
Robustness of Reinforced Concrete Slab Structures: Lessons Learned from Two Full-Scale Tests

 , , and
Abstract
:1. Introduction
2. Structure Description
2.1. Two-Storey Structure
2.2. Two-Span Structure
3. Test Description
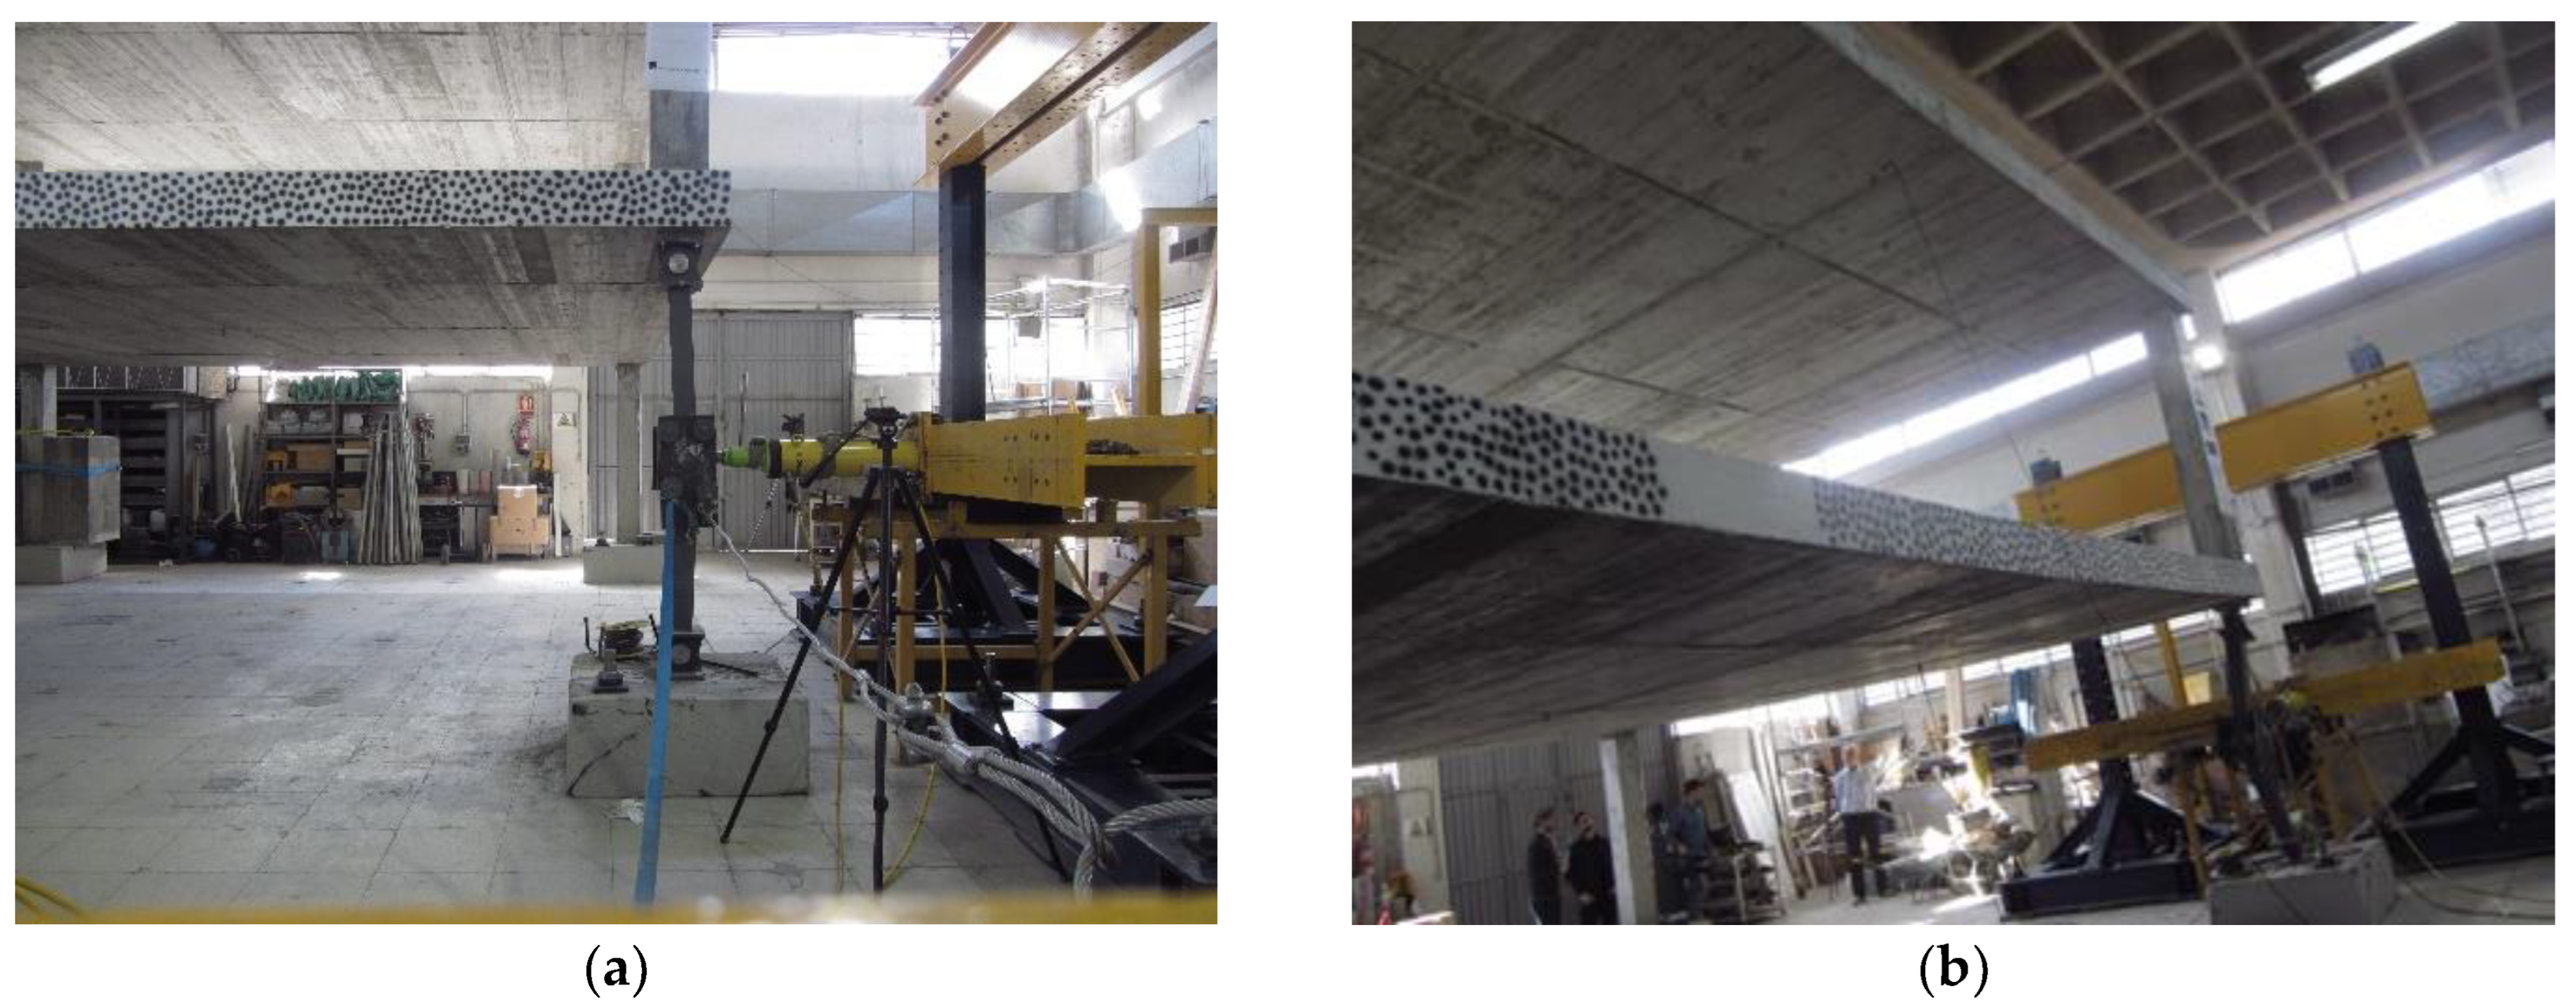
3.1. Two-Storey Structure
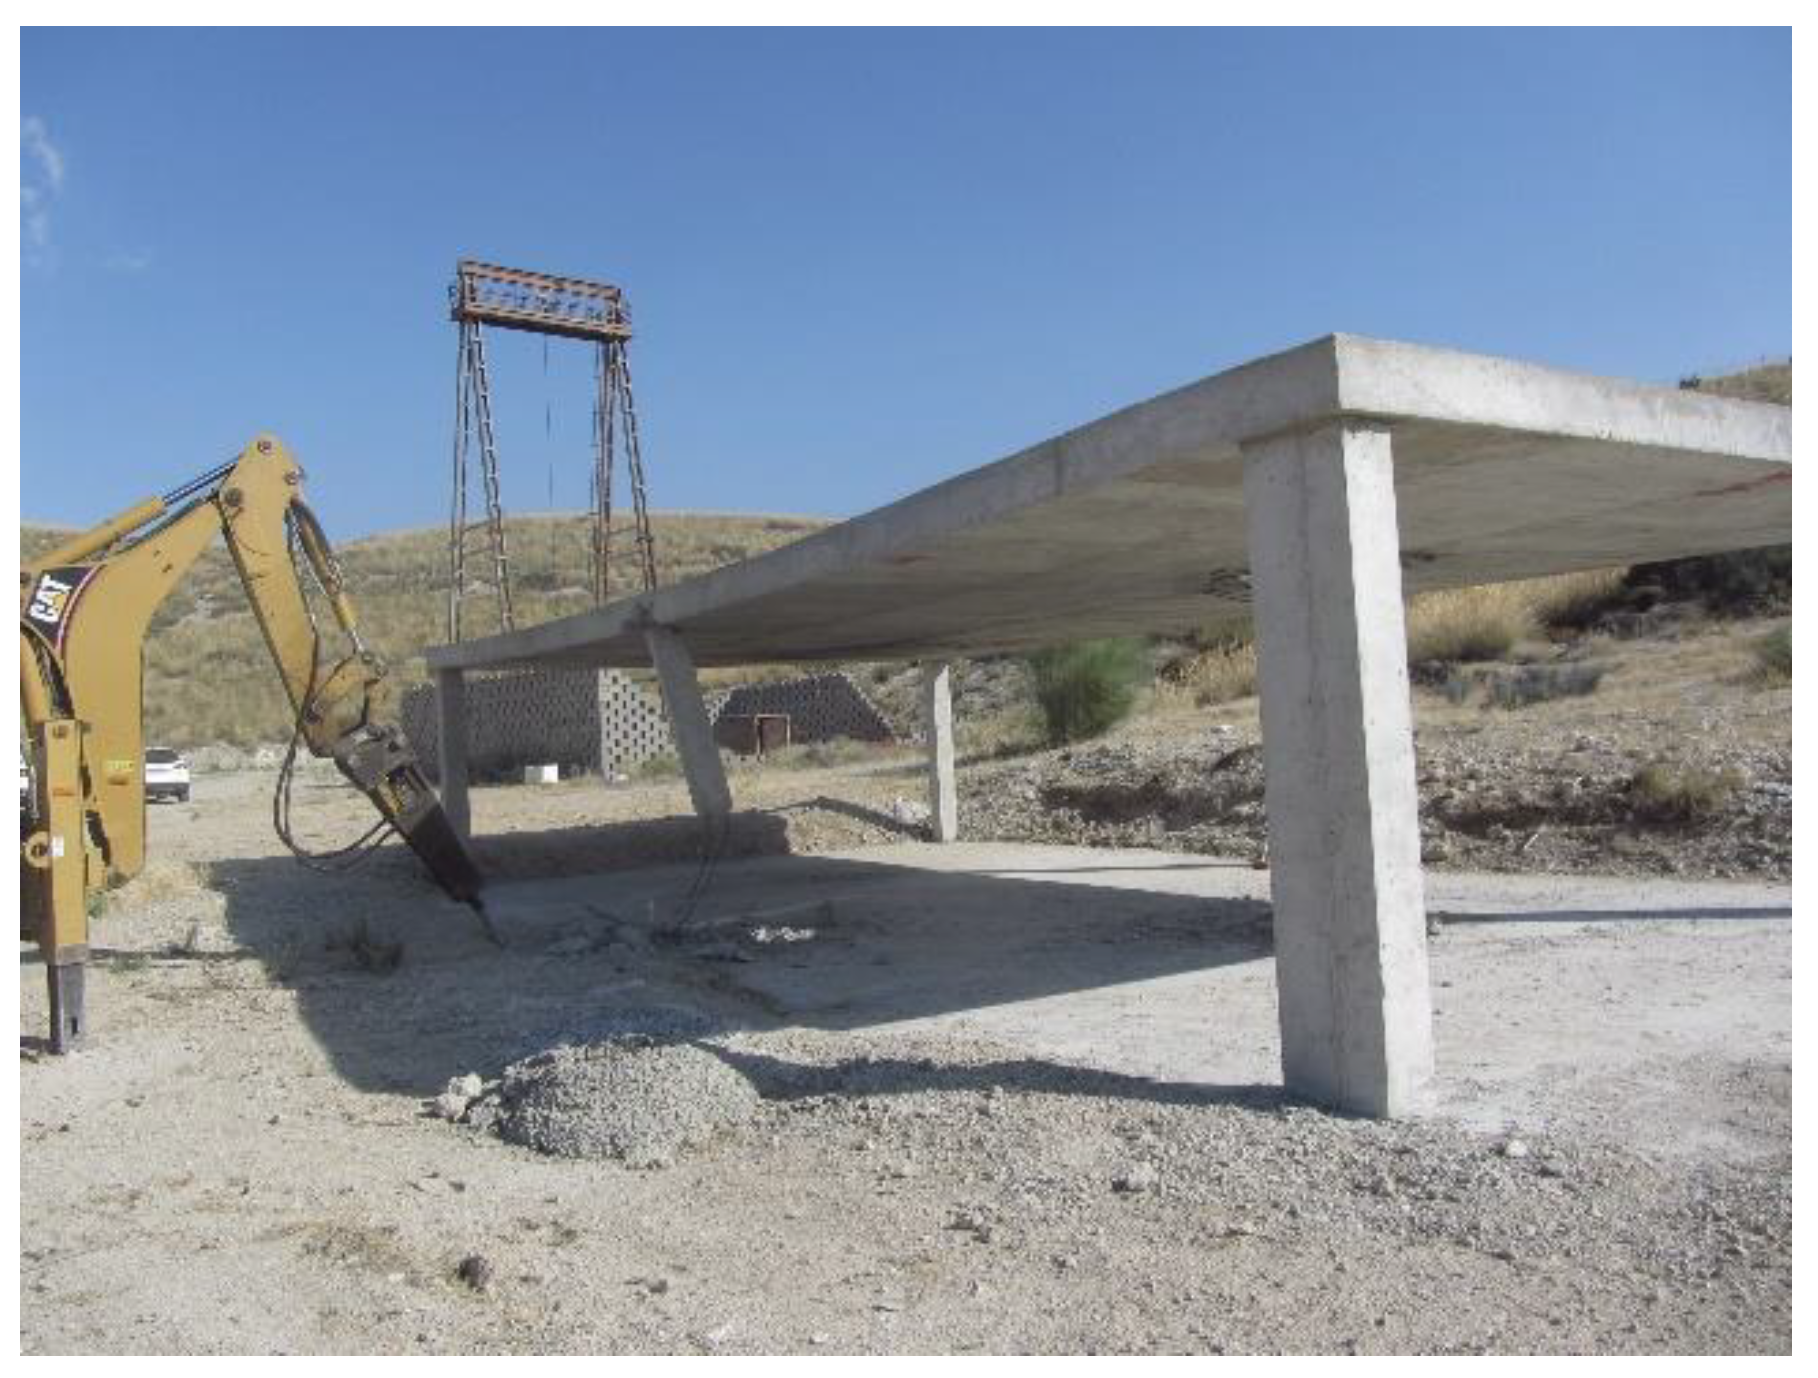
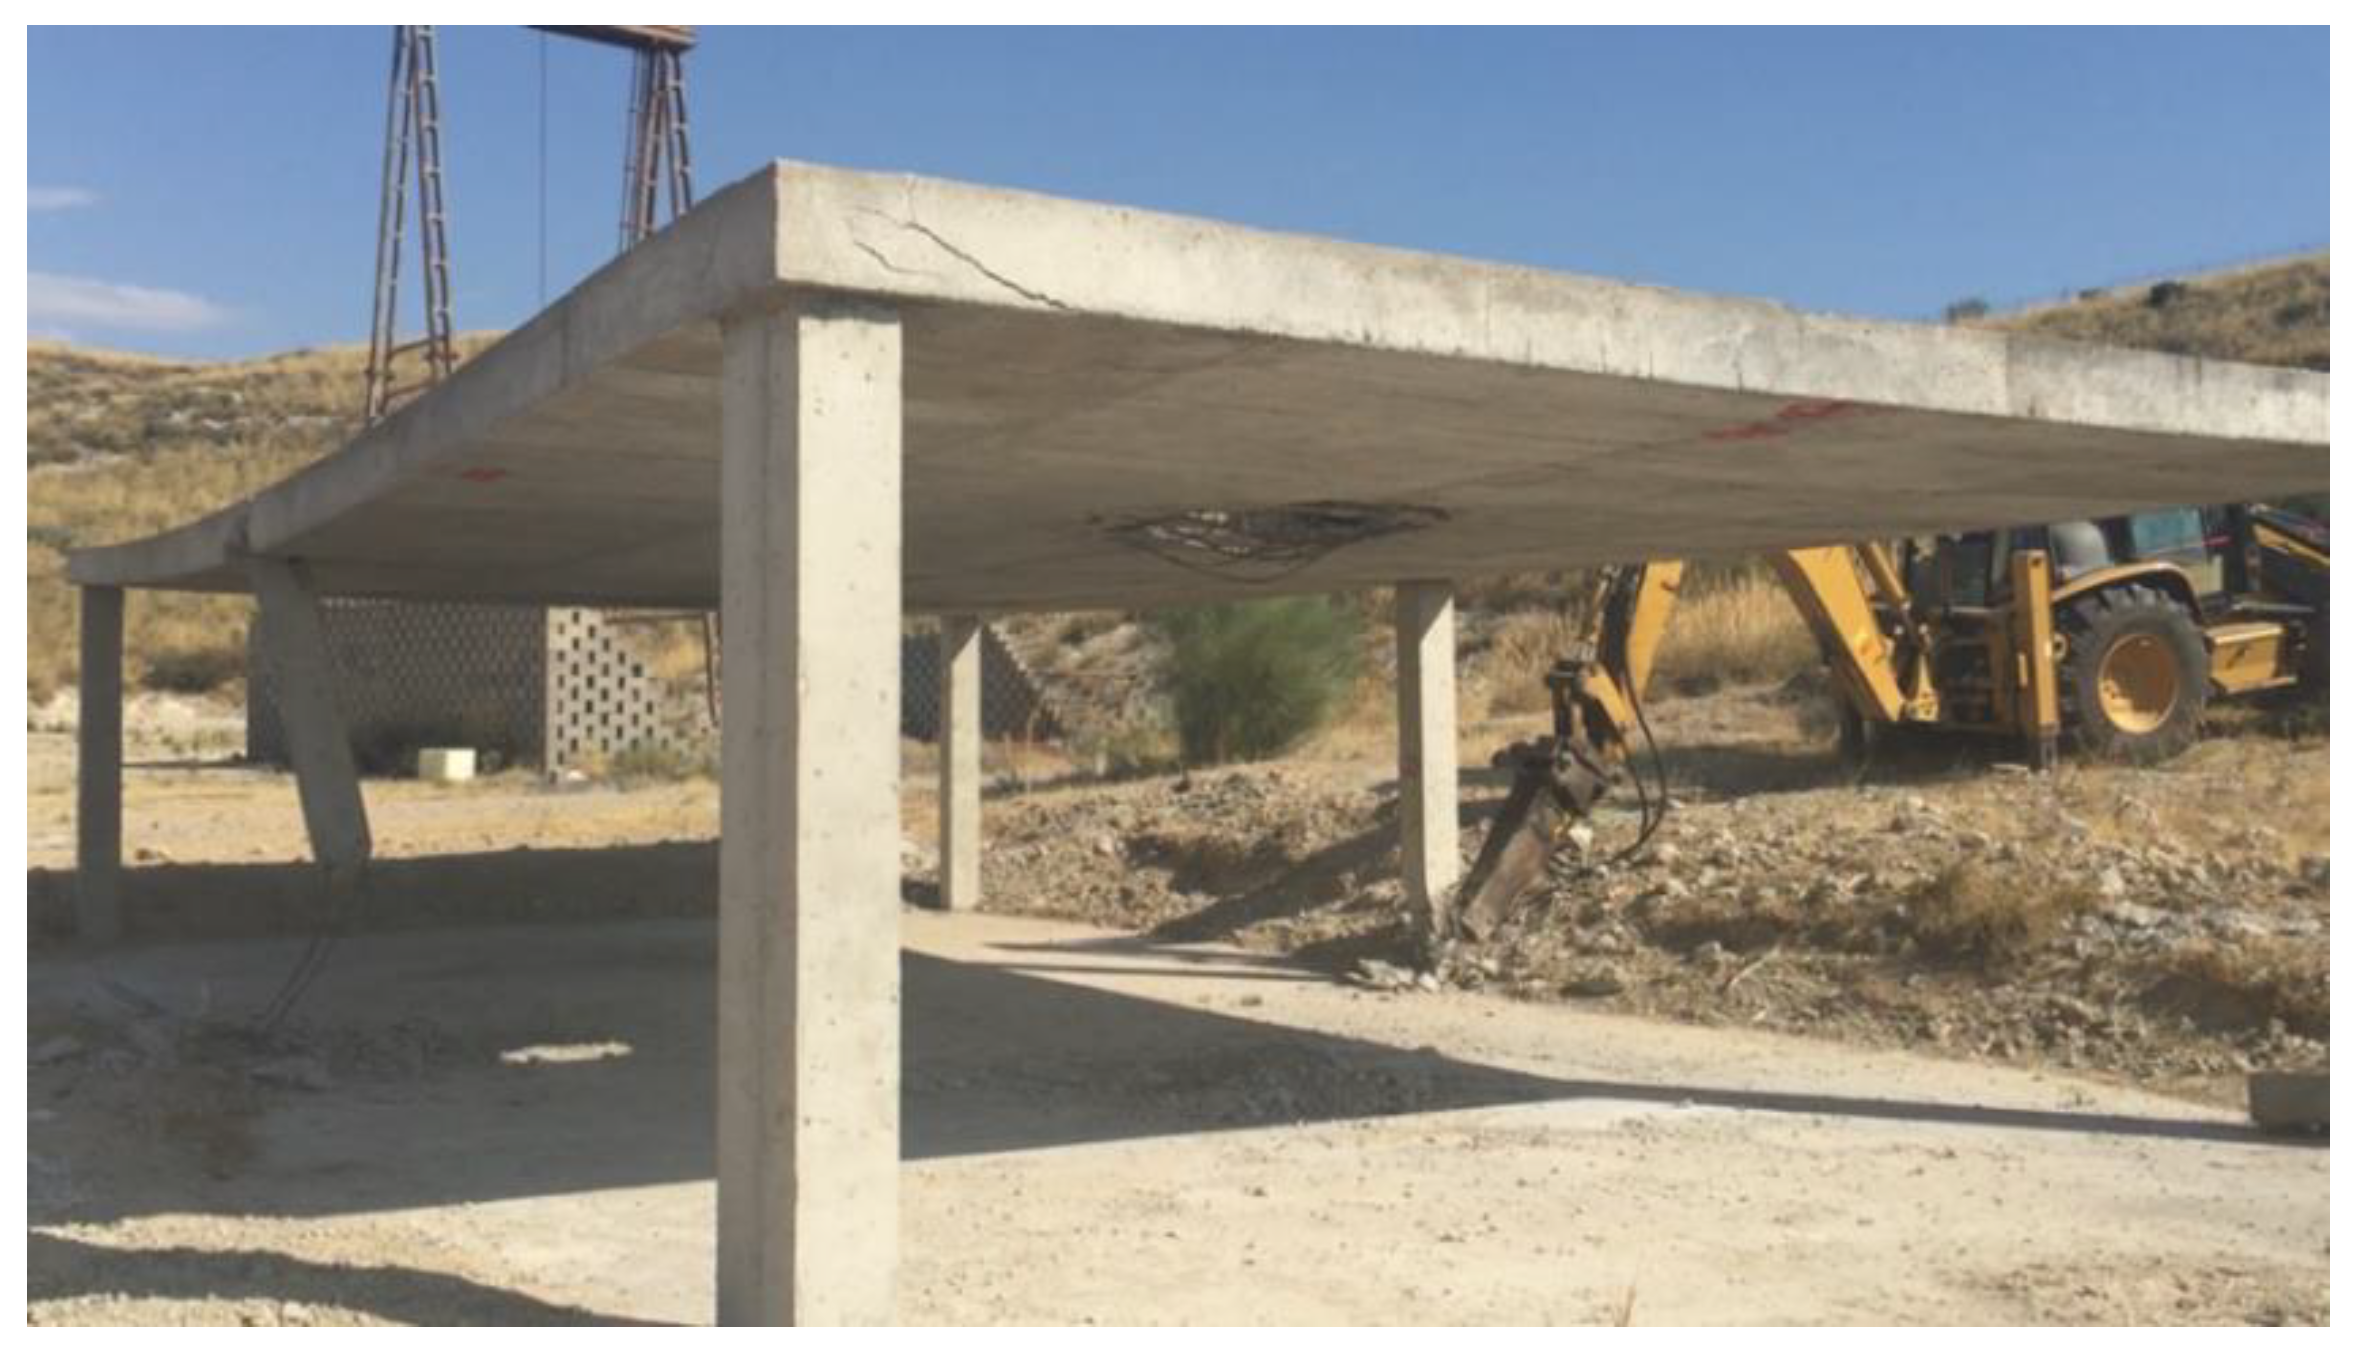
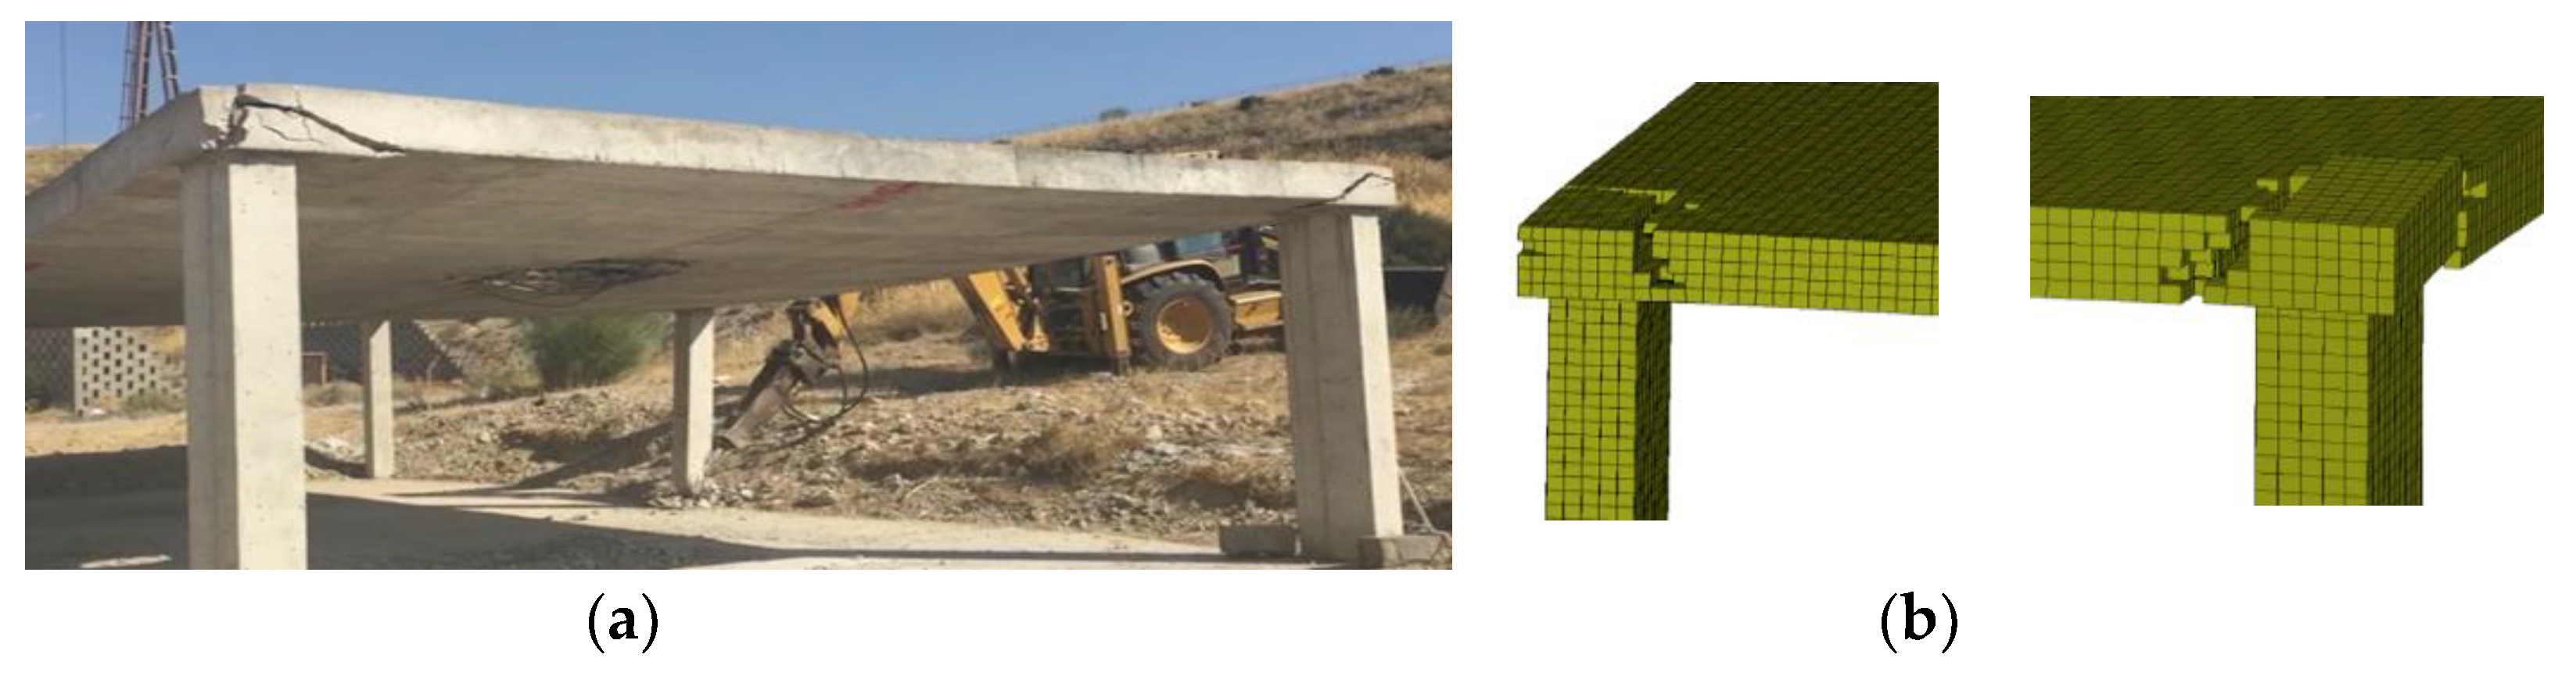
3.2. Two-Span Structure
4. Alternate Load Path Analysis
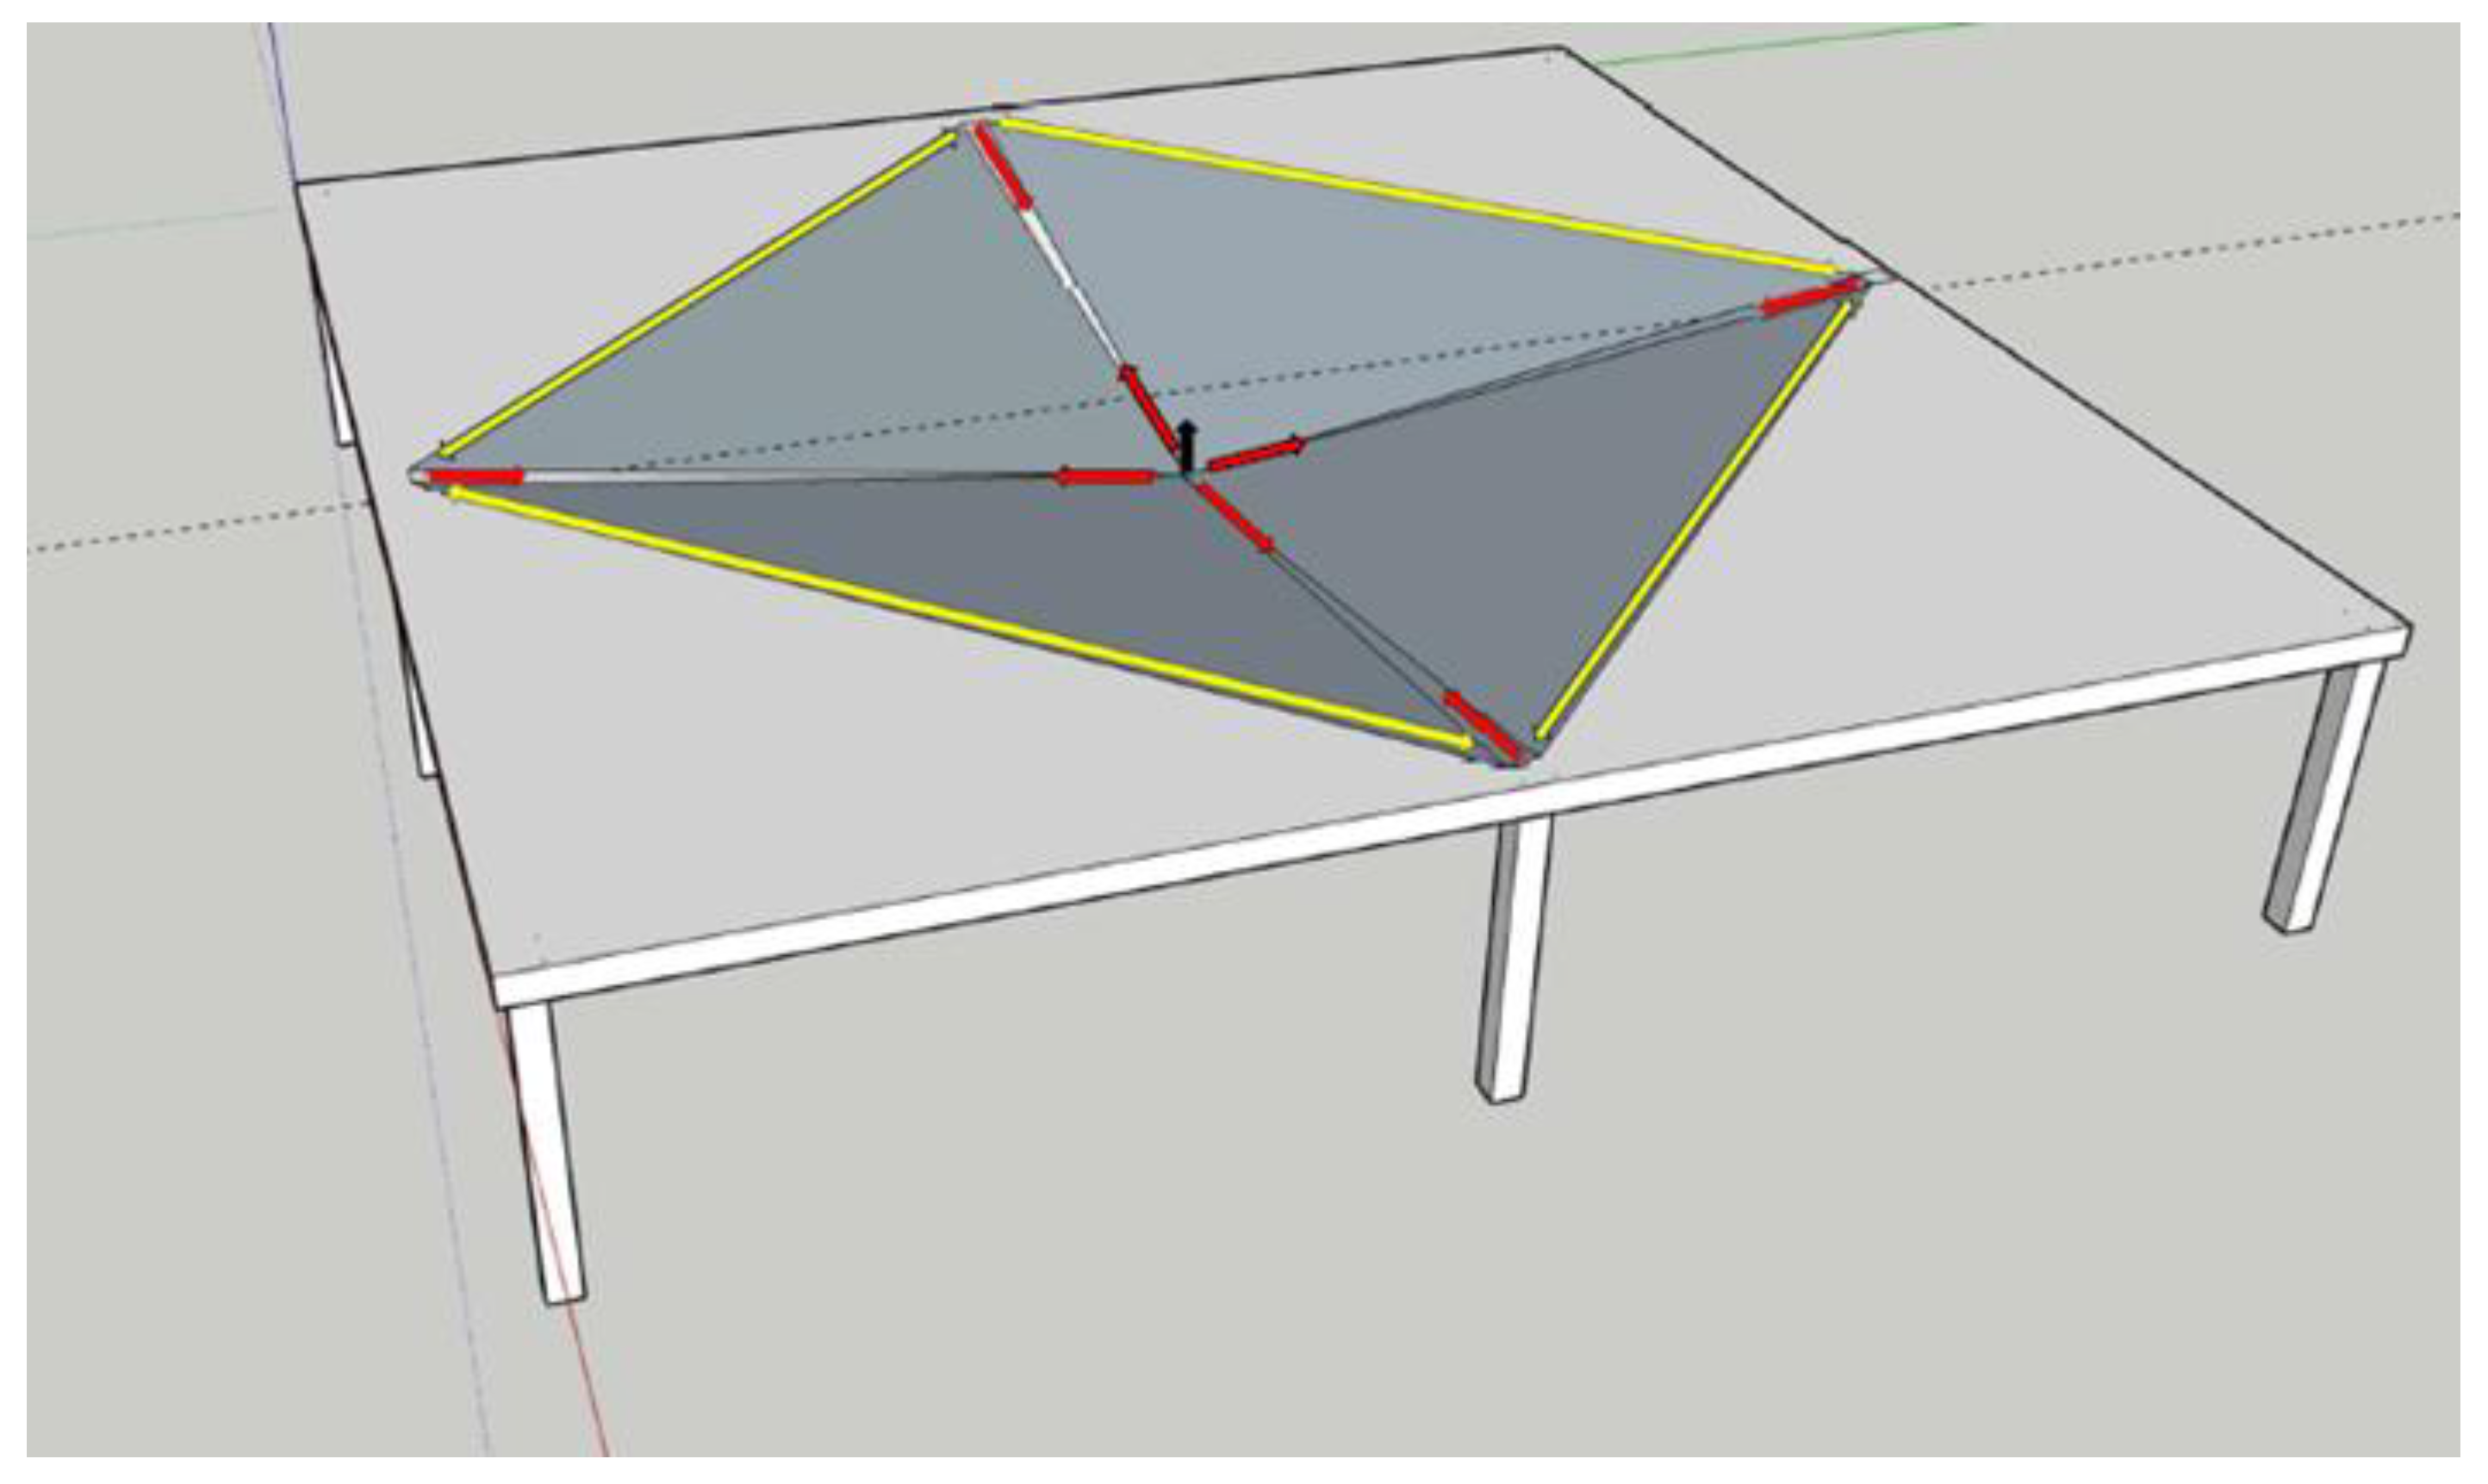
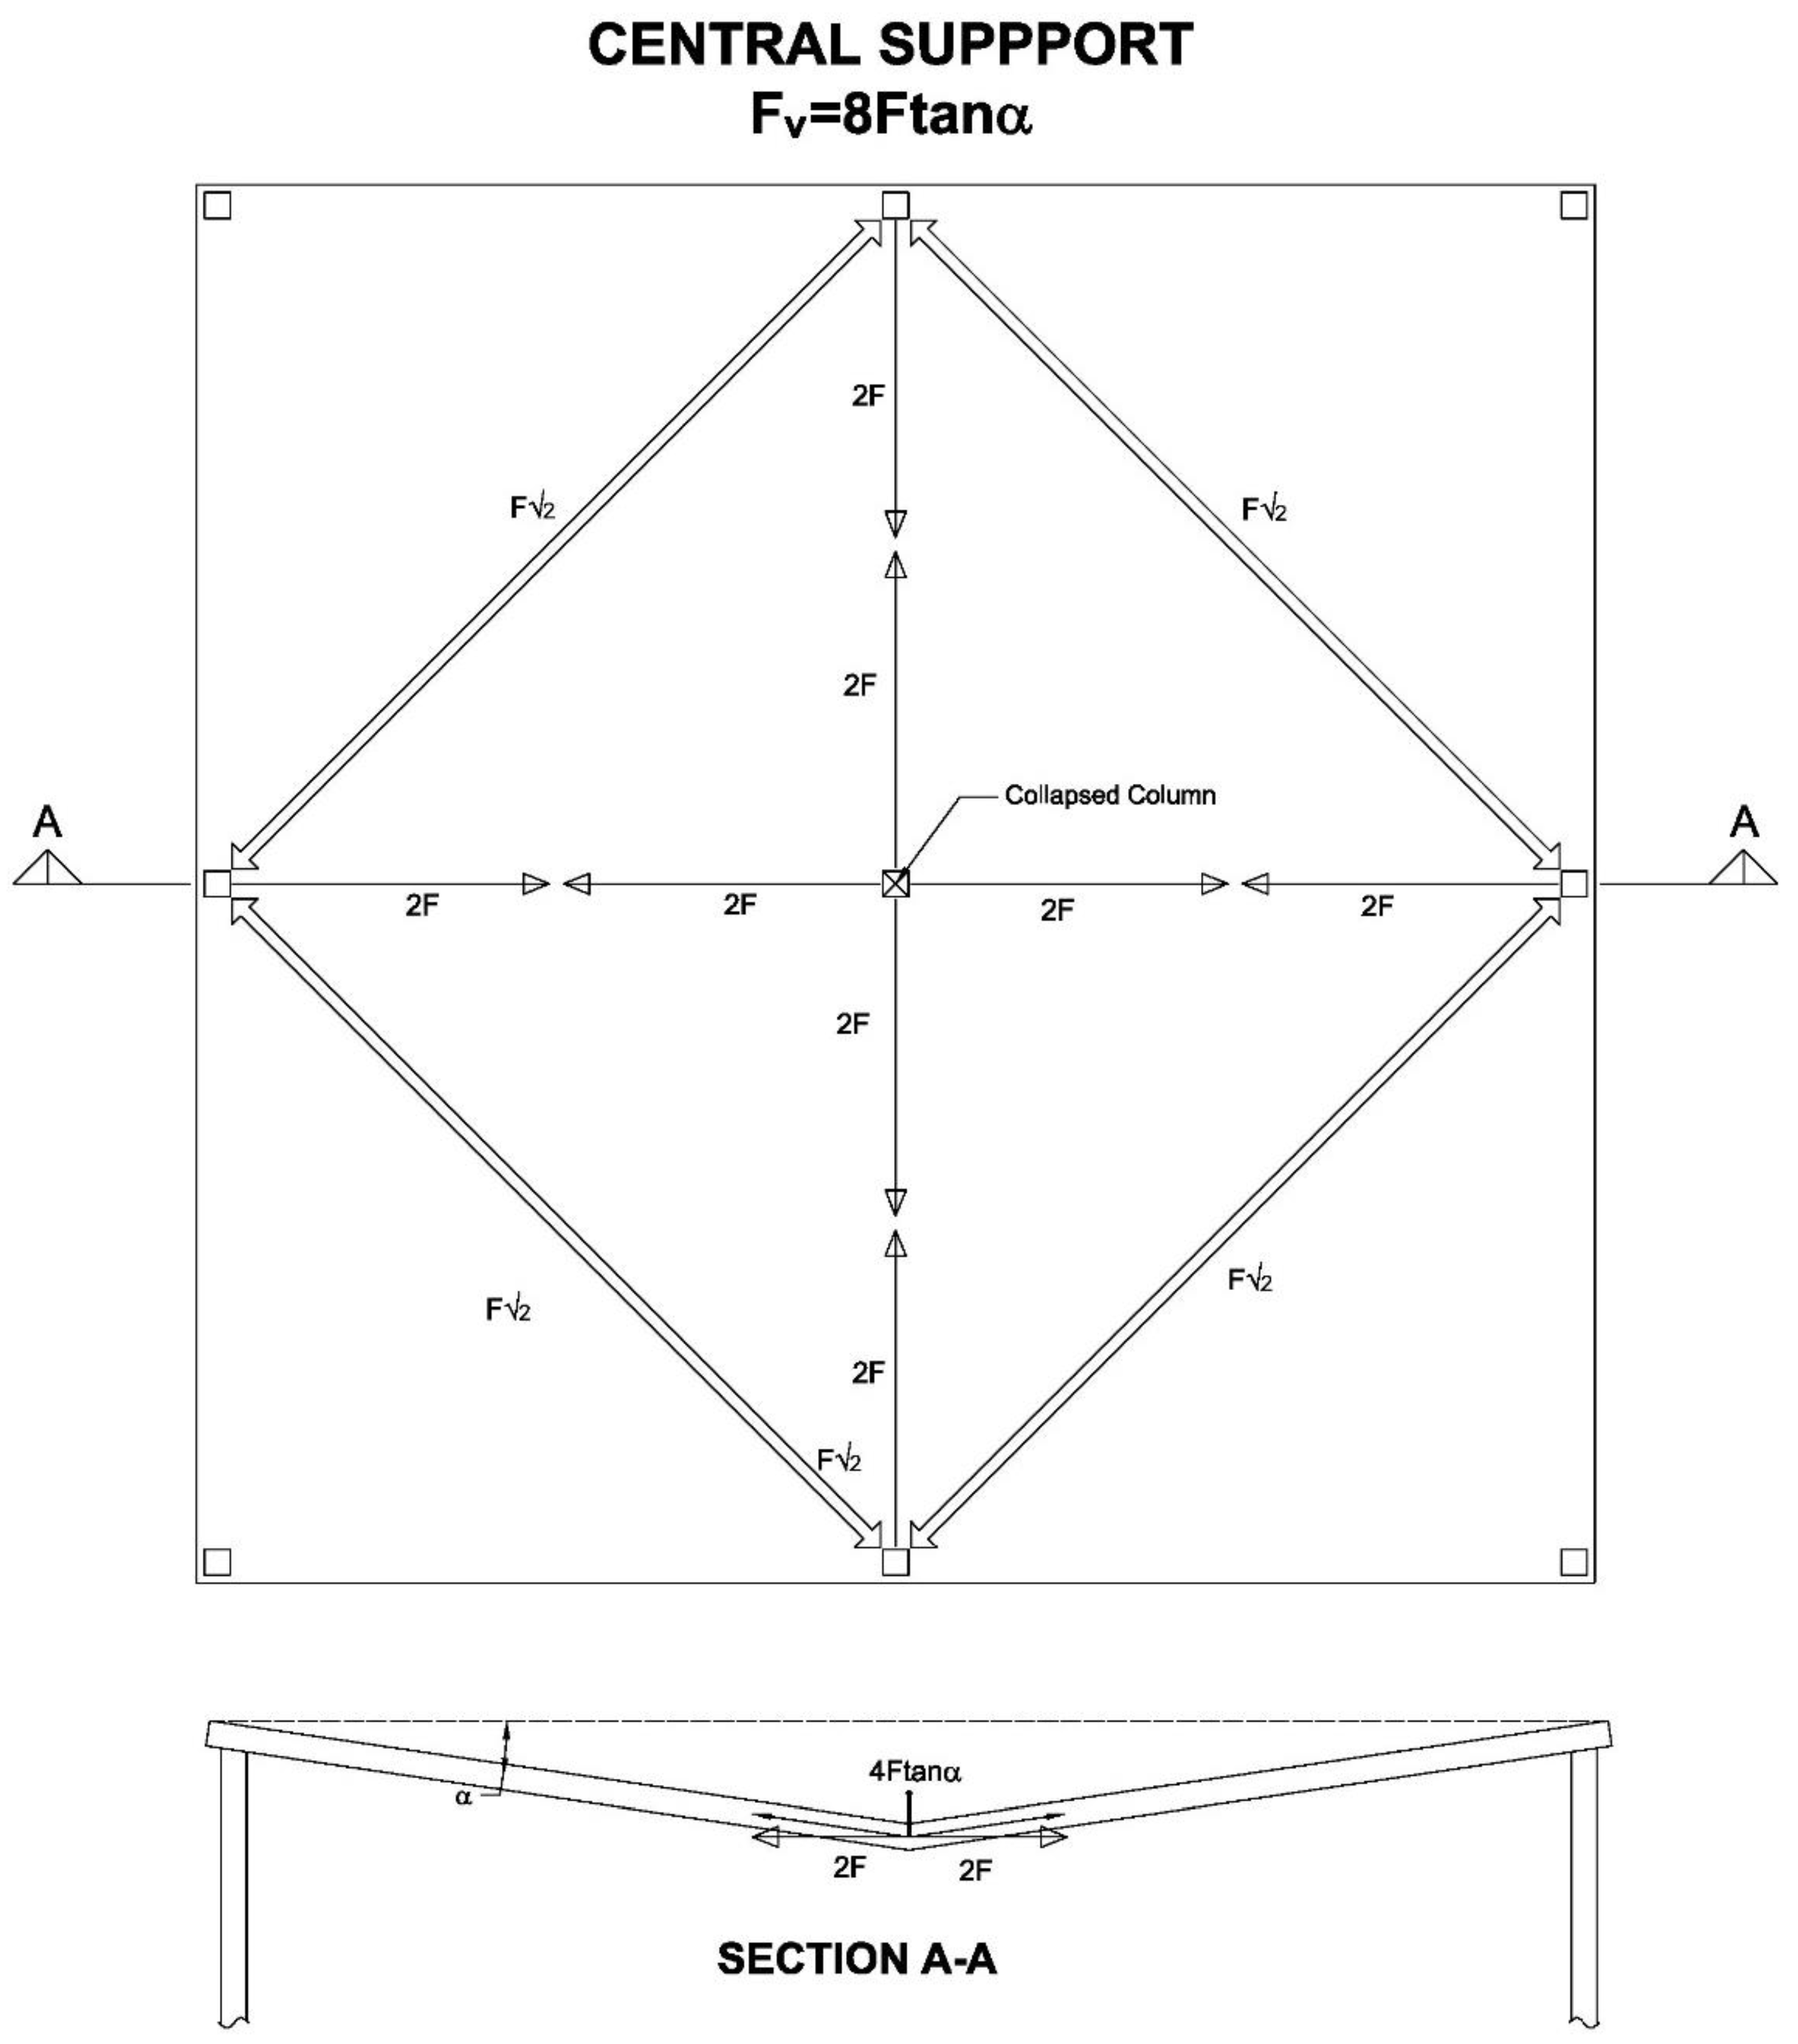
4.1. Central Column
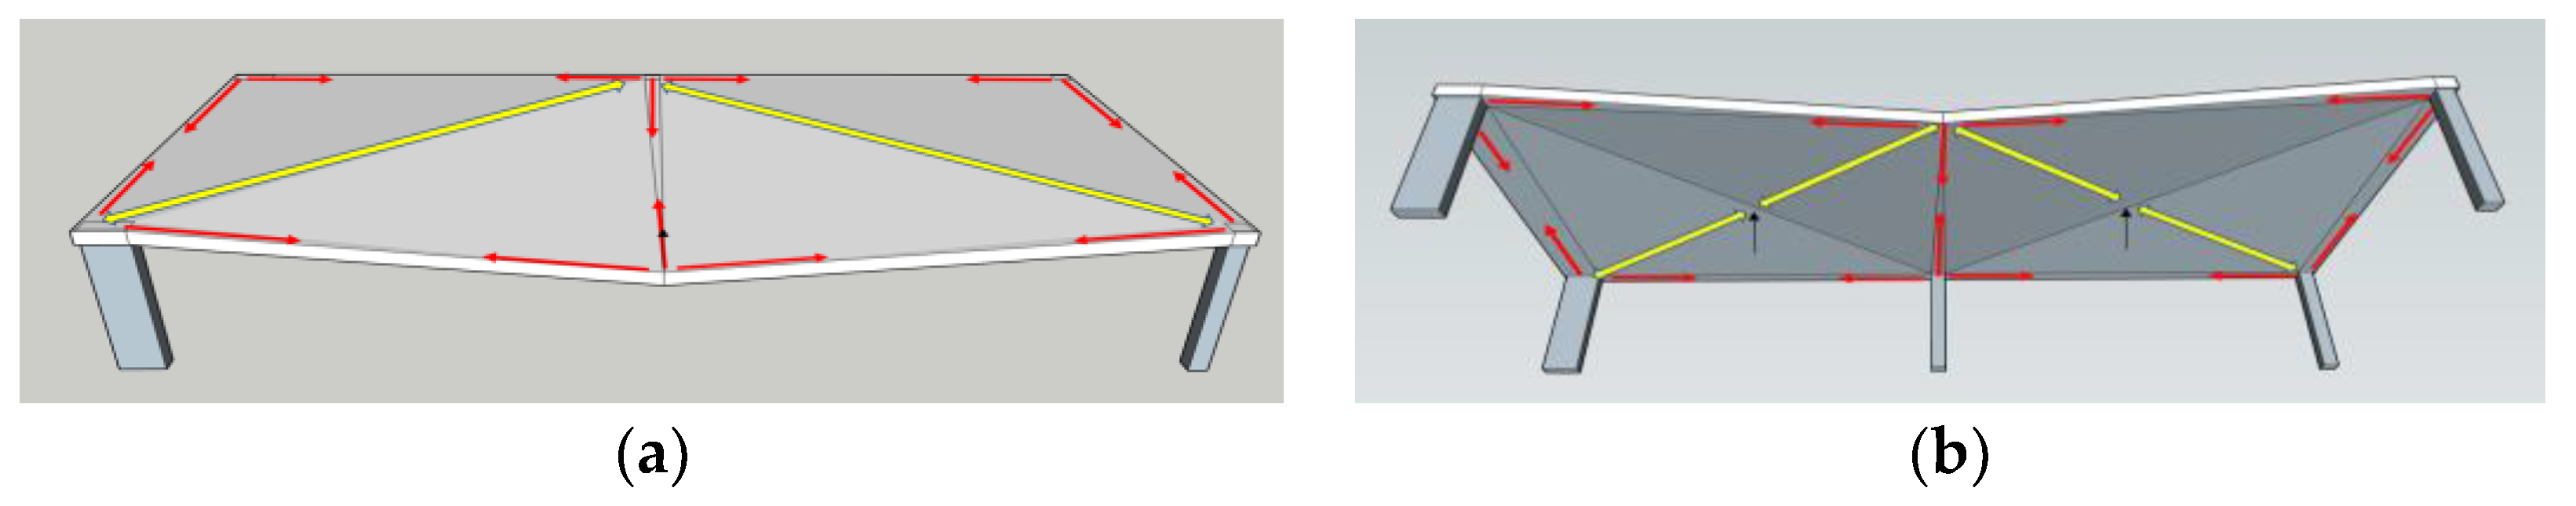
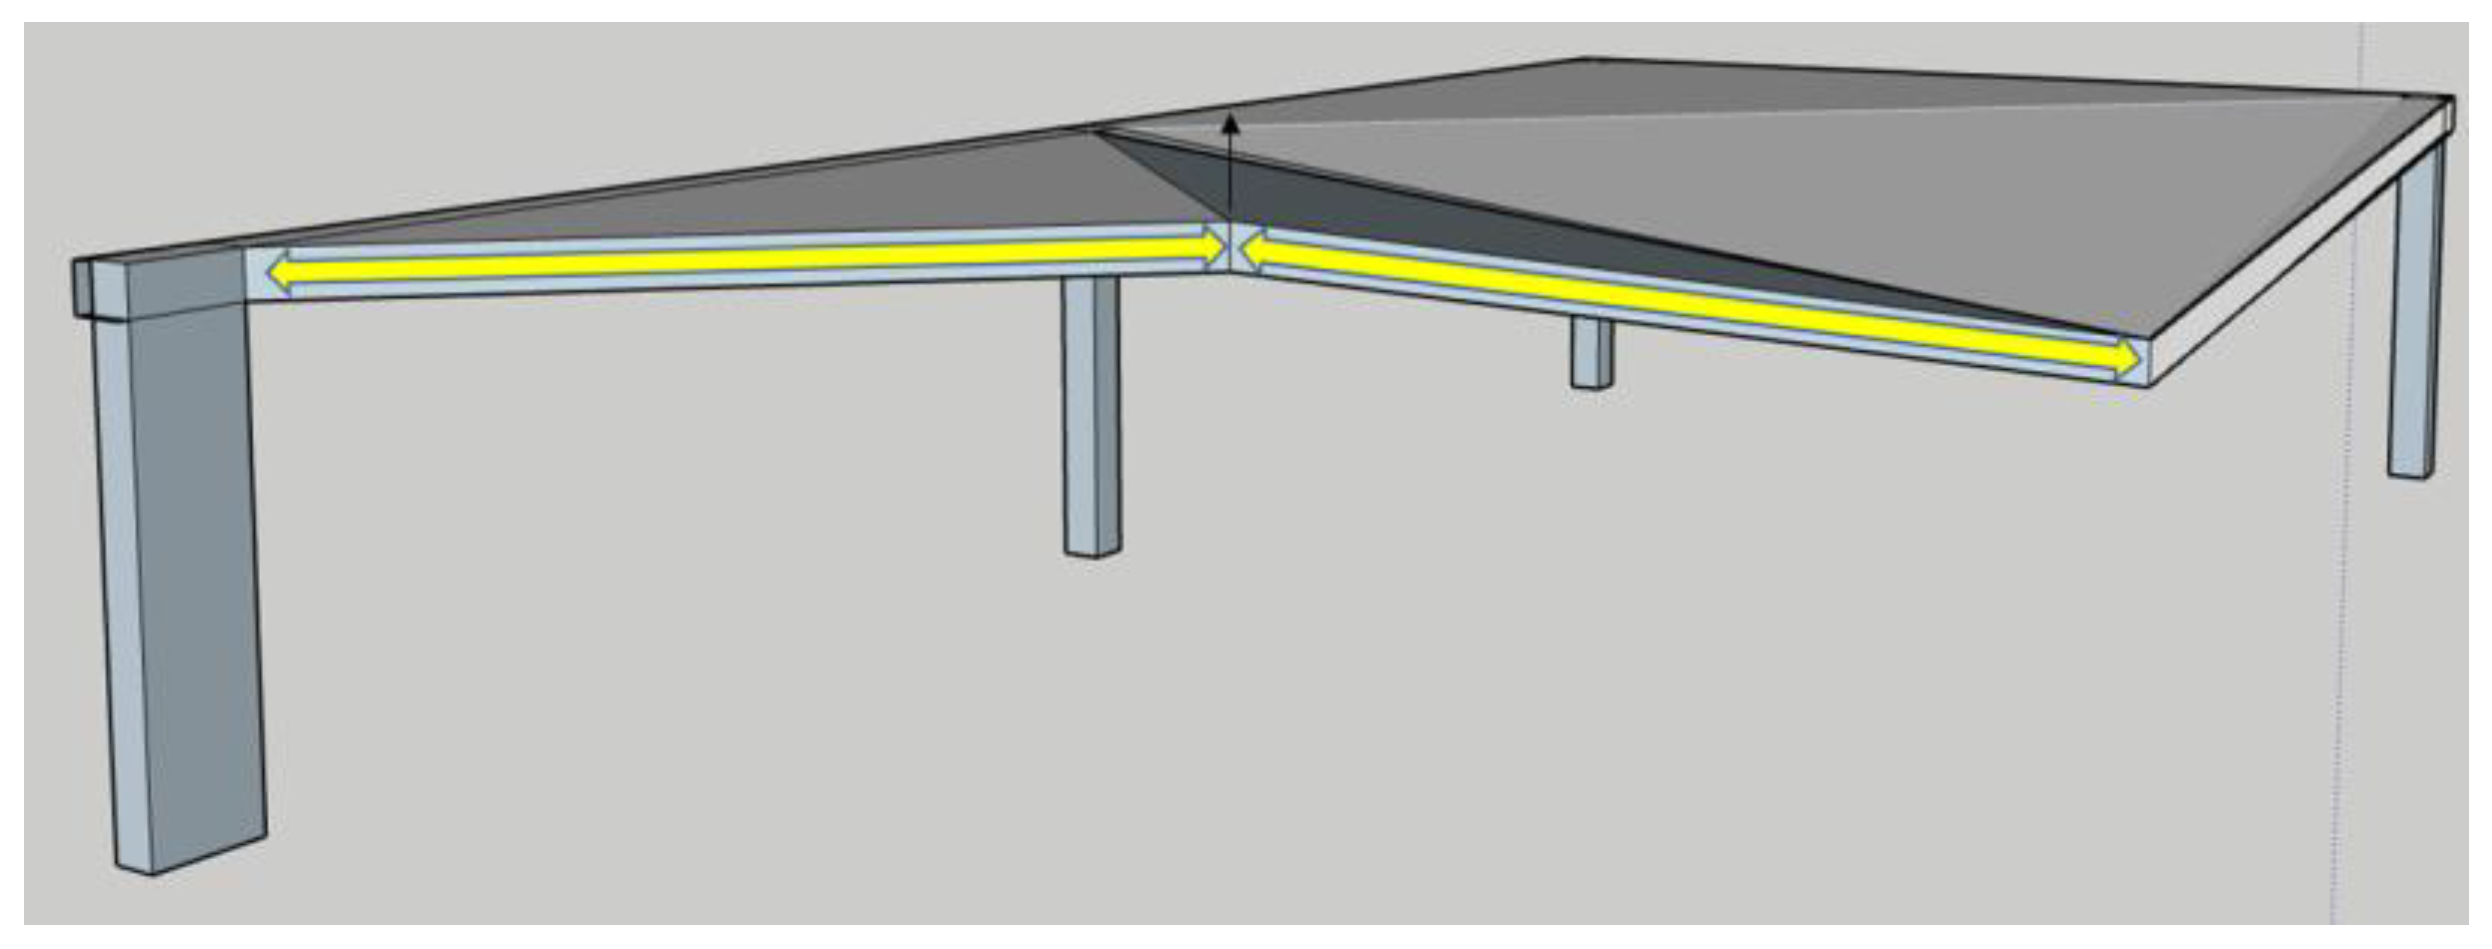
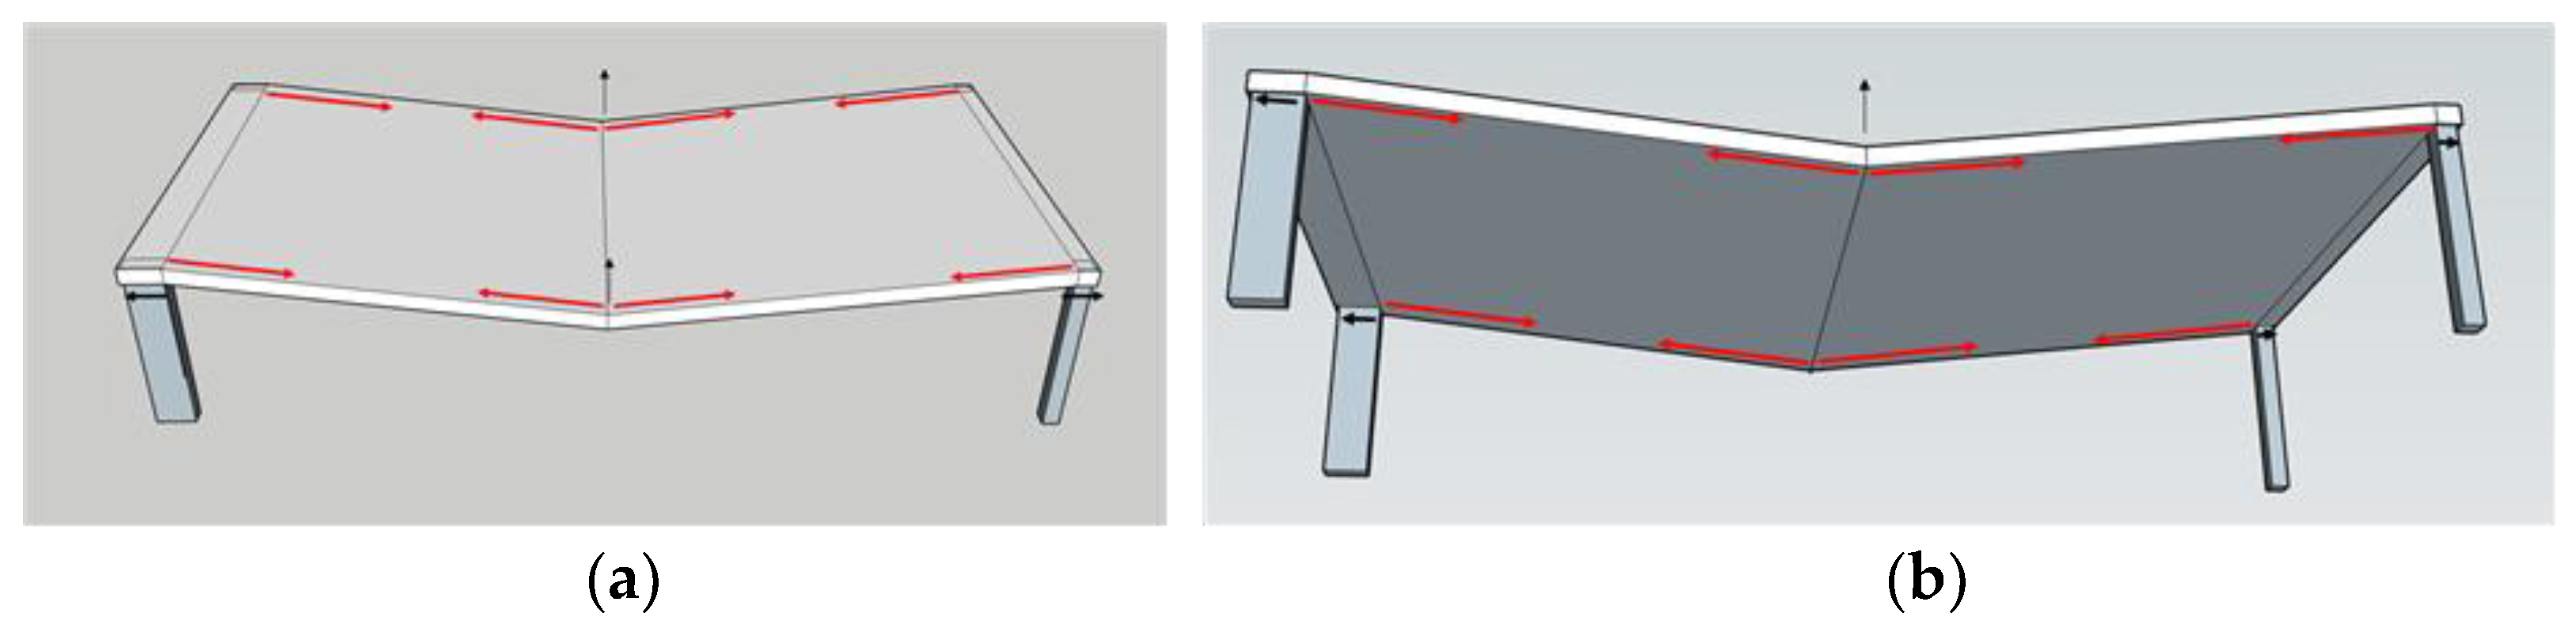
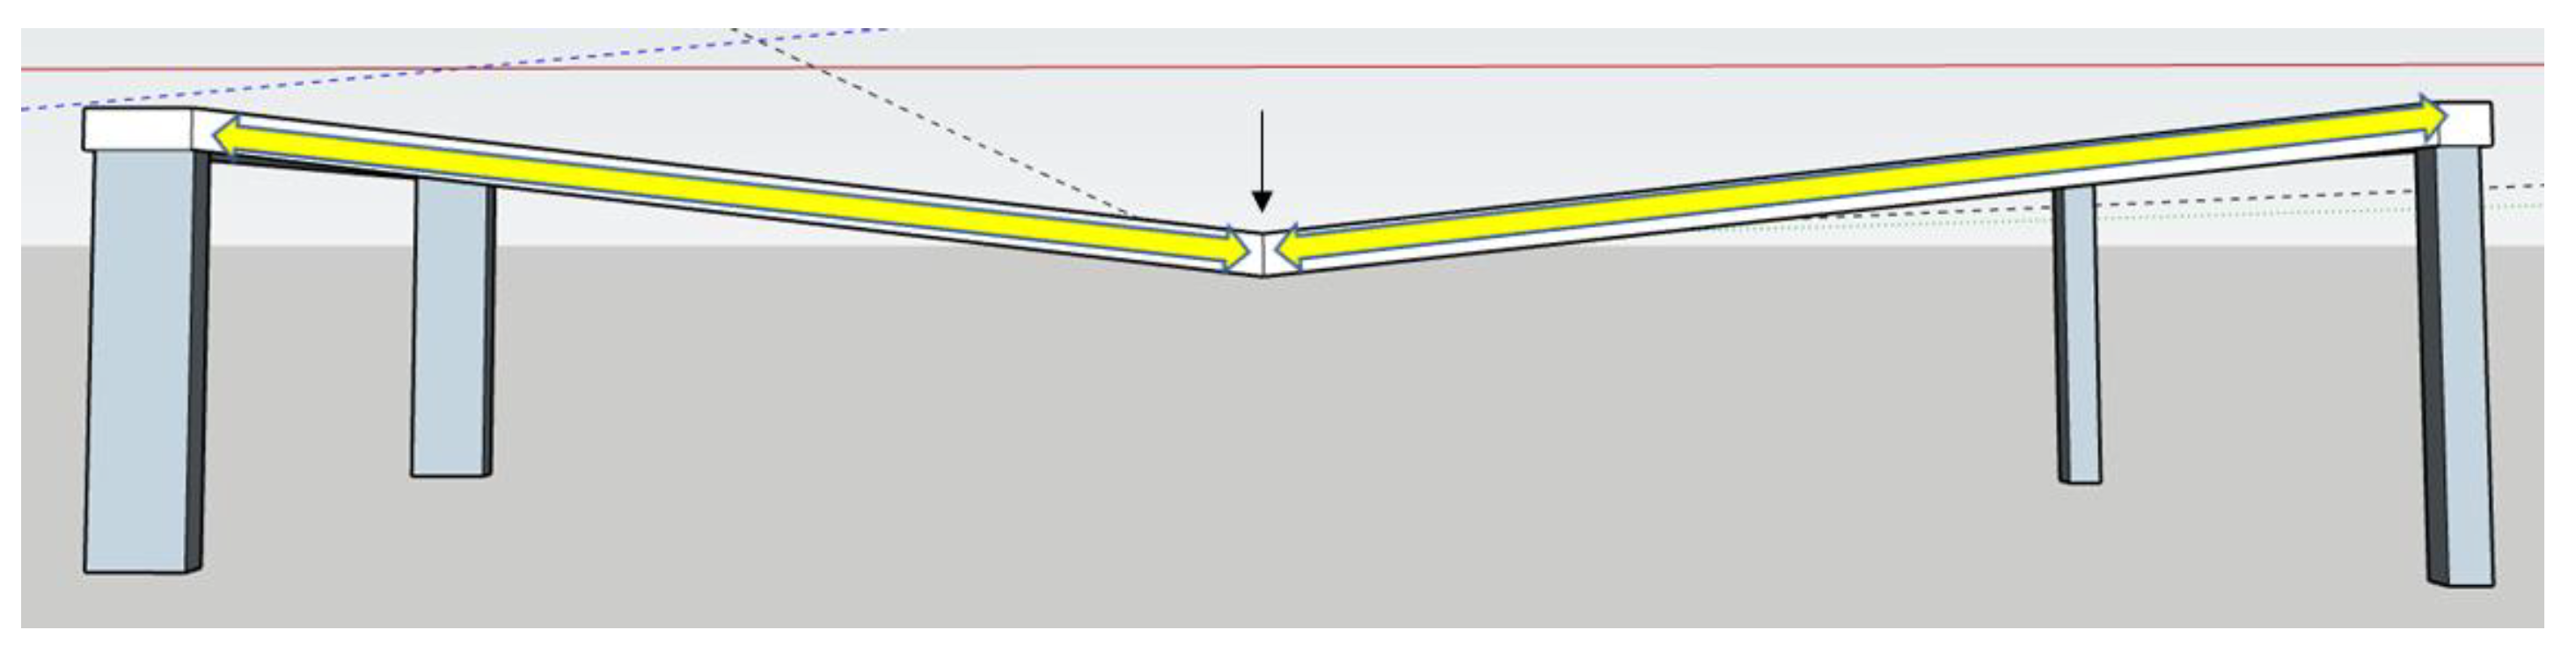
4.2. Edge Column
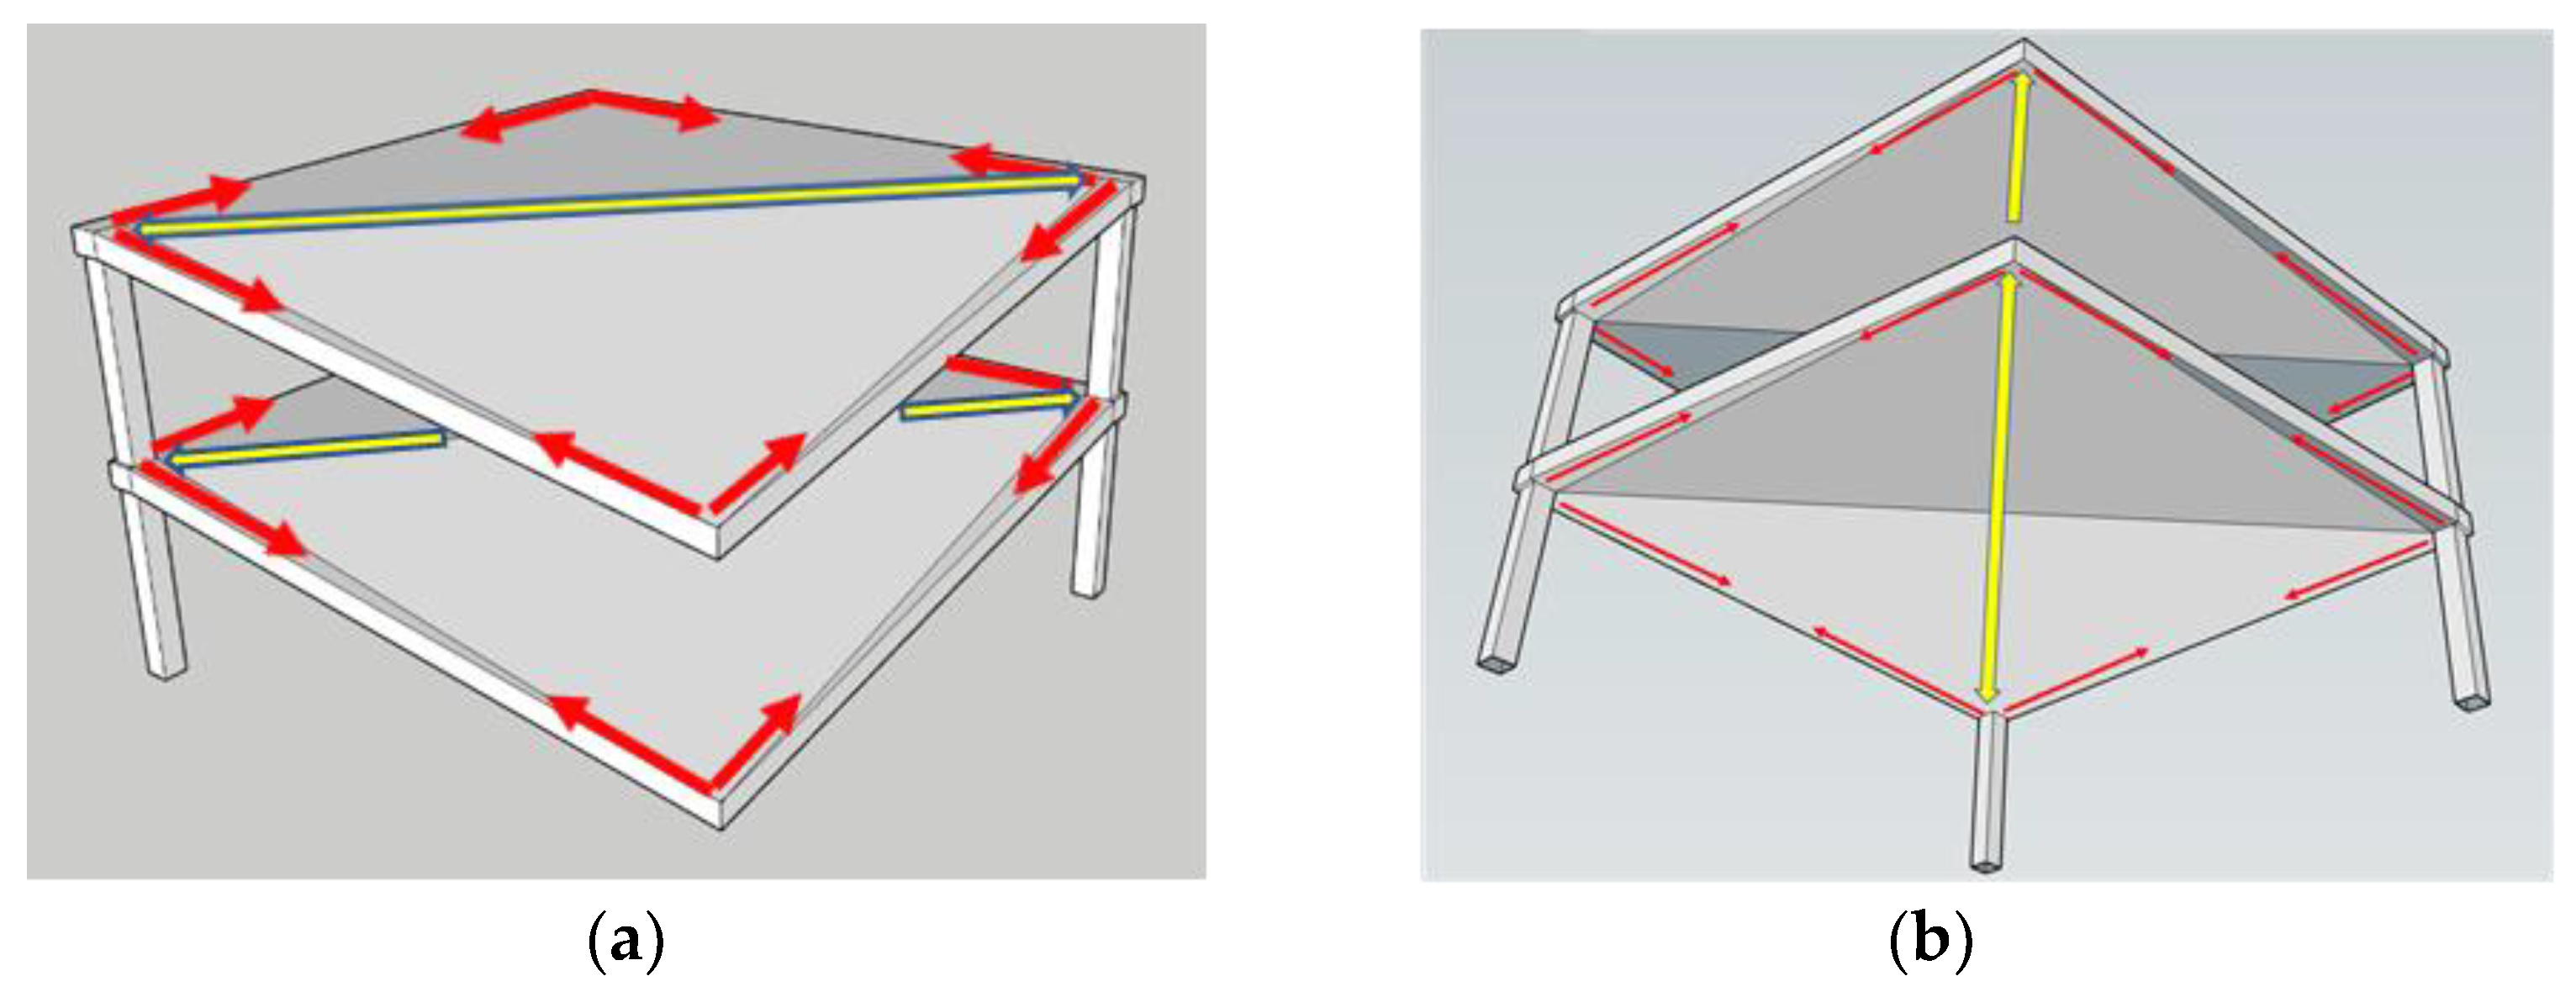
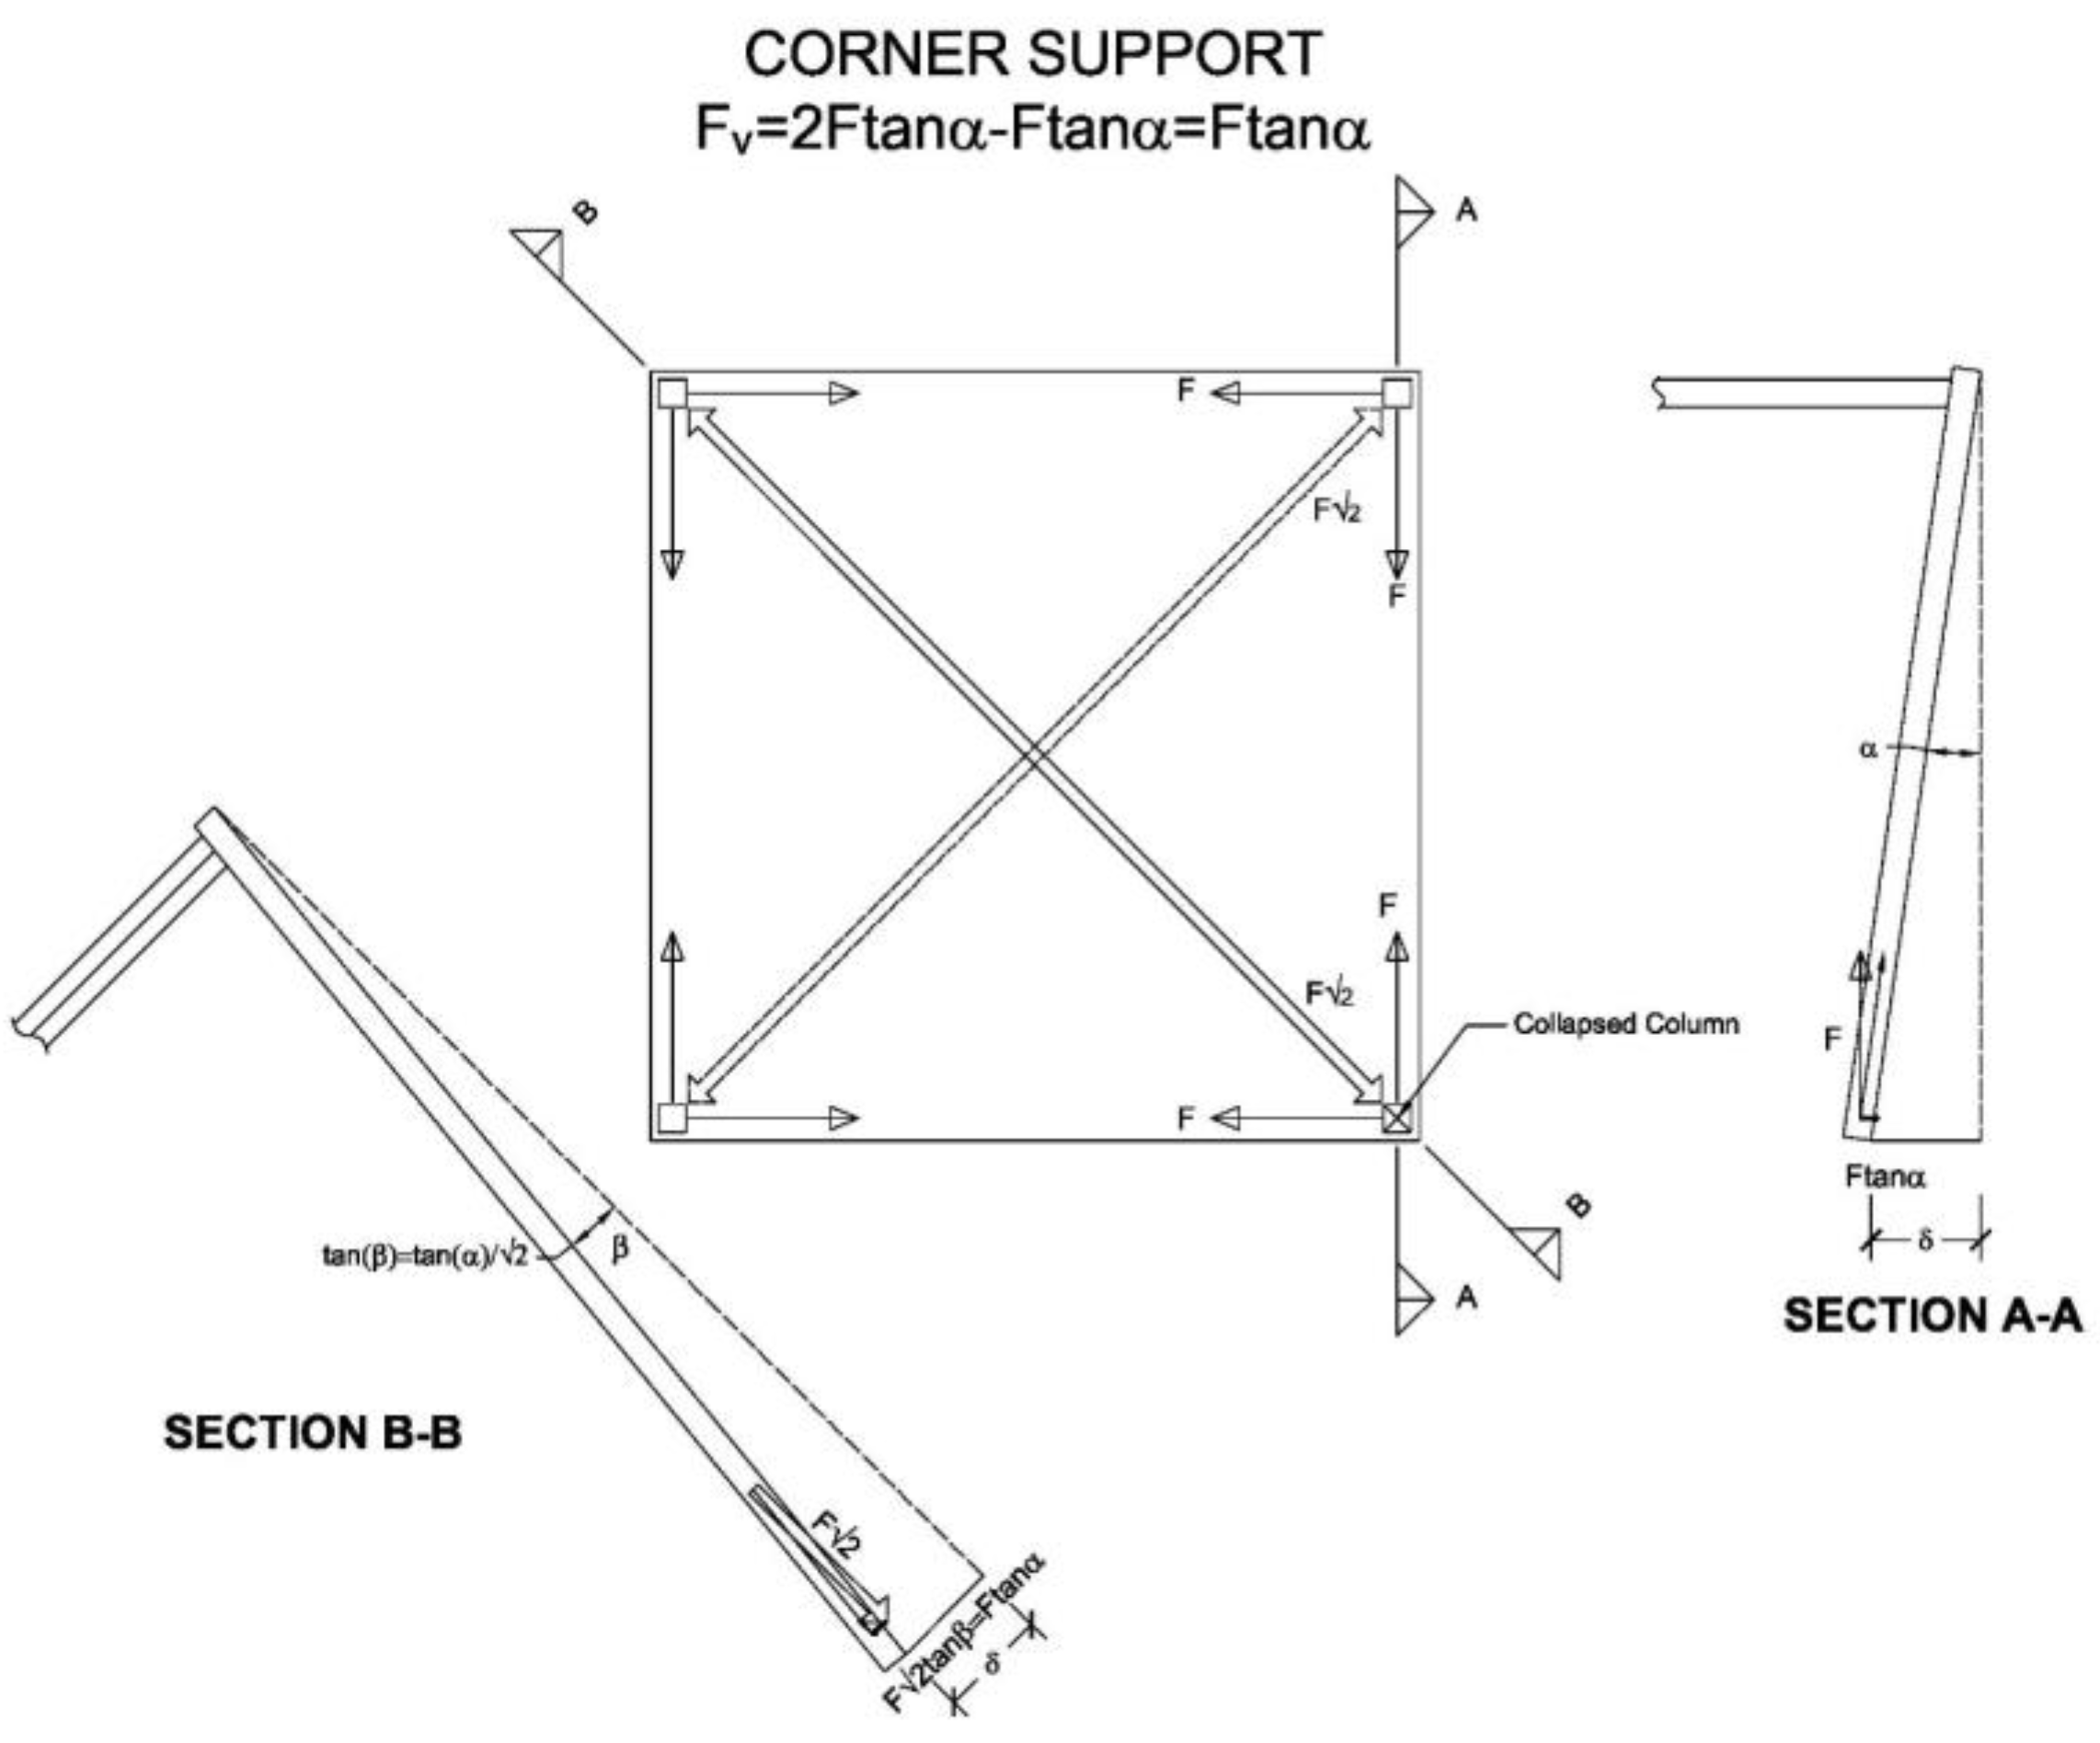
4.3. Corner Column
4.4. Comparison
5. Rupture Line Analysis
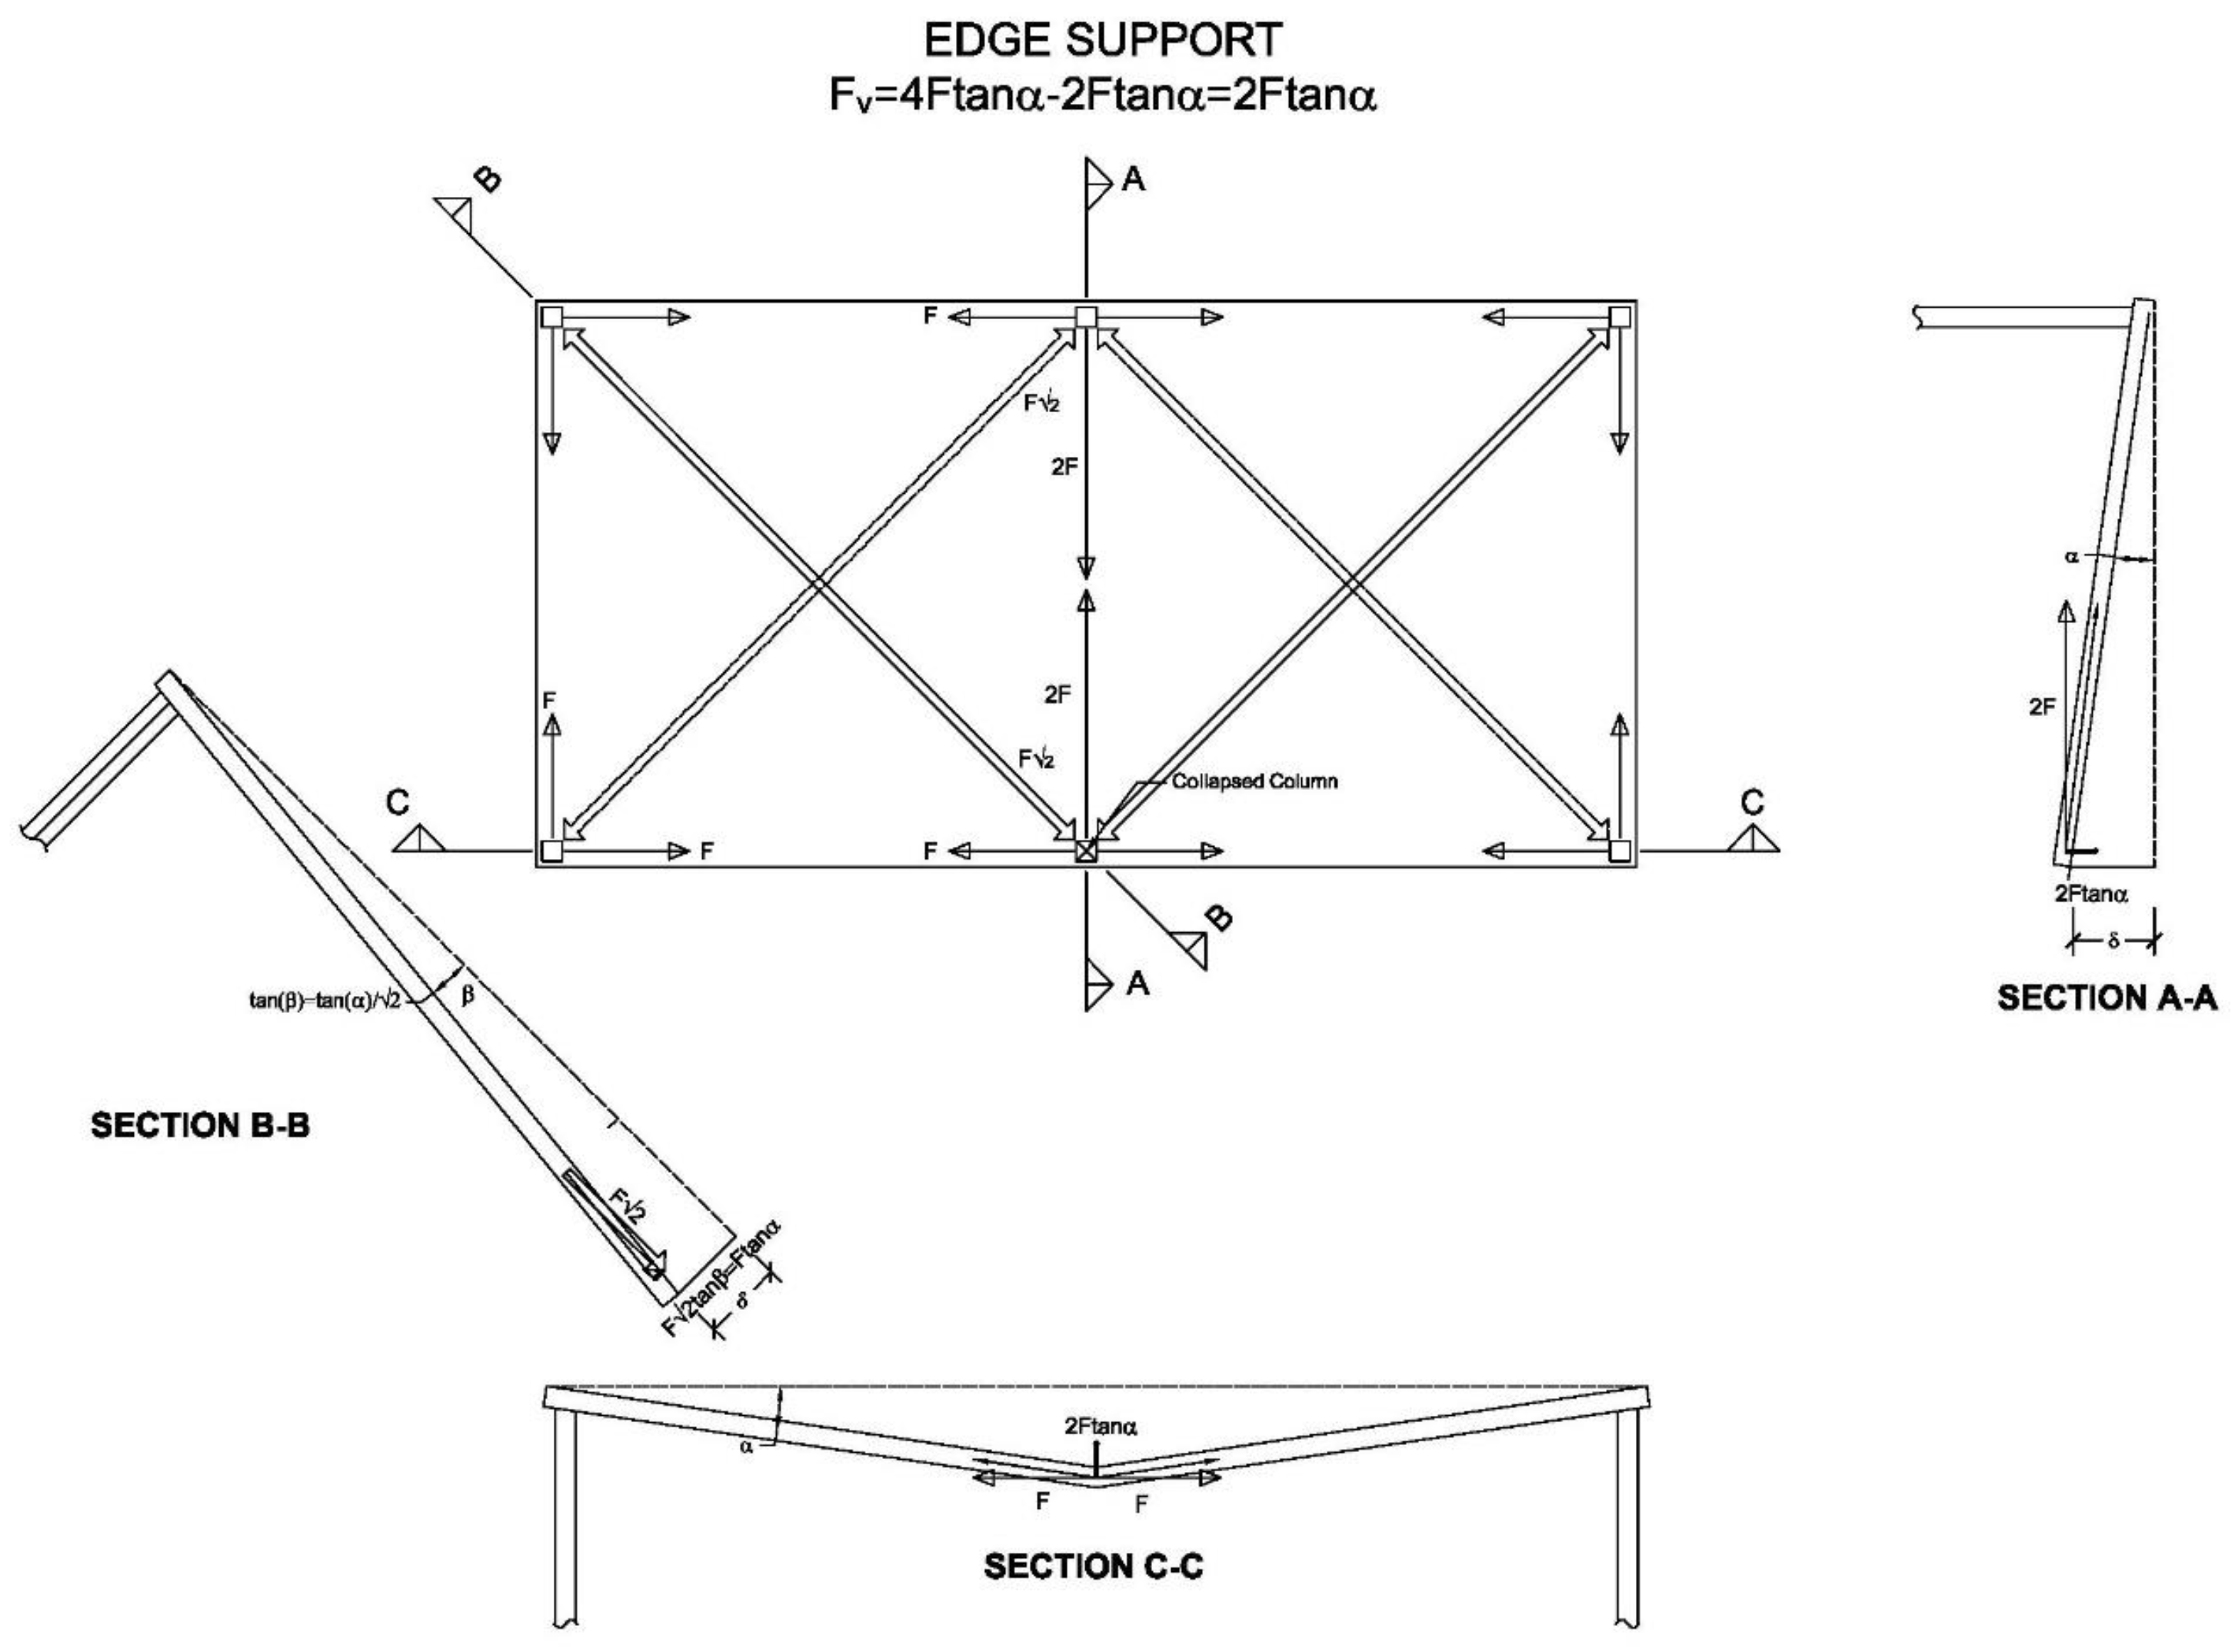
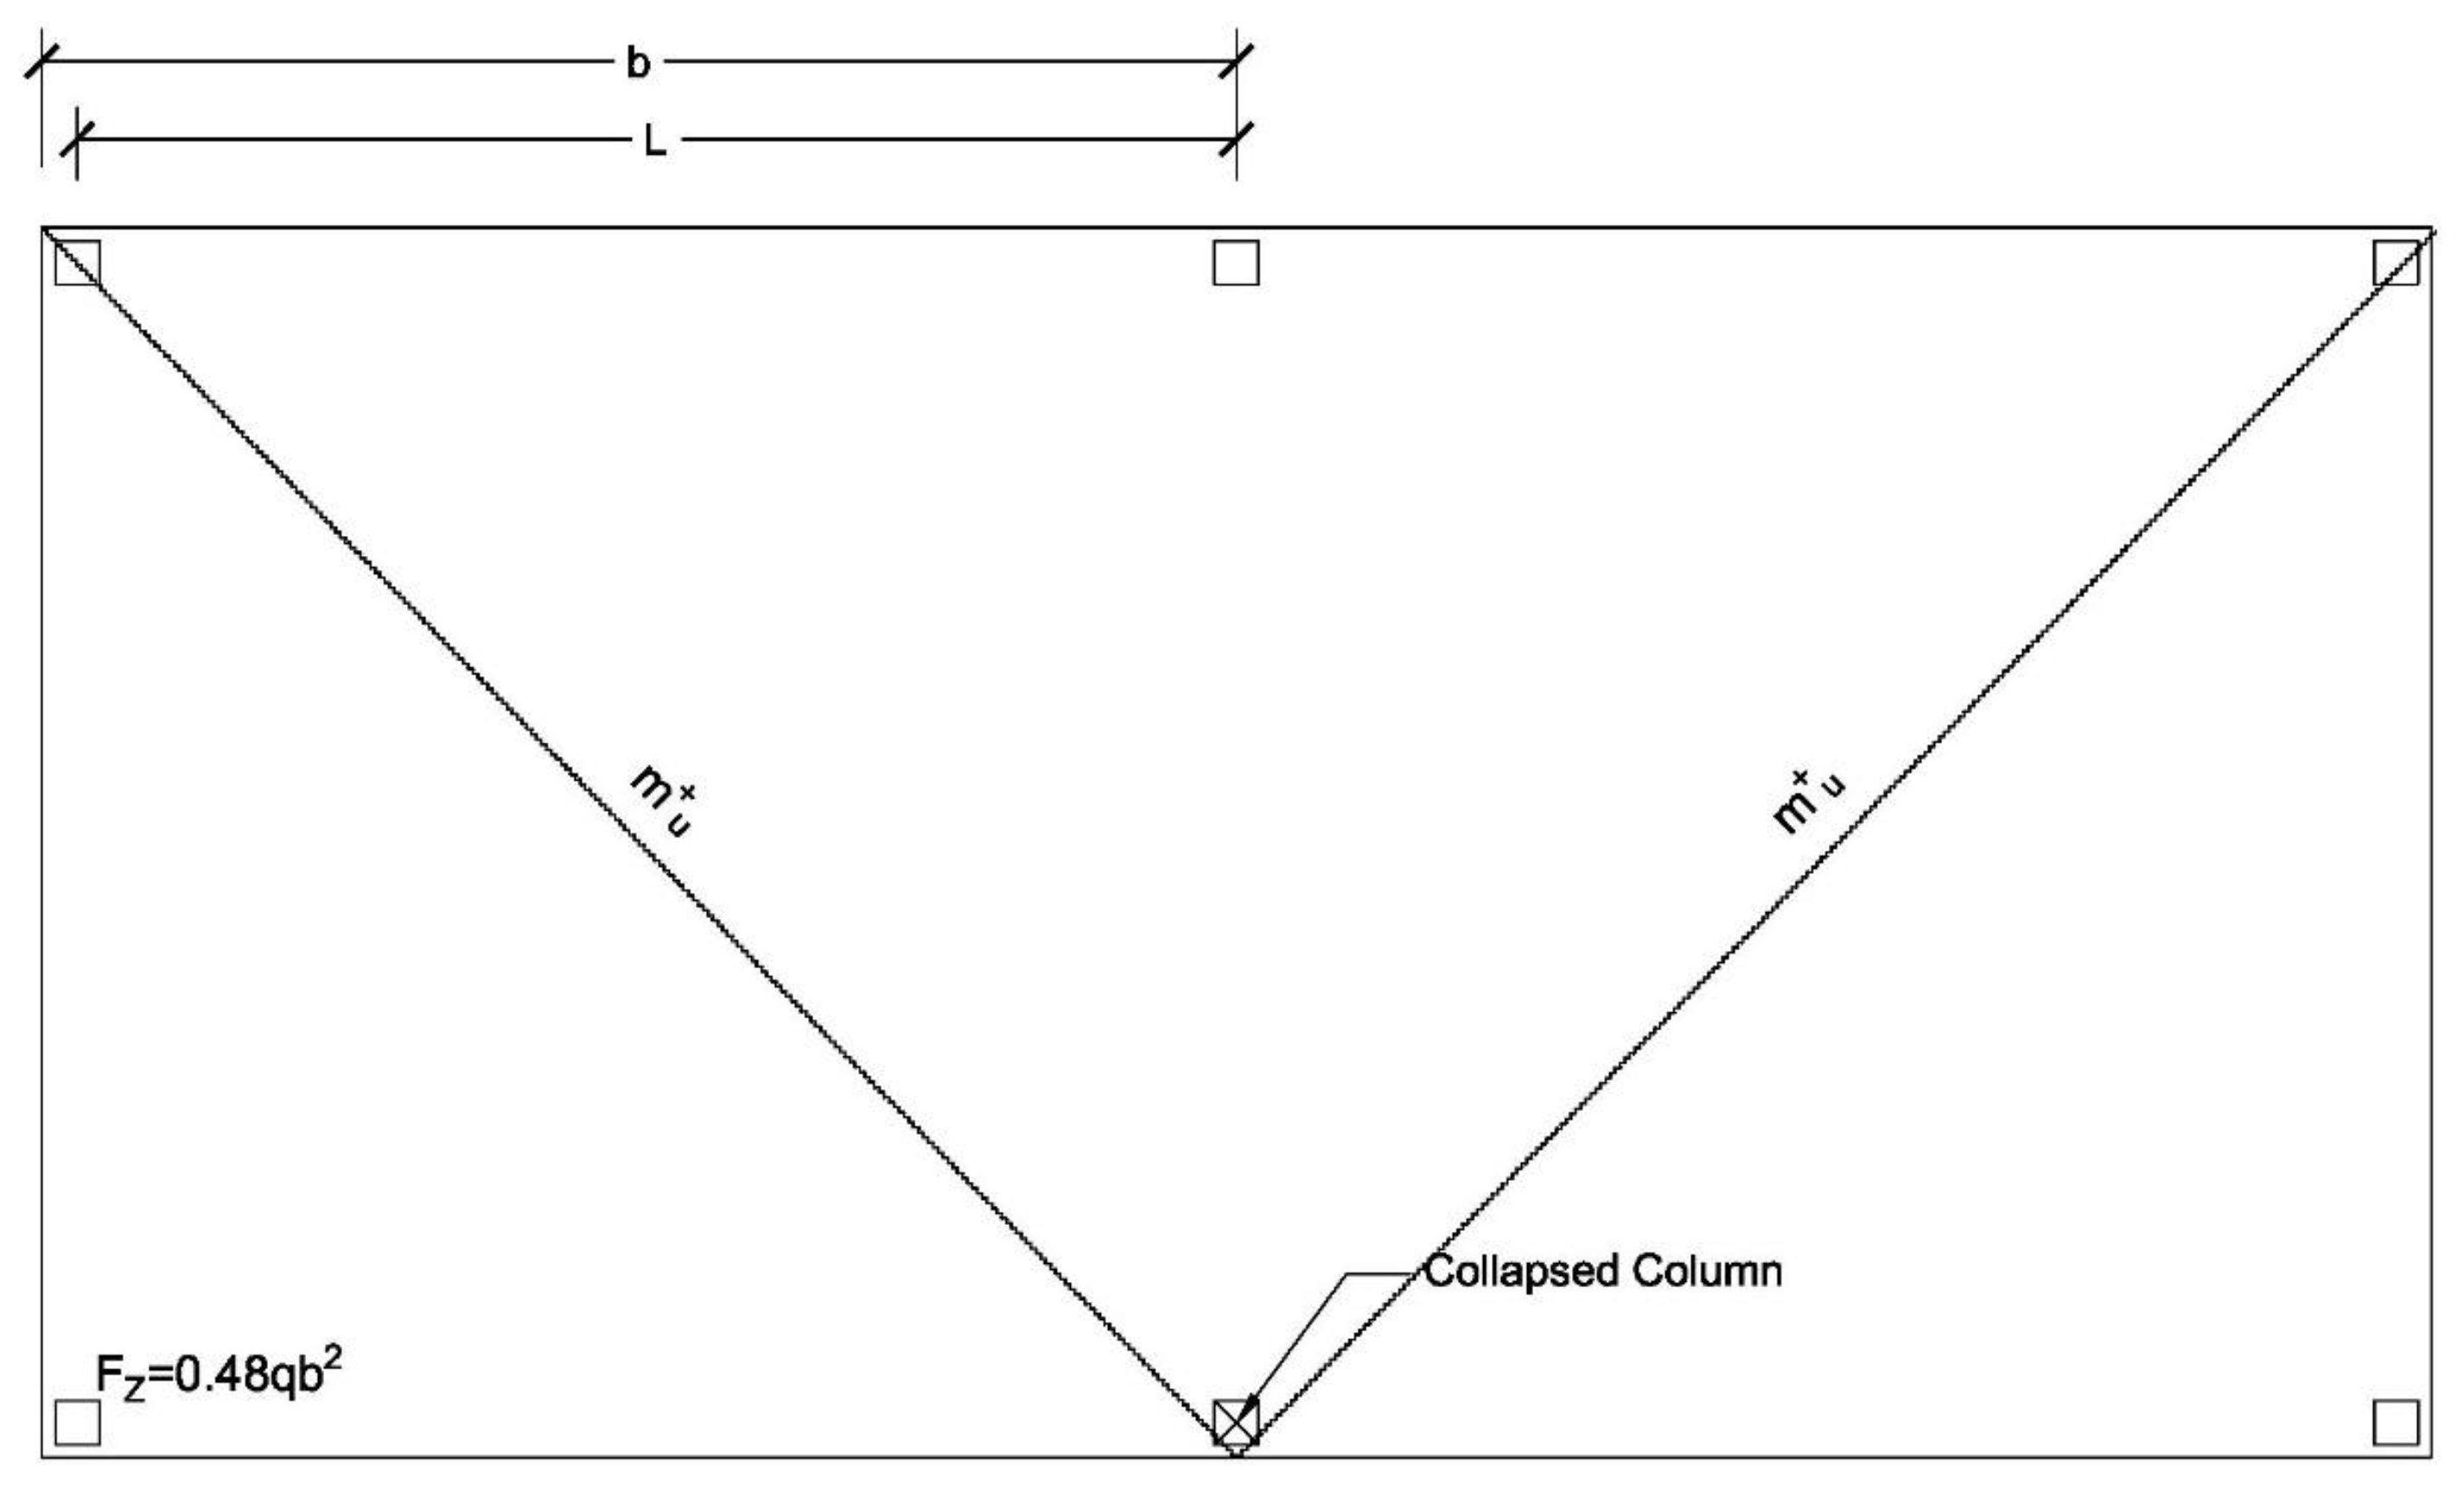
5.1. Edge Column
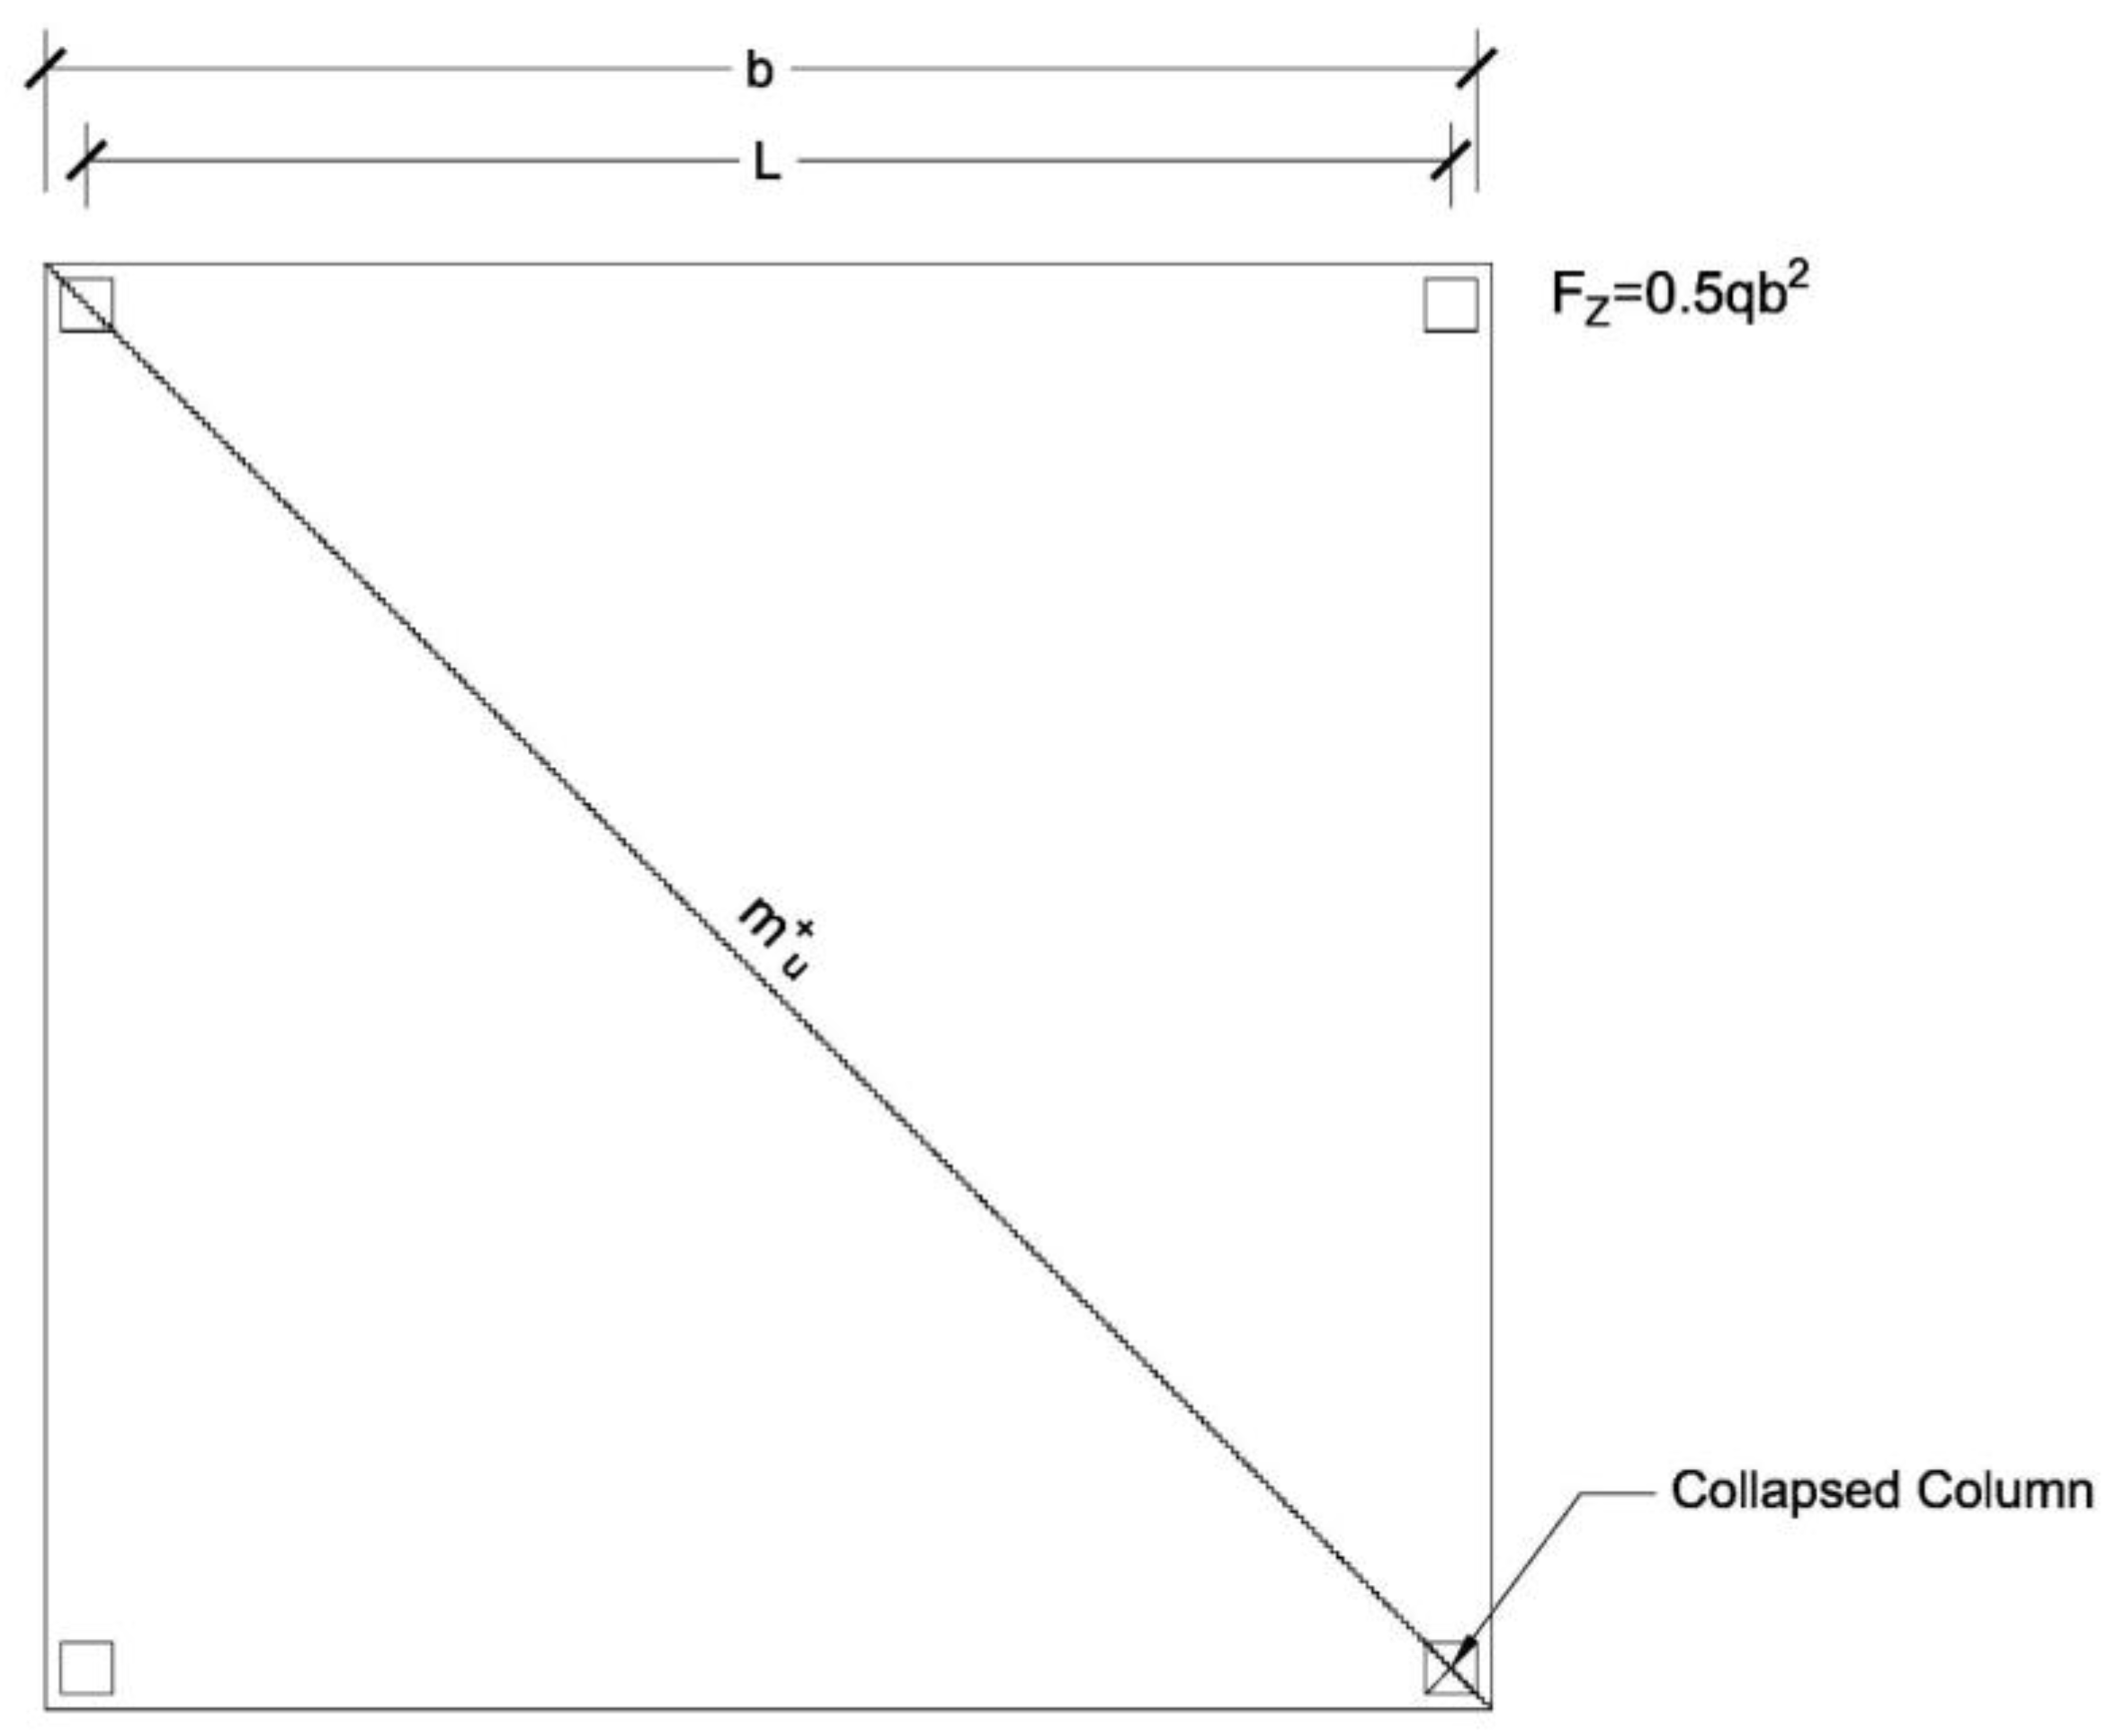
5.2. Corner Column
6. Finite Element Analysis
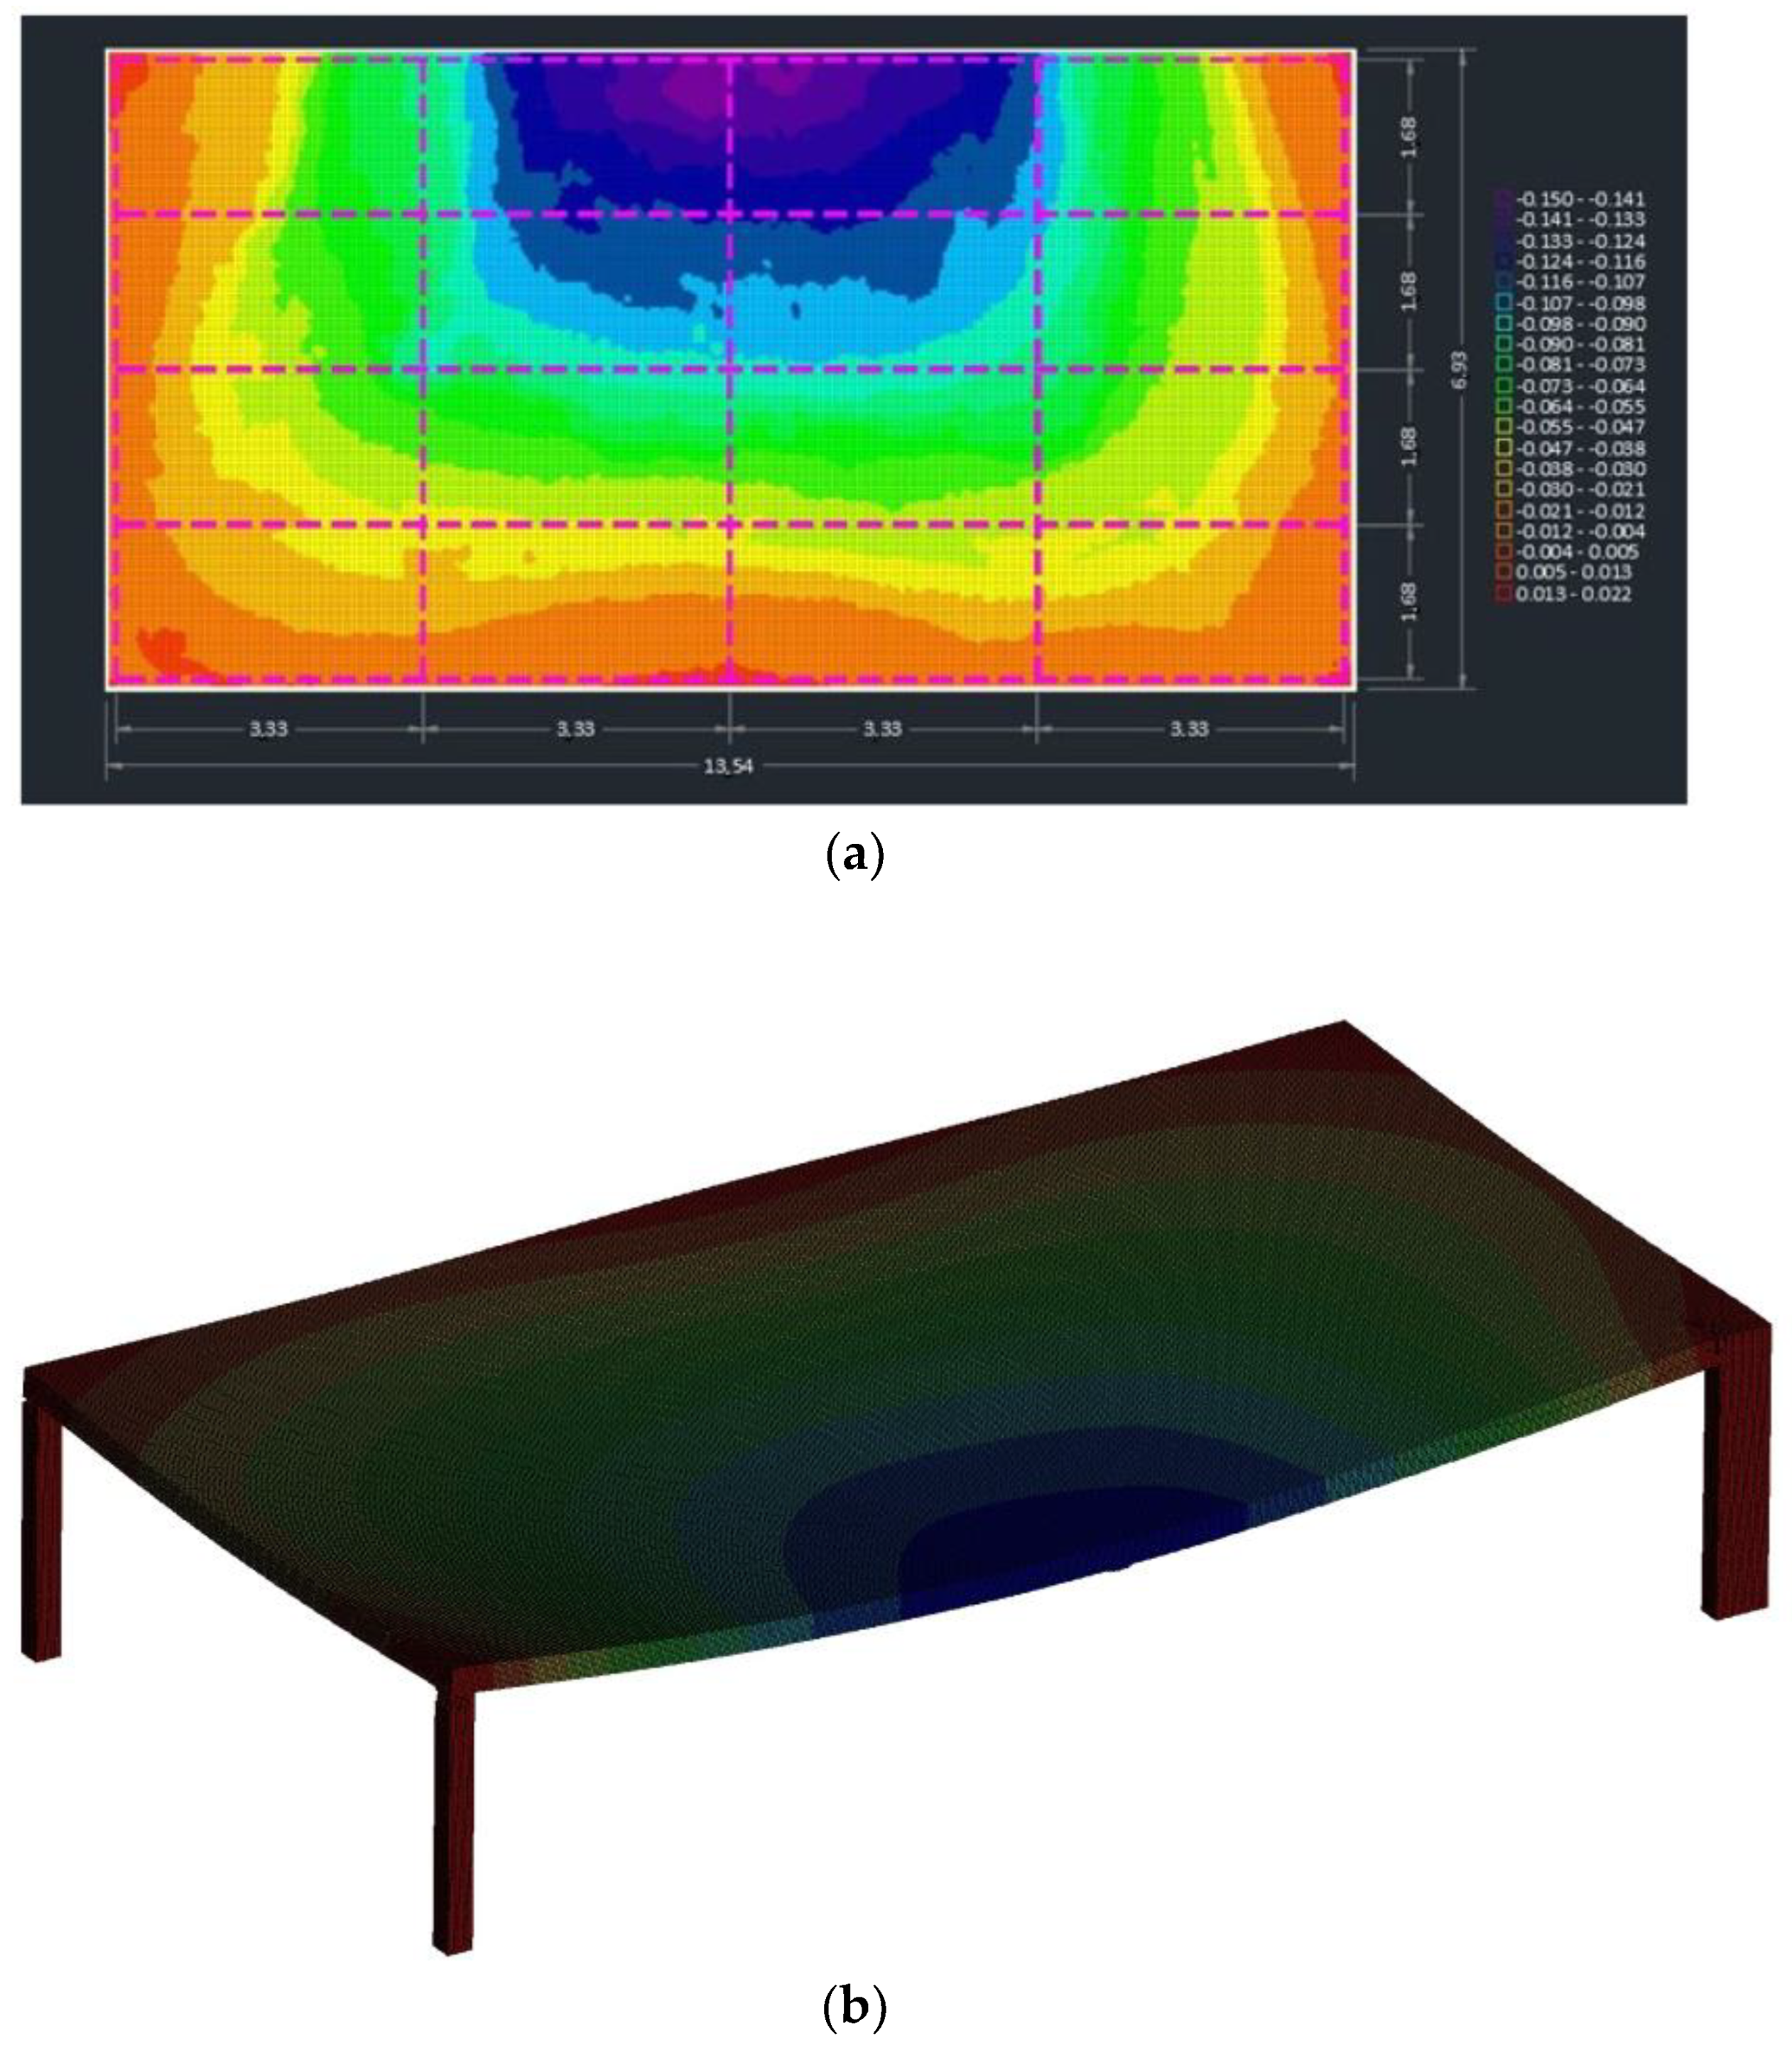
6.1. Two-Storey Structure
6.2. Two-Span Structure
7. Conclusions
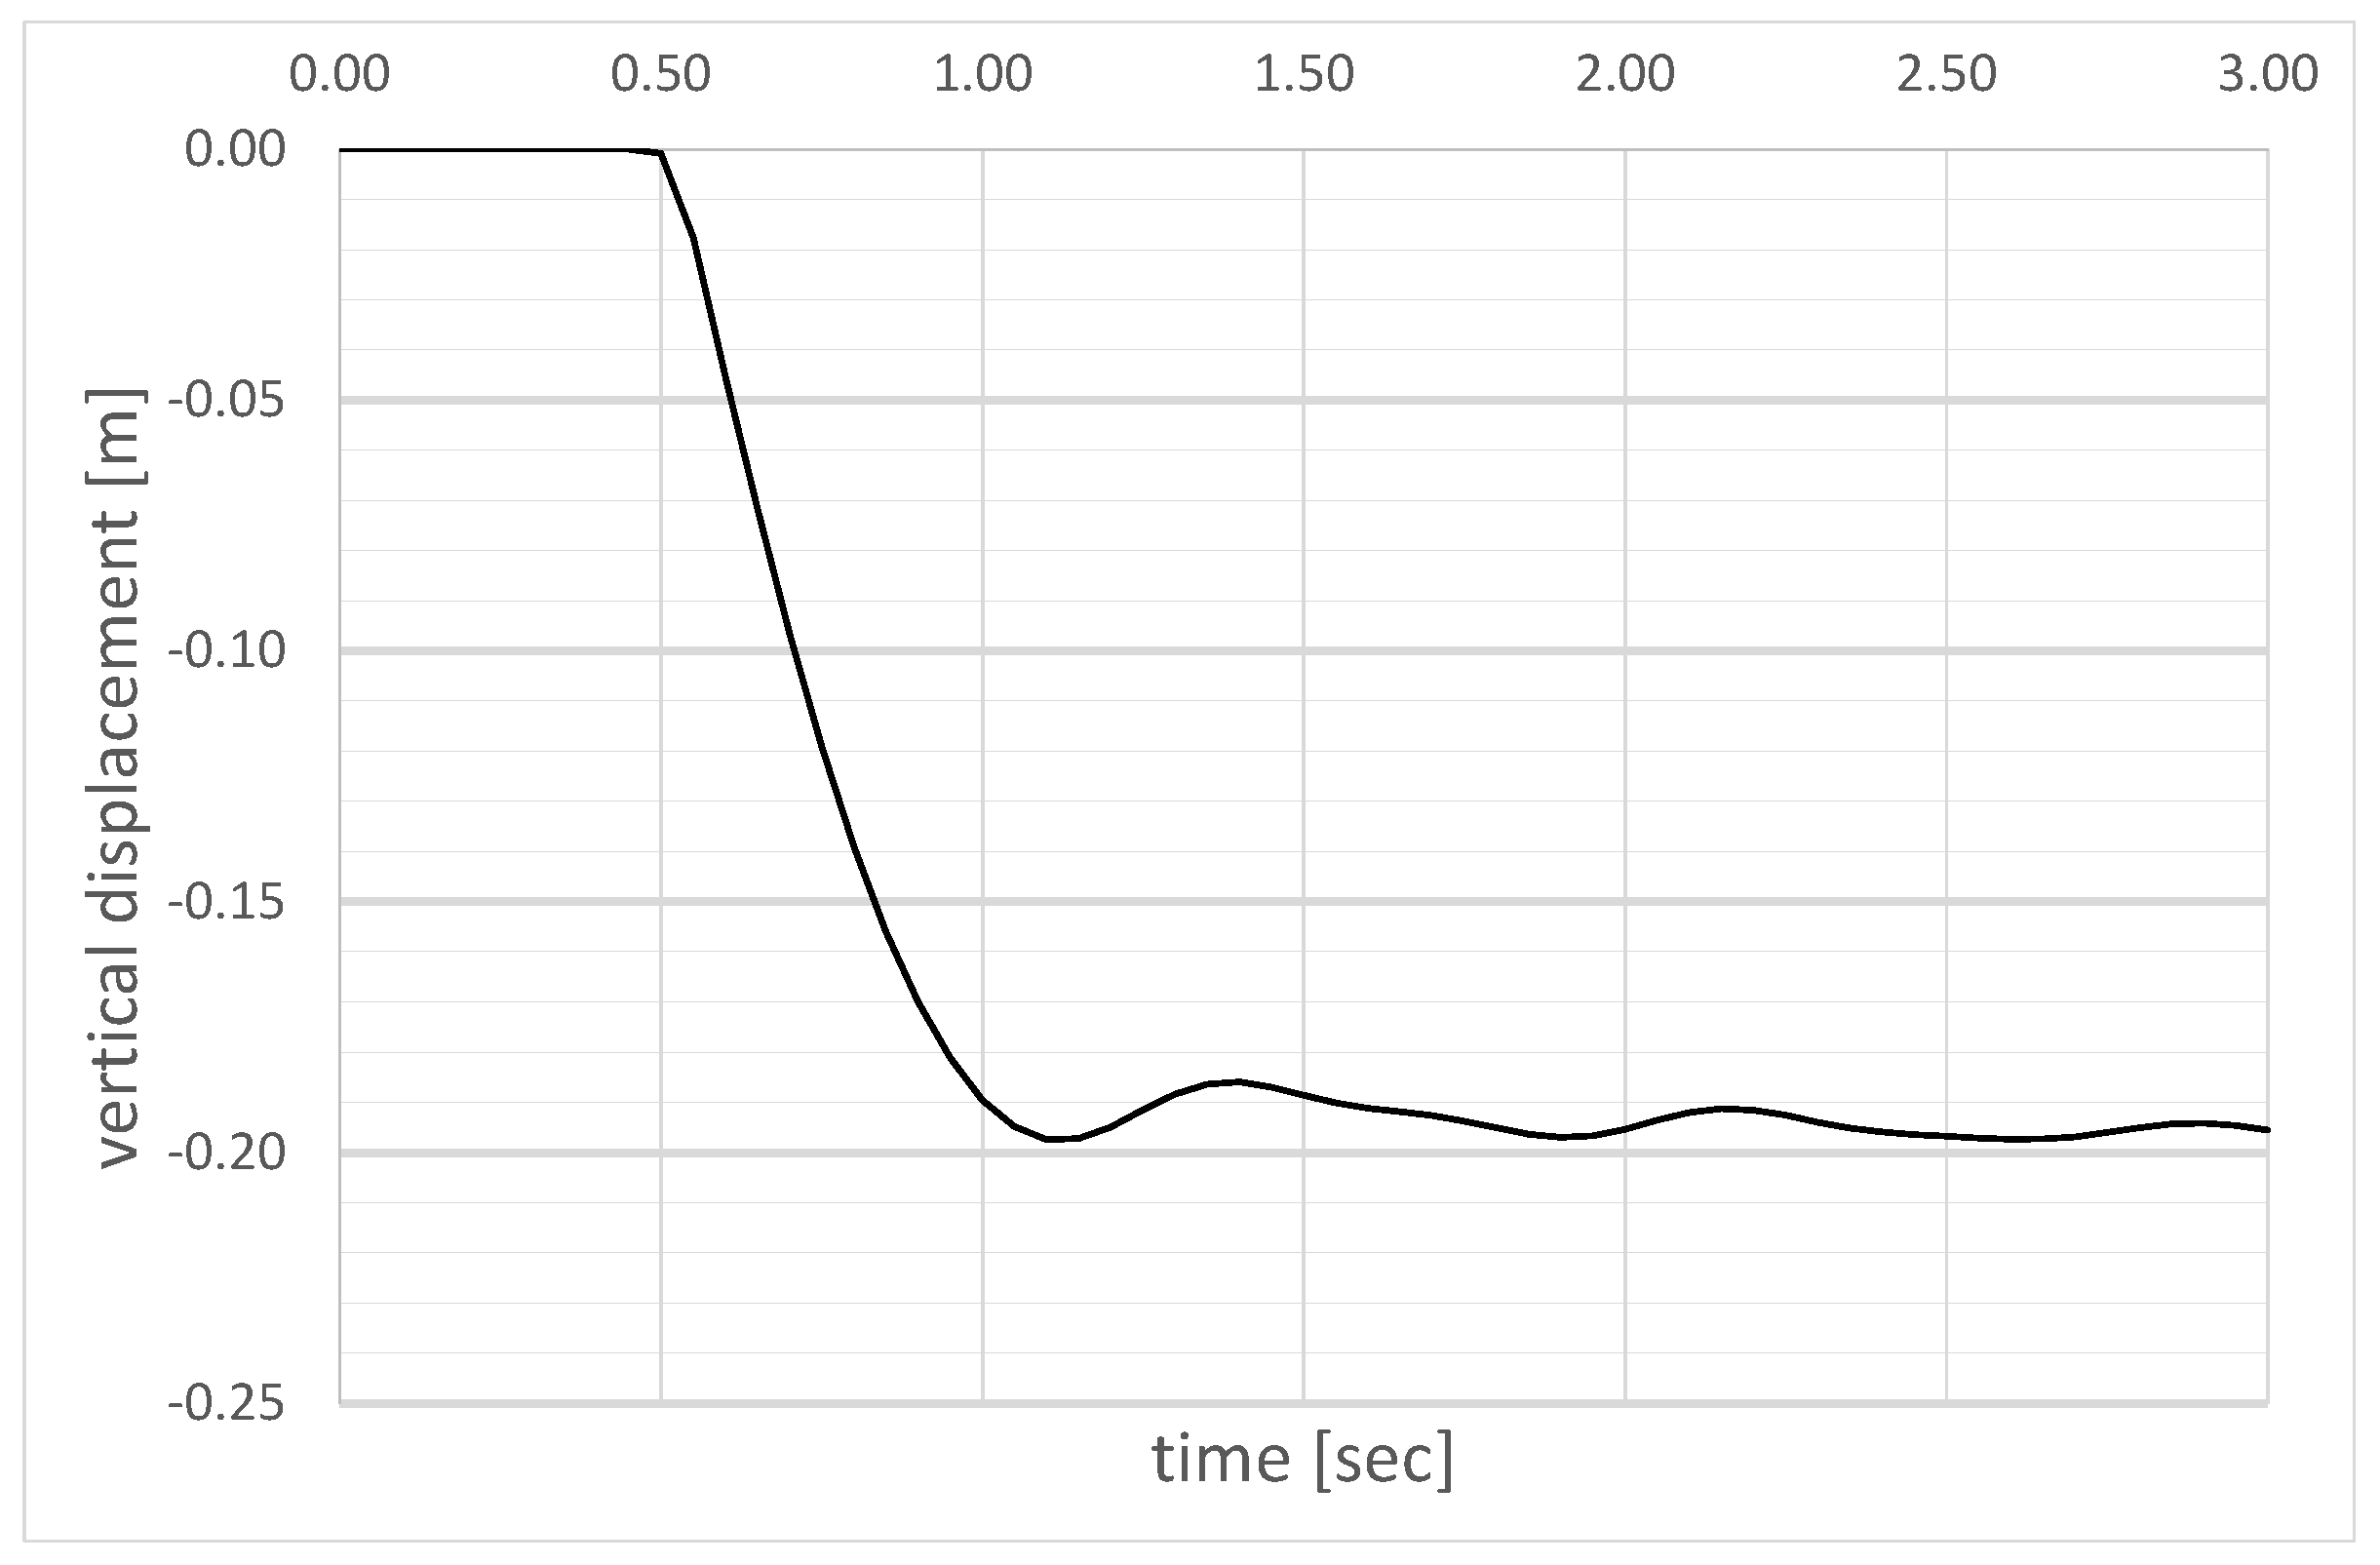
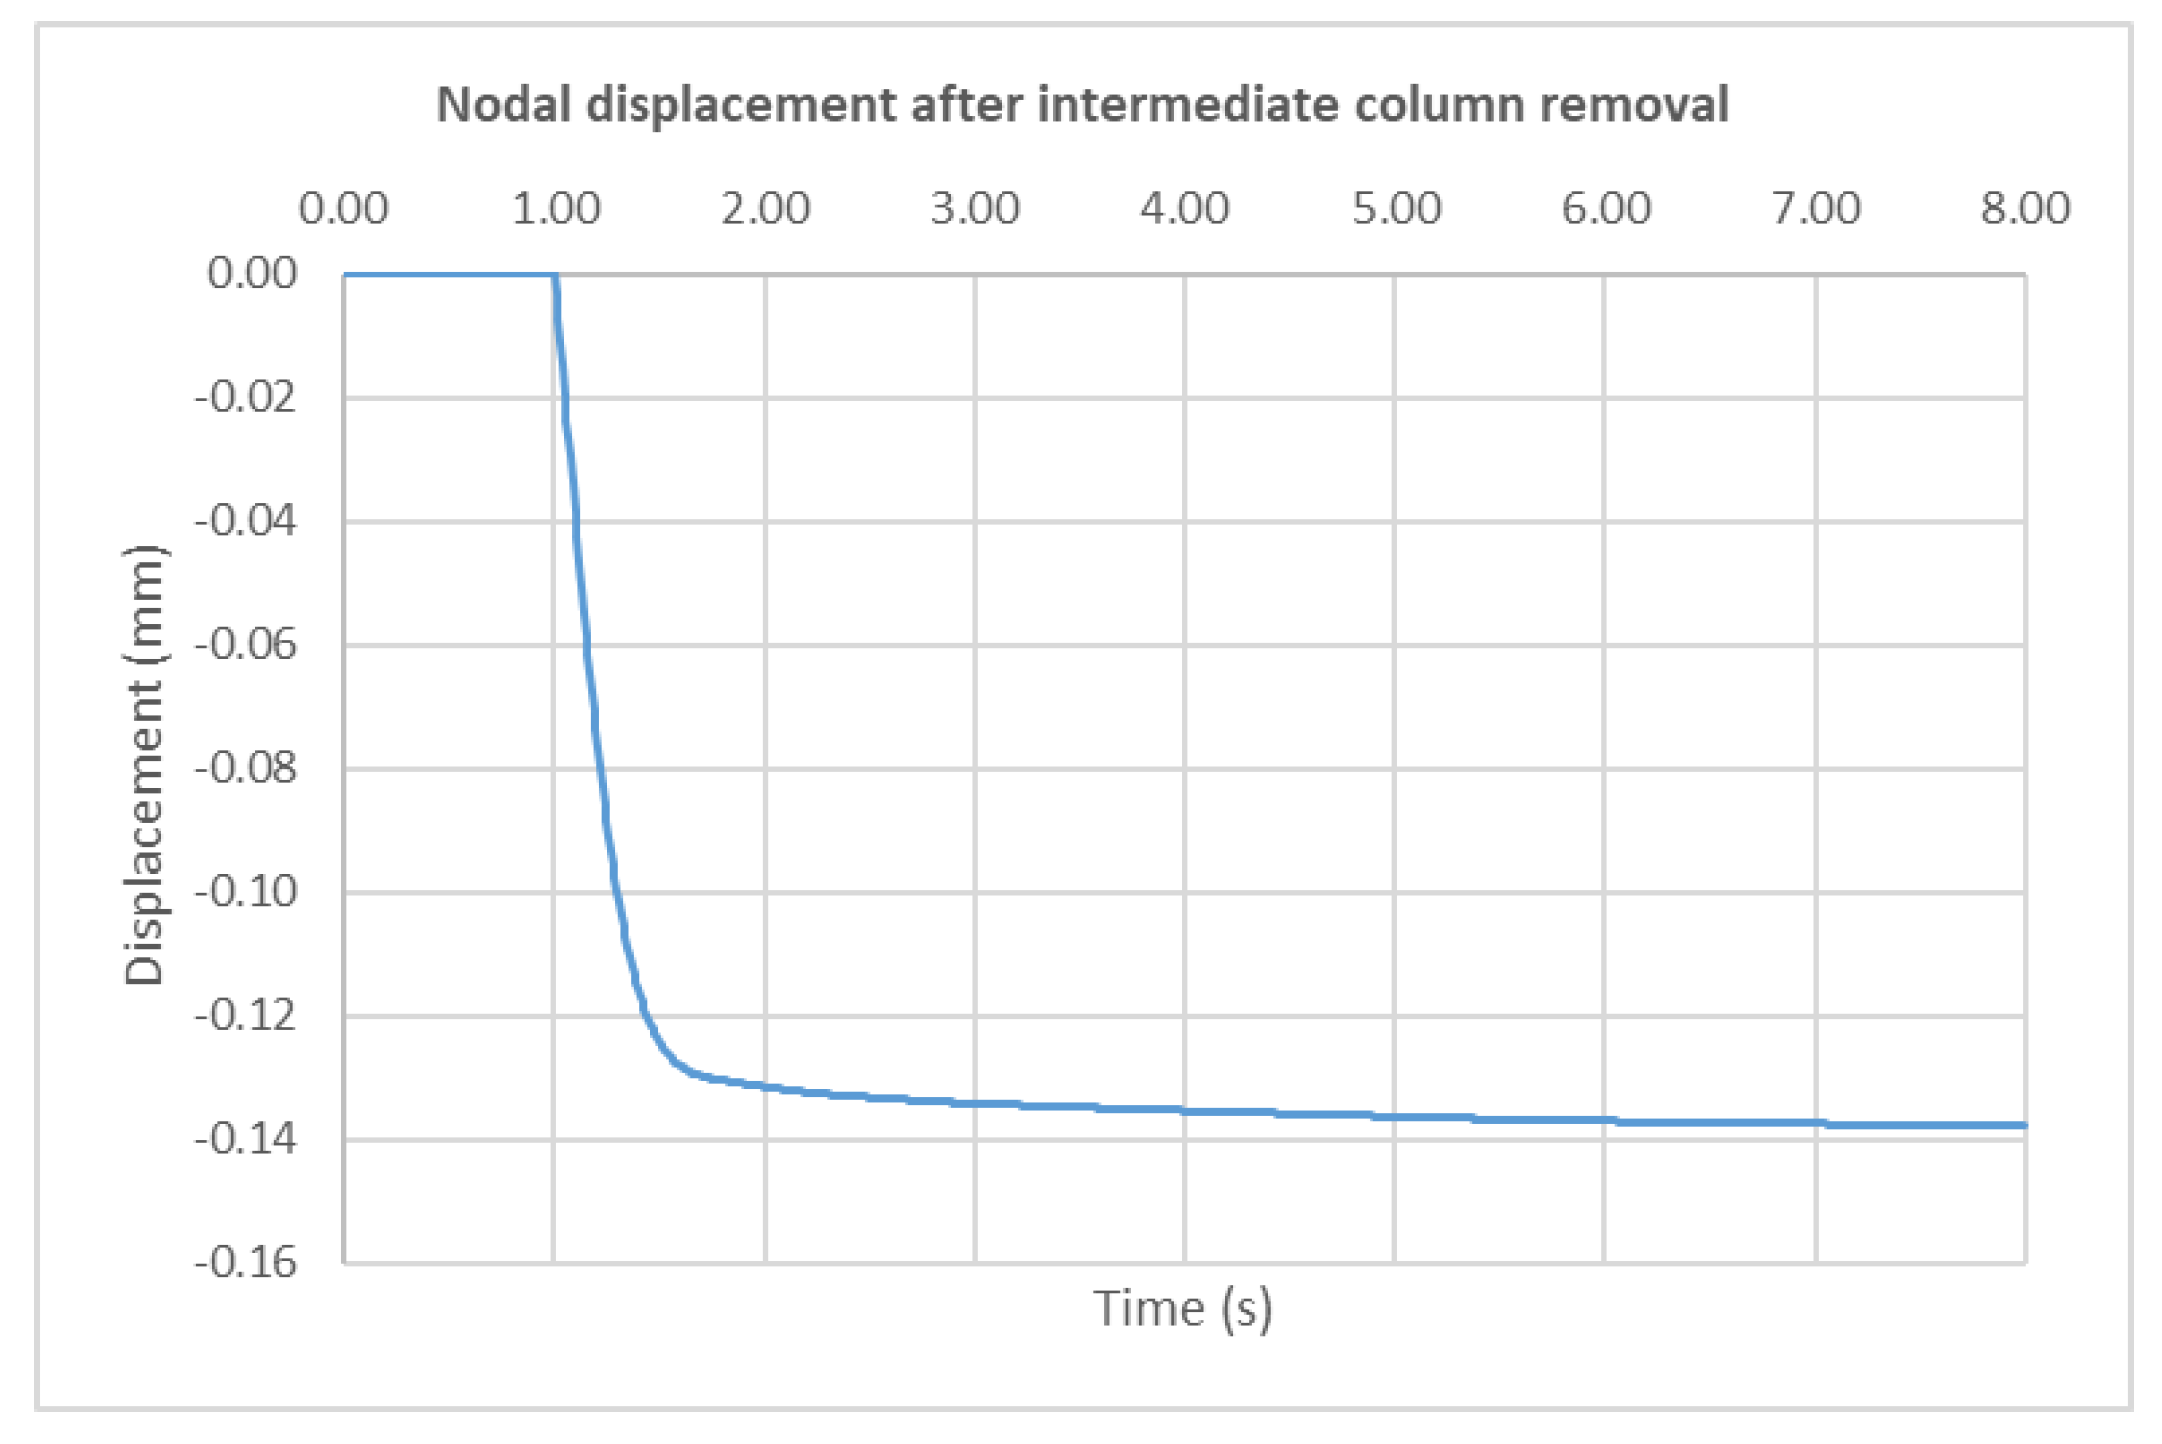
- In these structures, when subjected to only their self-weight, the removal of a single column results in relatively moderate deformations (14 to 15 cm for the two-span structure and 22 cm for the two-storey structure). The cracking observed in both cases is moderate, indicating that the steel stresses are within a serviceable range.
- The simple strut-and-tie or rupture line analyses indicate that the structure could avoid collapse even with very large loads. Such analyses, however, do not account for the possible rupture of the connection between the slab and the column.
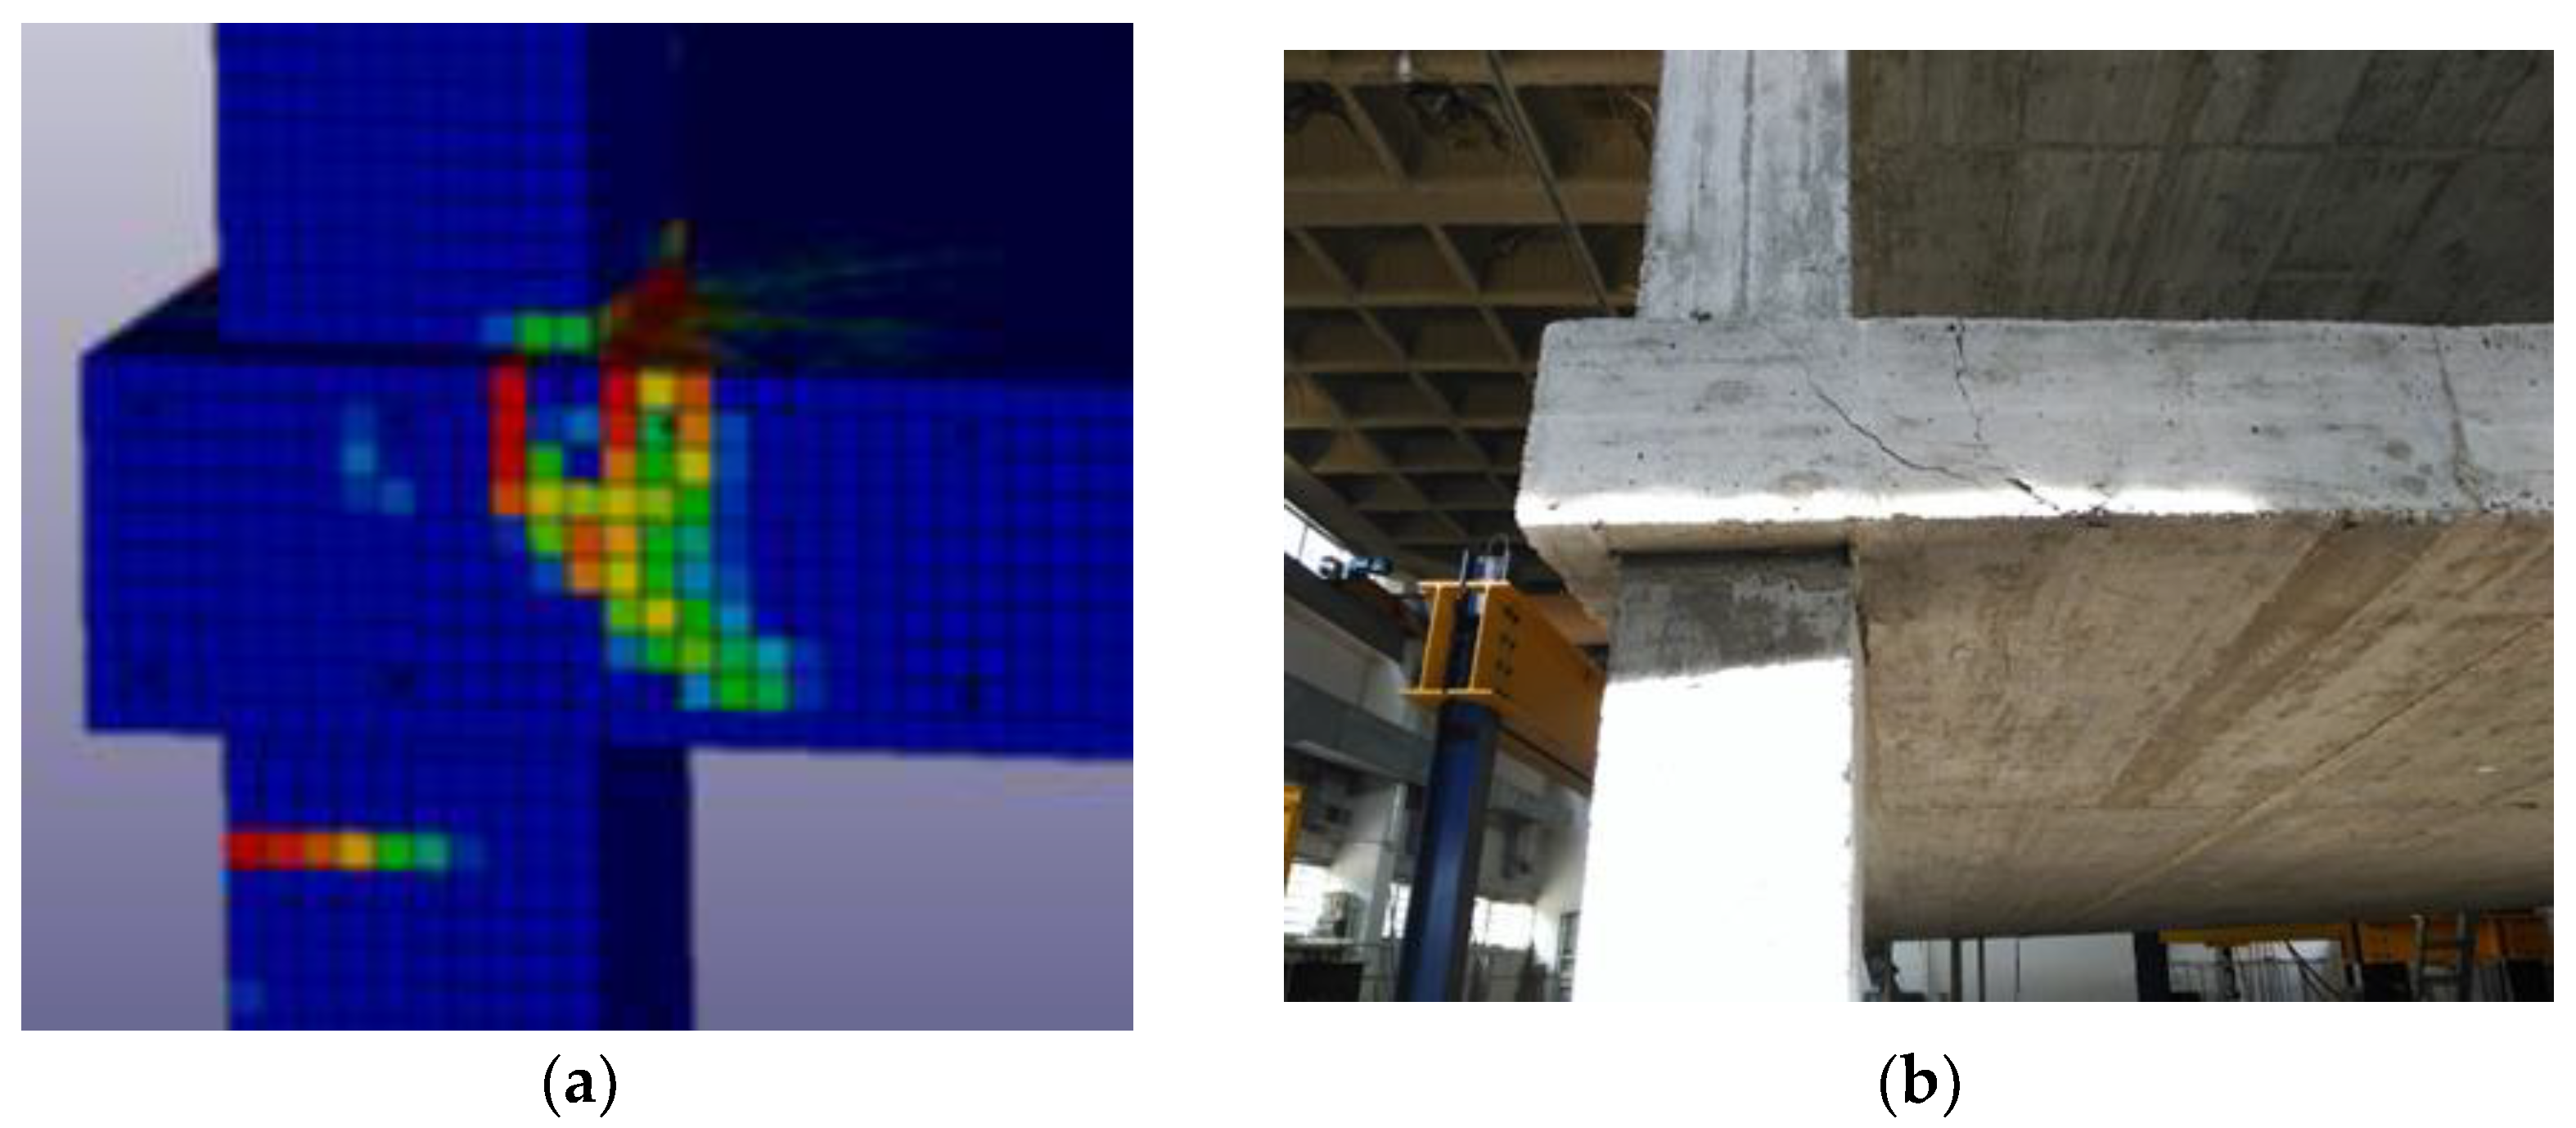
- Signs for this potential type of rupture are present even with the low levels of load at which the tests were conducted when removing a single column in the cracking pattern around the columns.
- In the two-span structure, even though the structure could not have survived the removal of two columns in any case, the failure observed in both the test and the FEM model is the torsional failure of the column–slab connection.
- This type of rupture also occurs in the FEM simulations of the two-storey frame structure for a load of 15.25 kPa, which is very similar to the value obtained by using rupture line analysis.
- The analysis shows that, contrary to the prevailing opinion in the literature, membrane forces can also be mobilized for edge and corner column failures. This has been established above with the use of strut-and-tie models, where it was shown that for equal spans in both directions, membrane forces are two times more effective for a central column than for either an edge or a corner column. For a given load, these models provide the deflection needed to balance the lost reaction force with the vertical component of the membrane forces at the collapsed column location. The problem is determining whether this deflection is admissible or whether, before reaching it, the column–slab connection would fail, leading to the complete collapse of the structure. This observation leads to the need to complement the robustness analysis with further consideration regarding the resistance of the column–slab connection.
Author Contributions
Funding
Data Availability Statement
Conflicts of Interest
References
- Gulvanessian, H. EN 1991 Eurocode 1: Actions on structures. In Proceedings of the Institution of Civil Engineers-Civil Engineering; Thomas Telford Ltd.: London, UK, 2001; Volume 144, pp. 14–22. [Google Scholar]
- Loads, M.D. Minimum design loads and associated criteria for buildings and other structures. In Minimum Design Loads and Associated Criteria for Buildings and Other Structures; ASCE Library: Lawrence, KS, USA, 2017. [Google Scholar]
- Gouverneur, D. Experimental and Numerical Analysis of tensile Membrane Action in Reinforced Concrete Slabs in the Framework of Structural Robustness. Ph.D. Thesis, Ghent University, Ghent, Belgium, 2014. [Google Scholar]
- Wang, J.; Wang, W.; Bao, Y. Full-scale test of a steel–concrete composite floor system with moment-resisting connections under a middle-edge column removal scenario. J. Struct. Eng. 2020, 146, 04020067. [Google Scholar] [CrossRef]
- Zandonini, R.; Baldassino, N.; Freddi, F.; Roverso, G. Steel-concrete frames under the column loss scenario: An experimental study. J. Constr. Steel Res. 2019, 162, 105527. [Google Scholar] [CrossRef]
- Zhang, Q.; Li, Y. Experimental and modeling study on the progressive collapse resistance of a reinforced concrete frame structure under a middle column removal scenario. Struct. Des. Tall Spec. Build. 2020, 29, e1693. [Google Scholar] [CrossRef]
- Sasani, M. Response of a reinforced concrete infilled-frame structure to removal of two adjacent columns. Eng. Struct. 2008, 30, 2478–2491. [Google Scholar] [CrossRef]
- Song, B.I.; Giriunas, K.A.; Sezen, H. Progressive collapse testing and analysis of a steel frame building. J. Constr. Steel Res. 2014, 94, 76–83. [Google Scholar] [CrossRef]
- Adam, J.M.; Buitrago, M.; Bertolesi, E.; Sagaseta, J.; Moragues, J.J. Dynamic performance of a real-scale reinforced concrete building test under a corner-column failure scenario. Eng. Struct. 2020, 210, 110414. [Google Scholar] [CrossRef]
- Buitrago, M.; Makoond, N.; Moragues, J.J.; Sagaseta, J.; Adam, J.M. Robustness of a full-scale precast building structure subjected to corner-column failure. Structures 2023, 52, 824–841. [Google Scholar] [CrossRef]
- Adam, J.M.; Parisi, F.; Sagaseta, J.; Lu, X. Research and practice on progressive collapse and robustness of building structures in the 21st century. Eng. Struct. 2018, 173, 122–149. [Google Scholar] [CrossRef]
- Makoond, N.; Shahnazi, G.; Buitrago, M.; Adam, J.M. Corner-column failure scenarios in building structures: Current knowledge and future prospects. Structures 2023, 49, 958–982. [Google Scholar] [CrossRef]
- Herraiz Gómez, B. Robustness of Flat Slab Structures Subjected to a Sudden Column Failure Scenario. Ph.D. Thesis, ETH Zürich, Zürich, Switzerland, 2016. [Google Scholar]
- Caldentey, A.P.; Diego, Y.G.; Fernández, F.A.; Santos, A.P. Testing robustness: A full-scale experimental test on a two-storey reinforced concrete frame with solid slabs. Eng. Struct. 2021, 240, 112411. [Google Scholar] [CrossRef]
- López, L.M.; Pérez-Caldentey, A.; Santos, A.P.; Diego, Y.G.; Castedo, R.; Chiquito, M. Experimental response and numerical modelling of a full-scale two-span concrete slab frame subjected to blast load. Eng. Struct. 2023, 296, 116969. [Google Scholar] [CrossRef]
- Kiakojouri, F.; Zeinali, E.; Adam, J.M.; De Biagi, V. Experimental studies on the progressive collapse of building structures: A review and discussion on dynamic column removal techniques. Structures 2023, 57, 105059. [Google Scholar] [CrossRef]
- Park, R.; Gamble, W.L. Reinforced Concrete Slabs; John Wiley & Sons: Hoboken, NJ, USA, 1999. [Google Scholar]
- Hallquist, J.O. LS-DYNA Theory Manual; Livermore Software Technology Corporation: Livermore, CA, USA, 2006; Volume 3, pp. 25–31. [Google Scholar]
- Khoe, Y.S.; Weerheijm, J. Limitations of smeared crack models for dynamic analysis of concrete. In Constitutive Models, Proceedings of the 12th International LS-DYNA Users Conference, Detroit, MI, USA, 3–5 June 2012; Karagozian & Case: Burbank, CA, USA, 2012. [Google Scholar]
- Alañón, A.; Cerro-Prada, E.; Vázquez-Gallo, M.J.; Santos, A.P. Mesh size effect on finite-element modeling of blast-loaded reinforced concrete slab. Eng. Comput. 2018, 34, 649–658. [Google Scholar] [CrossRef]


| MAT_CSCM_CONCRETE Parameters | ||
|---|---|---|
| Parameter | LS-DYNA symbol | Value |
| Mass density | RO | 2300 kg/m3 |
| Unconfined compression strength | FPC | 30 MPa |
| Maximum aggregate size | DAGG | 20 mm |
| Erode parameter | ERODE | 1.1 |
| Piecewise linear plasticity model for steel rebars | ||
| Mass density | RO | 7850 kg/m3 |
| Young’s modulus | E | 210 GPa |
| Poisson’ s ratio | PR | 0.3 |
| Yield stress | SIGY | 575 MPa |
| Tangent modulus | ETAN | 1194 MPa |
| Effective plastic strain to failure | FAIL | 0.075 |
| MAT_Winfrith Parameters | ||
|---|---|---|
| Parameter | LS-DYNA symbol | Value |
| Mass density | RO | 2300 kg/m3 |
| Initial tangent modulus of concrete | TM | 33.55 GPa |
| Unconfined compression strength | UCS | 33 MPa |
| Unconfined tension strength | UTS | 2.56 MPa |
| Maximum aggregate size | DAGG | 20 mm |
| Poisson’s ratio | PR | 0.2 |
| Aggregate size (radius) | ASIZE | 0.01 m |
| Piecewise linear plasticity model for steel rebars | ||
| Mass density | RO | 7850 kg/m3 |
| Young’s modulus | E | 210 GPa |
| Poisson’ s ratio | PR | 0.3 |
| Yield stress | SIGY | 575 MPa |
| Tangent modulus | ETAN | 1194 MPa |
| Effective plastic strain to failure | FAIL | 0.075 |
Disclaimer/Publisher’s Note: The statements, opinions and data contained in all publications are solely those of the individual author(s) and contributor(s) and not of MDPI and/or the editor(s). MDPI and/or the editor(s) disclaim responsibility for any injury to people or property resulting from any ideas, methods, instructions or products referred to in the content. |
© 2024 by the authors. Licensee MDPI, Basel, Switzerland. This article is an open access article distributed under the terms and conditions of the Creative Commons Attribution (CC BY) license (https://creativecommons.org/licenses/by/4.0/).
Share and Cite
Pérez Caldentey, A.; G. Diego, Y.; Santos, A.P.; López, L.; Chiquito, M.; Castedo, R. Robustness of Reinforced Concrete Slab Structures: Lessons Learned from Two Full-Scale Tests. Buildings 2024, 14, 558. https://0-doi-org.brum.beds.ac.uk/10.3390/buildings14020558
Pérez Caldentey A, G. Diego Y, Santos AP, López L, Chiquito M, Castedo R. Robustness of Reinforced Concrete Slab Structures: Lessons Learned from Two Full-Scale Tests. Buildings. 2024; 14(2):558. https://0-doi-org.brum.beds.ac.uk/10.3390/buildings14020558
Chicago/Turabian StylePérez Caldentey, Alejandro, Yolanda G. Diego, Anastasio P. Santos, Lina López, María Chiquito, and Ricardo Castedo. 2024. "Robustness of Reinforced Concrete Slab Structures: Lessons Learned from Two Full-Scale Tests" Buildings 14, no. 2: 558. https://0-doi-org.brum.beds.ac.uk/10.3390/buildings14020558