Article

External Spatial Morphology of Creative Industries Parks in the Industrial Heritage Category Based on Spatial Syntax: Taking Tianjin as an Example

1
International School of Engineering, Tianjin Chengjian University, Tianjin 300384, China
2
Faculty of Architecture, Cracow University of Technology, 31-155 Kraków, Poland
3
China Academy of Building Research Tianjin Institute, Tianjin 300380, China
4
School of Architecture, Tianjin Chengjian University, Tianjin 300384, China
*
Author to whom correspondence should be addressed.
Submission received: 26 October 2023 / Revised: 5 February 2024 / Accepted: 14 February 2024 / Published: 20 February 2024

Abstract

:
Industrial heritage creative industrial parks are an organic component of historical neighborhood buildings. According to several field visits and surveys of creative industrial parks, it has been found that the external space of some creative industrial parks does not meet the needs of the people. This research primarily investigates the critical factors influencing the usability of external spaces in these revitalization projects. Spatial syntax, a field that has seen considerable advancement in recent years, offers a more scientific approach to understanding spatial relationships. Therefore, this paper employs spatial syntax as its principal methodology. It conducts a quantitative analysis of the external spatial morphology of four creative industrial parks of industrial heritage in Tianjin. The study critically evaluates the syntactic values and identifies issues in the external spatial morphology, including a dearth of cultural elements and limited environmental richness. Furthermore, it provides recommendations for the enhancement of these external spaces. The aim is to furnish data support and strategic insights to invigorate the revitalization efforts of Tianjin’s industrial heritage creative industrial parks.

1. Introduction

Industrial heritage constitutes a vital component of cultural heritage, renowned for its historical, social, cultural, technological, economic and aesthetic significance [1,2,3]. With the promotion of conservation activities targeting industrial heritage in the UK in the 19th century, it gradually became a global conservation movement. In 2003, the Lower Tagil Charter was adopted by the International Association for the Conservation of Industrial Heritage (TICCIH) [4], which is one of the most important international documents on industrial heritage. In 2006, the State Administration of Cultural Heritage of China (SACH) organized the Wuxi Forum on the Protection of China’s Cultural Heritage in Wuxi, which was the first time that industrial heritage protection was advocated for. Since then, the interest of Chinese academics in industrial heritage research has gradually increased, and the Wuxi Forum has played an important role in promoting industrial heritage research and conservation in China [5].
At the same time, many cities worldwide are contemplating retaining existing industrial sites and transforming them into visitor attractions with a brand positioning in culture and creativity [6,7,8]. Creative industries take creative industrial parks as the carrier of their material space and provide them with characteristic material space by combining with old industrial factories [9,10]. The study of creative industrial parks has been carried out along with the rise of creative industries. It mainly includes the study of creative industry class [11,12], the study of creative industry cluster [13] and the study of the spatial field of creative industry parks [14,15].
In recent years, data surveys of and field visits to creative industrial park projects have revealed that some projects have not attained their anticipated planning outcomes. Observations indicate a lack of satisfaction among users regarding the park’s usability, coupled with a notable deficiency in the vitality of the park’s external space. Concurrently, quantitative research on the external space of industrial heritage renewal projects is in its nascent stages within the academic community. Specifically, there is a limited number of quantitative studies focused on the external space of industrial heritage creative industrial park renewal projects. This shortfall highlights a need for more informed guidance on enhancing the external spaces of these parks. Addressing these issues is of immediate importance.
Spatial syntax has developed rapidly in recent years, and its use is gradually increasing as a method of quantifying space and enabling researchers to study spatial relationships in a more scientific manner. For example, spatial syntax is used to study the relationship between people and community space, the structures of streets over time, the influence of roads on urban structural connectivity, the tendency of visitors in choosing paths, the spatial visibilities of cities and the spatial relationship between cultures, settlements and the configurational structure of social spaces [16,17,18,19,20,21,22]. Consequently, this study adopted spatial syntax as its primary methodology to investigate the spatial nodes, traffic routes and visual interfaces in the external spatial morphology of industrial heritage-based creative industrial parks in Tianjin.
This paper focuses on creative industrial parks based on industrial heritage in Tianjin as its research subject. It references pertinent theories, by contrasting with studies on the external spatial morphology of other creative industrial parks, and the study innovatively applied three syntactic quantitative methods: axes, convexity and visual field. This approach enables comprehensive analyses, allowing for quantitative and objective descriptions of the external spatial morphology of these parks, thereby enhancing the scientific basis for future design endeavors. The study of Tianjin’s industrial heritage creative industrial parks’ external space morphology not only summarizes the renewal projects, but also offers valuable insights and recommendations for future design practices, demonstrating significant applicability (Figure 1).

2. Materials and Methods

2.1. Research Area

The transformation of cultural and creative industrial parks is an effective way to renew and utilize industrial heritage in Tianjin. According to the statistics of the database established by this group, as of July 2023, there are 9 projects of industrial heritage-based creative industrial parks in Tianjin (Figure 2). In order to study the external spatial morphology of the industrial heritage-based creative industrial parks in Tianjin, the basic information of these 9 industrial heritage-based creative industrial parks was organized (Table 1).
In terms of transformation time, the transformation times of Yiku Creative Industrial Park and Tatsuhaku Creative Industrial Park are relatively early, while the transformation times of other creative industrial parks are relatively late. In terms of the maturity of development, C92 Creative Cluster, No.6 Courtyard Creative Industrial Park, “1946” Creative Industrial Park and “3526” Creative Factory have higher grades of maturity and relatively better supporting facilities, while the other creative industrial parks have lower grades of maturity. In terms of scale, 460 International Design Park, Chenhe Creative Industry Park, Lane Warehouse Creative Industry Park and No.6 Courtyard Creative Industry Park are relatively small in scale; C92 Creative Cluster, “1946” Creative Industrial Park and Yiku Creative Industry Park are moderate in scale; and “3526” Creative Factory and Cotton 3 Creative Factory are relatively mature in development. In terms of geographical location, No. 6 Courtyard Creative Industry Park is the closest to the city center, 460 International Design Park is relatively far away from the city center, and other parks are at a moderate distance from the city center. After considering the above aspects, we selected four representative industrial heritage creative industry parks as the research objects of this study, namely, the “1946” Creative Industrial Park and “3526” Creative Factory in Hebei District, the C92 Creative Cluster in Nankai District and the Cotton 3 Creative Block in Hedong District (Figure 3). These four projects have higher grades of maturity, later transformation times, larger scales, moderate distances from the city center and located in different regions, and at the same time represent the development of creative industrial parks of the industrial heritage category in Tianjin from early stages to recent developments, which is more appropriate and scientific and suitable as the objects of this research.

2.2. Analysis of Spatial Syntax Theory

2.2.1. An Interpretation of Spatial Syntax Theory

The theory of spatial syntax was first proposed by British scholar Bill Hillier [23], who pointed out that spatial syntax is a kind of quantitative description that describes the objects of the structures of human spaces such as buildings, settlements, cities and landscapes, and then explores the connection between spatial organization and human life. Hillier focused on the development of methods and theories related to space–society relationships between buildings [24,25,26,27,28]. The “space” in the theory of spatial syntax is not the three-dimensional or four-dimensional space, but the space here represents the relationship between different spaces [29,30], such as topological relationships. In the process of researching this theory, the actual space represents a kind of quantitative index, and then the relevant syntactic software represents them with topological diagrams, so as to achieve the goal of quantitatively describing the space.

2.2.2. A Basic Analytical Approach to Spatial Syntax

The configurations in spatial syntax have great roles in its theoretical research, so before using the theory for quantitative research, relevant abstraction and integration work should be performed, including spatial segmentation and so on. The theory of spatial syntax involves three kinds of spatial segmentation methods, namely, the axial method, convex space method and visual field analysis method [31,32].

2.2.3. Quantitative Indicators in Spatial Syntactic Configurations

The depth value between two nodes refers to the shortest distance (i.e., the minimum number of steps) from one node to another, and the global depth value refers to the total depth value of the shortest journey from all nodes in the system to a particular node, which when divided by the number of nodes other than itself is the mean depth value. In this paper, we mainly use the mean depth value for the study [33]. The total depth (TDi) and average depth (MDi) of node i calculation formulas are shown in Equation (1):
T D i = j = 1 n d i j ,   M D i = T D i ( n 1 )
The integration degree indicates the degree of agglomeration or disaggregation of a unit’s node space with the remaining space in a spatial system. In an axial analysis diagram, the redder the color, the greater the integration degree of the node space, the better the accessibility of this node space and vice versa [23]. The formula of the integration degree Ii of node i is given in Equation (2):
I i = n [ l o g 2 n + 2 3 1 + 1 ] ( n 1 ) ( M D i 1 )
Intelligibility calculates the correlation coefficient between connectivity and integration, indicating the spatial characteristics of the whole system as perceived through local features. The closer the correlation coefficient (R2) is to 1.0, the higher level of intelligibility. A spatial system with a high degree of intelligibility should have good connectivity between local and neighboring spaces within the system and a high degree of integration of the system as a whole, so that the structure of this spatial system is clearer and easier to be understood by visitors [34,35,36]. The intelligibility calculation formula is given in Equation (3):
R 2 = [ Σ ( I i g I ¯ g ) ( I i l I ¯ l ) ] 2 Σ ( I i l I ¯ l ) 2 Σ ( I i g I ¯ g ) 2
where I i g and I ¯ g represent the global integration of node i and the mean of the global integration of all nodes, respectively; I i l and I ¯ l represent the local integration of node i and the mean of the local integration of all nodes, respectively.

2.2.4. Research Methods and Steps in Spatial Syntax

Spatial syntax can model and illustrate the relationship between the real external space of creative industrial parks, show the implicit logic and social attributes of the space through algorithms and thus explore the relationship between spatial structure and the activities of people using the park [37,38]. With the help of spatial syntax software Depth Map(0.8.0.) to analyze the data can help us visualize the external spatial relationship of industrial heritage creative industrial parks and analyze the problems according to the data obtained, so as to provide targeted optimization suggestions (Figure 4).

2.3. Preparation of Data

This study focused on the external spaces of industrial heritage-based creative industrial parks, which were divided into point, line and surface spaces according to their morphology, and these were then syntactically quantified according to the principles of different segmentation methods [39,40].

2.3.1. Convex Modeling

A straight line connecting any two points in a space is convex if it lies within that space. People within the same convex space can see each other and can communicate with each other to understand each other (Figure 5a). In covering a certain spatial system with a minimum and maximum number of convex spaces (Figure 5b), considering each convex space as a node and connecting them according to their relationship with each other, the system can be transformed into a spatial relationship graphic [23].
The road system connects the overall external space of the park and is the main body of the external spatial structure of the whole park, so the road system should be taken into account when dividing the convex space, dividing it from the junction of the park’s roads and dividing the park’s road system into a number of road segments so that each road space is an independent convex space.
The method of drawing a convex map is as follows: take the space outside the buildings (including the space under the eaves) within the scope of each creative industry park research object, import the base map of the park scope intercepted from the satellite map into Auto CAD (2014) software and divide the convex space according to the types of spaces such as buildings, roads, plazas and green areas. Based on the analysis principle of the Depth Map software, the convex spaces must be rectangles that are horizontal and vertical and do not overlap with each other, so they need to be further adjusted on the basis of the drawings. Figure 6 shows the convex model of the external space of the four parks after finishing the drawing.

2.3.2. Axis Modeling

Axes represent the furthest distances visible from a point in space in the direction of the line of sight and are to be represented by the fewest and longest axes, representing the most convenient mode of movement (Figure 7). Each axis line is treated as a node in the operation of forming the relationship of the axial node intersection transformation in the spatial grouping to obtain a graphical relationship solution. Then, the axis model is calculated and analyzed using the spatial syntactic parameter variables, and different colored axes are obtained, representing different values [23,31].
The axial model is more widely used, and it is used for roads in the urban systems in most of the urban form studies. Therefore, in this study, the axis model was used to describe the linear space in the external space form of the creative industry parks. The method of drawing the axial model involves intercepting the whole park and the surrounding area according to the satellite map and importing it into Auto CAD software to manually draw the axial lines of the roads inside the park.
In order to ensure the accuracy of the quantification process, the scope of the study was expanded to the park’s carriageway roads, pedestrian roads and some of the pedestrian paths with high penetration found by the research, and curved paths were converted with clearer guidance into straight paths according to the calculation principle of the Depth Map software. Figure 8 shows the axial models of the road systems of the four creative industrial parks drawn in Auto CAD.

2.3.3. Visual Modeling

The visual field is the extent to which an element can be viewed in a spatial system. The visual field initially denotes three dimensions, whereas we often call the visual field in spatial syntactic studies two-dimensional, referring to the visible area of a certain element in the plane in which it is located, so it is necessary to extract the boundaries of the buildings in the site (Figure 9). After that, several element viewpoints are delineated using a grid in the Depth Map software and the values of the different parameter variables in the syntax are calculated by creating a relational illustration based on the way these visuals are connected to each other [41,42,43].
In this study, the syntactic quantification of faceted spaces in the external spatial forms of industrial heritage-based creative industrial parks was carried out using the visual field segmentation method. Based on the calculation principle of the Depth Map software, it is necessary to remove the height elements in the visual field in the study, and retain only the range of the human eye’s visual field in the two-dimensional plane to further reduce the definition of the faceted space. The visual field model reflects the degree of visual importance of different locations within the park’s external spatial system. Important locations can “see” a wider field of view and are also more likely to be “seen”, which results in more attention being paid to the space.
Since the visual field model is a horizontal profile study of the external space of the park, this study chose to investigate the visibility at the main elevation level of the creative industrial park. The outer contour maps of the buildings on the main elevation level of each park were drawn with a polyline in the Auto CAD software, and the building boundaries of the park were extracted. Finally, the park boundaries intercepted from the satellite map were imported into the Auto CAD software, and the overall area of the park was plotted with polylines to obtain the visual field models of the external spaces of the four parks (Figure 10).

3. Results

3.1. Convex Analysis

3.1.1. Convex Mean Depth Analysis

According to Figure 11 and Table 2, the maximum and minimum mean depth of the 16 convex spaces in the external space of the “1946” Creative Industrial Park are 3.59 and 1.86, respectively, with an overall average of 2.63. This includes a minimal proportion of reddish-orange nodes, while approximately half were bluish, indicating good overall accessibility of the park’s external nodes, but moderate spatial hierarchy richness. A few nodes exhibited lower convenience, but they were limited in number.
The maximum value of the convex mean depth of the external spatial nodes of the “3526” Creative Factory is 6.28, the minimum value is 2.59 and the average value is 3.67. Despite the prevalence of cooler tones in the visual representation, the mean depth of each spatial node is relatively high, so the park’s external space nodes have a more general overall convenience and better spatial level richness. The dark red spatial node with the highest mean depth value is the vehicular exit plaza on the southeast side of the park, and the only spatial node connected to it is the park’s car park on the north side, also depicted in warm colors.
The maximum value of the convex average depth of the external space nodes of the Cotton 3 Creative Block is 6.77, the minimum value is 3.44 and the average value is 4.92. Warm-colored areas are sparse, mainly on the northwestern and southeastern sides, but the mean depth of each node is significantly higher than those of other parks, resulting in lower overall convenience and higher spatial hierarchy richness.
The maximum convex average depth value of the external space nodes in the C92 Creative Cluster is 3.87, the minimum value is 1.87, and the average is 2.95. Although one-third of the nodes are warm-colored, their mean depths are smaller compared with those of the other parks, so the overall convenience of the external space nodes is relatively better, and the spatial hierarchical richness is more general. Contrary to the convex integration degree, nodes on the southwest and northeast sides have higher mean depth values and poorer convenience degrees.

3.1.2. Convex Integration Analysis

According to Figure 12 and Table 3, the external space of “1946” Creative Industrial Park is divided into 16 convex spaces, each of which represents a spatial node. The integration degree of these convex spaces ranges from a maximum of 2.02 to a minimum of 0.67, with an average value of 1.18. Approximately one-third of these nodes exhibit warm colors, while only two nodes exhibit dark blue colors. This shows that the overall external space nodes of the park are relatively general in attracting and gathering crowds. A minority of these nodes display limited openness and integration.
The external space of the “3526” Creative Factory contains 43 spatial nodes. The convex integration degree of these spatial nodes exhibits a maximum of 1.88, a minimum of 0.56 and an average of 1.21. Nodes with warm colors account for about one-third of the whole, whereas those with cold colors make up roughly one-quarter. These data indicate that the park’s external spatial nodes possess an average capacity for attracting and gathering crowds.
The external space of the C92 Creative Cluster contains 25 space nodes. The maximum value of the convex integration degree is 2.63, the minimum is 0.8, and the average is 1.29. Among them, there is only one spatial node with warm colors, while approximately one-third exhibit cold colors. This pattern suggests that the overall external spatial nodes of this park are relatively poor in attracting and gathering crowds, and that there is a significant disparity among the nodes.
The external space of the Cotton Three Creative Block contains 55 space nodes. The maximum value of the convex integration degree of these spatial nodes is 1.36, the minimum is 0.57, and the average is 0.88. A small proportion of spatial nodes have warm colors, including just two nodes with dark red colors, and about half of the nodes are characterized by cold colors. This indicates that the overall external spatial nodes of this block are generally less successful in attracting and gathering crowds. Despite the presence of some highly integrated nodes, their number is limited.

3.1.3. Convex Intelligibility Analysis

According to Figure 13, the convex intelligibility R2 of the external spatial system of “1946” Creative Industrial Park is 0.721, which is greater than 0.7, indicating a high overall intelligibility of the park’s spatial nodes, and it is very easy to grasp the distribution of the overall external spatial nodes of the park through the local spatial nodes. After the research, it was found that the park has a relatively small number of external spatial nodes, which are also distributed more clearly. People can easily identify and judge the position of each spatial node when they are moving around, and they have a high degree of intelligibility of the park’s external spatial nodes.
The convex intelligibility R2 of the external space system of “3526” Creative Factory is 0.361, which is less than 0.5, indicating that the overall intelligibility of the space nodes in the external space system of the park is limited, and it is difficult to judge and grasp the distribution of the overall external space nodes of the park through the local space nodes. After the research, we found that there are a high number of external spatial nodes within the park. Aside from the spatial nodes divided into roads, the other plazas, greening and other functional spatial nodes in the park are relatively dispersed, and their locations are relatively remote and hidden. These nodes are infrequently used or recognized, thereby complicating the process for individuals to accurately locate and understand the park’s comprehensive external spatial node arrangement. The R² value of convex intelligibility in the external space system of Cotton Three Creative Block is 0.268 (<0.5), indicating that the overall intelligibility of the space nodes in the external space system of the park is relatively low, and it is difficult to grasp and judge the distribution of the overall external space nodes of the park in a complete way. Subsequent research and analysis indicate that the park encompasses a considerable area with numerous spatial nodes. While the location of key spatial nodes in the park can be identified and judged with relative clarity, the identification and cognition of the park’s entire external spatial node structure is considerably more challenging, reflecting a lower degree of intelligibility.
The R2 value of convex intelligibility in the external space system of C92 Creative Cluster is 0.515, with a value between 0.5 and 0.7, indicating that the overall intelligibility of the space nodes in the external space system of the park is more general, and it is relatively easy to judge and grasp the distribution of the external space nodes of the park. After the research, we found that the park contains a limited number of external space nodes, except for very few space nodes with a low degree of use with locations that are relatively remote and hidden, visitors can basically clearly identify and judge the location of the distribution of each space node in the park, and the degree of intelligibility of the park’s external space nodes is relatively high.

3.2. Axis Analysis

3.2.1. Analysis of Axial Mean Depth Values

In referencing Figure 14 and Table 4, the “1946” Creative Industrial Park ‘s road system has a maximum mean depth of 2.50, a minimum of 1.25 and an average of 1.83. Generally, the mean depth of the axes is relatively low, with only a single axis marked in dark red color, suggesting high convenience across the park’s roads, ease of use of external spaces and a less complex road system.
In the ‘3526’ Creative Factory, the maximum mean depth of the internal road system is 2.94, with a minimum of 1.68 and an average of 2.27. There are fewer axes with warmer colors, and there are only two roads with darker red, so the mean depth of the axes is relatively low, which indicates that the convenience of people moving around in the external space of the park is relatively good.
For the Cotton 3 Creative Block, the road system’s maximum mean depth reaches 4.18, with a minimum of 2.29 and an average of 3.18. Approximately half of the axes are in warm colors, reflecting a higher average depth. This indicates the limited convenience in the external space of the park, but the spatial level of the park’s road system is relatively rich.
The maximum value of the mean depth of the road system of C92 Creative Cluster is 2.22, the minimum is 1.33, and the average is 1.82. Although the axes with warmer colors account for about half of the roads, the convenience degree of the park’s road system is relatively good due to the lower value of the mean depth of the axes.

3.2.2. Analysis of the Degree of Axial Integration

According to Figure 15 and Table 5, the internal road system of “1946” Creative Industrial Park is mainly divided into nine axes, each of which represents a distinct road. The maximum value of the global integration degree of the axes is 4.43, the minimum value is 0.73, and the average value is 1.69. Notably, only one axis is marked in dark red, indicating a relatively minor role in crowd attraction and distribution within the overall road system.
The internal road system of “3526” Creative Factory is mainly divided into 20 axes. The maximum value of the global integration degree of the road system is 2.96, the minimum value is 1.04, and the average value is 1.73. Approximately one-third of these axes are in warmer colors, suggesting a stronger overall openness and integration of the road system in this park.
The road system within the Cotton 3 Creative Block is mainly divided into 45 axes, with each axis representing a road. The maximum value of the global integration degree of the park’s road system is 2.36, the minimum value is 0.96, and the average value is 1.46. A smaller proportion, about one quarter, of these axes are in warm colors, predominantly featuring darker blue hues. This pattern suggests a comparatively weaker openness and integration in the road system, correlating with a lower capacity for attracting and congregating crowds.
The C92 Creative Cluster’s internal road system consists of 10 axes. Its global integration degree ranges from 3.66 at the highest to 1 at the lowest, with an average value of 1.83. Among these, only two axes are characterized by warm colors, while the rest predominantly exhibit cool colors. This variance indicates a diverse level of openness and integration within the road system, rendering it average in terms of overall integration and crowd attraction capacity.

3.2.3. Axis Intelligibility Analysis

According to Figure 16, the global intelligibility R2 of the “1946” Creative Industry Park in the park road system is 0.856 (>0.7). This indicates a high level of overall comprehensibility within the park’s road system, enabling individuals to easily predict and perceive the entire network, thus reducing the likelihood of disorientation. Interviews conducted as part of this research revealed that park visitors possess a clear understanding of the road locations within the system. Even visitors with only one or two prior visits noted the simplicity and clarity of the park’s road structure.
The R2 value of global intelligibility in the road system of the “3526” Creative Factory is 0.927 (>0.7), which is a very high level, indicating that the overall intelligibility of the road system in the park is very high. After the research, we found that people in the park do not understand the whole road system as clearly as the value shows, because although the overall structure of the park’s road system is relatively clear, the large number of roads, along with the limited usage of more remote and obscured routes, a lack of diversity in businesses and an imperfect signage system, people’s awareness of the distribution of the park’s road system is rather general and not so clear. It is recommended to enrich the types of businesses in the remote and hidden road spaces, increase the degree of their use, and improve the signage system of the whole park in a subsequent reconstruction.
The global intelligibility R2 value of the road system of the Cotton Three Creative Block is 0.557, with a value in the range of 0.5–0.7, which belongs to a relatively general level. It shows that the degree of understanding of the overall road system in the park is relatively general. After the research, it was found that the park has a large area and a rich road network, so it is relatively difficult for people to understand the overall road system of the park and it is not so clear, while the location and distribution of the local road spaces are relatively better understood. It is recommended to increase the facilities with guiding roles in the road system, such as signage and park plans, to improve the orientation of the overall road system of the park and help visitors to strengthen their understanding of the park’s entire road layout.
The R2 value of global intelligibility of the road system of the C92 Creative Cluster is 0.985 (>0.7), which is indicative of a very high level of intelligibility. After the research, we found an exceptionally clear and straightforward structure of the park’s road system, characterized by a limited number of roads. The research indicates that visitors have a strong ability to grasp and identify both the overall and local road spaces within the park. For future enhancements, it is recommended to upgrade the public service facilities throughout the road system and organize more cultural activities to enrich the overall industrial cultural ambiance of the park.

3.3. Visual Graph Analysis

3.3.1. Mean Depth of Visual Graph Analysis

Figure 17 and Table 6 present the data on the mean depth of the external space interface in the “1946” Creative Industrial Park. The maximum value recorded is 5.21, with a minimum of 1.68 and an average of 2.22. Approximately two-thirds of the overall area is represented by dark blue, and the yellow area with poor accessibility accounts for a very small proportion. This indicates that the park’s external space offers very good overall visual accessibility.
In the “3526” Creative Industrial Park, the mean depth of the external space interface reaches a maximum of 4.15, a minimum of 1.89, and the average value is 2.64. The dark-blue-colored areas account for about half of the overall area, and the proportion of red-orange-colored areas with poor accessibility is very small, which indicates that the overall accessibility to the external space of the park is relatively good. This indicates that the park’s external space is relatively accessible overall.
For the Cotton 3 Creative Block, the maximum mean depth of the visual field of the external space interface is 3.87, with the minimum of 1.88 and an average of 2.61. The area with dark blue color accounts for about one-third of the overall area, and the area with reddish-orange color, which has poor accessibility, accounts for a very small proportion. This indicates that the park’s external space maintains relatively good overall visual accessibility.
In the C92 Creative Cluster, the maximum mean depth of the visual field of the external space interface is 3.86, with a minimum of 1.73 and an average of 2.38. The areas with a darker blue color account for about one-third of the overall area, which are mainly concentrated in the middle area. The proportion of warm-colored areas is very small, indicating that the overall visual accessibility of the external space area of the park is relatively general and unevenly distributed.

3.3.2. Integration of Visual Graph Analysis

According to Figure 18 and Table 7, the maximum value of the global integration degree of the external space interface of “1946” Creative Industrial Park is 14.02, the minimum value is 2.28, and the average value is 8.53. Overall, the proportion of reddish-orange areas and dark blue areas is minimal, showing an “olive shape” with fewer at both ends and more in the middle. The distribution of “olive-shaped” shapes indicates that the overall convergence effect of the line of sight in the park’s external space area is relatively general, and there are relatively few spaces with an excellent or poor line of sight convergence effect.
The maximum value of the global integration degree of the external space of “3526” Creative Factory is 11.18, the minimum value is 3.18, and the average value is 6.48, and the proportion of reddish-orange and dark-blue areas is comparatively minimal, which shows an olive-shaped distribution with more areas in the middle. This indicates that the overall convergence of sight lines in the external space area of the park is relatively general, and the distribution of sight areas is relatively balanced.
The maximum value of the global integration degree of the external space area of Cotton 3 Creative Block is 12.56, the minimum value is 3.85, and the average value is 7.28. Overall, the warm-colored area accounts for about one-third of the total area. The dark-red-colored areas are notably scarce, while the dark-blue-colored areas are more prevalent. This distribution indicates a general convergence effect of sight lines in the external space area of the park. The arrangement of sight lines is relatively balanced, with some areas exhibiting a high degree of sight line integration, although these areas are small, and there are comparatively more areas with limited visibility.
The maximum value of the global integration degree of the external space of C92 Creative Cluster is 13.13, the minimum value is 3.35, and the average value is 7.57. The overall distribution demonstrates a lower proportion of reddish-orange and dark blue areas, resulting in an olive-shaped pattern with fewer areas at the extremities and a higher concentration in the middle. This pattern suggests that the park’s external space is notably effective in converging lines of sight. The sightline convergence ability is relatively strong, providing a more balanced visual experience. While there are some dead-end spaces, they are relatively limited in number.

3.3.3. Intelligibility of Visual Graph Analysis

According to Figure 19, the intelligibility of the global visual field of the external spatial system of “1946” Creative Industrial Park is 0.781, which is higher than 0.7. This indicates a high level of sightline intelligibility within the park’s external spatial interface, facilitating ease in comprehending the park’s overall external spatial interface through the local spatial interface within the line of sight. Subsequent research reveals that the park’s external space is limited in area, with a spatial structure that is clear and relatively simple. This enables individuals to clearly identify and assess both the local and overall external spatial interfaces while navigating the park, resulting in a high degree of understanding of the park’s external spatial interface.
The R2 value of the global visual field intelligibility of the external space system of “3526” Creative Factory is 0.460, which ranges from 0 to 0.5, indicating that the visual line of sight in the external space area of “3526” Creative Factory is relatively limited, and it is not easy to grasp the park as a whole through visual lines of sight. After the research, we found that when people are at a certain point in the external space of the park, it is difficult to judge the shape of the surrounding space area according to what they see in line of sight, and the degree of intelligibility of the overall external space area of the park is even lower. It is recommended to strengthen the identifiability of the overall external space area of the park by offering a graphic guide map and cultural landscape facilities to assist visitors in improving their understanding of the entire external space area of the park.
The R2 value of global visual field intelligibility of the external space system of Cotton Three Creative Block is 0.776 (>0.7), indicating that the intelligibility of the park’s external space area’s line of sight is high, and it is relatively easy for people to grasp the park’s overall external space through the local space within the line of sight. After the research, it was found that although the overall external space of the park has a large area, the hierarchy and wholeness of the space is very strong. People can clearly judge the position of different space areas when they are moving in the external space of the park, and their understanding of the overall external space of the park is relatively high. It is recommended that various activities and exhibitions showing industrial civilization, creative industry culture and Tianjin’s regional characteristics should be held regularly in the external space of the park in a subsequent renovation, so as to enhance the industrial cultural atmosphere and historical value of the park.
The R2 value of global visual intelligibility in the external space system of C92 Creative Cluster is 0.820 (>0.7), which indicates that the intelligibility of the park’s external spatial region’s sight is very high, and it is relatively easy to infer the overall spatial pattern of the park through the local spatial pattern. After the research, it was found that the layout of the park’s external space area is very clear and has a strong integrity. When visitors are at any point in the external space of the park, they can readily discern the shape of the surrounding area within their line of sight, thereby gaining a comprehensive understanding of the park’s external spatial configuration. The perception and comprehension of the entire external space areas are notably clear among park visitors. The quality and vitality of the external space area of the park can be further improved in a subsequent renovation.

4. Discussion

4.1. The Result of Syntactic Quantification and the Reason for That Result

The external spaces of the four parks were quantitatively evaluated using the convex segmentation, axial segmentation and visual field segmentation of the spatial syntax, and the mean values of each of these variables were selected for comparative analysis in order to further explore the differences between the four parks.

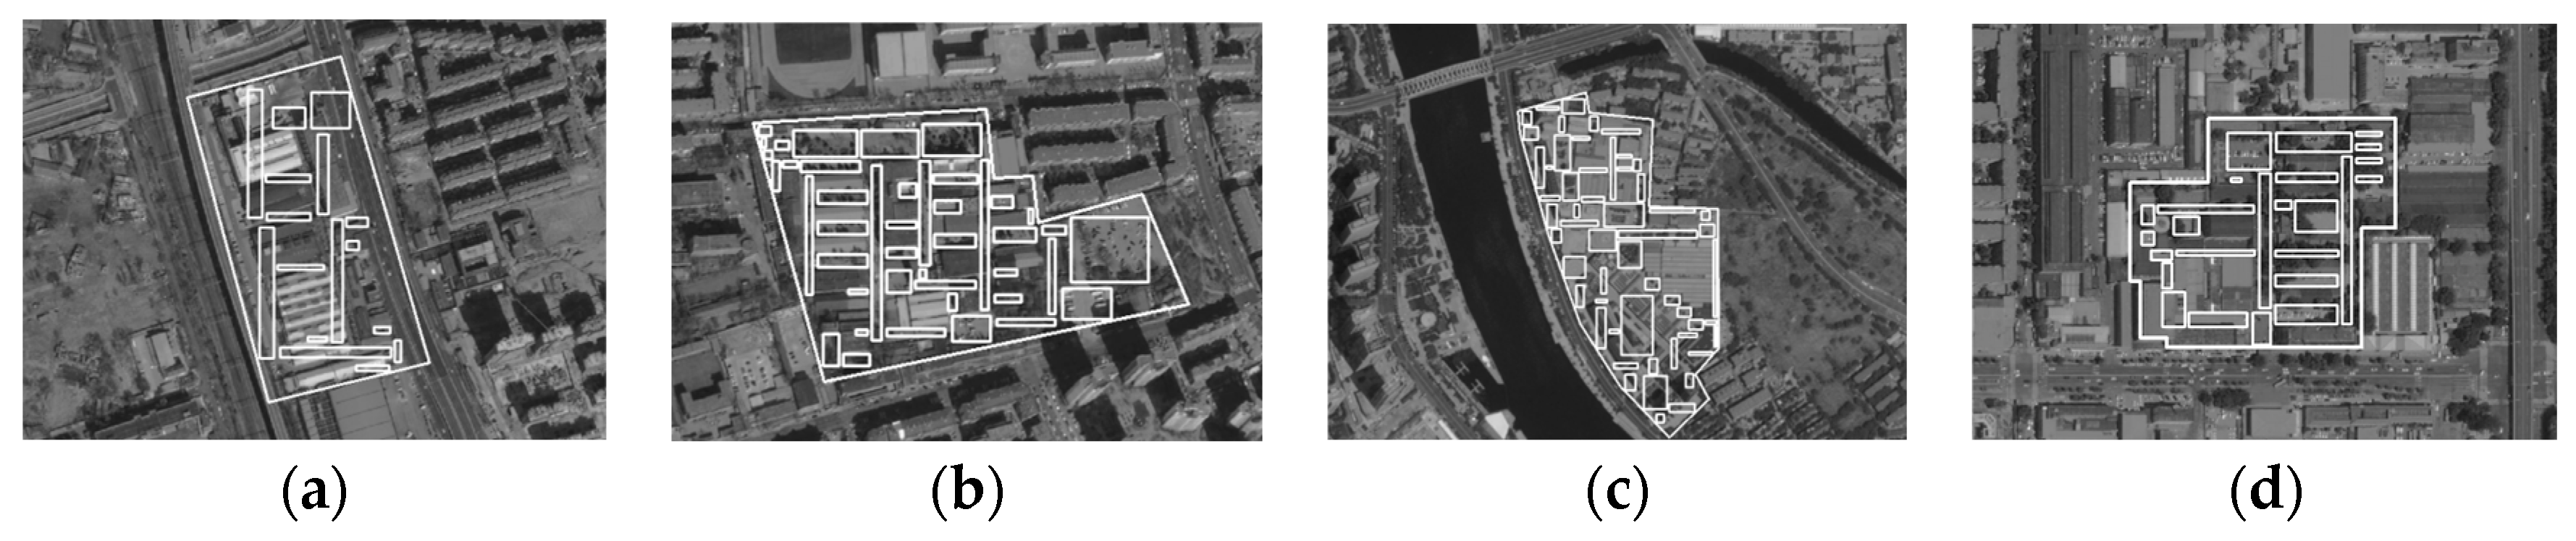
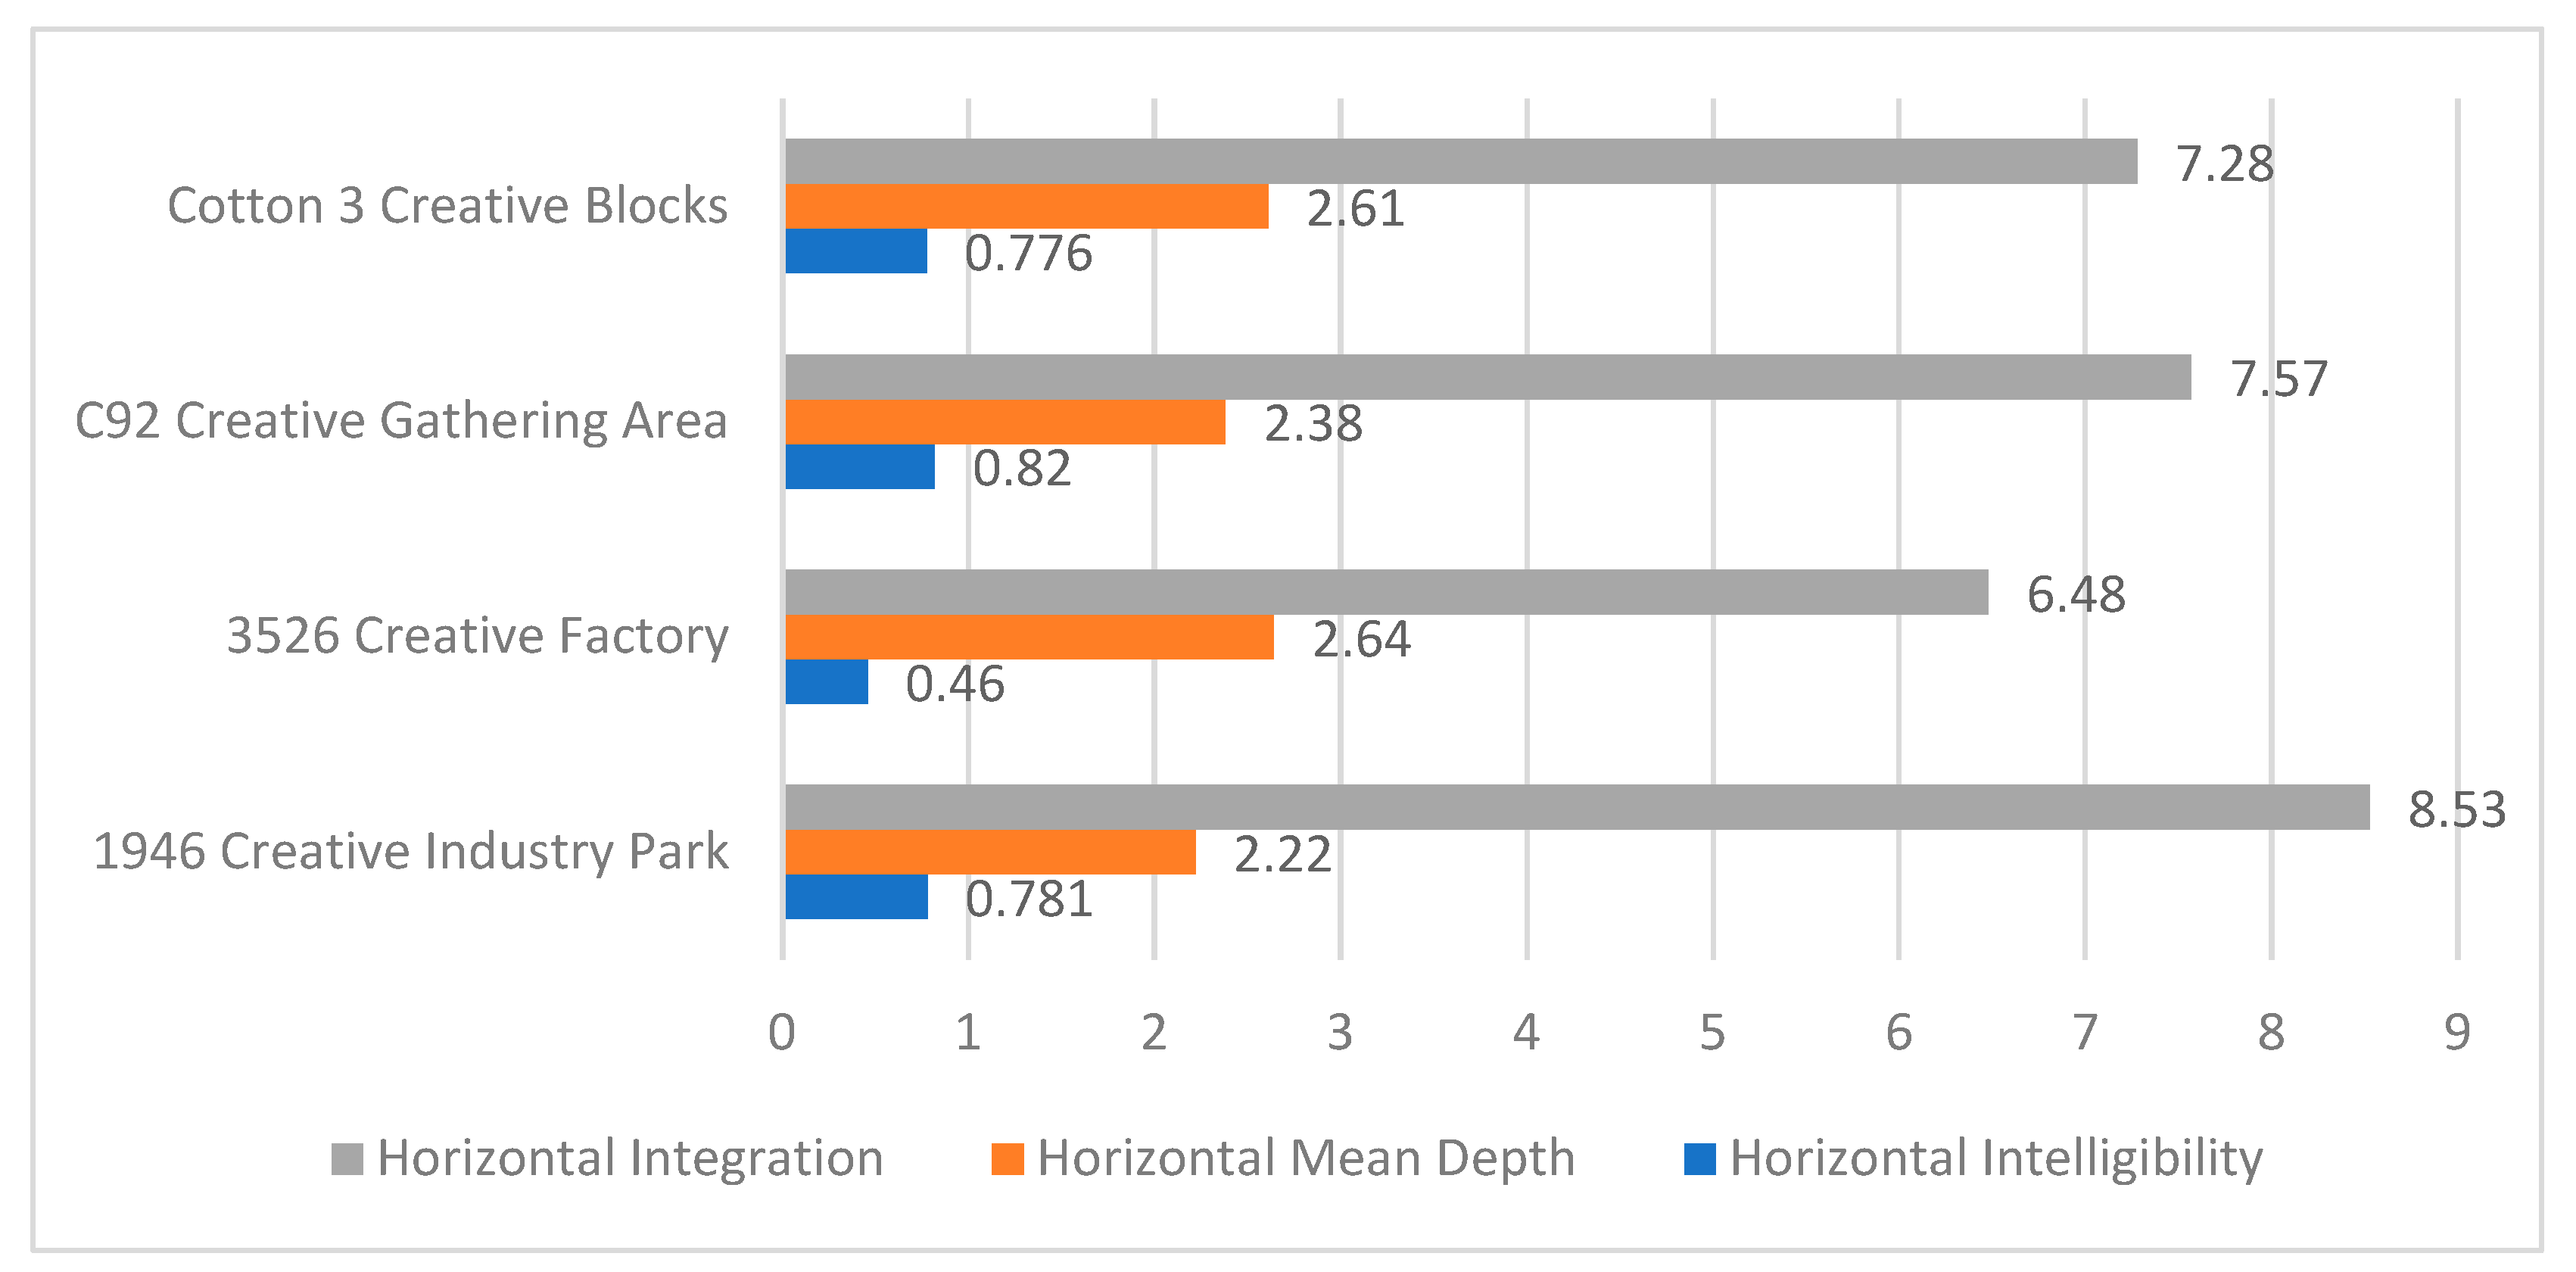
4.1.1. Results and Causes of Convexity Analysis

The results of the convex analysis primarily encompass global integration, mean depth and intelligibility as key parameter variables. The quantitative outcomes for each park were selected for comparative analysis, with a focus on elucidating the underlying reasons for the observed comparative results.
As depicted in Figure 20, a comparative analysis of the average values of the convex integration degrees for the external spatial nodes of the four parks was conducted. The data reveal relatively minor differences in values among the parks. The C92 Creative Cluster exhibits the highest value, suggesting that its external space nodes possess the greatest overall openness and integrality, thereby making it most conducive to attracting and gathering crowds. The “3526” Creative Factory and the “1946” Creative Industrial Park rank second-lowest in terms of these values, while the Cotton 3 Creative Block has the lowest value, indicating a comparatively weaker capacity of its external space nodes to attract and gather crowds. It is observed that the Cotton 3 Creative District’s limited industry variety, inadequate supporting facilities, and somewhat remote location contribute to its poor openness and integration, resulting in a reduced ability to attract and gather crowds.
The syntactic quantification results for the four parks show that the average value of the convex mean depth is generally low, with only minor differences observed between the parks. The Cotton 3 Creative Block exhibits the highest value, suggesting that its external spatial nodes are relatively diverse but less accessible. The “3526” Creative Factory and the C92 Creative Cluster follow, demonstrating average levels of diversity and accessibility in their external space nodes. Conversely, the “1946” Creative Industrial Park has the lowest value, indicative of relatively simple external space nodes with higher accessibility. Research findings reveal that the mean depth values of each park are significant, and the locations of these nodes are often remote and concealed, necessitating traversal through multiple spatial nodes to reach them. Lower spatial nodes, such as the entrance plaza, central plaza, pedestrian landscape street and internal car park, are situated centrally within the park and are directly connected to more spatial nodes, hence offering greater convenience.
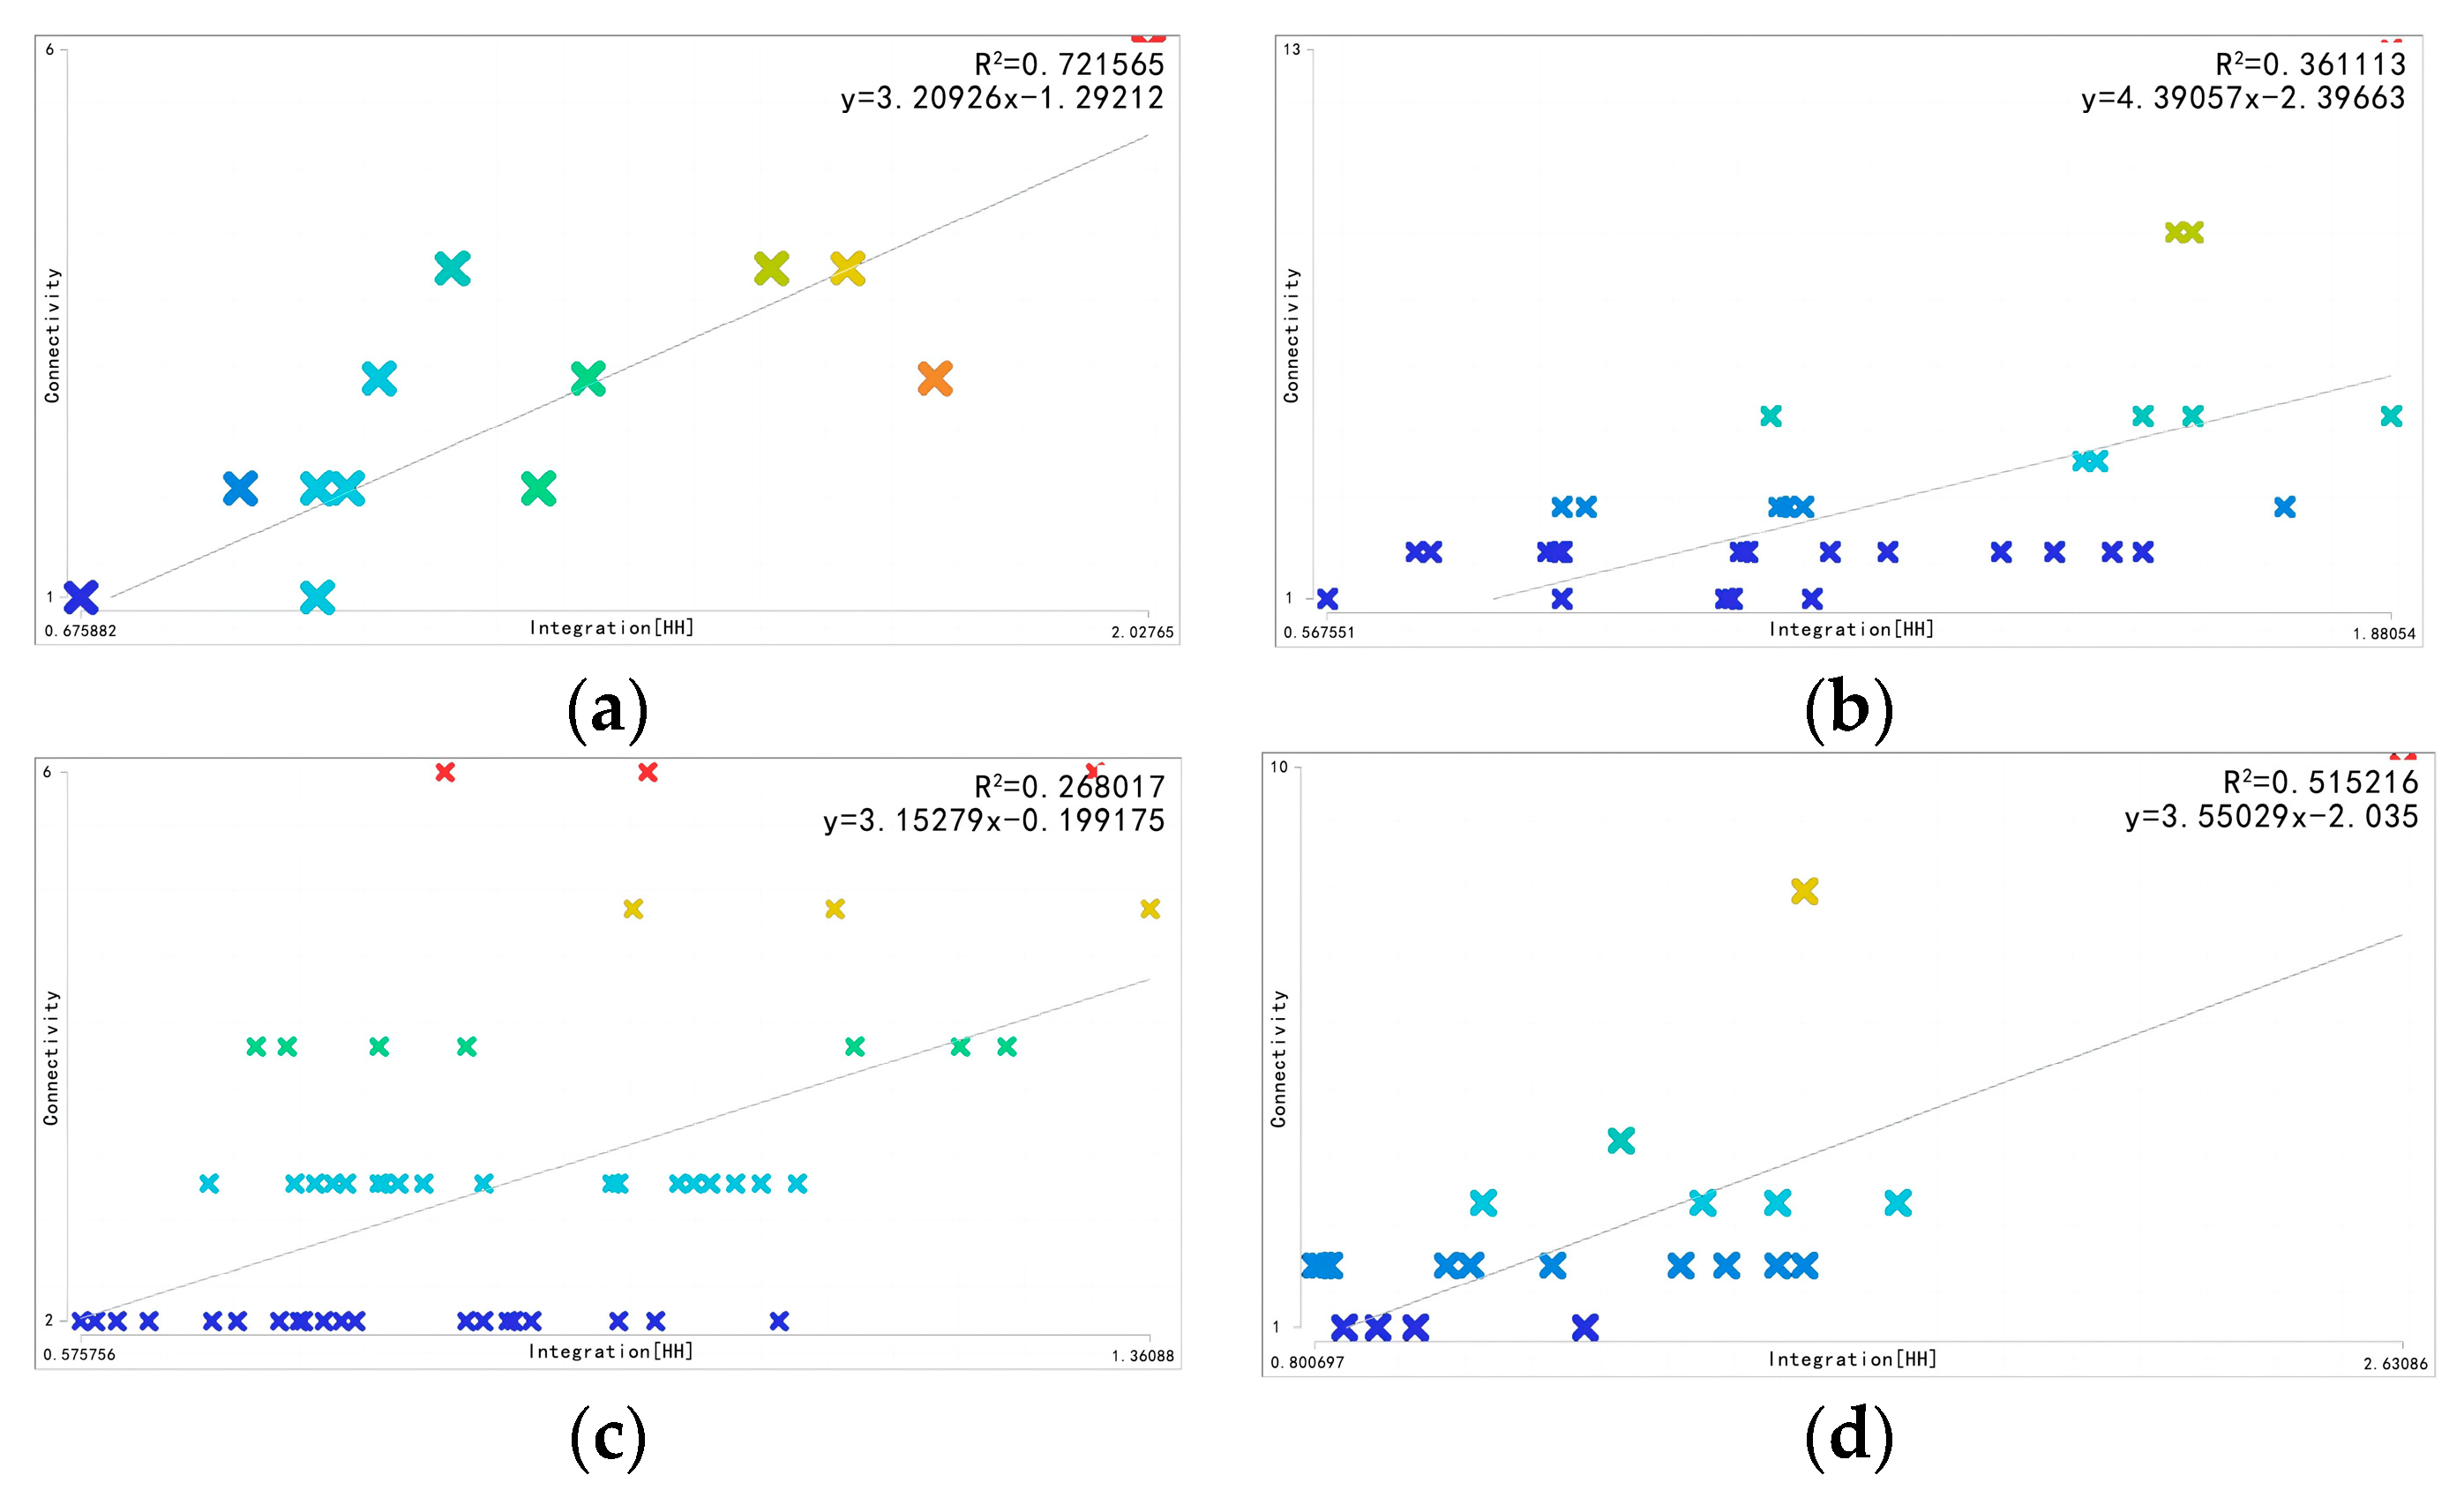
The comparative analysis of the convex intelligibility across the four parks revealed significant differences in their values. Specifically, the “1946” Creative Industrial Park’s value falls within the range that indicates that its external spatial nodes are extremely easy to understand (greater than 0.7). In contrast, the C92 Creative Cluster’s value lies in the range denoting easier understanding (0.5–0.7). The values for both the “3526” Creative Factory and the Cotton 3 Creative Block are categorized in the range indicating that it is more challenging for people to comprehend (less than 0.5), with the Cotton 3 Creative Block registering the lowest value among them. This suggests that the external spatial nodes of the “1946” Creative Industrial Park are very clearly understood by people, who can accurately identify and judge the location of each spatial node while navigating the park. The C92 Creative Cluster ranks second in terms of clarity, with a relatively high level of understanding of its external spatial node distribution. Conversely, the “3526” Creative Factory and the Cotton 3 Creative Block have the lowest values, indicating that their external spatial nodes are not easily identifiable or recognized by people. Further research and analysis revealed that the Cotton 3 Creative Block has a vast external space, divided into numerous spatial nodes. People are able only to clearly identify and judge the location of more significant space nodes within the park, but the overall understanding and cognitive recognition of the park’s external spatial nodes are relatively low.

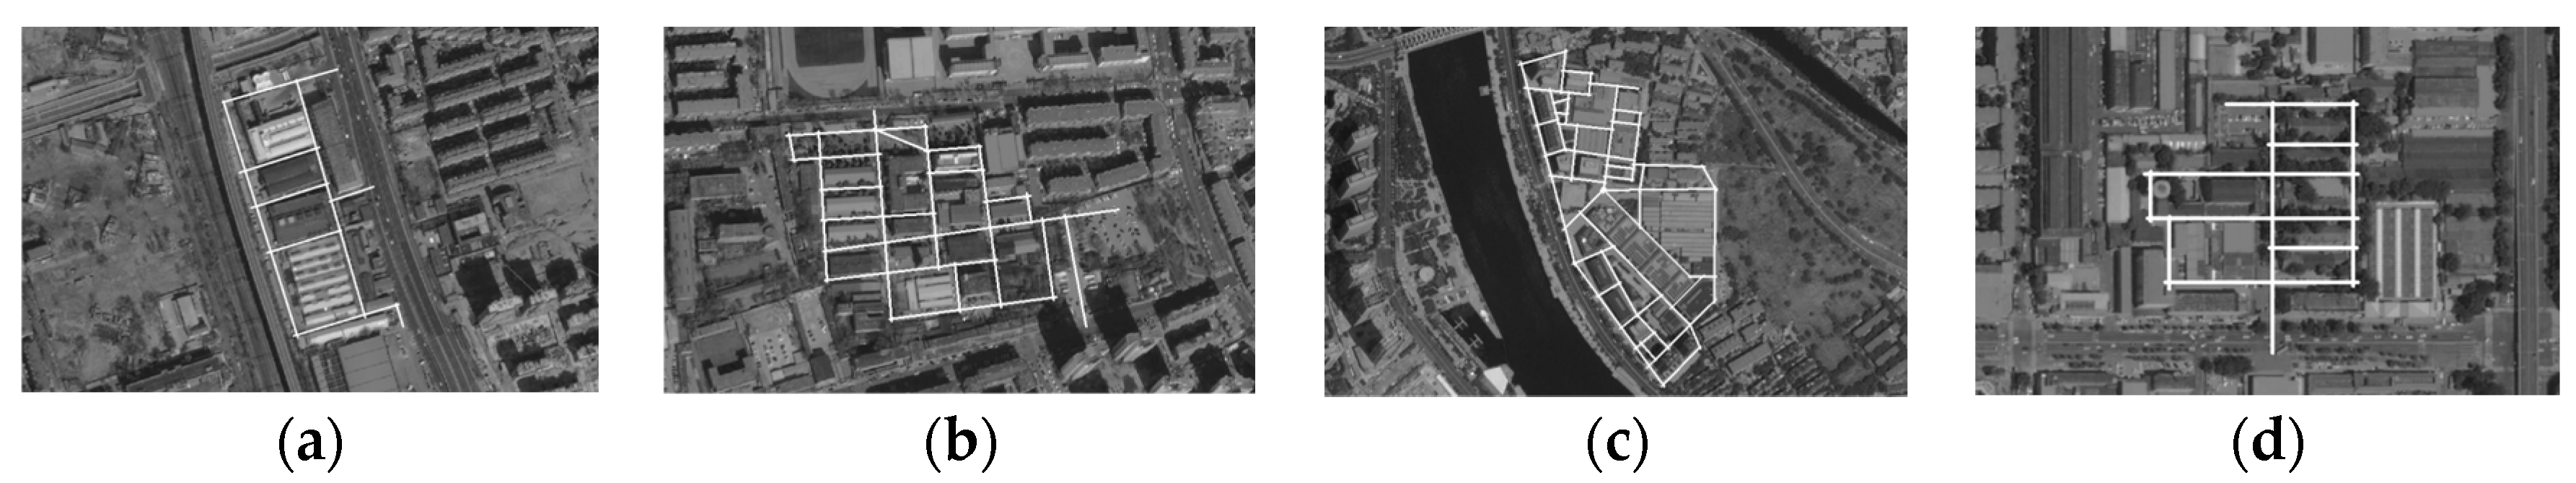
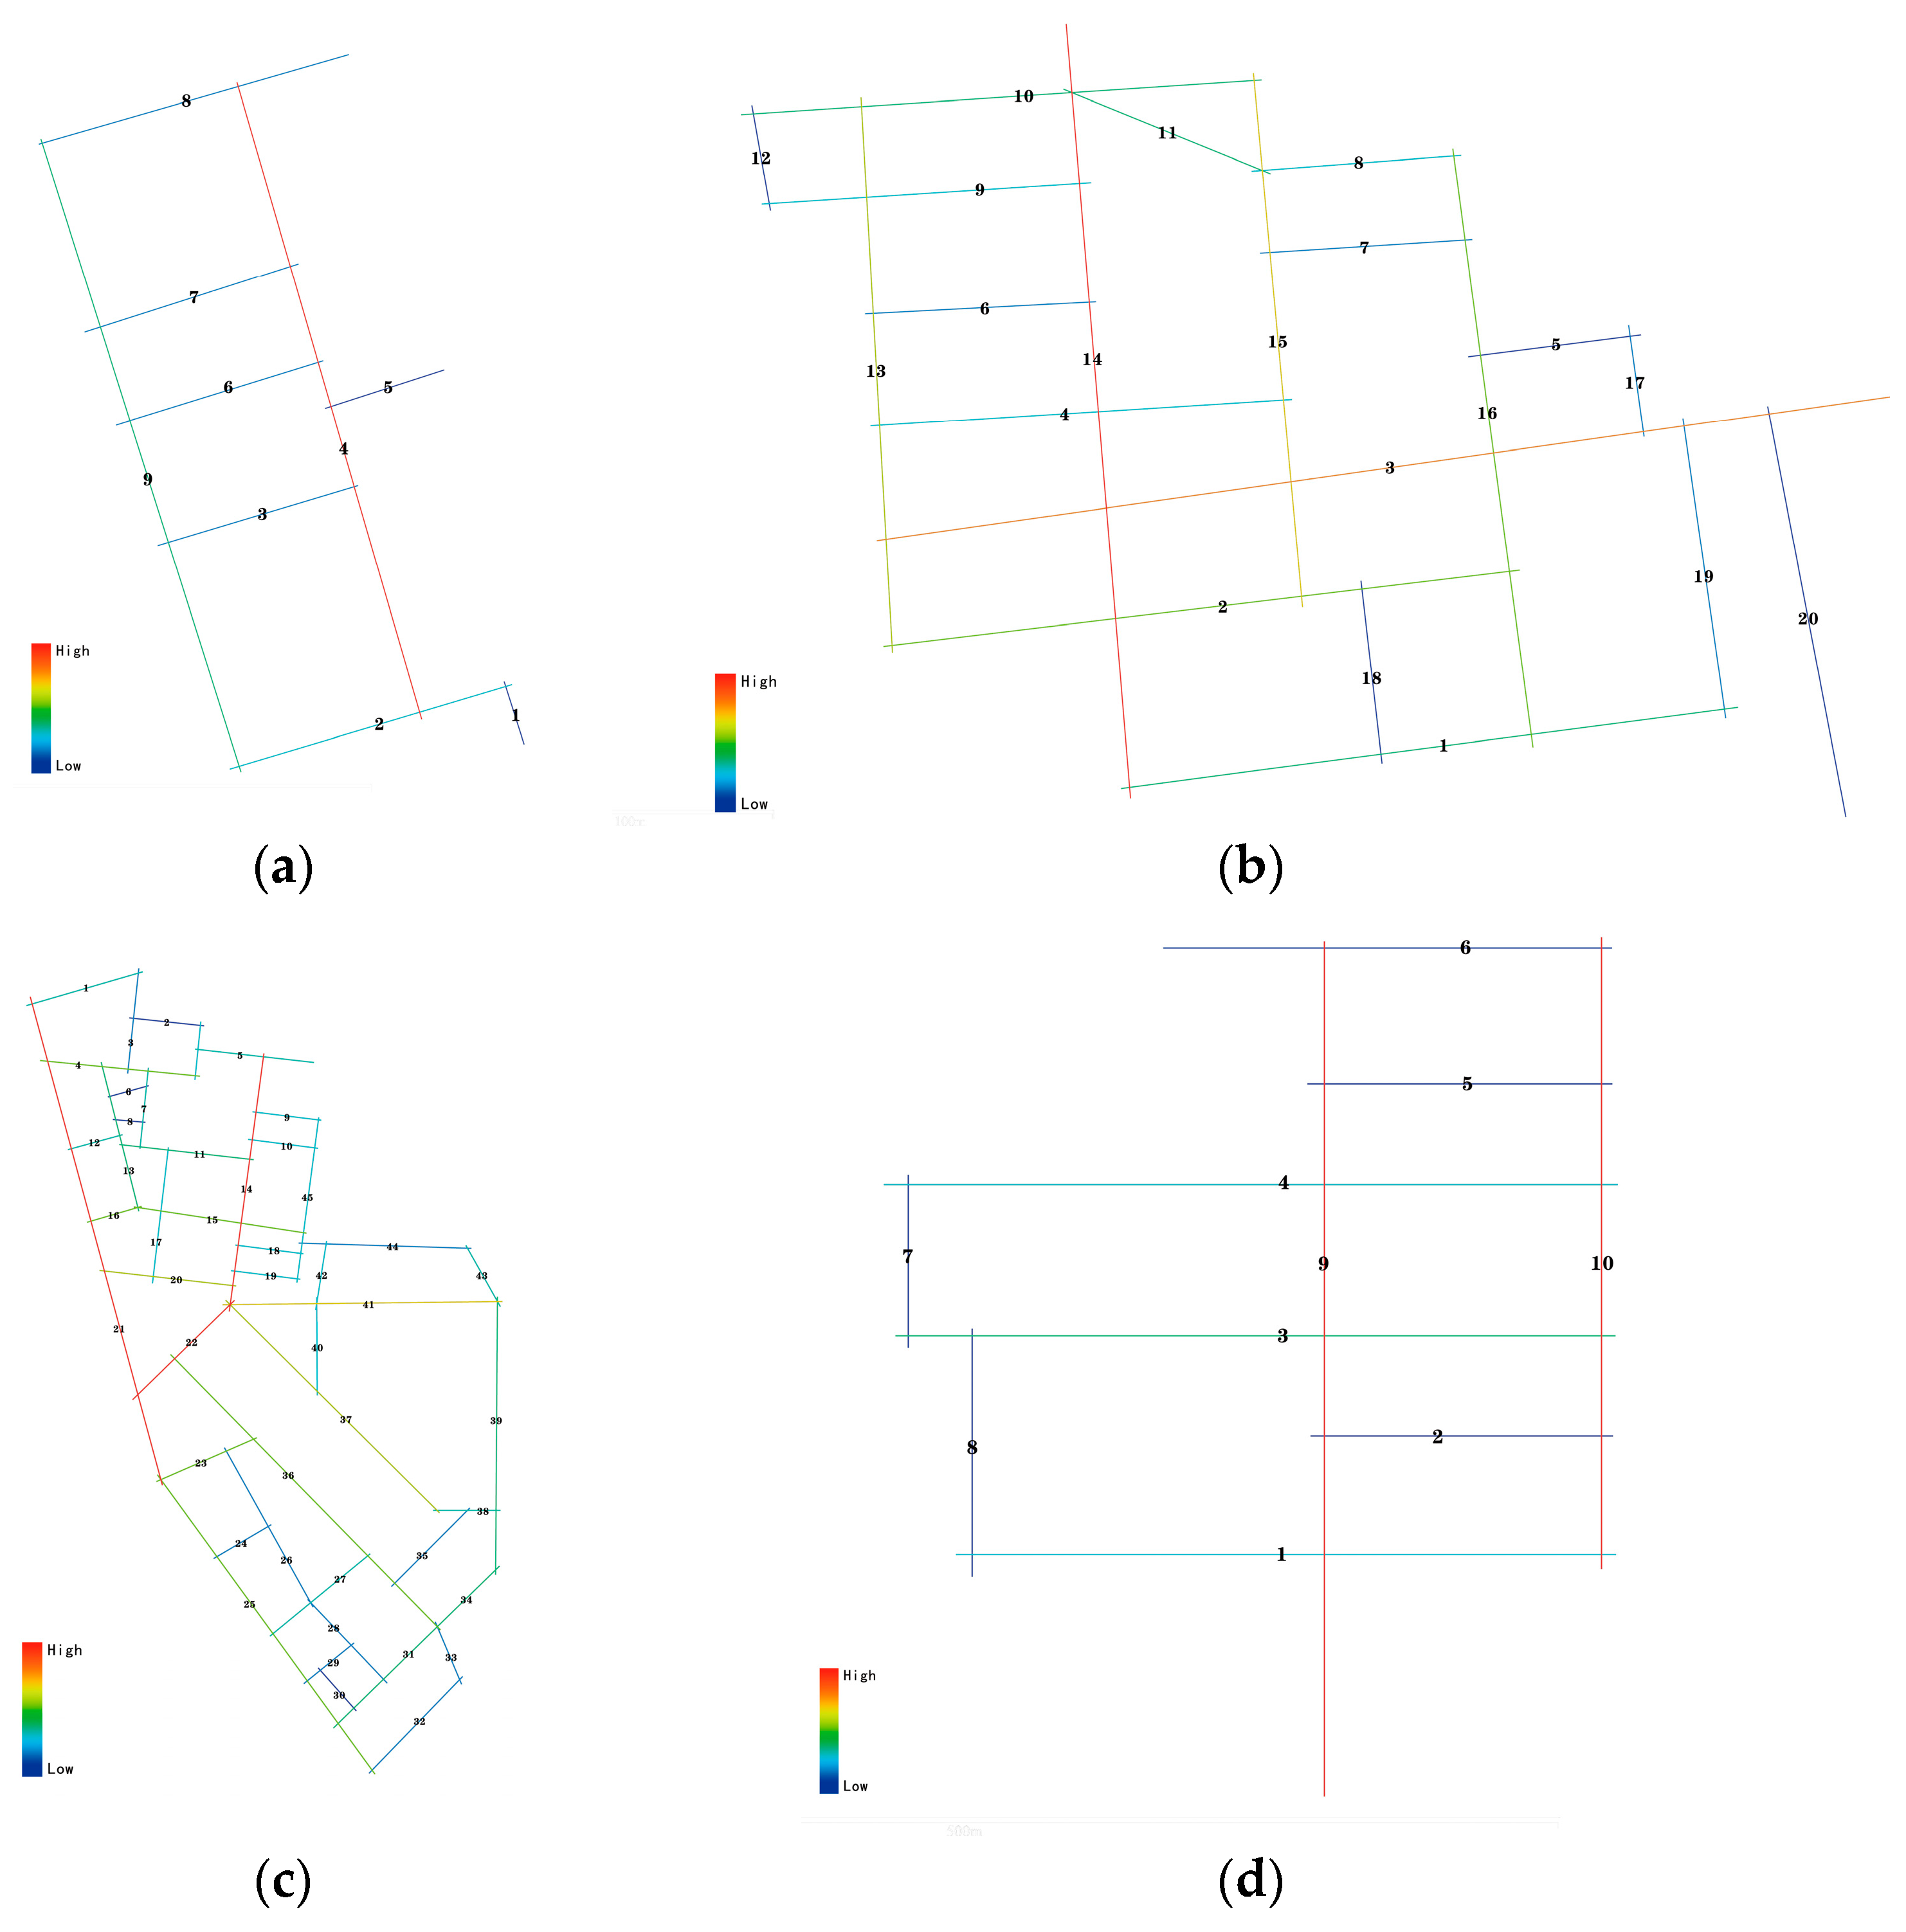
4.1.2. Results and Causes of Axial Analysis

The axial analysis results primarily encompass key parameters such as global integration, mean depth and intelligibility. The quantitative outcomes for each park were selected for a comparative analysis, with the objective to elucidate the reasons behind the observed comparative results.
As illustrated in Figure 21, the comparative analysis of the average global integration values of the road system axes in the four zones revealed generally low values across the board, with minimal significant differences. Among these zones, the C92 Creative Cluster exhibits the highest value, suggesting that its road system has the highest level of openness and integration among the four parks. The “3526” Creative Factory and the “1946” Creative Industrial Park follow, both demonstrating relatively average levels. The Cotton 3 Creative Block has the lowest value, implying that its road system is less effective in attracting and gathering crowds. Further research indicates that roads in the Cotton 3 Creative Block with lower axial integration values are relatively remote and concealed within the overall road system. This contributes to the difficulty for people in accessing and congregating in these areas. Additionally, there is a noticeable lack of supporting facilities such as commercial and cultural amenities, and the variety of business types is relatively limited.
The syntactic quantification results for the four parks show only minor variations in the mean value of the mean depth of their axes. Among these, the Cotton 3 Creative Block registers the highest value, suggesting a more complex road system compared to the other three parks, albeit with relatively limited convenience. The “3526” Creative Factory follows closely, with its road system’s level and convenience being moderately rated. The differences between the C92 Creative Cluster and the “1946” Creative Industrial Park are minimal, both displaying lower values. This indicates that their road systems are relatively simpler, and the roads are generally less sophisticated. Subsequent research revealed that roads with a lower degree of axial mean depth typically have fewer types of businesses and landscape structures along them, hindering their ability to attract pedestrian traffic. Additionally, in spaces with highly permeable roads, the clarity of signage systems is inadequate, and there is a notable absence of directional facilities such as signboards and park plans. This deficiency hampers people’s ability to quickly identify directions and destinations while navigating the park. Furthermore, the industry types in these spaces are relatively homogenous, lacking diversity in business, culture and entertainment sectors, thereby failing to provide comprehensive services for people traversing the park.
The comparative analysis of the intelligibility of the axes in the four parks reveals notable differences in their values. The C92 Creative Cluster stands out with the highest value, approaching 1, suggesting an extremely high level of road system intelligibility. This is followed by the “3526” Creative Factory and the “1946” Creative Industrial Park, both of which also register values within the range indicative of a very clear understanding of the park’s road system (greater than 0.7). This implies that the C92 Creative Cluster’s road system is the most intelligible among the four parks, and the road systems of the “3526” Creative Factory and “1946” Creative Industrial Park are also well understood by people. In contrast, the Cotton 3 Creative Block has the lowest value, significantly lower than the other parks, falling within the range indicating that it is relatively easy to understand by people (0.5–0.7). This indicates that the recognition and understanding of its road system by the public are comparatively moderate. Subsequent research indicated that due to the large area and complex road network of the Cotton 3 Creative Block, it is relatively challenging for people to grasp the overall road system of the park, resulting in a less clear understanding.

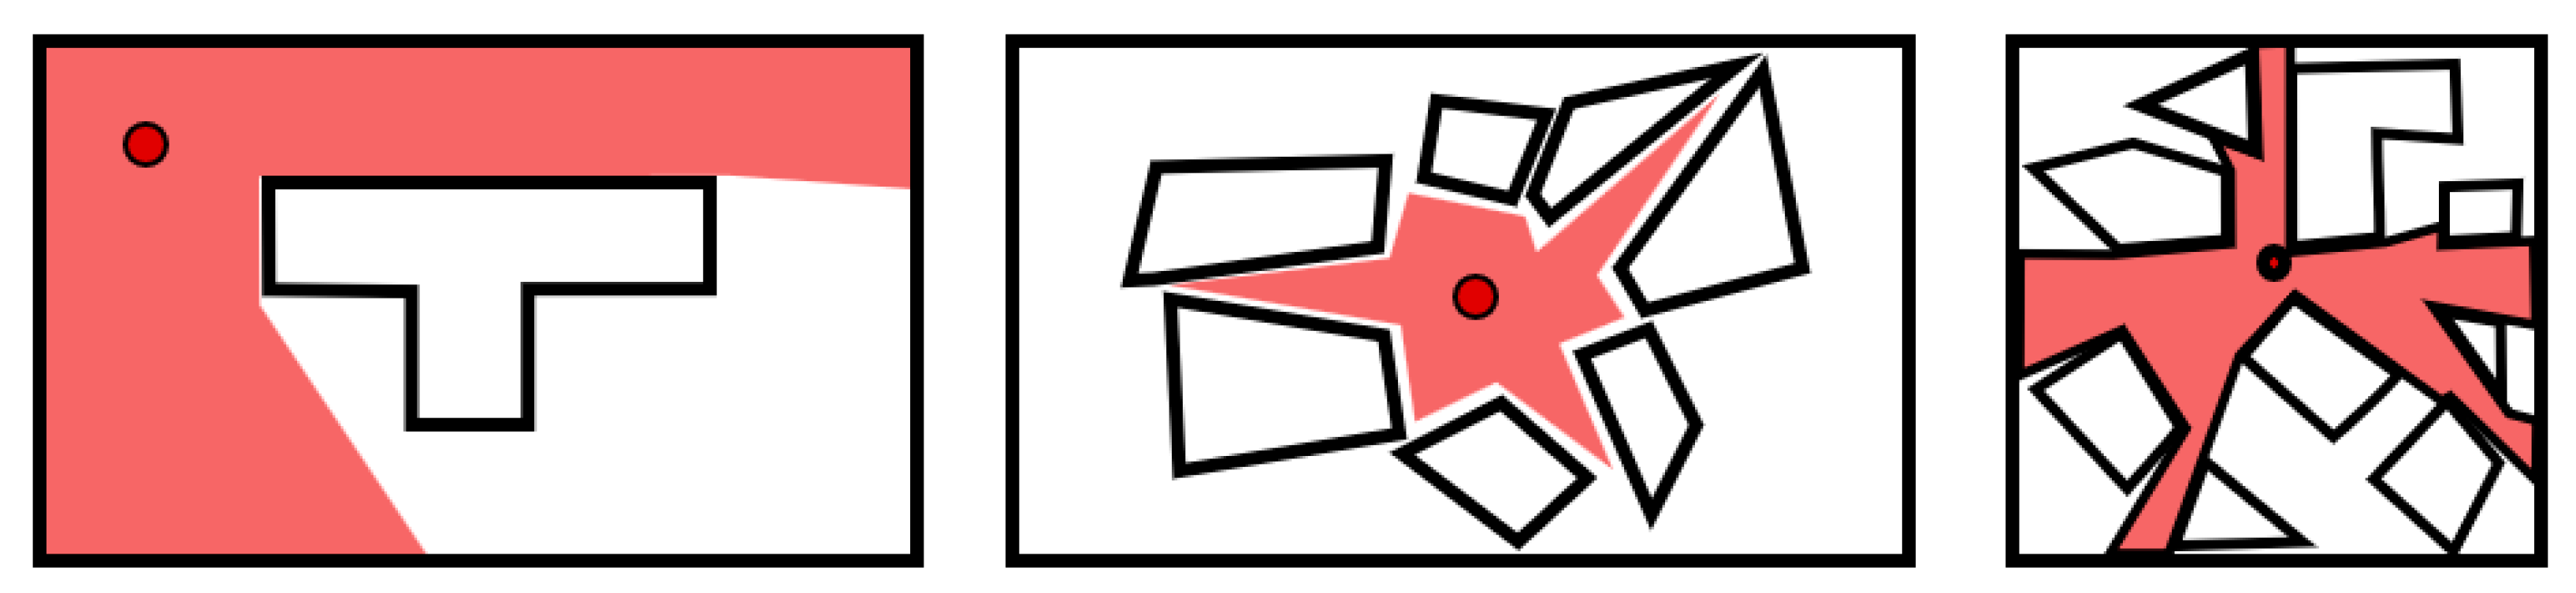
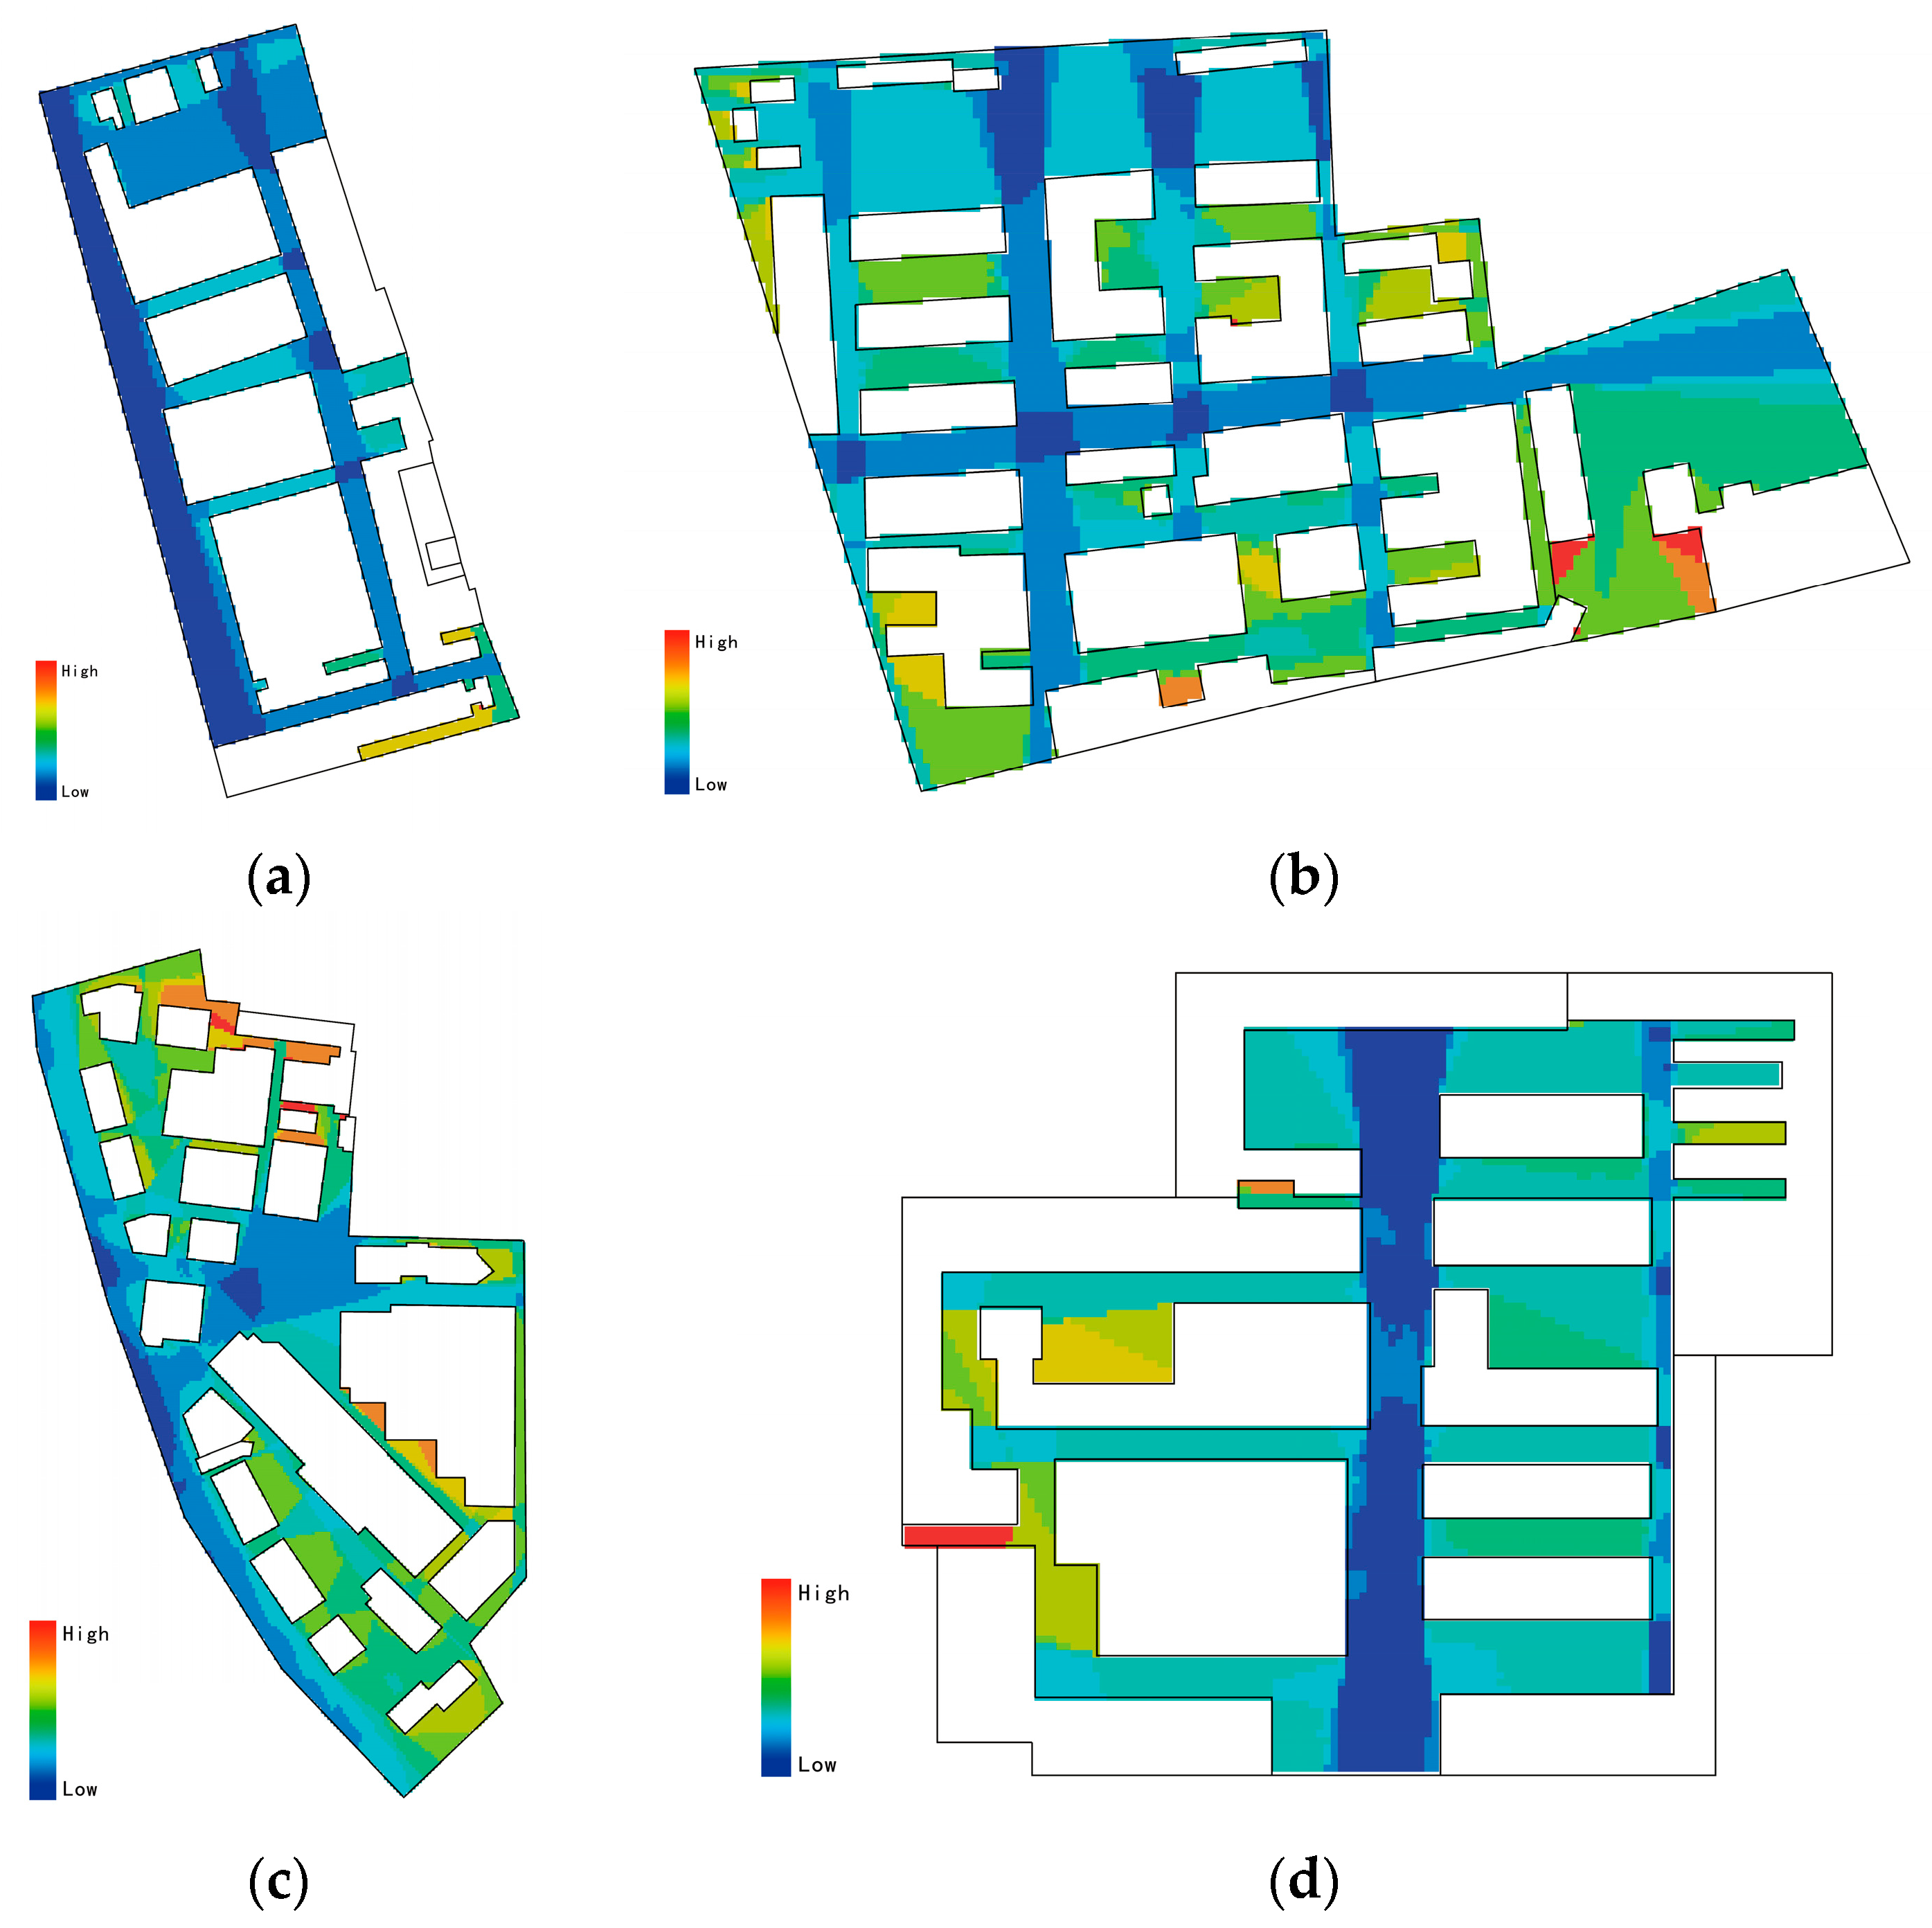
4.1.3. Results and Causes of Visual Graph Analysis

The visual domain analysis results encompass key parameter variables, including global integration, mean depth and intelligibility. The quantitative data from each park were subjected to a comparative analysis, with a focus on understanding the underlying reasons for the observed differences.
Figure 22 illustrates a comparison and analysis of the average values of visual domain integration, as derived from the syntactic quantification of the external spatial interfaces of the four parks. The results indicate that the values across the parks are relatively high and show minimal variance. Notably, the “1946” Creative Industrial Park exhibits the highest value, indicating that its external space area possesses the strongest visual convergence ability among the four parks. This facilitates an efficient dispersion and guidance of crowds. The C92 Creative Cluster and the Cotton 3 Creative Block follow closely, with little difference between them and an overall average level of visual integration. In contrast, the “3526” Creative Factory registers the lowest value, suggesting a comparatively weaker capability in its external space to converge sightlines, which negatively impacts the direction and distribution of crowds. The research identified that in the “3526” Creative Factory, areas with cold colors have fewer landscape facilities, leading to poor spatial identifiability. This lack of distinct features makes these areas less accessible and results in a lower degree of visual integration.
The syntactic quantification of the average depth of the visual field in the four parks shows an overall lower mean value with relatively minor differences. Among these parks, the “3526” Creative Factory has the highest value, closely followed by the Cotton 3 Creative Block, with an almost negligible difference between them. This suggests that the overall accessibility of the external space areas in these two parks is comparatively limited, characterized by more enclosed areas and intricate spatial levels. The C92 Creative Cluster exhibits a lower value than these parks, indicating more moderate accessibility in its external space area. The “1946” Creative Industrial Park registers the smallest value, signifying the best overall visual accessibility of its external space area among the four parks, allowing people to more conveniently observe each area while moving around. Further research revealed that in the “3526” Creative Factory’s cold-colored area, there is a lack of color harmony in building facades, coupled with a scarcity of landscape facilities, which contributes to a lower mean depth value in this area.
Significant variations were observed in the visual intelligibility values across the four zones. The C92 Creative Cluster exhibited the highest value, approaching 1, which was closely followed by the “1946” Creative Industrial Park. The Cotton 3 Creative Block demonstrated a relatively lower value. However, all three of these values fall within the range indicative of a highly comprehensible external view interface (above 0.7). This suggests that the C92 Creative Cluster’s external view interface is the most intelligible among the four parks. Similarly, the interfaces of the “1946” Creative Industrial Park and the Cotton 3 Creative Block are also clearly understood. In contrast, the “3526” Creative Factory’s value falls within the range denoting difficulty in understanding the external visual interface of the park (below 0.5), markedly lower than those of the other three parks. This indicates a low level of recognition, mastery and understanding of the park’s external visual interface among observers. The study also revealed that the greenery and pavement comfort level in the car park area on the east side of the “3526” Creative Factory are comparatively low. The dark blue area, predominantly encompassing spaces encircled by buildings and smaller-scale street spaces, exhibits limited vision range and reduced visual permeability, contributing to its lower intelligibility value.

4.2. Summary of Problems and Suggestions for Optimization

By quantifying the external point, line and surface spatial morphology of the four parks using the three analytical methods, convex, axis and visual graph, we analyzed the problems of poor openness and integration in some of the parks, relatively poor accessibility to the overall line of sight in the external spatial area and the relatively difficult identification and cognition of the park’s external spatial nodes as a whole, which resulted in a small value of their comprehensibility, and at the same time, combined with the visits to the four parks, we summarize the reasons for the problems in the external space of the four parks (Figure 23). The main points are as follows:
  • The intelligibility of some parks is low, such as the axes of the Cotton 3 Creative Block being far less intelligible than those of other parks, and it was found that there is a phenomenon in the park that the ground pavement produces aging and breakage. Moreover, insufficient and unclear signage and guiding facilities in the external space make people’s safety and walking experience worse;
  • The vegetation types and greening methods in the external space environment of the park are relatively limited, and there are relatively few landscape facilities reflecting the culture of the park, so the overall richness of the spatial environment is relatively low, which is one of the reasons for the low degree of convex integration in some of the parks, such as the Cotton 3 Creative Block;
  • The low convex mean depth in some parks is due to the lower intensity of the development of the more functionally important spaces in the parks, the spaces’ lack of characteristics, a lower diversity of spaces and the degree of utilization of some unused spaces being low;
  • A deficiency in public service facilities, such as seating, fitness equipment and public toilets, along with inadequate security and maintenance infrastructure like street lamps, monitoring and guardrails, adversely affects the user experience in the parks’ external spaces. This also contributes to a diminished sense of security, particularly at night, as well as low values such as in convex integration and axial mean depth;
  • Some parks fail to effectively utilize retained industrial elements and highly open space nodes at the external space interface to promote and display park culture, so the external space nodes have a low attraction and gathering ability, the visual interface fails to make a lasting impression on visitors and the mean depth of the visual field is low;
  • Some creative industry parks have a low degree of integration and intelligibility of the visual field, such as the “3526” Creative Factory having the lowest values of these two items compared with the other parks. The reason for this is that the external public spaces of some creative industry parks suffer from low openness and visibility. This restricts the external spaces’ receptiveness to user behavioral activities and diminishes the spatial atmosphere’s vibrancy. At the same time, it reduces the inclusiveness and absorption of neighboring residents and foreign tourists.
This study proposes the following:
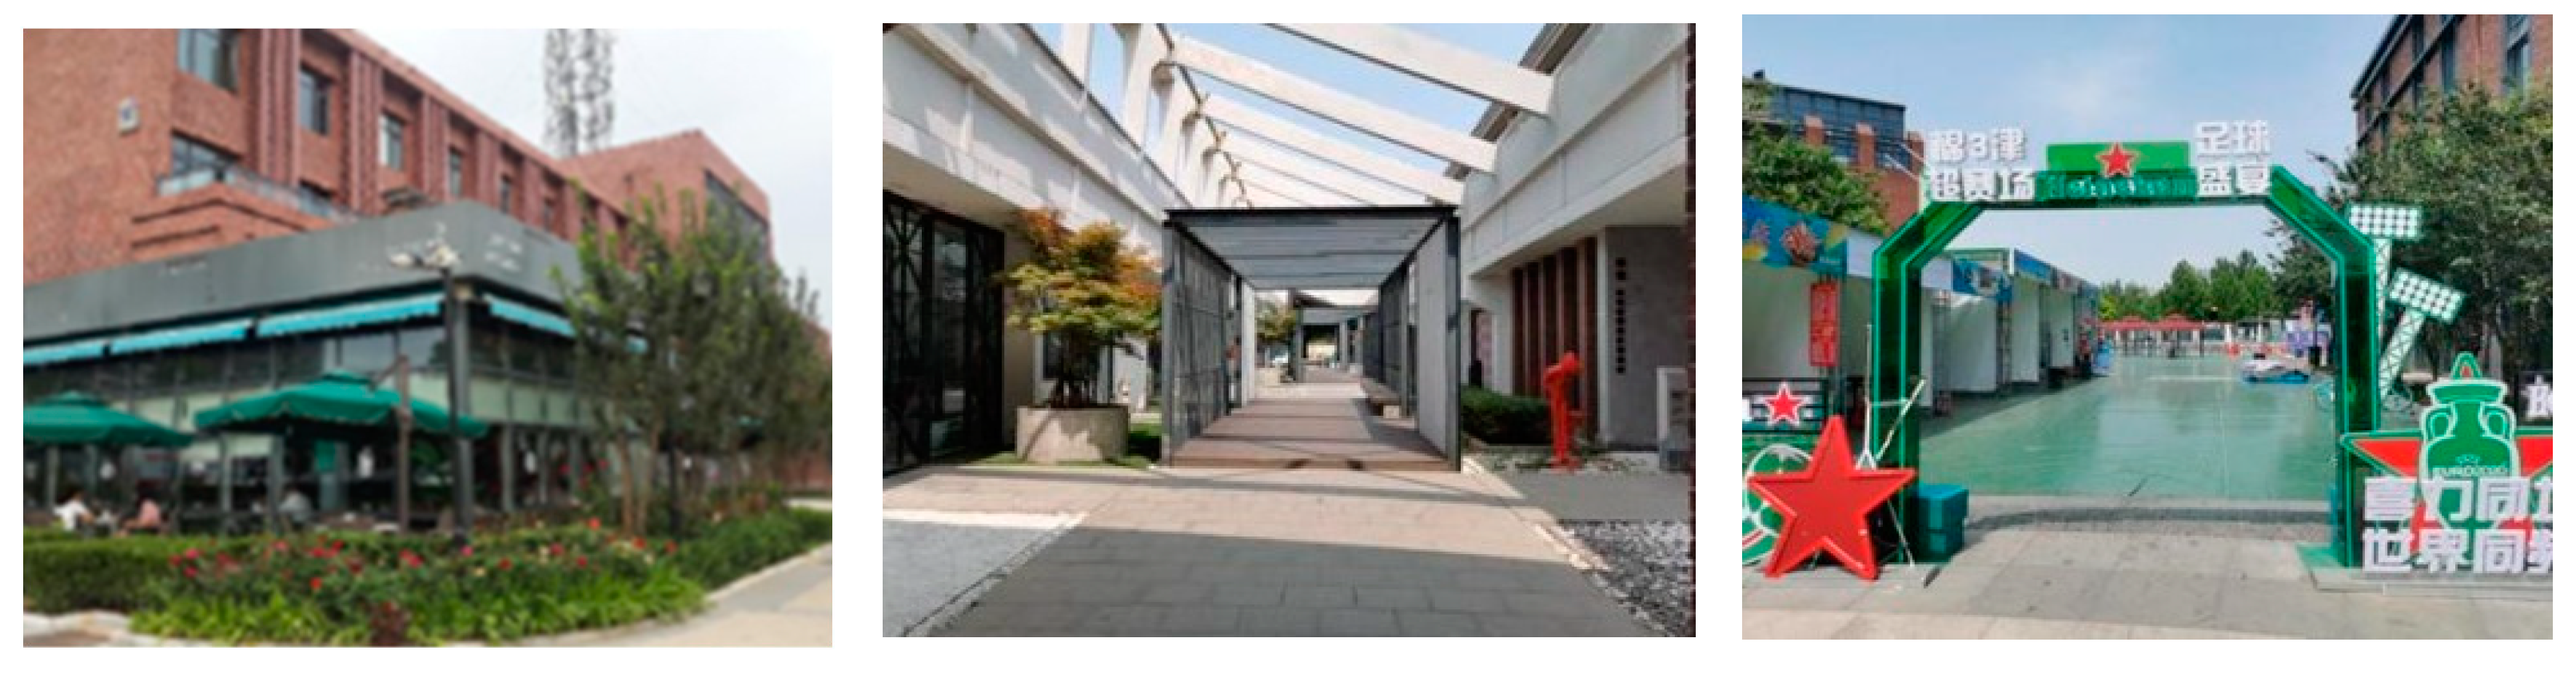
(1) Enhancement of the Walking and Signage Guidance Systems: The road network in the creative industry park serves a dual purpose, accommodating both vehicle traffic and pedestrian movement. A well-developed pedestrian system directly affects people’s activities in the external space of the park and plays an important role in shaping the vitality of the external space of the creative industry park. It is recommended to set up a pedestrian road that connects different buildings and landscape spaces in the park and adopt different pavement materials for spaces with different functional attributes to improve the comfort of walking (Figure 24a). The design of the signage and guidance system in the external space of the industrial creative industrial park will directly affect the feelings of park visitors. These designs should be concise, clear and intuitive. As far as possible, the guidelines of the park plan and the locations and functions of buildings should be introduced in detail to improve the sense of fluency when people walk (Figure 24b). The C92 Creative Cluster, which has the highest degree of integration in the central axis of the text, adopts a dial as an elemental symbol in the design of its signage and guiding facilities, and expresses it in the form of an arrangement of compositions, which perfectly show the history and culture represented by the predecessor of the park, Tianjin Instrumentation Factory, with a great sense of creativity (Figure 24c).
(2) Enrichment of External Space Environment Diversity: Augmenting vegetation and greenery within the park can regulate its microclimate, beautify external spaces and compensate for the lack of vitality and color in the old industrial park. Figure 25a shows that the building façade of the Nabhai Yiku Creative Industrial Park adopts vertical greening and is covered by a large wall of ecological green, which makes its appearance more novel and well demonstrates its renovation method with the theme of green architecture. The exterior space of the North Duisburg Landscape Park retains a lot of elevated frames with a strong industrial flavor, and planting several plants with climbing properties near these frames and making them the medium for green plant attachment not only enriches the compositional elements within the space, but also forms an activity space with a shading effect (Figure 25b). In the external spaces of C92 Creative Cluster external spaces, which have the highest degree of convex integration, some areas utilize repurposed steel frames for three-dimensional greening, although this is implemented on a relatively smaller scale (Figure 25c).
(3) Enhancing Utilization of the Park’s External Spaces: The parks’ external areas contain underutilized spaces, such as courtyards, corridors and the roofs of factories, which are formed between buildings, so sunshade canopies, leisure chairs, landscape facilities and other facilities should be installed in such spaces to make full use of them and create recreational areas. These improvements will facilitate park users in taking breaks, engaging in social interactions and participating in recreational activities. For instance, the open-air dining area outside the cafe in the Cotton 3 Creative Block, which has the highest convex mean depth compared to the other parks, the central plaza of the same block and the area of the connecting corridor between the two factories attract a large number of tourists and workers who come here for rest, conversation and recreation, and even a variety of creative activities that are held (Figure 26).
(4) Enhancing Service Facilities in the External Spaces: The addition of user-friendly public service facilities, such as directional signs, bins and charging facilities in the external spaces, which can enhance the overall image and quality of the park, increase the sense of identity and belonging for visitors, and in this way, also increase the spatial abundance and elevate the convex integration degree of the corresponding renovated spaces in the parks. In the processes of renewal and reconstruction, the parks should improve infrastructure in the external spaces and add facilities for visitors to rest, such as steps, planting pools and rest seats (Figure 27a). Moreover, the consideration of local climatic conditions is essential, necessitating the installation of amenities offering sunshade, windbreaks and rain protection (Figure 27b). Additionally, the placement of aesthetically pleasing and artistically designed lighting fixtures (Figure 27c) will provide essential night-time illumination for park pathways, ensuring safety during nocturnal activities and contributing to the park’s visual appeal. At the same time, more public restrooms should be installed to facilitate people’s outdoor activities.
(5) Enhancing the Industrial Cultural Atmosphere of the Park: The park’s historical context often includes numerous abandoned factories, warehouses, railway tracks, pipelines, chimneys and industrial equipment, such as components of production machinery, which are the original codes and symbols of the factory, that offer insights into its historical lineage and embody the industrial culture. During the park’s renewal and reconstruction, these wastes should be preserved and fully utilized as far as possible. One of the ways of doing so is to give these wastes to artists for transformation and processing, so that they can become new landscape elements of the park and further improve the overall industrial cultural atmosphere of the park, so as to improve the mean depth of the visual field. Beijing 798 Art District preserves the original structure, form and skin of the insides of the factory buildings in the processes of renewal and reconstruction, fully refining and displaying the unique style of the old industrial buildings. It is also possible to give new functions to the external space through processing techniques such as addition, demolition and replacement, so that the original factory building can be fully utilized (Figure 28a). The Chongqing Aile Factory made a staircase addition to the top space of the factory building and retained the industrial heritage equipment, thus displacing the function of the space and making it an interesting place for activities, which attracted many music lovers to visit (Figure 28b). Shanghai M50 Creative Park often organizes exhibitions and activities in the form of cultural and art festivals, showcasing distinctive cultural activities and cultural works and engaging visitors, thus bringing more vitality to the park (Figure 28c).
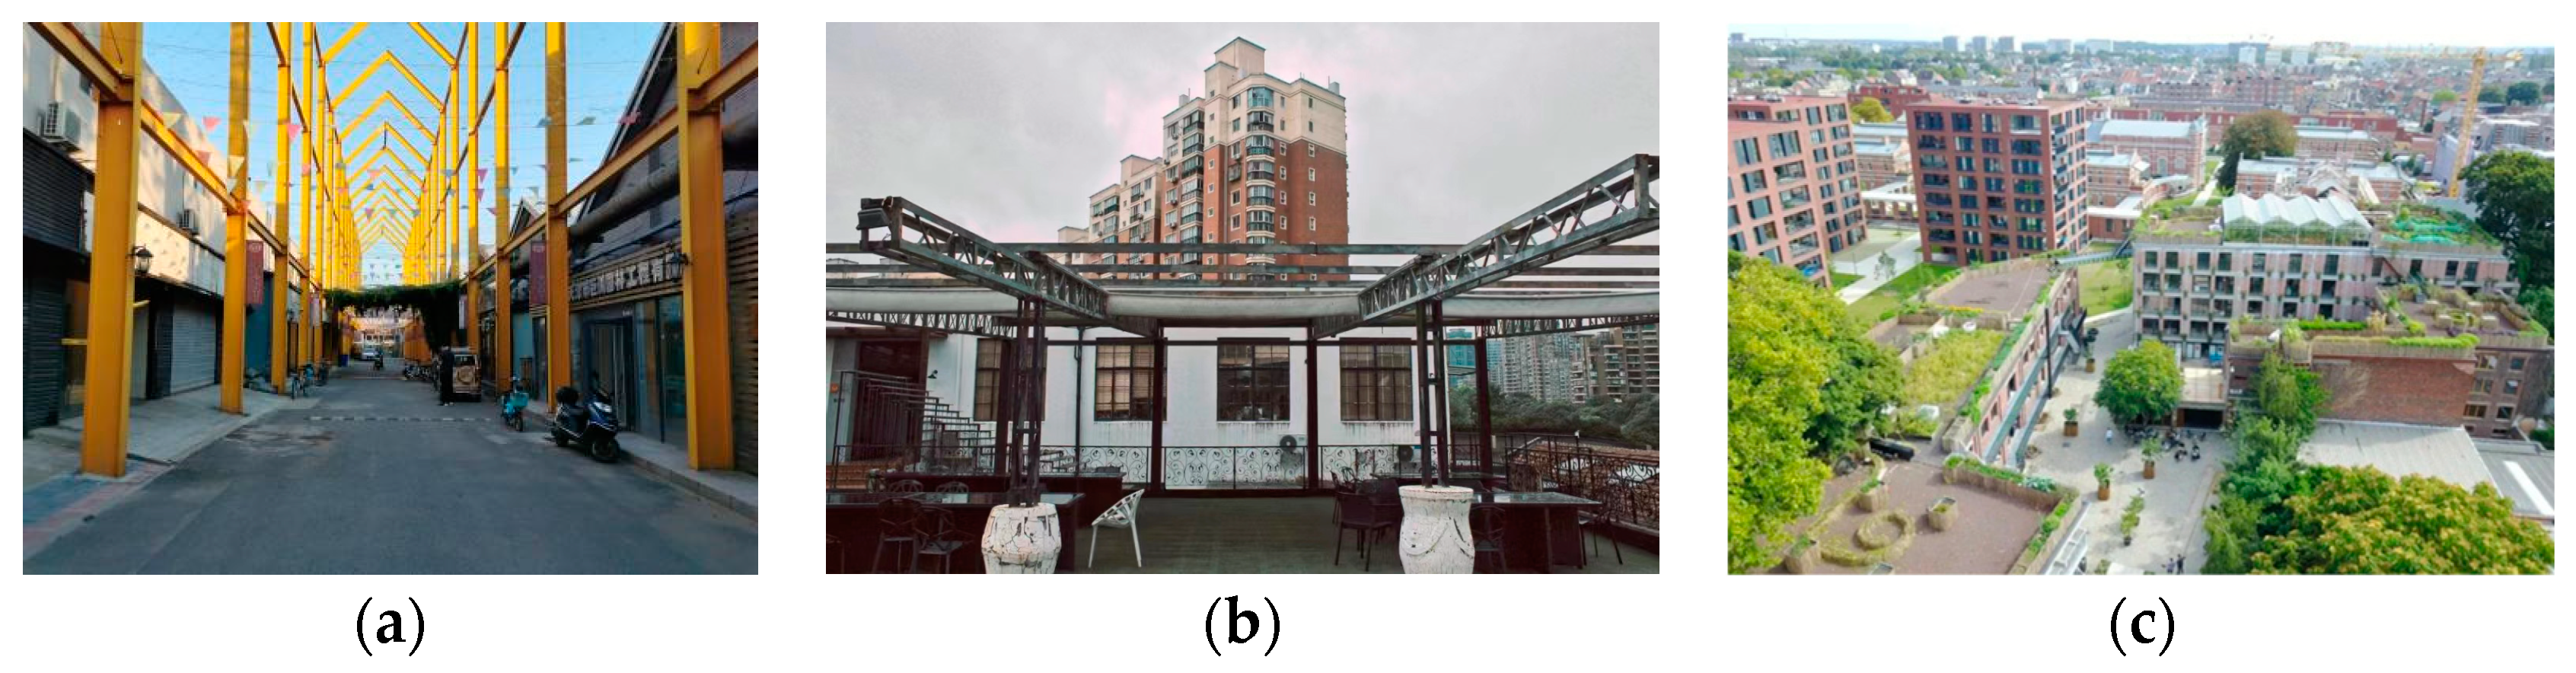
(6) Enhancing the Openness and Visibility of the External Space: The spatial openness and visibility are affected by the spatial enclosure. When surrounded by enclosing solid walls, the user’s line of sight is restricted, and it is difficult to produce visual contact with the outside world, which in turn hinders possible interaction activities from the side and is contrary to the original intention of seeking openness and communication. Therefore, in order to enhance openness and visibility, we should adjust the virtual and real designs of the enclosing interfaces, height differences and plane layouts to make them sight-penetrable. In the “1946” Creative Industrial Park, which has the highest degree of visual integration, partial walls have been removed and replaced with fences to enhance accessibility and openness. This modification in the enclosure style of the entrance area has significantly strengthened the communication atmosphere (Figure 29a). At the same time, the openness of the space is also directly related to the scale of the space, which affects the psychology and behavior of the users, and a relatively narrow or closed space makes people unwilling to stay for a long time. At the same time, it is also important not to over-pursue the openness of a space and set up a space with too large a height-to-width ratio, which will reduce the sense of security and interest of the space. In addition, roof decks can be used to increase spatial openness; for example, the E warehouse creative industrial park in Shanghai (Figure 29b) and the PAKT Block in Antwerp, Belgium (Figure 29c) both use roof decks to enhance spatial openness.

5. Conclusions

In the relevant research on industrial heritage-based creative industrial parks in China, studies focusing on the evaluation of the external spatial morphology using spatial syntax are limited and nascent. There are deficiencies in the theoretical research and practical experience, which need further exploration and research. In this paper, by quantifying the external spatial morphology of four industrial heritage-based creative industrial parks in Tianjin, the following research results have been achieved:
(1)
The existing basic theories on industrial heritage, creative industrial parks, spatial syntax theory and quantitative research on external spatial morphology have been summarized; this study establishes a definition for the external spatial morphology of a creative industrial park within the industrial heritage category.
(2)
The external space morphologies of four industrial heritage creative industrial parks in Tianjin were quantitatively analyzed using the three analysis methods of convex, axis and field of view under the theory of spatial syntax. At the same time, the existing problems of the external spaces of the four parks were summarized with the research.
(3)
Design strategies for optimizing the external spatial forms of the industrial heritage creative industrial parks were proposed in order to provide guidance and reference for future renewal and transformation work in China.
Limitations of this study include its primary focuses on the external public spaces of creative industry parks in Tianjin, which is special in terms of geographical location and historical background and is not universal to external public spaces of creative industry parks in other cities or regions requiring more factors; in addition to the external spatial form, multiple perspectives, a multi-disciplinary and larger scope and a selection from different regions and different city levels of cities are required in the case of the combination of research, so that the results of the study are more accurate, and at the same time, to be able to explore, in depth, the many contents of the external space design of cultural and creative industrial parks. Additionally, utilizing spatial syntax for the simulation and verification of external spaces can enrich the design concepts of these parks and contribute to the healthy development of industrial heritage creative parks.

Author Contributions

Conceptualization, Z.J. and Z.Q.; methodology, Z.J. and Z.Q.; software, Z.Q. and Z.J.; validation, Z.Q. and Z.J.; formal analysis, Z.J. and Z.Q.; investigation, Z.Q. and Z.J.; resources, L.L., L.C., L.X. and D.W.; data curation, Z.J. and Z.Q.; writing—original draft preparation, Z.Q. and Z.J.; writing—review and editing, L.L., L.C., L.X., D.W., P.B.-G. and R.Z.; visualization, Z.J. and Z.Q.; supervision, L.L., L.C., L.X., D.W., P.B-.G. and R.Z.; project administration, L.L., L.C., L.X., D.W., P.B.-G. and R.Z.; funding acquisition, L.L., L.C., L.X. and D.W. All authors have read and agreed to the published version of the manuscript.

Funding

The project was supported by the National Natural Science Foundation of China (51808377).

Data Availability Statement

Data are contained within the article.

Acknowledgments

We thank the research team of Tianjin Chengjian University’s Historic Building Conservation and Renewal Study for their support during this study.

Conflicts of Interest

The authors declare no conflicts of interest.

References

  1. Harris, F. From the industrial revolution to the heritage industry. Geogr. Mag. 1989, 61, 38–42. [Google Scholar]
  2. Jixiang, S. Focus on New Cultural Heritage: Protection of Industrial Heritage. Beijing Plan. Rev. 2007, 2, 11–17. [Google Scholar]
  3. Douet, J. Industrial Heritage Re-Tooled: The TICCIH Guide to Industrial Heritage Conservation; Routledge: Abingdon, UK, 2016; ISBN 9781629582030. [Google Scholar]
  4. Ticcih, P. The Nizhny Tagil Charter for the industrial heritage. In Proceedings of the TICCIH XII International Congress, Moscow, Russia, 17 July 2003; pp. 169–175. [Google Scholar]
  5. Zhang, J.; Cenci, J.; Becue, V.; Koutra, S.; Ioakimidis, C.S. Recent evolution of research on industrial heritage in Western Europe and China based on bibliometric analysis. Sustainability 2020, 12, 5348. [Google Scholar] [CrossRef]
  6. Murphy, C.; Boyle, E. Testing a conceptual model of cultural tourism development in the post-industrial city: A case study of Glasgow. Tour. Hosp. Res. 2006, 6, 111–128. [Google Scholar] [CrossRef]
  7. Richards, G. Creativity and tourism: The state of the art. Ann. Tour. Res. 2011, 38, 1225–1253. [Google Scholar] [CrossRef]
  8. Tan, S.K.; Tan, S.H.; Luh, D.B.; Kung, S.-F. Understanding tourist perspectives in creative tourism. Curr. Issues Tour. 2016, 19, 981–987. [Google Scholar] [CrossRef]
  9. Liu, B. Roundup of the Development of Industrial Building Heritage Conservation. Archit. J. 2012, 1, 436. [Google Scholar]
  10. Oevermann, H.; Mieg, H.A. Urban development planning and world cultural heritage: Two perspectives of planning practice dealing with industrial heritage. Plan. Pract. Res. 2021, 36, 430–441. [Google Scholar] [CrossRef]
  11. Bilton, C. Risky business: The independent production sector in Britain’s creative industries. Int. J. Cult. Policy 1999, 6, 17–39. [Google Scholar] [CrossRef]
  12. Bayliss, D. The rise of the creative city: Culture and creativity in Copenhagen. Eur. Plan. Stud. 2007, 15, 889–903. [Google Scholar] [CrossRef]
  13. Howkins, J. The Creative Economy: How People Make Money from Ideas; Penguin: London, UK, 2002. [Google Scholar]
  14. Finkel, R.; Jones, D.; Sang, K.; Russell, D.S. Diversifying the creative: Creative work, creative industries, creative identities. Organization 2017, 24, 281–288. [Google Scholar] [CrossRef]
  15. Nie, K. Bowing to five pecks of rice: How online monetization programs shape artistic novelty. Chin. Sociol. Rev. 2023, 55, 66–95. [Google Scholar] [CrossRef]
  16. Sarkar, C.; Gallacher, J.; Webster, C. Built environment configuration and change in body mass index: The Caerphilly Prospective Study (CaPS). Health Place 2013, 19, 33–44. [Google Scholar] [CrossRef]
  17. Dhanani, A.N. Street Network Centrality and Built Form Evolution in the Spatial Development of London’s Periphery 1880–2013; UCL (University College London): London, UK, 2015. [Google Scholar]
  18. Bindajam, A.A.; Mallick, J. Impact of the spatial configuration of streets networks on urban growth: A case study of Abha City, Saudi Arabia. Sustainability 2020, 12, 1856. [Google Scholar] [CrossRef]
  19. Paul, A. The rationales behind the unit-segment theory and its analysis methodology for modeling vehicular movement networks. Environ. Syst. Decis. 2016, 36, 72–84. [Google Scholar] [CrossRef]
  20. Vaitkevičiūtė, V. Legibility of Urban Spaces in Kaunas New Town: Research, Strategy, Suggestions. Archit. Urban Plan. 2019, 15, 13–21. [Google Scholar] [CrossRef]
  21. El-Agouri, F.A.; Karakale, V. Privacy regulation, Spatial culture and Communities in a communally diverse city: Ghadames, Libya. J. World Archit. 2018, 2. [Google Scholar] [CrossRef]
  22. Karimi, K. The Configurational Structures of Social Spaces: Space Syntax and Urban Morphology in the Context of Analytical, Evidence-Based Design. Land 2023, 12, 2084. [Google Scholar] [CrossRef]
  23. Hillier, B.; Hanson, J. The Social Logic of Space; Cambridge University: Cambridge, UK, 1984. [Google Scholar]
  24. Hillier, B. Space is the Machine: A Configurational Theory of Architecture; Space Syntax: London, UK, 2007. [Google Scholar]
  25. Bill, H. Network effects and psychological effects: A theory of urban movement. In Proceedings of the 5th International Space Syntax Symposium Delft 2005, Delft, The Netherlands, 13–17 June 2005. [Google Scholar]
  26. Hillier, B.; Turner, A.; Yang, T.; Park, H.T. Metric and topo-geometric properties of urban street networks: Some convergences, divergences and new results. J. Space Syntax. Stud. 2009, in press. [Google Scholar]
  27. Hillier, W.R.G.; Yang, T.; Turner, A. Normalising least angle choice in Depthmap-and how it opens up new perspectives on the global and local analysis of city space. J. Space Syntax. 2012, 3, 155–193. [Google Scholar]
  28. Hillier, W.R.G. What are cities for? And how does it relate to their spatial form? J. Space Syntax. 2016, 6, 199–212. [Google Scholar]
  29. Karimi, K. Space syntax: Consolidation and transformation of an urban research field. J. Urban Des. 2018, 23, 1–4. [Google Scholar] [CrossRef]
  30. Bafna, S. Space syntax: A brief introduction to its logic and analytical techniques. Environ. Behav. 2003, 35, 17–29. [Google Scholar] [CrossRef]
  31. Turner, A.; Penn, A.; Hillier, B. An algorithmic definition of the axial map. Environ. Plan. B Plan. Des. 2005, 32, 425–444. [Google Scholar] [CrossRef]
  32. Turner, A.; Doxa, M.; O’sullivan, D.; Penn, A. From isovists to visibility graphs: A methodology for the analysis of architectural space. Environ. Plan. B Plan. Des. 2001, 28, 103–121. [Google Scholar] [CrossRef]
  33. Hillier, B. Centrality as a process: Accounting for attraction inequalities in deformed grids. Urban Des. Int. 1999, 4, 107–127. [Google Scholar] [CrossRef]
  34. Grajewski, T.; Vaughan, L. Space Syntax Observation Manual; UCL Bartlett and Space Syntax Limited: London, UK, 2001. [Google Scholar]
  35. Hillier, B.; Burdett, R.; Peponis, J.; Penn, A. Creating life: Or, does architecture determine anything? Archit. Comport. Archit. Behav. 1986, 3, 233–250. [Google Scholar]
  36. Penn, A.P. Obituary: Exploring the frontiers of space: Bill Hillier (1937–2019). Urban Morphol. 2020, 24, 224–229. [Google Scholar] [CrossRef]
  37. Yamu, C.; Van Nes, A.; Garau, C. Bill Hillier’s legacy: Space syntax—A synopsis of basic concepts, measures, and empirical application. Sustainability 2021, 13, 3394. [Google Scholar] [CrossRef]
  38. Batty, M. Integrating space syntax with spatial interaction. Urban Inform. 2022, 1, 4. [Google Scholar] [CrossRef]
  39. Van Nes, A.; Yamu, C. Introduction to Space Syntax in Urban Studies; Springer Nature: Berlin/Heidelberg, Germany, 2021. [Google Scholar] [CrossRef]
  40. Joutsiniemi, A. The ajax project: New theory and new software for space syntax. In Proceedings of the 5th International Space Syntax Symposium, Delft, The Netherlands, 13–17 June 2005; pp. 13–17. [Google Scholar]
  41. Hillier, B. A theory of the city as object: Or, how spatial laws mediate the social construction of urban space. Urban Des. Int. 2001, 7, 153–179. [Google Scholar] [CrossRef]
  42. Benedikt, M.L. To take hold of space: Isovists and isovist fields. Environ. Plan. B Plan. Des. 1979, 6, 47–65. [Google Scholar] [CrossRef]
  43. Batty, M. Exploring isovist fields: Space and shape in architectural and urban morphology. Environ. Plan. B Plan. Des. 2001, 28, 123–150. [Google Scholar] [CrossRef]
Figure 1. Research methodology and framework.
Buildings 14 00559 g001
Figure 2. Tianjin’s industrial heritage creative industrial parks.
Buildings 14 00559 g002
Figure 3. Location Map: (a) “1946” Creative Industrial Park; (b) “3526” Creative Factory; (c) Cotton 3 Creative Block; (d) C92 Creative Cluster.
Buildings 14 00559 g003
Figure 4. Research methods and steps in spatial syntax.
Buildings 14 00559 g004
Figure 5. Convex spaces: (a) schematic of a convex space; (b) translation relation diagram of a convex space.
Buildings 14 00559 g005
Figure 6. Convex map: (a) “1946” Creative Industrial Park; (b) “3526” Creative Factory; (c) Cotton 3 Creative Block; (d) C92 Creative Cluster.
Buildings 14 00559 g006
Figure 7. Axial lines.
Buildings 14 00559 g007
Figure 8. Axis maps: (a) “1946” Creative Industrial Park; (b) “3526” Creative Factory; (c) Cotton 3 Creative Block; (d) C92 Creative Cluster.
Buildings 14 00559 g008
Figure 9. Visual fields.
Buildings 14 00559 g009
Figure 10. Visual field maps: (a) “1946” Creative Industrial Park; (b) “3526” Creative Factory; (c) Cotton 3 Creative Block; (d) C92 Creative Cluster.
Buildings 14 00559 g010
Figure 11. Convex mean depth: (a) “1946” Creative Industrial Park; (b) “3526” Creative Factory; (c) Cotton 3 Creative Block; (d) C92 Creative Cluster.
Buildings 14 00559 g011
Figure 12. Convex integration: (a) “1946” Creative Industrial Park; (b) “3526” Creative Factory; (c) Cotton 3 Creative Block; (d) C92 Creative Cluster.
Buildings 14 00559 g012aBuildings 14 00559 g012b
Figure 13. Convex intelligibility analysis chart: (a) “1946” Creative Industrial Park; (b) “3526” Creative Factory; (c) Cotton 3 Creative Block; (d) C92 Creative Cluster.
Buildings 14 00559 g013
Figure 14. Axis average depth analysis chart: (a) “1946” Creative Industrial Park; (b) “3526” Creative Factory; (c) Cotton 3 Creative Block; (d) C92 Creative Cluster.
Buildings 14 00559 g014
Figure 15. Axis integration analysis chart: (a) “1946” Creative Industrial Park; (b) “3526” Creative Factory; (c) Cotton 3 Creative Block; (d) C92 Creative Cluster.
Buildings 14 00559 g015
Figure 16. Axis intelligibility chart: (a) “1946” Creative Industrial Park; (b) “3526” Creative Factory; (c) Cotton 3 Creative Block; (d) C92 Creative Cluster.
Buildings 14 00559 g016
Figure 17. Visual mean depths analysis chart: (a) “1946” Creative Industrial Park; (b) “3526” Creative Factory; (c) Cotton 3 Creative Block; (d) C92 Creative Cluster.
Buildings 14 00559 g017
Figure 18. Visual integration analysis chart: (a) “1946” Creative Industrial Park; (b) “3526” Creative Factory; (c) Cotton 3 Creative Block; (d) C92 Creative Cluster.
Buildings 14 00559 g018aBuildings 14 00559 g018b
Figure 19. Visual intelligibility analysis chart: (a) “1946” Creative Industrial Park; (b) “3526” Creative Factory; (c) Cotton 3 Creative Block; (d) C92 Creative Cluster.
Buildings 14 00559 g019
Figure 20. Comparison of convex analysis values.
Buildings 14 00559 g020
Figure 21. Numerical ratio diagram for axial analysis.
Buildings 14 00559 g021
Figure 22. Comparison plot of field of view analysis values.
Buildings 14 00559 g022
Figure 23. Spaces in the parks lacking facilities: (a) “1946” Creative Industrial Park; (b) “3526” Creative Factory; (c) Cotton 3 Creative Block; (d) C92 Creative Cluster.
Buildings 14 00559 g023
Figure 24. Pedestrian and signage orientation systems: (a) walking trail in the Creative Industries Park, Quarry Bay; (b) graphic signage for Guangdong 33 Town; (c) spatial signage at C92 Creative Cluster.
Buildings 14 00559 g024
Figure 25. Vegetation greening in the parks: (a) Nanhai Yiku Creative Industrial Park; (b) Landschaftspark Duisburg-Nord; (c) C92 Creative Cluster.
Buildings 14 00559 g025
Figure 26. Utilization of unused spaces outside the Cotton 3 Creative Block.
Buildings 14 00559 g026
Figure 27. Supporting service facilities: (a) lounge chair; (b) sunshade facilities; (c) lighting facilities.
Buildings 14 00559 g027
Figure 28. Industrial culture atmospheres of parks: (a) Beijing 798 Art District; (b) Chongqing Aile Factory; (c) Shanghai M50 Creative Park.
Buildings 14 00559 g028
Figure 29. Well-opened spaces in parks: (a) entrance space of “1946” Creative Industrial Park; (b) roof platform of E Warehouse Creative Industrial Park; (c) roof platform of PAKT Block in Belgium.
Buildings 14 00559 g029
Table 1. Tianjin’s industrial heritage creative industrial park summary.
Retrofitting TimeFactory Name of OriginCreative Industry Park Name
2007Tianjin carpet factoryIcu Creative Industries Park
2008Tianjin Internal Combustion Engine Magnetic Motor FactoryTatsuhaku Creative Industries Park
2009Tianjin Instrument FactoryC92 Creative Cluster
2010Tianjin Textile Machinery Factory“1946” Creative Industrial Park
2011Tianjin Huajin Pharmaceutical Factory“3526” Creative Factory
2011Jardine Matheson WarehouseNo. 6 Courtyard Creative Industry Park
2012Tianjin Bicycle Saddle Factory460 International Design Park
2012Tianjin Rubber Products FactoryAlleyway Creative Industry Park
2014Tianjin Cotton Textile FactoryCotton 3 Creative Block
Table 2. Table of convex mean depth data.
Mean DepthMax.Avg.Min.Std.Space
“1946” Creative Industrial Park3.592.631.860.4816
“3526” Creative Factory6.283.672.590.7943
Cotton 3 Creative Block6.774.923.440.7955
C92 Creative Cluster3.872.951.870.5625
Table 3. Convex integration data sheet.
Integration AnalysisMax.Avg.Min.Std.Space
“1946” Creative Industrial Park2.021.180.670.3716
“3526” Creative Factory1.881.210.560.3243
Cotton 3 Creative Block1.360.880.570.1855
C92 Creative Cluster2.631.290.80.4125
Table 4. Axis mean depth data table.
Mean DepthMaxAvg.MinStd.Count
“1946” Creative Industrial Park2.501.831.250.339
“3526” Creative Factory2.942.271.680.3620
Cotton 3 Creative Block4.183.182.290.4345
C92 Creative Cluster2.221.821.330.3110
Table 5. Axial integration data sheet.
Integration AnalysisMaxAvg.MinStd.Count
“1946” Creative Industrial Park4.431.690.731.059
“3526” Creative Factory2.961.731.040.5320
Cotton 3 Creative Block2.361.460.960.3245
C92 Creative Cluster3.661.8310.9710
Table 6. Mean depth of field of view data sheet.
Mean DepthMaxAvg.MinStd.
“1946” Creative Industrial Park5.212.221.680.44
“3526” Creative Factory4.152.641.890.41
Cotton 3 Creative Block3.872.611.880.39
C92 Creative Cluster3.862.381.730.41
Table 7. Field of view integration data sheet.
Integration AnalysisMaxAvg.MinStd.
“1946” Creative Industrial Park14.028.532.282.13
“3526” Creative Factory11.186.483.181.57
Cotton 3 Creative Block12.567.283.851.75
C92 Creative Cluster13.137.573.352.28
Disclaimer/Publisher’s Note: The statements, opinions and data contained in all publications are solely those of the individual author(s) and contributor(s) and not of MDPI and/or the editor(s). MDPI and/or the editor(s) disclaim responsibility for any injury to people or property resulting from any ideas, methods, instructions or products referred to in the content.

