Article

A Community Information Model and Wind Environment Parametric Simulation System for Old Urban Area Microclimate Optimization: A Case Study of Dongshi Town, China

1
School of Civil Architecture and Environment, Hubei University of Technology, Wuhan 430068, China
2
College of Engineering and Computer Science, California State University Northridge (CSUN), Northridge, CA 91330, USA
*
Author to whom correspondence should be addressed.
Submission received: 26 February 2024 / Revised: 13 March 2024 / Accepted: 15 March 2024 / Published: 19 March 2024
(This article belongs to the Special Issue Impact of Climate Change on Buildings and Urban Thermal Environments)

Abstract

:
In the context of an increasingly extreme climate, Urban Heat Island (UHI) mitigation of communities through ventilation has recently attracted more attention. To explore the impact mechanisms of different morphological renovation schemes on its wind and thermal environment, this paper selected the Laozheng Community as a case study and: (1) analyzed measured data to quantitatively investigate the UHI within the community; (2) established the CIM-WTEPS system to construct community information models and to conduct wind environment parametric simulation for seven micro-renovation schemes across three levels; (3) performed correlation analyses between morphology indicators and wind environment indicators; (4) conducted the thermal environment parametric simulation of the community under different schemes. The results reveal that: (1) the Laozheng Community exhibits the Urban Heat Island Intensity (UHII) of up to 6 °C; (2) apart from the “ Hollowing “ scheme, which deteriorates the community wind environment, all other schemes optimize it, potentially increasing the average wind speed by up to 0.03m/s and in the renovated area by up to 0.42 m/s; (3) building density is highly correlated with the average wind speed and the proportion of calm wind area, with correlation coefficients of −0.916 (p < 0.01) and 0.894 (p < 0.01), respectively; (4) the adding of shading facilities can enhance the proportion of areas with lower Universal Thermal Climate Index (UTCI) without adversely affecting the optimization effects of the wind environment, achieving an maximum increase of 3.1%. This study provides a reference for optimizing the community’s microclimate through morphological micro-renovations and detailed operations, aiding designers in better controlling community morphology for in future community renewal and design planning, thereby creating a more hospitable outdoor environment.

1. Introduction

UHI refers to the phenomenon where urban or urbanized areas exhibit higher temperatures compared to surrounding rural or natural areas [1]. The intensity of this effect is typically measured by the UHII, reflecting the degree of the UHI. Global rapid urbanization has been underway since the second half of the 20th century, and the increasing size and density of cities inevitably leads to the UHI [2], which worsens the microclimates of cities, resulting in high air temperature, poor air quality and low outdoor thermal comfort. Extreme heat can cause severe health problems, including respiratory, cardiovascular, and cerebrovascular diseases, and even death [3,4,5]. Similarly, outdoor air pollution poses a persistent threat to the well-being and health of inhabitants [6,7].
Mitigating UHI and improving thermal comfort in outdoor spaces is a challenging and complex task [8]. It requires urban planners, landscape designers, and climatologists to pay more attention to the optimization of the urban microclimate [9], considering that urban microclimates are sensitive to urban morphology, especially from the view of air temperature and wind speed [10,11]. Previous studies have observed that urban microclimates are significantly influenced by factors such as meteorological parameters, urban underlying surface material, and population [1,12,13]. In addition, researchers found that surface roughness is a key factor in reducing the wind speed and increasing the calm wind of a community or a city [14]. Furthermore, UHI is revealed to be closely related to urban ventilation, and the lack of ventilation will increase the intensity of the heat island. A study in Greece indicated that in summer, Greece could be 4 °C cooler when subjected to the westerly sea breeze (compared to the north-bound breeze). This was because the northerly sea breeze was generally blocked by the ancient city wall so that cool wind could not penetrate the core zone of the city [15]. These researchers revealed that UHI is the result of morphological features, and urban ventilation corridors are generally effective in UHI mitigation.
As a fundamental unit shaping urban morphology, community morphology is believed to be a critical driver of urban microclimates. Community morphology mainly consists of the street-canyon configuration and the building configuration. Street-canyon configuration is classified by height-to-width ratio (H/W), street orientation (SO), sky view factor (SVF), and other variables. Using this classification, Oke found that the H/W greatly influences outdoor comfort [16]. When H/W = 0.4~0.6, a community can obtain a better wind and thermal environment under the conditions of satisfying the shelter, heat preservation, ventilation, and other functions of the street. Achour-Younsi and Kharrat proposed that H/W and SO are the important geometric factors in urban street canyons, which determine the solar access, shading conditions, and ventilation environment of the canyon [17]. One study in Beijing found that when the SO is parallel to the dominant wind direction of the city or at a small angle, it is more conducive to the airflow inside the community, thus accelerating the diffusion of pollutants. In addition, studies in Brazil, Singapore, and other places have found that SVF has a strong correlation with outdoor air temperature: the greater the SVF, the higher the temperature and the greater the discomfort during the daytime [18,19,20,21]. As to the building configuration, indicators such as floor area ratio (FAR) [22,23,24], building density (BD) [22,23,24,25,26], building height (BH) [22,24,26,27], building form (BF), and other variables have been found to be the key measures in assessing the wind and thermal environment of communities. Authors in [28] reported that an increase in the FAR could dramatically reduce the local wind speed and solar radiation. Also, low BD can mitigate the UHII by reducing the community temperatures and the duration of UHI (approximately 30%) [29]. Furthermore, the breathability of the communities is improved by turbulent and diffusive winds (generated by buildings of uneven height) and the occurrence of strong winds is suppressed. Buildings under the point-layout arrangement provide communities with the most effective ventilation, followed by buildings under determinant-layout, staggered-layout and enclosed-layout arrangements [30].
The above researchers highlight the decisive role of the street-canyon configuration and the building configuration in the community microclimate and their significant impact on outdoor pedestrian comfort. But it is worth noting that previous and current studies primarily focus on communities with high-rise, high-density configurations. Limited research attention has been concentrated on old urban communities with low-rise, high-density, and complex configurations, with various limitations on renovation. These communities increasingly require consideration of their internal microclimate improvement as urbanization progresses. Computational Fluid Dynamics (CFD) simulation tools have been brought to these communities to assess how morphological features influence microclimates in recent years. Based on it, some scholars have combined field measurements and CFD simulations to conduct micro-renovation studies aimed at optimizing the microclimates of old or historic communities. Wei proposed that community morphology can be renovated not only at the macro level using methods like demolition, relocation, and clearance, but also at the micro level through measures such as adjusting active equipment, increasing greenery, and replacing pavement materials to enhance the wind and thermal environment [31]. Zheng, using Envi-met software and various microclimate assessment methods, conducted a series of simulations and analyzed three scenarios for improving the microclimate of a traditional community [32]. The study provided constructive recommendations for microclimate improvement (such as increasing wind intake capacity, removing additional structures, and adding windows). Peng, taking a community in Wuhan as an example, conducted CFD simulations to understand how the microclimate of an old urban area is changed under different renovation strategies including creating long streets and short alleyways, widening ventilation corridors, constructing or reconstructing communities flower-arrangement layout, and adopting a T-shaped space [33]. Additionally, Li used CFD simulations to predict the thermal comfort of residents and proposed various community morphological renovation methods and design strategies within Beijing’s Siheyuan and Hutong areas to enhance outdoor comfort [34].
From the current state of research, it is evident that, to study the relationship between community morphology and microclimate, the common approach in previous studies has been a “modeling-simulation-model modification-simulation again” cycle. Such research often requires manual adjustments to the original models when generating new cases and involves repetitive operations such as setting boundary conditions and dividing computational grids, which is time-consuming and challenging, to meet the demands for dynamic model changes and rapid simulation in a multi-scheme comparison scenario. Furthermore, there is a scarcity of research that quantitatively integrates community morphological information or analyzes the correlation between morphology indicators and microclimate indicators, making it difficult for planners to identify highly correlated morphology indicators for effectively enhancing the community microclimate.
Therefore, this study started with the hypothesis that the Laozheng Community exists with a UHI based on human perception, then verified the hypothesis with measured data, and finally analyzed the renovation schemes through simulation. The goal is to investigate whether different micro-renovation schemes bring significant improvements to the community microclimate. The specific research steps are as follows:
  • Conducting field measurements within the Laozheng Community, calculating the UHII, and employing “ventilation” approaches to mitigate the UHI;
  • Establishing the CIM-WTEPS system (Figure 1, the specific details can be found in the Section 3.2.2) to construct community information models (CIM) and conduct wind environment parametric simulations (WEPS) for seven morphological micro-renovation schemes across three levels, assessing outdoor wind comfort through three wind-environment indicators;
  • Performing a correlation analysis between morphology indicators and wind-environment indicators from simulation results, identifying highly correlated morphology indicators;
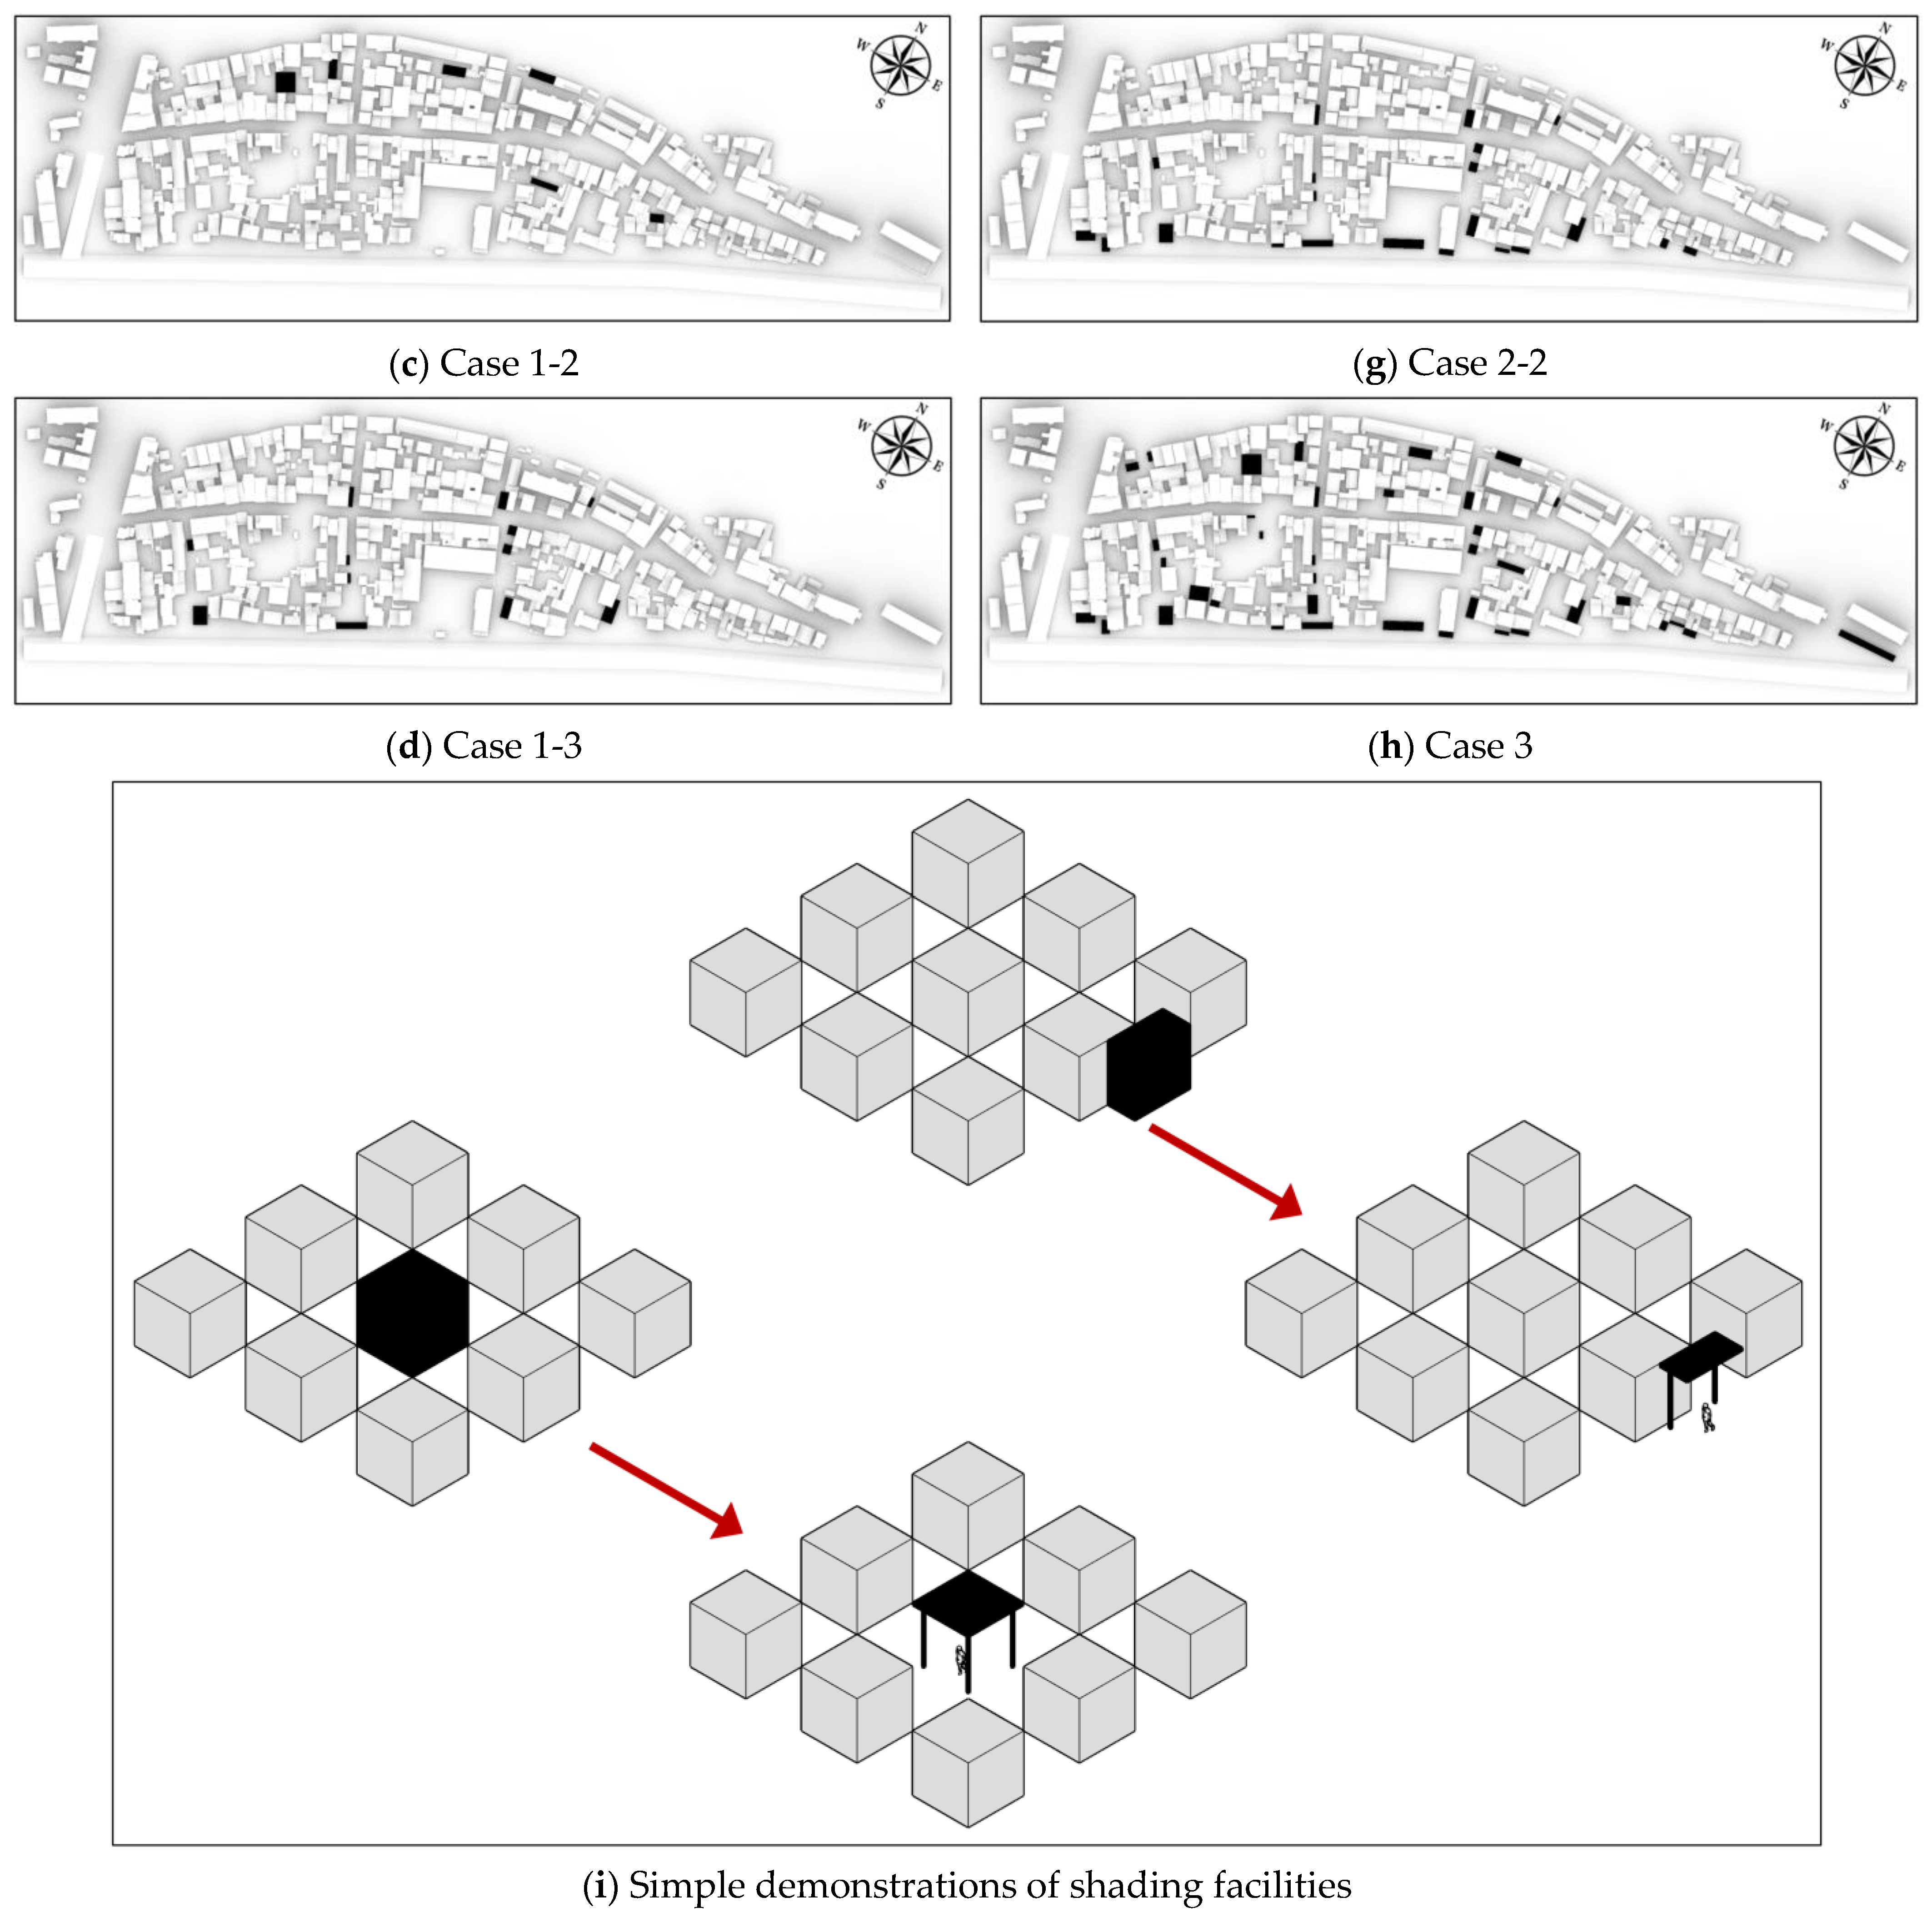
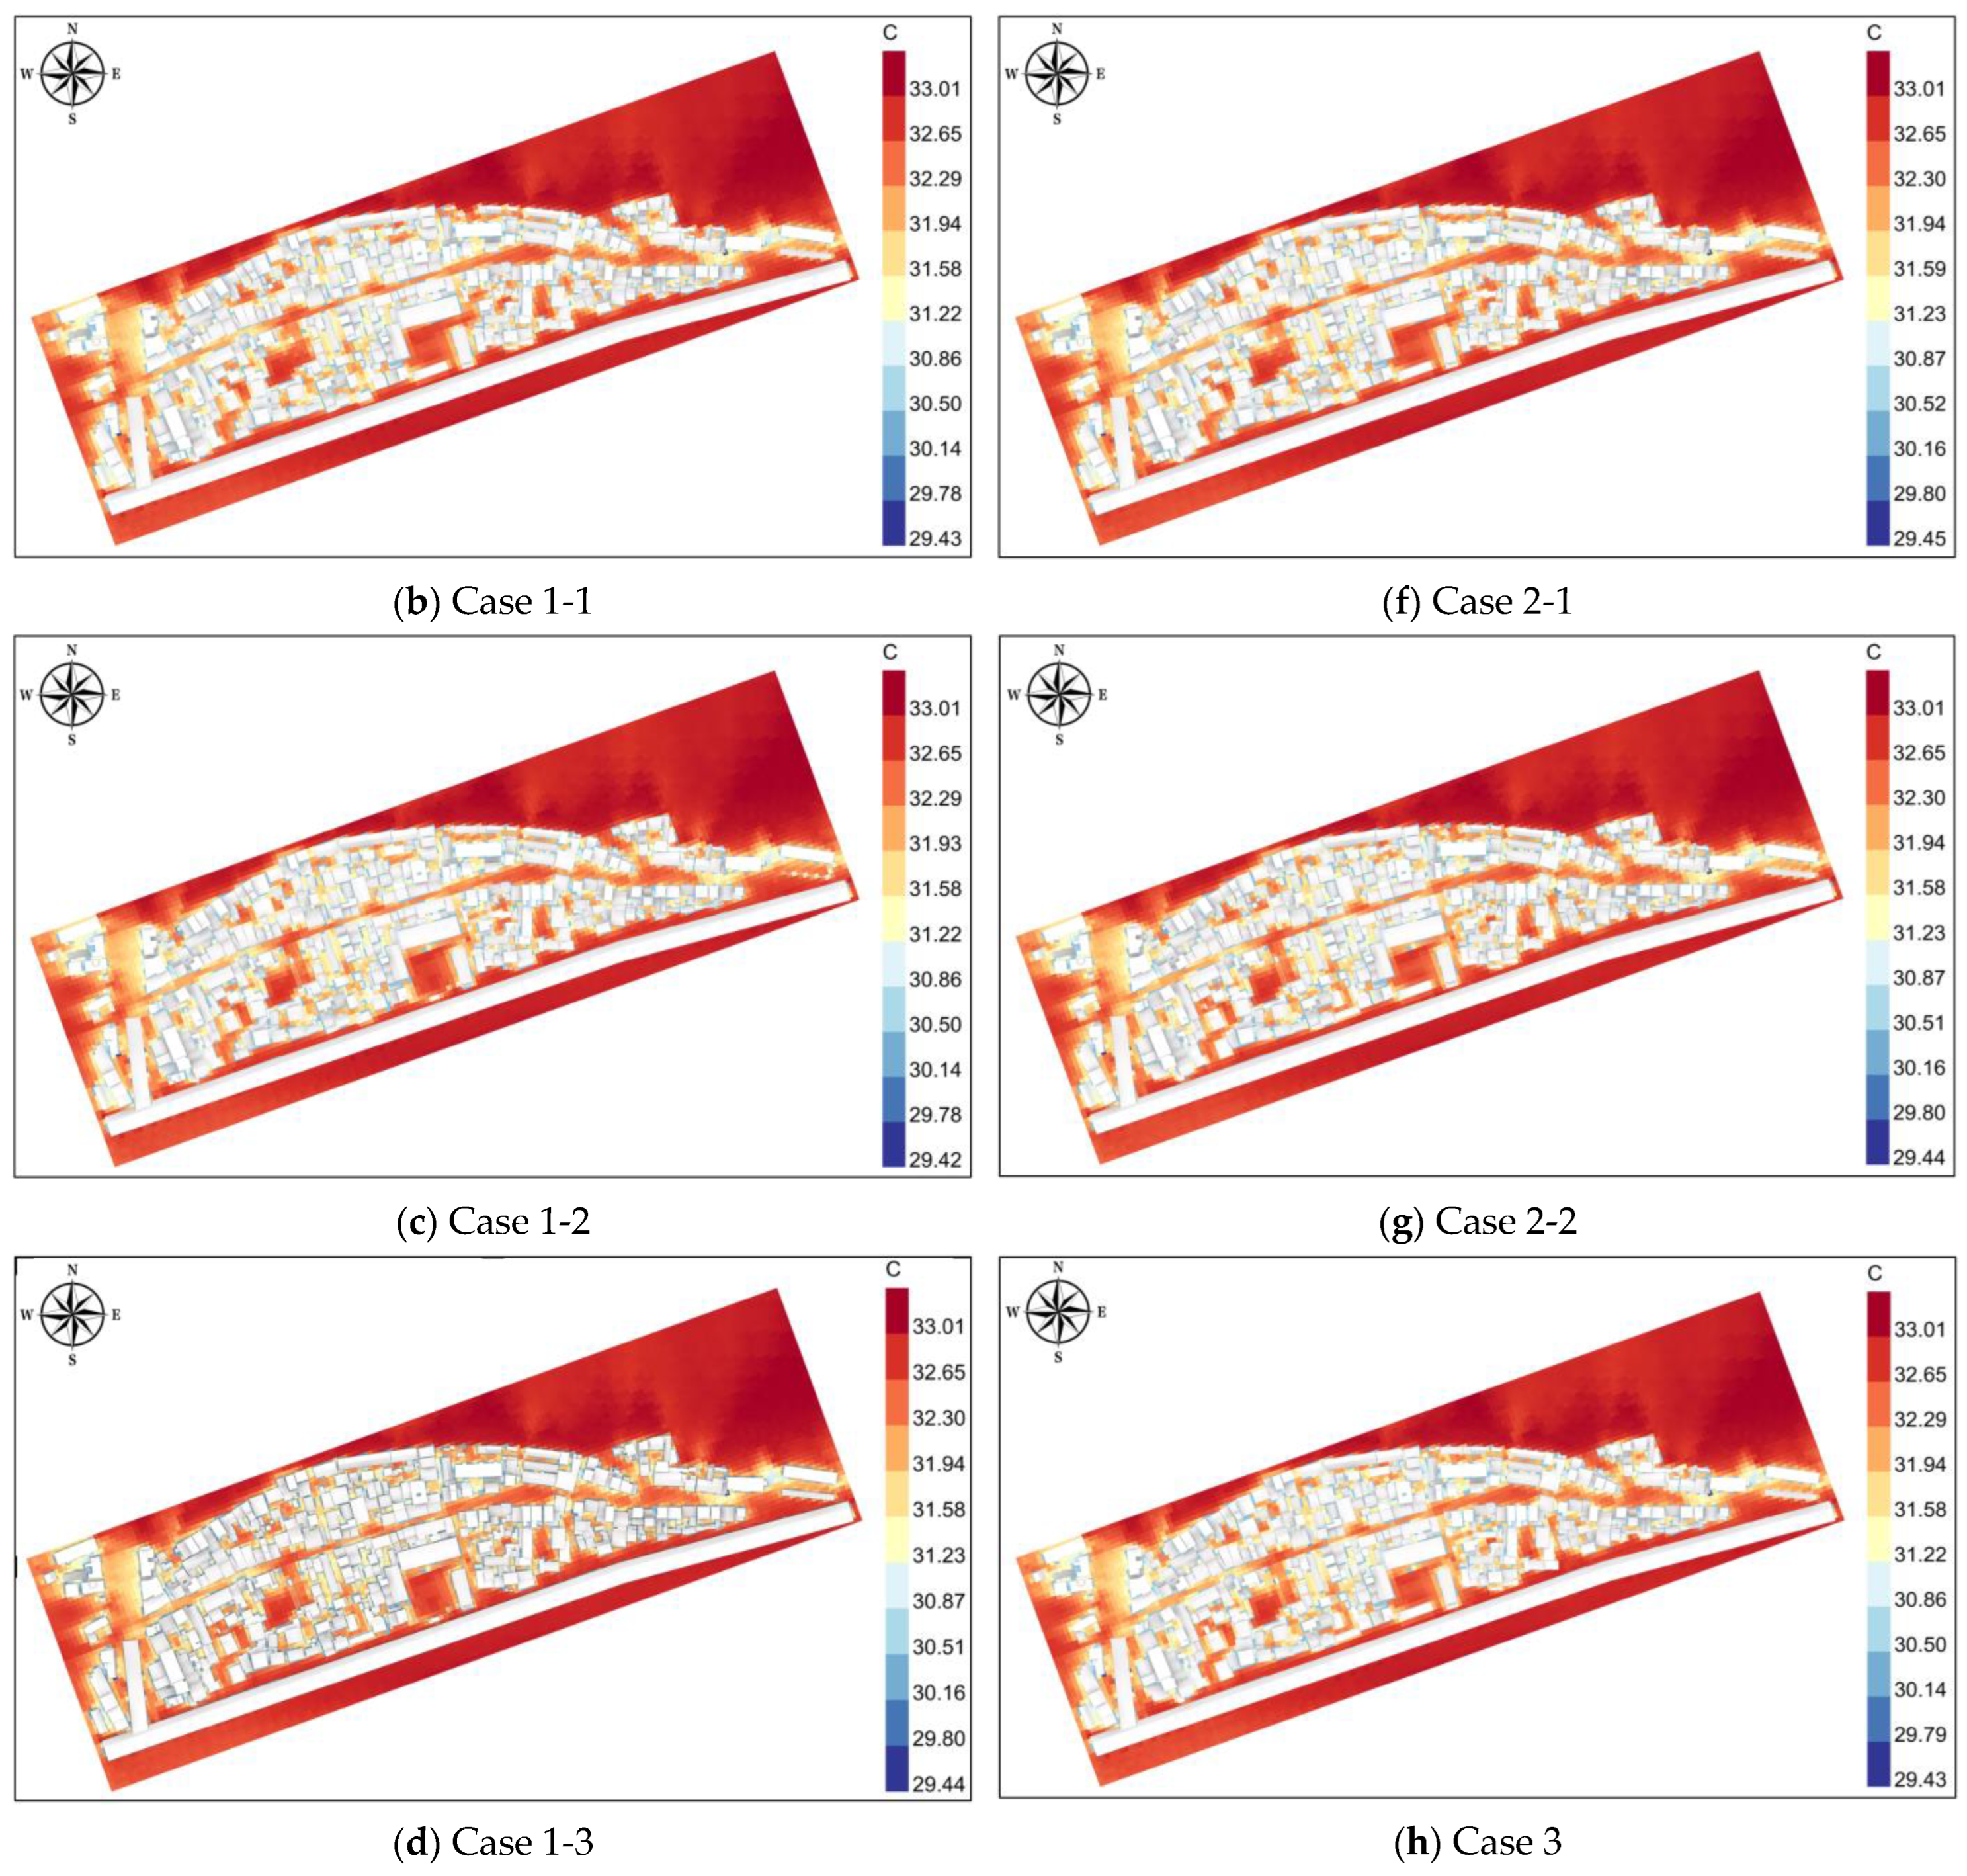
  • Conducting thermal environment parametric simulations (TEPS) for schemes based on background meteorological data and wind environment simulation data, assessing outdoor thermal comfort through the UTCI and analyzing the improvement effects of shading facilities on the thermal environment.
The contributions of this study include: (1) quantifying the UHII through temperature data, thereby validating the field measurement hypothesis of poor microclimate conditions in the community; (2) establishing a system (CIM-WTEPS) to investigate the relationship between morphology and microclimate, where the CIM module can quantify community morphology information, and the WTEPS module can meet the needs for rapid simulation analysis of multiple scenarios, a method that can also be applied to quantitative studies of microclimates in other communities; (3) providing reference guidance for guiding the morphological renovation of old urban communities and the design planning of new community, aiming to create a comfortable outdoor environment.

2. Study Area

In this study, the Laozheng Community, Dongshi Town, Hubei Province, China was selected. As shown in Figure 2, the community is situated in the transition zone between the border area of Jianghan Plain and the mountainous area of western Hubei, close to the Yangtze River, experiencing a typical hot-summer and cold-winter climate.
Within the Laozheng Community, the road network consists of three east-west roads and 15 north-south alleys (Figure 3). The width of the east-west roads is about 8 m, while the width of most alleys is less than 3 m. The Jinshi Road cuts the community and the Laozheng Street in half. The west side of the Laozheng Street is “Up Street”, while the east side is “Down Street”.

3. Methods

3.1. Field Measurement

Initially, through on-site reconnaissance, the microclimate of the Laozheng Community was subjectively perceived to be uncomfortable, leading to the hypothesis that the wind and thermal environment was poor and required optimization through micro-renovation of the community morphology. Subsequently, based on meteorological forecasts, the research team selected the three most representative days of the summer heat characteristics in the Laozheng Community from 1 August to 3 August 2022, and conducted continuous field measurements from 7:00 AM to 7:00 PM over these three days. The primary instrument used was the electronic breeze meter (TES-1341N, Table 1), which recorded meteorological data such as air temperature, relative humidity, and wind speed.
Sites A1~B5 were set on the ground for data recording, and Site WS was set as a weather station, installed on the roof of the highest residential building near the Laozheng Community, to measure the background meteorological data (Figure 4 and Table 2). The measurement sites were evenly distributed in the community, which can better reflect the overall microclimate. According to the road conditions, Sites A1~A5 were located in the center of the Jinshi Road to enhance data accuracy, and Sites B1~B5 were located on one side of Down Street to ensure vehicle passage.
A preliminary analysis revealed that the meteorological characteristics over the three days were similar, thus the measured data from August 3 was chosen for in-depth analysis. The air-temperature data were selected to quantify the UHII within the community, in order to validate the hypothesis and provide rational support for the subsequent simulation studies, and the wind-speed data of Sites B1~B5 were utilized to verify the accuracy of the simulation tool (the specific details can be found in the Section 3.2.5).
UHII was adopted to indicate the air-temperature difference between Sites A1~B5 ( T i j ) and Site WS ( T w s ), as expressed by Equation (1) [35,36].
U H I I = T i j T w s   ( i = A , B ; j = 1 , 2 , 3 , 4 , 5 )

3.2. Parametric Simulation

3.2.1. Microclimate Evaluation Indicators

Three mainstream and appropriate microclimate evaluation indicators were selected to evaluate the wind and thermal environment: V ¯ (average wind speed), P c a l m (proportion of calm-wind area), σ (wind-speed dispersion) and UTCI.
  • Average wind speed: this is a commonly used assessment indicator in outdoor microclimate, indicating the average value of all instantaneous wind speeds at a pedestrian height of 1.5 m. It is used to evaluate the overall wind-environment conditions in the area.
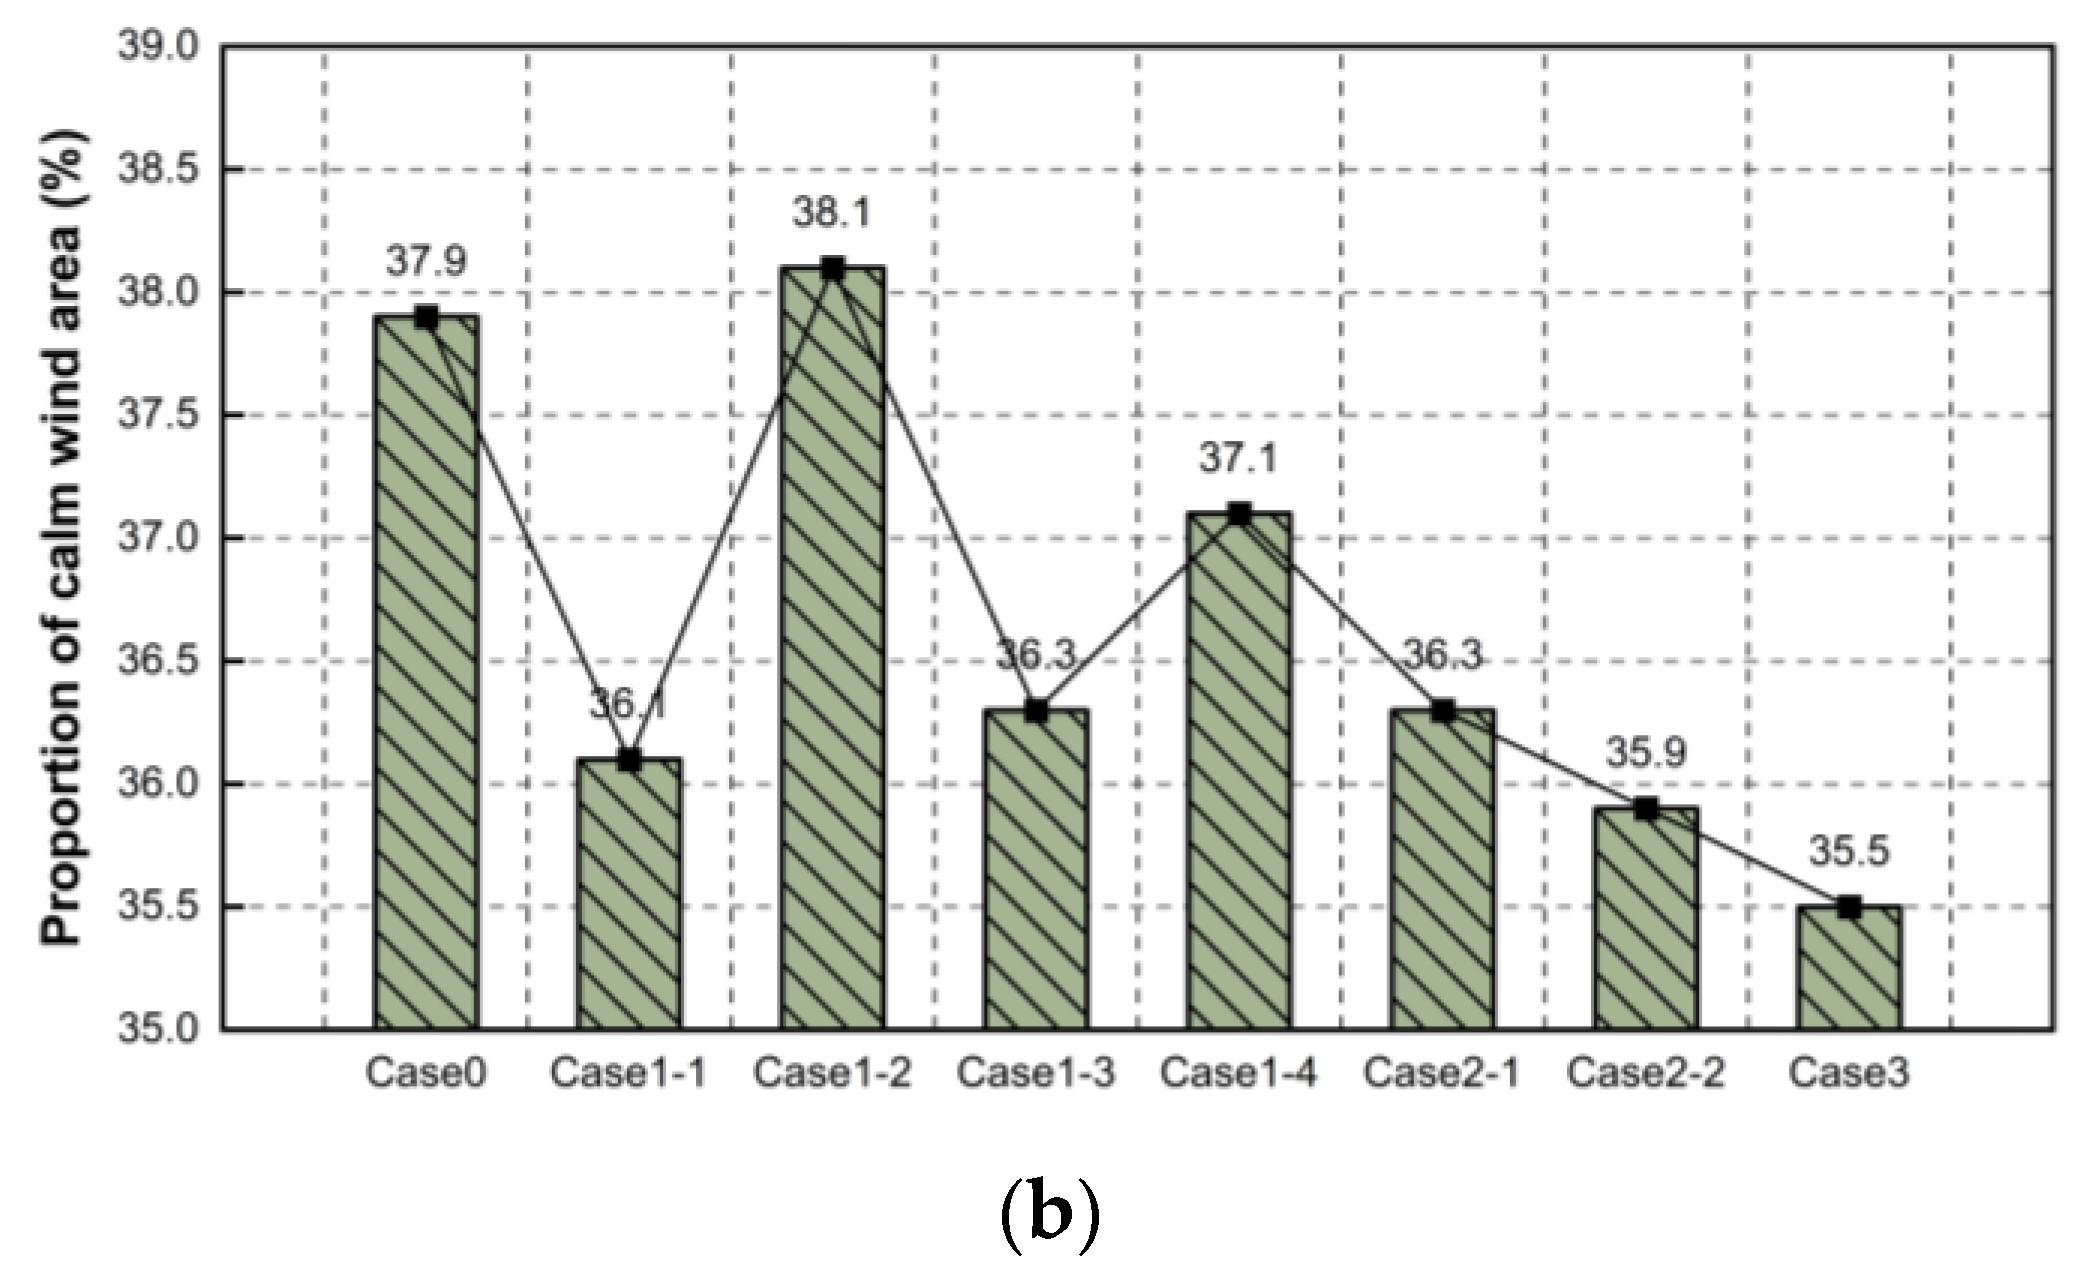
  • Proportion of calm-wind area: based on experimental results and calculations, some researchers have concluded that a speed of 0.6 m/s must be achieved at a walking height of 1.5 m to effectively reduce the level of pollutants in the air. This implies that in summer, wind speeds below 0.6 m/s are considered as the proportion of calm-wind area in the overall wind environment.
  • Wind-speed dispersion: primarily employed to assess the uniformity of outdoor wind-speed distribution. The evaluation is based on calculating the standard deviation (Equation (2)), where a smaller value signifies a more uniform wind-speed distribution within the area, while a larger value indicates a more uneven wind-speed distribution [37].
    σ = 1 n i = 1 n x i μ 2
    where σ is the wind-speed dispersion, n is the number of measurement points; x i is the wind speed at each point, μ is the average wind speed of all points.
  • Universal Thermal Climate Index: UTCI is a comprehensive tool for assessing climatic comfort that integrates principles of human thermophysiology [38,39]. It takes into account environmental factors including air temperature, relative humidity, wind speed, and solar radiation, as well as individual metabolic rate and clothing thermal resistance, thereby offering a globally applicable system for evaluating thermal comfort. The UTCI categorization is divided into the following ranges, measured in degrees Celsius (°C), depicting levels of thermal comfort under varying environmental conditions (Table 3):

3.2.2. CIM-WTEPS System

The CIM-WTEPS system consists of a CIM (Community Information Model) module and WTEPS (Wind- and Thermal-Environment Parametric Simulation) module.
The CIM module is primarily responsible for integrating and standardizing diverse community morphology indicators. In this study, three indicators were selected: MBH (mean building height), BN (building number), and BD (building density). They were chosen based on the following principles [41,42,43]: (1) common but important in theory and practice; (2) relatively clear guiding significance in urban planning; (3) easily interpretable and calculated [44]. It is significant to note that due to the diverse building forms in the Laozheng Community, indicators BF (building layout) and BS (building size) are not used.
The WTEPS module is mainly focused on building modeling and wind- and thermal-environment simulation, with the objective of creating an efficient and rapid simulation process for conducting microclimate simulations on CIM. The WTEPS module can also be subdivided into a building information module, a meteorological information module, a simulation module, and a visualization module. The main software tools used include: Rhino 7 modeling software, Grasshopper platform, Ladybug plugin, Butterfly plugin, blueCFD fluid simulation solver, and Paraview visualization platform. It is worth noting that blueCFD 2017 is a customized version of the open-source CFD software OpenFOAM. This customization streamlines the installation process and management tools, enhancing the accessibility and usability of OpenFOAM [45].
The workflow of the WTEPS module is illustrated in Figure 5, primarily: integrate building information and perform parametric modeling of the research object through the Grasshopper platform; establish constraint relationships between the building model and programming modules to achieve adaptive changes in the building model with variations in programming parameters; subsequently, utilize the Ladybug plugin to import background meteorological data, and process the data to obtain the required background wind speed and wind direction for wind-environment simulation; following this, set simulation parameters and use the Butterfly plugin to invoke the blueCFD fluid simulation solver for model preprocessing, solving, and post-processing. The simulation files are then imported into Excel for organizing and calculating wind-environment indicators, and simultaneously imported into the Paraview visualization platform to display the simulation results. Lastly, background meteorological data along with the obtained community wind-environment data are imported, and thermal-environment simulation is conducted. Similarly, simulation results are imported into Excel for calculating the thermal-environment indicator, with simulation outcomes directly displayed in Rhino (the workflow of the simulation module is shown in Figure A1 and Figure A2).

3.2.3. CIM Construction of Renovation Schemes

Based on the thermal problems of the Laozheng Community and drawing inspiration from previous studies on ventilation corridors, courtyards, and windward areas [46,47,48], this study has designed three levels, totaling seven different micro-renovation schemes. The objective is to alleviate the UHI and to optimize the community’s microclimate. Additionally, corresponding CIMs have been established for each scheme to facilitate subsequent wind- and thermal-environment simulations. To reduce simulation costs, the “Down Street” area on the right is selected for modeling. Buildings involved in different renovation schemes are represented by blocks of different colors. The schemes, models, and their corresponding CIMs are shown in Table 4 and Table 5 and Figure 6.

3.2.4. Simulation Parameters Setting

In various meteorological databases, historical meteorological data for Zhijiang City is unavailable. According to China’s “Green Performance Calculation Standard for Civil Buildings” (JGJ/T 449-2018) [49]: when there is no meteorological data available in the calculation area, meteorological data of nearby cities should be selected as the background meteorological data for simulation. Due to the similar geographical location and features of Zhijiang City and Jingzhou City (both are situated in the transition zone between the border area of the Jianghan Plain and the mountainous area of western Hubei), as well as their similar level of urban development (Figure 7), Jingzhou TMYx data has been selected as the background meteorological data for the simulation study. The simulated input wind direction is S and the input wind speed is 3 m/s.
Considering the relatively flat and open geographical characteristics of the study area, but that within the research community there is a cluster of high-density and low-rise buildings with a uniform height, setting the simulation roughness to 6 seems reasonable [50].
The boundary of the calculation area is closely related to the authenticity of the simulation results. As the calculation area expands, the disparity between simulated data and measured data gradually decreases. According to China’s JGJ/T 449-2018 standard [49], the calculation-area boundary is set as 5H (vertical distance, where H represents the height of the tallest building within the object building group) × 5H (horizontal distance) × 5H (inflow distance) × 10H (outflow distance), as shown in Figure 8.
Grid size is the key to measure the accuracy of wind-environment simulation [51]. This simulation utilized a grid division method, with the number of grids increasing and their sizes decreasing closer to the buildings. It involved employing Blockmesh to construct coarse structured grids for the site and Snappyhexmesh to create refined unstructured grids for the building models. Varying the parameter cell_size, cell_size = 10/6/4/2/1 were selected for comparison (Figure 9). Considering both simulation accuracy and simulation cost, cell_size = 2 and a surface feature level of 3 (enhancing grid conformity with the model’s geometric features) were set. Consequently, the calculation area was established as 826 m × 552 m × 90 m, with a maximum grid size of 37 m × 18 m × 15 m and a minimum grid size of 2 m × 2 m × 0.5 m, totaling approximately 5.05 million grids.
The blueCFD fluid simulation solver encompasses multiple turbulence models, among which the RNG K-epsilon model is the commonly used in engineering for the Reynolds-averaged Navier-Stokes (RANS) equations. It offers moderate computational demand, reduced computation time, lower cost, minimal fluctuations, and higher computational accuracy [52]. Considering the morphology complexity in the Laozheng Community, the RNG K-epsilon model is adept at simulating constrained airflow. This study adopted the RNG K-epsilon turbulence model, while setting the residual limit of equations to 10−4 as the convergence criterion. The pre-setting of the simulation tool was as listed in Table 6.

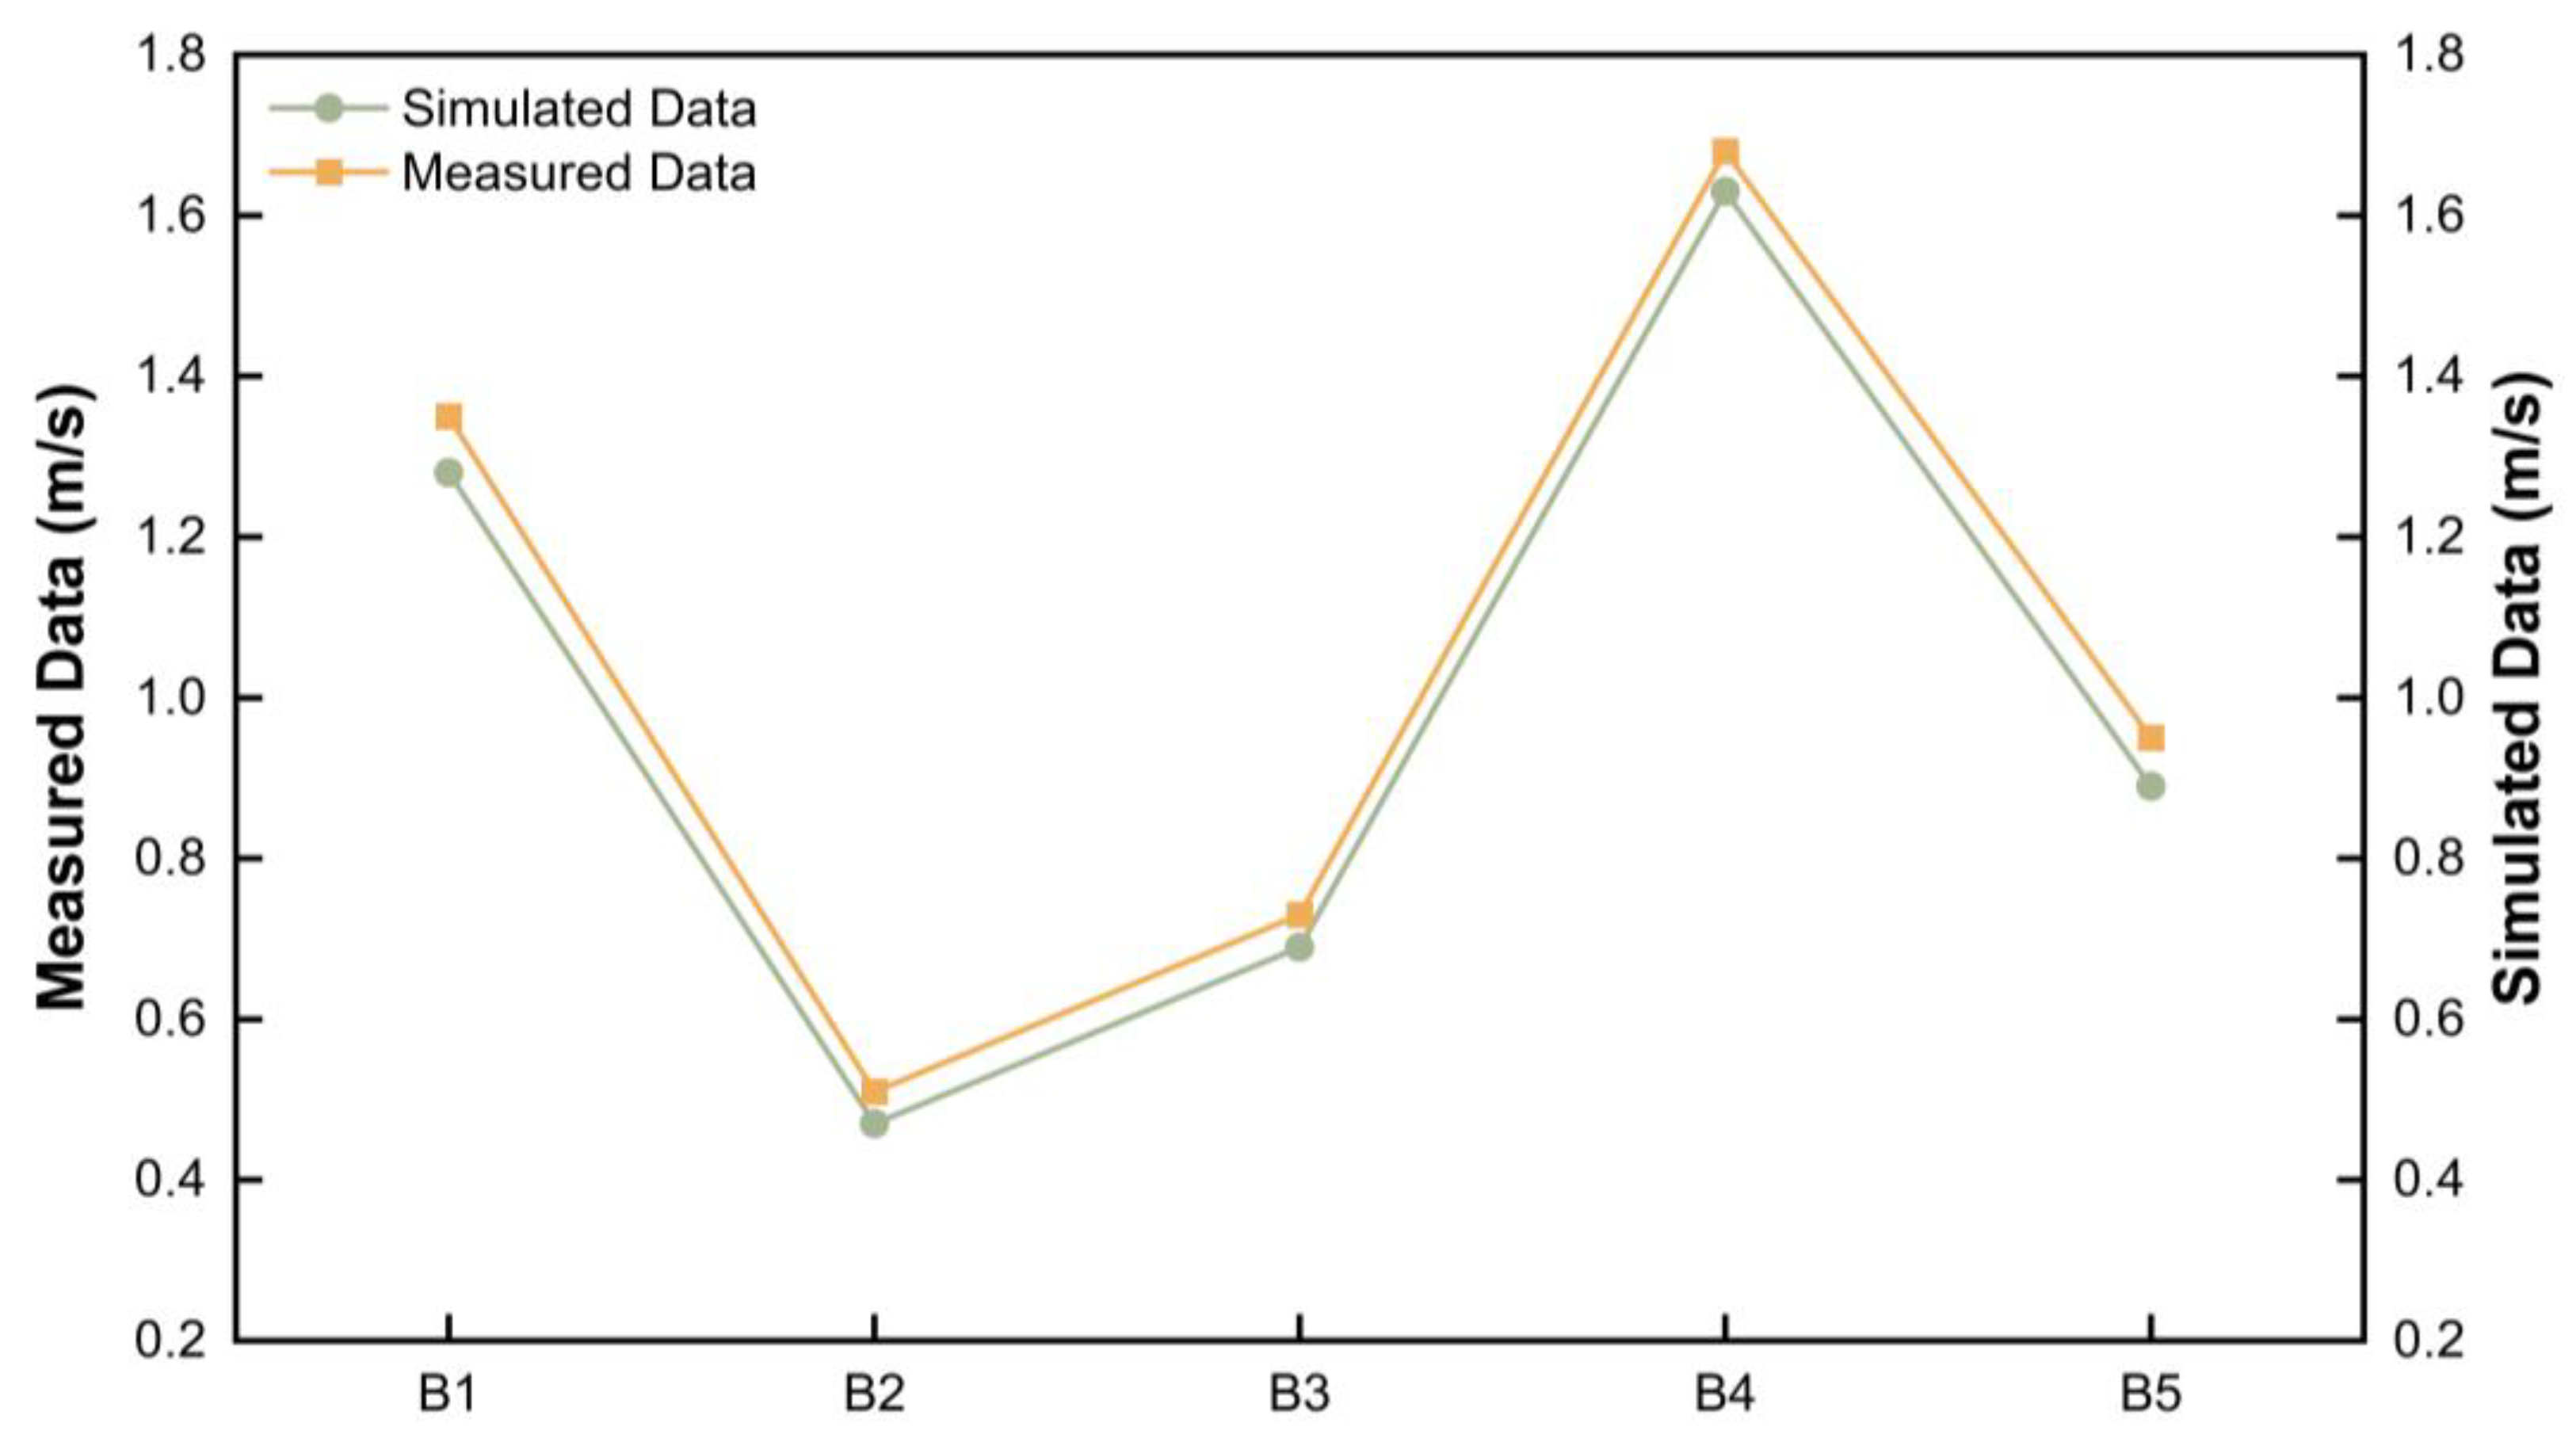
3.2.5. Feasibility Validation

Feasibility validation was conducted to compare the measured data with the simulated data to validate the accuracy of the simulation tool. Sites B1, B2, B3, B4, and B5 were utilized for the feasibility validation of the simulation software. They were evenly distributed along Down street, effectively reflecting the overall microclimate conditions within the Laozheng Community.
The average wind speed at five sites compared with that at the same locations in the simulated model can be seen from the Table 7 and Figure 10. By calculation, the average absolute error between the measured data and the simulated data is 5.62%. Considering the influence of multiple factors such as model simplification, ground reflection, wall radiation, and windbreaks from vegetation in the community, the simulation error is deemed within an acceptable range.
Based on the pre-setting and feasibility validation of the simulation tool, it can be concluded that the simulation tool possesses the capability to conduct relatively accurate simulations of the community’s microclimate.

4. Results

4.1. Field Measurement Results

By calculating the measured data, the temporal distribution of the UHII in the Laozheng Community is illustrated in Figure 11 (The complete measured data of air temperature in 11 sites is shown in Figure A3 and Table A1).
From Figure 11a, it is observed that the median and mean of the UHII among the 10 sites are both greater than 0. Sites A1 and A2 exhibit median and mean values surpassing 2 °C, with IQR (25–75%) data ranging between 1 °C to 4 °C, indicating notably high UHI levels. Based on the environmental information from the measurement sites, it can be inferred that the expansive surroundings of Sites A1 and A2 lack obstructions such as buildings or large trees, receiving direct sunlight from 7:30 AM to 6:00 PM. Additionally, these sites are situated at a T-junction with higher vehicular traffic, experiencing a more pronounced influence from traffic-related heat sources compared to other sites. Considering these primary factors, the ambient temperatures around these sites are elevated, resulting in stronger heat-island effects. Notably, the highest UHII exceeds 6 °C, observed at Site A2 instead of Site A1, possibly due to the cooling effect of vegetation at Site A1 and the sustained heat release from the higher specific heat capacity asphalt surface at Site A2.
From Figure 11b, it is evident that between 11:00 AM to 2:00 PM, all 10 sites experienced direct sunlight, exhibiting a UHII greater than 0. The median and mean values, approximating over 2 °C, indicate a pronounced UHI (It is generally considered that a temperature difference exceeding 1 °C is indicative of the presence of a local UHI). Specifically, Sites A3, B1, and B4 demonstrated IQRs at relatively lower levels. It is inferred that Site A3’s location at the junction of Jinshi Road and Laozheng Street, forming a spacious and well-ventilated corridor, fosters improved airflow. Site B1’s taller surrounding structures may generate a canyon effect, elevating wind speeds. Additionally, Site B4’s proximity to small patches of greenery and large tree canopies might contribute to reducing ambient air temperatures, thereby alleviating the heat-island effect.
Through the above analysis of the UHII, it is shown that the Laozheng Community experiences a UHI, with an average UHII of approximately 2 °C and maximum values exceeding 6 °C. Particularly between 11:00 AM to 2:00 PM when all sites are exposed to direct sunlight, the heat-island effect intensifies. Moreover, it is evident that enhancing environmental greenery, replacing underlying surface materials with higher specific heat capacities and lower thermal conductivities, and establishing ventilated corridors can collectively optimize local thermal environments, thereby mitigating UHI.

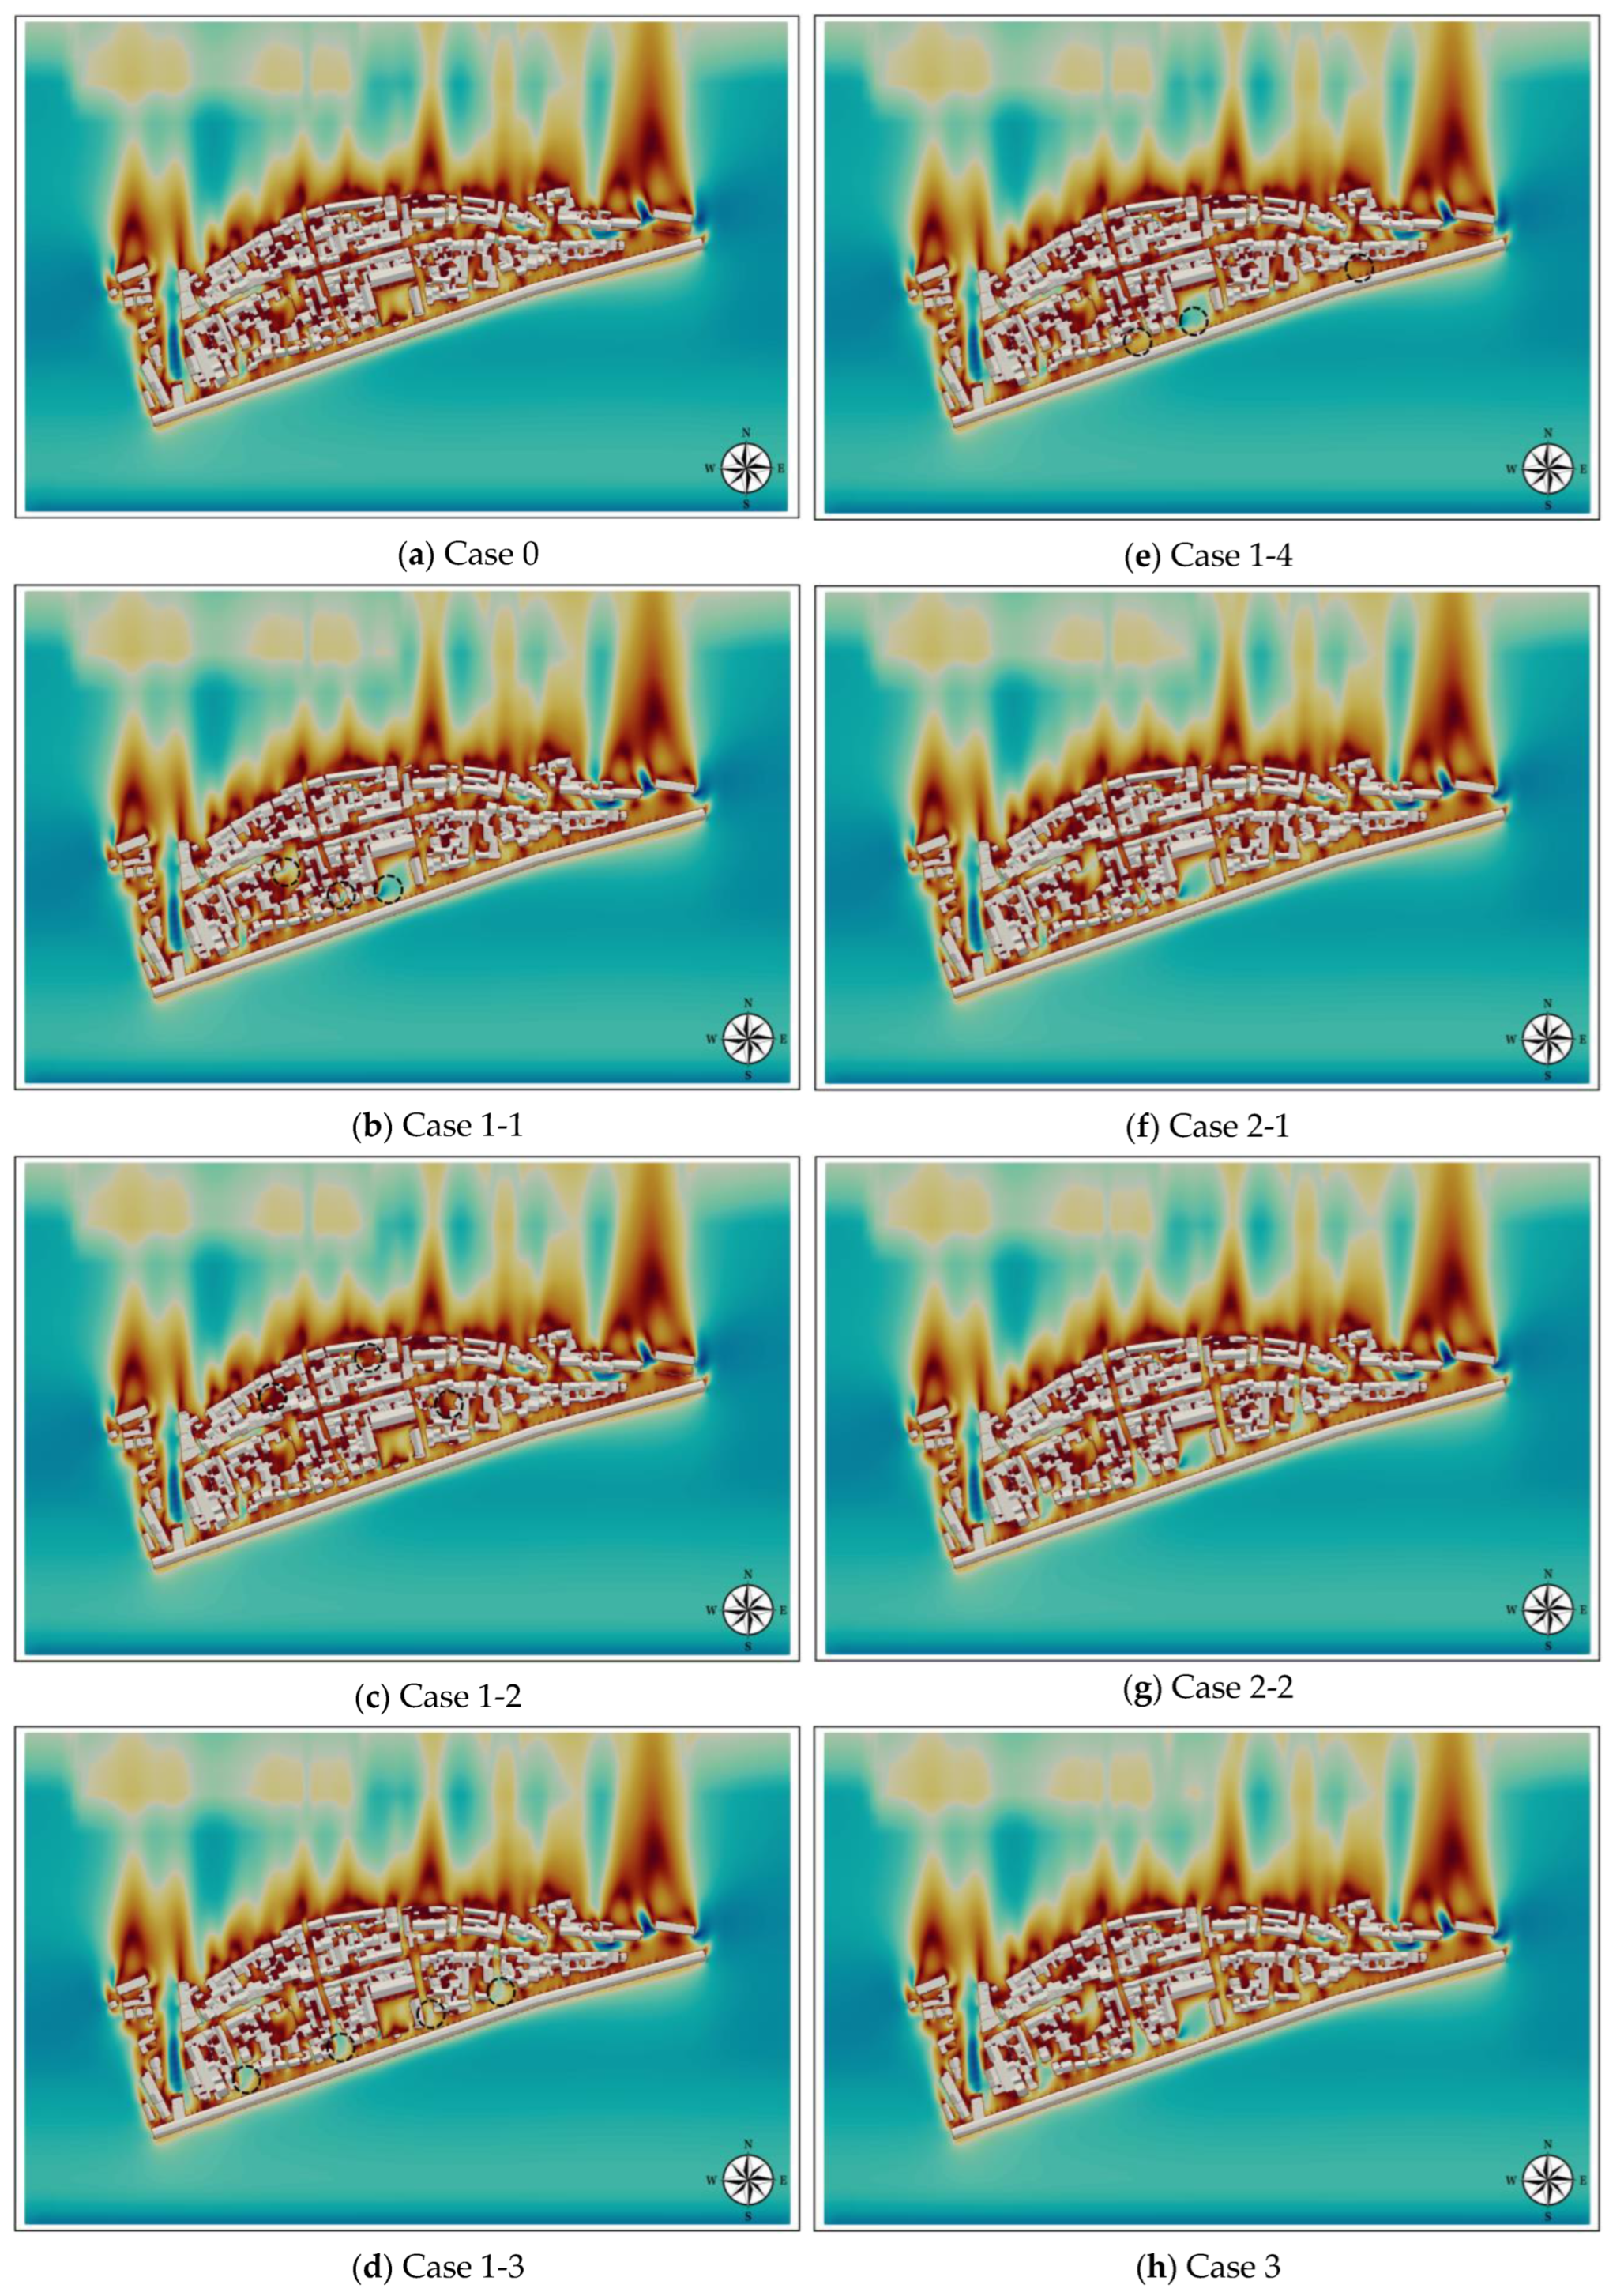
4.2. Wind-Environment Simulation Results

Through the construction of community information models (CIMs) and parametric wind-environment simulation, the wind-environment simulation results for the control group and seven micro-renovation schemes are as follows (Table 8, Table 9, Table 10, Table 11, Table 12, Table 13, Table 14 and Table 15 and Figure 12).
Table 8 indicates that in Case 0, the average wind speed during summer stands at 0.82 m/s ( V ¯ ), with the proportion of calm-wind area accounting for 37.9% ( P s t a t i c ), and a wind-speed dispersion of 0.451 ( σ ). Figure 12a demonstrate that the maximum wind speed primarily occurs at the Jinshi Road, and between two high-rise buildings at the eastern end of the Laozheng Community. This occurrence is attributed to the canyon effect and funnel effect resulting in the increase of wind speed. Additionally, within the Laozheng Community and the leeward areas of buildings to the north, the wind speeds predominantly exhibit yellow and red, remaining below 1.2 m/s.
Table 9 and Figure 12b indicate that in Case 1-1, the average wind speed during summer stands at 0.84m/s, with the proportion of calm-wind area accounting for 36.1%, and a wind-speed dispersion of 0.458. Compared to Case 0, under Case 1-1 scenario, the overall wind environment in the Laozheng Community has been optimized. The average wind speed has increased by 0.02 m/s ( V ¯ ), and the proportion of calm-wind area has decreased by 1.8% ( P s t a t i c ). However, the increase in wind speed has also led to a rise in wind-speed dispersion by 0.007 ( σ ). Additionally, notable changes in the wind environment are evident in the three renovation areas marked by the black circle, where the average wind speed has surged by 0.73 m/s ( V ¯ ).
Table 10 and Figure 12c indicate that in Case 1-2, the average wind speed during summer stands at 0.82 m/s, with the proportion of calm-wind area accounting for 38.1%, and a wind-speed dispersion of 0.453. Compared to Case 0, under Case 1-2 scenario, the overall wind environment in the Laozheng Community has deteriorated. The average wind speed has not changed, the proportion of calm-wind area has increased by 0.2%, and the wind-speed dispersion has increased by 0.002. Additionally, no notable changes in the wind environment are evident in the three renovation areas marked by the black circle.
Table 11 and Figure 12d indicate that in Case 1-3, the average wind speed during summer stands at 0.83 m/s, with the proportion of calm-wind area accounting for 36.3%, and a wind-speed dispersion of 0.451. Compared to Case 0, under the Case 1-3 scenario, the overall wind environment in the Laozheng Community has been optimized. The average wind speed has increased by 0.01 m/s, and the proportion of calm-wind area has decreased by 1.6%. Additionally, notable changes in the wind environment are evident in the four renovation areas marked by the black circle, where the average wind speed has surged by 0.52 m/s.
Table 12 and Figure 12e indicate that in Case 1-4, the average wind speed during summer stands at 0.83 m/s, with the proportion of calm-wind area accounting for 37.1%, and a wind-speed dispersion of 0.453. Compared to Case 0, under the Case 1-4 scenario, the overall wind environment in the Laozheng Community has been optimized. The average wind speed has increased by 0.01 m/s, and the proportion of calm-wind area has decreased by 0.8%. However, the increase in wind speed has also led to a rise in wind-speed dispersion by 0.002. Additionally, notable changes in the wind environment are evident in the three renovation areas marked by the black circle, where the average wind speed has surged by 0.67 m/s.
Case 2-1 primarily focuses on reducing building density. Table 13 and Figure 12f indicate that during summer, the average wind speed stands at 0.84m/s, with the proportion of calm-wind area accounting for 36.3%, and a wind-speed dispersion of 0.457. Compared to Case 0, under the Case 2-1 scenario, the overall wind environment in the Laozheng Community has been slightly optimized. The average wind speed has increased by 0.02 m/s, and the proportion of calm-wind area has decreased by 1.6%. However, the increase in wind speed has also led to a rise in wind-speed dispersion by 0.006.
Case 2-2 primarily focuses on increasing air-intake volume. Table 14 and Figure 12g indicate that during summer, the average wind speed stands at 0.84 m/s, with the proportion of calm-wind area accounting for 35.9%, and a wind-speed dispersion of 0.454. Compared to Case 0, under the Case 2-2 scenario, the overall wind environment in the Laozheng Community has been optimized. The average wind speed has increased by 0.02 m/s, and the proportion of calm-wind area has decreased by 2%. However, the increase in wind speed has also led to a rise in wind-speed dispersion by 0.003.
Table 15 and Figure 12h indicate that in Case 3, the average wind speed during summer stands at 0.85 m/s, with the proportion of calm-wind area accounting for 35.5%, and a wind-speed dispersion of 0.456. Compared to Case 0, under Case 3 scenario, the average wind speed has increased by 0.03 m/s, and the proportion of calm-wind area has decreased by 2.4%. However, the increase in wind speed has also led to a rise in wind-speed dispersion by 0.005.

4.3. Correlation Analysis

Using the SPSS 27 software for the Shapiro–Wilk normality test and Pearson correlation analysis on six parameters (Table 16) (it is generally considered that |r| ≥ 0.8 indicates a high degree of correlation; 0.5 ≤ |r| < 0.8 suggests a moderate degree of correlation; 0.3 ≤ |r| < 0.5 indicates a low degree of correlation; |r| < 0.3 suggests little to no correlation.), the results indicate the following associations (Table 17): (1) average wind speed ( V ¯ ) exhibits a moderate positive correlation with mean building height (MBH), a moderate negative correlation with building number (BN) (significant level: p < 0.05), and a high negative correlation with building density (BD) (p < 0.01). The correlation coefficients (r) are 0.644, −0.771, and −0.916, respectively; (2) the proportion of calm-wind areas ( P s t a t i c ) demonstrates a low negative correlation with MBH, a moderate positive correlation with BN, and a high positive correlation with BD (p < 0.01). The correlation coefficients are -0.463, 0.657, and 0.894, respectively; (3) wind-speed dispersion ( σ ) shows a moderate positive correlation with MBH, a low negative correlation with BN, and a moderate negative correlation with BD. The correlation coefficients are 0.597, −0.488, and −0.541, respectively.

4.4. Thermal-Environment Simulation Results

Upon completing the parametric simulation of the wind environment, further simulations were conducted to assess the thermal environment of the community under various micro-renovation schemes. The results indicated that although adjustments in community morphology improved the wind environment, the reduction in building density weakened the shading effect, leading to an increase in direct solar radiation reaching the ground and its reflection, which, in turn, exacerbated the thermal environment of the community. Specifically, the thermal environment index UTCI revealed a decrease in the proportion of the “Moderate Heat” (26 °C to 32 °C) range, while the proportion of the “Strong Heat” (32 °C to 38 °C) range increased (Figure 13, notable changes in the thermal environment are evident in the three renovation areas marked by the black circle), suggesting a decline in thermal comfort for outdoor activities.
Previous research has demonstrated that shading facilities can effectively reduce direct solar radiation, thereby lowering outdoor thermal stress and enhancing thermal comfort with minimal impact on the airflow circulation in communities. Consequently, shading structures with a height of 3 m and a thickness of 10 cm were added at renovated locations in each scheme, with their models simplified as rectangular prisms (Figure 14, shading facilities are indicated in black blocks). After conducting a re-simulation, new thermal-environment data and UTCI values were obtained, with specific results presented in the subsequent Figure 15.
Figure 16 reveals that the addition of shading facilities has a positive impact on the thermal environment of the Laozheng Community, resulting in lower thermal stress. It was observed that following the implementation of seven micro-renovation schemes incorporating shading facilities, there was an increase in the proportion of the “Moderate Heat” interval (26 °C to 32 °C), with a minimum increase of 0.7% a maximum increase of 3.1%, and an average increase of 1.47%, as well as a decrease in the proportion of the “Strong Heat” interval (32 °C to 38 °C).

5. Discussion

5.1. Community Morphological Micro-Renovation Schemes

From the above research results and Figure 17, it can be seen that the average wind speed under the seven micro-renewal schemes generally shows an upward trend. The proportion of calm-wind areas generally exhibits a variation trend opposite to that of the average wind speed, while the variation in wind speed dispersion is more irregular, mainly related to the focus of the renovation schemes.
The Level 1 renovation schemes Case 1-1, Case 1-3, and Case 1-4 have optimized the wind environment of the community to a certain extent, while Case 1-2 deteriorated the wind environment. Under the Case 1-1 scenario, due to the removal of certain walls and illegal constructions, there has been an increase in the airflow volume entering the community’s interior, resulting in smoother circulation. Under the Case 1-2 scenario, a large amount of cyclotron airflow will be formed in hollow areas, which is not conducive to the formation of ventilation corridors, resulting in the hollow areas becoming calm-wind areas. Under the Case 1-3 scenario, due to the enlargement of the air inlet, there has been a significant increase in both the volume and speed of the airflow entering the community, facilitating better penetration of the airflow throughout the entire community. Under the Case 1-4 scenario, the removal of obstructions in the dominant summer-wind direction, the increased average distance between the buildings on the south side of the community and the river embankment, and the elevation in the windward pressure of the rear buildings contribute to improved air exchange within the community.
Regarding the Level 2 renovation schemes, both Case 2-1 and Case 2-2 have optimized and improved the community’s wind environment to some extent. However, due to the side effects of the “hollowing” renovation approach, the wind-environment optimization effect of Case 2-1 is not as pronounced as it is in Case 1-1, with the proportion of calm-wind area increasing by 0.2%. The more significant optimization of the community’s wind environment by Case 2-2 is due to the increased airflow entering the community resulting from the enlargement of the air inlet and the expansion of the windward area, enhancing the airflow’s penetration capacity within the internal alleys.
The Level 3 renovation scheme, Case 3, constitutes an overall combination of Level 1 renovation schemes and exhibits the most optimal wind-environment enhancement among the seven schemes. It significantly facilitates airflow penetration and circulation within the community.
It is worth noting that, although the overall improvement in the wind environment of the community ( V ¯ ) is relatively small through different renovation schemes, there is a significant enhancement in the local wind environment within the black circle areas ( V ¯ ). Moreover, these red circle areas are often situated in open spaces or at intersections with high pedestrian traffic, which is of great significance for enhancing the outdoor comfort of community residents.

5.2. Impact of Community Morphology on the Wind Environment

Through the correlation analysis (Table 17), it can be determined that although each morphology indicator is an essential component in simulating urban wind environments, their impact on the community wind environment varies. In terms of MBH, there is no strong correlation between MBH and the three wind-environment indicators. This might be because, while an increase in MBH implies a decrease in BN, the uniformity in building heights within the community, primarily consisting of low-rise buildings, may not significantly increase MBH due to the reduction in BN, weakening its correlation with the wind-environment indicators. Similarly, although a decrease in BN implies a decrease in BD, the varied land use within the community, including residential buildings and spaces for agricultural tools, might not significantly decrease BD with the reduction in BN. Regarding BD, its high correlation with V ¯ and P c a l m indicates its dominant role in influencing the community wind environment. Reducing building density significantly impacts optimizing the community wind environment and reducing the intensity of the heat -island effect. The premise for community renovation and planning should be subsequent operations based on a reasonable building density. That is similar to the research in five climate zones, which claims that reducing BD has a more significant influence on alleviating UHI and can reduce the temperature rise and the duration of the heat-island effect [29]. It’s also noteworthy that σ does not exhibit a strong correlation with morphology indicators. This might be attributed to the complexity of the Laozheng Community’s morphology, where the internal wind distribution is more related to the overall community morphology rather than individual morphology indicators resulting from different renovation schemes. Hence, the correlation between σ and singular morphology indicators decreases.

5.3. Implications for Community Renovation and Planning

Based on the wind-environment simulation results, inspiration can be drawn from the level 1 renovation schemes: In high-density communities, various approaches to reduce building density, such as lowering the enclosure ratio of building groups, are more effective in improving the wind environment compared to increasing the internal space area of building groups. This approach allows for more effective wind penetration into the interior of the Laozheng Community. Further inspiration can be obtained from the level 2 renovation schemes: Enhancing the wind-intake capacity at the community’s entrances is more significant than reducing wind obstruction within the community’s interior. This is in line with the study, which shows that the high-enclosed building layout is more conducive to the penetration of wind in the street canyon, but not conducive to the circulation inside the community. In addition, since the wind is often affected by upwind buildings, resulting in the ability of inward penetration is greatly weakened, so improving the wind-intake capacity of the upwind entrance of the community has greater significance for the overall wind environment. Likewise, insights can be gained from the level 3 renovation schemes: When dealing with community renovation, a single scheme often has limited effectiveness. Considering the complexity of the practical context and the organic integration of multiple community renovation strategies can maximize the optimization benefits for the community’s wind environment.
On the other hand, according to the thermal-environment simulation results, although the wind environment of the Laozheng Community was optimized through micro-renovation, it increased the community’s direct-exposure ratio, leading to increased solar radiation reaching the ground and increased reflection at pedestrian height, worsening the outdoor thermal environment and reducing human thermal comfort. However, by adding shading facilities, the community’s thermal environment was improved, with an increase in the proportion of “Moderate Heat” areas and a decrease in “Strong Heat” areas in the UTCI index, enhancing human thermal comfort without significantly affecting the wind environment.
Moreover, the CIM-WTEPS system used in this study can also be applied to the renovation of other old communities in different cities. By constructing information models for communities and conducting rapid parametric simulations (wind environment, thermal environment, etc.), the study analyzes microclimate changes in communities under different renovation schemes. It explores the coupled relationship between community morphology information and microclimate, which is of significant importance for the future sustainable (re)development of communities to enhance their climate resilience.

5.4. Limitations

(1) The present study did not take into account the energy consumption of buildings, the warming effects of ground-surface radiation, and the cooling effects of trees and water bodies, all of which have a certain impact on the microclimate. These factors will be included in the scope of future research.
(2) Although the measurement dates are representative of the summer heat characteristics, three days of data are insufficient to reflect the comprehensive and diverse climatic characteristics of the community. Future research will extend the data collection period, including measurements across different seasons and over a longer time span.
(3) The simulation study focuses on improving the microclimate comfort of the community in summer through morphological renovation, but this may have different impacts on the climate comfort in other seasons [53,54]. Future research will pay attention to cross-seasonal analysis.

6. Conclusions

This study focuses on the Laozheng Community, located in a climate zone with hot summers and cold winters, employing research methodologies such as field measurements, simulations, and correlation analyses to arrive at the following main conclusions:
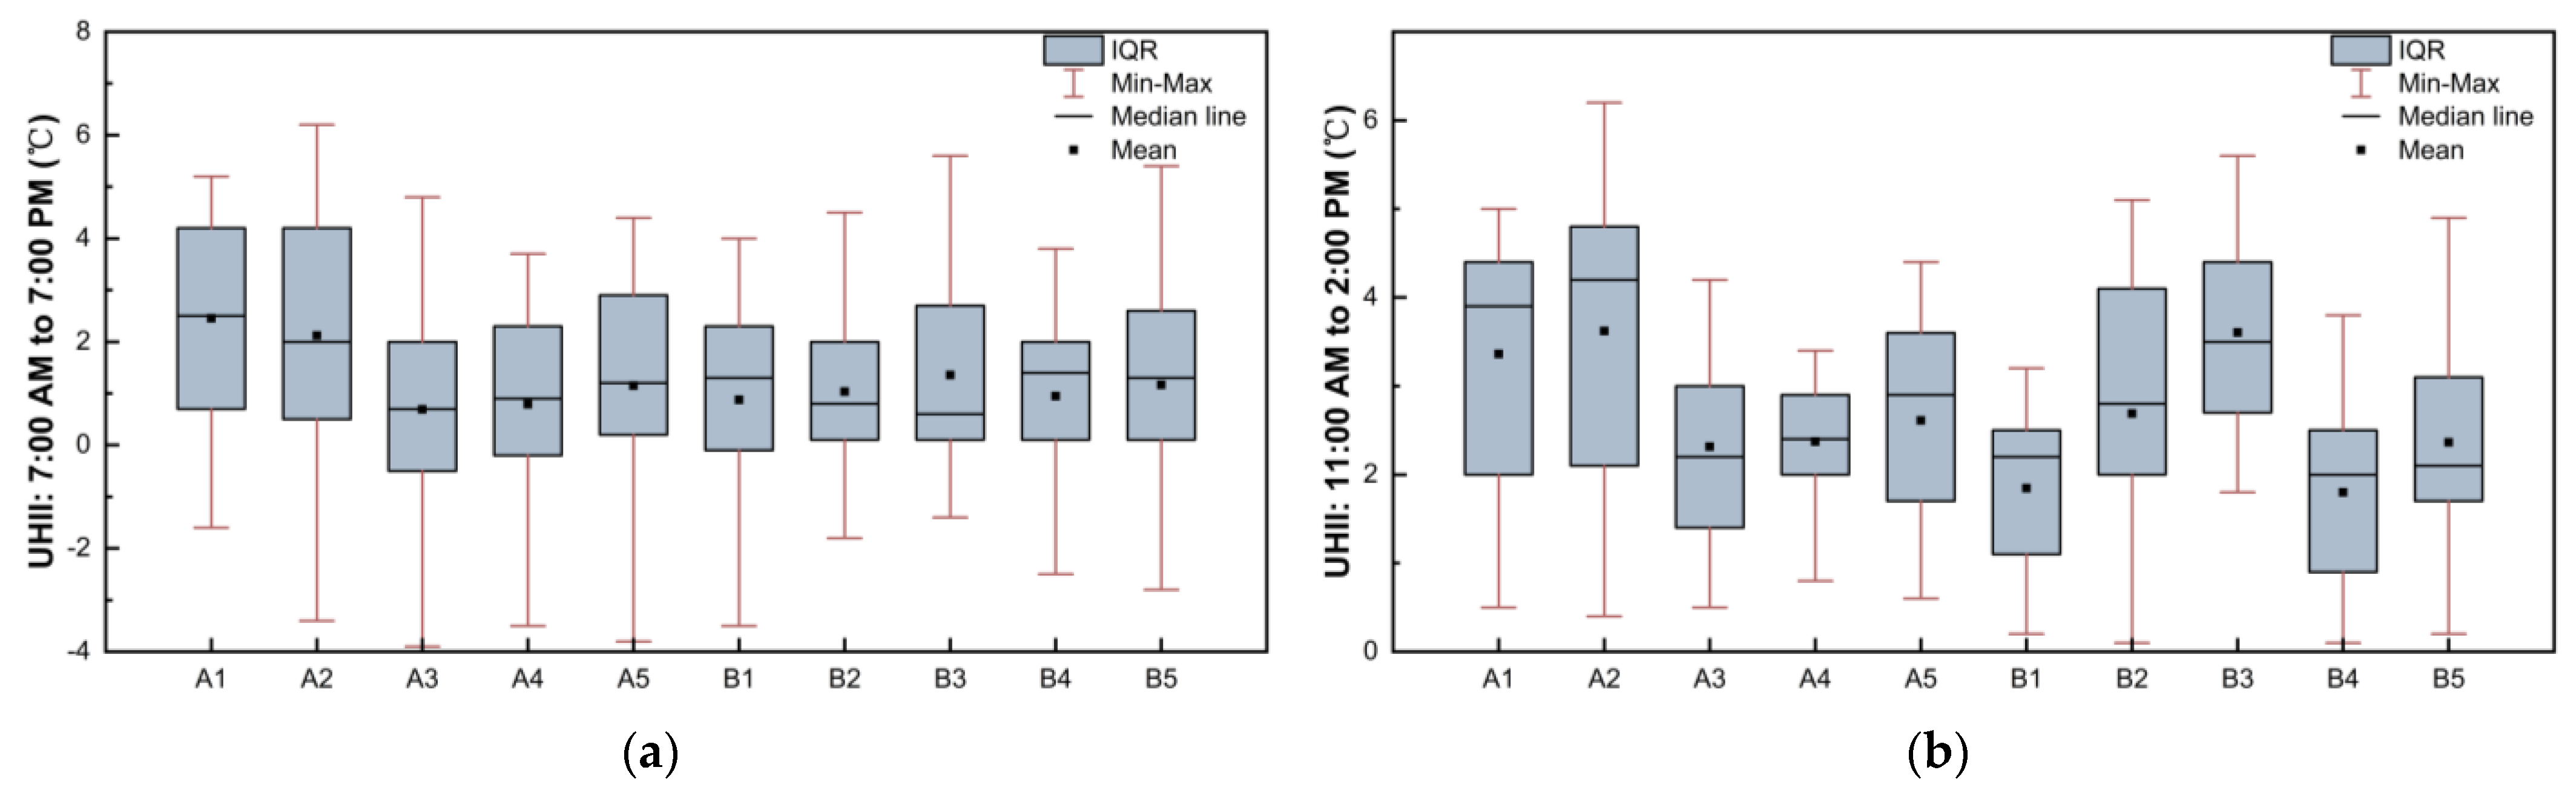
  • The Laozheng Community experiences a relatively serious UHI, with an average UHII of approximately 2 °C and maximum values exceeding 6 °C. Particularly between 11:00 AM to 2:00 PM when all sites are exposed to direct sunlight, the heat-island effect intensifies.
  • The optimization effect of the level 1 schemes ranged from excellent to inferior as follows: “Removing additional objects”, “Increasing the width of air inlet”, “Increasing windward surface”, and “Hollowing”. In the subsequent renovation, attention should be paid to reducing the enclosure ratio of the building group and increasing the wind-intake capacity at the community’s entrances. Flexible selection or combination of renovation schemes should be made to optimize the community morphology, so as to alleviate the wind-environment problems.
  • The correlation analysis between the morphology indicators and the wind-environment indicators indicates that although there are many morphology indicators that affect the community wind environment, building density still plays a dominant role in it. In the subsequent morphology planning of communities, the control of other indicators should be considered on the basis of the low density, and this will have important implications for the sustainable development of the community in the future, making it more climate-resilient.
  • The morphology renovation improves the wind environment, but also increases the thermal stress of the community. However, by adding shading facilities, it is possible to alleviate the thermal-environment issues without affecting the optimization effects of the wind environment, thereby enhancing the outdoor thermal comfort.

Author Contributions

Conceptualization, R.T. and Y.H.; methodology, R.T., Y.H. and W.T.; software, R.T. and X.J.; validation, R.T., Y.H., W.T. and X.J.; data curation, R.T., W.T., X.C. and X.Z.; writing—original draft preparation, R.T. and Y.H.; writing—review and editing, R.T., Y.H. and X.J.; visualization, R.T.; supervision, Y.H.; funding acquisition, Y.H. All authors have read and agreed to the published version of the manuscript.

Funding

This research was funded by the National Natural Science Foundation of China (grant number: 52078193); the Hubei Province Educational Research Project: Research on the Construction of an Integrated “General-Special Fusion” Talent Training Model in Architectural Education Towards the New Engineering (grant number: 2020451); the Construction Project of “Polishing Small Towns” in Dongshi Town, Zhijiang City (grant number: ZJGJS0475-202202-01-2).

Data Availability Statement

The data underlying this article are available in the article.

Acknowledgments

We are grateful to Hubei University of Technology for providing instruments for testing.

Conflicts of Interest

The authors declare no conflicts of interest.

Nomenclature

UHIUrban Heat Island P c a l m Proportion of Calm-Wind Area (%)
UHII Urban   Heat   Island   Intensity   ( ) σ Wind-Speed Dispersion
UTCI Universal   Thermal   Climate   Index   ( )MBHMean Building Height
CIMCommunity Information ModelBNBuilding Number
WTEPSWind- and Thermal-Environment
Parametric Simulation
BDBuilding Density
V ¯ Average Wind Speed (m/s)rCorrelation Coefficient
V ¯ Average Wind Speed in
Renovation Areas (m/s)
pSignificant Level

Appendix A

Figure A1. Workflow of wind-environment parametric simulation.
Buildings 14 00832 g0a1
Figure A2. Workflow of thermal-environment parametric simulation.
Buildings 14 00832 g0a2
Figure A3. Variation trend of air temperature in 11 sites, 3 August 2022.
Buildings 14 00832 g0a3
Table A1. Complete measured data of air temperature in 11 sites, 3 August 2022.
WSA1A2A3A4A5B1B2B3B4
7:0029.830.429.929.930.330.230.630.930.029.6
7:1029.931.029.830.330.230.330.231.831.130.2
7:2030.931.229.930.430.430.629.731.931.130.3
7:3030.832.331.630.130.430.530.931.731.930.5
7:4031.031.731.630.330.530.931.730.931.631.1
7:5032.533.231.931.131.631.331.933.533.131.3
8:0033.334.033.831.431.330.935.335.533.930.8
8:1034.333.433.331.631.932.134.235.334.132.1
8:2035.335.335.232.032.332.131.634.536.031.3
8:3033.835.133.732.332.831.831.833.836.132.9
8:4034.236.736.533.133.435.034.535.035.936.8
8:5036.839.136.335.033.534.633.336.136.437.6
9:0038.937.336.635.034.935.135.137.134.936.9
9:1037.638.338.036.836.236.936.338.336.537.0
9:2035.940.536.637.436.936.035.337.736.335.7
9:3038.838.435.434.435.334.735.937.237.436.9
9:4038.037.036.236.636.236.634.937.237.337.1
9:5037.237.436.135.136.334.934.736.337.636.4
10:0037.741.736.636.136.136.833.838.537.836.1
10:1037.138.938.237.338.137.535.837.838.236.4
10:2036.437.536.736.836.736.834.738.439.937.2
10:3036.439.736.335.436.236.235.238.838.437.9
10:4034.339.536.636.336.735.536.637.639.137.0
10:5035.937.436.837.537.136.335.938.939.037.2
11:0036.838.637.238.038.137.437.938.939.237.7
11:1037.439.937.937.938.238.738.137.539.838.1
11:2036.738.740.039.138.037.738.137.839.436.8
11:3036.939.438.838.838.338.337.139.139.837.6
11:4035.940.241.638.138.738.536.938.940.838.4
11:5035.340.341.539.538.038.737.039.540.937.6
12:0034.739.739.738.337.139.137.438.839.138.5
12:1035.840.240.338.438.238.838.538.839.738.0
12:2035.639.640.137.638.538.637.837.640.637.6
12:3036.640.041.439.038.838.737.939.439.938.6
12:4035.840.039.839.939.038.838.040.340.538.6
12:5036.540.440.738.639.339.438.739.139.738.5
13:0036.241.239.839.239.639.939.440.539.638.7
13:1036.540.742.038.739.640.439.041.640.439.3
13:2037.140.841.540.240.340.939.139.941.139.3
13:3037.441.842.240.040.241.039.640.540.939.1
13:4038.139.439.339.240.140.340.340.242.039.6
13:5039.239.741.440.641.441.240.240.341.039.7
14:0038.940.741.040.341.140.641.539.841.539.9
14:1040.040.442.842.140.941.943.039.542.140.3
14:2040.640.342.341.641.541.644.639.341.140.0
14:3040.842.042.841.742.041.642.139.741.540.3
14:4039.242.743.440.742.043.442.739.741.840.3
14:5039.242.243.641.041.942.643.240.143.140.2
15:0039.740.140.940.341.841.342.939.239.940.8
15:1040.440.042.240.442.742.041.638.939.941.5
15:2039.444.043.141.941.541.841.940.839.242.2
15:3038.843.744.542.642.542.142.438.739.540.9
15:4039.944.241.740.042.942.843.040.839.641.4
15:5039.243.844.844.042.642.141.039.439.441.4
16:0039.143.443.641.641.642.241.539.539.140.6
16:1039.042.144.242.640.242.440.439.139.240.7
16:2038.943.944.439.638.742.541.339.638.840.7
16:3039.143.143.038.738.541.142.238.538.740.6
16:4038.643.143.538.038.841.840.138.438.740.6
16:5038.243.042.038.938.341.340.538.738.640.9
17:0038.642.441.738.138.041.140.839.138.340.4
17:1037.842.142.738.638.040.340.138.638.140.1
17:2037.541.240.938.237.839.040.638.037.939.5
17:3038.041.140.137.938.138.239.737.937.939.5
17:4037.441.040.537.637.638.037.937.437.739.3
17:5037.540.339.937.637.737.837.237.937.639.1
18:0036.739.939.137.437.537.638.037.137.038.5
18:1036.939.538.836.537.337.136.937.136.838.0
18:2036.538.536.836.836.736.936.237.036.638.1
18:3035.937.936.436.636.636.835.836.836.337.7
18:4035.237.236.336.136.236.535.536.436.137.4
18:5035.235.335.735.936.136.035.435.735.736.6
19:0034.634.635.535.835.935.735.235.635.535.8

References

  1. Oke, T.R. City Size and the Urban Heat Island. Atmos. Environ. 1973, 7, 769–779. [Google Scholar] [CrossRef]
  2. Grimm, N.B.; Faeth, S.H.; Golubiewski, N.E.; Redman, C.L.; Wu, J.; Bai, X.; Briggs, J.M. Global Change and the Ecology of Cities. Science 2008, 319, 756–760. [Google Scholar] [CrossRef]
  3. Wong, L.P.; Alias, H.; Aghamohammadi, N.; Aghazadeh, S.; Nik Sulaiman, N.M. Urban Heat Island Experience, Control Measures and Health Impact: A Survey among Working Community in the City of Kuala Lumpur. Sustain. Cities Soc. 2017, 35, 660–668. [Google Scholar] [CrossRef]
  4. Ward, K.; Lauf, S.; Kleinschmit, B.; Endlicher, W. Heat Waves and Urban Heat Islands in Europe: A Review of Relevant Drivers. Sci. Total Environ. 2016, 569–570, 527–539. [Google Scholar] [CrossRef]
  5. Ebi, K.L.; Capon, A.; Berry, P.; Broderick, C.; De Dear, R.; Havenith, G.; Honda, Y.; Kovats, R.S.; Ma, W.; Malik, A.; et al. Hot Weather and Heat Extremes: Health Risks. Lancet 2021, 398, 698–708. [Google Scholar] [CrossRef]
  6. Li, G.; Zhou, M.; Cai, Y.; Zhang, Y.; Pan, X. Does Temperature Enhance Acute Mortality Effects of Ambient Particle Pollution in Tianjin City, China. Sci. Total Environ. 2011, 409, 1811–1817. [Google Scholar] [CrossRef]
  7. Guan, W.-J.; Zheng, X.-Y.; Chung, K.F.; Zhong, N.-S. Impact of Air Pollution on the Burden of Chronic Respiratory Diseases in China: Time for Urgent Action. Lancet 2016, 388, 1939–1951. [Google Scholar] [CrossRef]
  8. Zhao, Q.; Sailor, D.J.; Wentz, E.A. Impact of Tree Locations and Arrangements on Outdoor Microclimates and Human Thermal Comfort in an Urban Residential Environment. Urban For. Urban Green. 2018, 32, 81–91. [Google Scholar] [CrossRef]
  9. El-Bardisy, W.M.; Fahmy, M.; El-Gohary, G.F. Climatic Sensitive Landscape Design: Towards a Better Microclimate through Plantation in Public Schools, Cairo, Egypt. Procedia-Soc. Behav. Sci. 2016, 216, 206–216. [Google Scholar] [CrossRef]
  10. Maggiotto, G.; Buccolieri, R.; Santo, M.A.; Leo, L.S.; Di Sabatino, S. Validation of Temperature-Perturbation and CFD-Based Modelling for the Prediction of the Thermal Urban Environment: The Lecce (IT) Case Study. Environ. Model. Softw. 2014, 60, 69–83. [Google Scholar] [CrossRef]
  11. Yang, X.; Li, Y. The Impact of Building Density and Building Height Heterogeneity on Average Urban Albedo and Street Surface Temperature. Build. Environ. 2015, 90, 146–156. [Google Scholar] [CrossRef]
  12. Takebayashi, H.; Senoo, M. Analysis of the Relationship between Urban Size and Heat Island Intensity Using WRF Model. Urban Clim. 2018, 24, 287–298. [Google Scholar] [CrossRef]
  13. Liu, L.; Lin, Y.; Liu, J.; Wang, L.; Wang, D.; Shui, T.; Chen, X.; Wu, Q. Analysis of Local-Scale Urban Heat Island Characteristics Using an Integrated Method of Mobile Measurement and GIS-Based Spatial Interpolation. Build. Environ. 2017, 117, 191–207. [Google Scholar] [CrossRef]
  14. Ng, E.; Yuan, C.; Chen, L.; Ren, C.; Fung, J.C.H. Improving the Wind Environment in High-Density Cities by Understanding Urban Morphology and Surface Roughness: A Study in Hong Kong. Landsc. Urban Plan. 2011, 101, 59–74. [Google Scholar] [CrossRef]
  15. Kolokotsa, D.; Psomas, A.; Karapidakis, E. Urban Heat Island in Southern Europe: The Case Study of Hania, Crete. Sol. Energy 2009, 83, 1871–1883. [Google Scholar] [CrossRef]
  16. Oke, T.R. Street Design and Urban Canopy LayerClimate; Elsevier: Amsterdam, The Netherlands, 1988. [Google Scholar]
  17. Achour-Younsi, S.; Kharrat, F. Outdoor Thermal Comfort: Impact of the Geometry of an Urban Street Canyon in a Mediterranean Subtropical Climate—Case Study Tunis, Tunisia. Procedia-Soc. Behav. Sci. 2016, 216, 689–700. [Google Scholar] [CrossRef]
  18. Krüger, E.; Givoni, B. Outdoor Measurements and Temperature Comparisons of Seven Monitoring Stations: Preliminary Studies in Curitiba, Brazil. Build. Environ. 2007, 42, 1685–1698. [Google Scholar] [CrossRef]
  19. Yu, Z.; Chen, S.; Wong, N.H.; Ignatius, M.; Deng, J.; He, Y.; Hii, D.J.C. Dependence between Urban Morphology and Outdoor Air Temperature: A Tropical Campus Study Using Random Forests Algorithm. Sustain. Cities Soc. 2020, 61, 102200. [Google Scholar] [CrossRef]
  20. Yang, F.; Qian, F.; Lau, S.S.Y. Urban Form and Density as Indicators for Summertime Outdoor Ventilation Potential: A Case Study on High-Rise Housing in Shanghai. Build. Environ. 2013, 70, 122–137. [Google Scholar] [CrossRef]
  21. He, B.-J.; Ding, L.; Prasad, D. Outdoor Thermal Environment of an Open Space under Sea Breeze: A Mobile Experience in a Coastal City of Sydney, Australia. Urban Clim. 2020, 31, 100567. [Google Scholar] [CrossRef]
  22. Lan, Y.; Zhan, Q. How Do Urban Buildings Impact Summer Air Temperature? The Effects of Building Configurations in Space and Time. Build. Environ. 2017, 125, 88–98. [Google Scholar] [CrossRef]
  23. Zhao, C.; Fu, G.; Liu, X.; Fu, F. Urban Planning Indicators, Morphology and Climate Indicators: A Case Study for a North-South Transect of Beijing, China. Build. Environ. 2011, 46, 1174–1183. [Google Scholar] [CrossRef]
  24. Wu, C.; Xia, L.; Lin, Y.; Wang, Y.; Gong, Y.; Zhang, W. Analysis on Characteristics of Thermal Environments in Typical Residential Districts and Its Influencing Factors in Shenzhen. J. Harbin Inst. Technol. 2015, 47, 59–62. [Google Scholar] [CrossRef]
  25. Yang, F.; Lau, S.S.Y.; Qian, F. Urban Design to Lower Summertime Outdoor Temperatures: An Empirical Study on High-Rise Housing in Shanghai. Build. Environ. 2011, 46, 769–785. [Google Scholar] [CrossRef]
  26. Perini, K.; Magliocco, A. Effects of Vegetation, Urban Density, Building Height, and Atmospheric Conditions on Local Temperatures and Thermal Comfort. Urban For. Urban Green. 2014, 13, 495–506. [Google Scholar] [CrossRef]
  27. Sattar, A.M.A.; Elhakeem, M.; Gerges, B.N.; Gharabaghi, B.; Gultepe, I. Wind-Induced Air-Flow Patterns in an Urban Setting: Observations and Numerical Modeling. Pure Appl. Geophys. 2018, 175, 3051–3068. [Google Scholar] [CrossRef]
  28. Mei, S.-J.; Hu, J.-T.; Liu, D.; Zhao, F.-Y.; Li, Y.; Wang, Y.; Wang, H.-Q. Wind Driven Natural Ventilation in the Idealized Building Block Arrays with Multiple Urban Morphologies and Unique Package Building Density. Energy Build. 2017, 155, 324–338. [Google Scholar] [CrossRef]
  29. Liu, Y.; Li, Q.; Yang, L.; Mu, K.; Zhang, M.; Liu, J. Urban Heat Island Effects of Various Urban Morphologies under Regional Climate Conditions. Sci. Total Environ. 2020, 743, 140589. [Google Scholar] [CrossRef] [PubMed]
  30. HU, Y.; LIU, Z.; TAN, H. Multi-Parameter Impact on Wind Environment of Residential District. Build. Sci. 2020, 33, 108–114. [Google Scholar] [CrossRef]
  31. Wei, C.; Li, Z. Research on Local Reconstruction Strategy of Old City Blocks from the Perspective of Wind and Heat Environment: A Case Study of Huoqiu Road in Hefei City. Hous. Ind. 2022, 1, 48–53. [Google Scholar]
  32. Zheng, J.; Wang, G. Application and Optimization of Microclimate Environment Simulation in Traditional Street Renewal: A Case Study of Baogongfu Street in Zhaoqing City. Planners 2019, 35, 79–86. [Google Scholar]
  33. Peng, C.; Zou, Z.; Hong, L.; Pan, Q. Numerical Simulation of Wind and Thermal Environment in Inner Cities and Strategies for Partial Renewal: A Case Study of Dazhimen, Wuhan. City Plan. Rev. 2016, 40, 16–24. [Google Scholar]
  34. Li, N.; Guo, Z.; Geng, W.; Li, L.; Li, Z. Design Strategies for Renovation of Public Space in Beijing’s Traditional Communities Based on Measured Microclimate and Thermal Comfort. Sustain. Cities Soc. 2023, 99, 104927. [Google Scholar] [CrossRef]
  35. Memon, R.A.; Leung, D.Y.; Liu, C.-H. An Investigation of Urban Heat Island Intensity (UHII) as an Indicator of Urban Heating. Atmos. Res. 2009, 94, 491–500. [Google Scholar] [CrossRef]
  36. He, B.-J.; Ding, L.; Prasad, D. Relationships among Local-Scale Urban Morphology, Urban Ventilation, Urban Heat Island and Outdoor Thermal Comfort under Sea Breeze Influence. Sustain. Cities Soc. 2020, 60, 102289. [Google Scholar] [CrossRef]
  37. Liu, X.; Wang, W.; Wang, Z.; Song, J.; Li, K. Simulation Study on Outdoor Wind Environment of Residential Complexes in Hot-Summer and Cold-Winter Climate Zones Based on Entropy-Based TOPSIS Method. Sustainability 2023, 15, 12480. [Google Scholar] [CrossRef]
  38. Bröde, P.; Fiala, D.; Błażejczyk, K.; Holmér, I.; Jendritzky, G.; Kampmann, B.; Tinz, B.; Havenith, G. Deriving the Operational Procedure for the Universal Thermal Climate Index (UTCI). Int. J. Biometeorol. 2012, 56, 481–494. [Google Scholar] [CrossRef]
  39. Ge, Q.; Kong, Q.; Xi, J.; Zheng, J. Application of UTCI in China from Tourism Perspective. Theor. Appl. Clim. 2017, 128, 551–561. [Google Scholar] [CrossRef]
  40. Fiala, D.; Havenith, G.; Bröde, P.; Kampmann, B.; Jendritzky, G. UTCI-Fiala Multi-Node Model of Human Heat Transfer and Temperature Regulation. Int. J. Biometeorol. 2012, 56, 429–441. [Google Scholar] [CrossRef]
  41. Zheng, Z.; Zhou, W.; Wang, J.; Hu, X.; Qian, Y. Sixty-Year Changes in Residential Landscapes in Beijing: A Perspective from Both the Horizontal (2D) and Vertical (3D) Dimensions. Remote Sens. 2017, 9, 992. [Google Scholar] [CrossRef]
  42. Zheng, Z.; Zhou, W.; Yan, J.; Qian, Y.; Wang, J.; Li, W. The Higher, the Cooler? Effects of Building Height on Land Surface Temperatures in Residential Areas of Beijing. Phys. Chem. Earth Parts A/B/C 2019, 110, 149–156. [Google Scholar] [CrossRef]
  43. Tian, Y.; Zhou, W.; Qian, Y.; Zheng, Z.; Yan, J. The Effect of Urban 2D and 3D Morphology on Air Temperature in Residential Neighborhoods. Landsc. Ecol. 2019, 34, 1161–1178. [Google Scholar] [CrossRef]
  44. Zhang, J.; Li, Z.; Hu, D. Effects of Urban Morphology on Thermal Comfort at the Micro-Scale. Sustain. Cities Soc. 2022, 86, 104150. [Google Scholar] [CrossRef]
  45. blueCFD. Available online: Https://Bluecfd.Github.Io/Core/ (accessed on 27 January 2024).
  46. Hadianpour, M.; Mahdavinejad, M.; Bemanian, M.; Haghshenas, M.; Kordjamshidi, M. Effects of Windward and Leeward Wind Directions on Outdoor Thermal and Wind Sensation in Tehran. Build. Environ. 2019, 150, 164–180. [Google Scholar] [CrossRef]
  47. Xiao, W.; Zhong, W.; Wu, H.; Zhang, T. Multiobjective Optimization of Daylighting, Energy, and Thermal Performance for Form Variables in Atrium Buildings in China’s Hot Summer and Cold Winter Climate. Energy Build. 2023, 297, 113476. [Google Scholar] [CrossRef]
  48. Guo, A.; Yue, W.; Yang, J.; Li, M.; Xie, P.; He, T.; Zhang, M.; Yu, H. Quantifying the Impact of Urban Ventilation Corridors on Thermal Environment in Chinese Megacities. Ecol. Indic. 2023, 156, 111072. [Google Scholar] [CrossRef]
  49. JGJ/T449-2018; Green Performance Calculation Standard for Civil Buildings. China Building Industry Press: Beijing, China, 2018.
  50. Hammond, D.S.; Chapman, L.; Thornes, J.E. Roughness Length Estimation along Road Transects Using Airborne LIDAR Data. Meteorol. Appl. 2012, 19, 420–426. [Google Scholar] [CrossRef]
  51. Qiu, Y.; He, Y.; Li, M.; Zhu, X. A Generalization of Building Clusters in an Urban Wind Field Simulated by CFD. Atmosphere 2023, 15, 9. [Google Scholar] [CrossRef]
  52. Launder, B.E. Numerical Computation of Convective Heat Transfer in Complex Turbulent Flows: Time to Abandon Wall Functions? Int. J. Heat Mass Transf. 1984, 27, 1485–1491. [Google Scholar] [CrossRef]
  53. Jamei, E.; Rajagopalan, P.; Seyedmahmoudian, M.; Jamei, Y. Review on the Impact of Urban Geometry and Pedestrian Level Greening on Outdoor Thermal Comfort. Renew. Sustain. Energy Rev. 2016, 54, 1002–1017. [Google Scholar] [CrossRef]
  54. Lai, D.; Liu, W.; Gan, T.; Liu, K.; Chen, Q. A Review of Mitigating Strategies to Improve the Thermal Environment and Thermal Comfort in Urban Outdoor Spaces. Sci. Total Environ. 2019, 661, 337–353. [Google Scholar] [CrossRef] [PubMed]
Figure 1. Core workflow of the CIM-WTEPS System.
Buildings 14 00832 g001
Figure 2. Study area.
Buildings 14 00832 g002
Figure 3. Road network of the Laozheng Community.
Buildings 14 00832 g003
Figure 4. Selection of measurement sites and layout of instruments.
Buildings 14 00832 g004
Figure 5. Core workflow of the WTEPS module.
Buildings 14 00832 g005
Figure 6. Models.
Figure 6. Models.
Buildings 14 00832 g006aBuildings 14 00832 g006b
Figure 7. Basis for selection: (a) Topographic feature; (b) Urban development level—Zhijiang City; (c) Urban development level—Jingzhou City.
Buildings 14 00832 g007
Figure 8. Calculation-area boundary: (a) Top view; (b) Right view.
Buildings 14 00832 g008
Figure 9. Comparison of accuracy under different grid sizes.
Buildings 14 00832 g009
Figure 10. Variation trend of measured data and simulated data.
Buildings 14 00832 g010
Figure 11. Spatial distribution characteristics of UHII at different time periods: (a) UHII within the community: 7:00 AM to 7:00 PM; (b) UHII within the community: 11:00 AM to 2:00 PM.
Buildings 14 00832 g011
Figure 12. Wind-environment parametric simulation results (wind-speed distribution).
Buildings 14 00832 g012aBuildings 14 00832 g012b
Figure 13. Thermal-environment parametric simulation results (UTCI distribution).
Buildings 14 00832 g013aBuildings 14 00832 g013b
Figure 14. Models with shading facilities.
Buildings 14 00832 g014aBuildings 14 00832 g014b
Figure 15. Thermal-environment parametric simulation results with shading facilities.
Buildings 14 00832 g015aBuildings 14 00832 g015b
Figure 16. Variation trend of thermal-environment indicators: (a) Proportion of “Moderate Heat” areas without shading facilities; (b) “Strong Heat” areas without shading facilities; (c) “Moderate Heat” areas with shading facilities; (d) “Strong Heat” areas with shading facilities.
Buildings 14 00832 g016
Figure 17. Variation trend of wind-environment indicators: (a) Average wind speed; (b) Proportion of calm wind area; (c) Wind speed dispersion.
Buildings 14 00832 g017aBuildings 14 00832 g017b
Table 1. Measuring Instrument.
PictureModelParameterRangeResolutionAccuracy
Buildings 14 00832 i001TES-1341NWind Speed0~30 m/s0.01 m/s ± 3%
Airflow0~999900 m 3 /min0.001 m 3 /min
Relative
Humidity
10~95% RH0.1% RH ± 3%
(25 °C, 20~80% RH)
Air
Temperature
−10~60 °C0.1 °C ± 0.4 °C
Wet Bulb
Temperature
5~60 °C0.1 °CCalculated Value
Dew Point
Temperature
−15~49 °C0.1 °C
Note: Recording model—Automatic memory; Automatic memory interval—10 min; Automatic memory capacity—5 × 99 sets.
Table 2. Information of measurement sites.
SiteLocationSurface MaterialAmbience
WSRoofResin tileH = 20 m, open.
A1Jinshi RoadBrickGreen plants
A2Jinshi RoadAsphaltBuildings and street trees
A3Jinshi RoadAsphaltBuildings and street trees
A4Jinshi RoadAsphaltBuildings and street trees
A5Jinshi RoadAsphaltBuildings and street trees
B1Down StreetCementBuildings
B2Down StreetCementBuildings and green spaces
B3Down StreetCementBuildings and green spaces
B4Down StreetCementBuildings and trees
B5Down StreetCementBuildings and green spaces
Table 3. Degrees centigrade ranges and stress categories of the UTCI [40].
RangeStress Level
UTCI < −40 °CExtreme Cold
−40 °C ≤ UTCI < −27 °CVery Strong Cold
−27 °C ≤ UTCI < −13 °CStrong Cold
−13 °C ≤ UTCI < 0 °CModerate Cold
0 °C ≤ UTCI < 9 °CSlightly Cold
9 °C ≤ UTCI < 26 °CNo Thermal Stress
26 °C ≤ UTCI < 32 °CModerate Heat
32 °C ≤ UTCI < 38 °CStrong Heat
38 °C ≤ UTCI < 46 °CVery Strong Heat
UTCI ≥ 46 °CExtreme Heat
Table 4. Basic information of micro-renovation schemes.
LevelCaseMicro-Renovation ContentExplanation
Control
group
0——Current situation of the Laozheng Community
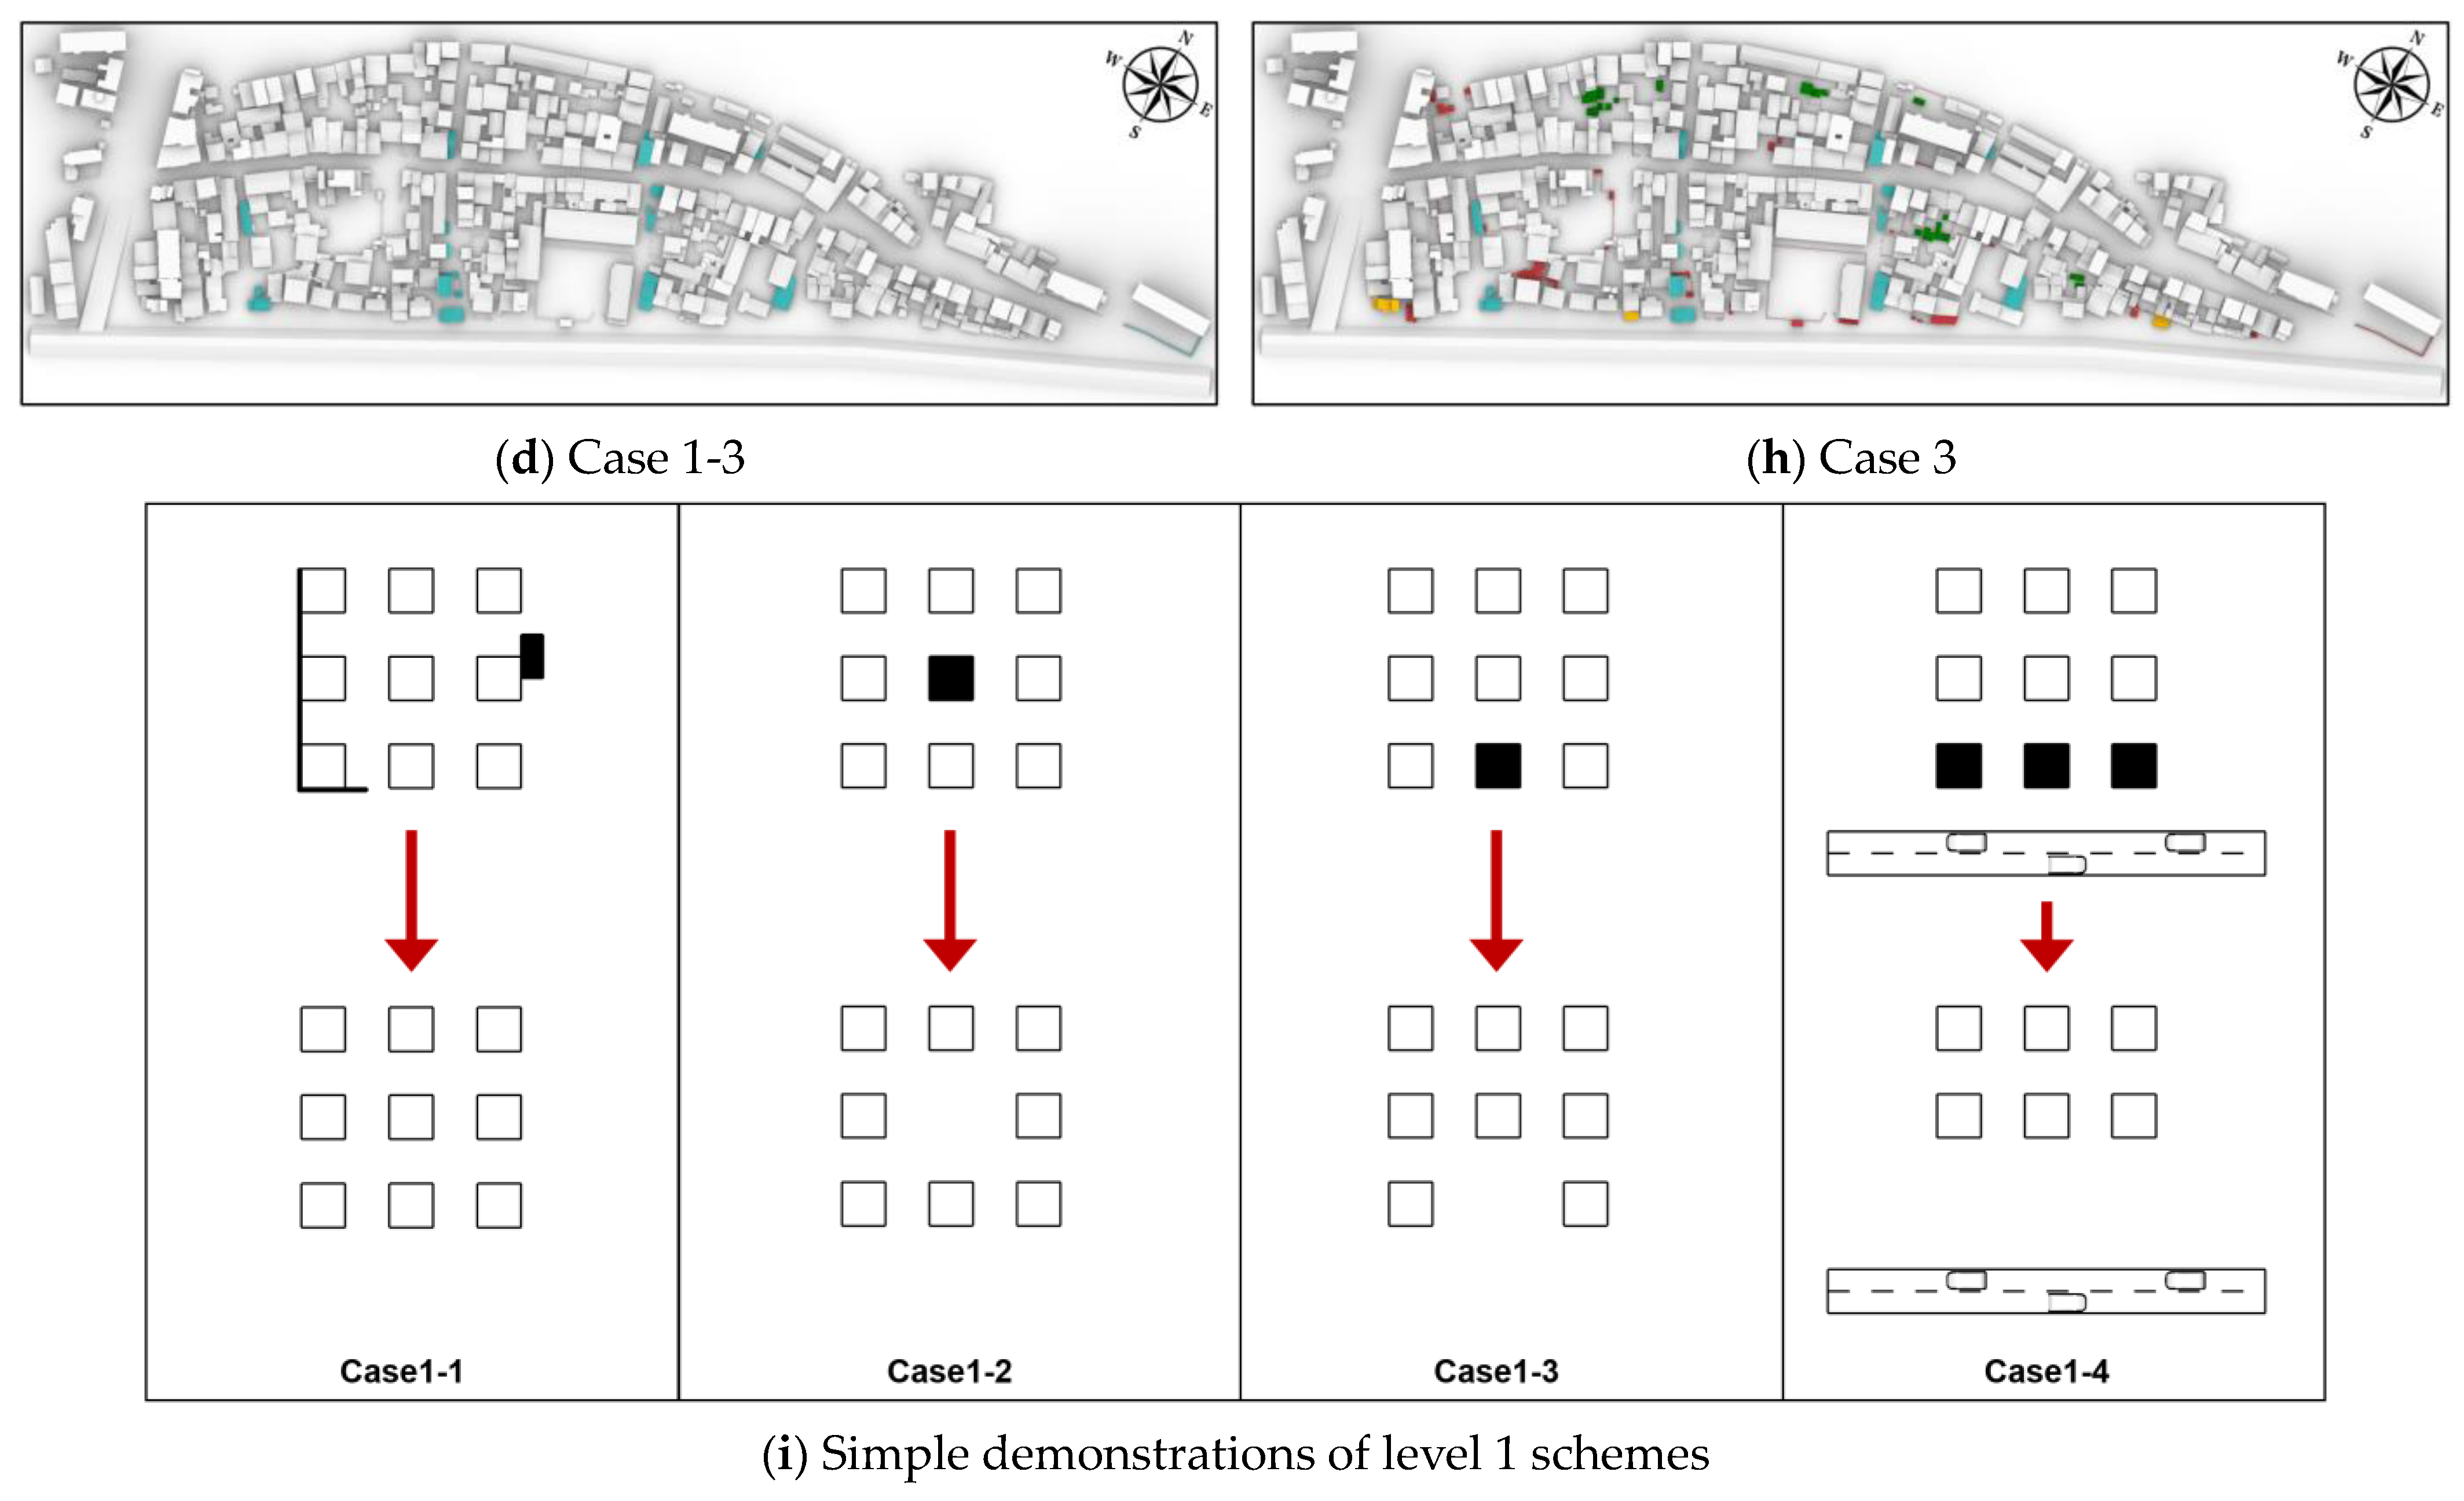
Level 11-1Removing additional objectsOn the basis of maintaining the integrity of the original texture of the community, the scheme partially removed additional objects (including walls with no heritage protection value and additional buildings) inside the community.
1-2HollowingThe scheme removed part of the buildings inside building clusters to form a “hollow” space.
1-3Increasing the
width of air inlet
The scheme removed part of the building at the entrance of the main roadway inside the community, and the average width of multiple alley air inlet increased by 8.6m.
1-4Increasing the
windward area
The scheme removed part of the shield on the dominant summer-wind direction, and the average distance between the southern buildings and the Yanjiang Road has increased by 4.9 m.
Level 22-1Case 1-1 + Case 1-2Focus on reducing airflow obstruction
2-2Case 1-3 + Case 1-4Focus on increasing air intake volume
Level 33Case 1-1 + Case 1-2 +
Case 1-3 + Case 1-4
——
Table 5. CIMs.
Table 5. CIMs.
CaseMBHBNBD
05.49 m41951.7%
1-15.55 m40849.9%
1-25.60 m40150.8%
1-35.53 m40449.4%
1-45.51 m41150.1%
2-15.68 m39048.6%
2-25.54 m39548.7%
35.74 m36647.4%
Table 6. Parameters of simulation pre-setting.
ParameterInputParametric Module
Wind Speed3 m/sBuildings 14 00832 i002
Wind DirectionS (0,1,0)
Roughness6Buildings 14 00832 i003
Calculation Area
Boundary
5H × 5H × 5H × 10HBuildings 14 00832 i004
Grid SizeCell_size = 2
(Surface_Feature_Level = 3)
Buildings 14 00832 i005
Iterations1000Buildings 14 00832 i006
Turbulence ModelRNG K-epsilonBuildings 14 00832 i007
Convergence Criterion 10 4 Buildings 14 00832 i008
Governing Equations u i x i = 0
u x j = P x j + x j [ v + v t u i x j ] + x j [ v u i x j ]
k x j = x j [ v + v f δ k k x j ] + v t [ u i x j + u j x i ] u j x i ε
u j z x j = x j [ v + v t δ k ε x j ] + C 1 ε k v t [ u i x j + u j x j ] u i x i C 2 ε 2 k + R
R = C μ η 3 ( 1 η η 0 ) ε 4 ( 1 + β η 3 ) k
( C μ = 0.085, C 1 = 1.42, C 2 = 1.68, δ k = 0.72, η 0 = 4.38, β = 0.015.)
Table 7. Average wind speed of five measurement sites.
B1B2B3B4B5
Measured Data1.35 m/s0.51 m/s0.73 m/s1.68 m/s0.9 m/s
Simulated Data1.28 m/s0.47 m/s0.69 m/s1.63 m/s0.89 m/s
Absolute Error5.2%7.8%5.8%3%6.3%
Table 8. Wind-environment indicators of Case 0.
V ¯ P s t a t i c σ
0.8237.9%0.451
Table 9. Wind-environment indicators of Case 1-1.
Case V ¯ V ¯ V ¯ P c a l m P c a l m σ σ
1-10.84+0.02+0.7336.1%−1.8%0.458+0.007
00.8237.9%0.451
Table 10. Wind-environment indicators of Case 1-2.
Case V ¯ V ¯ V ¯ P c a l m P c a l m σ σ
1-20.820038.1%+0.2%0.453+0.002
00.8237.9%0.451
Table 11. Wind-environment indicators of Case 1-3.
Case V ¯ V ¯ V ¯ P c a l m P c a l m σ σ
1-30.83+0.01+0.5236.3%−1.6%0.4510
00.8237.9%0.451
Table 12. Wind-environment indicators of Case 1-4.
Case V ¯ V ¯ V ¯ P c a l m P c a l m σ σ
1-40.83+0.01+0.6737.1%−0.8%0.453+0.002
00.8237.9%0.451
Table 13. Wind-environment indicators of Case 2-1.
Case V ¯ V ¯ V ¯ P c a l m P c a l m σ σ
2-10.84+0.02+0.3736.3%−1.6%0.457+0.006
00.8237.9%0.451
Table 14. Wind-environment indicators of Case 2-2.
Case V ¯ V ¯ V ¯ P c a l m P c a l m σ σ
2-20.84+0.02+0.5635.9%−2%0.454+0.003
00.8237.9%0.451
Table 15. Wind-environment indicators of Case 3.
Case V ¯ V ¯ V ¯ P c a l m P c a l m σ σ
30.85+0.03+0.4235.5%−2.4%0.456+0.005
00.8237.9%0.451
Table 16. Morphology indicators and wind-environment indicators.
CaseMBHBNBD V ¯ P c a l m σ
05.49 m41951.7%0.82 m/s37.9%0.451
1-15.55 m40849.9%0.84 m/s36.1%0.458
1-25.60 m40150.8%0.82 m/s38.1%0.453
1-35.53 m40449.4%0.83 m/s36.3%0.451
1-45.51 m41150.1%0.83 m/s37.1%0.453
2-15.68 m39048.6%0.84 m/s36.3%0.457
2-25.54 m39548.7%0.84 m/s35.9%0.454
35.74 m36647.4%0.85 m/s35.5%0.456
Table 17. Correlations.
MBHBNBD V ¯ P c a l m σ
MBHr——
BNr−0.917 **——
p0.001
BDr−0.738 *0.892 **——
p0.0370.003
V ¯ r0.644−0.771 *−0.916 **——
p0.0850.0250.001
P s t a t i c r−0.4630.6570.894 **−0.944 **——
p0.2480.0770.003 < 0.001
σ r0.597−0.488−0.5410.745 *−0.578——
p0.1180.2200.1660.0340.133
** Correlation is significant at the 0.01 level (2-tailed). * Correlation is significant at the 0.05 level (2-tailed).
Disclaimer/Publisher’s Note: The statements, opinions and data contained in all publications are solely those of the individual author(s) and contributor(s) and not of MDPI and/or the editor(s). MDPI and/or the editor(s) disclaim responsibility for any injury to people or property resulting from any ideas, methods, instructions or products referred to in the content.

