
Strategic Integration of a Vegetative Component on a Metal Roof Base: An Evaluation of Its Impacts on Thermal and Acoustic Performance in the Tropics

 ,
,  ,
,  ,
, 
Abstract
:1. Introduction

| Discussion Aspect | Reference | Assessed Element(s) | Climate | Method(s) of Assessment | Main Performance Indicators |
|---|---|---|---|---|---|
| Thermal | [14] | Green roof system; RC roof system | Tropical | Simulations | Roof thermal transfer Value (RTTV) and overall thermal transfer value (OTTV) |
| [4] | Green roof plant species | Tropical | Field measurement | Surface and ambient temperature (°C) | |
| [15] | Green roof system | Tropical | Field measurement, interview, and case study | Roof surface temperature, analysis of interviewees’ responses | |
| [16] | Green roof system with mineral wool substrate | Sub-tropical | Field measurement | Roof surface temperature, reduction in conductive heat flow, and delayed heat transfer | |
| [17] | Intensive and extensive green roof systems | Sub-tropical | Field measurement | Roof surface temperature, roof heat flux, and cooling/heating load | |
| [18] | Green roof system | Irrelevant | Simulations | Energy performance of simulated green roofs using leaf area index, plant height, and soil thickness | |
| [19] | Extensive green roof system | Sub-tropical | Simulations and field measurement | Maximum and minimum indoor temperature | |
| [20] | Extensive green roof system | Tropical | Field measurement | Roof surface temperature, ambient temperature, and temperature reduction | |
| Acoustic | [8] | Windows | Temperate | Field measurement | Sound level differences between outdoors and indoors |
| [9] | Green roof system | Temperate | Field measurement | Sound transmission loss of roof system |
2. Literature Review
3. Methodology
3.1. Test Module and Sensor Set-Up
3.2. Thermal Performance Test
3.3. Air-Borne Acoustic Performance Test
4. Results and Discussion
4.1. Thermal Performance Test
4.2. Air-Borne Acoustic Performance Test
5. Conclusions
Author Contributions
Funding
Data Availability Statement
Acknowledgments
Conflicts of Interest
References
- Perivoliotis, D.; Arvanitis, I.; Tzavali, A.; Papakostas, V.; Kappou, S.; Andreakos, G.; Fotiadi, A.; Paravantis, J.A.; Souliotis, M.; Mihalakakou, G. Sustainable Urban Environment through Green Roofs: A Literature Review with Case Studies. Sustainability 2023, 15, 15976. [Google Scholar] [CrossRef]
- Li, W.C.; Yeung, K.K.A. A Comprehensive Study of Green Roof Performance from Environmental Perspective. Int. J. Sustain. Built Environ. 2014, 3, 127–134. [Google Scholar] [CrossRef]
- MacIvor, J.S.; Lundholm, J. Performance Evaluation of Native Plants Suited to Extensive Green Roof Conditions in a Maritime Climate. Ecol. Eng. 2011, 37, 407–417. [Google Scholar] [CrossRef]
- Nyuk Hien, W.; Puay Yok, T.; Yu, C. Study of Thermal Performance of Extensive Rooftop Greenery Systems in the Tropical Climate. Build. Environ. 2007, 42, 25–54. [Google Scholar] [CrossRef]
- Del Rey, R.; Alba, J.; Bertó, L.; Gregori, A. Small-Sized Reverberation Chamber for the Measurement of Sound Absorption. Mater. Constr. 2017, 67, 139. [Google Scholar] [CrossRef]
- Bradley, D.T.; Müller-Trapet, M.; Adelgren, J.; Vorländer, M. Effect of Boundary Diffusers in a Reverberation Chamber: Standardized Diffuse Field Quantifiers. J. Acoust. Soc. Am. 2014, 135, 1898–1906. [Google Scholar] [CrossRef] [PubMed]
- Bastos, L.P.; da Silva Vieira de Melo, G.; Soeiro, N.S. Panels Manufactured from Vegetable Fibers: An Alternative Approach for Controlling Noises in Indoor Environments. Adv. Acoust. Vib. 2012, 2012, 698737. [Google Scholar] [CrossRef]
- Locher, B.; Piquerez, A.; Habermacher, M.; Ragettli, M.; Röösli, M.; Brink, M.; Cajochen, C.; Vienneau, D.; Foraster, M.; Müller, U.; et al. Differences between Outdoor and Indoor Sound Levels for Open, Tilted, and Closed Windows. Int. J. Environ. Res. Public. Health 2018, 15, 149. [Google Scholar] [CrossRef]
- Connelly, M.; Hodgson, M. Experimental Investigation of the Sound Transmission of Vegetated Roofs. Appl. Acoust. 2013, 74, 1136–1143. [Google Scholar] [CrossRef]
- Jamaludin, S.; Jemain, A.A. Fitting Daily Rainfall Amount in Malaysia Using the Normal Transform Distribution. J. Appl. Sci. 2007, 7, 1880–1886. [Google Scholar]
- Malaysian Metrological Department Malaysia’s Climate (Rainfall Distribution). Available online: https://www.met.gov.my/en/pendidikan/iklim-malaysia/#Rainfall%20distribution (accessed on 15 November 2023).
- Connelly, M.; Hodgson, M. Thermal and Acoustical Performance of Green Roofs. In Proceedings of the Sixth Annual Greening Rooftops for Sustainable Communities Conference, Awards & Trade Show, Vancouver, BC, Canada, 30 April–2 May 2008. [Google Scholar]
- Hui, S.C.M. Study of Thermal and Energy Performance of Green Roof Systems; University of Hong Kong: Hong Kong, China, 2009; p. 71. [Google Scholar]
- Yuliani, S.; Hardiman, G.; Setyowati, E. A comparison of heat performance between green roofs on concrete and green roofs on corrugated zinc. Dimensi J. Archit. Built Environ. 2021, 47, 55–64. [Google Scholar] [CrossRef]
- Abdul Rahman, A.; Mohamed Zaid, S.; Mohammad Shuhaimi, N.D.A. Effects of Green Roof in Reducing Surface Temperature and Addressing Urban Heat Island in Tropical Climate of Malaysia. J. Des. Built Environ. 2022, 22, 1–20. [Google Scholar] [CrossRef]
- Kostadinović, D.; Jovanović, M.; Bakić, V.; Stepanić, N.; Todorović, M. Experimental Investigation of Summer Thermal Performance of the Green Roof System with Mineral Wool Substrate. Build. Environ. 2022, 217, 109061. [Google Scholar] [CrossRef]
- Peng, L.L.H.; Yang, X.; He, Y.; Hu, Z.; Xu, T.; Jiang, Z.; Yao, L. Thermal and Energy Performance of Two Distinct Green Roofs: Temporal Pattern and Underlying Factors in a Subtropical Climate. Energy Build. 2019, 185, 247–258. [Google Scholar] [CrossRef]
- Zeng, C.; Bai, X.; Sun, L.; Zhang, Y.; Yuan, Y. Optimal Parameters of Green Roofs in Representative Cities of Four Climate Zones in China: A Simulation Study. Energy Build. 2017, 150, 118–131. [Google Scholar] [CrossRef]
- Yıldırım, S.; Özburak, Ç.; Özden, Ö. Green Roofs, Vegetation Types, Impact on the Thermal Effectiveness: An Experimental Study in Cyprus. Sustainability 2023, 15, 2807. [Google Scholar] [CrossRef]
- Ávila-Hernández, A.; Simá, E.; Xamán, J.; Hernández-Pérez, I.; Téllez-Velázquez, E.; Chagolla-Aranda, M.A. Test Box Experiment and Simulations of a Green-Roof: Thermal and Energy Performance of a Residential Building Standard for Mexico. Energy Build. 2020, 209, 109709. [Google Scholar] [CrossRef]
- Rahman, S.R.A.; Ahmad, H.; Rosley, M.S.F. Green Roof: Its Awareness Among Professionals and Potential in Malaysian Market. Procedia—Soc. Behav. Sci. 2013, 85, 443–453. [Google Scholar] [CrossRef]
- Pratama, H.C.; Sinsiri, T.; Chapirom, A. Green Roof Development in ASEAN Countries: The Challenges and Perspectives. Sustainability 2023, 15, 7714. [Google Scholar] [CrossRef]
- Town and Country Planning Department Malaysia. Garis Panduan Perancangan Taman Atas Bumbung; Jabatan Perancangan Bandar dan Desa Semenanjung Malaysia, Kementerian Perumahan dan Kerajaan Tempatan: Putrajaya, Malaysia, 2012; ISBN 978-983-2839-29-3. [Google Scholar]
- Housing Development (Control and Licensing) Regulations 1989; International Law Book Series: Petaling Jaya, Malaysia, 2021; p. 127.
- Mahdiyar, A.; Mohandes, S.R.; Durdyev, S.; Tabatabaee, S.; Ismail, S. Barriers to Green Roof Installation: An Integrated Fuzzy-Based MCDM Approach. J. Clean. Prod. 2020, 269, 122365. [Google Scholar] [CrossRef]
- Mirnezhad, M.; Aminudin, A.M.R.; Yeap, K.S. Thermal Performance and Temperature Mitigation towards Application of Green Roof in Tropical Climate. Chem. Eng. Trans. 2017, 56, 397–402. [Google Scholar] [CrossRef]
- Jim, C.Y.; Peng, L.L.H. Substrate Moisture Effect on Water Balance and Thermal Regime of a Tropical Extensive Green Roof. Ecol. Eng. 2012, 47, 9–23. [Google Scholar] [CrossRef]
- Mohapatra, S.; Verma, S.; Chowdhury, S.; Dwivedi, G.; Harish, V.S.K.V. A Critical Appraisal of Green Vegetated Roofs: Energy and Environment in Focus. Mater. Today Proc. 2021, 46, 5703–5710. [Google Scholar] [CrossRef]
- Wong, N.H.; Cheong, D.K.W.; Yan, H.; Soh, J.; Ong, C.L.; Sia, A. The Effects of Rooftop Garden on Energy Consumption of a Commercial Building in Singapore. Energy Build. 2003, 35, 353–364. [Google Scholar] [CrossRef]
- Mahmoodzadeh, M.; Mukhopadhyaya, P.; Valeo, C. Effects of Extensive Green Roofs on Energy Performance of School Buildings in Four North American Climates. Water 2019, 12, 6. [Google Scholar] [CrossRef]
- Lokesh, S.; Kadiwal, N.; Chandrashekar, R.; Pai, A.; Kumar, B. Heat Transfer Study of Green Roof in Warm and Humid Climatic Conditions. Mater. Today Proc. 2023, 92, 327–337. [Google Scholar] [CrossRef]
- Gagliano, A.; Nocera, F.; Detommaso, M.; Evola, G. Thermal Behavior of an Extensive Green Roof: Numerical Simulations and Experimental Investigations. Int. J. Heat Technol. 2016, 34, S226–S234. [Google Scholar] [CrossRef]
- Abuseif, M.; Gou, Z. A Review of Roofing Methods: Construction Features, Heat Reduction, Payback Period and Climatic Responsiveness. Energies 2018, 11, 3196. [Google Scholar] [CrossRef]
- Qin, X.; Wu, X.; Chiew, Y.-M.; Li, Y. A Green Roof Test Bed for Stormwater Management and Reduction of Urban Heat Island Effect in Singapore. Br. J. Environ. Clim. Chang. 2013, 2, 410–420. [Google Scholar] [CrossRef]
- Squier, M.; Davidson, C.I. Heat Flux and Seasonal Thermal Performance of an Extensive Green Roof. Build. Environ. 2016, 107, 235–244. [Google Scholar] [CrossRef]
- Chen, N.; Deng, Q.; Chen, Q.; Wang, Z. Green Roof Heat Transfer Coefficient Measurement and Impact of Plant Species and Moisture. Energy Build. 2024, 303, 113805. [Google Scholar] [CrossRef]
- Issa, R.J.; Leitch, K.; Chang, B. Experimental Heat Transfer Study on Green Roofs in a Semiarid Climate during Summer. J. Constr. Eng. 2015, 2015, 960538. [Google Scholar] [CrossRef]
- MS 1525-2019; Energy Efficiency and Use of Renewable Energy for Non Residential Buildings—Code of Practice (3rd Revision). Department of Standards Malaysia: Cyberjaya, Malaysia, 2019.
- UBBL Uniform Building By-Laws 1984 (Amendment 2021); International Law Book Series: Petaling Jaya, Malaysia, 2021; p. 36.
- Bronzaft, A.L.; Hagler, L. Noise: The Invisible Pollutant That Cannot Be Ignored. In Emerging Environmental Technologies; Shah, V., Ed.; Springer: Dordrecht, The Netherlands, 2010; Volume II, pp. 75–96. ISBN 978-90-481-3351-2. [Google Scholar]
- Kaltenbach, M.; Maschke, C.; Klinke, R. Health Consequences of Aircraft Noise. Dtsch. Ärztebl. Int. 2008, 105, 548–556. [Google Scholar] [CrossRef] [PubMed]
- Idris, M.F.M.; Musa, M.M.; Ayob, S.M. Noise Generated by Raindrop on Metal Deck Roof Profiles: It’s Effect towards People Activities. Procedia—Soc. Behav. Sci. 2012, 36, 485–492. [Google Scholar] [CrossRef]
- Van Renterghem, T. Green Roofs for Acoustic Insulation and Noise Reduction. In Nature Based Strategies for Urban and Building Sustainability; Elsevier: Amsterdam, The Netherlands, 2018; pp. 167–179. ISBN 978-0-12-812150-4. [Google Scholar]
- Galbrun, L.; Scerri, L. Sound Insulation of Lightweight Extensive Green Roofs. Build. Environ. 2017, 116, 130–139. [Google Scholar] [CrossRef]
- López-Silva, D.V.; Méndez-Alonzo, R.; Sauceda-Carvajal, D.; Sigala-Meza, E.; Zavala-Guillén, I. Experimental Comparison of Two Extensive Green Roof Designs in Northwest Mexico. Build. Environ. 2022, 226, 109722. [Google Scholar] [CrossRef]
- Malaysian Metrological Department Malaysia’s Climate (Temperature Distribution). Available online: https://www.met.gov.my/en/pendidikan/iklim-malaysia/#Temperature%20distribution%20 (accessed on 15 November 2023).
- Abdi, H. The Kendall Rank Correlation Coefficient. In Encyclopedia of Measurement and Statistics; Sage: Thousand Oaks, CA, USA, 2007. [Google Scholar]
- Woolson, R.F. Wilcoxon Signed-Rank Test. In Wiley Encyclopedia of Clinical Trials; D’Agostino, R.B., Sullivan, L., Massaro, J., Eds.; Wiley: Hoboken, NJ, USA, 2008; pp. 1–3. ISBN 978-0-471-35203-7. [Google Scholar]
- Shapiro, S.S.; Wilk, M.B. An Analysis of Variance Test for Normality (Complete Samples). Biometrika 1965, 52, 591–611. [Google Scholar] [CrossRef]
- Levene, H. Robust Tests for Equality of Variances. In Contributions to Probability and Statistics; Stanford University Press: Palo Alto, CA, USA, 1960; pp. 278–292. [Google Scholar]
- McKight, P.E.; Najab, J. Kruskal-Wallis Test. In The Corsini Encyclopedia of Psychology; Weiner, I.B., Craighead, W.E., Eds.; Wiley: Hoboken, NJ, USA, 2010; p. 1. ISBN 978-0-470-17024-3. [Google Scholar]
- MS 2680:2017; Energy Efficiency and Use of Renewable Energy for Residential Buildings. Department of Standards Malaysia: Cyberjaya, Malaysia, 2017.
- Hendricks, R.L.; Barnard, J.R. Thermal Conductivity of Bermuda Grass and Other Turfgrasses. ASHRAE Trans. 2002, 108, 67–76. [Google Scholar]
- Hendricks, R.L.; Barnard, J.R. Thermal Conductivity of Potting Mixes. HortScience 2002, 37, 225–227. [Google Scholar]
- Singh, R.M.; Bouazza, A. Thermal Conductivity of Geosynthetics. Geotext. Geomembr. 2013, 39, 1–8. [Google Scholar] [CrossRef]
- Jerman, M.; Černý, R. Effect of Moisture Content on Heat and Moisture Transport and Storage Properties of Thermal Insulation Materials. Energy Build. 2012, 53, 39–46. [Google Scholar] [CrossRef]
- Abdou, A.; Budaiwi, I. The Variation of Thermal Conductivity of Fibrous Insulation Materials under Different Levels of Moisture Content. Constr. Build. Mater. 2013, 43, 533–544. [Google Scholar] [CrossRef]
- Muller, S.R.; Hall, C.A. Comparison of Thermal Conductivity of Root Shield Membranes Using Steady-State Heat Transfer Methods. HortScience 2013, 48, 1134–1138. [Google Scholar]
- Incropera, F.P.; DeWitt, D.P.; Bergman, T.L.; Lavine, A.S. Fundamentals of Heat and Mass Transfer; John Wiley Sons: Hoboken, NJ, USA, 2013. [Google Scholar]
- American Society of Heating, Refrigerating and Air-Conditioning Engineers, Inc. (ASHRAE). 2009 ASHRAE Handbook—Fundamentals; American Society of Heating, Refrigerating and Air-Conditioning Engineers: Atlanta, GA, USA, 2009, 2009; ISBN 978-1-61583-001-5. [Google Scholar]
- Almeida, R.; Simões, N.; Tadeu, A.; Palha, P.; Almeida, J. Thermal Behaviour of a Green Roof Containing Insulation Cork Board. An Experimental Characterization Using a Bioclimatic Chamber. Build. Environ. 2019, 160, 106179. [Google Scholar] [CrossRef]
- He, Y.; Yu, H.; Dong, N.; Ye, H. Thermal and Energy Performance Assessment of Extensive Green Roof in Summer: A Case Study of a Lightweight Building in Shanghai. Energy Build. 2016, 127, 762–773. [Google Scholar] [CrossRef]


| Roof Type | Document | |
|---|---|---|
| UBBL [39] | MS1525:2019 [38] | |
| Light-weight roof | ||
| Definition | Below 50 kg/m2 | Non-concrete roof construction |
| Maximum U-Value | 0.4 W/m2K | 0.4 W/m2K |
| Heavy-weight roof | ||
| Definition | Above 50 kg/m2 | Concrete roof construction |
| Maximum U-value | 0.6 W/m2K | 0.6 W/m2K |
| Thermal Performance Field Measurement Settings | |
|---|---|
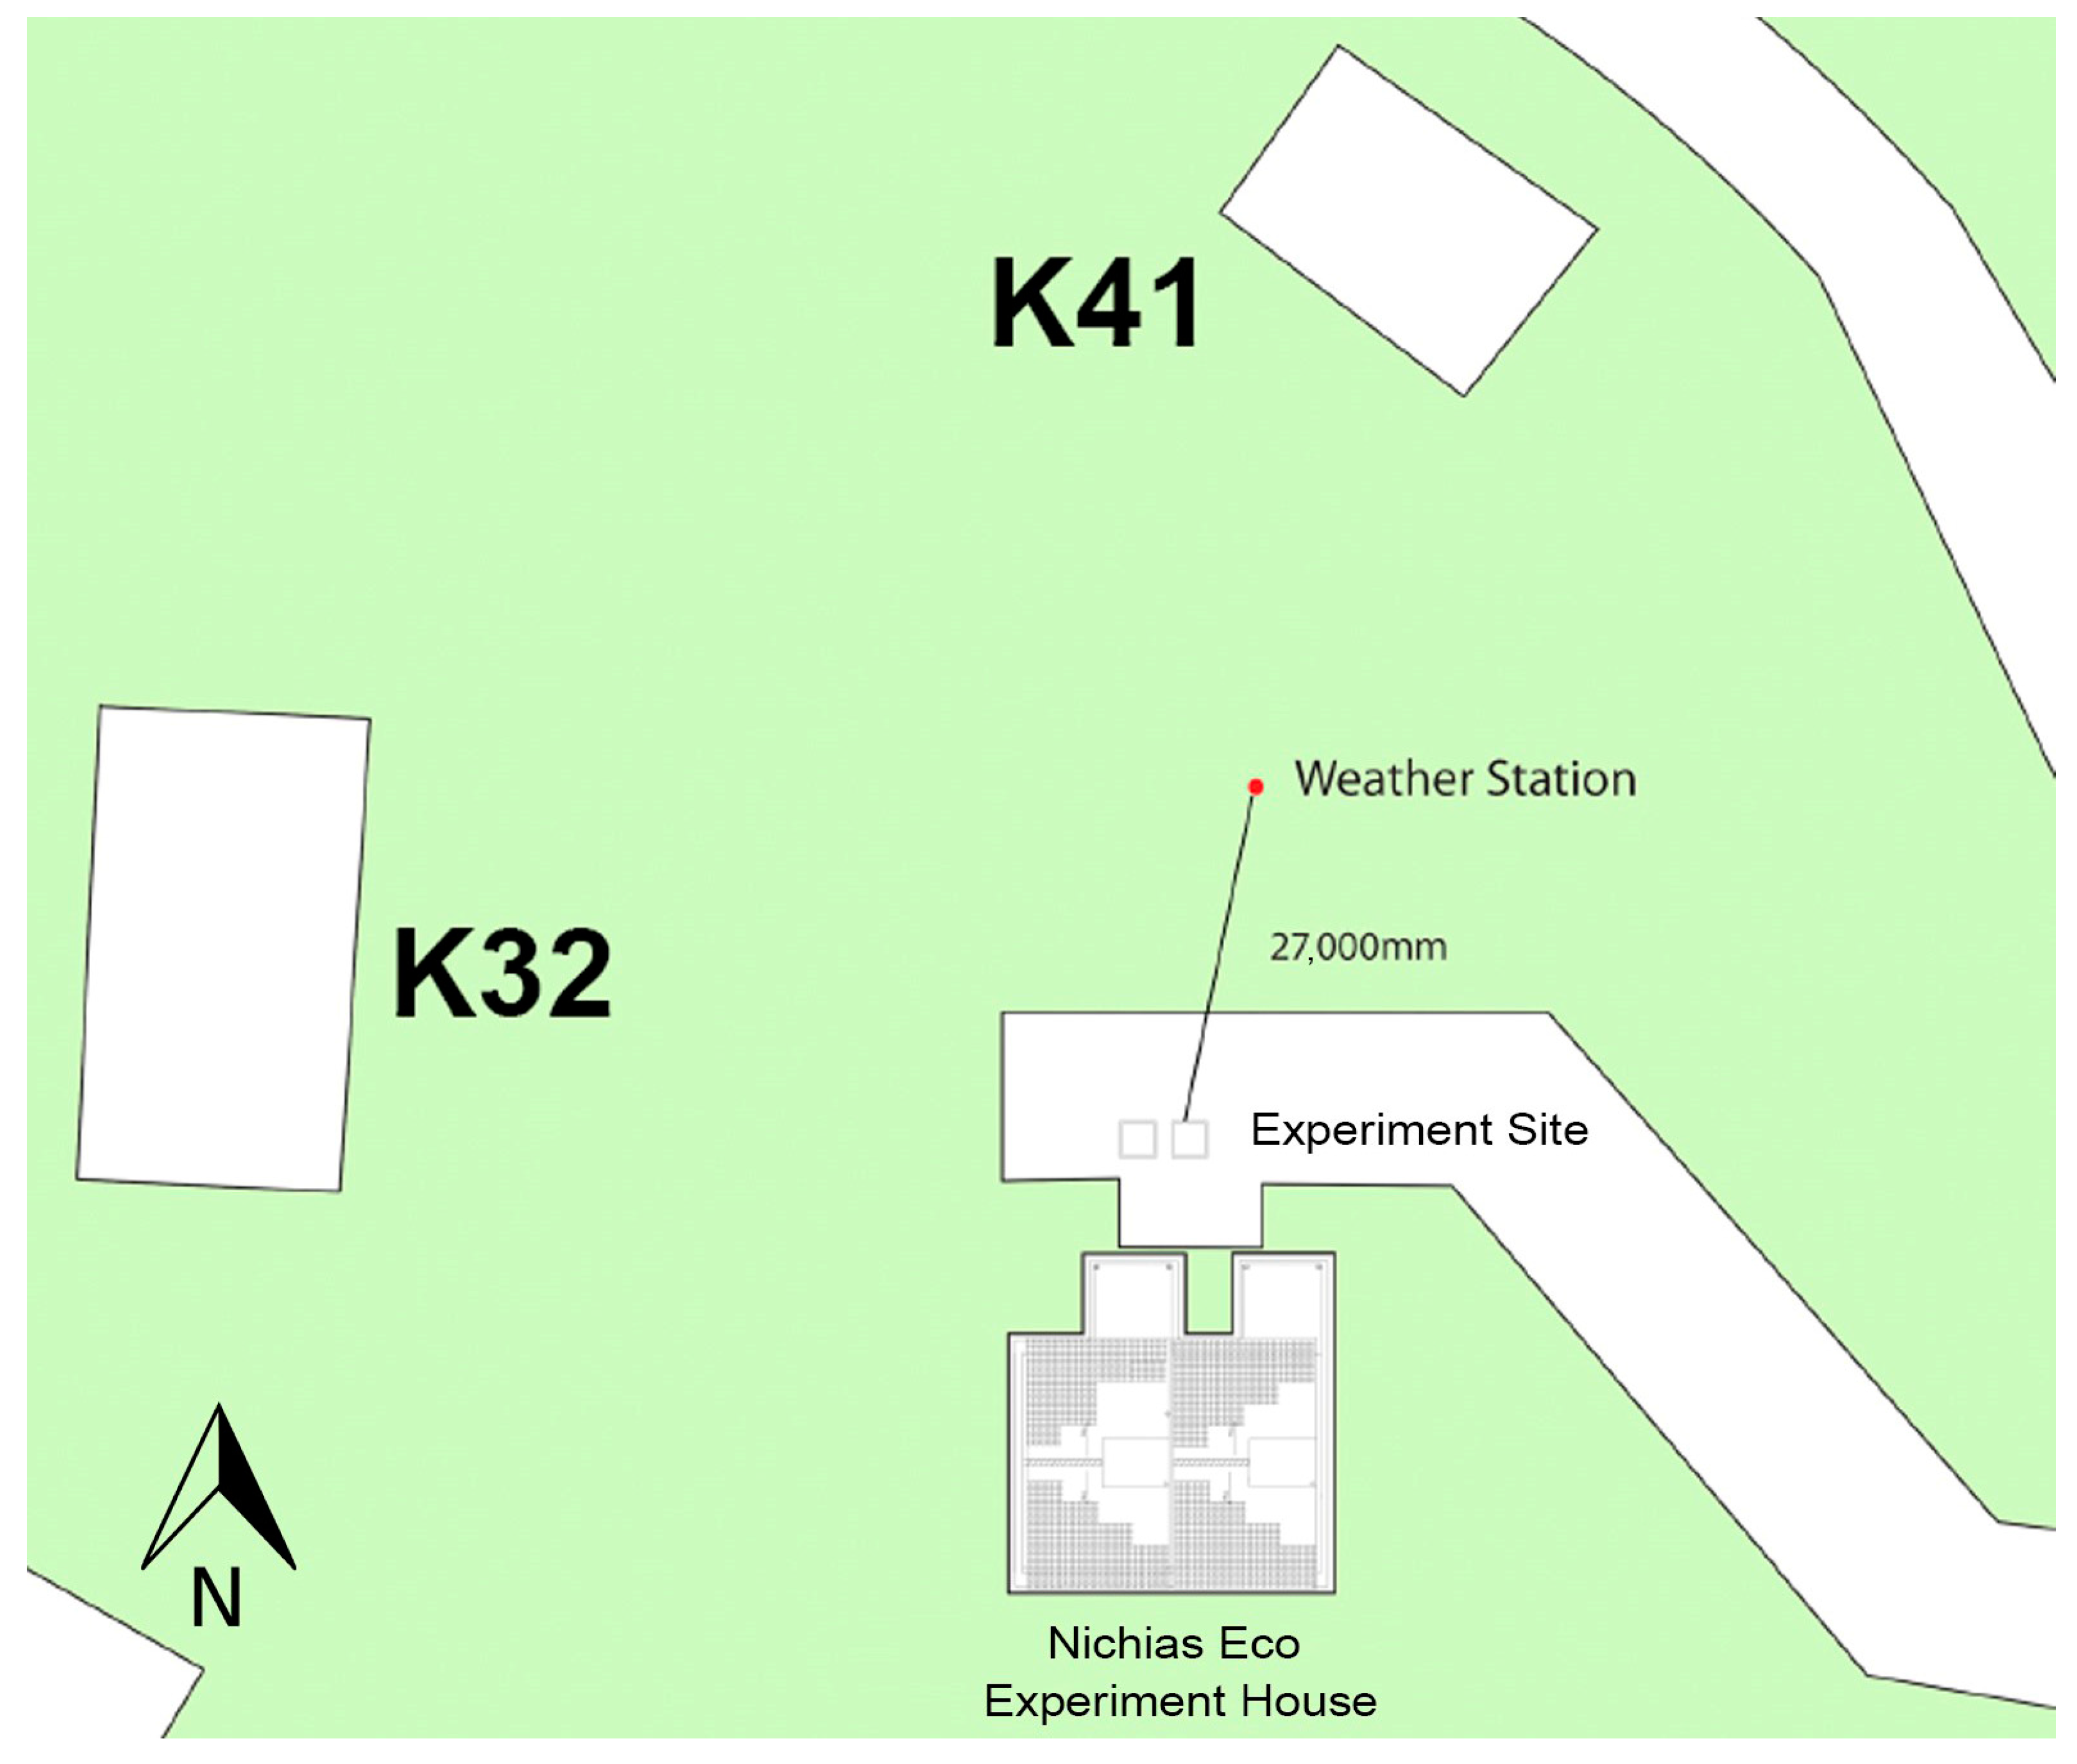
| HOBO U30 outdoor weather station | 27 m from roof modules |
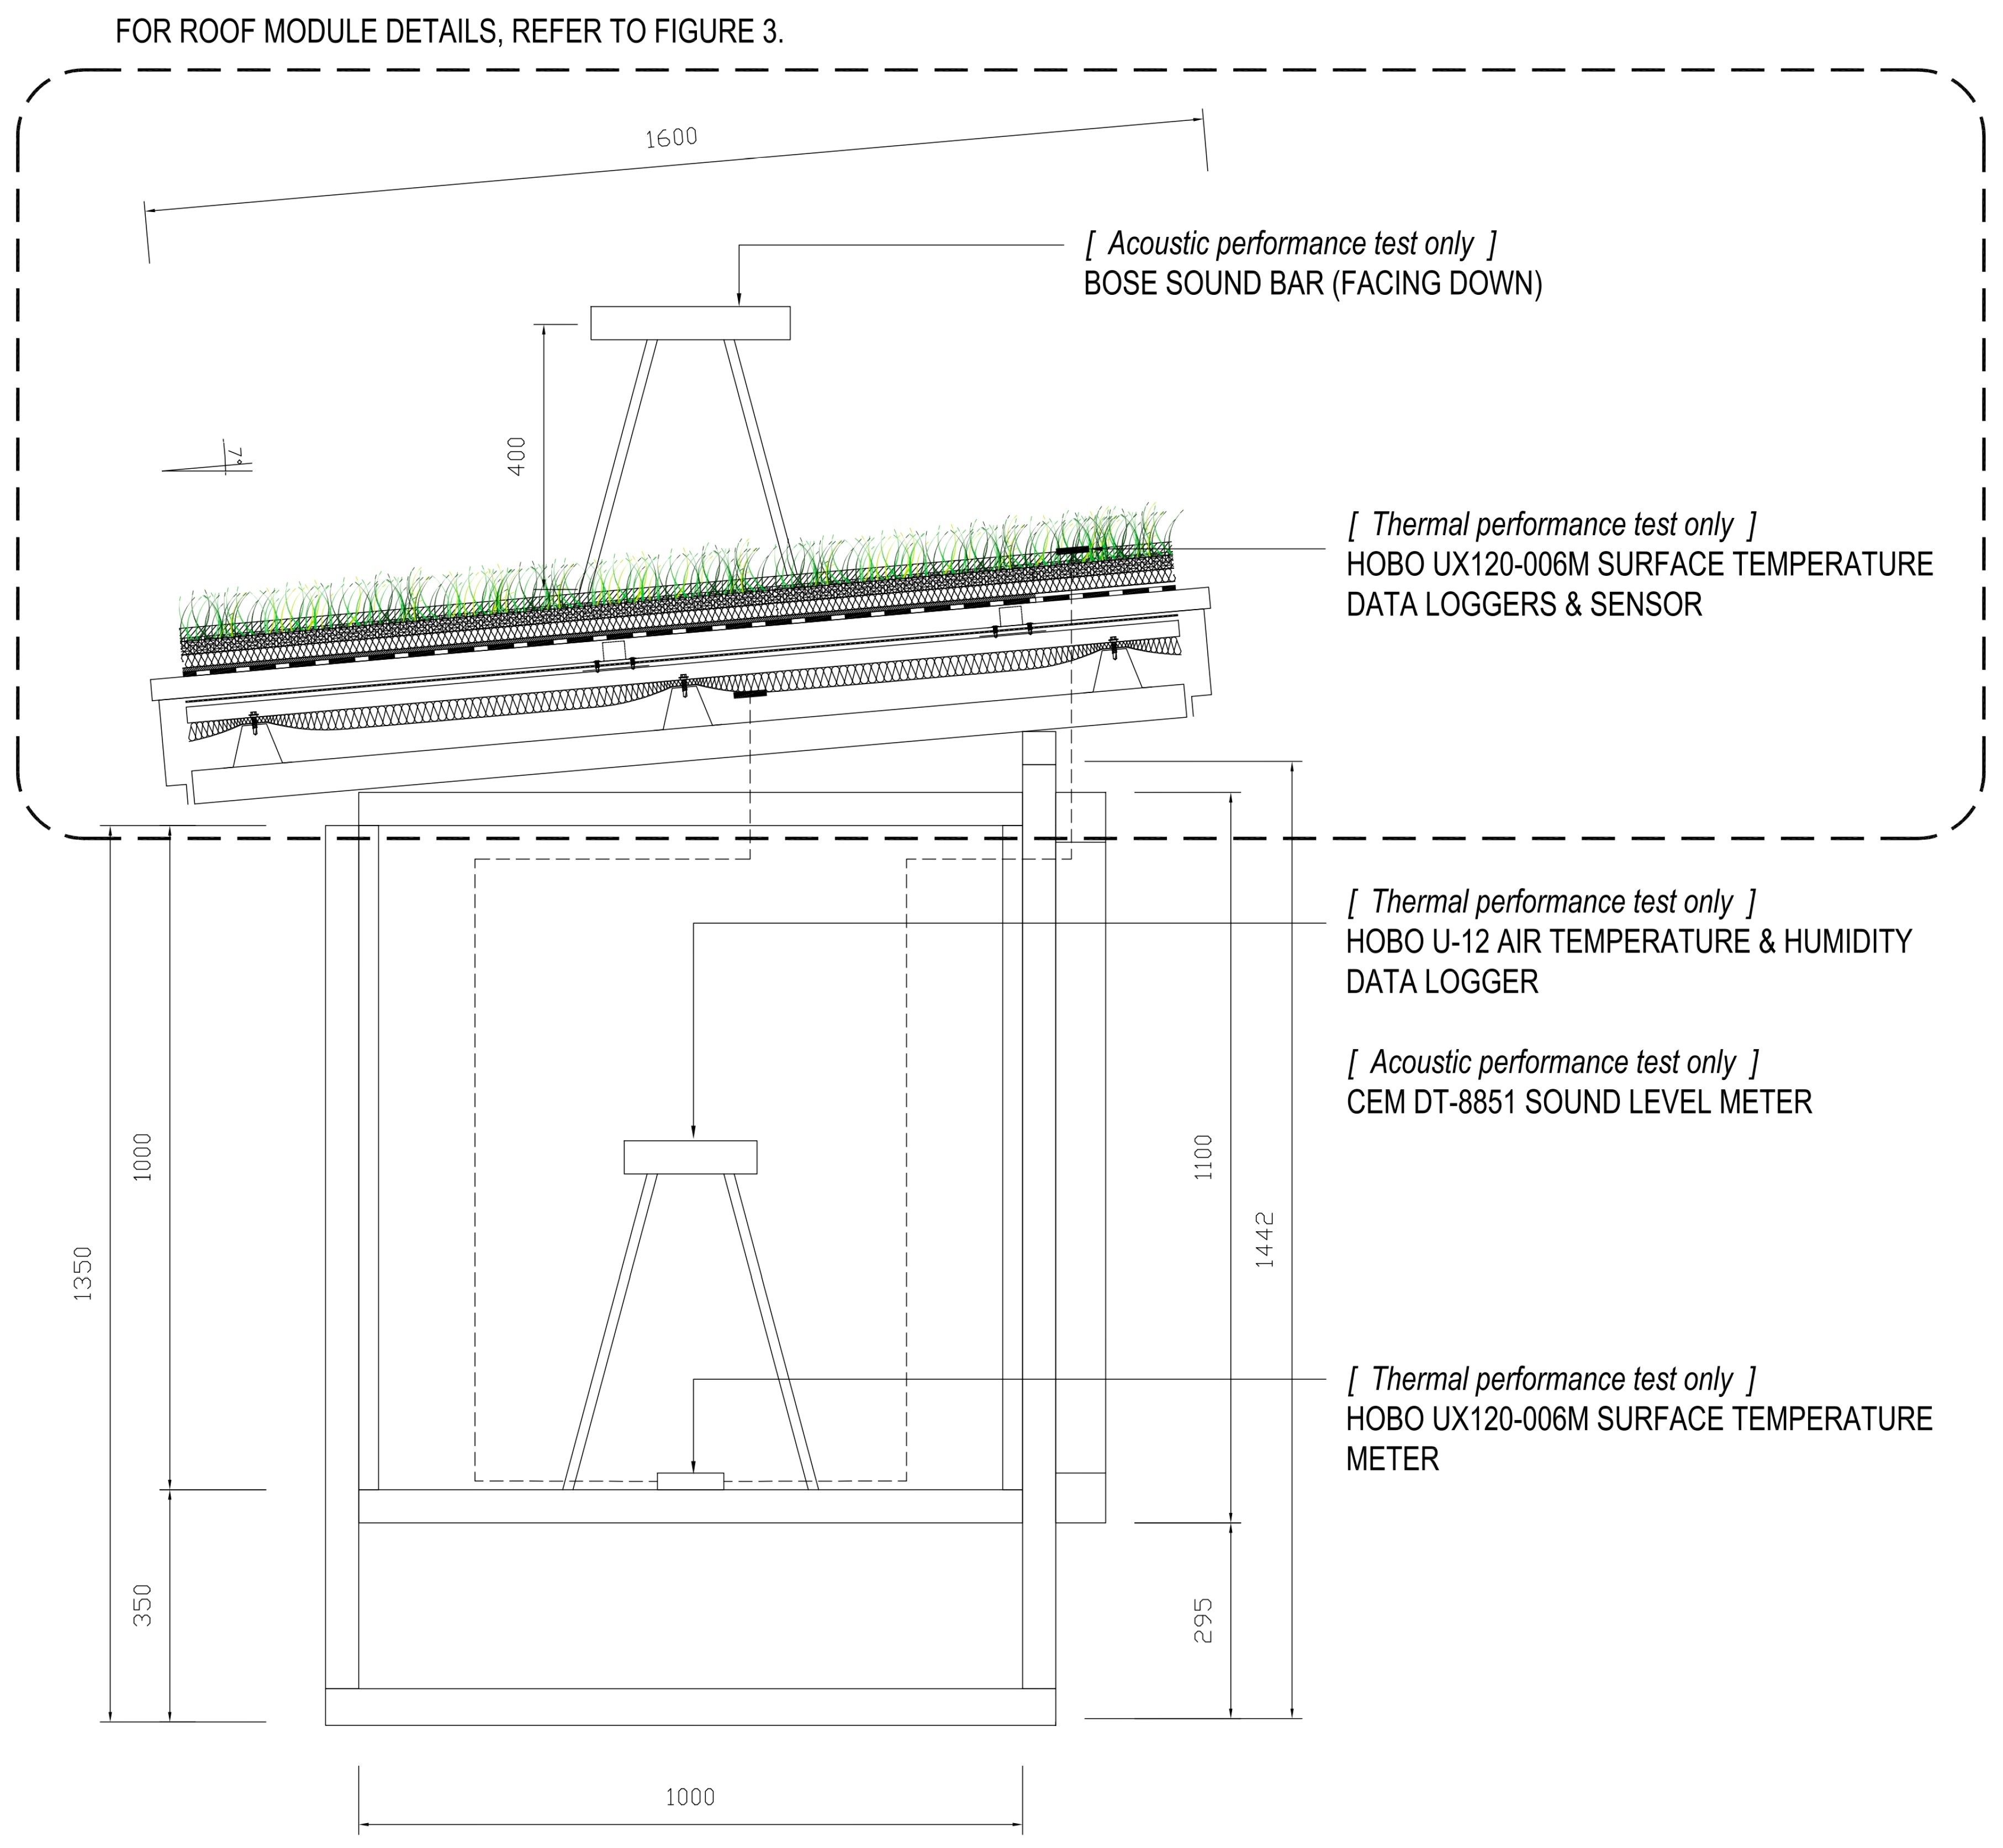
| HOBO UX120-006M (4-channel) surface temperature data loggers and sensors | Sensors are located at midpoint (0.5 m from all edges) of internal surface of roof module and 0.025 m above the external surface of roof module |
| HOBO U12 air temperature and humidity data logger | Midpoint of test frame interior (0.5 m above the floor and equidistant from all side walls) |
| Data logging intervals | 5 min |
| Data logging duration | Minimum 7 days |
| Extracted normal day data from total logged duration | 1 typical day comprising 24 continuous hours of no rainfall within a calendar day |
| Extracted rainy day data from total logged duration | 1 typical day with some rainfall within 24 continuous hours in a calendar day |
| Specimen test sequence | Concurrent. Phase 1: iGR with iMDR Phase 2: uiGR with uiMDR |
| Roof condition | Dry (dry day) Water-logged (wet day) |
| Devices’ manufacturer’s name and address | Onset HOBO, United States |
| Air-Borne Acoustic Field Measurement Settings | |
|---|---|
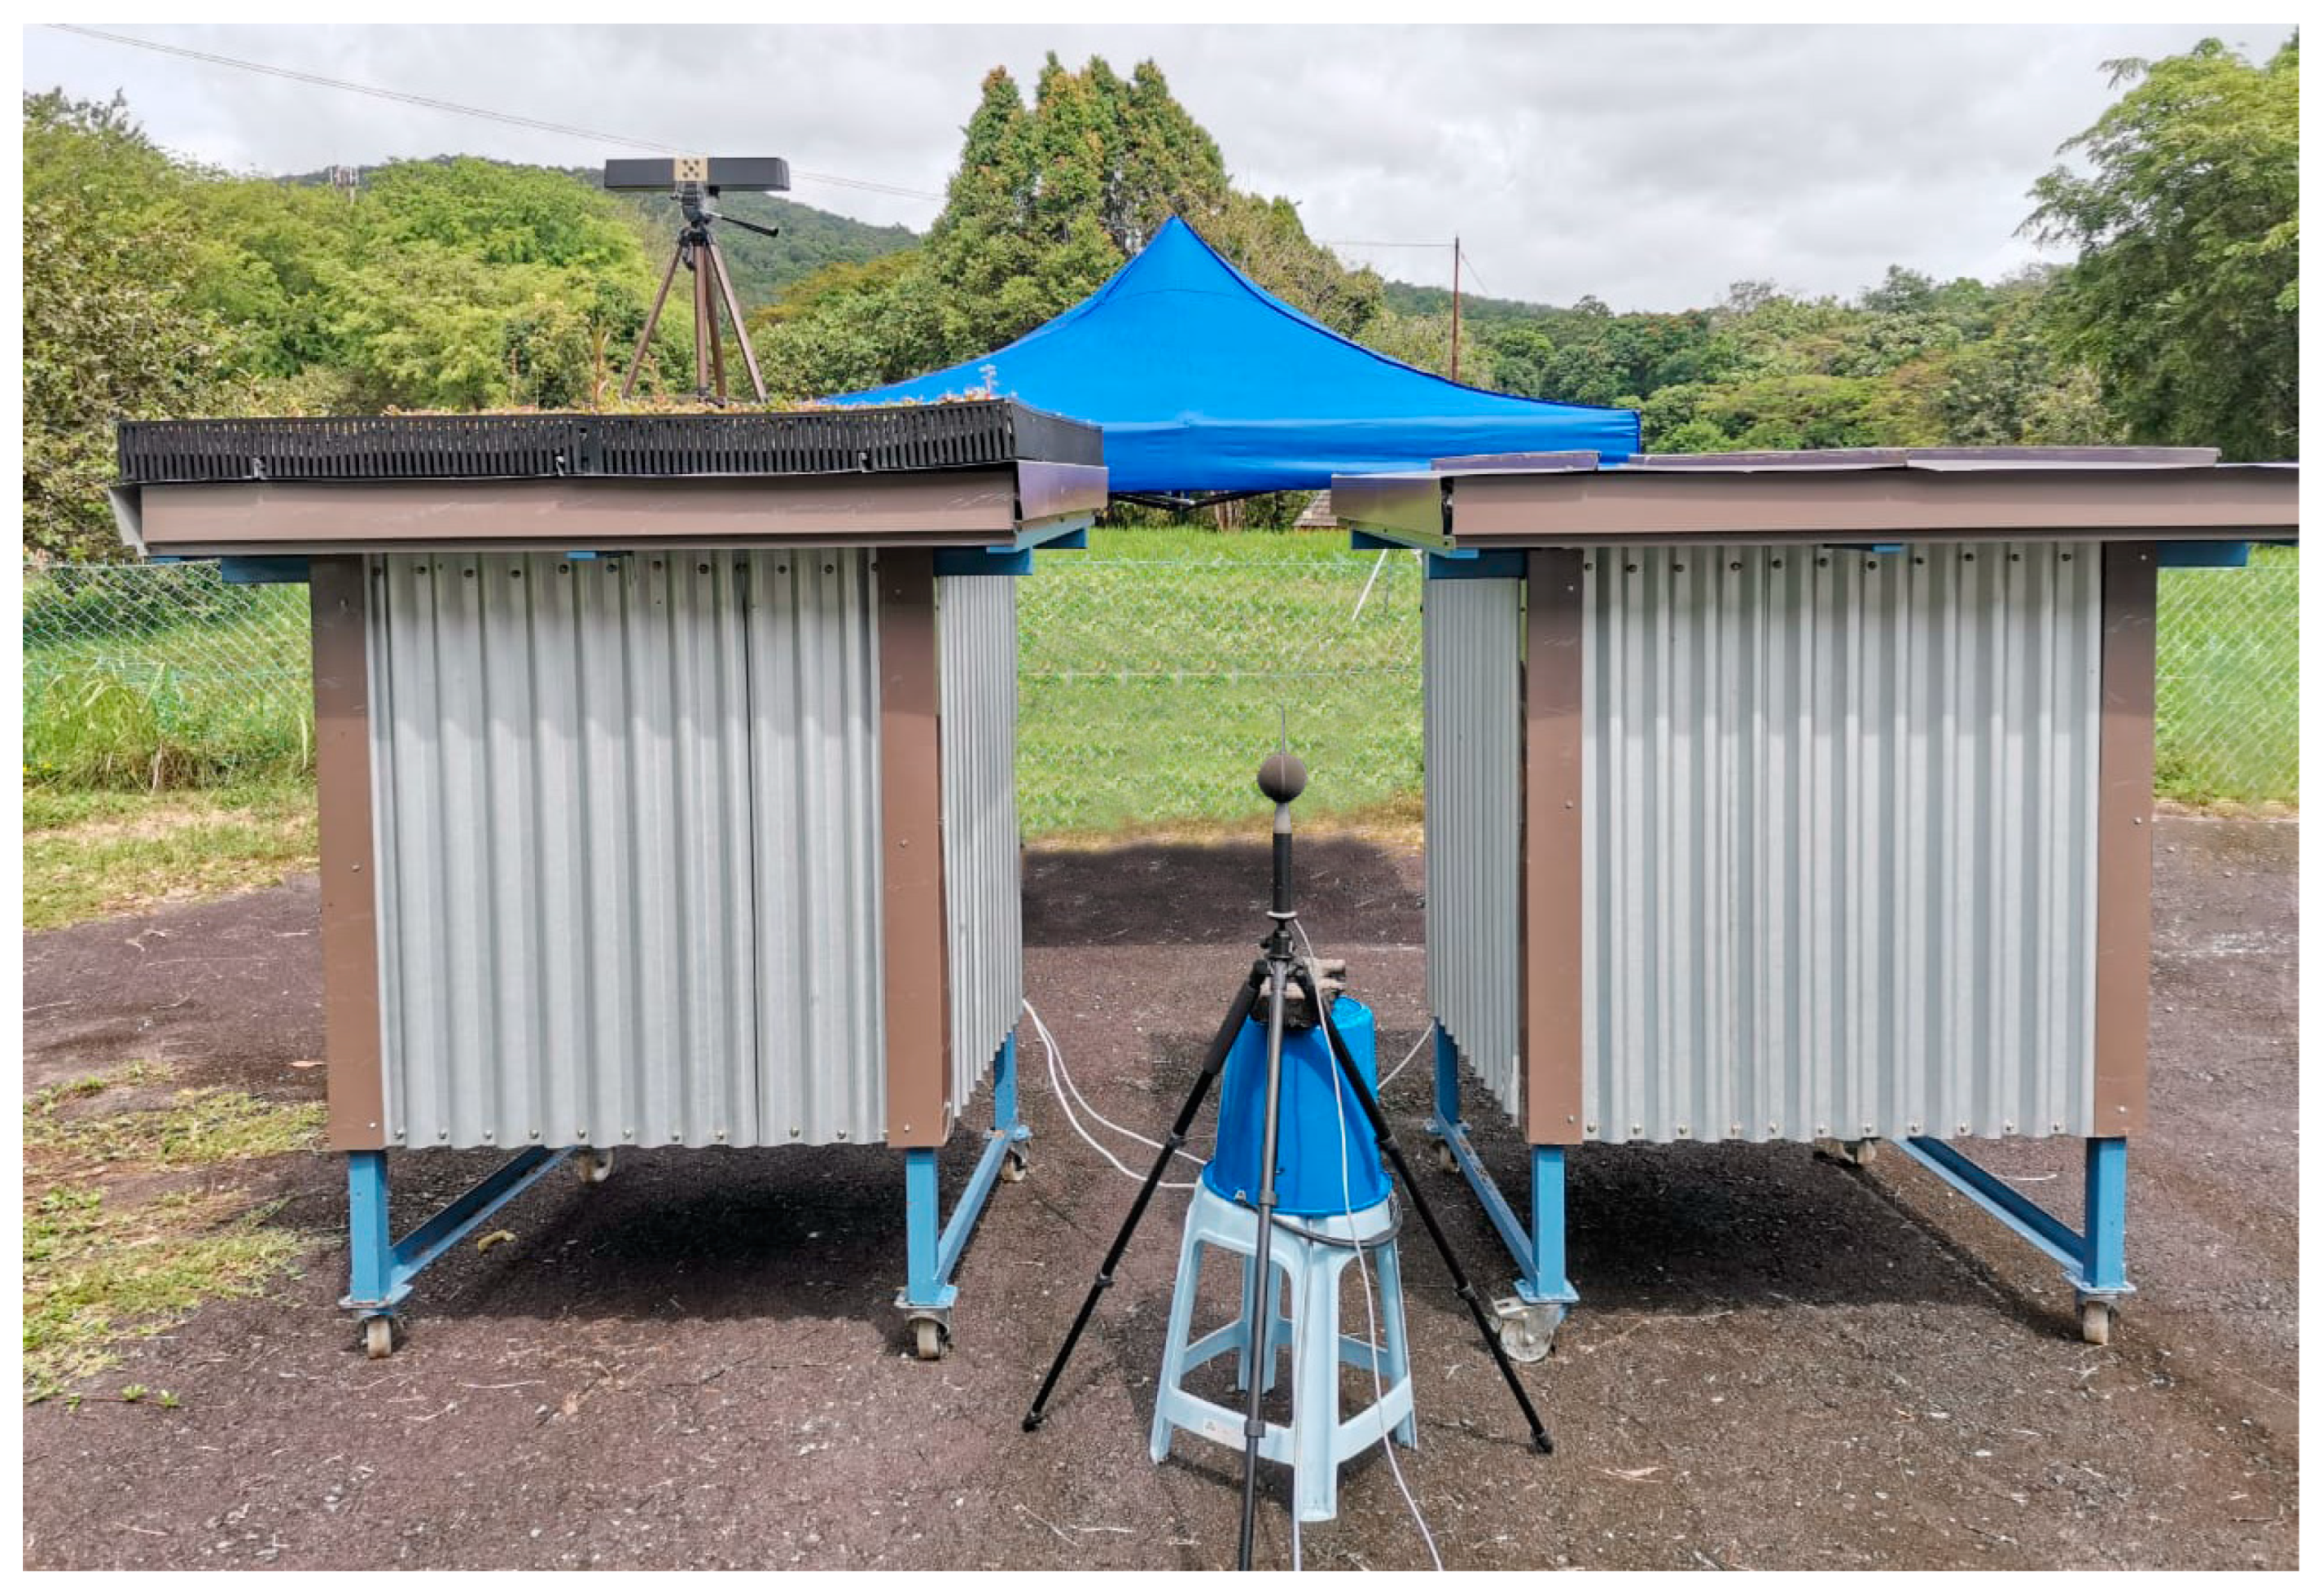
| Outdoor ambient sound measurement: Cirrus Optimus+ Green Sound Level Meter CR:1720 | 1.1 m above ground level and equidistant from both roof modules |
| Internal ambient sound measurement: CEM DT-8851 Sound Level Meter | Midpoint of test frame (0.5 m above the floor and equidistant from all side walls) |
| Air-borne sound source | One (1) BOSE 732522-2110 Sound Bar with the following settings:
|
| Description of air-borne sound | Audio clip of rain noises averaging at 65 dBA |
| Data logging intervals | 1 s |
| Data logging duration | 10 min |
| Extracted data duration | 5 min |
| Specimen test sequence | Non-concurrent. The test for any one roof module is concluded before the next roof module is tested. |
| Roof condition | Dry (dry day) Water-logged (wet day) |
| Sound level meter manufacturer’s name and address | Cirrus Research UK, United Kingdom |
| Sound bar manufacturer’s name and address | Bose Corporation, United States |
| Time of Day | Roof Type and Dry/Wet Day | Solar Intensity, SI | Relative Humidity, RH | Wind Speed, WS | Outdoor Ambient Temperature, Tamb |
|---|---|---|---|---|---|
| Daylight Hours (8.00 a.m.–6.00 p.m.) | Dry day | ||||
| iGR | 0.72 | −0.097 | 0.27 | 0.30 | |
| iMDR | 0.62 | −0.320 | 0.36 | 0.51 | |
| uiGR | 0.35 | −0.76 | 0.35 | 0.79 | |
| uiMDR | 0.40 | −0.58 | 0.35 | 0.61 | |
| Wet day | |||||
| iGR | 0.35 | −0.54 | 0.36 | 0.45 | |
| iMDR | 0.40 | −0.51 | 0.30 | 0.42 | |
| uiGR | 0.56 | −0.76 | 0.08 | 0.88 | |
| uiMDR | 0.60 | −0.68 | 0.13 | 0.75 | |
| Non-Daylight Hours | Dry day | ||||
| iGR | 0.13 | −0.16 | −0.29 | 0.42 | |
| iMDR | 0.10 | 0.24 | 0.01 | −0.01 | |
| uiGR | 0.04 | −0.59 | 0.11 | 0.83 | |
| uiMDR | 0.16 | −0.61 | 0.29 | 0.67 | |
| Wet day | |||||
| iGR | 0.11 | N/A | −0.055 | 0.01 | |
| iMDR | 0.18 | N/A | −0.042 | 0.06 | |
| uiGR | 0.28 | −0.18 | −0.041 | 0.69 | |
| uiMDR | 0.49 | −0.092 | 0.360 | 0.24 | |
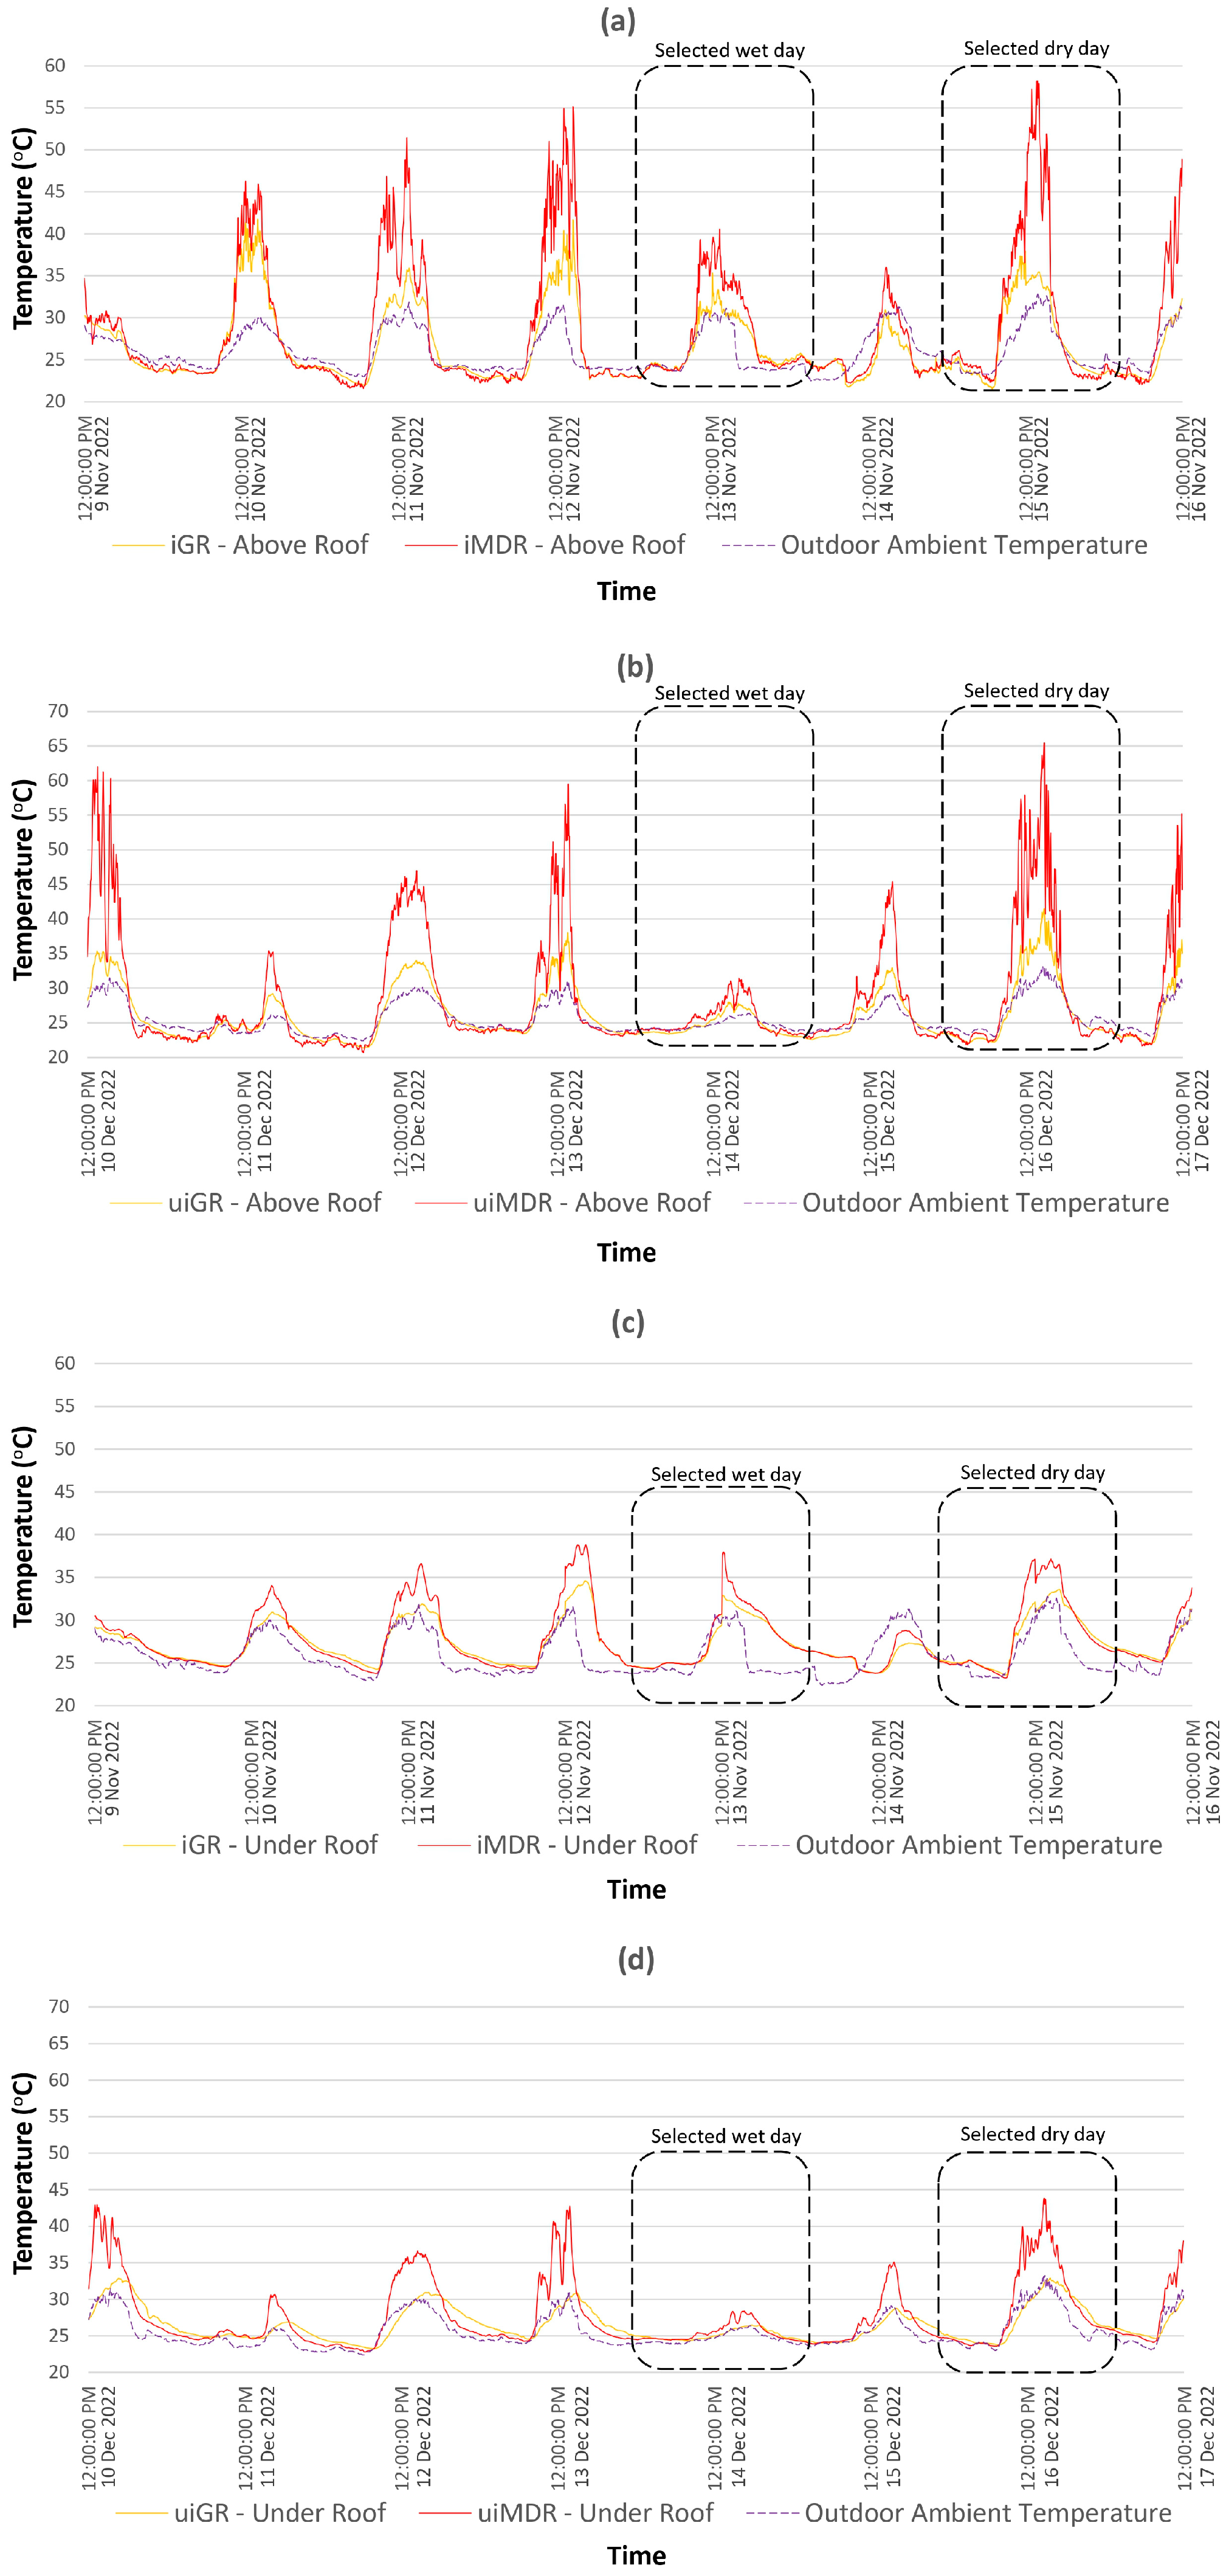
| Weather | Roof Module | Roof Surface | N | Min (°C) | Max (°C) | Mean (°C) | Std. Dev. |
|---|---|---|---|---|---|---|---|
| Dry Day | iGR | Outer | 289 | 21.5 | 37.8 | 27.5 | 4.8 |
| Inner | 289 | 23.6 | 33.6 | 28.2 | 3.2 | ||
| iMDR | Outer | 289 | 22.3 | 58.2 | 30.7 | 9.9 | |
| Inner | 289 | 23.3 | 37.2 | 29.1 | 4.6 | ||
| uiGR | Outer | 289 | 22.2 | 44.8 | 29.5 | 7.3 | |
| Inner | 289 | 24.3 | 35.3 | 29.0 | 3.8 | ||
| uiMDR | Outer | 289 | 22.1 | 59.4 | 32.5 | 11.8 | |
| Inner | 289 | 23.2 | 57.5 | 32.9 | 10.8 | ||
| Wet Day | iGR | Outer | 127 | 23.2 | 35.5 | 27.3 | 4.2 |
| Inner | 127 | 26.7 | 32.2 | 29.4 | 1.7 | ||
| iMDR | Outer | 127 | 23.9 | 35.6 | 28.5 | 4.2 | |
| Inner | 127 | 26.6 | 34.5 | 29.9 | 2.3 | ||
| uiGR | Outer | 229 | 23.1 | 28.0 | 25.0 | 1.5 | |
| Inner | 229 | 24.3 | 26.5 | 25.2 | 0.7 | ||
| uiMDR | Outer | 229 | 23.1 | 31.4 | 26.0 | 2.3 | |
| Inner | 229 | 24.4 | 28.4 | 25.8 | 1.2 |
| No | Material | K-/R-Value References | K-Value, λ (W/mK) | Thickness, d (m) | R-Value (d/λ) |
|---|---|---|---|---|---|
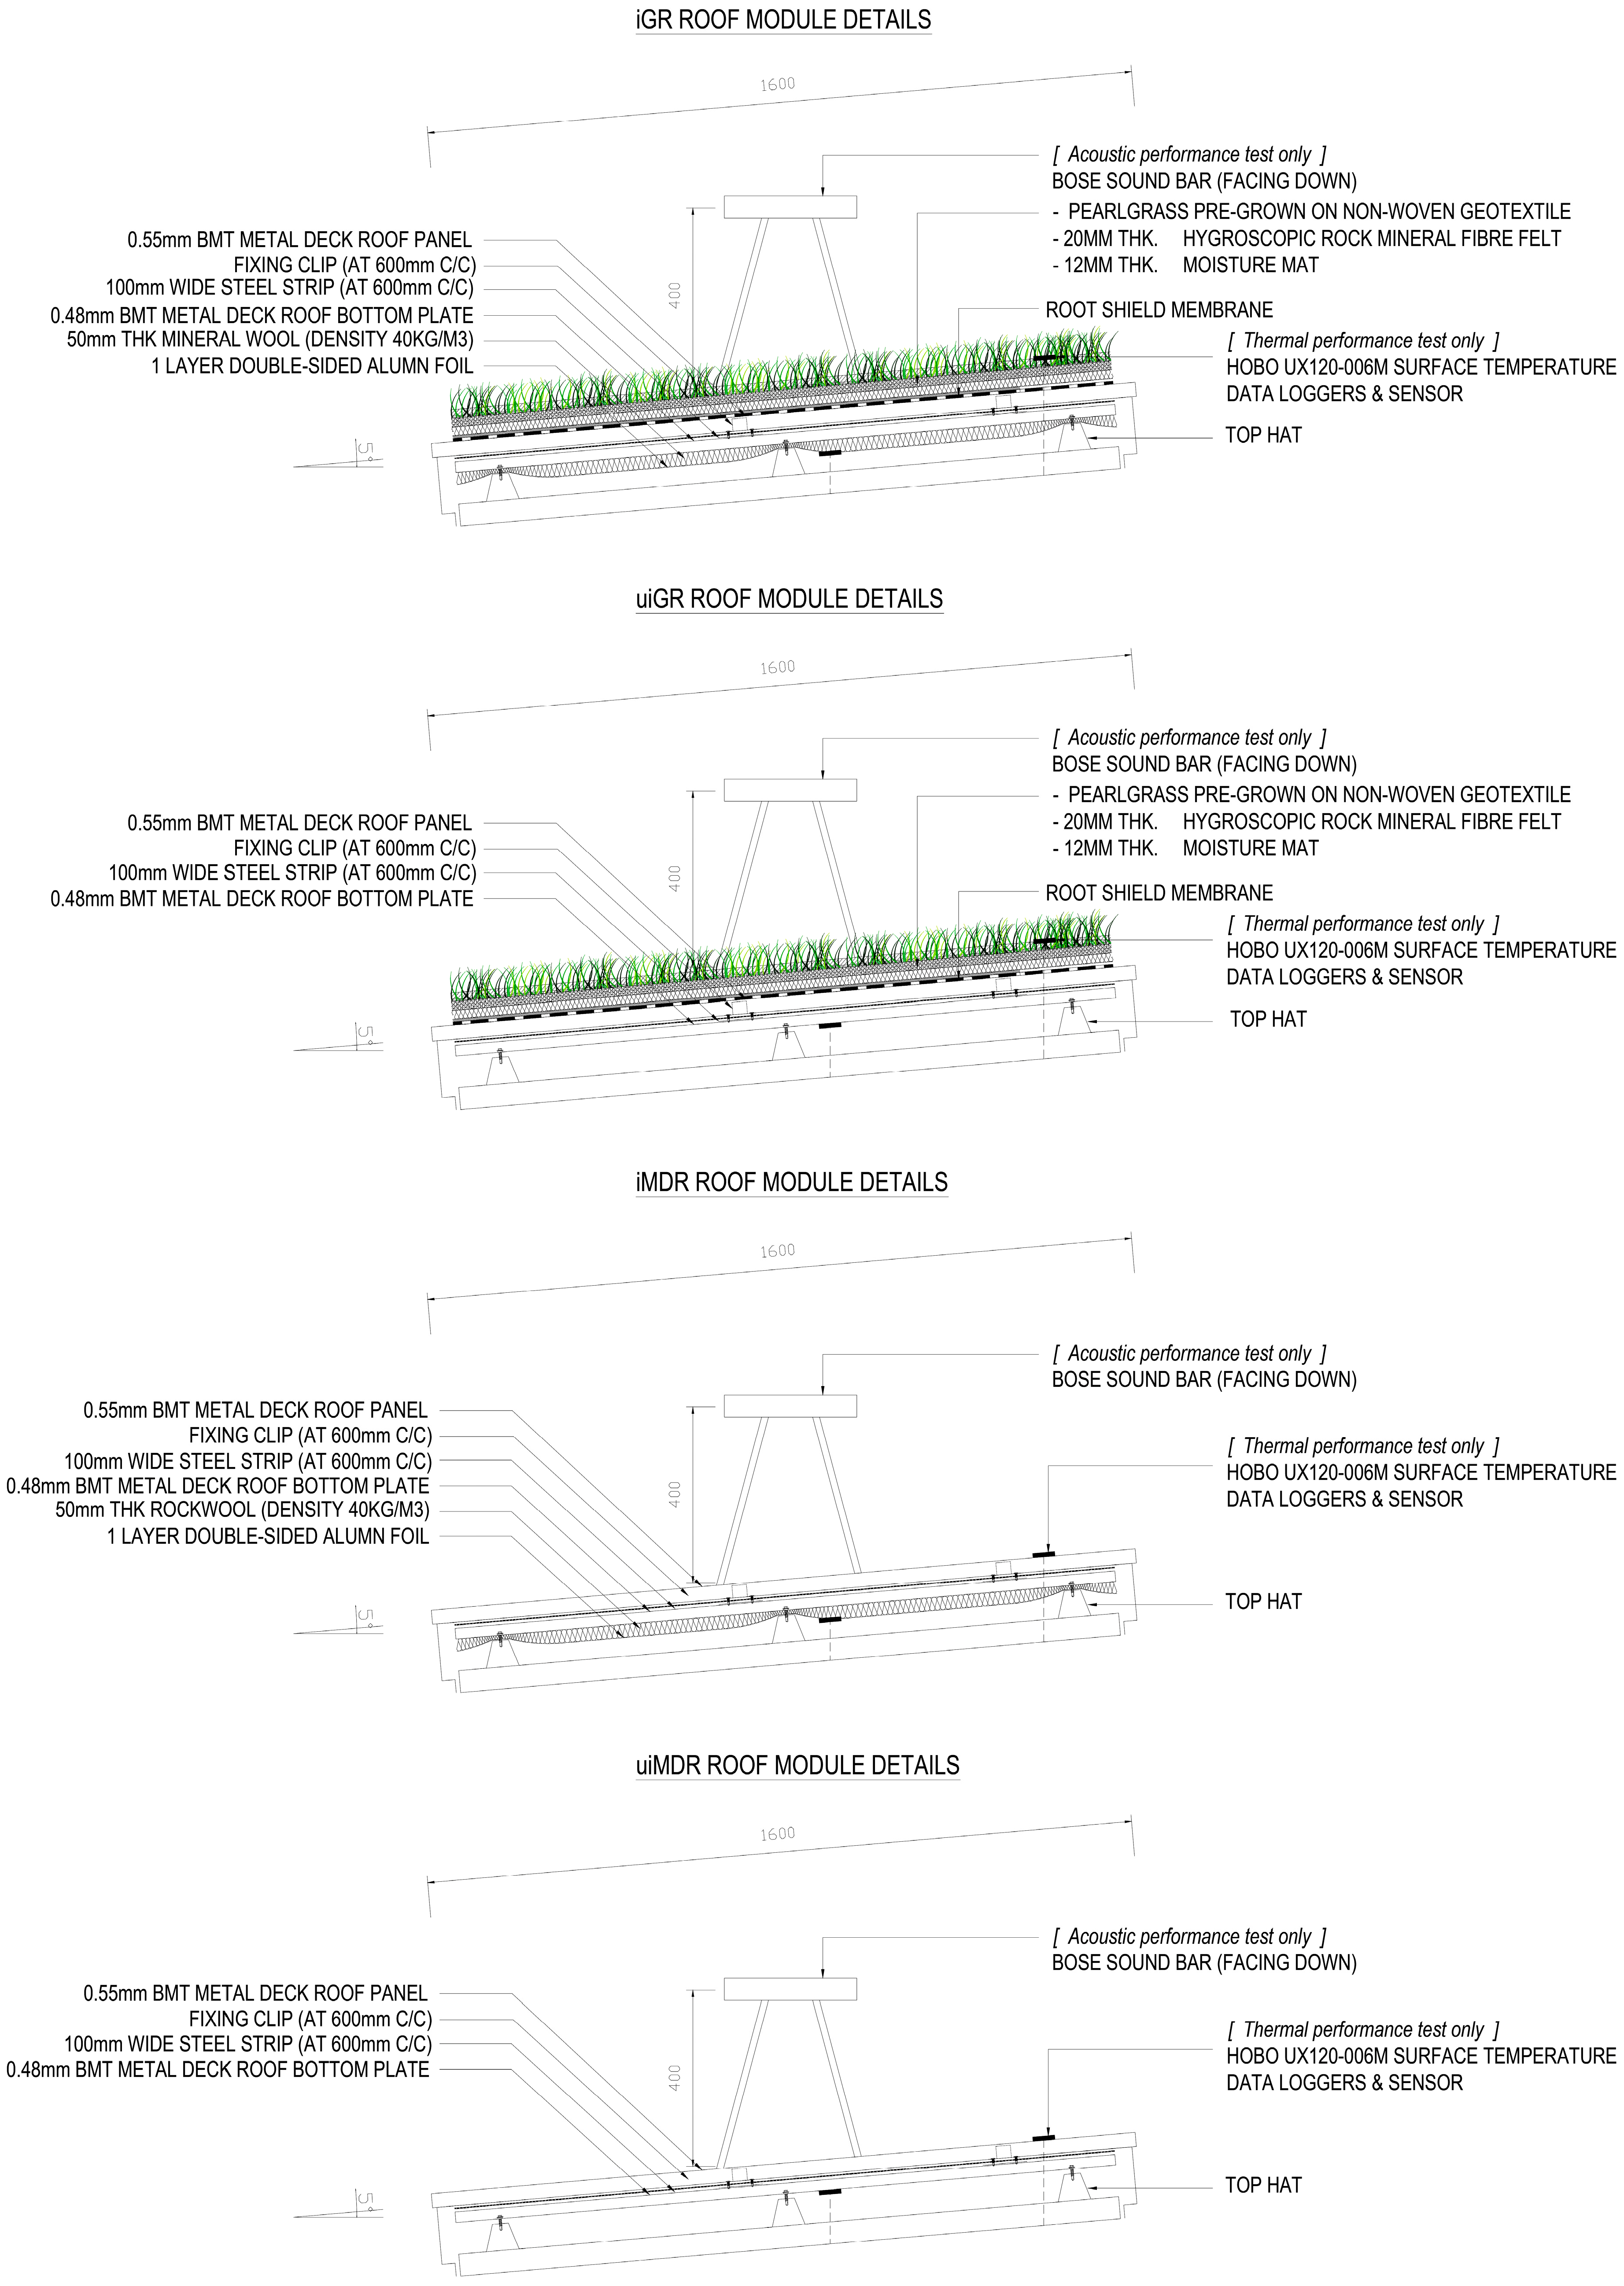
| 1 | Pearlgrass | [53] | 0.25 | 0.02 | 0.080 |
| 2 | Dry Soil Potting Mix (Loam Soil) | [54] | 0.10 | 0.05 | 0.500 |
| 3 | Wet Soil Potting Mix (Loam Soil) | [13] | 2.10 | 0.05 | 0.105 |
| 4 | Dry Non-Woven Geotextile | [55] | 0.10 | 0.002 | 0.02 |
| 5 | Wet Non-Woven Geotextile | [55] | 0.62 | 0.002 | 0.003 |
| 6 | Dry Hygroscopic Rock Mineral Fibre Felt | [56] | 0.037 | 0.02 | 0.541 |
| 7 | Wet Hygroscopic Rock Mineral Fibre Felt | [56] | 0.80 | 0.02 | 0.025 |
| 8 | Dry Moisture Mat | [57] | 0.0352 | 0.012 | 0.341 |
| 9 | Wet Moisture Mat | [57] | 0.0379 | 0.012 | 0.317 |
| 10 | Subsoil Drainage Mat | [54] | 0.02 | 0.002 | 0.100 |
| 11 | Root Shield Membrane | [58] | 0.04 | 0.001 | 0.025 |
| 12 | 0.48 mm BMT Metal Deck as Roof Structure Bottom Plate | [52] | 52.0 | 0.00048 | 0.0000092 |
| 13 | 0.55 mm BMT Metal Deck as Roof Panel | [52] | 52.0 | 0.00055 | 0.0000106 |
| 14 | Mineral wool | [52] | 0.035 | 0.05 | 1.429 |
| 15 | Aluminium Foil | [59] | 237.0 | 0.000016 | 0.0000001 |
| 16 | Rsr | [60] | - | - | 0.044 |
| 17 | Rsi | [60] | - | - | 0.160 |
| Roof Module | Materials Used (Based on Table 7) | Total R-Value (m2K/W) | U-Value, 1/R (W/m2K) |
|---|---|---|---|
| iGR (Dry) | Items 1–2, 4, 6, 8, 10–17 | 3.239 | 0.309 |
| iGR (Wet) | Items 1, 3, 5, 7, 9–17 | 2.206 | 0.453 |
| uiGR (Dry) | Items 1–2, 4, 6, 8, 10–13, 16–17 | 1.810 | 0.552 |
| uiGR (Wet) | Items 1, 3, 5, 7, 9–13, 16–17 | 0.778 | 1.286 |
| iMDR | Items 12–17 | 1.633 | 0.613 |
| uiMDR | Items 12–13, 16–17 | 0.204 | 4.901 |
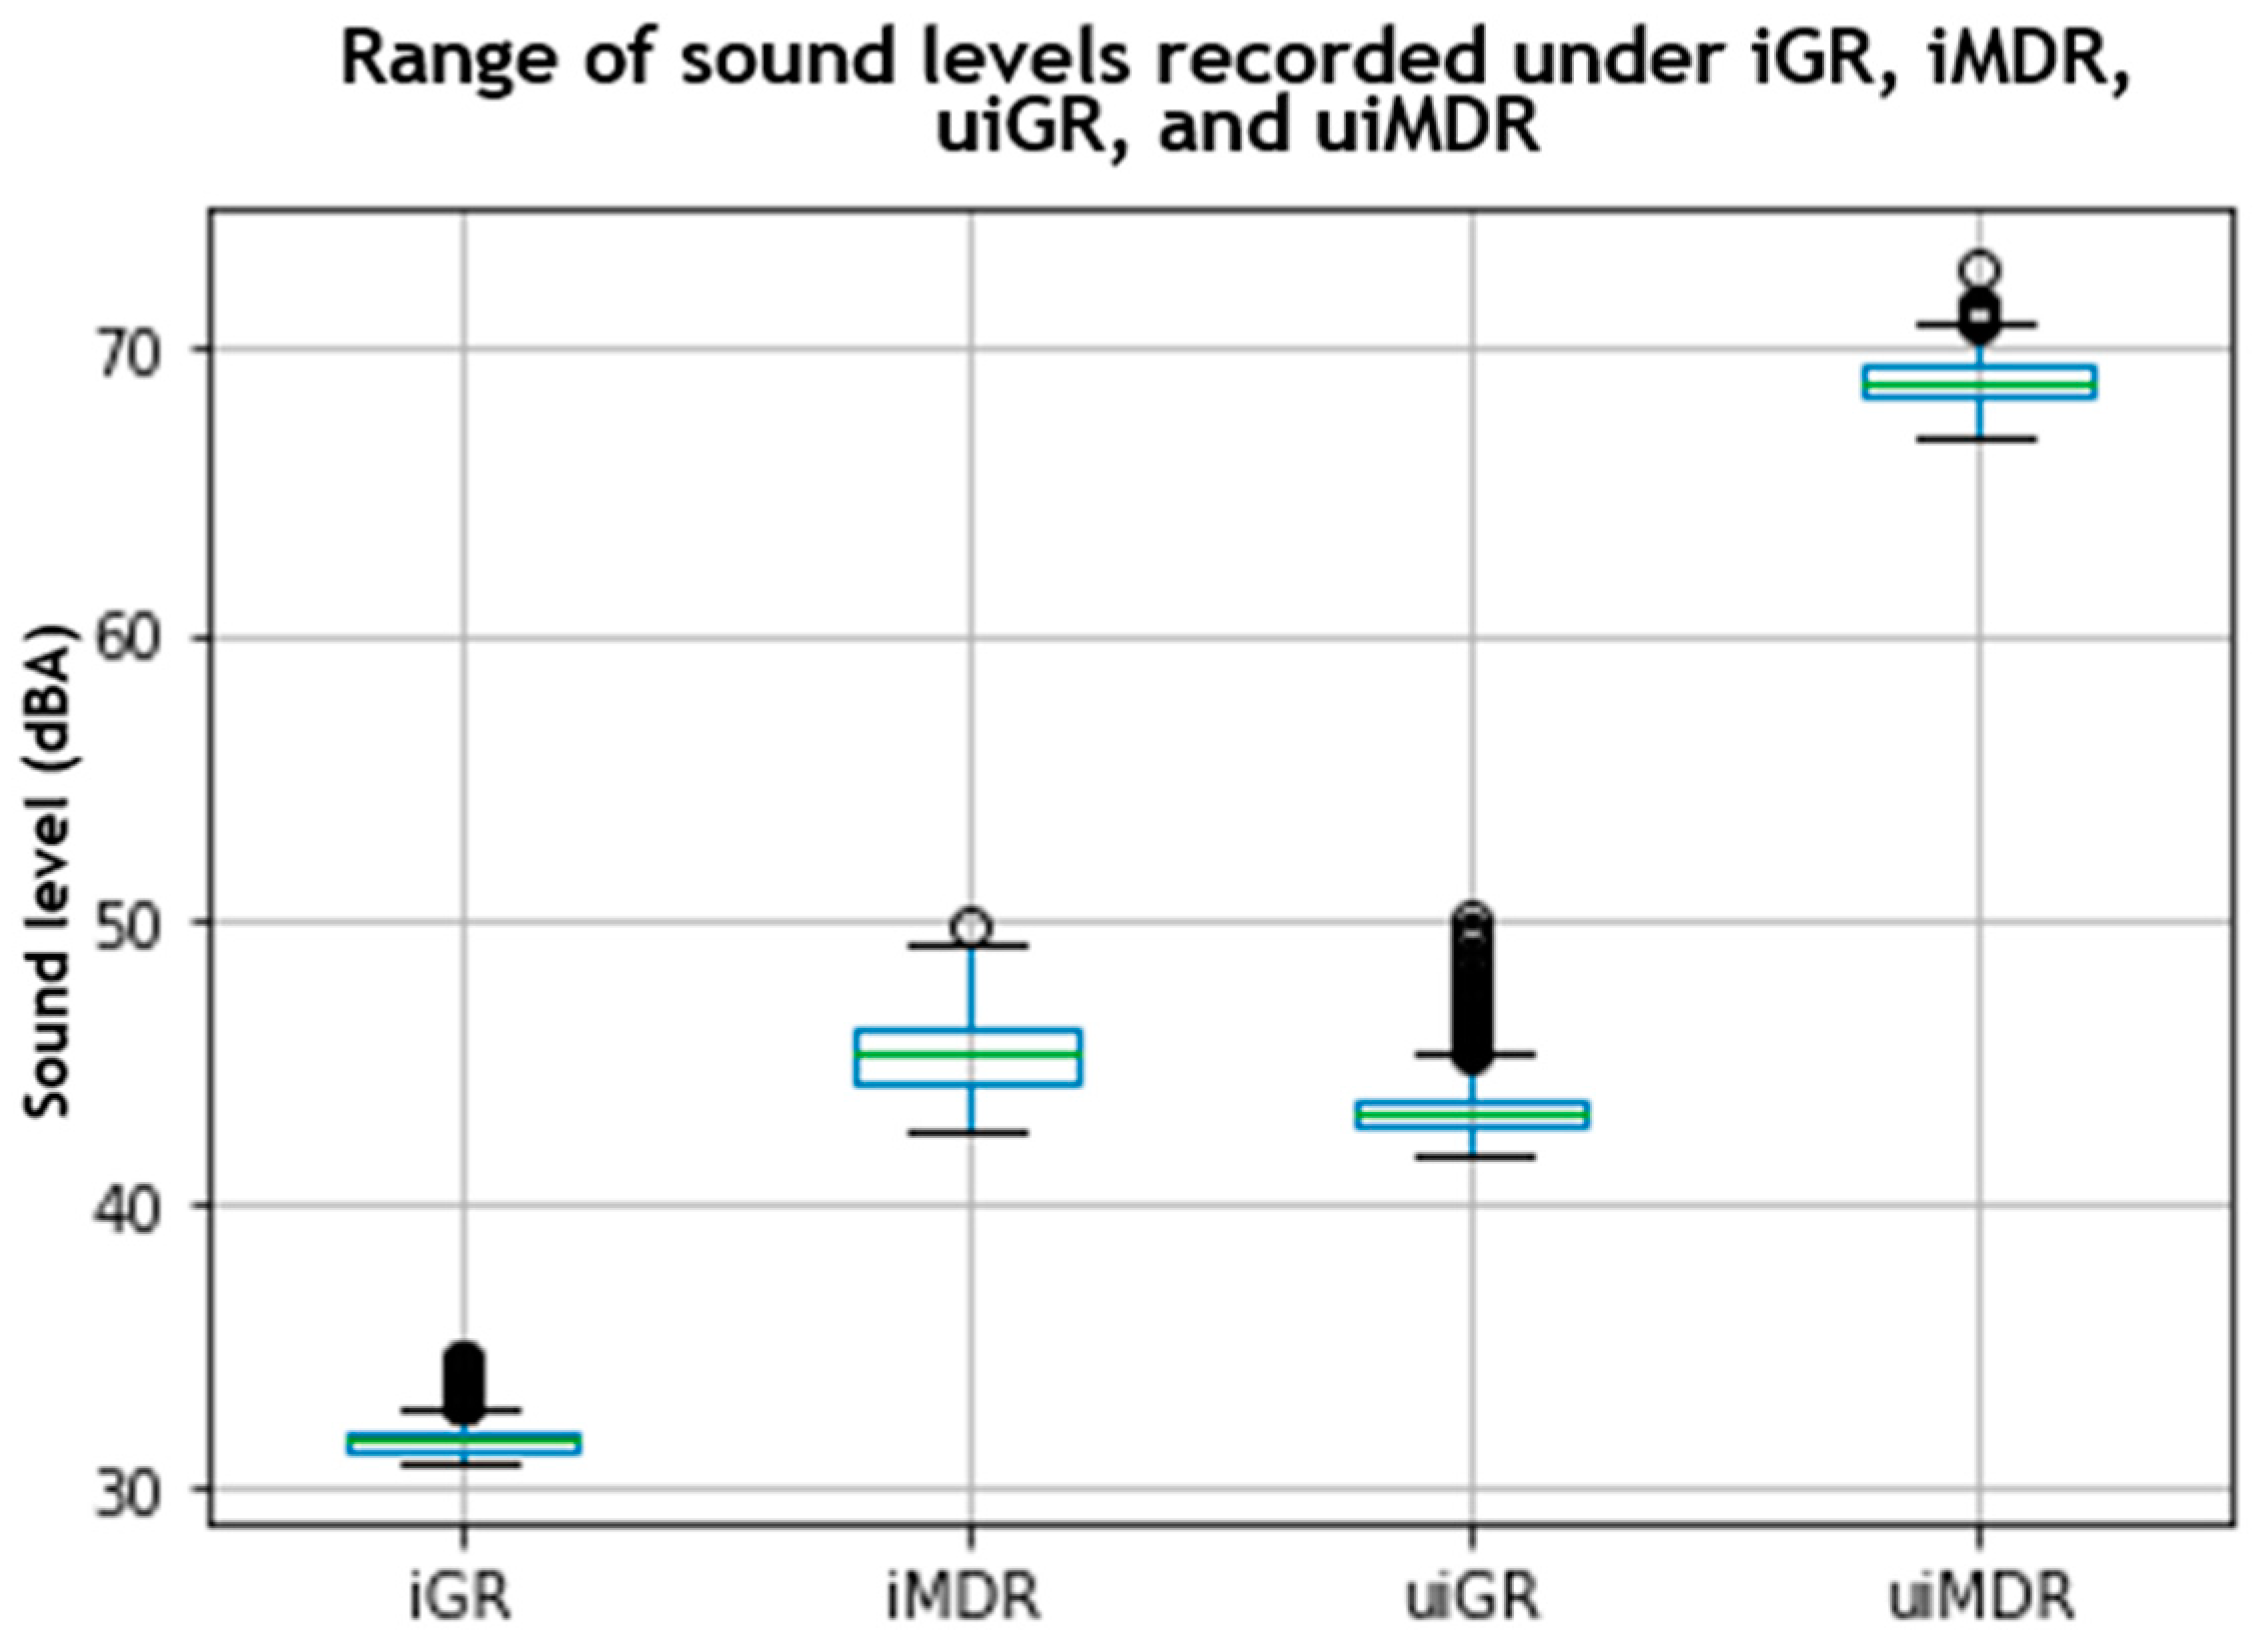
| Test Specimen | μSLo (dBA) | μSLint (dBA) | μSLred (dBA) | Deviation (%) |
|---|---|---|---|---|
| iGR | 65 | 32 | −33 | −51 |
| uiGR | 65 | 44 | −21 | −32 |
| iMDR | 65 | 45 | −20 | −31 |
| uiMDR | 65 | 69 | +4 | +6 |
| Roof Module | Shapiro–Wilk Test Results | ||
|---|---|---|---|
| Statistic | Nos. Observations | Significance (p-Value) | |
| iGR | 0.789 | 301 | 0.000 |
| iMDR | 0.985 | 301 | 0.003 |
| uiGR | 0.746 | 301 | 0.000 |
| uiMDR | 0.971 | 301 | 0.000 |
Disclaimer/Publisher’s Note: The statements, opinions and data contained in all publications are solely those of the individual author(s) and contributor(s) and not of MDPI and/or the editor(s). MDPI and/or the editor(s) disclaim responsibility for any injury to people or property resulting from any ideas, methods, instructions or products referred to in the content. |
© 2024 by the authors. Licensee MDPI, Basel, Switzerland. This article is an open access article distributed under the terms and conditions of the Creative Commons Attribution (CC BY) license (https://creativecommons.org/licenses/by/4.0/).
Share and Cite
Aw, S.B.; Leng, P.C.; Ling, G.H.T.; Wong, K.Y.; Mohamed Anuar, M.R.; Mohd Rokhibi, I.W.; Ng, C.H.; Law, N.H.K.; Goh, S.Y.Z. Strategic Integration of a Vegetative Component on a Metal Roof Base: An Evaluation of Its Impacts on Thermal and Acoustic Performance in the Tropics. Buildings 2024, 14, 915. https://0-doi-org.brum.beds.ac.uk/10.3390/buildings14040915
Aw SB, Leng PC, Ling GHT, Wong KY, Mohamed Anuar MR, Mohd Rokhibi IW, Ng CH, Law NHK, Goh SYZ. Strategic Integration of a Vegetative Component on a Metal Roof Base: An Evaluation of Its Impacts on Thermal and Acoustic Performance in the Tropics. Buildings. 2024; 14(4):915. https://0-doi-org.brum.beds.ac.uk/10.3390/buildings14040915
Chicago/Turabian StyleAw, Siew Bee, Pau Chung Leng, Gabriel Hoh Teck Ling, Keng Yinn Wong, Mohamed Rohaizad Mohamed Anuar, Ismail Wajdi Mohd Rokhibi, Cheah Haur Ng, Nathan Hui Kai Law, and Santa Ying Zi Goh. 2024. "Strategic Integration of a Vegetative Component on a Metal Roof Base: An Evaluation of Its Impacts on Thermal and Acoustic Performance in the Tropics" Buildings 14, no. 4: 915. https://0-doi-org.brum.beds.ac.uk/10.3390/buildings14040915