Article

Correlation Analysis of Urban Road Network Structure and Spatial Distribution of Tourism Service Facilities at Multi-Scales Based on Tourists’ Travel Preferences

Key Laboratory of Cold Region Urban and Rural Human Settlement Environment Science and Technology, School of Architecture and Design, Harbin Institute of Technology, Ministry of Industry and Information Technology, No. 66, Xidazhi Street, Harbin 150006, China
*
Author to whom correspondence should be addressed.
Submission received: 22 February 2024 / Revised: 24 March 2024 / Accepted: 25 March 2024 / Published: 27 March 2024
(This article belongs to the Section Architectural Design, Urban Science, and Real Estate)

Abstract

:
Harbin, as a popular tourist city in China, and the host of the 2025 Asian Winter Games, boasts rich tourism resources and significant potential for further development. The structure of the urban road network is a crucial factor influencing the spatial distribution of tourism service facilities. However, the current research on the correlation between the two, analyzed at multiple scales based on tourists’ travel preferences, is not sufficient. First, utilizing the questionnaire survey method to analyze tourists’ travel preferences and combining it with the theory of 15-min life circle, we determine the study scales at 500 m, 1000 m, 3000 m, and 5000 m. Secondly, the integration value and choice value of roads in the main urban area of Harbin are analyzed based on the theory of spatial syntax. The spatial distribution characteristics of tourism service facilities are then revealed through kernel density analysis. Finally, the correlation between the road network structure and the distribution of various types of tourism service facilities in Harbin at different scales is determined through buffer analysis and Pearson bivariate correlation analysis. The results show that: (1) Integration value plays a significant positive role in promoting the clustering of tourism service facilities, especially tending to cluster in areas with high integration value formed at a scale of 500 m; (2) At the scale of 3000 m, the distribution of tourism service facilities exhibits a significant correlation with the choice value; (3) The correlation between dining, shopping, and entertainment facilities and the integration value decreases with the increase in scale, whereas the spatial distribution of accommodation and attraction facilities does not exhibit a regular pattern with changes in integration value. In addition, this paper also puts forward targeted suggestions for optimizing the urban road network structure, reasonably locating tourism service facilities, and implementing balanced regional development. The contribution of this study is that it will help improve tourists’ travel experience in the city and provide scientific support for promoting the overall sustainable development of tourism in Harbin.

1. Introduction

1.1. Research Background

At the beginning of the 21st century, China set the construction of a world tourism powerhouse as a strategic goal and proposed to cultivate tourism as a key pillar industry of the national economy. In order to further promote the prosperity and development of cultural undertakings, cultural industries, and tourism, the ministry of culture and tourism of the People’s Republic of China promulgated the “Cultural and Tourism Development Plan for the 14th Five-Year Plan period” in 2021. This plan aims to enhance the modern cultural and tourism market system to support the strategy of expanding domestic demand, optimizing and strengthening the domestic market, improving the efficiency and fairness of resource allocation, and continuously advancing the unified, open, competitive, and orderly modern cultural tourism market system. Harbin, a city with a rich history and unique cultural charm, saw the inception of its tourism industry as early as 1963. It gained fame both domestically and internationally for its ice and snow tourism, making it the birthplace and leader of ice and snow tourism in China. Wang analyzed the market positioning and environment of Harbin winter tourism, considering both the marketing and management status quo. Using a combination of theoretical and argumentative research methods, he proposed strategies for Harbin’s winter tourism products, pricing, marketing channels, and promotion [1]. Sun et al., by establishing a comprehensive evaluation index system for Harbin’s tourism competitiveness, analyzed the challenges in the process of the tourism industry development. They then formulated targeted strategies to enhance the competitiveness of Harbin tourism [2]. Zhao et al. utilized the AHP method to determine the evaluation indexes and weights for rural tourism resources in Harbin. They constructed an evaluation index system to assess the development potential of rural tourism resources in Harbin and proposed a tourism resources development strategy across three scales: the central urban area, suburban areas, and the city’s outskirts [3]. However, the strong seasonality poses a challenge to Harbin’s tourism industry, causing a downturn in spring, summer, and fall. To overcome this disadvantage, Harbin implemented the strategy of establishing the Ice City Summer Capital Characteristic Tourism Zone in 2009 [4]. In 2022, Harbin reorganized its distinctive resources, including ice and snow, wetlands, hot springs, beer, music, and others, to establish two core brands: “winter ice and snow tourism” and “seasonal summer tourism”. As a result, the structural characteristics of Harbin’s tourism, initially marked by being “strong in winter and weak in summer”, have undergone fundamental changes, leading to a fully upgraded and coordinated development across all four seasons. With the onset of the tourism frenzy, during the seven-day Chinese New Year’s holiday in 2024, Harbin received a total of 10.093 million tourists, generating a total tourism revenue of 16.402 billion yuan. Both the number of tourists received and the total income from tourism reached a historical peak [5]. Successful bidding for the 2025 Asian Winter Games as well as year-on-year growth in tourist arrivals and tourism revenue have elevated tourism to a pillar industry in Harbin. It not only injects constant vitality into the development of the Northeast region but also plays a crucial role in leading the nationwide development of the region. Harbin has become a strategic hub for China’s booming tourism industry.
All the past research and policy proposals have made positive contributions to promoting the development of tourism in Harbin. However, if we only focus on the transformation of the urban tourism development mode, ignoring its unique spatial morphology characteristics and the increasing demand for tourism service facilities, it may lead to the construction and development of the urban tourism industry to fall into the predicament of repeating the same mistakes. Nowadays, the paradigm of “use transportation to promote, integration, and development tourism”, has emerged as a new developmental trend [6]. Tourism service facilities constitute a pivotal element within the modern tourism industry system [7], with tourists being the primary users of these facilities. Roads, as conduits and veins, play a crucial role in guiding and facilitating tourists’ travel behavior. However, there exists a deficiency in academic reflection regarding the correlation between the urban road network structure and the spatial distribution of tourism facilities. Considering tourists’ preferences for travel, achieving effective matching at various scales is crucial to enhancing the convenience of urban tourism, improving tourists’ satisfaction, and addressing an urgent problem for realizing high-quality and sustainable development of regional tourism.

1.2. Research Review

As the six major elements of tourism, namely “Dining, Shopping, Transportation, Accommodation, Entertainment, and Attraction”, these not only fulfill the diverse needs of tourists but also constitute the most attractive tourism service facilities [8]. Suning Xu et al. use Hongshi Town in Jilin Province as an example and propose a targeted planning strategy for integrating tourism facilities. This strategy addresses issues such as homogenization, facility isolation, loss of urban style and characteristics, and the single urban industrial structure common to many small tourism towns in China [9]. By reviewing and summarizing the existing literature, Diao et al. clarified the components of the rural tourism service system and constructed the rural tourism service system in Heilongjiang Province based on sustainable development goals and concepts [10]. Yuan took Jintan Maoshan Tourism Resort in Jiangsu Province as an example and proposed a strategy for planning tourism service facilities in mountain-type tourism resorts. This strategy is based on the types of tourism service facilities and the principles of configuring the tourism resort [11]. Xiao and Yi analyzed the existing problems and conducted functional zoning of tourism facilities in tourist villages and towns in Hunan Province based on principles such as the rationality of functional zoning, accessibility of the road transportation system, comprehensiveness of public service facilities, and systematicity of supporting facilities [12]. In general, a review of the existing literature reveals that previous studies on tourism service facilities mainly focus on their planning strategies and planning of tourism-oriented cities, and most of them tend to lean towards qualitative analysis.
Roads bear the transportation function in the city, serving as the main component of urban public space [13]. Simultaneously, they are interconnected with various functions such as commerce, socialization, and culture. From the perspective of urban space, Zhang, Zheng, and Zhang analyzed the driving effects of transportation on tourism development, tourism efficiency, and the tourism economy through a coupling coordination model, studying the coordination relationship between these factors [14,15,16]. Based on the traditional road network planning methods, Liu proposed a new set of tourism road planning methods by combining tourism resource evaluation and landscape value evaluation methods [17]. In the 1970s, Bill Hillier proposed the theory of spatial syntax, which mathematically explores the topological relationships between spaces [18]. Through spatial segmentation, the theory utilizes topological maps to depict the relationship between space and human activities. Spatial syntax, as a socio-linguistic tool, allows for a profound comprehension of urban spatial structure. It accurately quantifies and describes the structural characteristics of road networks, shaping the evolution of urban land use patterns and functional structures by dissecting the interactions between human-vehicle movement systems and urban spatial structures [19]. Akkelies van Nes compared the inner ring roads of different cities through the theory of spatial syntax and emphasized the decisive influence of the inner ring road connection mode and the street network type on the store location pattern [20]. Yunfeng Huang et al. used spatial syntax and the spatial resistance model to analyze the road network structure of traditional villages, to find out the streets that are more suitable for the layout of commercial space, and then propose optimization strategies for the commercial layout of the village [21]. The use of spatial syntax theory not only reveals the spatial laws hidden under the superficial economic activities and regional environment from the perspective of spatial users, but also provides a new perspective for exploring the spatial distribution of tourism facilities under the influence of urban road network structure.
Life circle refers to the spatial extent of urban residents involved in various daily activities. In China, researchers generally focus on 15-min life circles to develop people-oriented transportation systems and improve the distribution of facilities in the larger cities. The 15-min life circle is a spatial scale formed by comprehensive evaluation based on the principle that residents’ walking time is 15 min to meet their material and living needs, which generally corresponds to a 1000 m travel distance radius [22]. Likewise, the impact of travel distance on tourists’ demand is also widely acknowledged in tourism geography [23]. It has been demonstrated that travel time and distance influence the number, characteristics, and behavior of tourists. Tourists generally prefer to experience a greater number of tourism services and facilities within the shortest travel distance possible [24], it indicates a certain similarity between tourists’ expectations for travel and the life circle theory proposed for urban residents. Wu et al. used Structural Equation Modeling to explore how tourists’ psychological distances affect their willingness to travel in the context of the COVID-19 pandemic [25]. Based on an analysis of survey data from Lithuania, Urbonavicius et al. demonstrated that the effects of travel intention predictors were different. The greater the distance, the greater the complexity of planning [26]. Therefore, from the perspective of tourism planning and design, an accurate understanding of the travel preferences of tourists has become a key factor in enhancing the quality of tourism in Harbin and promoting sustainable development. However, at present, research on the travel preferences of tourists is mostly applied to the planning of optimal tourist routes [27,28] and the forecasting of traffic demand in tourist cities or towns [29,30,31,32]. There is a research gap concerning the arrangement of tourism service facilities according to the travel preferences of tourists.
Therefore, there is still a gap in research on the correlation between urban road network structure and the spatial distribution of tourism service facilities at multiple scales, considering tourists’ travel preferences and based on spatial syntax theory. An in-depth study of this relationship is of great significance for optimizing the urban road network structure, enhancing the accessibility of tourism service facilities, improving tourists’ travel experience and activity convenience, and unlocking the development potential of tourism.

1.3. Research Aim

This research aims to quantify the road network structure of Harbin and reveal the spatial distribution characteristics of its tourism service facilities according to the preferred travel distance of tourists, and further explore the correlation between the multi-scale road network structure and the spatial distribution of tourism service facilities in Harbin. At the same time, it provides support for the optimization strategy of promoting the optimization of urban road network structure and rational layout of tourism service facilities. By providing scientifically sound planning methods and bases, the study aims to effectively address potential challenges, enhance the overall tourist experience, and strengthen the attractiveness and sustainable development of urban tourism. Furthermore, we encourage the academic community to explore and address the challenges that cities may encounter in tourism planning and development. This effort aims to provide valuable theoretical and practical support for the sustainable development of cities in the future.

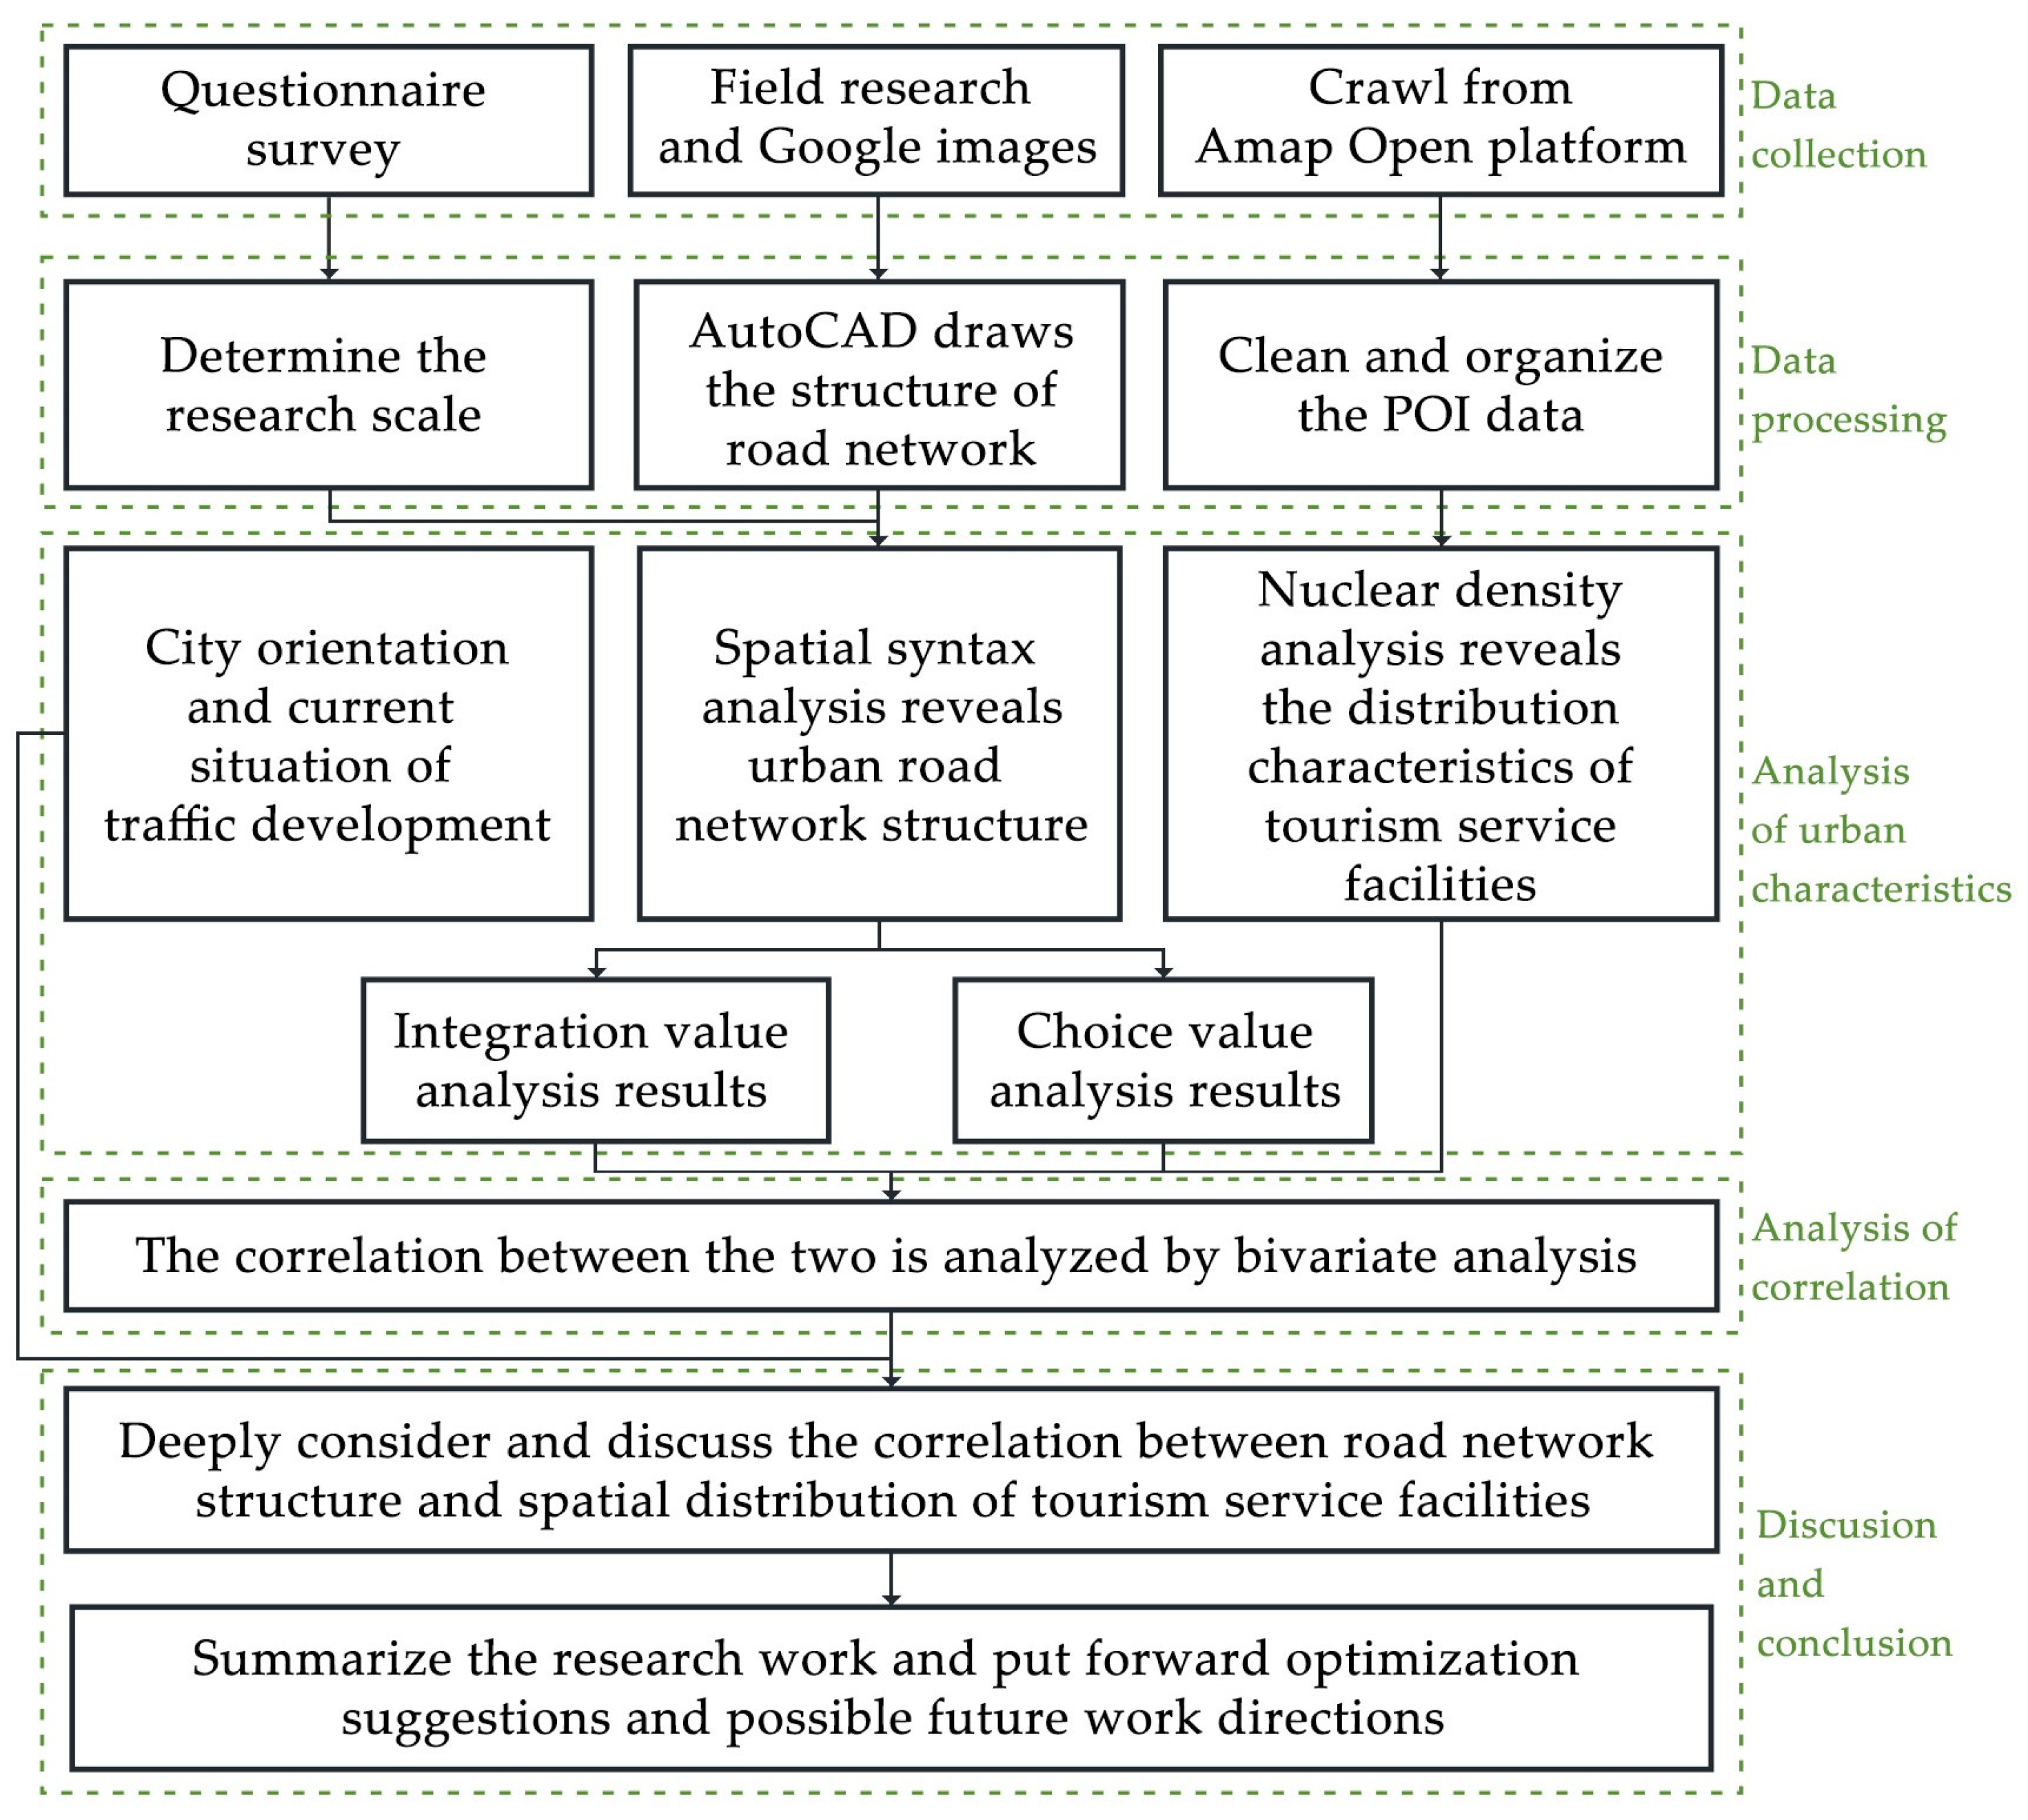
1.4. Paper Overview and Structure

This paper is structured into five main sections: Introduction, Materials and Methods, Results, Discussion, and Conclusions. The aim is to explore the relationship between the road network structure and the spatial distribution of tourism service facilities in Harbin at multiple scales, based on tourists’ travel distance preferences. The paper seeks to provide a scientific planning method for optimizing the city’s road network structure and enhancing the rationality of the spatial distribution of tourism service facilities.
The Introduction section introduces the background and motivation of the study and reviews the existing literature related to tourism service facilities, tourists’ travel distance, road planning, facility siting, and spatial syntax. This section leads to the purpose, methodology, and significance of the study. The Materials and Methods section begins by providing a detailed description of the research scope and the current state of transportation planning in the central city. This is done to gain a deeper understanding of the fundamental characteristics of the research object and to establish the foundation for subsequent analysis. The sources of the obtained data are then introduced. The section concludes by detailing the methods employed in the study. Questionnaire survey is utilized to summarize tourists’ preferences for travel tools, travel time, and travel distance. Additionally, integrating the life circle theory, it considers these factors comprehensively to determine multiple scales for the study. Field research and high-resolution image data from Google Earth are utilized to obtain the structure of the city’s road network. Additionally, web crawler technology is employed on the Amap Open Platform based on specific classification criteria to analyze data containing the Points of Interest (POI) data of tourism service facilities, including spatial attributes and location information. Then, spatial syntax theory is applied to quantify the urban road network structure. Kernel density analysis is applied to reveal the spatial distribution of tourism service facilities in the city. Furthermore, the correlation between the spatial distribution of tourism service facilities and the road network structure is explored through Person’s bivariate analysis method. The Results section presents the specific outcomes derived from data analysis across the study scale. It delves into the characteristics of the road network structure in Harbin, unveils spatial distribution patterns of tourism service facilities, and explores the correlation between the road network structure and the spatial arrangement of various types of tourism service facilities in Harbin at each analyzed scale. The Discussion section provides a thorough interpretation of the results, analyzing the relationship between the road network structure and the spatial distribution of tourism service facilities. It highlights the findings and significance of the study, offering a detailed exploration of the implications and insights derived from the results. Finally, we summarize the study, emphasizing the main findings and practical significance for the development of urban tourism. We put forward suggestions such as optimizing the structure of the urban road network and rationally locating tourism service facilities to meet the challenges faced by the sustainable development of urban tourism. At the same time, we summarize the limitations of the research work and the future work that need to be carried out, with a view to providing theoretical and empirical references for enriching the tourism experience and enhancing the tourism vitality of Harbin and boosting the sustainable development of the city.

2. Materials and Methods
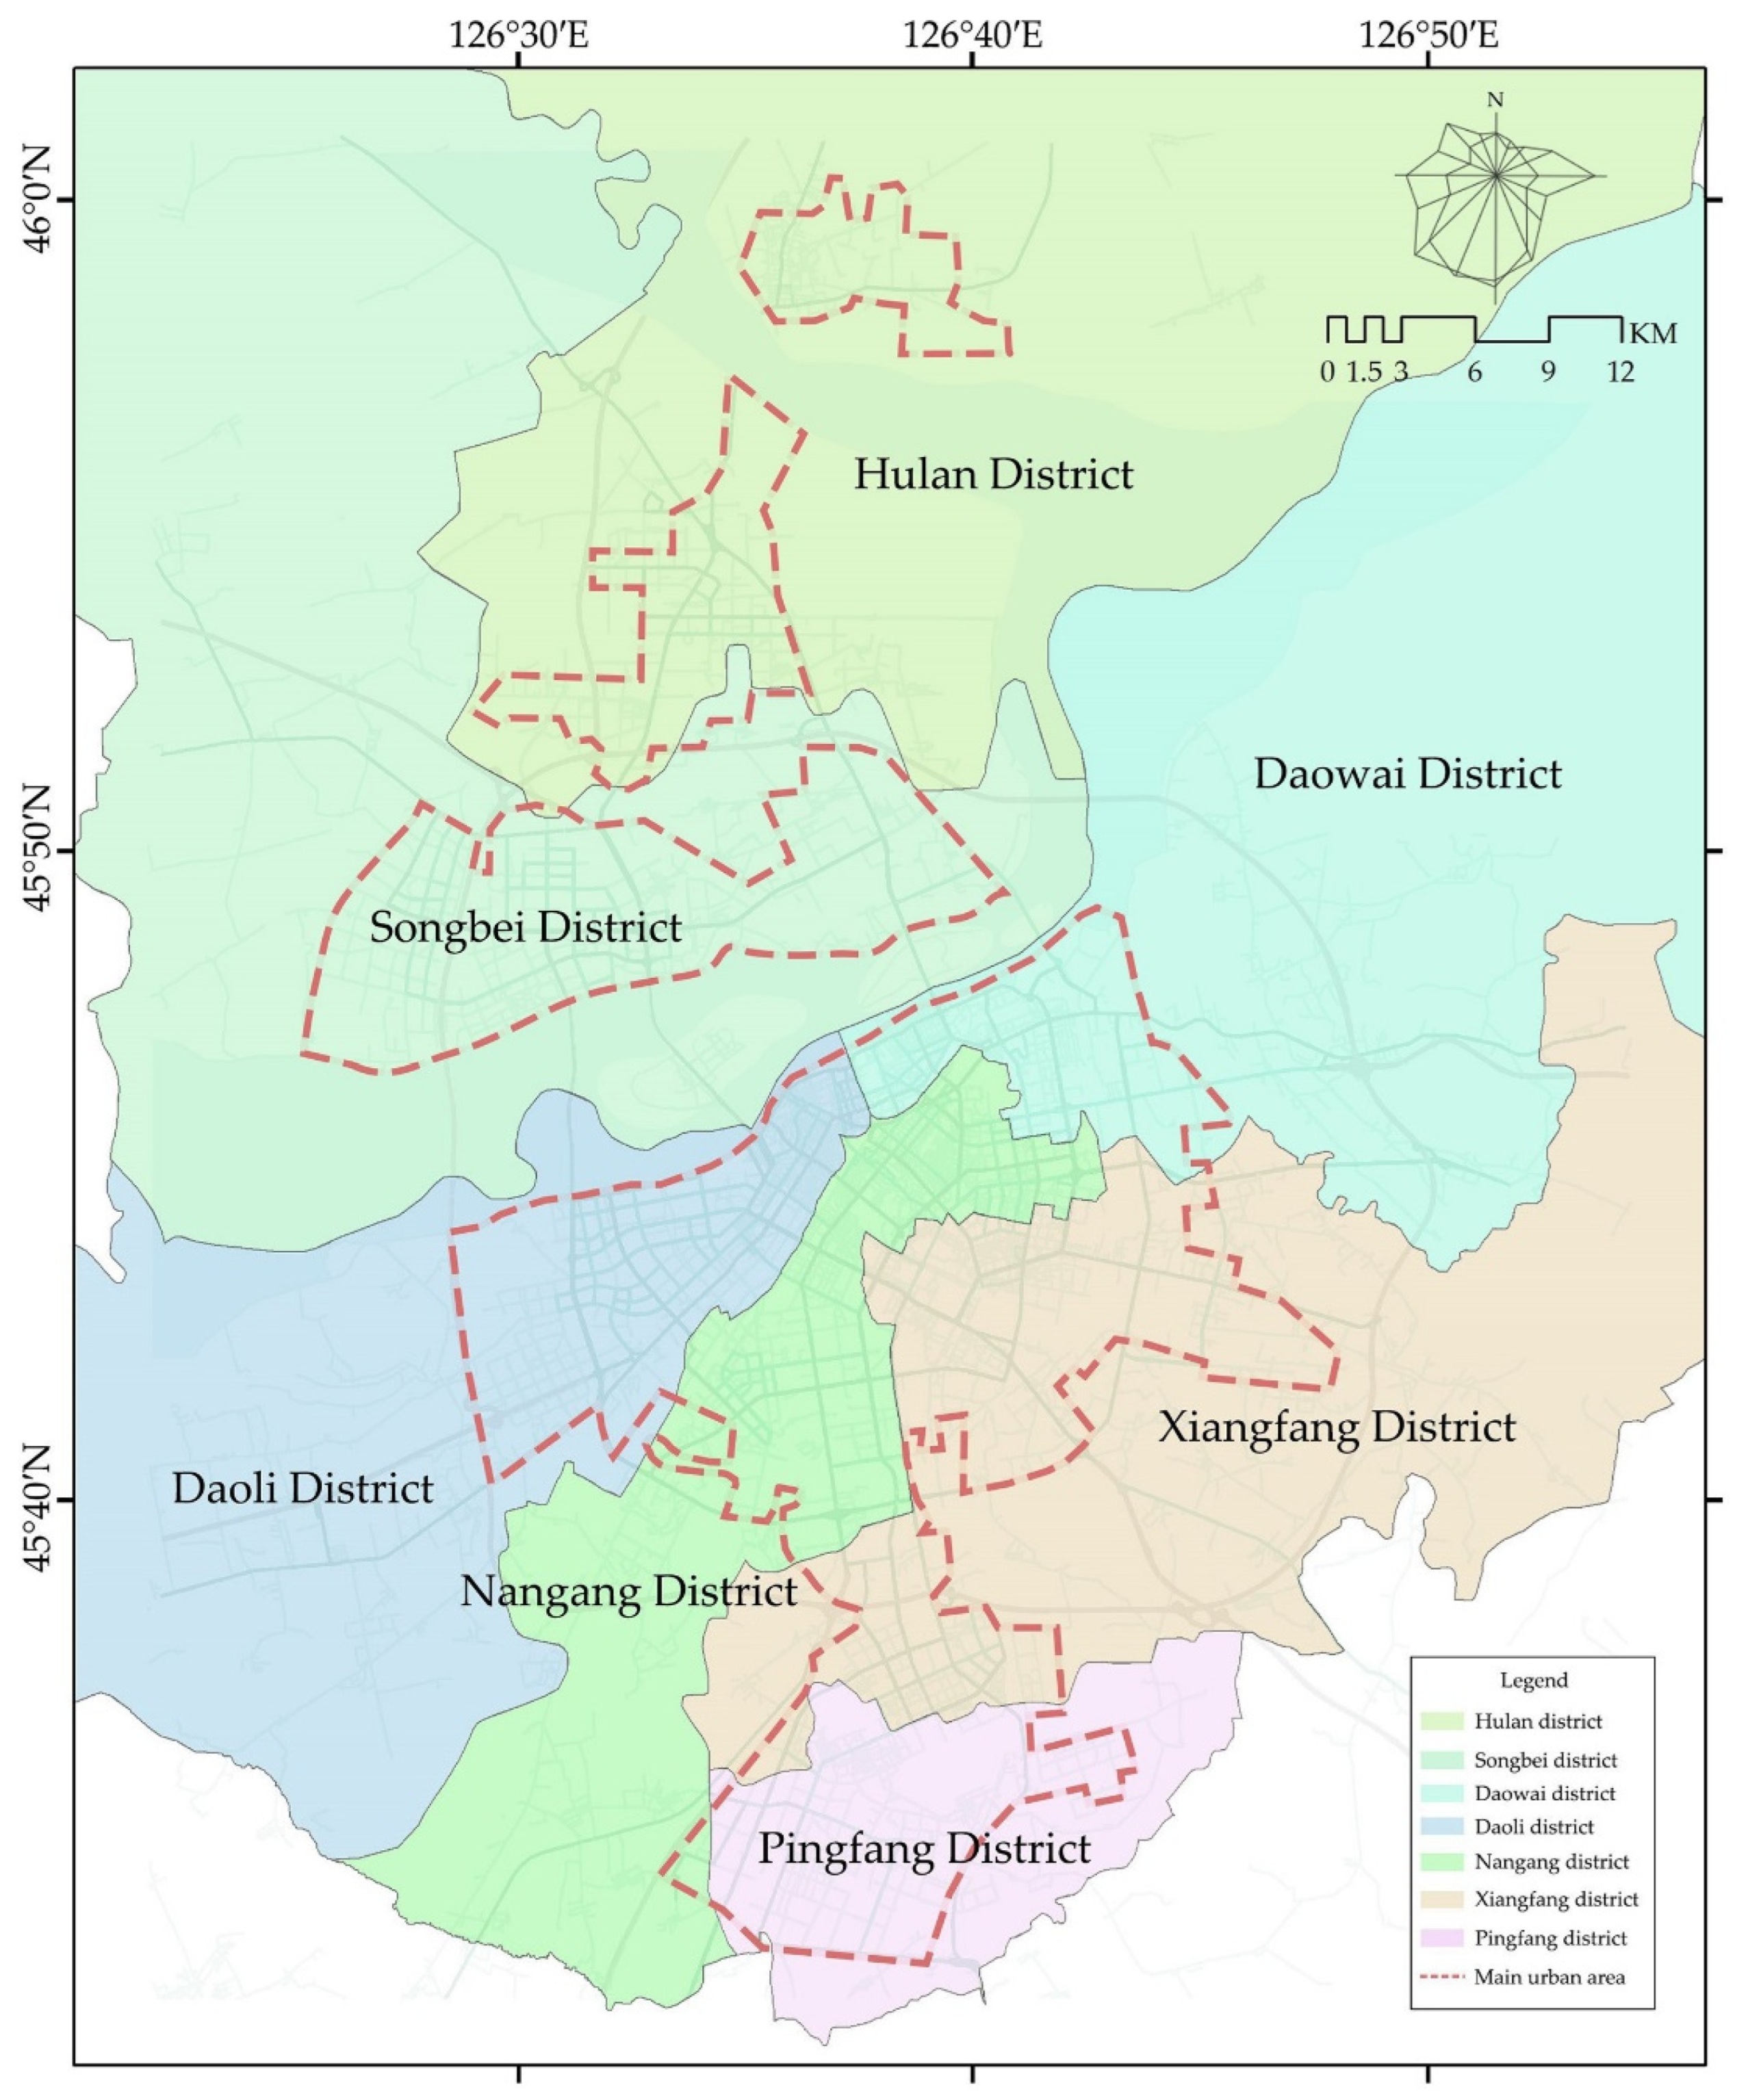
2.1. Research Area

2.1.1. City Orientation

Harbin, as the capital of Heilongjiang Province, is the political, economic, and cultural center in the north-eastern part of China. It is also the largest mega-city among the provincial municipalities in China. Harbin boasts superior geographic conditions. From a global perspective, it is strategically located in the center of Northeast Asia, serving as the first Eurasian continental bridge and an essential air corridor hub. Harbin is often referred to as “the Pearl on the Eurasian continental bridge”. From a national perspective, Harbin is situated in China’s future economic growth pole, being the largest city in the north of the Northeast Economic Circle. Moreover, Harbin is also renowned as a historically and culturally significant city, a popular tourist destination, and an international hub for ice and snow culture. The city boasts rich and diverse tourism resources, coupled with a deep cultural heritage.
In Figure 1, the research scope of this paper encompasses the main urban area as defined by the latest version of Harbin’s urban master plan. This includes the urban built-up areas planned for Daoli District, Daowai District, Nangang District, Xiangfang District, Pingfang District, Songbei District, and Hulan District, with a total land area of approximately 458 square kilometers. Local residents usually consider the Daoli, Daowai, and Nangang districts to be the old town of Harbin. These three districts are among the earliest to undergo development and are home to the most widely known and famous attractions in Harbin. They are widely considered as Harbin’s core area. On the other hand, Xiangfang District, Pingfang District, Songbei District, and Hulan District are generally viewed as the periphery of urban development or new districts still in the initial stage of development.

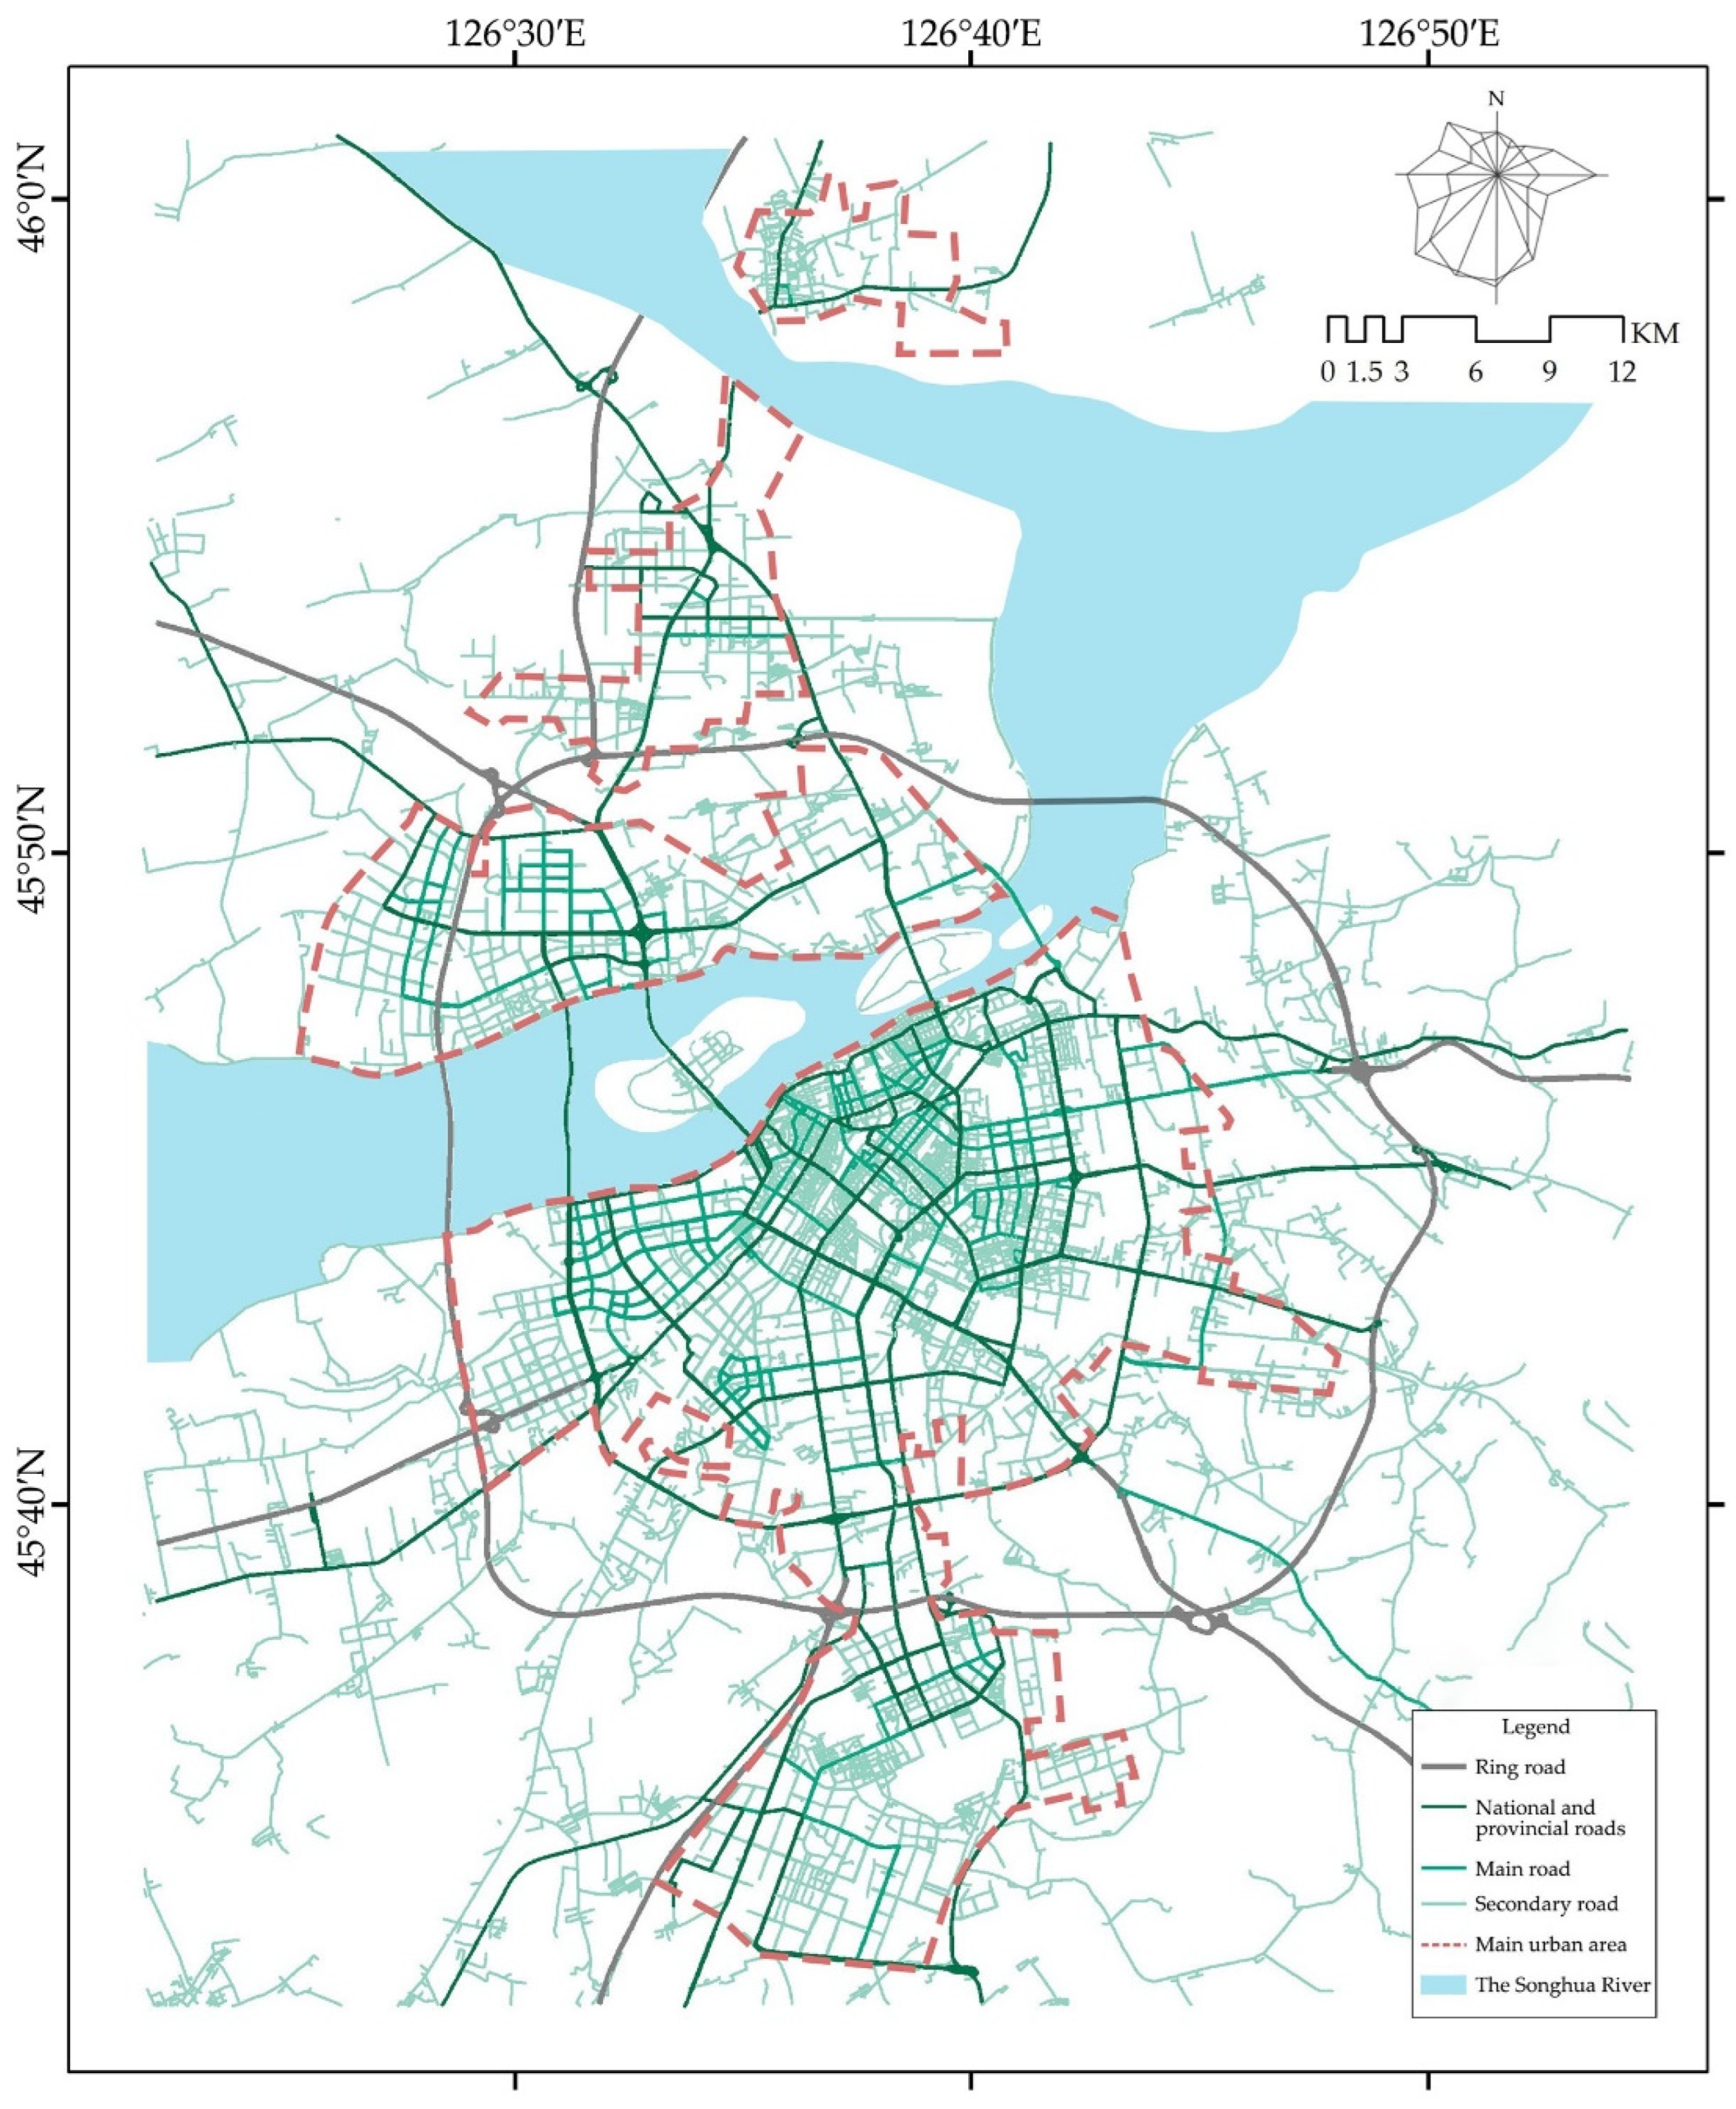
2.1.2. Current Situation of Traffic Development in Central Urban Area

From a macroscopic point of view, Figure 2 illustrates the road network structure of Harbin’s old town, which exhibits a radial pattern with “two axes (East Dazhi Street, West Dazhi Street, Zhongshan Road), four rings (city ring road), and ten radial roads (ten outlets)”. Influenced by railroad lines and the Russian planning system, the regional road network in the old town is more irregular in form, dominated by the square grid and free-form road network, especially in Daoli District, where the free-form road network reaches more than 26% [33]. Almost all the free-form road networks in Harbin are distributed here. The presence of a circular radial road network in Harbin is relatively uncommon, with only two instances identified in the Nangang District around the Jiaohua Square area and in the Daoli District near the Aijian street. The overall scale of both circular road networks is less than 1500 m, and their respective radiation areas are relatively small [33].

2.2. Data Sources

To gain a comprehensive understanding of the current road network structure of Harbin, the research team conducted fieldwork from June to August 2023, complemented by the use of high-resolution image data downloaded from Google Earth. We mapped the road network structure of Harbin in AutoCAD 2021 software, according to the principle of “the longest and the least” [34,35]. Subsequently, we utilized the Depthmap to construct the framework of its spatial morphology model, summarizing its spatial morphology characteristics. Furthermore, we used ArcGIS 10.2 to visually represent this data, systematically summarizing and outlining the spatial characteristics of the city.
In addition, we collected POI data of tourist service facilities, including spatial attributes and location information. These data were obtained from the Amap Open Platform in August 2023. Utilizing web crawler technology, the data were crawled according to specific classification criteria, covering six categories: dining, shopping, transportation, accommodation, entertainment, and attractions in Harbin, totaling 89,380 POIs. Each record includes the name, address, latitude and longitude coordinates, and contact information of the POI. After data collection, we conducted coordinate correction, screening, and de-duplication, and digitized the coordinates using ArcGIS 10.2.

2.3. Research Methods

As shown in Figure 3, this study proposes the following research methods.

2.3.1. Questionnaire Survey

The questionnaire survey method, as a research instrument for collecting subjective information and opinions, involves designing a series of questions for respondents to answer in writing or verbally. Firstly, we clarified the survey objective, which aimed to gain a comprehensive understanding of tourists’ travel behaviors and preferences by collecting their subjective thoughts and opinions. Secondly, we meticulously developed a clearly structured questionnaire with well-defined questions, ensuring comprehensive coverage of various aspects, such as the travel time, travel distance, and travel mode, rather than applying the concept of a 15-min life circle directly. Although the life circle theory can help us understand the behavior patterns of individuals in daily life to a certain extent, tourism is a unique and complex activity. Its decision-making process and influencing factors may differ from those in daily life. The question about travel time preference was used as the starting point of the questionnaire, prioritizing the time they spend on the road, which directly affects their choice of destination (in this study, referring to tourism service facilities). The question of travel distance was placed second because it is also an important consideration, which affects tourists’ arrangements for destinations and travel modes. The question of travel mode was presented last because it is usually considered after determining travel time and distance. Both on-site and online platforms were selected to distribute the questionnaire in the study, ensuring that respondents could express their views freely and comfortably. Finally, the collected data underwent sophisticated statistical analysis, involving the calculation of averages and the creation of graphs to draw conclusions about tourists’ travel preferences.
With the data obtained through the questionnaire survey, we comprehensively considered the objective behavior and subjective feelings of tourists. Through in-depth statistical analysis, we gained a more comprehensive understanding of the relationship between travel preferences and tourists’ exploration of tourism service facilities, providing a more accurate and comprehensive conclusion for the study.

2.3.2. Space Syntax Analysis

Spatial syntax is a quantitative research method used to describe urban morphology based on topological relationships [36], which contains three analysis methods: line-of-sight analysis, axis analysis, and line segment analysis. Considering the directionality of crowd flow in space, the line segment analysis method incorporates metric distance and angle relationships. In this paper, we utilize the spatial syntax arithmetic tool Depthmap 1.0 software to construct the spatial morphology model framework of Harbin. We conduct arithmetic synthesis analysis of the spatial model and adopt two commonly used variables, integration value and choice value [37], to summarize the spatial morphology characteristics of the city.
Integration value refers to the degree of overall unity or coherence between elements in space. It reflects the extent of interrelationship and interconnection among spatial elements, as well as the overall structure or organization they form in space. It serves as a crucial indicator of the degree of spatial aggregation and accessibility. In other words, the higher the integration value, the greater the accessibility of the space. It is defined mathematically as follows:
I i = n log 2 n + 2 3 1 + 1 n 1 D M i 1
where I i is the integration value, n is the number of spatial nodes, and D M i is the average depth value.
Choice value is the number of times a node space is passed through as a mandatory path for the shortest topological path between any two spaces in the system. In other words, a higher choice value indicates that the space has a higher frequency of passage. It is defined mathematically as follows:
E i = 1 N 1 N 2 j = k = 1 N n j , k i n j , k
where E i is the choice of axis I, N is the number of nodes in space, n j , k i is the number of shortest paths passed, and n j , k is the total number of shortest paths in space.

2.3.3. Kernel Density Estimation

Kernel density estimation is a method used to analyze spatial point patterns. It calculates the density of an element within its neighborhood range, reflecting the relative spatial concentration of the element [38]. It is widely used to study the distribution pattern and density characteristics of POI in space, providing support for urban spatial distribution [39,40,41]. By applying the kernel density estimation method, the spatial distribution characteristics of tourism service facilities in Harbin can be identified, and the differentiation of different types of tourism service facilities on the structure of urban road network can be further explored. It is defined mathematically as follows:
f s = i = 1 n 1 h 2 k s c i h
where f s is the kernel density calculation function at s, h is the distance attenuation threshold (bandwidth), n is the number of POI points within a distance less than or equal to h from position s, k is the spatial weight function, and C i is the position of the ith spatial point falling within the circle centered on s with h as the radius. If h is larger, the density profile is smoother, and the density structure is masked, resulting in a larger bias; if h is smaller, the density profile fits the sample better.

2.3.4. Buffer Analysis and Bivariate Correlation Analysis

Buffer analysis is an analytical method used to determine the spatial proximity of geographic elements. In this study, based on the natural break method, the spatial syntactic variables of roads are divided into five levels and standardized, and buffer zones at different scales are established for the road axes corresponding to the values of the variables of each level. In this way, we can precisely identify and define the radiation area of different spatial syntactic variables within the scope of roads of different grades, revealing the spatial distribution characteristics and trends of tourist service facilities.
In order to more accurately grasp and quantify the degree of correlation between the road network structure and the agglomeration of various types of tourism service facilities, we calculated the POI densities of various types of tourism service facilities in the buffer zones at each level. Subsequently, we conducted Person bivariate correlation analyses with the mean values of the spatial syntactic variables of the roads in the buffer zones at each level. It is defined mathematically as follows:
r = X X ¯ Y Y ¯ X X ¯ 2 Y Y ¯ 2
where X , Y denote 2 different variables and X ¯ , Y ¯ denote the expected value of the axial response variable, which in this paper refers to the value of the spatial syntactic variable and the density of POIs of tourism service facilities in the buffer zones at all levels.

3. Results

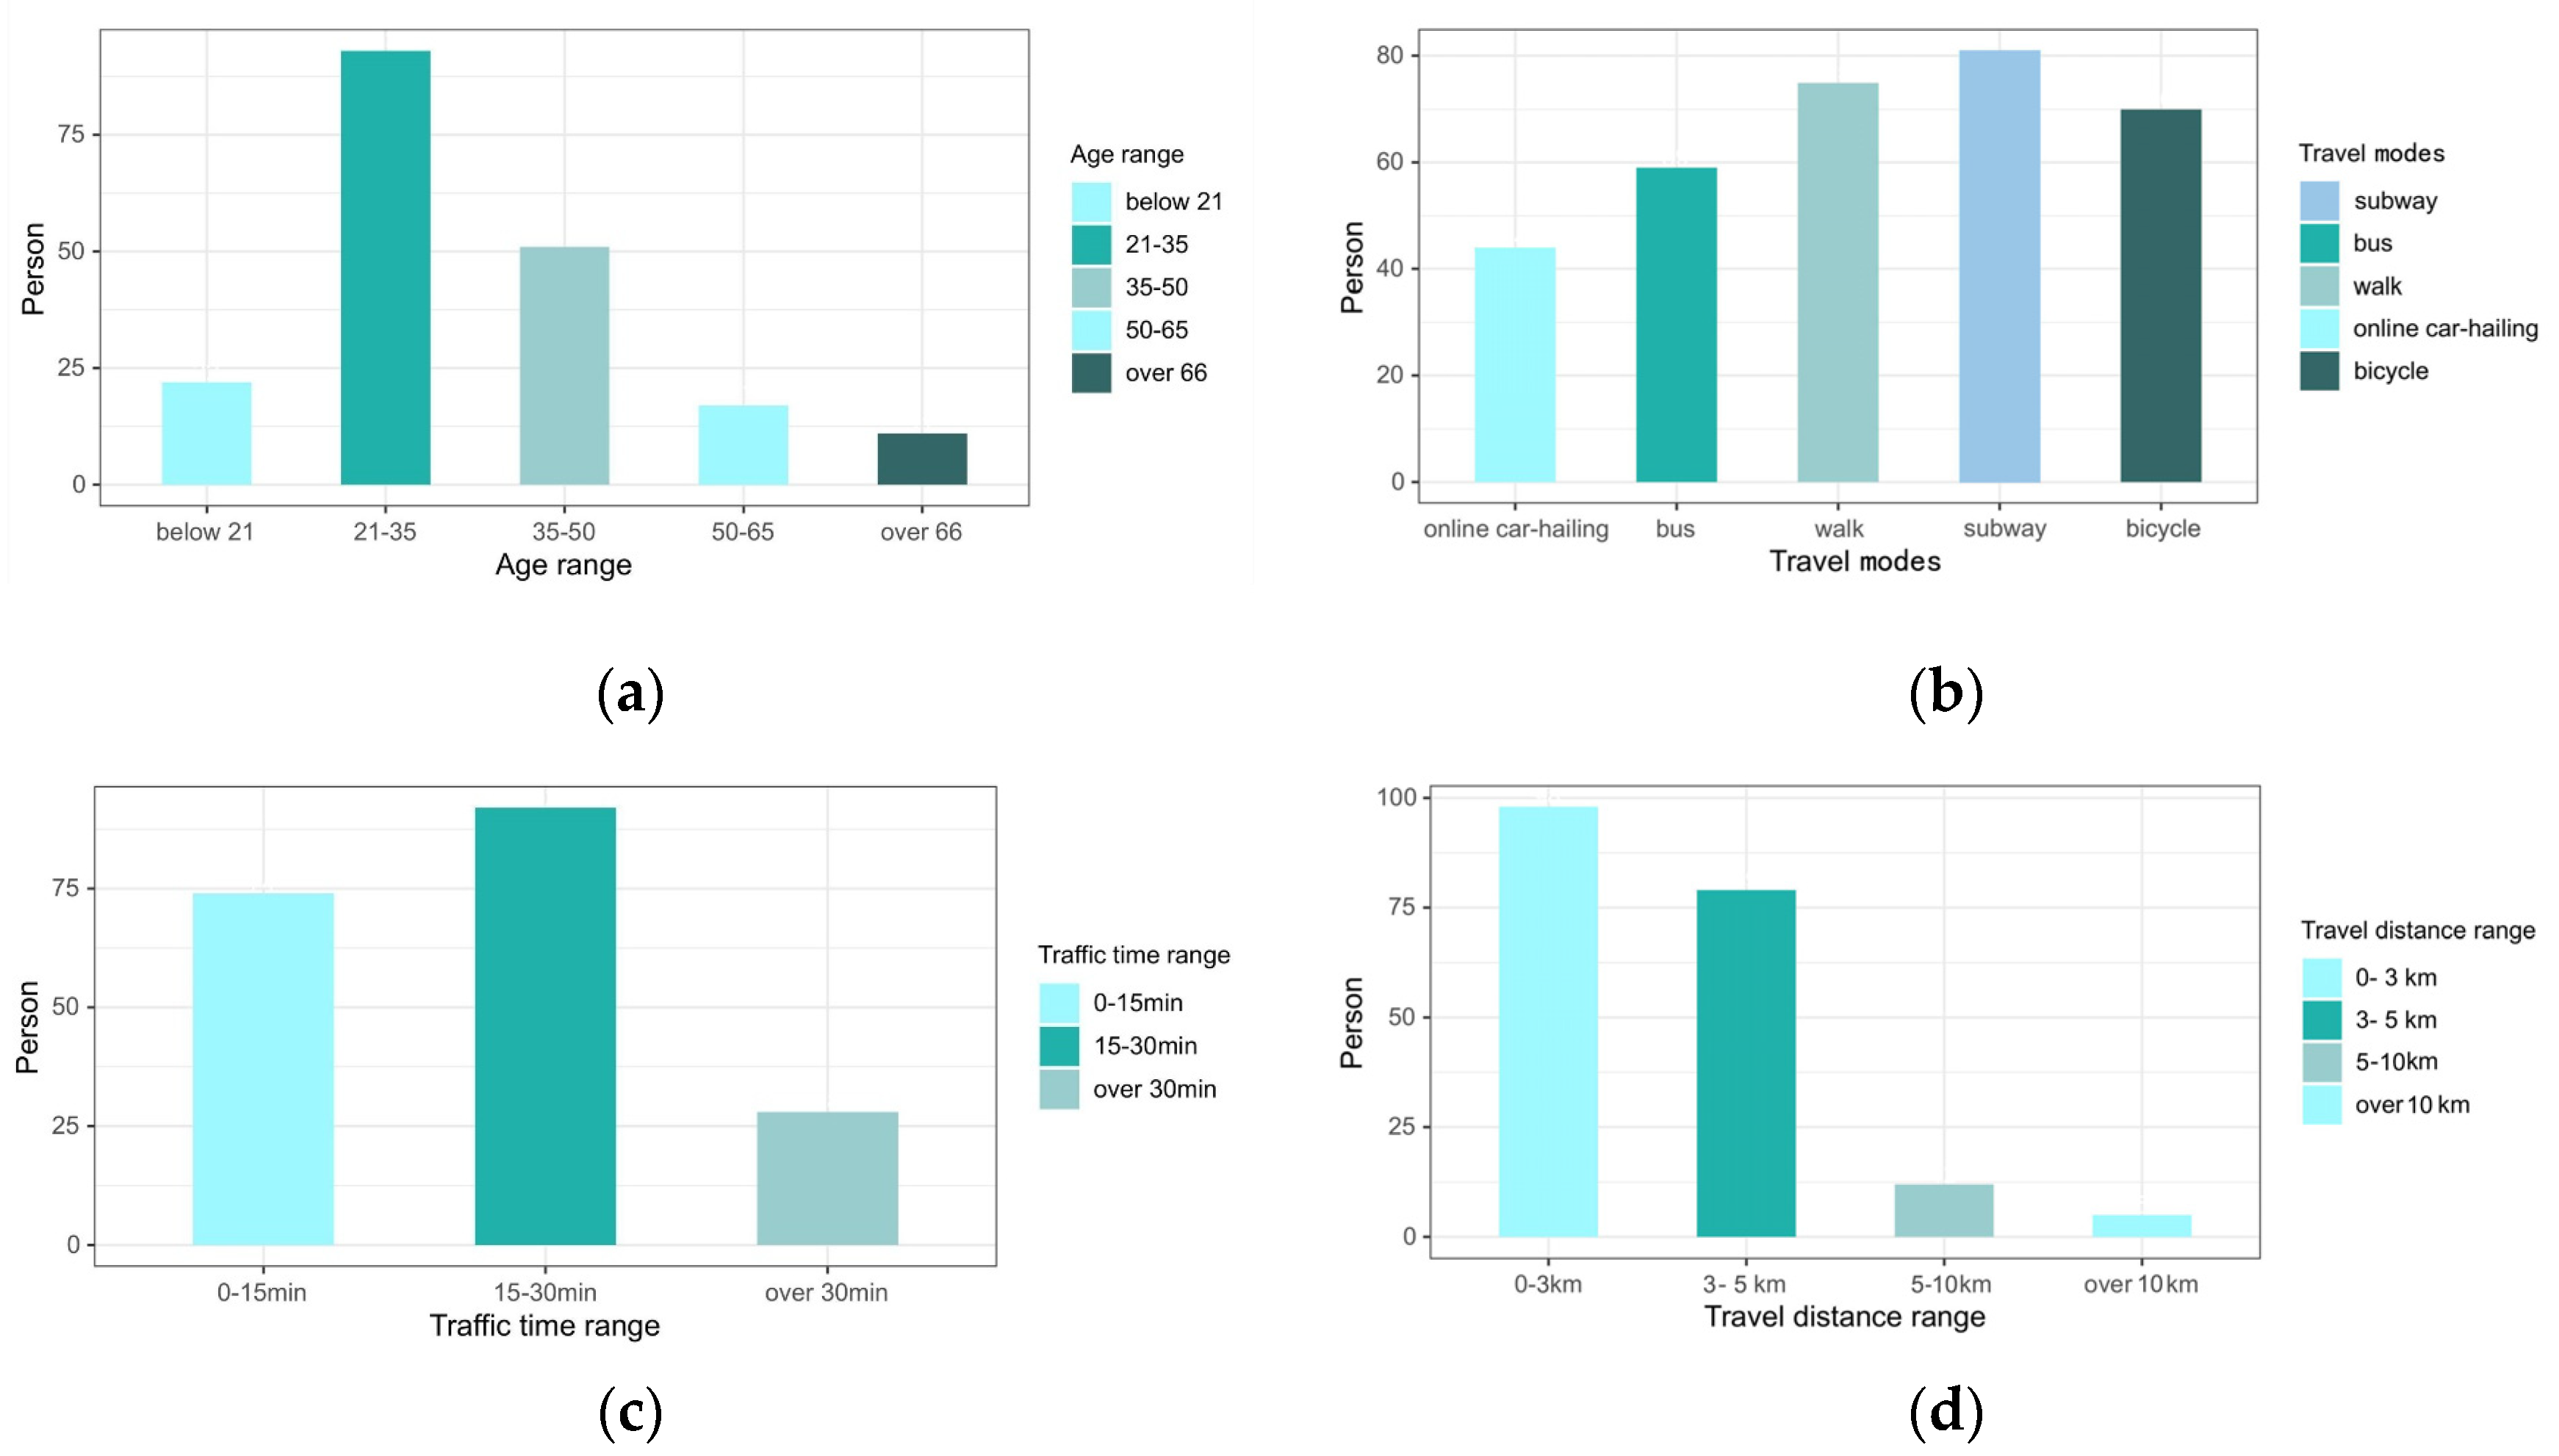
3.1. Analysis of Tourist Behavior

Since we used a non-scale questionnaire rather than a scale questionnaire, we evaluated the validity of the questionnaire through expert review, extensive reference summary, and field investigations. Simultaneously, we conducted a pre-survey on a small scale. Additionally, in the steps of data collection, sample selection, invalid sample processing and other procedures, we strictly adhered to uniform operating standards to reduce possible human errors, ensure data quality, and improve the credibility of our research results. We summarized tourists’ most preferred travel modes, travel time, and travel distance preferences, determining the multiple scales of the study, and the specific questionnaire survey data are shown in Figure 4. A total of 200 questionnaires were distributed, of which 194 were deemed valid. The participants covered various genders, ages, and occupational backgrounds of tourists. The age distribution of the survey respondents is mainly between 21 and 50 years old, and the largest proportion of respondents was in the 21–35 age group, which accounted for 48% of the respondents. The gender distribution among respondents is relatively balanced, with males and females each accounting for 50%. When choosing a tourist service facility as a destination within the central city of Harbin, more than 90% of the respondents expressed a preference for independent travel. Compared to other forms of travel, independent travel can give tourists greater freedom and flexibility, allowing them to make their own arrangements according to their personal interests and preferences. Among them, the popular means of transportation were subway (41.8%), walking (38.7%), bicycles (36.1%), buses (30.4%), and internet rides (22.7%) (Figure 4a). The subway was the most popular because the planning of Harbin subway line and the location of subway station were set according to many popular attractions and business districts. It will save tourists a lot of travel time. It is further learned through interviews that respondents also chose to walk when the travel distance was less than 1000 m (Figure 4b). Meanwhile, according to the survey results, we find that tourists have different preferences for the time they spend on traveling. Approximately 38.1% of the respondents can accept the longest travel time within 15 min, emphasizing the shortest time to quickly reach tourism service facilities. About 47.4% of the respondents can accept a travel time of 15–30 min, showing a preference for spending time moderately to balance between time and experiencing a variety of tourism service facilities. Only 14.4% of respondents can accept more than 30 min of travel time, they prioritize the comfort of travel tools and scenery (Figure 4c). Regarding travel distance, 91.2% of tourists are willing to travel to destinations within 5 km of their current location, with the choice of 3 km or less being the most popular. Only 8.8% of tourists think it is acceptable to travel more than 5 km when choosing a tourist service facility as a destination for free travel (Figure 4d). Through further interviews, we learned that a travel distance of more than 5 km would cause them physical discomfort and entail higher transportation costs. Combining the above findings on travel distance, travel tools, and travel time with the 15-min life circle theory, we stipulate the study scales based on tourists’ travel distance preferences as 500 m, 1000 m, 3000 m, and 5000 m.

3.2. Characteristics of Road Network Structure

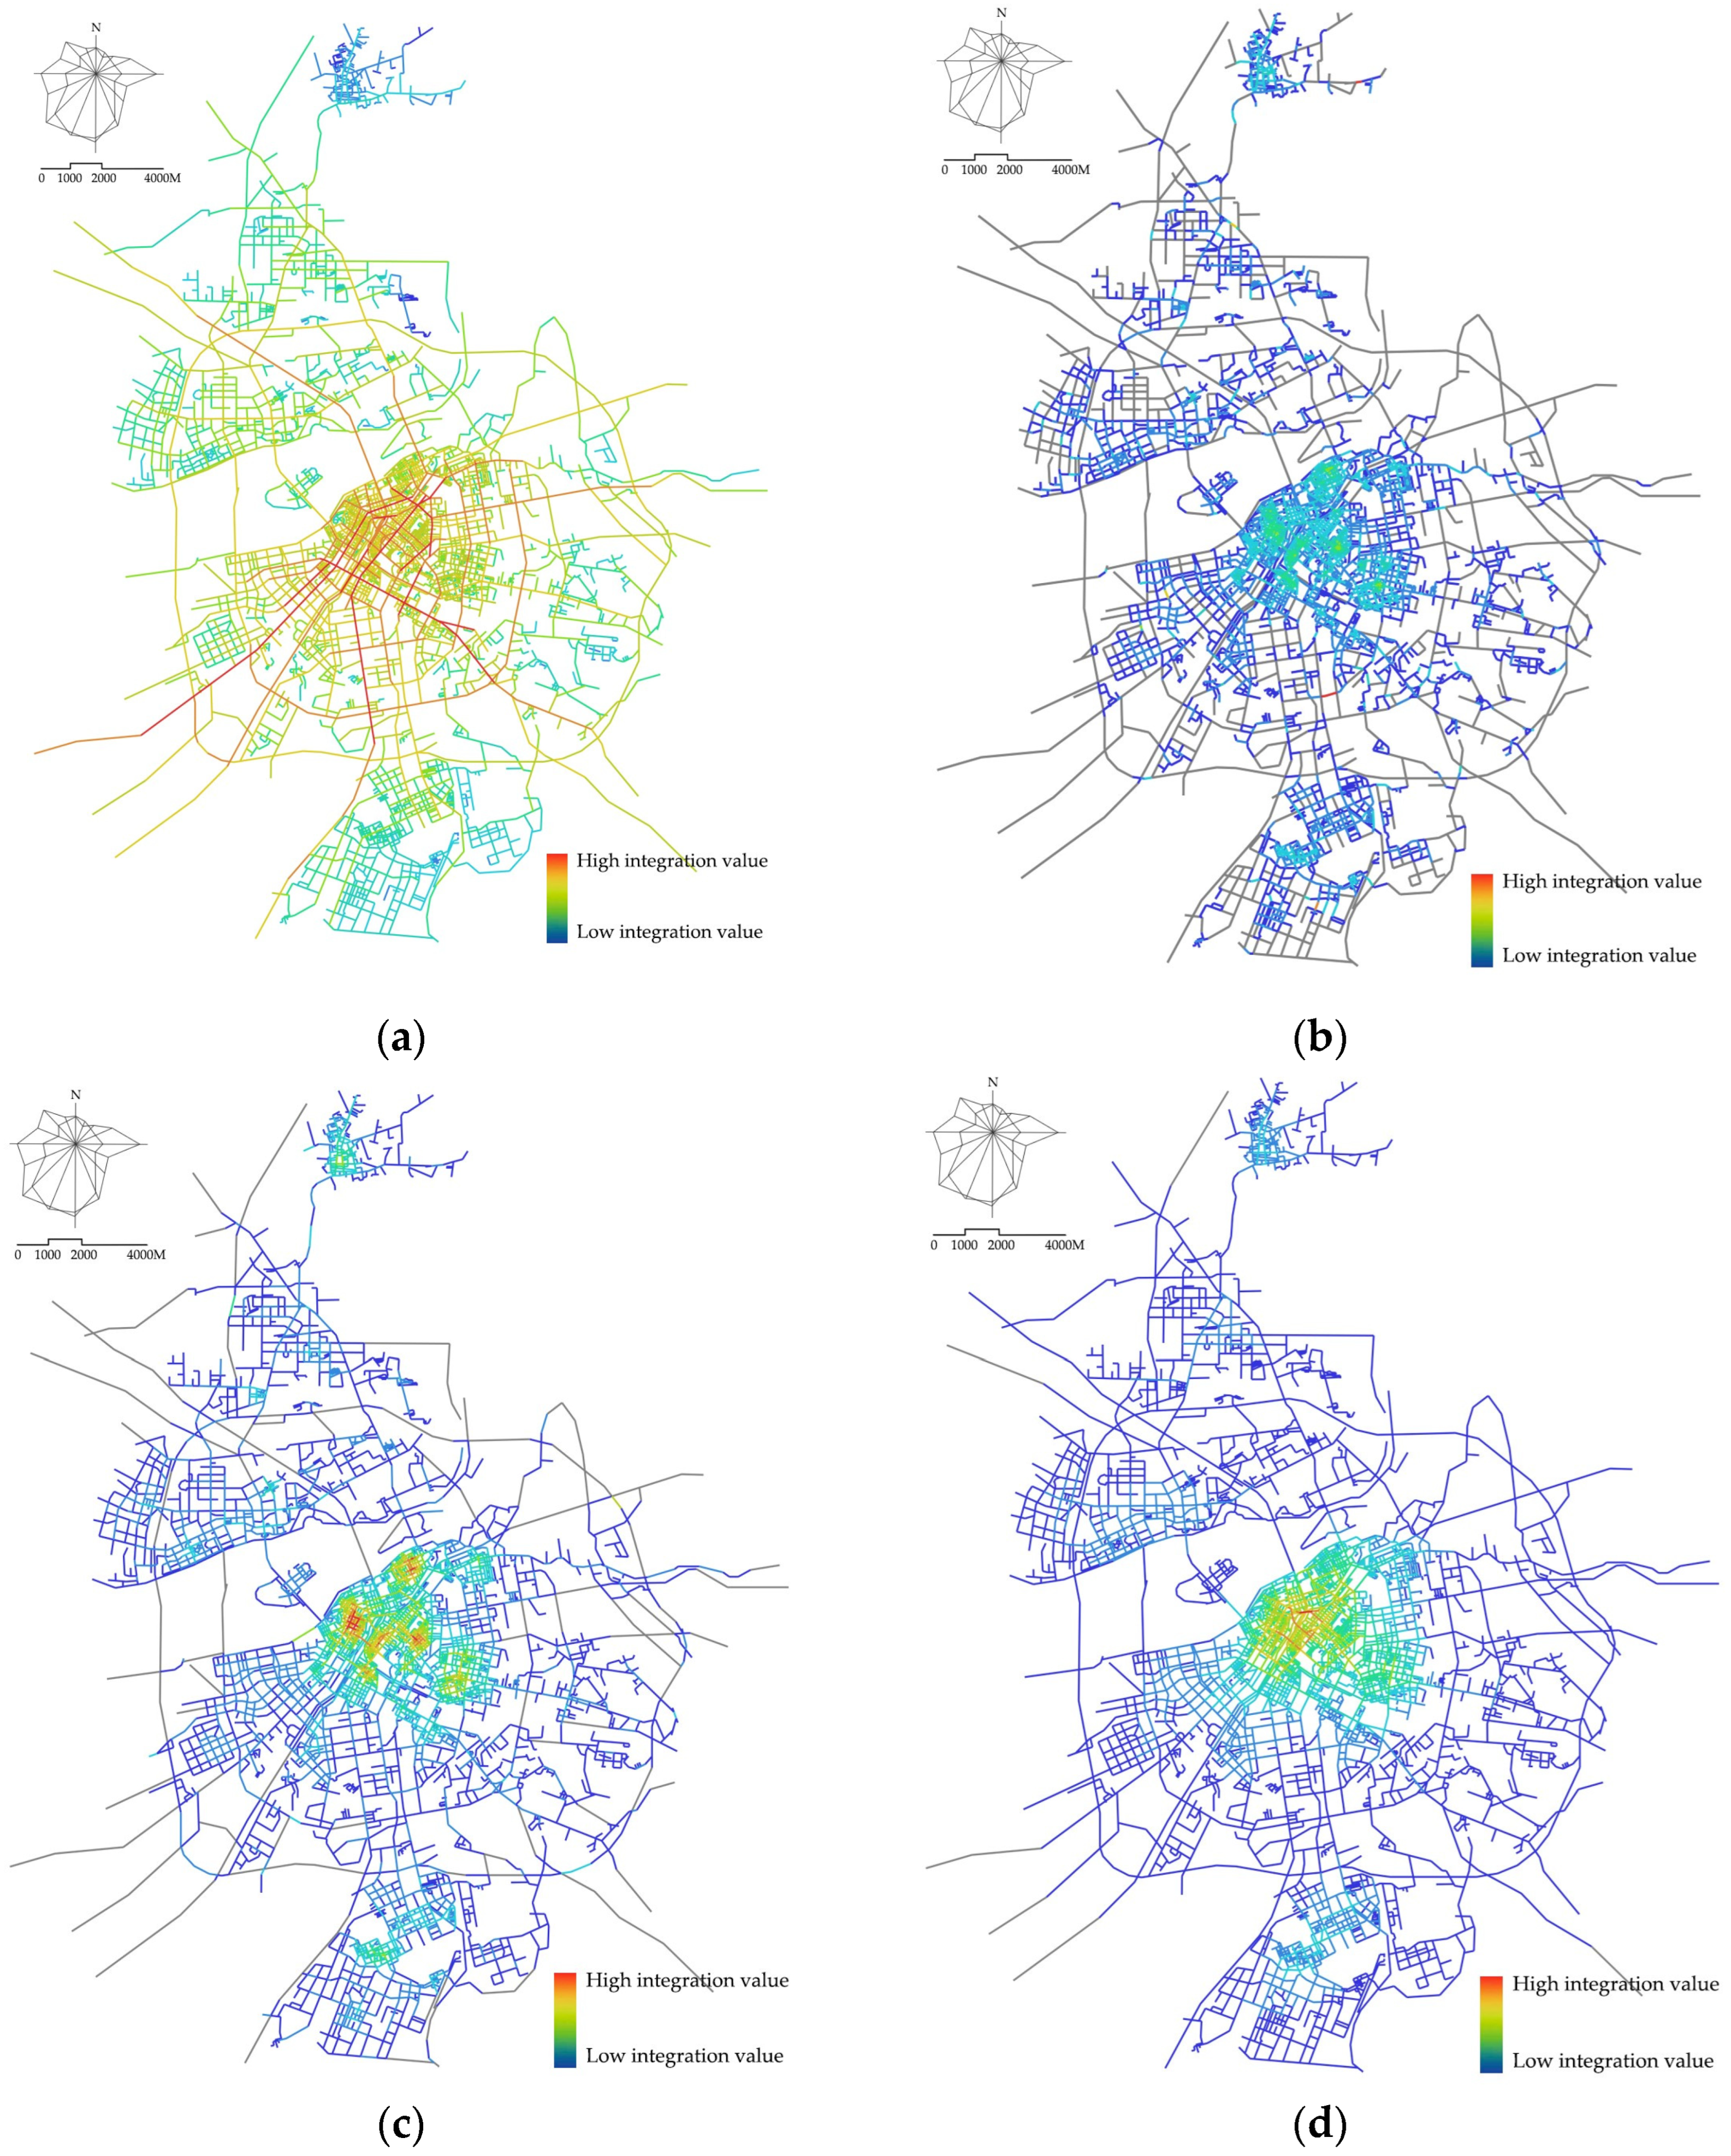
3.2.1. Analysis of Integration

Figure 5 demonstrates the distribution of road integration values in the main urban area of Harbin. The line segments are colored from warm to cold, indicating high to low integration values. The calculation results clearly show that the old town south of the Songhua River exhibits the highest integration value and the best accessibility at all scales. From the perspective of global integration, the roads with relatively high integration include the radial roads connecting Nangang District, Daoli District, and the Bypass Expressway. The next highest are the river crossings (Binzhou Railway Bridge, where you can walk or ride) and the Bypass Expressway, which serve as the most important transportation arteries in Harbin, connecting the administrative districts (Figure 5a). At the 500 m scale, the overall integration value of road in Harbin’s main urban area is low, with the old urban area exhibiting high integration relative to the urban development fringe (Figure 5b). At the 1000 m scale, three high integration cores are formed in the old city, located in the northeast of Daoli District, the southwest of Daowai District, and the north of Nangang District. These cores constitute the accessibility cores of each of the three administrative districts, with strong aggregation and disaggregation effects (Figure 5c). At the 3000 m scale, the high integration area spreads out in all directions with Harbin Station in Daoli District as the core. The local integration advantage of the latter gradually increases, indicating that the roads have higher accessibility at larger scales and better connectivity with external roads (Figure 5d). When the scale is expanded to 5000 m, a square grid-type high integration road network is clearly presented. The main road in the old town located in the northern part of Nangang District, West Dazhi Street and East Dazhi Street, has the highest integration value, and the integration value is thus dispersed outward and gradually weakened (Figure 5e).

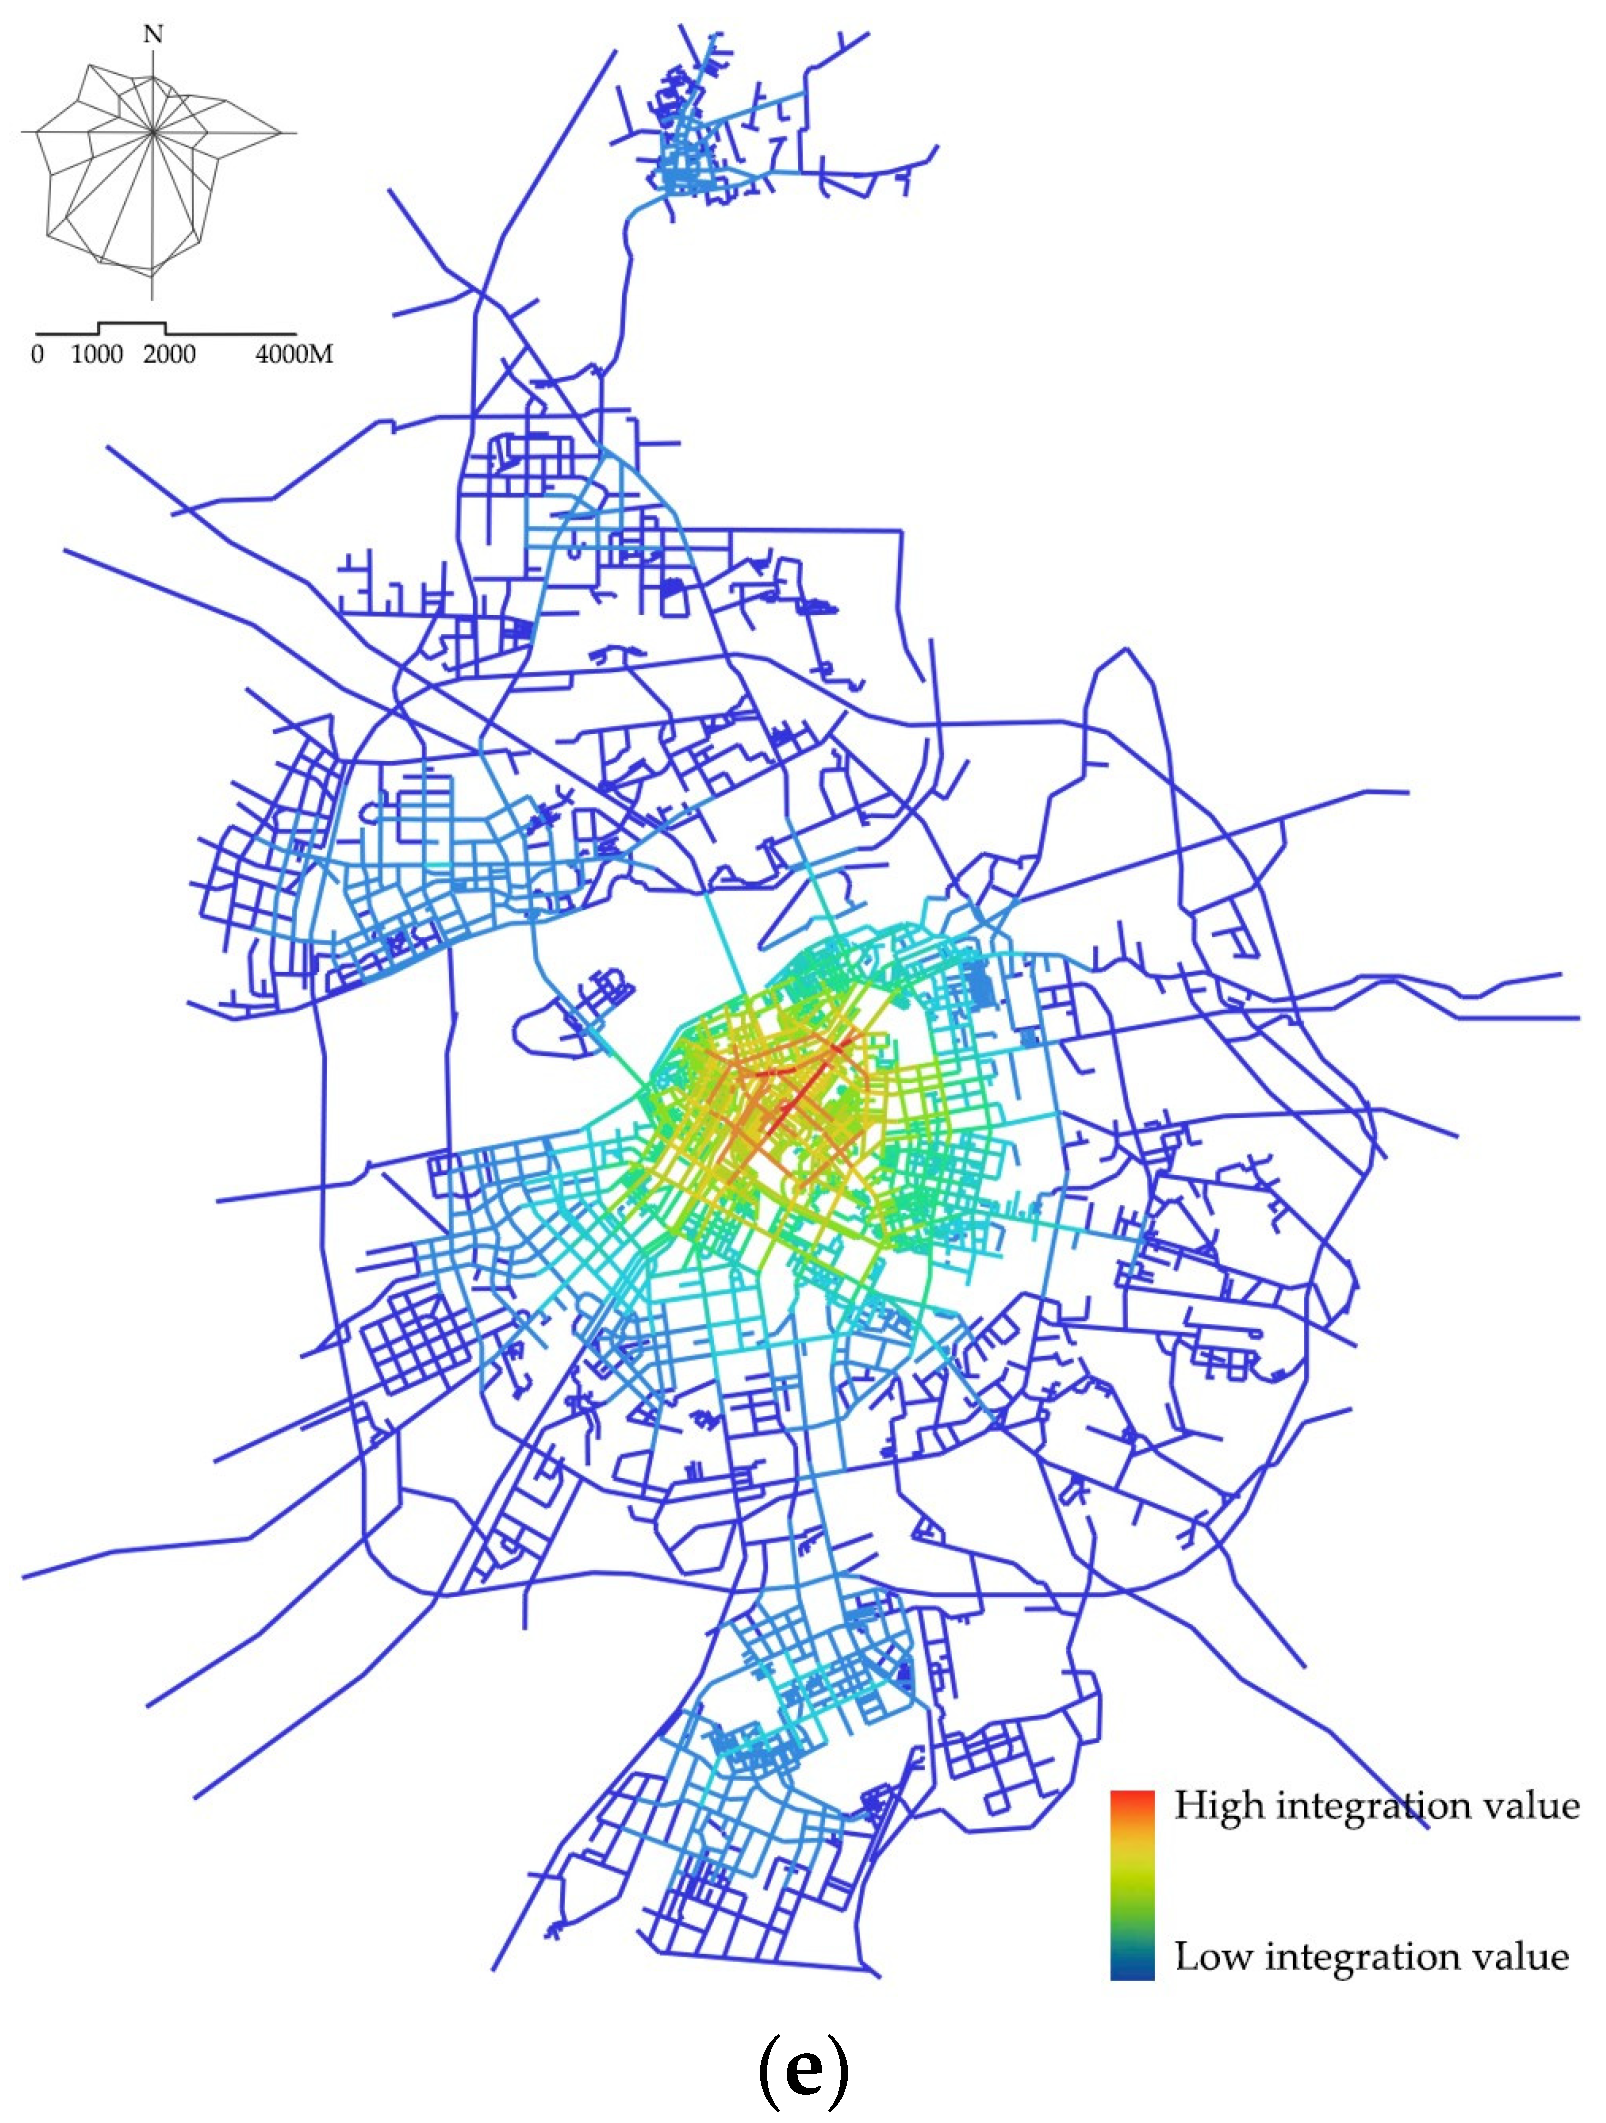
3.2.2. Analysis of Choice

Figure 6 shows the distribution of road choice values in the main urban area of Harbin, with the line segment color ranging from warm to cold indicating the integration value from high to low. The calculation results clearly show that the roads with higher choice at the global scale are, in order, the radial roads connecting Nangang District, Daoli District, and the Bypass Highway, the river crossing, and the Bypass Highway (Figure 6a). These results are similar to the findings of the global integration value calculations, indicating that these roads are not only highly accessible but also roads with a high probability of pathways, carrying a large amount of pedestrian and vehicular traffic in the city. At the scales of 500 m and 1000 m, the roads with high choice are distributed in clusters in the eastern part of Daoli District, the western part of Daowai District, the northern part of Nangang District, and the northern part of Xiangfang District (Figure 6b,c). With the expansion of the scale to 3000 m, the high-choice roads are gradually transformed from short-distance roads to long straight roads, mainly located in the area of the square grid road network in Nangang District (Figure 6d). When the scale is expanded to 5000 m, the local roads with high choice still show a square grid pattern distribution. However, the dominance of the areas with high choice value starts to increase, gradually extending to the west and east, covering the western part of Daoli District and the northern part of Xiangfang District (Figure 6e).

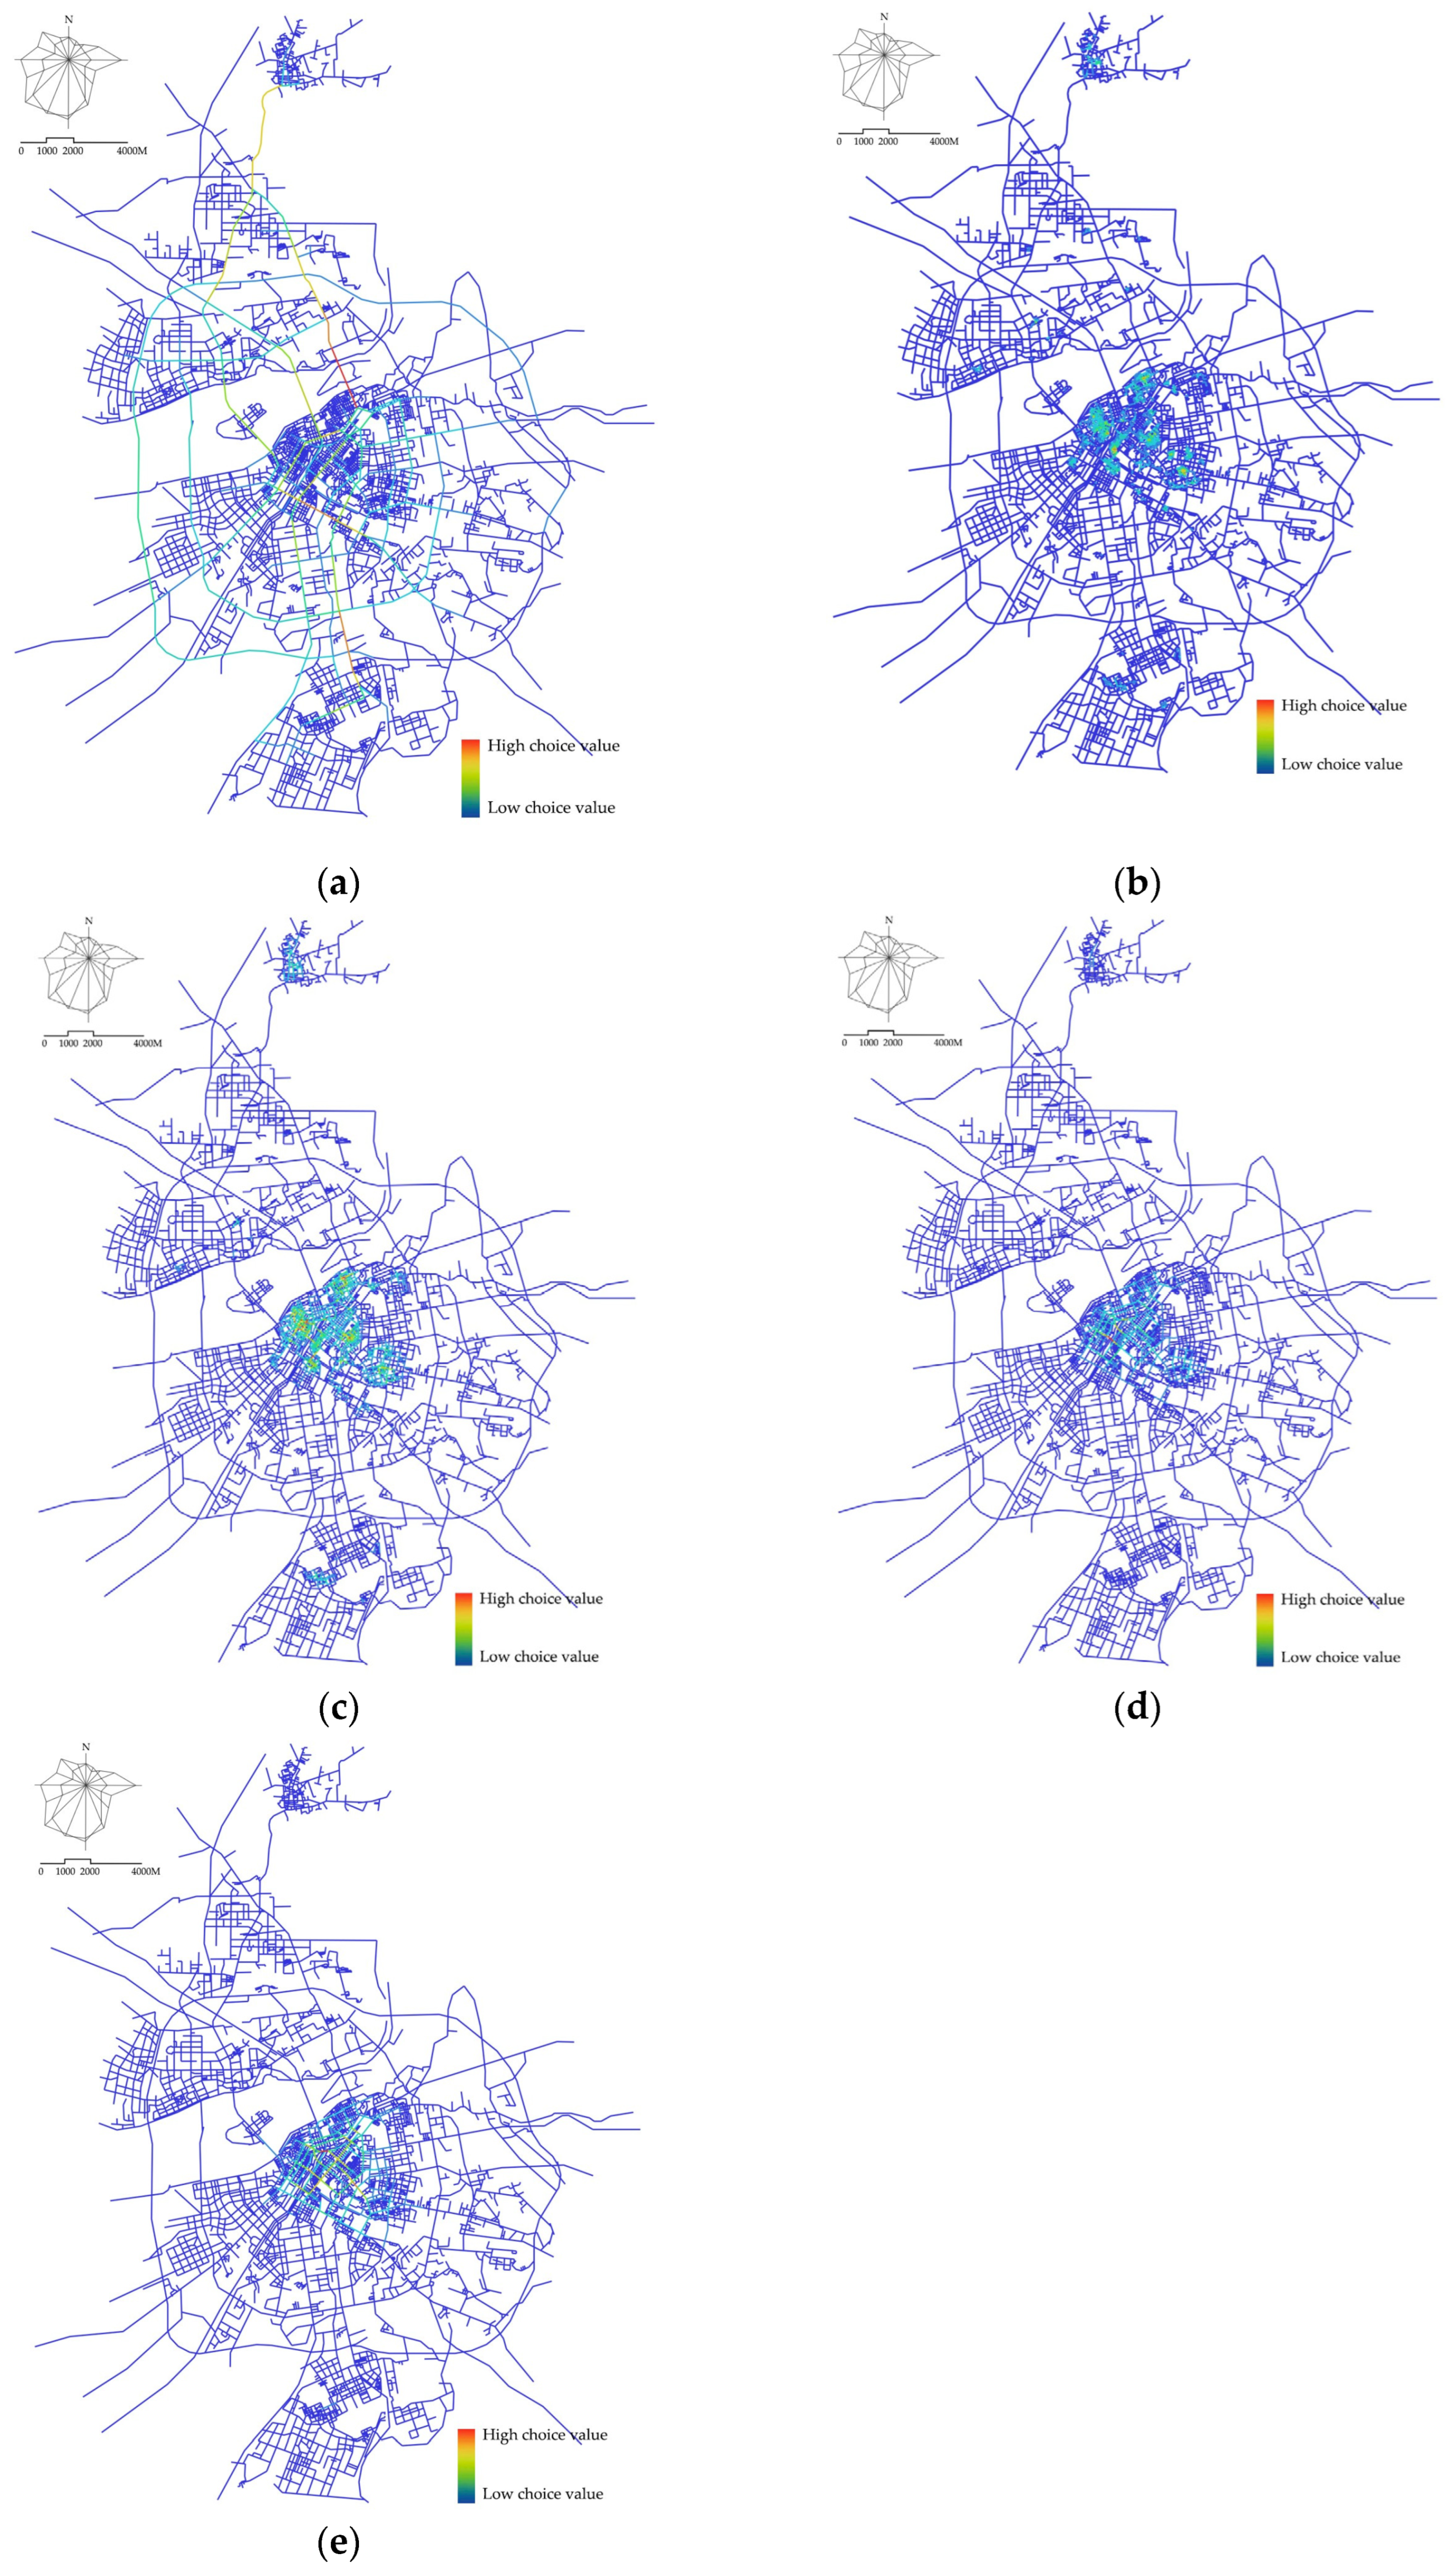
3.3. Spatial Distribution of Tourism Facilities

As the dominant digital map content, navigation, and positioning service provider in China, Amap Open Platform provides detailed geographic information. The research uses Python 3.10 software to crawl the POI and related attribute data of the catering facilities of the Amap Open Platform (https://lbs.amap.com, accessed on 18 August 2023) in August 2023, through the API interface. The specific types and numbers of facilities are shown in Table 1, and the spatial distribution characteristics of each type of facility are illustrated in Figure 7.
The six types of tourism service facilities contained within the main urban area total 89,380. Tourism service facilities form several close-knit, high-density cores within Harbin’s old town, and relatively high-density sub-cores in the south of Songbei District, the south of Hulan District, the western part of Xiangfang District, and the southeastern part of Pingfang District (Figure 7a). The distribution characteristics of nuclear density in dining and shopping service facilities (Figure 7b,c) exhibit similarities. Specifically, the primary concentration core is situated along the Zhongyang street in the northeast region of Daoli District, with a gradual decrease in density towards its periphery. Zhongyang Street is 1.4 km long, extending from the Songhua River in the north to Harbin Station in the south. Built at the end of the 19th century, it initially served as a residential area for Russian immigrants. Through numerous alterations and developments, it gradually transformed into a bustling commercial pedestrian street, with dining, shopping, and entertainment as its main attractions, making it the busiest commercial street in Harbin.
The main clustering area of transportation facilities is the parking lot and its combination with public transportation stations, which shows a dense regional distribution at the intersections of Daoli, Daowai, Nangang, and Xiangfang districts (Figure 7d). The reason for this is not only to be able to serve tourists on Zhongyang street, but also because in the past transportation planning of Harbin, the chevron road distribution in the old town prompted planners to put more roads. The reason is that in the past, the square road distribution in the old city prompted the planners to concentrate more transportation facilities on these regular intersections and road nodes.
The two high-density cores extend outward around Harbin West Station in the eastern part of Daoli District and Harbin Station in the western part of Daowai District (Figure 7e). These stations are among the most crucial transportation hubs in Harbin, closely connected to other transportation services such as buses and internet rides, facilitating convenient transfers for tourists within the city. It is common for tourists or business travelers to seek accommodations around these train stations for easier arrivals and departures.
Entertainment facilities form multiple agglomeration cores within the old town south of the Songhua River (Figure 7f). These facilities are primarily situated near the city’s commercial hotspots with large shopping centers, attracting a significant number of people and thereby boosting tourist spending. The distribution of attraction service facilities reveals two primary cores and multiple secondary cores (Figure 7g). The two main aggregation centers are located in Zhongyang Street and Sun Island Scenic Area along the banks of the Songhua River, while the secondary cores are relatively evenly distributed within the old town, with sporadic distribution in the fringe areas of urban development.

3.4. Correlation between Road Network Structure and Spatial Distribution of Tourism Service Facilities in Harbin at Multiple Scales

The analysis of road structure indicators aims to study the degree of dependence of tourism service facilities on the overall traffic organization at multiple scales. In this study, the value of spatial syntactic variables for roads are classified into five levels using ArcMap with the natural breakpoint method. And the buffer zone is then established for the road axis corresponding to the variable values of each level, and the number of POIs for tourism service facilities in the buffer zone at each level is counted, and the density is calculated. Further, Pearson bivariate correlation analysis is performed between the density and the corresponding mean value of each variable to reveal the correlation between the spatial syntactic variable values and the spatial distribution of tourism service facilities at each scale.

3.4.1. Analysis of the Association between Road Structure and Various Types of Tourist Service Facilities

The data in Table 2 show that there is a statistically significant correlation between the integration value and the spatial distribution of tourism service facilities in the global perspective. An increase in the integration value of road is positively correlated with an increase in the density of all types of tourism service facilities in the corresponding buffer zones, and is significantly correlated with all facilities, dining, shopping, transportation, accommodation, and recreation tourism service facilities at the 0.01 level (two-tailed), with r-values of 0.978, 0.978, 0.977, 0.980, 0.982, 0.982, respectively. The correlation between integration and attraction facilities is not significantly correlated with an r-value of 0.832. According to the data in Table 3, choice value does not have a significant correlation with the spatial distribution of tourism service facilities.

3.4.2. Analysis of the Association between Road Structure and Various Types of Tourism Service Facilities at Multiple Scales

According to the data shown in Table 4, firstly, there is a certain homogeneity in the correlation between the integration value and the spatial distribution of various types of tourism service facilities across all scales. The highest value of correlation between the spatial distribution of facilities in the dining, shopping, transportation, accommodation, and entertainment categories and the integration value all appeared at the 500 m scale, with r-values of 0.988, 0.993, 0.999, 0.991, 0.998. Furthermore, the correlation between dining, shopping, and entertainment facilities and the integration value increased with the scale. Second, the correlation characteristics of transportation facilities and all facilities with integration value are similar and all show significant correlation at 0.01 level (two-tailed) at all scales. Third, accommodation and attraction facilities did not change regularly with integration value at different scales.
According to the data in Table 5, we find that the correlation between the choice value and the spatial distribution of various types of tourism service facilities is the most significant when the scale is 3000 m, and there is a certain homogeneity in the trend of the correlation as the scale changes. When the scale ranges from 500 to 3000 m, the correlation reaches its highest value, increasing with the scale. Conversely, when the scale extends from 3000 to 5000 m, the correlation gradually decreases. This suggests that Harbin’s tourism service facilities not only tend to cluster in areas with high accessibility but also exhibit a preference for areas with elevated choice values, particularly at the 3000 m scale.

4. Discussion

With the evolution of the city’s development stage and the rise of self-media, Harbin has emerged as a focal point for cultural tourism, drawing a significant number of tourists and generating considerable economic value. Therefore, it is crucial to concentrate on the spatial distribution of Harbin’s tourism service facilities at this stage. This focus will not only enhance the city’s attractiveness as a cultural tourism hotspot but also ensure a coherent and smooth travel experience for tourists within the city.
Roads are not only a substantial part of the urban space, but also a key medium to facilitate the connection of tourists with tourism services in the city. This paper takes the main urban area of Harbin as the research object, takes the travel distance preferred by tourists as the scale basis, and proposes a spatial level research method to analyze the integration and choice of roads in the main urban area of Harbin by using Depthmap 1.0 software. This method not only considers roads as a medium connecting tourism service facilities and tourists but also regards them as a crucial element in shaping the experience of tourists and guiding the flow of tourists. Meanwhile, an association model between the road network structure and spatial distribution of tourism service facilities is constructed using ArcGIS buffer analysis and Pearson’s bivariate correlation analysis to quantitatively assess the correlation between them. In summary, this study provides insights into the relationship between the road network structure and the spatial distribution of tourism service facilities in Harbin at multiple scales.
Roads and tourism service facilities with high integration and choice values at all scales are relatively concentrated in the old town of Harbin. Excessive centralized development may exacerbate traffic congestion problems in the old town, negatively affecting tourists’ travel experience and increasing environmental pressure. This over-concentration may also lead to an unbalanced distribution of tourism investment and service levels in the future, triggering issues related to population mobility and unbalanced urban development due to employment [42].
At the global scale, the integration value significantly and positively contributes to promoting the agglomeration of tourism service facilities in dining, shopping, transportation, accommodation, and entertainment, demonstrating a “high-high” agglomeration pattern. This suggests that road accessibility has a significant influence on the distribution of these tourism service facilities. This result reaffirms the conclusions of previous studies indicating that roads with high accessibility play a crucial role in shaping business models [20,21]. Roads with high accessibility not only directly contribute to the increase in tourists but also attract more tourism service facilities to cluster in the area, creating a multiplier effect of agglomeration [43,44]. At multiple scales, these facilities tend to cluster, especially in areas with high integration values formed when accessibility is high and the scale is 500 m. This may be attributed to the fact that at smaller scales, people are more likely to perceive the convenience of various amenities in the space by walking [45]. Simultaneously, this convenience increases the frequency of people moving within the area.
Unlike dining, shopping, and entertainment facilities, the spatial distribution of accommodation facilities and attraction facilities does not precisely follow the regular changes in the integration value. This could be attributed to the fact that certain accommodation facilities, particularly higher star-rated hotels and “nongjiale”, prefer to be situated in places with pleasant landscapes and relative quietness. Meanwhile, the attractiveness of some attraction facilities (e.g., churches, ancient ruins, etc.) is primarily derived from their own history and culture. Consequently, their spatial distribution does not rely on the characteristics of pedestrian movement determined by the structure of the road network. However, transportation facilities are consistently and significantly correlated with integration values at the 0.01 level (two-tailed) regardless of the scale. Transportation accessibility encompasses the probability of tourists’ choices of various transportation modes and the passage and transfer time of these modes [46]. Transportation facilities tend to be densely installed in areas with high integration values, contributing to the improvement of travel convenience for both citizens and tourists.
In a global perspective, roads with high choice values are more focused on providing fast and smooth connections between administrative districts rather than specializing in catering to tourism needs. In addition, high levels of noise and pollution often exist around major transportation arterial roads [47], making it inappropriate to lay out tourism service facilities in their vicinity. However, at the 3000 m scale, the facility distribution showed a significant correlation with the choice value. This correlation indicates that the distribution of tourism service facilities is more likely to be influenced by the choice value at this scale.
This study demonstrates the feasibility of investigating the spatial distribution characteristics of tourism service facilities based on the spatial syntactic variables of urban road structure. The results of the study can offer valuable insights for facility siting and road planning. Additionally, the study will propose a series of recommendations to enhance the road network structure and spatial distribution patterns of various tourism service facilities within the main urban area of Harbin, aiming to promote its overall tourism development. At the same time, through these efforts, we aim to share experiences that can serve as valuable insights for other cities, fostering the continuous optimization and development of urban tourism and visitor experiences across multiple scales.

5. Conclusions

5.1. Summary and Recommendations

The primary micro-level contribution of this study is the enhancement of tourists’ travel experience in the city, thereby fostering the overall sustainable development of urban tourism. On a macroscopic level, the study extensively explores the correlation between the road network structure and the spatial distribution of tourism service facilities in Harbin. This investigation is based on tourists’ travel distance, utilizing spatial syntax, kernel density analysis, buffer analysis, and Person’s bivariate correlation analysis. These comprehensive analyses open new avenues for both planning practice and academic research. The study not only addresses existing research gaps but also surpasses the limitations associated with traditional planning experiences. It offers academic value and practical references for related fields, aiming to expand the research framework to encompass all tourist cities.
A total of the following three optimization suggestions are proposed for the research results of this paper:
  • In the process of selecting sites for dining, shopping, and entertainment facilities, priority is given to non-traffic arterial roads with high accessibility within the main urban area. The areas with high integration value at the 500 m scale and high choice value at the 3000 m scale are considered optimal choices for the siting of these types of tourism service facilities. Since there is less undeveloped land in the main urban areas and the renewal pattern is mainly based on stock planning [48], the utility of the facilities can be improved by refurbishing existing buildings. While considering road accessibility, pedestrian accessibility and traffic flow are emphasized to ensure a high level of regularity and systematicity in site selection, so that tourists can explore the city coherently with multiple modes of travel. This enhances the overall tourism experience and urban attractiveness;
  • It is recommended to formulate and implement a balanced regional development plan. The creation of multiple urban sub-centers is suggested to guide the even distribution of tourism service facilities in each region and achieve a fair allocation of resources and services. For Harbin’s old town, it can continue to take the route of comprehensive development to attract diversified groups of tourists. In the city’s fringe districts, the dining and shopping facilities can be strategically located to match the character of the respective attractions. This approach aims to provide more convenient services for tourists, satisfying their basic needs during the attraction-visiting process. In addition, proposing effective marketing strategies based on tourists’ behavior can be formulated to attract more tourists to different regions, improve their stay time and consumption level, thereby promote the development of regional tourism economy [49];
  • Destination mobility is considered an important component of sustainable tourism planning [50]. To improve the accessibility of tourism service facilities, the road network should be improved based on the distribution characteristics of the facilities. To solve the problem of poor road accessibility in new areas and urban fringe areas in the initial stage of development, a comprehensive transportation plan should be formulated according to the travel characteristics of tourists. In addition, planners should prioritize the development of public transport and slow traffic systems in scenic areas, and adopt traffic management measures to coordinate links with the transport network of the old town to reduce its traffic pressure and ensure the maximum benefit of tourists’ time [51]. What’s more, it should also take into account the future development needs of the area and emphasize the sustainability and flexibility of transportation planning.

5.2. Research Limitations and Future Works

Although this study achieved a series of meaningful findings, there are also some limitations that need to be fully considered in future work.
Firstly, our study exclusively focuses on the main urban area of Harbin, which imposes certain limitations on the generalizability of the findings. Future research endeavors could broaden the scope of investigation to encompass more cities with diverse industries, cultures, and road network structures. This expansion would facilitate a more comprehensive understanding of the variations among different cities and provide more specific references for urban planning and tourism development. For other cities with limited or fragmented data, one can first try to integrate the data resources as much as possible and compare them with Harbin’s data. Alternatively, more in-depth field research and observation can be conducted to understand the actual situation and development needs of the city and collect more empirical data and information.
Secondly, we utilize specific spatial analysis methods and tools, including Depthmap 1.0 software and ArcGIS 10.2 software in our study. Future studies may benefit from cross-validation using multiple spatial analysis methods, such as hotspot analysis and spatio-temporal data modeling. The combination of these methods ensures a comprehensive examination of the study object and increases the credibility and robustness of the study.
Finally, although we have considered a variety of factors in our study, there are still some uncovered factors that may affect tourists’ travel preference and the spatial distribution of tourism service facilities. Future studies can consider factors such as fluctuations in pedestrian flow and seasonal changes at different times and locations in a more refined manner. Additionally, future planning can be cross-explored with governmental guidance, spatial design, landscape design, and heritage protection to conduct in-depth studies through a broad vision and the application of scientific methods. This will provide more comprehensive references and lessons for the development, preservation, and optimization of the city’s tourism industry.

Author Contributions

Conceptualization, X.S. and Z.W.; methodology, X.S. and Z.W.; formal analysis, X.S.; investigation, X.S. and Z.W.; resources, X.S. and Z.W.; data curation, X.S.; validation, X.S. and L.D.; writing—original draft preparation, X.S. and Z.W.; writing—review and editing, X.S. and L.D.; supervision, L.D.; project administration, L.D. All authors have read and agreed to the published version of the manuscript.

Funding

This research received no external funding.

Data Availability Statement

The original contributions presented in the study are included in the article, further inquiries can be directed to the corresponding author.

Acknowledgments

The authors gratefully acknowledge the participation of those interviewed in the questionnaire, which provided the basis for this study. We also thank the professors of the Faculty of Architecture and Design for their support and guidance.

Conflicts of Interest

The authors declare no conflicts of interest.

References

  1. Wang, X. Winter Tourism Marketing Strategy Research of Harbin. Master’s Thesis, Northeast Forestry University, Harbin, China, 2009. [Google Scholar]
  2. Sun, X.; Meng, K.; Wang, L.; Shang, S.; Wu, C. Evaluation of urban tourism competitiveness: A case study of Harbin and Shenyang. China Econ. 2018, 1, 182–184. (In Chinese) [Google Scholar]
  3. Zhao, X.; Zhang, L.; Wu, H.; Na, S. Study on assessment and developing potential of rural tourism resources in Harbin based on AHP method. Chin. J. Agric. Resour. Reg. Plan. 2019, 40, 180–187. (In Chinese) [Google Scholar]
  4. Wu, D. Countermeasures Exploration of Improvement of Harbin Tourism Public Service System. Master’s Thesis, Heilongjiang University, Harbin, China, 2015. [Google Scholar]
  5. Harbin Municipal People’s Government. Harbin Receives 10.093 Million Tourists during the Spring Festival Holiday. Available online: https://www.harbin.gov.cn/haerbin/c104464/202402/c01_969055.shtml (accessed on 22 February 2024).
  6. Wang, Z.; Wang, Z. The Spatial-temporal Influence of Highway Transportation Development on the Efficiency of Tourism Development: Taking Changsha-Zhuzhou-Xiangtan Urban Agglomeration as an Example. J. Jishou Univ. Soc. Sci. 2020, 41, 64–71. [Google Scholar]
  7. Wang, M.; Yang, J.; Hsu, W.-L.; Zhang, C.; Liu, H.-L. Service Facilities in Heritage Tourism: Identification and Planning Based on Space Syntax. Information 2021, 12, 504. [Google Scholar] [CrossRef]
  8. Liu, X. Tourism service improvement based on Quality Gap Model. In Proceedings of the 30th Chinese Control Conference, Yantai, China, 22–24 July 2011; pp. 5748–5752. [Google Scholar]
  9. Xu, S.; Chen, L.; Liu, Y. Study on Planning Strategies of Small Tourist Town Resource Integration—Take the Example of Hongshi Town, Jilin Province. Appl. Mech. Mater. 2013, 409, 904–907. [Google Scholar] [CrossRef]
  10. Diao, Z. Establishment of rural tourism service system in Heilongjiang province based on Sustainable development concept. Foreign Econ. Relat. Trade 2023, 1, 64–67. (In Chinese) [Google Scholar]
  11. Yuan, J. Research on planning of tourism service facilities in mountain tourism resort: A case study of Maoshan Tourism Resort in Jintan, Jiangsu Province. Anhui Archit. 2022, 29, 22–24. (In Chinese) [Google Scholar]
  12. Xiao, Y.; Yi, J. Retracted: Research on the Planning and Layout of Tourism-Type Villages and Towns Based on Hunan Regional Characteristics. In Proceedings of the 2018 3rd International Conference on Smart City and Systems Engineering (ICSCSE), Xiamen, China, 29–30 December 2018; pp. 779–783. [Google Scholar]
  13. Ma, Y.; Jiao, H. Quantitative Evaluation of Friendliness in Streets’ Pedestrian Networks Based on Complete Streets: A Case Study in Wuhan, China. Sustainability 2023, 15, 10317. [Google Scholar] [CrossRef]
  14. Zhang, W.; Wen, L. Analysis of the Coordination Effects and Influencing Factors of Transportation and Tourism Development in Shaanxi Region. Sustainability 2023, 15, 9496. [Google Scholar] [CrossRef]
  15. Wang, Y.; Wang, M.; Li, K.; Zhao, J. Analysis of the Relationships between Tourism Efficiency and Transport Accessibility—A Case Study in Hubei Province, China. Sustainability 2021, 13, 8649. [Google Scholar] [CrossRef]
  16. Zheng, Q.; Kuang, Y.; Huang, N. Coordinated Development between Urban Tourism Economy and Transport in the Pearl River Delta, China. Sustainability 2016, 8, 1338. [Google Scholar] [CrossRef]
  17. Liu, Z.; Zhang, T. Layout Planning Methods of Tourism Road Considering Tourism Value and Traffic Demand. In Proceedings of the International Conference on Transportation and Development, Seattle, Washington, DC, USA, 26–29 May 2020. [Google Scholar]
  18. Hillier, B. Space is the Machine: A Configurational Theory of Architecture; Space Syntax: London, UK, 2007. [Google Scholar]
  19. Wang, H.; Rao, X.; Feng, C. Spatial segregation and social marginalization: On the transformation of Lijiang’s ancient city. City Plan. Rev. 2014, 38, 84. (In Chinese) [Google Scholar]
  20. van Nes, A. The Impact of the Ring Roads on the Location Pattern of Shops in Town and City Centres. A Space Syntax Approach. Sustainability 2021, 13, 3927. [Google Scholar] [CrossRef]
  21. Huang, Y.; Zhang, Z.; Fei, J.; Chen, X. Optimization Strategies of Commercial Layout of Traditional Villages Based on Space Syntax and Space Resistance Model: A Case Study of Anhui Longchuan Village in China. Buildings 2023, 13, 1016. [Google Scholar] [CrossRef]
  22. Qian, Z.; Liu, Q.; Huang, D. Three Scales and Planning Trends of 15-Minute Life Circle. Urban Plan. Int. 2022, 37, 63–70. (In Chinese) [Google Scholar]
  23. Mckercher, B. The Implicit Effect of Distance on Tourist Behavior: A Comparison of Short and Long Haul Pleasure Tourists to Hong Kong. J. Travel Tour. Mark. 2008, 25, 367–381. [Google Scholar] [CrossRef]
  24. Wu, X.; Guan, H.; Han, Y.; Ma, J. A tour route planning model for tourism experience utility maximization. Adv. Mech. Eng. 2017, 9, 1687814017732309. [Google Scholar] [CrossRef]
  25. Wu, G.; Guan, S.; Xu, Y.; Chu, C.; Zhu, Z. The Closer, the Better? Impact of Tourists’ Psychological Distance on Their Travel Intention in the Post-Pandemic Era. J. China Tour. Res. 2023, 1–24. [Google Scholar] [CrossRef]
  26. Urbonavicius, S.; Andruliene, R.; Adomaviciute, K.; Ozretic-Dosen, D. The Role of Travelling Distances: Different Planning, Different Motives. Bull. Geogr. Socio-Econ. Ser. 2023, 60, 145–156. [Google Scholar] [CrossRef]
  27. Arfananda, M.G.; Nasution, S.M.; Setianingsih, C. Selection of Bandung City Travel Route Using The FLOYD-WARSHALL Algorithm. Int. J. Integr. Eng. 2020, 12, 90–97. [Google Scholar] [CrossRef]
  28. Lu, B.; Yang, J.; Wang, X. Tourism route planning of urban suburb based on tourist experience. J. Chongqing Jiaotong Univ. Nat. Sci. 2021, 40, 161–170. (In Chinese) [Google Scholar]
  29. Han, Z.; Wang, H.; Mao, H. Travel Characteristics and Traffic Demand Prediction of Tourism Featured Towns Take Hengdian Town as an Example. In Proceedings of the International Conference on Transportation and Development, Beijing, China, 13–16 June 2019. [Google Scholar]
  30. Zhu, S. Multi-objective route planning problem for cycle-tourists. Transp. Lett. 2022, 14, 298–306. [Google Scholar] [CrossRef]
  31. Xu, X.; Wang, L.; Zhang, S.; Li, W.; Jiang, Q. Modelling and Optimization of Personalized Scenic Tourism Routes Based on Urgency. Appl. Sci. 2023, 13, 2030. [Google Scholar] [CrossRef]
  32. Liu, Z.; Wang, X.; Shen, S. Methods of Traffic Demand Forecast on Tourism Highway. International Conference on Engineering Management. In Proceedings of the 2015 International Conference on Engineering Management, Engineering Education and Information Technology, Guangzhou, China, 24–25 October 2015. [Google Scholar]
  33. Xu, S. Research on the Influence of Urban Road Network on the Wind Environment of Road in Harbin. Master’s Thesis, Harbin Institute of Technology, Harbin, China, 2018. [Google Scholar]
  34. Hillier, B.; Hanson, J. The Social Logic of Space; Cambridge University Press: Cambridge, UK, 1984. [Google Scholar]
  35. Turner, A.; Penn, A.; Hillier, B. An Algorithmic Definition of the Axial Map. Environ. Plan. B-Plan. Des. 2005, 32, 425–444. [Google Scholar] [CrossRef]
  36. Hillier, B.; Zhao, B. Space syntax: A new view of the city. New Archit. 1985, 62–72. [Google Scholar]
  37. Duan, J.; Hillier, B. Urban Space 3: Space Syntax and Urban Planning; Southeast University Press: Nanjing, China, 2007. [Google Scholar]
  38. Liu, R.; Hu, W.; Wang, H.; Wu, C. The Road Network Evolution Analysis of Guangzhou-Foshan Metropolitan Area Based on Kernel Density Estimation. In Proceedings of the 2010 International Conference on Computational and Information Sciences, Chengdu, China, 17–19 December 2010; pp. 316–319. [Google Scholar]
  39. Hao, F.; Wang, S. Spatial Characteristics and Forming Mechanisms of Retail Businesses in Changchun, China. Sci. Geogr. Sin. 2016, 36, 855–862. (In Chinese) [Google Scholar]
  40. Yang, J.; Zhu, J.; Sun, Y.; Zhao, J. Delimitating Urban Commercial Central Districts by Combining Kernel Density Estimation and Road Intersections: A Case Study in Nanjing City, China. ISPRS Int. J. Geo-Inf. 2019, 8, 93. [Google Scholar] [CrossRef]
  41. Xu, H.; Zhu, J.; Wang, Z. Exploring the Spatial Pattern of Urban Block Development Based on POI Analysis: A Case Study in Wuhan, China. Sustainability 2019, 11, 6961. [Google Scholar] [CrossRef]
  42. Ling, C.; Liu, Z. High-density Cities and Compact Development: Sino-Foreign Comparisons and implications. Urban Plan. Int. 2023, 1–13. (In Chinese) [Google Scholar] [CrossRef]
  43. Han, Z.; Cui, C.; Miao, C.; Wang, H.; Chen, X. Identifying Spatial Patterns of Retail Stores in Road Network Structure. Sustainability 2019, 11, 4539. [Google Scholar] [CrossRef]
  44. Han, Y.; Jiao, L.; Xu, G. Correlation analysis of road structure and commercial agglomeration in Wuhan City. Prog. Geogr. 2017, 36, 1349–1358. (In Chinese) [Google Scholar]
  45. Jan, G. Livet Mellem Husene; China Building Industry Press: Beijing, China, 2002. [Google Scholar]
  46. Biswas, C.; Omar, H.; Rashid-Radha, J.Z.R.R. The impact of tourist attractions and accessibility on tourists’ satisfaction: The moderating role of tourists’ age. Geojournal Tour. Geosites 2020, 32, 1202–1208. [Google Scholar] [CrossRef]
  47. Arani, N.; Karrabi, M.; Mohammadzadeh Moghaddam, A. Observational and statistical evaluation of factors affecting traffic noise: A case of tourist, pilgrimage and business area. Appl. Acoust. 2022, 193, 108750. [Google Scholar] [CrossRef]
  48. Liu, S.; Gu, C.; Chen, Y. Analysis of Coupling Relation between Urban Spatial Compactness and Degree of Land Use Mix Based on Compact City Theory: The Case of Downtown Shenyang, China. Sustainability 2023, 15, 1202. [Google Scholar] [CrossRef]
  49. Li, W.; Liu, Z. Explore Inbound Tourist Consumer Behavior and Marketing Strategy. In Proceedings of the International Institute of Statistics & Management Engineering Symposium, Qingdao, China, 20–25 July 2012. [Google Scholar]
  50. Scuttari, A.; Lucia, M.D.; Martini, U. Integrated planning for sustainable tourism and mobility. A tourism traffic analysis in Italy’s South Tyrol region. J. Sustain. Tour. 2013, 21, 614–637. [Google Scholar] [CrossRef]
  51. Yang, B. Research on Key Issues of City Tourism Transportation. Master’s Thesis, Southwest Jiaotong University, Chengdu, China, 2010. [Google Scholar]
Figure 1. Administrative divisions of Harbin.
Buildings 14 00914 g001
Figure 2. Present situation of road network structure of Harbin.
Buildings 14 00914 g002
Figure 3. Methodology framework.
Buildings 14 00914 g003
Figure 4. Statistics of questionnaire survey results. (a) Results of the age range; (b) Results of the traffic modes; (c) Results of the travel time range; (d) Results of the travel distance range.
Buildings 14 00914 g004
Figure 5. Integration value. (a) Global integration; (b) At the 500 m scale; (c) At the 1000 m scale; (d) At the 3000 m scale; (e) At the 5000 m scale.
Buildings 14 00914 g005aBuildings 14 00914 g005b
Figure 6. Choice value. (a) Global choice; (b) At the 500 m scale; (c) At the 1000 m scale; (d) At the 3000 m scale; (e) At the 5000 m scale.
Buildings 14 00914 g006
Figure 7. Kernel density value of tourism service facilities in Harbin. (a) All facilities; (b) Dining; (c) Shopping; (d) Transportation; (e) Accommodation; (f) Entertainment; (g) Attraction.
Buildings 14 00914 g007aBuildings 14 00914 g007b
Table 1. Types and quantity of tourism service facilities in Harbin.
Primary ClassificationSecondary ClassificationQuantity/pcPercentage/%
DiningTeahouse, cake and dessert shop, bar, café shop, western restaurant, snack and fast food shop, Chinese restaurant31,53535.28
ShoppingConvenience stores, supermarkets, shopping centers, markets, duty-free stores41,05245.93
Transportationparking lots, bus stations, charging stations, subway stations, train stations, bus stations82589.24
AccommodationStar Hotels, economy chain hotels, hostels, youth hostels, B and Bs60436.76
EntertainmentKTV, cinema, theater, nongjiale, bath and massage, leisure plaza, game venue, fitness Center, sports stadiums18202.04
AttractionsZoos, squares, parks, memorials, aquariums, botanical museums, churches, temples, and heritage sites6720.75
All facilities 89,380100
Table 2. The correlation between the integration value and various types of tourism.
Integration
(R = n)
All FacilitiesDiningShoppingTransportationAccommodationEntertainmentAttraction
r0.978 **0.978 **0.977 **0.980 **0.982 **0.982 **0.832
Sig.0.0040.0040.0040.0030.0030.0030.142
N5555555
*: At the 0.05 level (two-tailed), the correlation is significant. **: At the 0.01 level (two-tailed), the correlation is significant.
Table 3. The correlation between choice value and various types of tourism service facilities.
Choice
(R = n)
All FacilitiesDiningShoppingTransportationAccommodationEntertainmentAttraction
r0.7530.6650.7700.4670.5290.6270.316
Sig.0.1420.2210.1270.4280.3600.2580.605
N05555555
*: At the 0.05 level (two-tailed), the correlation is significant. **: At the 0.01 level (two-tailed), the correlation is significant.
Table 4. The correlation between the integration value and various types of tourism service facilities.
R = 500R = 1000R = 3000R = 5000
All facilities0.969 **0.930 **0.905 **0.927 **
Dining0.988 **0.886 *0.8670.866
Shopping0.993 **0.928 *0.889 *0.940 *
Transportation0.999 **0.986 **0.975 **0.994 **
Accommodation0.991 **0.926 **0.881 *0.880 *
Entertainment0.998 **0.959 **0.928 *0.991 **
Attraction0.8440.892 *0.887 *0.892 *
*: At the 0.05 level (two-tailed), the correlation is significant. **: At the 0.01 level (two-tailed), the correlation is significant.
Table 5. The correlation between the choice value and various types of tourism service facilities.
R = 500R = 1000R = 3000R = 5000
All facilities0.889 *0.960 **0.975 **0.934 *
Dining0.934 *0.952 *0.955 *0.930 *
Shopping0.8530.966 **0.981 **0.940 *
Transportation0.879 *0.928 *0.966 **0.923 *
Accommodation0.8670.970 **0.994 **0.930 *
Entertainment0.7800.941 *0.951 *0.931 *
Attraction0.6520.959 *0.992 **0.940 *
*: At the 0.05 level (two-tailed), the correlation is significant. **: At the 0.01 level (two-tailed), the correlation is significant.
Disclaimer/Publisher’s Note: The statements, opinions and data contained in all publications are solely those of the individual author(s) and contributor(s) and not of MDPI and/or the editor(s). MDPI and/or the editor(s) disclaim responsibility for any injury to people or property resulting from any ideas, methods, instructions or products referred to in the content.

