Article

Basic Analysis of Physical Determinants Affecting the Distribution Density of Senior Citizen Centers around Small Apartment Complexes, Focusing on Administrative Districts in Busan

1
College of Design, Jilin University of Arts, Changchun 130021, China
2
Department of Architecture, Sahmyook University, Seoul 01795, Republic of Korea
3
Department of Spatial Culture Design, Kookmin University, Seoul 02707, Republic of Korea
4
Department of Interdisciplinary Studies, Konkuk University, Seoul 05029, Republic of Korea
5
College of Design, Sangmyung University, Cheonan 31066, Republic of Korea
*
Author to whom correspondence should be addressed.
Submission received: 12 March 2024 / Revised: 21 March 2024 / Accepted: 26 March 2024 / Published: 28 March 2024
(This article belongs to the Special Issue Urban Wellbeing: The Impact of Spatial Parameters)

Abstract

:
The role of senior citizen centers is becoming more important, with a greater emphasis placed on ensuring that these establishments facilitate leisure and communication for older adults. These developments are taking place as population aging has now become an irreversible global trend. However, there is still a lack of systematic research on predicting the distribution density of senior citizen centers based on physical factors in urban planning. Therefore, this study set each administrative district in Busan as a unit and investigated physical factors affecting the distribution density of senior citizen centers around small apartment complexes to validate their effectiveness. First, the spatial hierarchy of each administrative district in Busan was examined. The city was divided into administrative districts while focusing on the distribution density of senior citizen centers (the dependent variable) around small apartment complexes where older adults live (within a 500 m radius). The spatial accessibility of senior citizen centers and the number of apartments in each administrative district were set as independent variables. This selection was made to verify the effectiveness of the physical factors by conducting an independent sample t-test, normality test, Friedman test, and two-way ANOVA. The chief findings of this study are as follows. (1) The spatial awareness of each administrative district was low, and there were large disparities in the land development density relative to the spatial scale of the administrative districts. (2) Regarding the physical factors affecting the distribution density of senior citizen centers, the spatial accessibility of senior residences was more significant than the number of small apartment complexes nearby. (3) Personal and social factors may have indirectly influenced the distribution density of senior citizen centers more than physical factors, depending on the type of house in which the older adults live. The findings will provide a theoretical basis for determining the location and distribution density of senior citizen centers in urban planning considering physical factors, as well as serve as a reference for public policy decisions related to the allocation of such centers in the future.

1. Introduction

1.1. Background and Purpose

Globally, the segment of the population aged 65 years or older reached 9.3% in 2020 and is projected to increase in the near future [1]. In South Korea, senior citizens aged 65 years and older accounted for 17.5% of the total population as of 2022 and this fraction is projected to exceed 20% by 2025, which will designate the country a super-aged society [2]. This increase in the population of elderly persons has led to an urgent social need to multiply senior welfare facilities across the country. According to Article 31 of the Welfare of Senior Citizens Act of Korea, older adults use or live in welfare facilities for psychological, social, or economic reasons. “Welfare facility for senior citizens” is a general term for an establishment that promotes the welfare of senior citizens. These include elder protection and employment support agencies and shelters for elder abuse victims, as well as residential, medical, leisure, and commuting-system welfare facilities [3]. Among these, senior citizen centers are welfare facilities where local seniors can engage in socialization, hobbies, collaboration, information exchange, and other leisure activities [4,5]. They play an instrumental role in promoting happiness in older adults and facilitating effective communication [5,6]. Thus, the number of senior citizen centers has been increasing rapidly, as a solution for addressing welfare and problems related to older adults [7,8]. However, despite the relative increase in the population of elderly persons, the use of senior citizen centers is low, owing to issues related to distance, lack of facility convenience, and absence of activity in programs for older adults [9,10].
Examining the recent geographic concentration of older adults in South Korea, Busan had a population ratio of elderly persons of 22.3%, the highest among the six major metropolitan cities with a population of more than one million people, making it the first super-aged society among the other metropolitan areas [11]. Busan established a Senior Citizen Regional Support Center using government funding in 2013 to actively promote the distribution of senior citizen centers and ensure that older adults could use them, considering the proportion of older adults in the region [12]. Consequently, senior citizen centers in Busan are relatively well distributed, compared with other areas [13,14]. However, there remains a lack of studies that have examined the effectiveness of the distribution density of senior citizen centers in relation to where older adults live, that is, apartment buildings, based on their distribution status [15,16,17]. In other words, ensuring a life of leisure and healthy communication for older adults is becoming more important as aging becomes an irreversible global trend. However, most government policies only focus on the distribution of senior citizen centers, and there is still a lack of research validating the distribution density of senior citizen centers based on physical factors in urban planning. Although past works have mentioned the impact of physical factors on senior welfare facilities, most were limited to a relatively small spatial scope.
Therefore, this study aims to determine the factors that affect the distribution density of senior citizen centers, focusing on apartment complexes in Busan, and examine whether the derived determinants are effective in influencing the distribution density of senior citizen centers. These findings will be significant in preparing fundamental data for determining prospective locations for senior citizen centers.

1.2. Research Scope, Previous Studies and Hypothesis

Considering that older adults have limited mobility owing to physical and psychological factors [14], this study focuses on the distribution density of senior citizen centers located near small apartment complexes comprising 150 households or fewer by dividing the administrative districts of Busan into separate units. The reasons for selecting senior citizen centers near small-scale apartment houses as the research scope were as follows. First, according to the Regulations on Housing Construction Standards [18], it is not mandatory to establish a senior citizen center in apartments with 150 households or fewer; therefore, most older adults living in small apartment complexes are forced to access senior citizen centers outside of their complex. Second, Zhao and Lee [19] determined that the usage rate of senior citizen centers adjacent to large apartment complexes was higher than that of centers located inside large apartment complexes. Moreover, the results of Oh and Kwon’s [20] survey on the use of outdoor spaces by seniors and the objective accessibility criteria for public facilities suggested by Kim et al. [21] have demonstrated that 500 m is a relatively comfortable walking distance for older adults. Therefore, the research scope of this study was limited to facilities within a 500 m radius of small-scale apartment complexes in which older adults live.
As presented in Table 1, the extant literature on senior citizen centers [19,20,21,22,23,24,25,26,27,28,29,30,31] lacks research on whether the distribution of centers around apartment buildings affects their usage. Also, determinants affecting the distribution density of senior welfare facilities in past works can be divided into physical, personal, and social factors. Among them, references to physical factors have generally been limited to a small and specific spatial scope [19,20,26,27,28]. In particular, studies have focused on the success of the indoor space use and revitalization strategies of senior welfare facilities based on physical factors. More recent studies developed into research efforts on strategies and guidelines to improve the operation of and satisfaction with welfare facilities, in consideration of both personal factors and local social factors [28,29,30,31]. However, among the factors affecting the distribution density of senior welfare facilities, personal and social factors are premised on optimizing the changes in response to deviations formed by the individual attributes of older adults [26,27,29] (such as gender, mental/physical health, economic conditions, interpersonal relationships, etc.) and the influence of the community’s culture, customs, and folklore [23,24] to ensure the internal consistency of the collected sample, so there are limitations in conducting research by limiting the sampling scope to a specific area or older adults with similar attributes. This limitation is primarily why previous studies have limited physical factors to a specific small spatial range. On the other hand, this study is differentiated from others because it focuses on physical factors in urban planning to analyze the distribution density of senior citizen centers in Busan, Korea.
Previous studies [22,25,28] have confirmed that welfare facilities are more functional in neighborhoods with a higher concentration of older adults than when located in general areas. Enhancing the functionality of welfare facilities entails improving the convenience of transportation to areas with a high concentration of the population of elderly persons and establishing neighborhood facilities with consideration to their accessibility for older adults. In terms of urban planning policies, enhancing functionality is also an important measure for promoting the distribution of elder-friendly facilities. Accordingly, this study referred to the findings of Lim and Lee [25], Jeong and Jun [22], and Park and Lee [28], and determined that the spatial accessibility of apartment complexes where older adults live and the number of neighboring apartment buildings are physical factors that affect the use of nearby senior citizen centers. Also, based on the premise that the importance of physical factors affecting the distribution density of senior citizen centers (spatial accessibility of senior residences and the number of adjacent apartment complexes) is unclear in the above theory, the following hypotheses can be proposed.
Hypothesis 1.
The main effect of physical factors affecting the distribution density of senior citizen centers is the spatial accessibility of senior residences.
Hypothesis 2.
The main effect of physical factors affecting the distribution density of senior citizen centers is the number of nearby apartment complexes.
Hypothesis 3.
All physical factors affecting the distribution density of senior citizen centers have the same effectiveness.

2. Materials and Methods

2.1. Space Syntax

In 1984, Hillier and his colleague Hanson coined the term “space syntax” in their book, The Social Logic of Space [32]. Space syntax refers to a methodology that quantifies space. Depending on the form and method of analysis, convex spaces or axial lines are used to quantitatively analyze the use and perception of each convex space (axial line) based on the spatial depth generated while using the space [33]. In particular, studies have already been conducted to analyze urban space using axial lines to understand urban hierarchy and review spatial accessibility [34,35], and many scholars have demonstrated that social and economic phenomena occurring in urban spaces can be interpreted using indicators related to space syntax [36,37,38]. Integration is an important indicator that describes the accessibility of space in space syntax; it is divided into two scales: global and local integration. Global integration refers to accessibility calculated by considering all spatial depths from a specific space to the entire space. Local integration refers to local spatial accessibility by limiting spatial depth (usually three spatial depths) when moving from a specific space to another space. Intelligibility (R2) refers to the correlation between the calculated global integration and local integration and is used to explain the spatial configuration of the analysis target. In space syntax, the standard value for interpreting intelligibility is usually 0.6. The closer it is to 1, the more recognizable the space, and the closer it is to 0, the less recognizable it is [37,39]. Equation (1) and Table 2 present the calculation and interpretation of the integration [33]. Although previous studies conducted in Busan have explored the city’s spatial hierarchy and the accessibility of specific facilities [35,40], none have examined the detailed spatial hierarchy subdivided into administrative districts. Therefore, in addition to calculating the spatial accessibility of senior citizen residences, it is essential to conduct a preliminary analysis to identify the spatial hierarchy of each administrative district. Although global and local integration can be used to interpret accessibility, this study limited the radius of accessibility to 500 m [20,21]. Therefore, it is more appropriate to explain the spatial accessibility of small apartment complexes through global rather than local integration. Therefore, this study aims to calculate the spatial accessibility of senior citizen residences by global integration, with reference to the main interpretative indicators of spatial syntax, and examine the spatial hierarchy of each administrative district in Busan using intelligibility as a criterion.
I ( i ) = D n 2 n 2 ( k = 1 n d i , k n 1 1 )

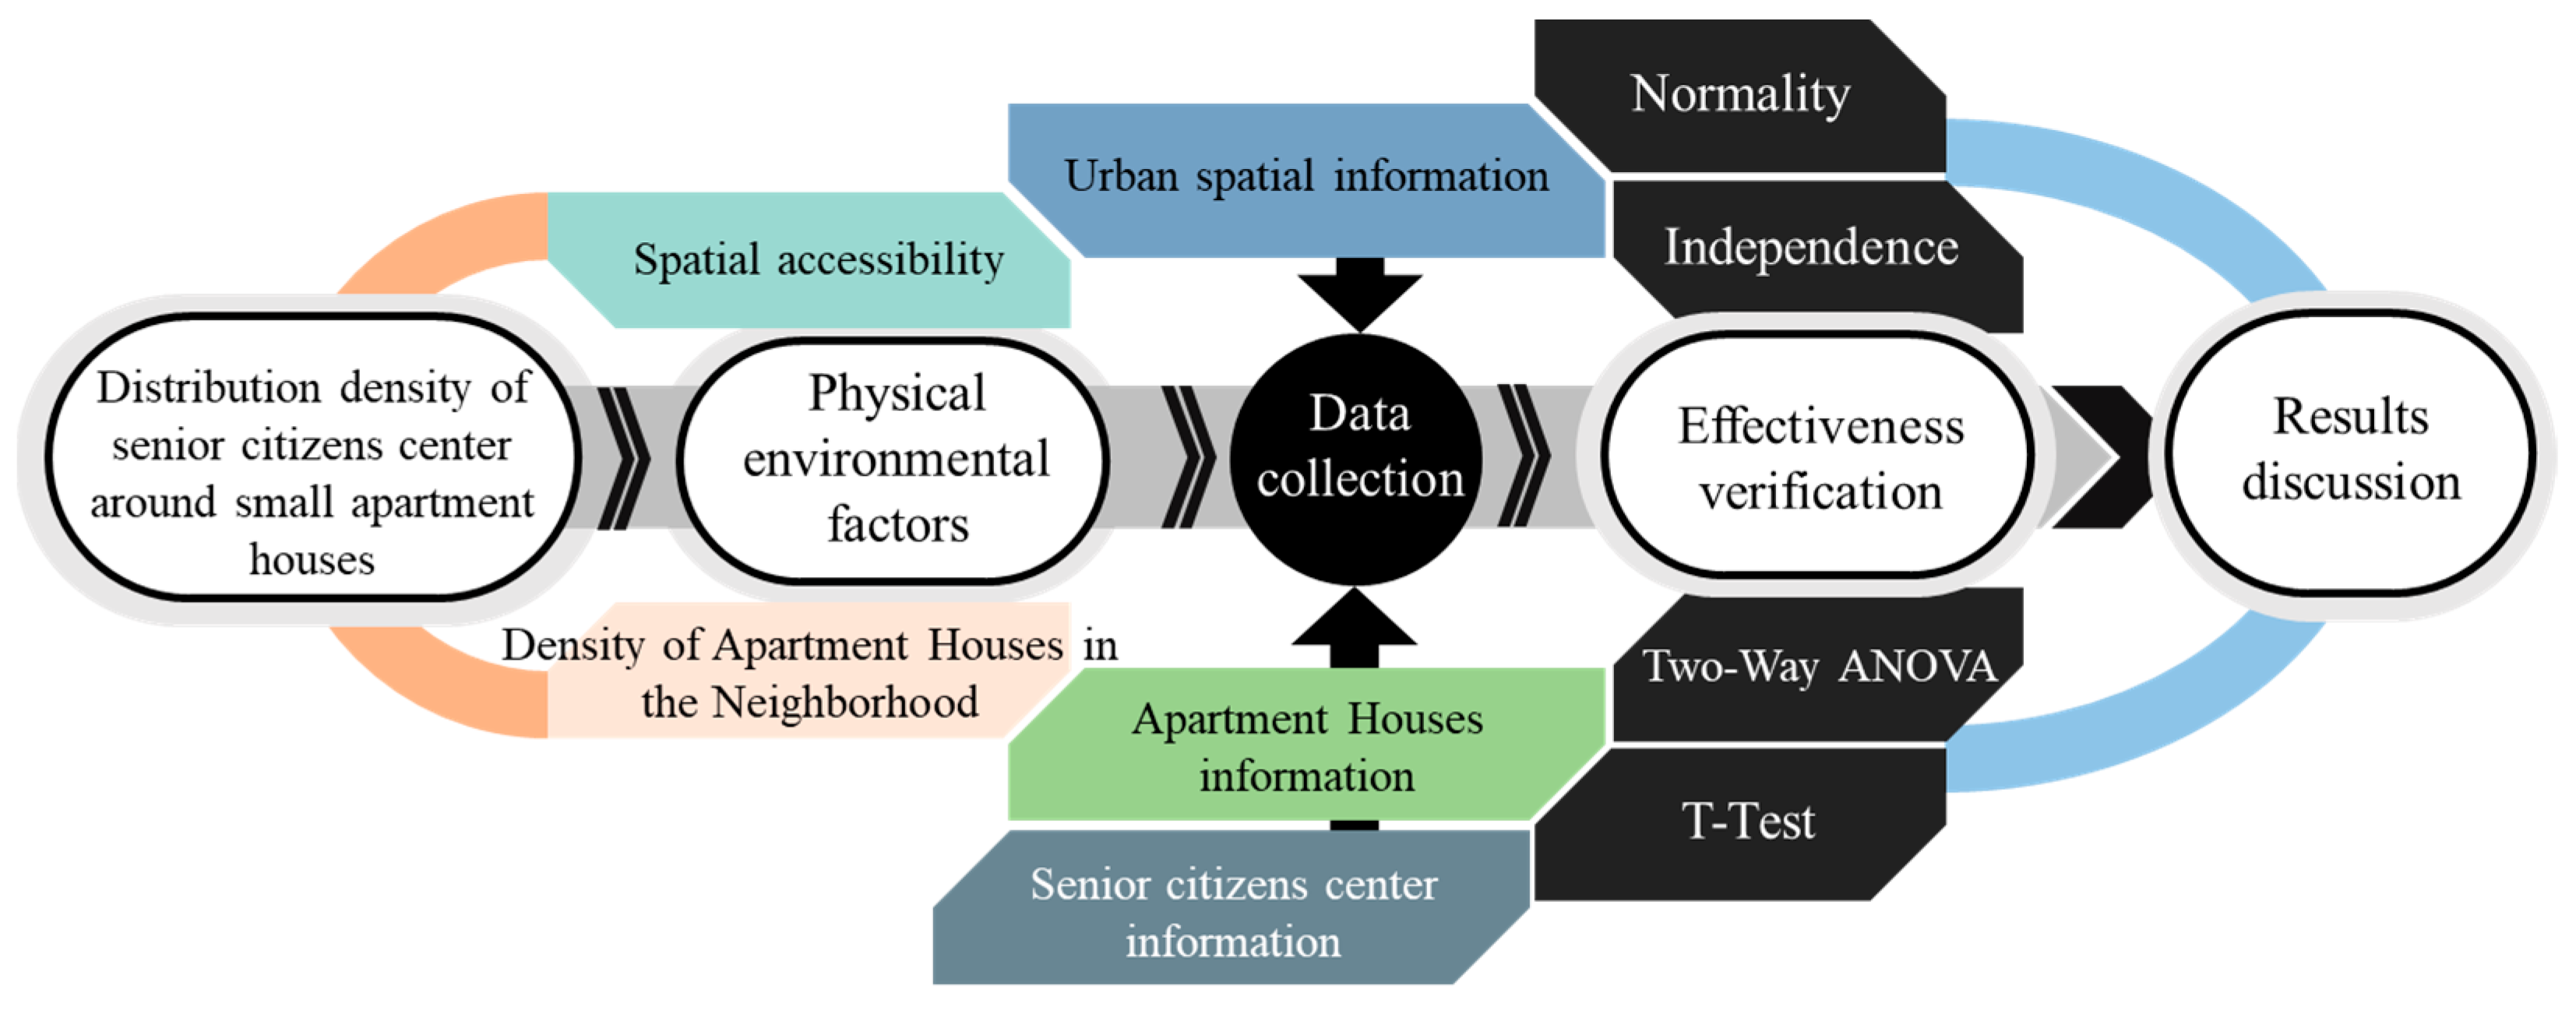
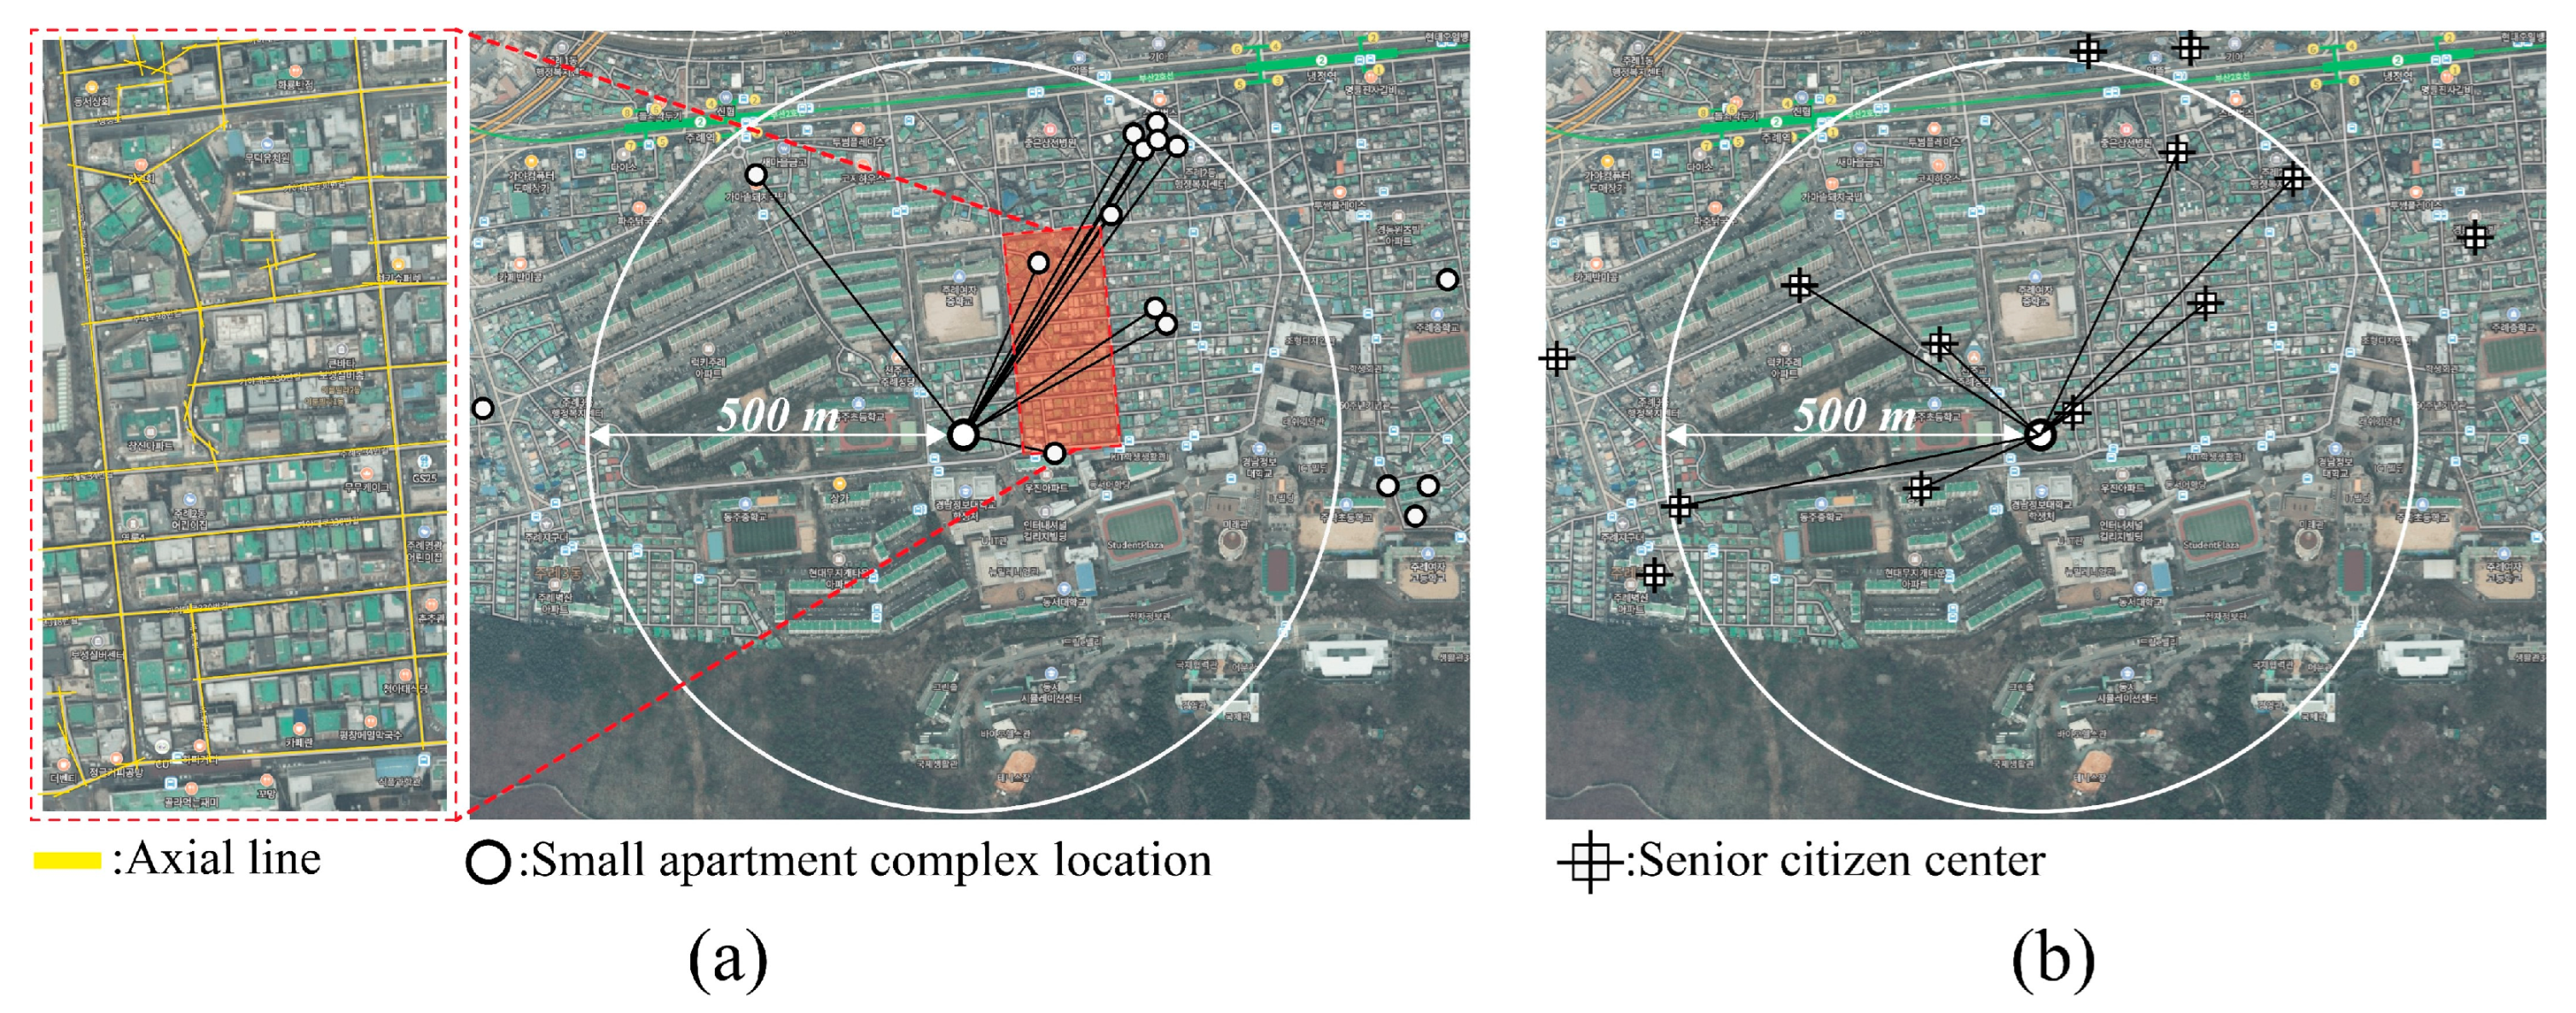
2.2. Research Methods

As shown in Figure 1, research was conducted in four stages: variable setting, data collection, validation, and discussion of results. In terms of variable setting, based on the results of previous research, the spatial accessibility of senior citizen residences and the number of surrounding apartments were set as independent variables, and the distribution density of senior citizen centers was the dependent variable when considering the range of facilities distributed within the 500 m radii centered on small apartment complexes where older adults live.
After determining the dependent and independent variables, in order to collect samples for each variable, this study collected location information on apartment complexes with 150 households or fewer and senior citizen centers registered in each administrative district by referring to data released by the Busan Metropolitan City Open Data Portal [41] and the Senior Citizen’s Regional Support Center [42]. After excluding location information with the same address and duplicate records in the same category from the collected data, an axial map of urban spatial information was created by referring to the geographic information system (GIS) data of administrative district boundaries and road centerlines disclosed on the V-WORLD website [43] operated by the Ministry of Land, Infrastructure, and Transport of Korea. Figure 2 presents the calculations of the independent and dependent variables.
The specific steps are as follows: First, considering that the research scope was limited to the optimal walking distance associated with senior citizens, all codes corresponding to overpasses, tunnels, and railroad transportation were excluded from the attribute data in the attribute data filter of the Quantum GIS (QGIS) program, and the information was entered to create a new Vector Data Layer to display the location information of apartment complexes and senior citizen centers. Second, after securing this information in the QGIS program, the distribution quantity of apartment complexes (independent variable B) and the distribution density of senior citizen centers (dependent variable C) were recorded separately for spaces within a 500 m radius around residential areas. Third, the classification of the vector layers (administrative district boundaries, road centerlines, apartment complexes, and senior citizen centers) in the edited GIS data were checked and converted into lines. This process was necessary to prepare for the relatively weak identification of planes and points in the depth map developed based on the space syntax. Fourth, after deriving the refined GIS data in the DXF file format, axial maps were created for each administrative district by referring to the road centerline layer in AutoCAD, according to the guidelines for creating space syntax axial maps. After identifying the urban spatial hierarchy of each administrative district in Busan using the Depth Map program, the global integration of the corresponding residential area (independent variable A) was calculated.
After calculating the independent variables A and B and the dependent variable C using the aforementioned process, the effectiveness of the physical factors and distribution density was verified by a two-way ANOVA using IBM SPSS Statistics 25. Moreover, as the prerequisites for a two-way ANOVA require normality and relative independence of the variables, normality was checked using a P-P Plot for each administrative district, and the relative independence of the variables included in the data group (district level) was confirmed using the Friedman test. If the sample of small apartments collected in an administrative district was less than 30, normality and independence were not tested; instead, however, the median of the dependent variable C according to the specific quantity of distribution density was calculated. Values above the median were coded as 1 (signifying relatively high distribution density), and values below the median were coded as 2 (signifying relatively low distribution density) on a categorical scale; only the mean differences were compared between the two groups. If normality and relative independence were significant, the degrees of effectiveness of independent variables A and B on dependent variable C were tested for the corresponding data group.

3. Results and Discussion

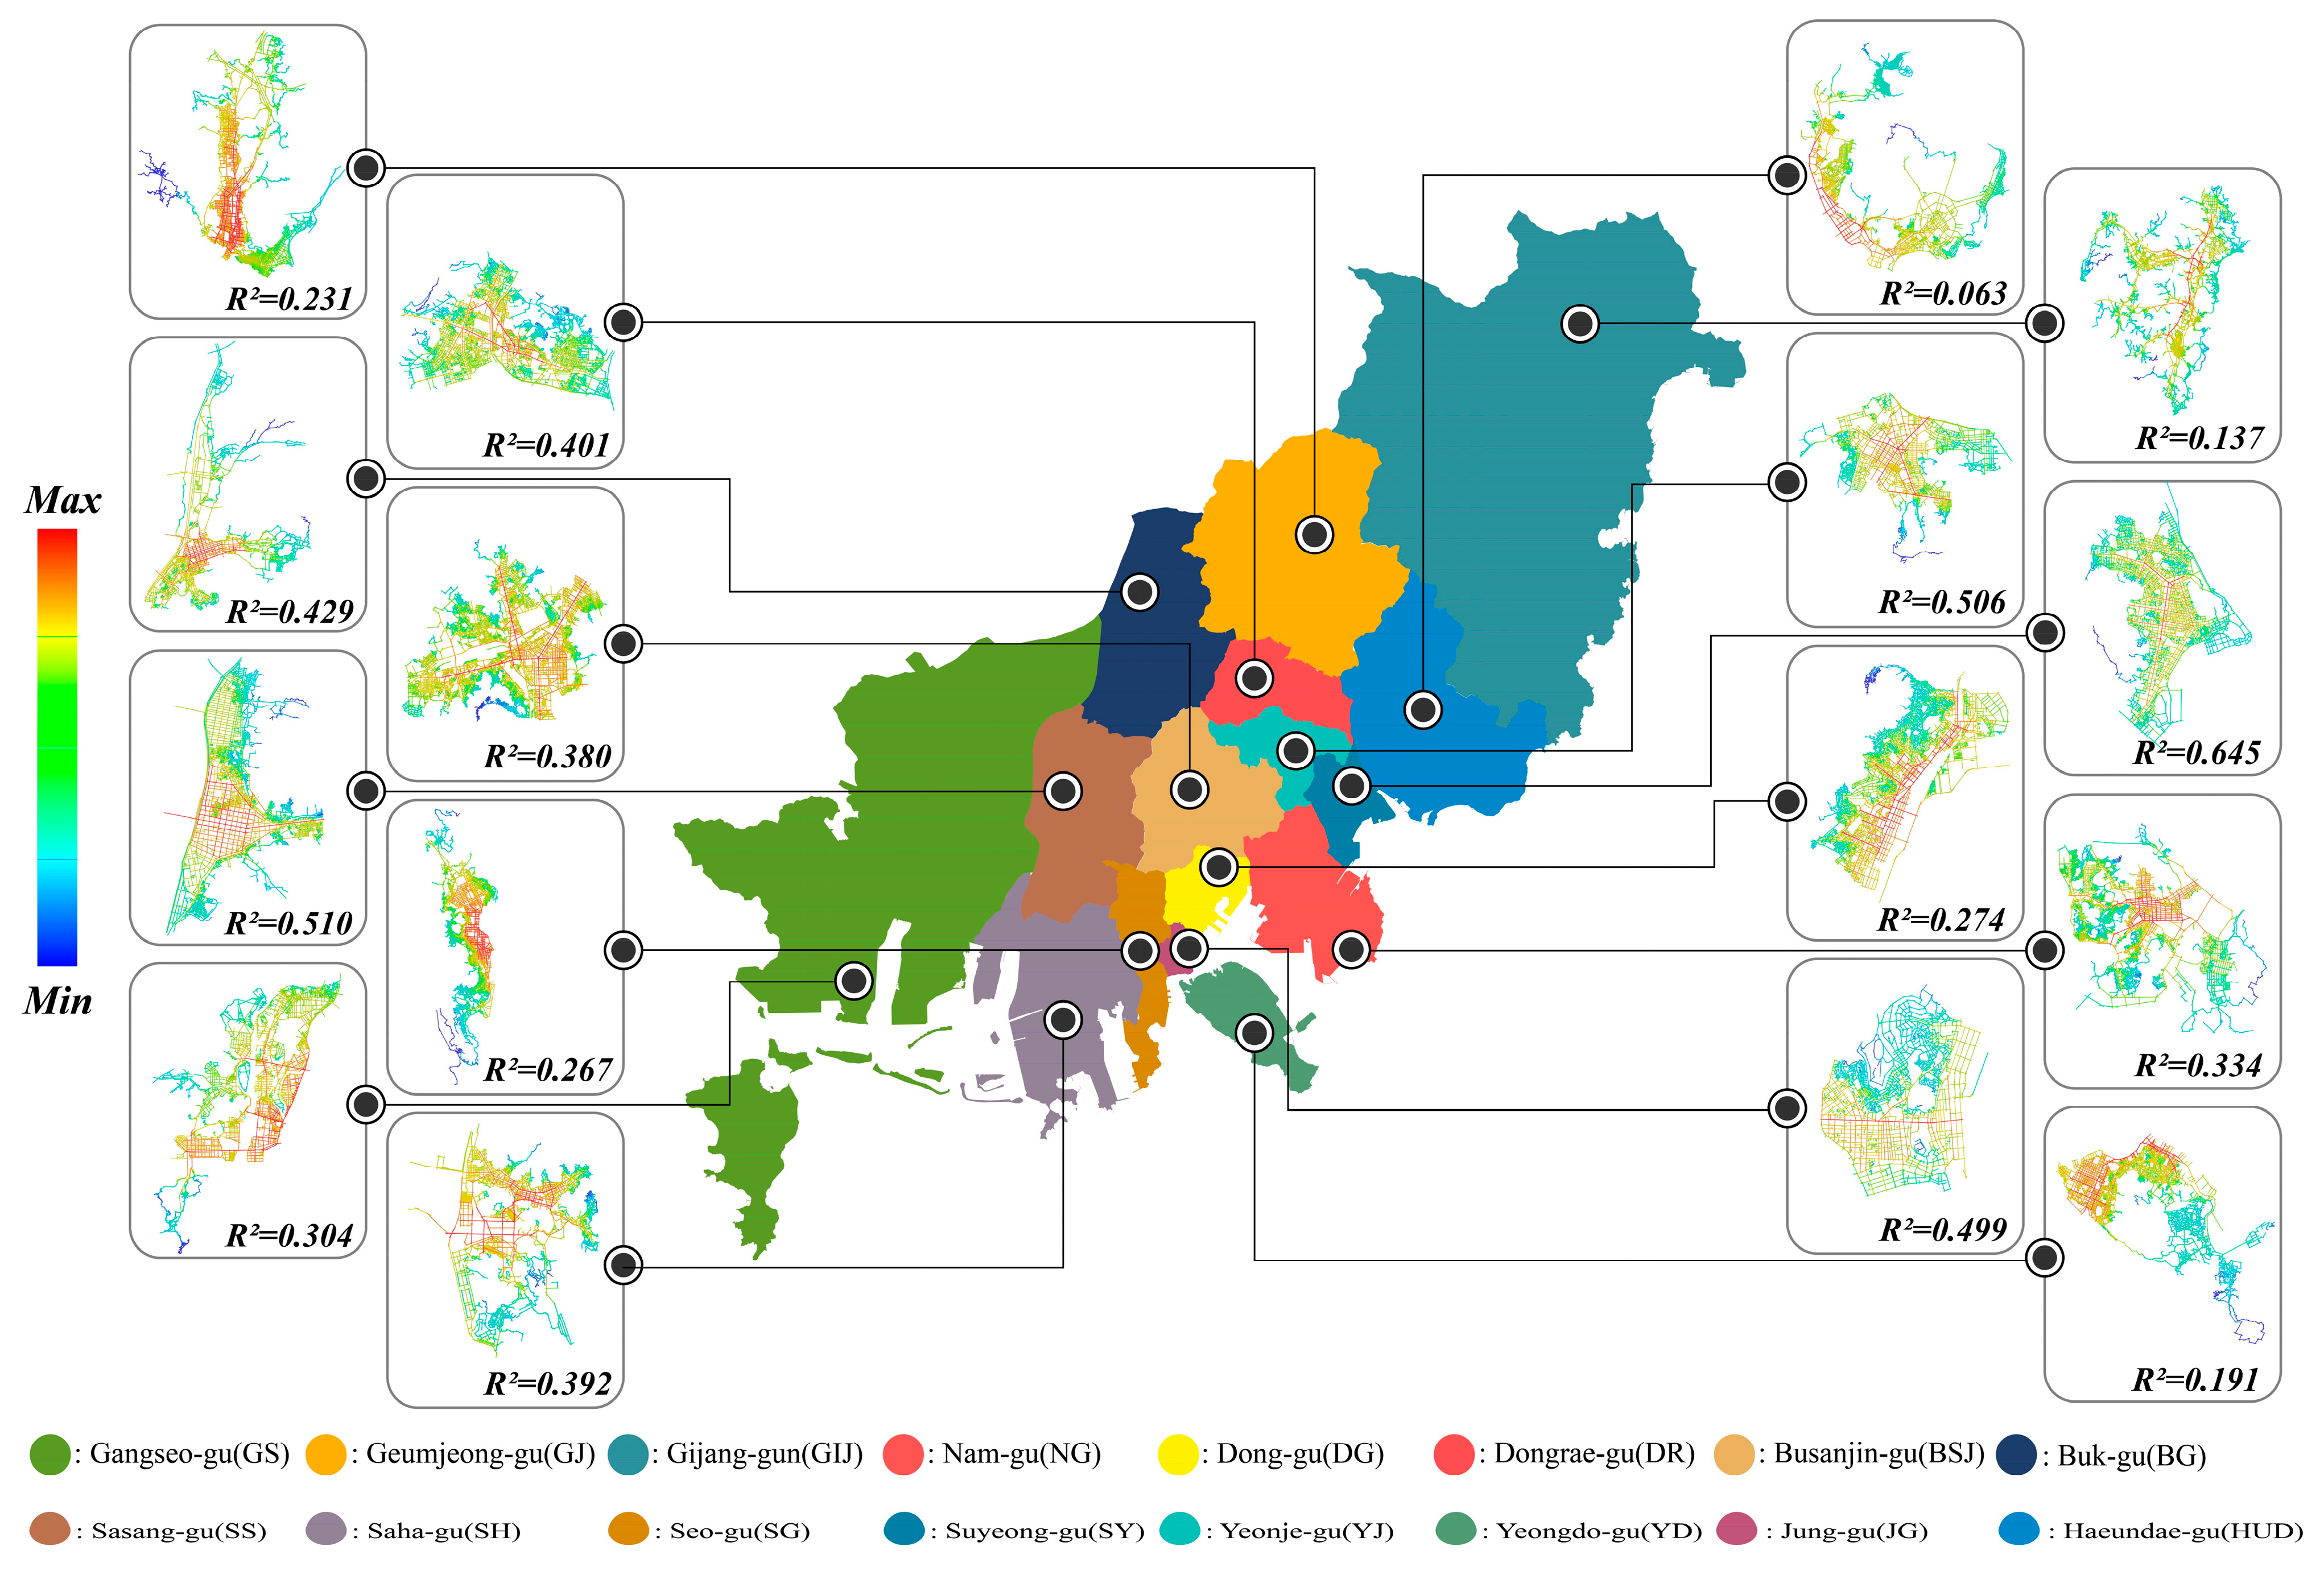
3.1. General Status and Spatial Hierarchy of Each Administrative District in Busan

As presented in Table 3, with respect to the proportion of the population of elderly persons in each administrative district of Busan, the general status of each administrative district can be categorized into either 20% or less, 20–30%, or 30% or more. Of the 16 administrative districts, 10 fall into the 20–30% category. Among them, those in the 20–30% category had a wider range of square footage (area) and more small apartment complexes and senior citizen centers compared with those in the 20%-or-less category and those in the 30%-or-more category. Thus, the 20–30% category had a relatively wide geographical distribution and various types of housing. Moreover, YD and JG districts in the 30%-or-more category were geographically adjacent and tended to have relatively small distributions in terms of the area, number of small apartment complexes, and number of senior citizen centers. However, administrative districts YD and JG (with populations of 30% or more elderly persons) had a higher population density than GS and GIJ (with populations of 20% or less elderly persons), which demonstrates that areas with a high proportion of older adults in Busan are primarily adjacent to the densely populated city center and have a relatively concentrated distribution. Furthermore, as a result of examining the number of axial lines, it can be determined that NG, DG, DR, BSJ, SG, and YD comprised relatively high numbers of axis lines, compared with the square footage of each district, which indirectly proves that they have a higher density of land development than other districts in terms of urban planning. The intelligibility of each district was as follows: GS (0.304), GJ (0.231), GIJ (0.137), NG (0.334), DG (0.274), DR (0.401), BSJ (0.380), BG (0.429), SS (0.510), SH (0.392), SG (0.267), SY (0.645), YJ (0.506), YD (0.191), JG (0.334), and HUD (0.063). All districts, excluding SY, had a value of less than 0.6, indicating that the administrative districts constituting Busan had relatively low recognition. Figure 3 presents the spatial hierarchy of each administrative district in Busan.

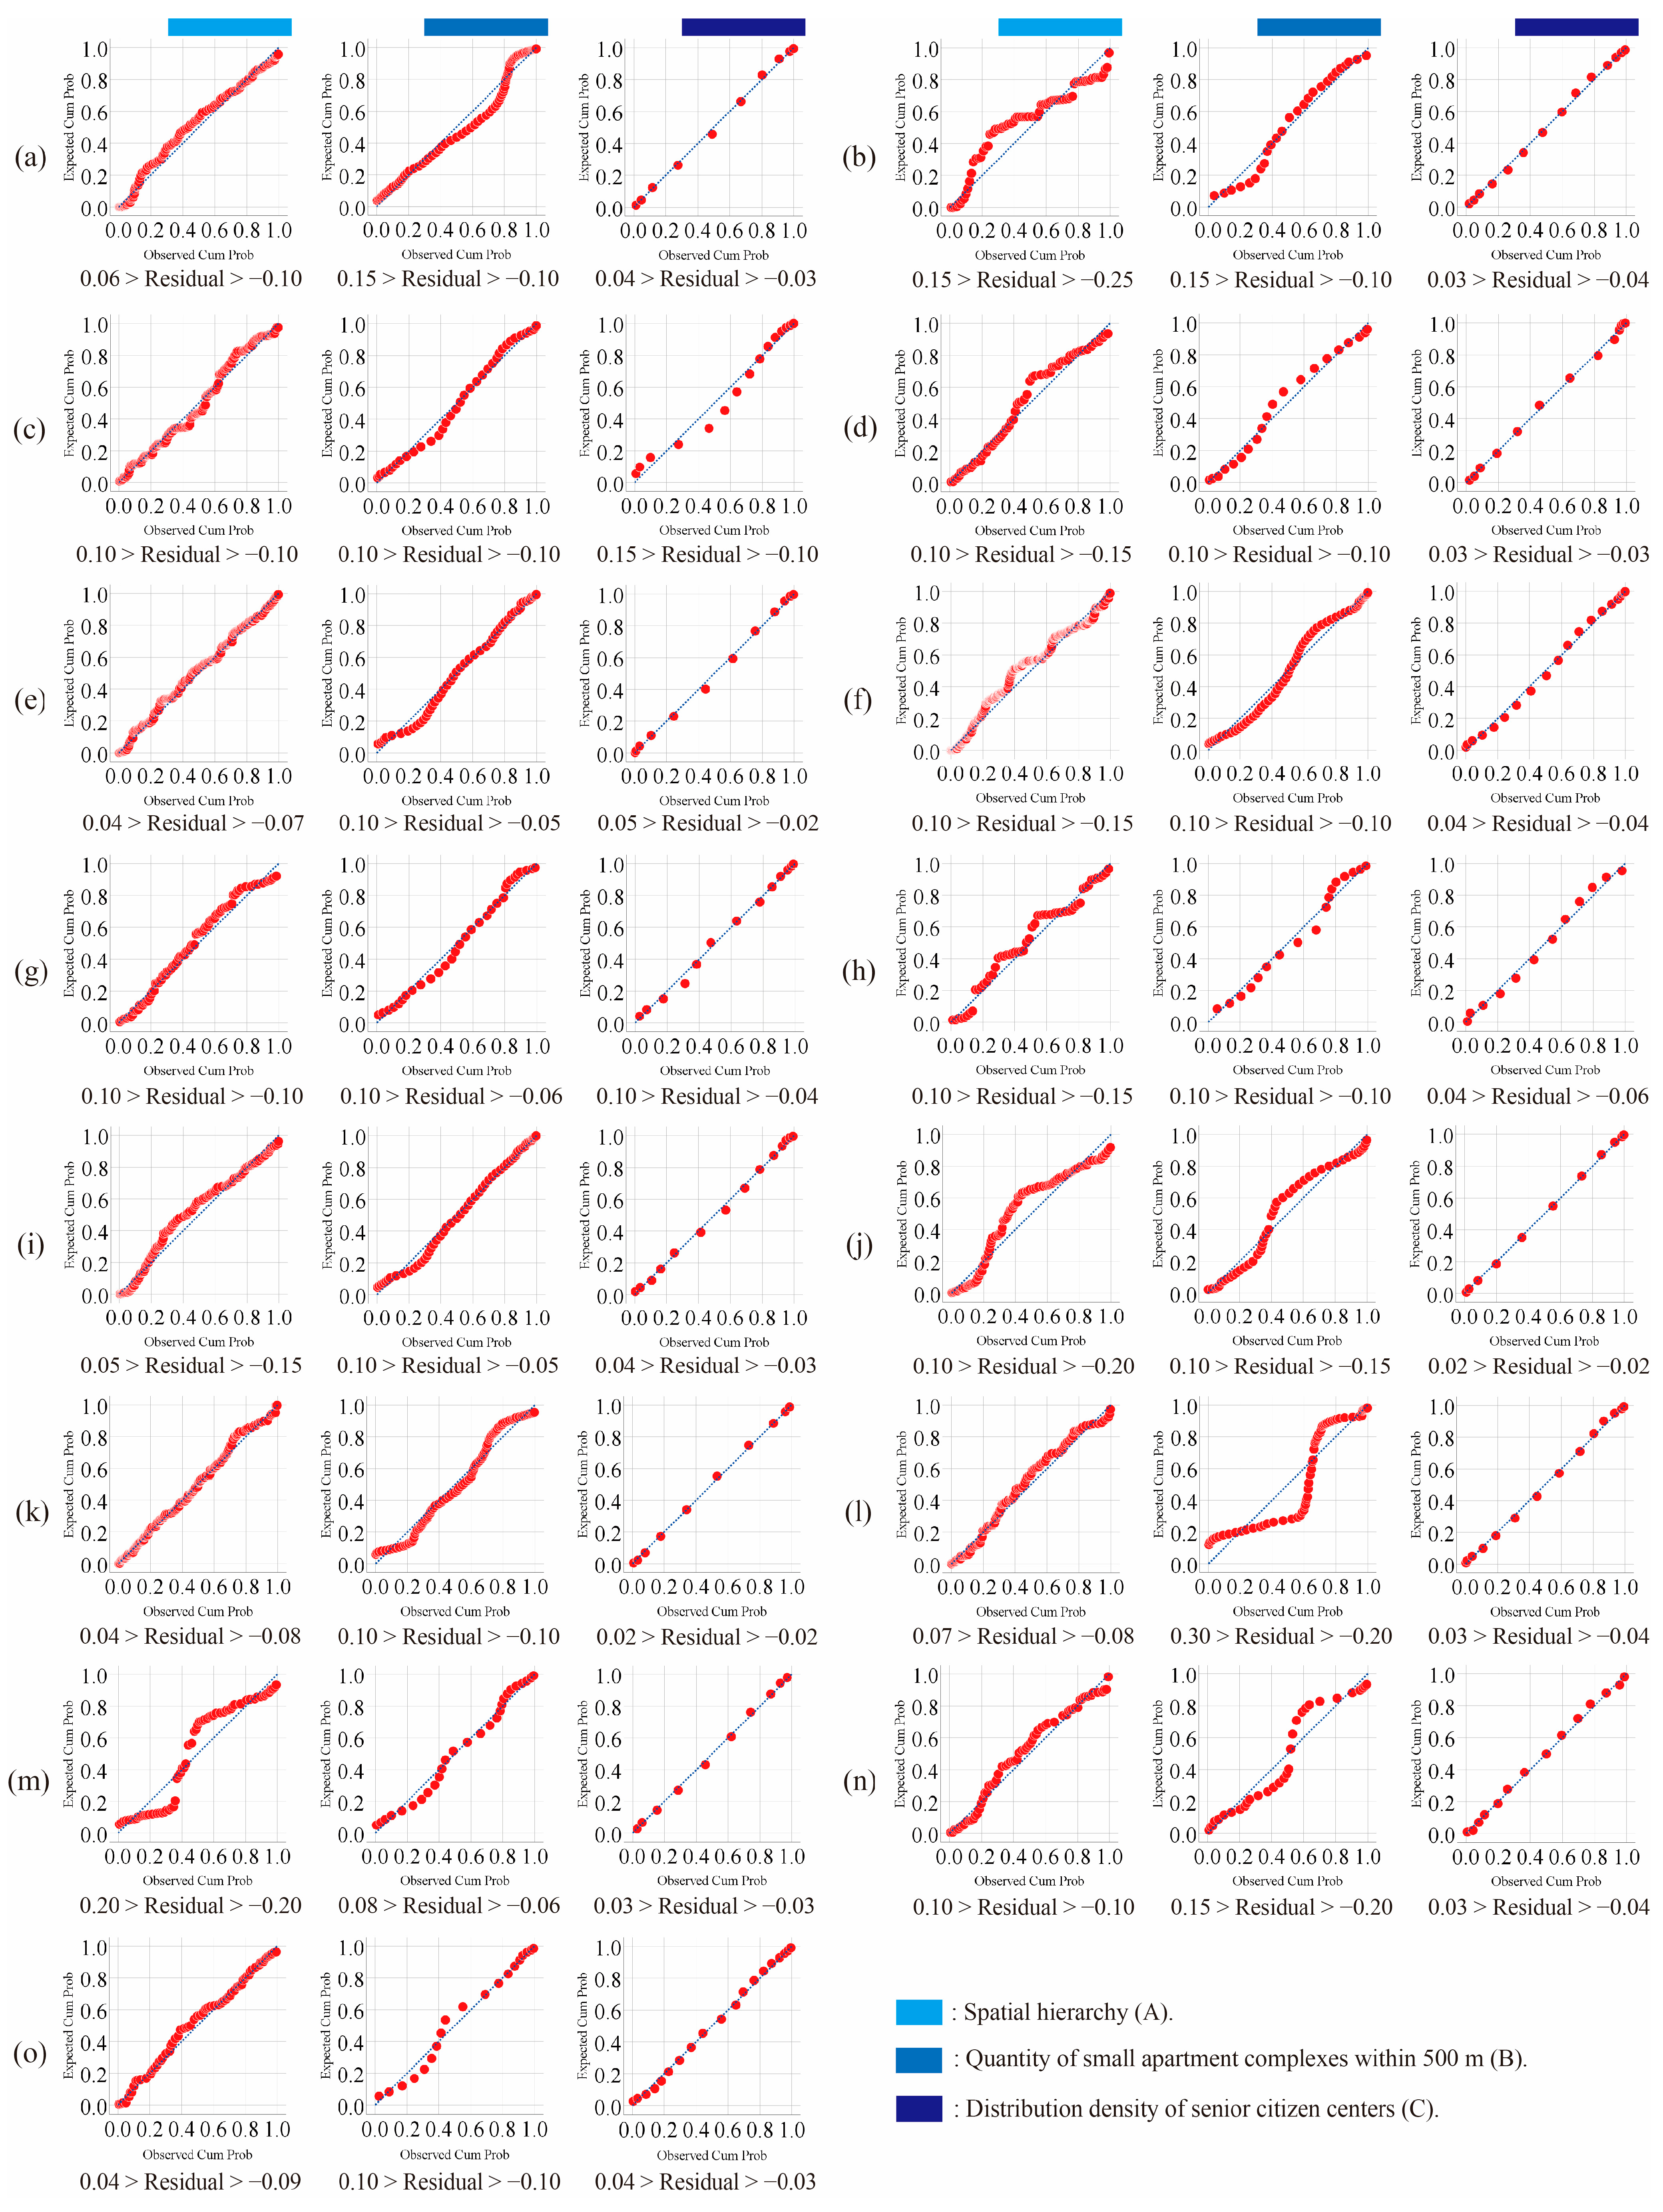
3.2. The t-Test, Preliminary Analysis, and Two-Way ANOVA Results

Considering that GS had fewer than 30 apartment buildings, the fewest among the samples collected from each administrative district, an independent sample t-test was conducted to examine whether variables A and B differed depending on the density of senior citizen centers. As presented in Table 4, there was no statistically significant difference between the independent variables A (t = 0.011, p > 0.05) and B (t = −1.072, p > 0.05) in relation to the dependent variable C.
After examining the mean differences of the GS data group, the P-P Plots were used to check the normality of the other 15 administrative district data groups. The graphs in Figure 4 present the residuals, which have a minimum range of ±0.02 and a maximum range of +0.3–−0.2 across the 15 administrative districts. Although the residuals slightly deviate from the Y = 0 baseline, they remain within the range of ±0.3, and all the data are distributed in a range close to the diagonal of a normal Q-Q Plot. Therefore, the data groups of the 15 administrative districts in this study were normally distributed. After confirming the normality of the data groups, we performed a Friedman test on the variables within each group to check their relative independence.
The chi-square values for the data group for each administrative district in Busan were GJ (713.981), GIJ (123.027), NG (339.136), DG (143.184), DR (435.493), BSJ (775.591), BG (168.902), SS (64.530), SH (508.486), SG (357.823), SY (635.005), YJ (435.626), YD (143.939), JG (153.365), and HUD (150.522), as presented in Table 5. As all p-values were p < 0.001, the variables within the 15 administrative district data groups (A, B, and C) were found to have relatively independent distributions. Moreover, among the chi-square values for each district, the high values of GJ (713.981) and BSJ (775.591) indicate a wide range of deviations compared with the lower values of SS (64.530) and GIJ (123.027). These results indirectly demonstrate a wide variation in the distribution of data in each administrative district as well as large gaps between the various districts.
After confirming the normality and relative independence of each administrative district data group in Busan, the primary effects of variables A and B, which represent physical factors, on variable C, which is the outcome variable, were tested. As presented in Table 6, the data groups in which variable A was significant were GJ (F = 2.273, p < 0.001), NG (F = 20.298, p < 0.001), BSJ (F = 12.682, p < 0.001), BG (F = 18.645, p < 0.01), SS (F = 11.416, p < 0.001), SH (F = 1.848, p < 0.01), SG (F = 3.021, p < 0.001), SY (F = 2.179, p < 0.01), YJ (F = 6.186, p < 0.001), YD (F = 3.766, p < 0.001), JG (F = 7.463, p < 0.01), and HUD (F = 4.997, p < 0.001). In GJ, BSJ, SS, SG, YD, JG, and HUD, variable B was also significant at p < 0.05, with F values of 1.638, 3.293, 5.814, 2.048, 2.644, 10.408, and 2.960, respectively. Further, variables A and B did not affect C in the GIJ, DG, or DR data groups. Therefore, among the hypotheses proposed in this study, hypotheses 2 and 3 were rejected, and hypothesis 1 was adopted.

3.3. Discussion

According to the two-way ANOVA results, the spatial accessibility of senior residences affected the distribution density of nearby senior citizen centers in 12 of the 15 administrative districts. Among these 12 districts, the spatial accessibility of residential areas and the number of small apartment complexes distributed around residential areas were simultaneously indicated to be effective in GJ, BSJ, SS, SG, YD, JG, and HUD. In particular, considering that only the number of small apartment complexes distributed around the residential areas did not indicate significant independent results, except for the spatial accessibility of residential areas in the 12 administrative districts above, it is reasonable to conclude that the physical factor that had the greatest influence on the distribution density of citizen centers was the spatial accessibility of residential areas, at least within the limited scope of this study. Thus, this suggests that the spatial accessibility of senior housing is a significant factor to consider in urban planning and in formulating public policies to determine the locations of senior citizen centers.
According to the results of the t-test for GS, the distribution density of senior citizen centers in administrative districts with only a few apartment complexes demonstrated no difference, on average, between the number of small apartment complexes and the spatial accessibility of residential areas. In addition, although the aging rate of GS (14.2%) was relatively low compared with other districts, 162 senior citizen centers were distributed within the neighborhood. This suggests the possibility that GS had more diverse housing types, aside from small apartments, compared with other administrative districts, and that the distribution density of senior citizen centers is influenced by regional characteristics, depending on the various types of housing. Although it is possible to hypothesize that the distribution density of citizen centers in most administrative districts of Busan is influenced by physical factors, the influence of personal and social factors highlighted in previous studies should not be ignored. This is owing to the potential influence of regional characteristics, as observed in GS, and the fact that physical factors did not have a significant effect on the distribution density of senior citizen centers in GIJ, DG, and DR. Therefore, it is necessary to adopt diverse and multilateral strategies to promote the welfare of older adults, considering the limited effect of physical factors on the distribution density of senior citizen centers in these districts.

4. Conclusions

After examining the general status and spatial hierarchy of each administrative district in Busan, physical factors such as the spatial accessibility of residential areas and the number of small-scale apartment complexes were set as independent variables, and the distribution density of senior citizen centers was designated as the dependent variable. This selection was made to verify the effectiveness of the physical factors on the distribution density of senior citizen centers by using an independent samples t-test, normality test, Friedman test, and two-way ANOVA. The chief findings of this study are as follows.
First, the areas with a high proportion of older adults in Busan were neighborhoods with a high population density and were adjacent to the city center, in addition to having a relatively concentrated distribution. The number of axial lines also differed in relation to the square footage and population density of each administrative district, indicating a large disparity in land development density in each district. This phenomenon may have occurred because older adults in areas adjacent to the city center have easier access to more services and amenities. However, customized urban planning for an aging society is required to account for the overall decline in spatial cognition in each administrative district.
Second, in terms of the physical factors affecting the distribution density of senior citizen centers, the spatial accessibility of senior housing had a greater effect than the number of nearby small apartment complexes, which indirectly indicates that the composition of the surrounding environment is essential for improving the convenience of daily life and quality of life for older adults.
Third, the methodology used in this study did not evaluate personal and social factors as suggested in previous studies, focusing instead on interpreting the effectiveness of physical factors. In particular, considering that physical factors did not show significant results in the distribution density of senior citizen centers in GS, GIJ, DG, and DR, the personal and social factors may have indirectly influenced the distribution density of senior citizen centers more than physical factors, depending on the type of housing in which the older adults live. This implies that, in addition to physical factors, personal and social factors, such as the social networks, health statuses, and economic conditions of older adults, may influence the use of citizen centers in a given area. This suggests the possibility of complex interactions between physical, personal, and social factors. Therefore, a comprehensive approach which considers these personal and social factors is required to increase the use of senior citizen centers.
The importance of physical factors affecting the distribution density of senior citizen centers in each administrative district in Busan was investigated. Among them, the spatial accessibility of senior housing (independent variable A) seemed to have relatively more explanatory power than did the number of nearby small apartment complexes (independent variable B). Although these findings can be used as a theoretical basis for setting the location and distribution density of senior citizen centers in urban planning, when considering physical factors, this study has some limitations. First, its review of the distribution density of senior citizen centers was limited to physical factors only. Second, it focused on a single type of housing. In particular, the population density and the square footage of GS suggest the possibility of more diverse housing types aside from small apartments, so further research is needed in this area. Also, GS and GIJ had similar population age demographics, each with 20% or less elderly persons, as well as similar population densities and square footage, but considering that physical factors did not affect the distribution density of senior citizen centers in the GIJ data group, it is likely that GIJ also had diverse housing types. It is also evident that housing types indirectly affected the distribution density of senior citizen centers. In other words, differences in housing types, depending on the economic conditions of older adults, may also affect the density of senior citizen centers around individual residences. Therefore, in addition to physical factors, it would be necessary to address the limitations of this study, examining personal and social factors by considering policies for older adults, conducting in-depth interviews with people operating and managing senior citizen centers, and determining the motivations for older adults to use senior citizen centers. In particular, the lack of significant results for the dependent variable in GIJ, DG, and DR data groups, assuming that all physical factors satisfied normality and relative independence, is a crucial aspect that should be considered in follow-up studies, as the distribution density of senior citizen centers can be the result of the interaction of multiple factors rather than a single aspect.

Author Contributions

Conceptualization, X.Z. and H.L.; investigation, X.Z. and E.-s.P.; methodology, X.Z., E.-s.P., J.K. and H.L.; writing—original draft preparation, X.Z.; writing—review and editing, S.-Y.L. and J.K.; supervision, H.L. All authors have read and agreed to the published version of the manuscript.

Funding

This study was supported by the Ministry of Education of the Republic of Korea and the National Research Foundation of Korea (Grant Number: NRF-2022S1A5A2A03050078).

Data Availability Statement

The original contributions presented in the study are included in the article, further inquiries can be directed to the corresponding author.

Conflicts of Interest

The authors declare no conflicts of interest.

References

  1. World Bank Group. Population Ages 65 and Above (% of Total Population). Available online: https://data.worldbank.org/indicator/SP.POP.65UP.TO.ZS (accessed on 20 December 2023).
  2. Yonhap News Agency. Senior Citizens Make Up 17.5 Pct of S. Korea’s Population in 2022. Available online: https://en.yna.co.kr/view/AEN20220929003000320 (accessed on 23 December 2023).
  3. Korean Law Information Center. Welfare of Senior Citizens Act. Available online: https://www.law.go.kr/LSW//lsEfInfoP.do?lsiSeq=254055# (accessed on 23 December 2023).
  4. Kim, G.J. A study on leisure facility for the elderly of Korea and Japan. Jpn. Cult. Stud. 2012, 44, 105–130. [Google Scholar] [CrossRef]
  5. Kim, E.K. Factors related to leisure satisfaction of urban elderly using senior center and elderly welfare center. AJMAHS 2019, 9, 629–641. [Google Scholar] [CrossRef]
  6. Cho, C.Y. The impact of participation in senior citizen center programs in rural areas on happiness: Double mediating effects of depression and program satisfaction. Soc. Work. Pract. Res. 2019, 16, 41–72. [Google Scholar] [CrossRef]
  7. Ju, I.H. A Study on the Establishment of Main Senior Citizen Centers for the Effective Implementation of Aging-Related Policies: Focusing on the Operational Status of Senior Citizen Centers in Busan. Master’s Thesis, Pusan National University, Busan, Republic of Korea, 2019. [Google Scholar]
  8. Yang, S.M. A study on the improvement direction of the elderly welfare act: Focusing on elderly welfare facilities. Soc. Welf. Law. J. 2022, 13, 85–115. [Google Scholar] [CrossRef]
  9. Lee, J.E. A Study on the Community Facilities of Public Rental Housing Called “Happy Housing” in Metropolitan Area Based on Accessibility: Focused on Space Syntax. Master’s Thesis, Yonsei University, Seoul, Republic of Korea, 2020. [Google Scholar]
  10. Park, D.S.; Shin, G.I.; Woo, Y.S.; Lee, H.S.; Park, H.Y. Status and prospect of the elderly living in small and medium-sized cities using the senior citizens’ center. Ther. Rehabil. Sci. 2021, 10, 95–104. [Google Scholar] [CrossRef]
  11. Korean Statistical Information Service. Ratio of Older Adults in Busan. Available online: https://kosis.kr/eng/search/searchList.do (accessed on 30 December 2023).
  12. The Korea Senior Citizens Association Busan Metropolitan Federation. Senior Citizen’s Regional Support Center. Available online: http://www.busanpeople.or.kr/02_business/?mcode=0402030000 (accessed on 30 December 2023).
  13. Kim, H.J. A Comparative Study on the Characteristics of Senior Centers in Urban Areas and Rural Area. Master’s Thesis, Tongmyong University, Busan, Republic of Korea, 2013. [Google Scholar]
  14. Oh, C.O. Using frequency and needs for walking sphere of neighborhood facilities by the elderly: Focused on the elderly who lived in Busan. Korean Soc. Sci. Art. 2015, 20, 279–292. [Google Scholar] [CrossRef]
  15. Kim, J.H.; Kim, K.H. A regional analysis for distribution of social welfare facilities. J. Korean Soc. Welf. Adm. 2015, 17, 1–23. [Google Scholar] [CrossRef]
  16. Moon, J.Y.; Jung, Y.R.; Hwang, Y.S. A study on layout characteristics of subsidiary welfare facilities at apartment complexes in new towns: Focused on apartment complexes in second phase new towns. J. Korean Inst. Inter. Des. 2017, 26, 81–90. [Google Scholar] [CrossRef]
  17. Lee, Y.C.; Kang, E.M. Analysis of factors affecting the life satisfaction of elderly users of senior citizen centers: Focus on senior citizen centers in Seoul. J. Converg. Inf. Technol. 2018, 8, 173–181. [Google Scholar] [CrossRef]
  18. Korean Law Information Center. Housing Construction Standards. Available online: https://www.law.go.kr/lsSc.do?menuId=1&subMenuId=17&tabMenuId=93&query=#undefined (accessed on 5 January 2024).
  19. Zhao, X.L.; Lee, H.W. A basic study on the spatial hierarchy correlation between apartment complexes and senior citizen centers. J. Adv. Res. Rep. 2021, 1, 45–52. [Google Scholar] [CrossRef]
  20. Oh, C.O.; Kwon, H.J. Use and needs of outdoor exercise area by seniors: Focused on the seniors living in new apartment complex. Des. Converg. Study 2018, 17, 181–195. [Google Scholar] [CrossRef]
  21. Kim, M.H.; Lee, D.T.; Yu, J.G.; Lee, S.J.; Lee, Y.S. Relationship between accessibility of public exercise facilities and physical activity participation of residents in metropolitan city. Korean J. Sport. Sci. 2014, 25, 10–20. [Google Scholar] [CrossRef]
  22. Jeong, J.E.; Jun, M.I. Spatial concentrations of the elderly and its characteristics in the Seoul metropolitan area. J. Korean Reg. Sci. Assoc. 2013, 29, 3–18. [Google Scholar]
  23. Choi, J.M.; Hwang, S.Y.; Kim, S.E. Social network and comprehensive aging problem: Interaction effect analysis between gender and social network for political application. Korean J. Policy Anal. Eval. 2015, 25, 83–115. [Google Scholar] [CrossRef]
  24. Hong, S.H.; Kim, S.E. Constraints to participation in senior welfare centers: Focusing on the difference of regional types. Health Soc. Welf. Rev. 2016, 36, 125–156. [Google Scholar] [CrossRef]
  25. Lim, B.H.; Lee, S.Y. A study on the aged’s preference of proximity to the supporting facilities from their dwellings in daejeon metropolitan. J. Korea Plan. Assoc. 2011, 46, 113–124. [Google Scholar]
  26. Choi, Y.; Oh, J.; Park, H. A study on the behavior of the older adults for senior leisure welfare facilities. J. Converg. Cult. Technol. 2022, 8, 381–386. [Google Scholar] [CrossRef]
  27. Woo, B.H. A study on the development plan: Through the analysis of the actual condition of use of senior citizen center. Study Cult. Art. 2022, 20, 16–50. [Google Scholar] [CrossRef]
  28. Park, W.S.; Lee, C.Y. Factors influencing revitalization of senior citizen centers in Goyang-si, Gyeonggi-do, South Korea. J. Korea Plan. Assoc. 2023, 58, 22–38. [Google Scholar] [CrossRef]
  29. Roh, K.S. A study on elements that activates the functions of senior citizen hall. Study Cult. Art. 2023, 22, 147–166. [Google Scholar]
  30. Park, E.J.; Cho, S.J. A study on the mediating effect of remain intention in the relationship between social support and organizational commitment of elderly welfare facility workers. J. Korea Acad. Ind. Coop. Soc. 2024, 25, 432–439. [Google Scholar]
  31. Lee, H.J.; Jung, D.H.; Lim, S.M. How do metropolitan/provincial governments deal with the Super-Aged challenge? The significance of local environmental impact on elderly life satisfaction. Korean J. Local. Gov. Stud. 2024, 27, 163–198. [Google Scholar] [CrossRef]
  32. Hillier, B.; Hanson, J. The Social Logic of Space; Cambridge University Press: Cambridge, UK, 1984. [Google Scholar]
  33. Hillier, B. Space is the Machine: A Configurational Theory of Architecture; Space Syntax: London, UK, 2007. [Google Scholar]
  34. Zhao, X.L.; Moon, J.M. Analysis of urban spatial accessibility of museums within the scope of Seoul. Buildings 2022, 12, 1749. [Google Scholar] [CrossRef]
  35. Zhao, X.L.; Hong, K.S. Analysis on accessibility of tourist city museums based on according to through angle and limit distance: Focusing on Busan metropolitan city. J. Arch. Inst. Korea 2022, 38, 169–180. [Google Scholar] [CrossRef]
  36. Garau, C.; Annunziata, A.; Yamu, C. A walkability assessment tool coupling multi-criteria analysis and space syntax: The case study of Iglesias, Italy. Eur. Plan. Stud. 2024, 32, 211–233. [Google Scholar] [CrossRef]
  37. Zhao, X.L.; Lee, J.J.; Hong, K.S. A comparative analysis of museum accessibility in high-density Asian cities: Case studies from Seoul and Tokyo. Buildings 2023, 13, 1886. [Google Scholar] [CrossRef]
  38. Yang, C.; Qian, Z. Street network or functional attractors? Capturing pedestrian movement patterns and urban form with the integration of space syntax and MCDA. Urban Des. Int. 2023, 28, 3–18. [Google Scholar] [CrossRef]
  39. Zhao, X.L.; Hong, K.S. Basic analysis of the correlation between the accessibility and utilization activation of public libraries in Seoul: Focusing on location and subway factors. Buildings 2023, 13, 600. [Google Scholar] [CrossRef]
  40. Kim, J.; Park, S.; Kim, M. Safety map: Disaster management road network for urban resilience. Sustain. Cities Soc. 2023, 96, 104650. [Google Scholar] [CrossRef]
  41. Busan Metropolitan City Public Data Portal. Status of Apartment Complexes. Available online: https://data.busan.go.kr/dataSet/list.nm (accessed on 5 January 2024).
  42. Busan Metropolitan City Senior Citizen’s Regional Support Center. Status of Senior Citizen Centers. Available online: http://www.busansenior.or.kr/04find/01.php (accessed on 5 January 2024).
  43. Ministry of Land, Infrastructure, and Transport. V-WORLD. Available online: https://www.vworld.kr/v4po_main.do (accessed on 5 January 2024).
Figure 1. Research process of the study.
Buildings 14 00929 g001
Figure 2. Example of how to measure variables in Jurye-dong, Busan: (a) independent variable; (b) dependent variable.
Buildings 14 00929 g002
Figure 3. Spatial hierarchy of each administrative district in Busan.
Buildings 14 00929 g003
Figure 4. Normal P-P plot analysis of each administrative district data group in Busan: (a) GJ, (b) GIJ, (c) NG, (d) DG, (e) DR, (f) BSJ, (g) BG, (h) SS, (i) SH, (j) SG, (k) SY, (l) YJ, (m) YD, (n) JG, and (o) HUD.
Buildings 14 00929 g004
Table 1. Review of past studies on senior citizen centers.
Author (Year)PurposeConsideration Variable
Lim and Lee (2011) [25]Studying the correlation between elderly welfare facilities, residential proximity, and preference by older adultsResidential proximity, preference by older adults
Jeong and Jun (2013) [22]Studying spatial characteristics of areas with concentrated populations of elderly personsDistribution of the population of elderly persons, small houses, welfare facilities
Kim et al. (2014) [21]Measuring accessibility of public exercise facilitiesFacility accessibility, perceived distance
Choi et al. (2015) [23]Measuring the impact of social factors on older adults by genderGender gaps, communication, mental and physical health
Hong and Kim (2016) [24]Comparing factors hindering the use of leisure welfare facilities for older adults by region type Intrapersonal, interpersonal, physical, and control factors
Oh and Kwon (2018) [20]Evaluating exercise and environment for older adultsTravel distance, walking time, exercise time
Zhao and Lee (2021) [19]Measuring differences in the spatial hierarchy of senior citizen centers inside and outside apartment complexesSpatial accessibility, usage rate
Choi et al. (2022) [26]Improving the use of space among older adults, as well as their satisfactionFrequency of use, health promotion, satisfaction, accessibility
Woo (2022) [27]Measuring the usage and satisfaction of senior citizen centers Preferred programs, travel distance, and motivations
Park and Lee (2023) [28]Formulating a strategic plan to revitalize senior citizen centersWalking accessibility, differences in spatial demand
Roh (2023) [29]Developing guidelines to promote the operation and functions of senior citizen centersPreferred programs, motivations, and activation factors
Park and Cho (2024) [30]Exploring factors affecting organizational commitment of workers at senior welfare centersSocial support, intention to remain
Lee et al. (2024) [31]Analyzing the impact of personal and community factors on life satisfaction of elderly personsPolicies for older adults, life satisfaction, welfare facility distribution
Table 2. Interpretation of space syntax expressions.
TypeInterpretation
MDAverage spatial depth
TSDiTotal spatial depth in space i
SThe number of steps taken through space i
mThe number of steps from space i to the deepest space
KThe total number of spaces
KsThe number of spaces in Step S
DnCorrection factor
D (i, k)The depth from space i to space k
nThe total number of nodes
Table 3. The general status of each administrative district in Busan.
District
(Abbreviated)
% of Older AdultsArea (km2)Population Density# of Apartment Buildings# of Senior Citizen CentersAxial Lines
Gangseo-gu (GS)14.2%181.49784.60/km21116210,835
Geumjeong-gu (GJ)25.1%65.283302.54/km23661293934
Gijang-gun (GIJ)18.4%218.30818.73/km2872918056
Nam-gu (NG)23.2%26.829477.44/km22061726145
Dong-gu (DG)28.6%9.878894.83/km282756619
Dongrae-gu (DR)21.2%16.6316,284.73/km22471385157
Busanjin-gu (BSJ)22.1%29.6712,116.89/km24272667806
Buk-gu (BG)21.6%39.376949.35/km21111472155
Sasang-gu (SS)22.5%36.105621.39/km2561333248
Saha-gu (SH)23.2%41.777130.26/km22941952903
Seo-gu (SG)28.1%13.957461.58/km2187747005
Suyeong-gu (SY)24.4%10.2117,092.85/km2318902434
Yeonje-gu (YJ)22.5%12.1017,005.45/km22351232065
Yeongdo-gu (YD)31.6%14.207503.38/km291715788
Jung-gu (JG)30.7%2.8313,646.29/km284311807
Haeundae-gu (HUD)20.9%51.547381.61/km21102423199
Table 4. GS data group t-test.
Dependent VariableIndependent VariabletdfSig.
(2-Tailed)
Mean DifferenceStd. Error Difference
CA0.0114.3980.9920.001 0.053
B−1.07290.312−0.8330.777
Table 5. Analysis of the relative independence of each administrative district data group.
TypeNMeanMean RankStd. DeviationMinMaxChi-Square
GJ ***A3660.5741.0000.0570.3930.672713.981
B36.2542.97420.077185
C5.2022.0251.900110
GIJ ***A870.4161.1030.0350.2800.482123.027
B13.5752.7419.268029
C6.2532.1553.070013
NG ***A2060.6741.0100.1230.3850.915339.136
B16.8252.7799.120037
C7.3932.2113.392221
DG ***A820.7241.0000.1240.4120.913143.184
B12.1222.8235.098121
C6.0852.1772.310113
DR ***A2471.0171.0000.1620.5111.419435.493
B24.7332.85014.399262
C6.5102.1502.048112
BSJ ***A4270.8831.0020.1350.4071.189775.591
B29.9602.89716.231269
C8.3212.1014.059020
BG ***A1110.8771.0180.1590.4831.018168.902
B14.1442.6718.64502.671
C6.9732.3112.88122.311
SS ***A561.0361.1430.1770.6491.35864.530
B6.9642.3845.081018
C7.8212.4733.081013
SH ***A2940.6121.0070.0820.3730.757508.486
B23.7792.83814.163065
C6.7722.1552.795114
SG ***A1870.5501.0000.1040.2680.695357.823
B29.4492.95213.652254
C5.7542.0481.968111
SY ***A3181.5901.0000.2420.8452.272635.005
B55.3112.99732.8324111
C7.7642.0031.864312
YJ ***A2361.0091.0000.1610.5471.320435.626
B38.3402.91731.7601105
C8.5062.0832.716215
YD ***A910.4741.0110.0990.3170.622143.939
B11.6922.7207.139029
C6.3852.2692.260211
JG ***A840.9881.0600.1670.5571.339153.365
B26.0832.96412.623045
C8.0121.9763.396015
HUD ***A1100.4651.0550.0720.2790.595150.522
B7.5732.3774.722018
C8.5182.5684.405019
*** p < 0.001.
Table 6. Two-way ANOVA to test effectiveness by administrative district.
TypeCorrected ModelInterceptABErrorTotalCorrected Total
GJdf218113778147366365
Mean Square4.8192635.7604.1212.9711.813
F2.6581453.6152.273 ***1.638 **
GIJdf83158638786
Mean Square9.7042243.6924.1670.8331.667
F5.8221346.2152.5000.500
NGdf1971162118206205
Mean Square11.9516964.66212.2871.1430.605
F19.74211505.04620.298 ***1.888
DGdf781591138281
Mean Square5.512500.9854.7515.3030.833
F6.614601.1825.7016.364
DRdf2441192232247246
Mean Square4.2263844.4863.7131.0540.250
F16.90515377.94614.8534.217
BSJdf38313213743427426
Mean Square18.2024521.62214.0583.6501.109
F16.4204078.83812.682 ***3.293 ***
BGdf104174116111110
Mean Square8.756836.6806.9921.0080.375
F23.3502231.14818.645 **2.687
SSdf52136435655
Mean Square10.0432097.7239.0814.6250.795
F12.6252637.20311.416 ***5.814 ***
SHdf19611415497294293
Mean Square9.5842880.6737.8376.1014.241
F2.260679.2771.848 **1.439
SGdf15011063536187186
Mean Square4.4592252.0774.3442.9451.438
F3.1011566.1763.021 ***2.048 *
SYdf26111658356318317
Mean Square3.9131791.7073.1102.1171.427
F2.7421255.3242.179 **1.484
YJdf17811164756235234
Mean Square9.234557.8309.1872.2321.485
F6.218375.6316.186 ***1.503
YDdf841581969190
Mean Square5.372800.9265.1793.6361.375
F3.907582.4923.766 ***2.644 *
JGdf751451288483
Mean Square12.6482754.0877.81110.8931.047
F12.0862631.6067.463 **10.408 **
HUDdf881701521110109
Mean Square23.0901981.53319.88311.7773.979
F5.803498.0434.997 ***2.960 *
Dependent Variable: C; * p < 0.05; ** p < 0.01; *** p < 0.001.
Disclaimer/Publisher’s Note: The statements, opinions and data contained in all publications are solely those of the individual author(s) and contributor(s) and not of MDPI and/or the editor(s). MDPI and/or the editor(s) disclaim responsibility for any injury to people or property resulting from any ideas, methods, instructions or products referred to in the content.

