Article

Theoretical and Numerical Simulation Study on the Ultimate Load Capacity of Triangular and Quadrilateral Truss Structures

1
Zhejiang Provincial Erjian Construction Group Ltd., 519 Minhe Road, Ningbo 315202, China
2
Ningbo Zhenhai District Construction Traffic Engineering Safety and Quality Management Center, 669 Congyuan Road, Ningbo 315299, China
3
School of Mechanics and Civil Engineering, China University of Mining and Technology, 1 Daxue Road, Xuzhou 221116, China
4
College of City Construction, Jiangxi Normal University, 99 Ziyang Avenue, Nanchang 330022, China
*
Author to whom correspondence should be addressed.
Submission received: 20 February 2024 / Revised: 10 March 2024 / Accepted: 26 March 2024 / Published: 28 March 2024

Abstract

:
Spatial truss structures (STSs), serving as the bottom support structure of a cooling tower, effectively harness the superior load-bearing capacity offered by lattice-type truss structures. STSs are composed of main bars, diagonal bars, and horizontal bars, with horizontal bars serving as vital components of the truss structure. They play a pivotal role in maintaining the overall integrity and stability of the structure. The proportional relationship between the stiffness of each bar in STSs has a profound impact on the mechanical characteristics of the overall structure. This relationship directly influences the ultimate load-bearing capacity of the structure. Therefore, conducting research on the influence patterns of this relationship is of utmost importance. This paper explores the study of triangular truss structures (TTSs) and quadrilateral truss structures (QTSs). Firstly, through theoretical analysis, considering structural elements such as the stiffness of the horizontal bars, the number of layers in the truss, and the angle between the diagonal bars and the horizontal bars, theoretical expressions for the calculation of the ultimate load capacity of TTSs and QTSs are derived. Furthermore, a parametric finite element (FE) model was established for the TTSs and QTSs. Through numerical simulations, the validity of the theoretical calculation expressions was verified. Finally, this paper discusses the influence of factors such as the stiffness of the horizontal bars, the number of layers in the truss, and the angle between the diagonal and horizontal bars on the TTSs and QTSs. It analyzes the patterns and trends of these influences. The research results indicate that the theoretical and numerical simulation results for the TTSs have an error ranging from 0.40% to 4.93%, while the relative error for the QTSs ranges from 1.59% to 4.88%. These errors are within an acceptable range for engineering calculations. As the stiffness of the horizontal bars increases, the proportionality coefficient of the truss’s ultimate load capacity shows an initial increase followed by a stable trend. It reaches an equilibrium state when the stiffness of the horizontal bars reaches a certain threshold. As the number of layers in the truss and the angle between the diagonal and horizontal bars increase, the proportionality coefficient of the load capacity gradually decreases. The research findings provide a theoretical basis for the application of TTSs and QTSs in cooling towers.

1. Introduction

Cooling towers are important facilities in thermal power plants and nuclear power plants [1]. Hyperbolic cooling towers are mostly large-scale reinforced concrete structures, whose main function is to remove waste heat from water and transfer it to the atmosphere [2]. Hyperbolic cooling towers are hyperbolic thin-walled shell structures, capable of effectively withstanding external pressure [3]. The safety of these power facilities is directly dependent on their load-bearing capacity. During the operation of a cooling tower, sudden damage or collapses can occur due to factors such as structural deterioration, random actions, and environmental effects [4,5]. Any damage to cooling towers can lead to safety accidents, either directly or indirectly [6,7]. The original cooling tower dates back to the 1920s and is approximately 110 years old [8]. After World War II, rapid economic development took place in countries worldwide, leading to the construction and development of thermal power plants and their associated cooling tower facilities. However, at that time, the design and construction concepts were not mature, resulting in multiple cooling tower collapse accidents. For example, the Ferrybridge Power Station accident [9] and the Ardeer Power Station cooling tower accident [10] were notable incidents caused by these design and construction shortcomings. Therefore, as an important type of engineering structure, the stability and ultimate load-bearing capacity of cooling towers deserve special attention from the engineering community and researchers.
The main structure of a cooling tower consists of the tower shell, lower columns, and ring foundations. Under loads, the upper and lower ends of the supporting columns of the tower shell, as well as the bottom of the shell connected to the upper end of the column, become the weak points of the entire structure [11]. Therefore, the structural form and load-bearing capacity of the lower columns play a crucial role in the overall safety of cooling towers. To improve the local stress distribution and enhance their load-bearing capacity, this study proposes TTSs and QTSs for the column system and conducts research on its ultimate load-bearing capacity. The TTSs and QTSs primarily consist of main bars, diagonal bars, and horizontal bars. The horizontal bars, as essential components, play a crucial role in the stability and load-bearing capacity of the structure. In the TTSs and QTSs, the stiffness of the horizontal bars, the number of truss layers, and the angle between the diagonal and horizontal bars directly influence the ultimate load-bearing capacity of the structure. Therefore, it is crucial to conduct research on these factors to understand their impact on the performance of the truss structures.
STSs, as a type of lattice structural component, have been extensively studied both domestically and internationally. Research on the load-bearing capacity of STSs mainly focuses on aspects such as their nonlinear load-bearing capacity, the load-bearing capacity of connection joints, and their impact on the overall structure. These studies aim to understand the behavior and performance of STSs under different loading conditions and to enhance their load-carrying capabilities. Tang et al. [12] proposed a prediction model for the bearing capacity of unequal-leg angle (ULA) cross-bracings, and the efficiency and accuracy of the model was verified through experiments and FE analysis. Vettoretto et al. [13] considered extreme wind load conditions and investigated the influence of geometric imperfections and the joint stiffness in brace and lattice structure sub-assemblies on the ultimate load-bearing capacity of tower structures. Krajewski et al. [14] conducted a study on the stability and load-bearing capacity of elastic support trusses. Milašinović et al. [15] investigated the load-bearing capacity of non-elastic beams and planar trusses, considering geometric and material defects. Krajewski et al. [16] provided linear buckling analysis results and nonlinear static analysis results for truss–shell models and obtained the relationship between the truss support stiffness and buckling as well as the ultimate load capacity. Stümpel et al. [17] proposed a truss structure composed of concrete columns and cast iron joints and conducted experimental studies to investigate the load-bearing behavior of this new connection joint. Gao et al. [18] investigated the mechanical response of long-span steel truss arch bridges through elastic–plastic time history analysis. Li et al. [19] proposed a steel truss structure with a high impact resistance and conducted in-depth research on its mechanical properties through numerical simulations and experiments. Cai et al. [20] proposed a topology optimization design method for truss structures, considering the stability of joints and local components. Li et al. [21] analyzed the effects of various factors, such as component deviation, the bolt pre-tension force, and the structural self-weight, on the mechanical characteristics of the escalator truss structure through experiments and numerical simulations. Yao et al. [22] investigated the mechanical response of STSs under loading conditions, considering the influence of semi-rigid connections at the joints. Jiang et al. [23] conducted numerical simulations to investigate the influence of connection joints on the load-bearing capacity of lattice transmission towers. Li et al. [24] considered the influence of geometric nonlinearity and material nonlinearity and proposed an elastoplastic analysis method for ultra-high-voltage (UHV) transmission towers. Tang et al. [25] established a finite element model of a steel tubular transmission tower with cross-bracings featuring semi-rigid connections and conducted a predictive study on the stability bearing capacity of the tower structure. Hao et al. [26] investigated the influence of the connection joint stiffness on the mechanical characteristics of STSs through experiments and numerical simulations. Jiang et al. [27] proposed a key joint simulation technique to investigate the impact of connection joints on the load-carrying capacity of ultra-high-voltage transmission tower frames through experiments and numerical simulations. Gan et al. [28] proposed a slip calculation model for connection joints and experimentally validated the effectiveness of the model. Ma et al. [29] considered the influence of semi-rigid connection joints and studied their effect on the stability of steel cooling towers. Yang et al. [30] conducted a study on the influence of semi-rigid connections in steel structures on the overall structural mechanical properties. A significant amount of research indicates that the stiffness of structural connection joints has a substantial impact on the overall mechanical characteristics of structures [31,32,33,34]. Additionally, the local stiffness within a structure can directly affect its ultimate load-carrying capacity [35,36,37,38].
There is a substantial amount of theoretical and experimental research both domestically and internationally on the influence of the connection joint stiffness. However, there is a relative lack of research on the mutual interaction between the support structure stiffness in TTSs and QTSs. Therefore, this paper focuses on TTSs and QTSs and combines the characteristics of truss structures. From both theoretical analysis and numerical simulation, it investigates the influence of three factors: the stiffness of the horizontal bars, the number of truss layers, and the angle between the diagonal and horizontal bars on the overall ultimate load-carrying capacity of the structures. The research results are compared between TTSs and QTSs. The findings of this study will provide a theoretical basis for the application of TTSs and QTSs in cooling towers.

2. Theoretical Calculation of the Ultimate Load-Carrying Capacity of TTSs and QTSs

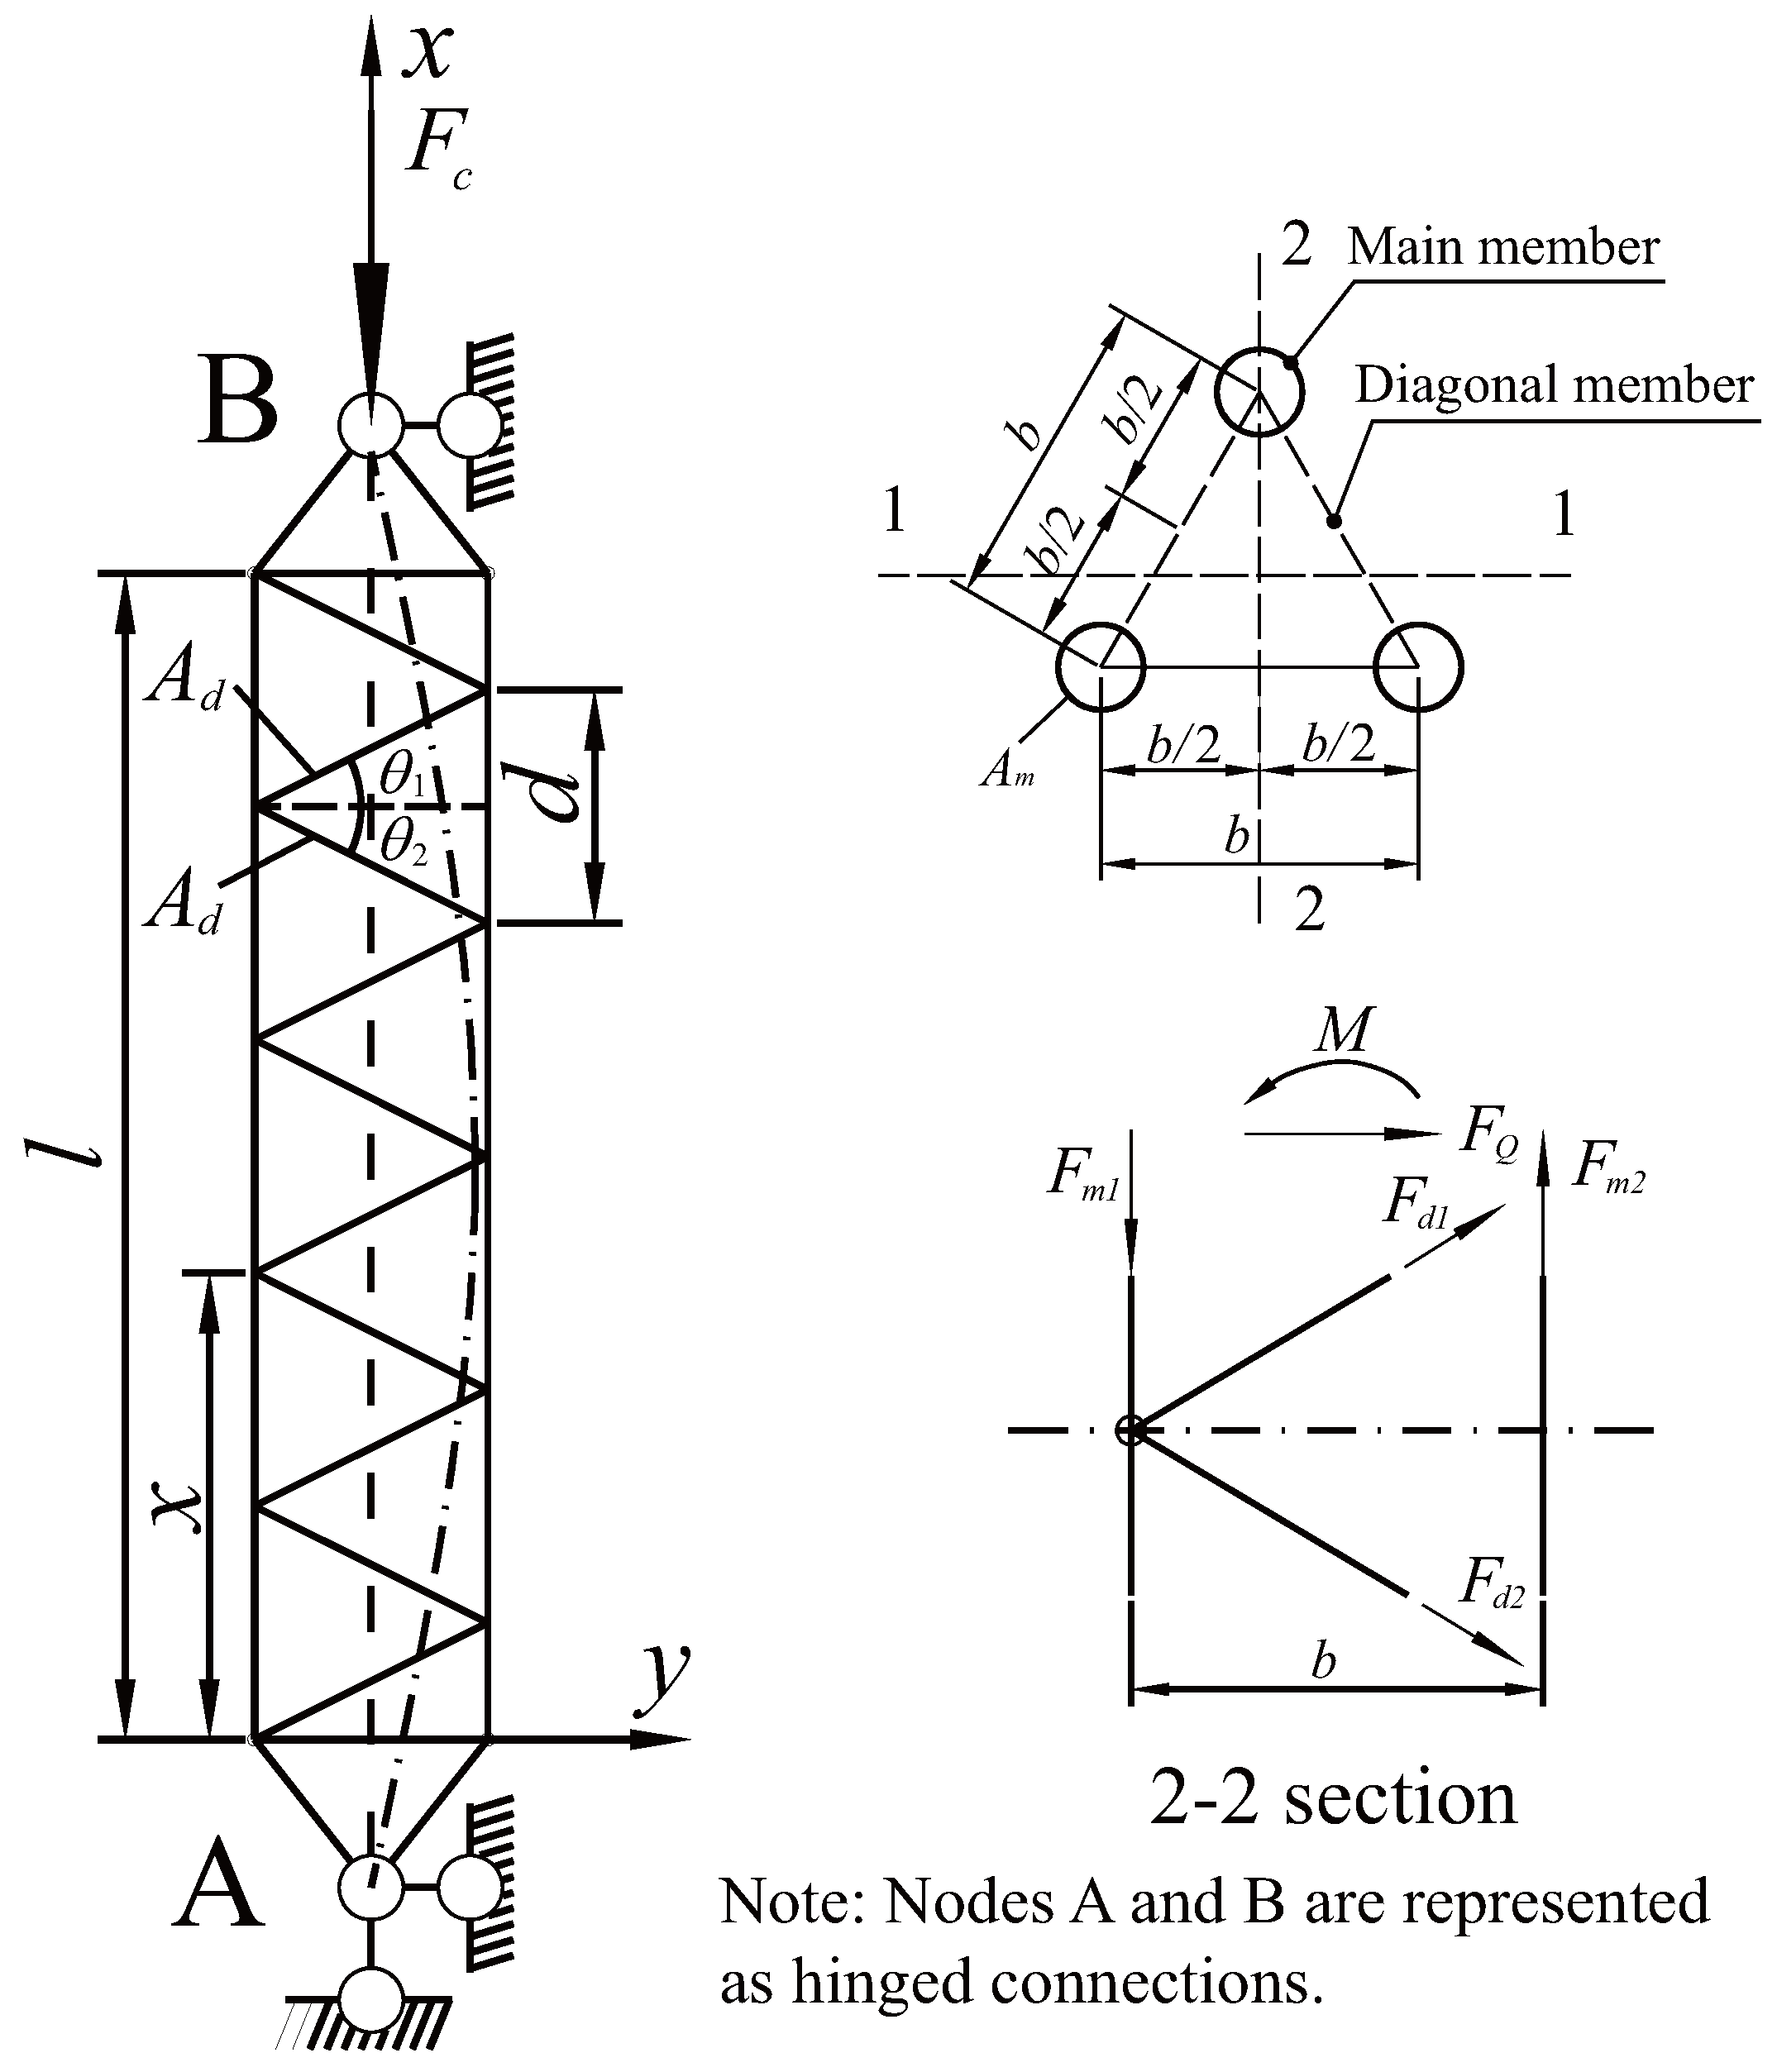
2.1. Ultimate Load-Carrying Capacity of TTSs

The TTS is primarily composed of main bars, diagonal bars, and horizontal bars, as shown in Figure 1. The connection joints between the members are hinge joints. When the structure becomes unstable, the members in the truss primarily experience axial forces.
If both ends of the truss structure are hinged connections, the constraints at node A are displacement constraints in the x, y, and z directions, while the constraints at node B are constraints in the y and z directions. Considering the characteristics of displacement constraints, let us assume the deformation function of the triangular truss when it becomes unstable is given by [39]
y = a sin ( π x l )
where a represents the deformation coefficient, x represents the length in the x-axis direction, and l represents the length of the truss.
The bending moment and shear force at any arbitrary point along the axis of the structure can be expressed as
M = F c y = F c a sin ( π x l )
F Q = d M d x = π F c a cos ( π x l ) / l
where M represents the bending moment of the truss structure about the 1-1 axis direction, F Q denotes the shear force at any point of the truss structure, and F c represents the load along the x-axis in the truss structure.
According to the force analysis, the axial force of the main bar in the truss can be expressed as
F m 1 = 2 3 F c a sin ( π x l ) 3 b
F m 2 = 3 F c a sin ( π x l ) 3 b
where F m 1 represents the axial force in the upper main bar of the truss about the 1-1 axis, F m 2 represents the axial force in the lower main bar of the truss about the 1-1 axis, and b represents the width of the truss section.
The combined axial forces of the diagonal bars in the upper and lower layers within the same section are
F d 1 = 2 3 π F c a cos ( π x l ) 3 l cos ( θ 1 )
F d 2 = 2 3 π F c a cos ( π x l ) 3 l cos ( θ 2 )
where F d 1 represents the combined axial force of the diagonal bars in the upper layer of the TTS, θ 1 represents the angle between the diagonal bars in the upper layer and the x-axis, F d 2 represents the combined axial force of the diagonal bars in the lower layer of the TTS, and θ 2 represents the angle between the diagonal bars in the lower layer and the x-axis.
The strain energy of the TTS can be expressed as
U = i = 1 n F m 1 i 2 s m i 2 E A m 1 i + F m 2 i 2 s m i 2 E A m 2 i + F d 1 i 2 s d i 2 E A d 1 i + F d 2 i 2 s d i 2 E A d 2 i
where s m represents the length of the main bar, s d represents the length of the diagonal bar, E represents the elastic modulus of the bar material, A m represents the cross-sectional area of the main bar in the truss, and A d represents the cross-sectional area of the diagonal bar in the truss.
Substituting Equations (4)–(7) into Equation (8), we obtain
U = 1 2 E i = 1 n F m 1 i 2 d A m i + i = 1 2 n F m 2 i 2 d A m i + i = 1 n F d 1 i 2 b cos θ 1 A d 1 i + i = 1 n F d 2 i 2 b cos θ 2 A d 2 i
Due to the typically larger number of sections in STSs, we can obtain
d = Δ x d x
According to Equation (10), we can obtain
1 n sin π x l 2 d 0 l sin π x l 2 d x = l 2 1 2 n sin π x l 2 d 2 0 l sin π x l 2 d x = l 1 n cos π x l 2 d 0 l cos π x l 2 d x = l 2
Based on the geometric relationship between the main bars and diagonal bars of the truss, we can derive
d = b tan θ 1 + b tan θ 2
According to Equations (9), (11) and (12), the strain energy of the truss can be expressed as
U c = F c 2 a 2 l 2 b 2 E A m 1 + π 2 F c 2 a 2 6 l E tan θ 1 + tan θ 2 1 A d 1 cos 3 θ 1 + 1 A d 2 cos 3 θ 2
Taking into account the influence of bending deformation on the deformation of the STS, the potential energy of external loads is given by
U e = F c 0 l 1 2 y 2 d x = π 2 F c a 2 4 l
According to the principle of energy conservation, the total potential energy of the STS can be expressed as
E P = U c + U e
According to the energy method [40,41], the condition for stationary potential energy is d E P d a = 0 . We can obtain the expression for the critical load.
F P c r Δ = π 2 E I Δ l 2 1 3 + π 2 b l 2 1 tan θ 1 + tan θ 2 A m 1 A d 1 cos 3 θ 1 + A m 1 A d 2 cos 3 θ 2
where
I Δ = 3 2 A m 1 b 2
Equation (16) provides the calculation expression for the critical load considering only the influence of the diagonal bars between the upper and lower sections. When considering the impact of the horizontal bars within the STS, the calculation expression for the critical load of the complete TTS is as follows:
F P c r Δ = π 2 E I Δ l 2 1 3 + π 2 b l 2 1 tan θ 1 + tan θ 2 + tan θ 3 A m 1 A d 1 cos 3 θ 1 + A m 1 A d 2 cos 3 θ 2 + A m 1 A h cos 3 θ 3
where A h represents the cross-sectional area of the horizontal bar and θ 3 represents the angle between the horizontal bar and the y-axis.
Considering an STS with the horizontal bar perpendicular to the main bar, i.e., θ 3 = 0 , and diagonal bars with the same cross-sectional area and angle with the y-axis, i.e., θ 1 = θ 2 = θ , A d 1 = A d 2 = A d , the calculation expression for the critical load of the TTS becomes
F P c r Δ = π 2 E I Δ l 2 1 3 + π 2 b l 2 A m 1 A d cos 2 θ sin θ + A m 1 A h tan θ
To discuss the influence of the horizontal bar stiffness on the overall critical load of the STS, let us assume that A m 1 = A Δ , A d = 1 4 A Δ and the range of variation for A h is given by A h = 1 400 A Δ A Δ ( A h = ζ Δ A Δ ). The inter-nodal width of the truss structure is denoted as b Δ , and the inter-nodal height is h Δ = b Δ tan θ Δ . Therefore, l Δ = n Δ h Δ = n Δ b Δ tan θ Δ . Substituting this into Equation (19), we can obtain
F P c r Δ = 3 ζ Δ π 2 E A Δ cos 2 θ Δ sin θ Δ 6 ζ Δ n Δ 2 sin 3 θ Δ + 8 ζ Δ π 2 + 2 π 2 cos 3 θ Δ
where ζ Δ represents the coefficient of the range of variation for the horizontal bar area A h (with a range of 1 400 to 1). A Δ denotes the cross-sectional area of the main bar in the TTS. n Δ represents the number of sections in the TTS, which corresponds to the number of basic units in the TTS. θ Δ represents the angle between the diagonal bar and the x-axis direction in the TTS.
From Equation (20), it can be observed that the ultimate load-carrying capacity of the TTS is primarily related to three parameters: ζ Δ , n Δ , and θ Δ .

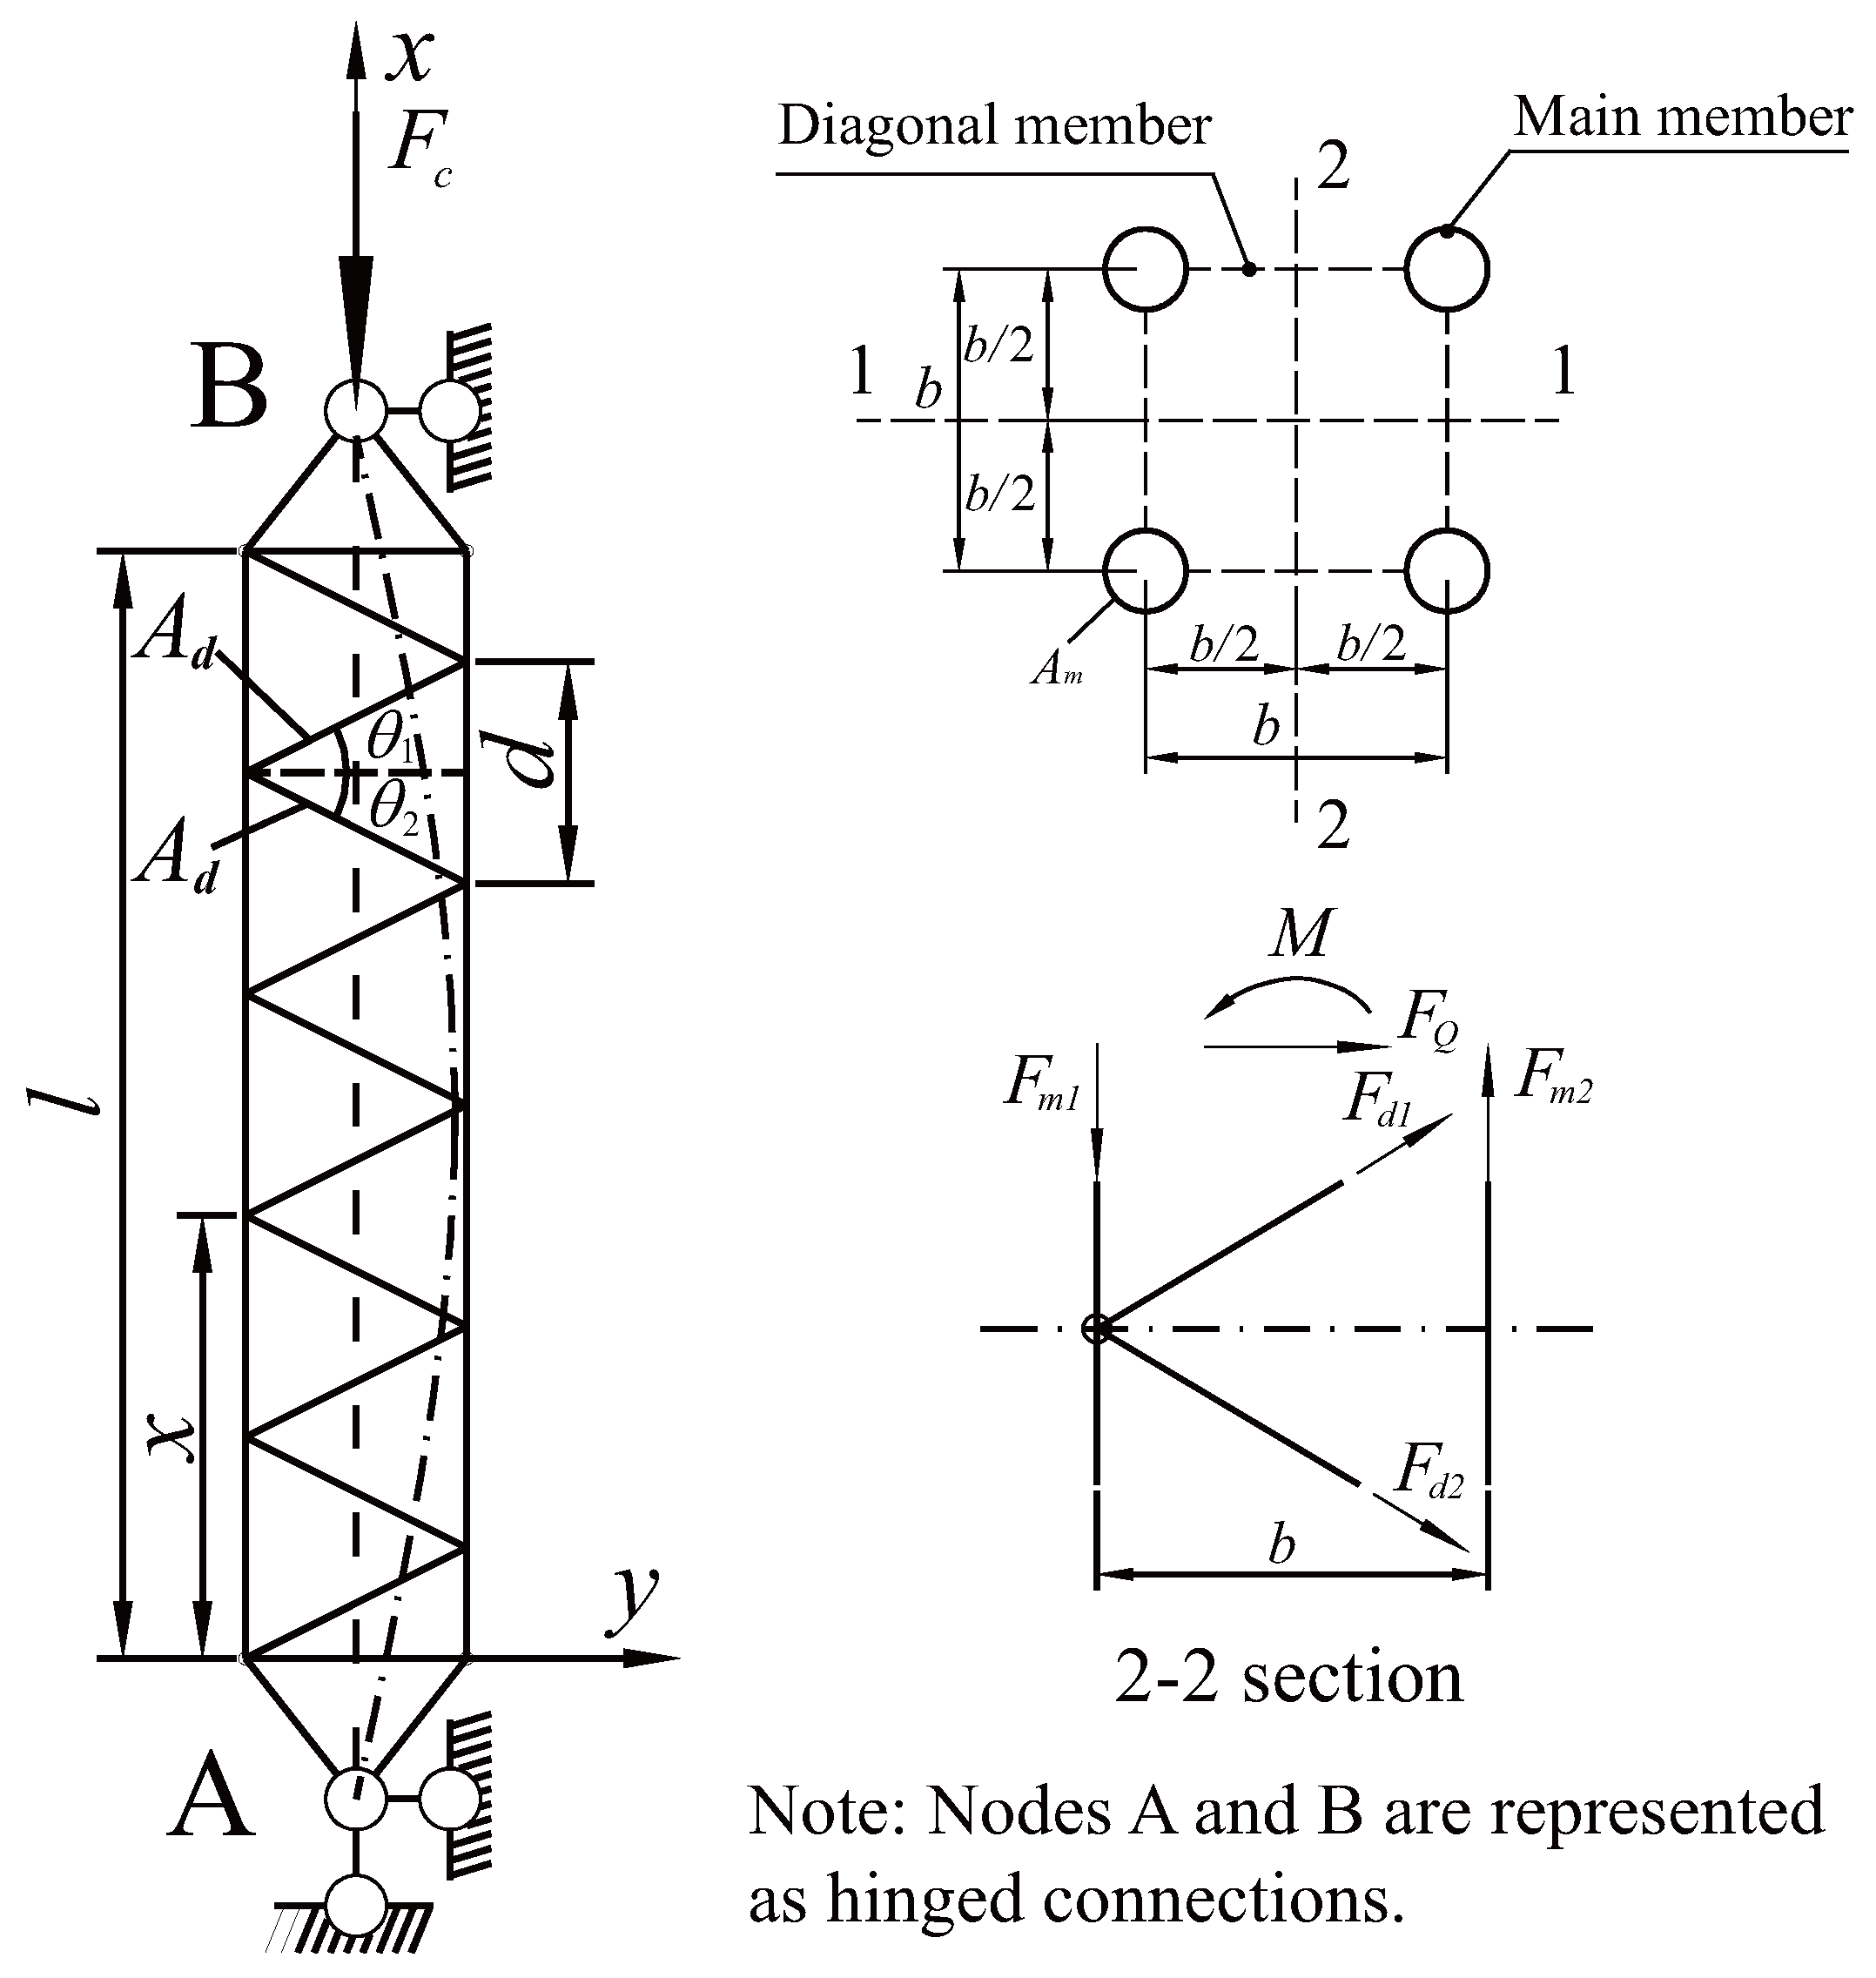
2.2. Ultimate Load-Carrying Capacity of QTSs

For QTSs, as shown in Figure 2, when both ends are restrained in hinge joints, the deformation function of the QTS is the same as that of the TTS, as shown in Equation (1).
In the QTS, the bending moment and shear forces of the structure can be represented by Equations (2) and (3). Similarly, in the QTS, the axial forces of the main bars, F m 1 , and the diagonal bars, F d 1 and F d 2 , can be approximated using the truss analysis method.
F m 1 = F c a sin ( π x l ) 2 b
F d 1 = π F c a cos ( π x l ) l cos θ 1
F d 2 = π F c a cos ( π x l ) l cos θ 2
The strain energy of the QTS can be expressed as
U = i = 1 n F m 1 i 2 s m i 2 E A m 1 i + F d 1 i 2 s d i 2 E A d 1 i + F d 2 i 2 s d i 2 E A d 2 i
Substituting Equations (21)–(23) into Equation (24), we can obtain
U = 1 2 E i = 1 4 n F m 1 i 2 d A m i + i = 1 n F d 1 i 2 b cos θ 1 A d 1 i + i = 1 n F d 2 i 2 b cos θ 2 A d 2 i
According to Equation (10), we can derive
1 4 n sin π x l 2 d 0 l sin π x l 2 d x = 2 l 1 n cos π x l 2 d 0 l cos π x l 2 d x = l 2
By utilizing Equations (25) and (27), the strain energy of the QTS is obtained:
U c = F c 2 a 2 l 4 b 2 E A m 1 + π 2 F c 2 a 2 4 l E tan θ 1 + tan θ 2 1 A d 1 cos 3 θ 1 + 1 A d 2 cos 3 θ 2
According to the energy method [40,41], the calculation expression for the critical load of the QTS is derived as
F P c r = π 2 E I l 2 1 1 + π 2 b l 2 1 tan θ 1 + tan θ 2 A m 1 A d 1 cos 3 θ 1 + A m 1 A d 2 cos 3 θ 2
where
I = A m 1 b 2
Taking into account the influence of the horizontal bar in the QTS, the calculation expression for the critical load of the overall QTS is given by
F P c r = π 2 E I l 2 1 1 + π 2 b l 2 1 tan θ 1 + tan θ 2 + tan θ 3 A m 1 A d 1 cos 3 θ 1 + A m 1 A d 2 cos 3 θ 2 + A m 1 A h cos 3 θ 3
Similarly, when θ 3 = 0 , θ 1 = θ 2 = θ , and A d 1 = A d 2 = A d , the calculation expression for the critical load of the QTS is obtained as follows:
F P c r = π 2 E I l 2 1 1 + π 2 b l 2 A m 1 A d cos 2 θ sin θ + A m 1 A h tan θ
To investigate the impact of the horizontal bar stiffness on the overall critical load of the truss, let A m 1 = A and A d = 1 4 A and consider the variation range of A h as A h = 1 400 A A (i.e., A h = ζ A ). The spacing between truss sections is denoted as b , and the height between truss nodes is given by h = b tan θ . Consequently, l = n h = n b tan θ . Substituting these values into Equation (31), we can obtain
F P c r = ζ π 2 E A cos 2 θ sin θ ζ n 2 sin 3 θ + 4 ζ   π 2 + π 2 cos 3 θ
where ζ represents the coefficient of variation range for the horizontal bar area A h (with a range of 1 400 to 1); n represents the number of sections in the QTS, which corresponds to the basic unit cell count of the QTS; and θ represents the angle between the diagonal bar and the x-axis direction in the QTS.
From Equation (32), it can be observed that the ultimate load-carrying capacity of the QTS is primarily dependent on three parameters: ζ , n , and θ .

3. Numerical Simulation

To validate the accuracy of the theoretical calculations for TTSs and QTSs, FE models of 2-layer, 5-layer, and 10-layer TTSs and QTSs were established using ANSYS 14.5 software. Numerical simulations are conducted to verify the accuracy of the theoretical calculations.

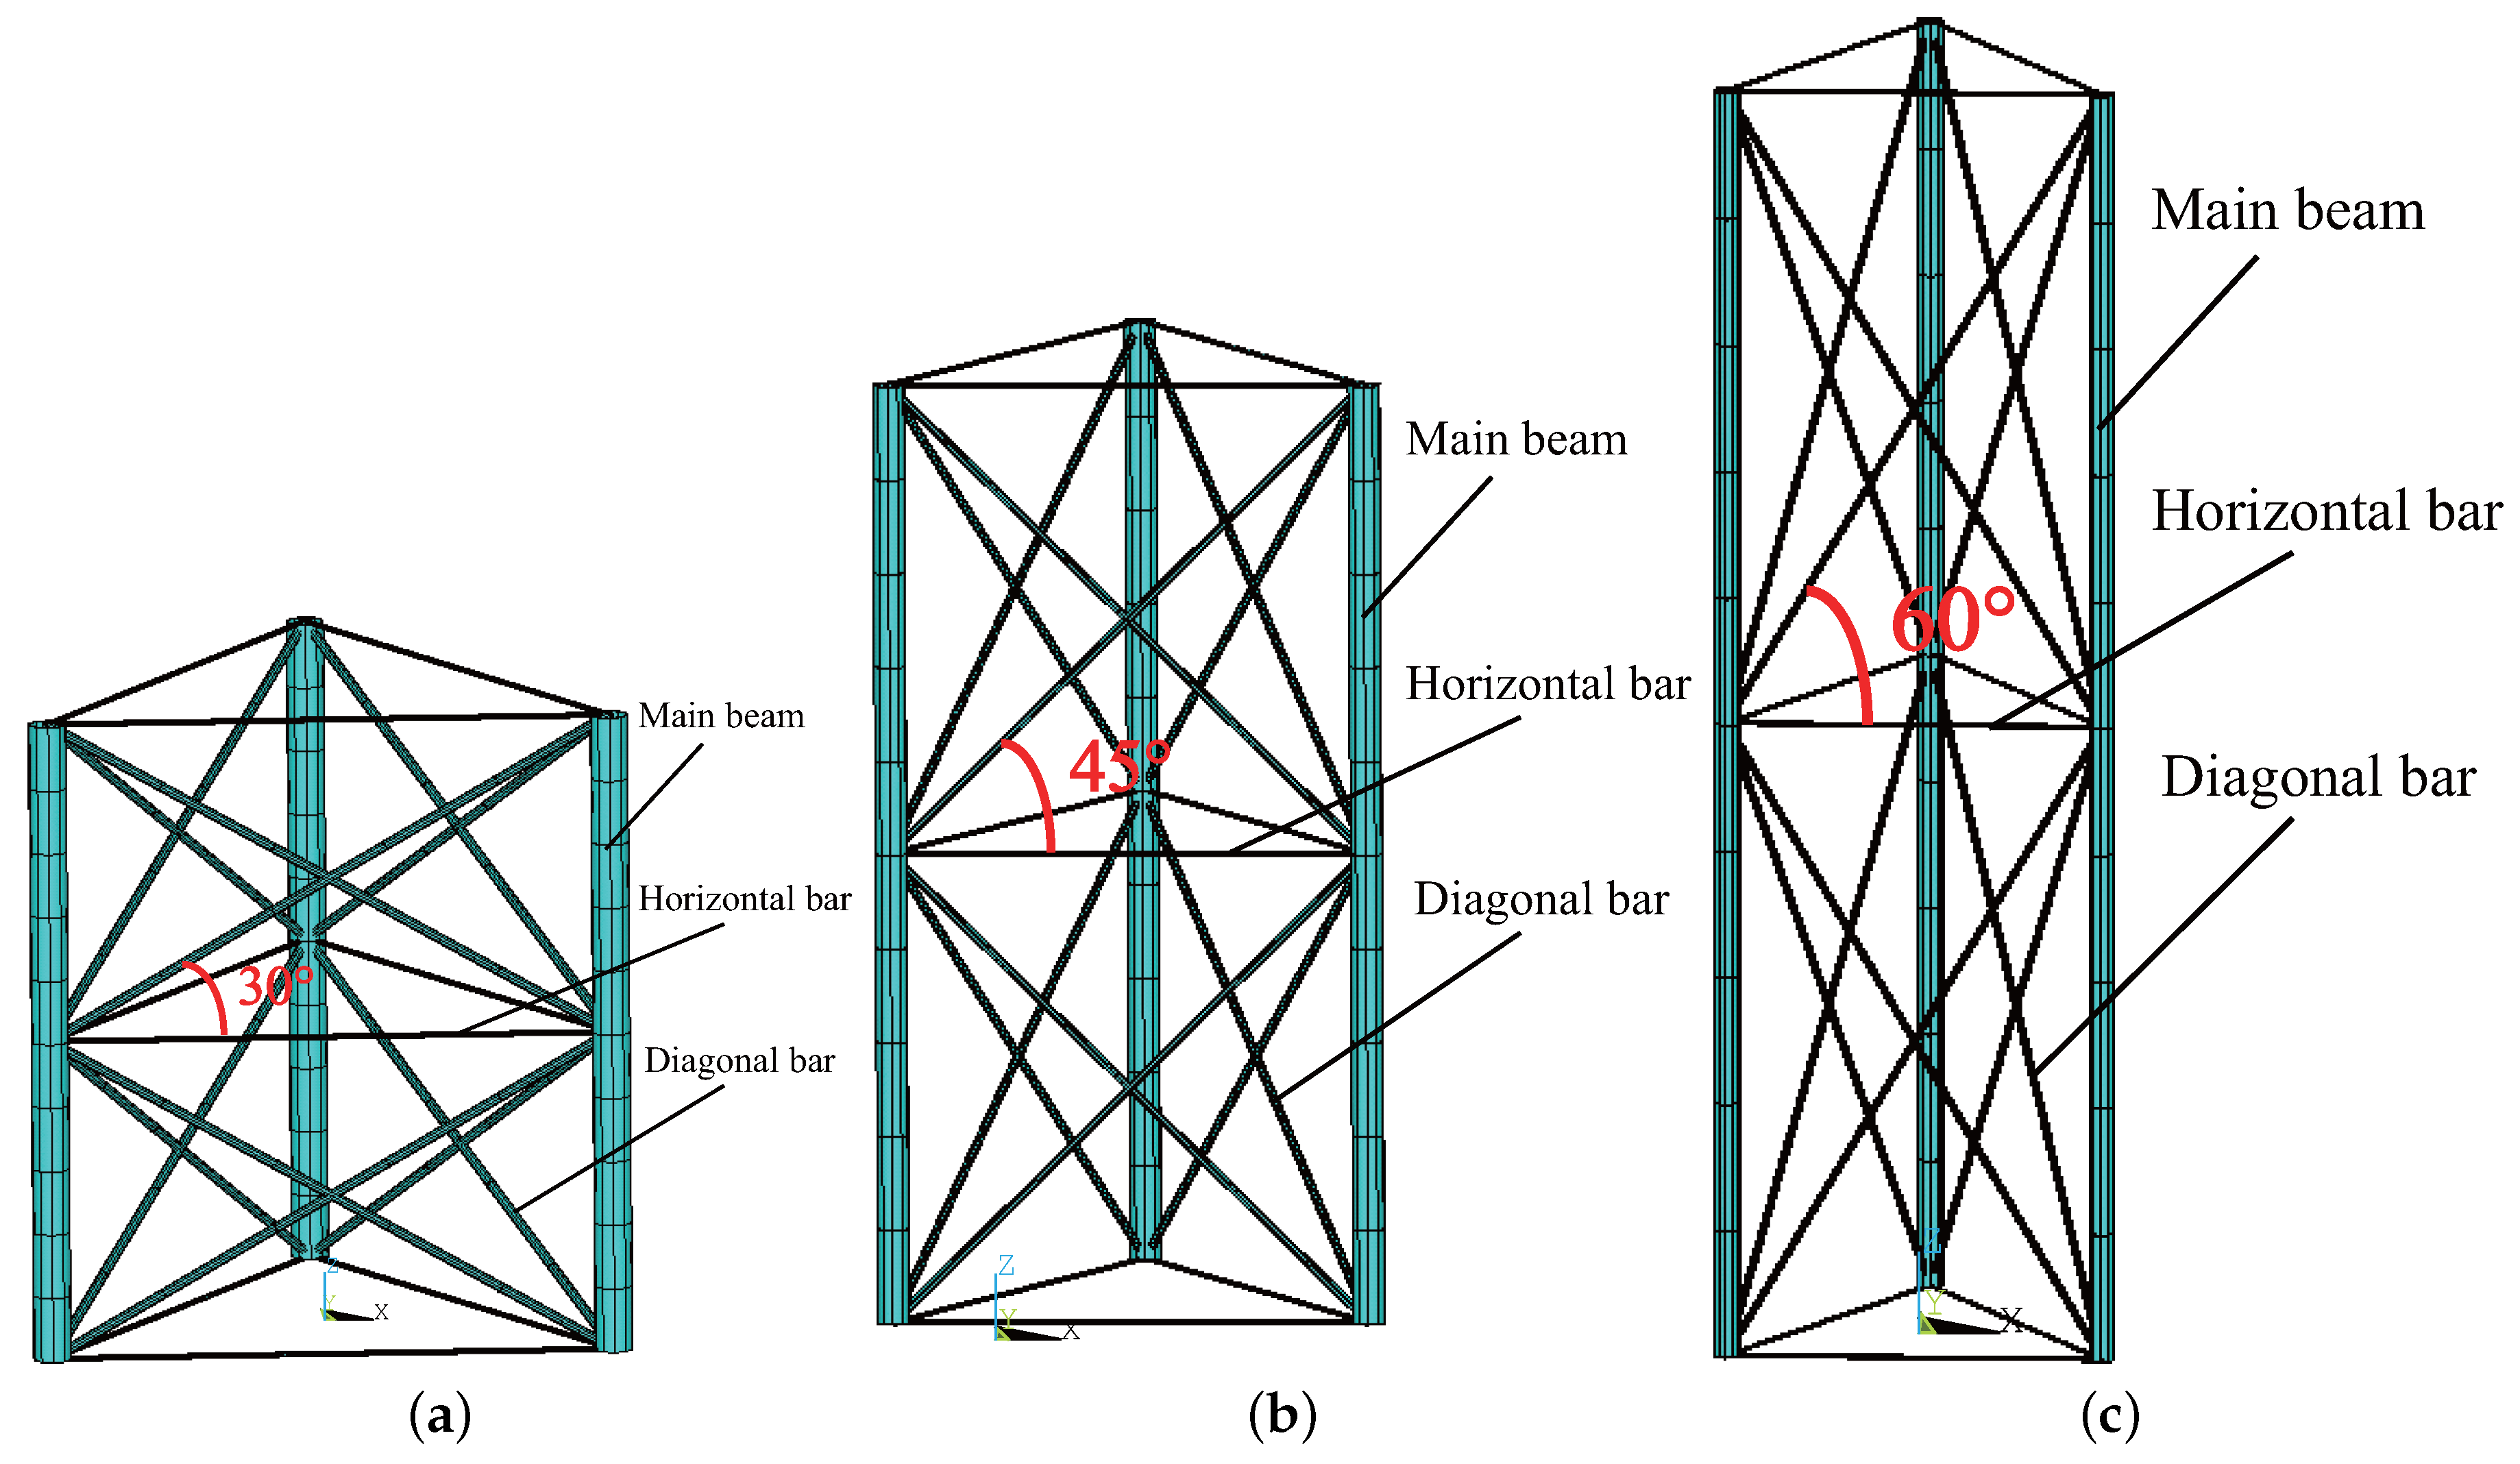
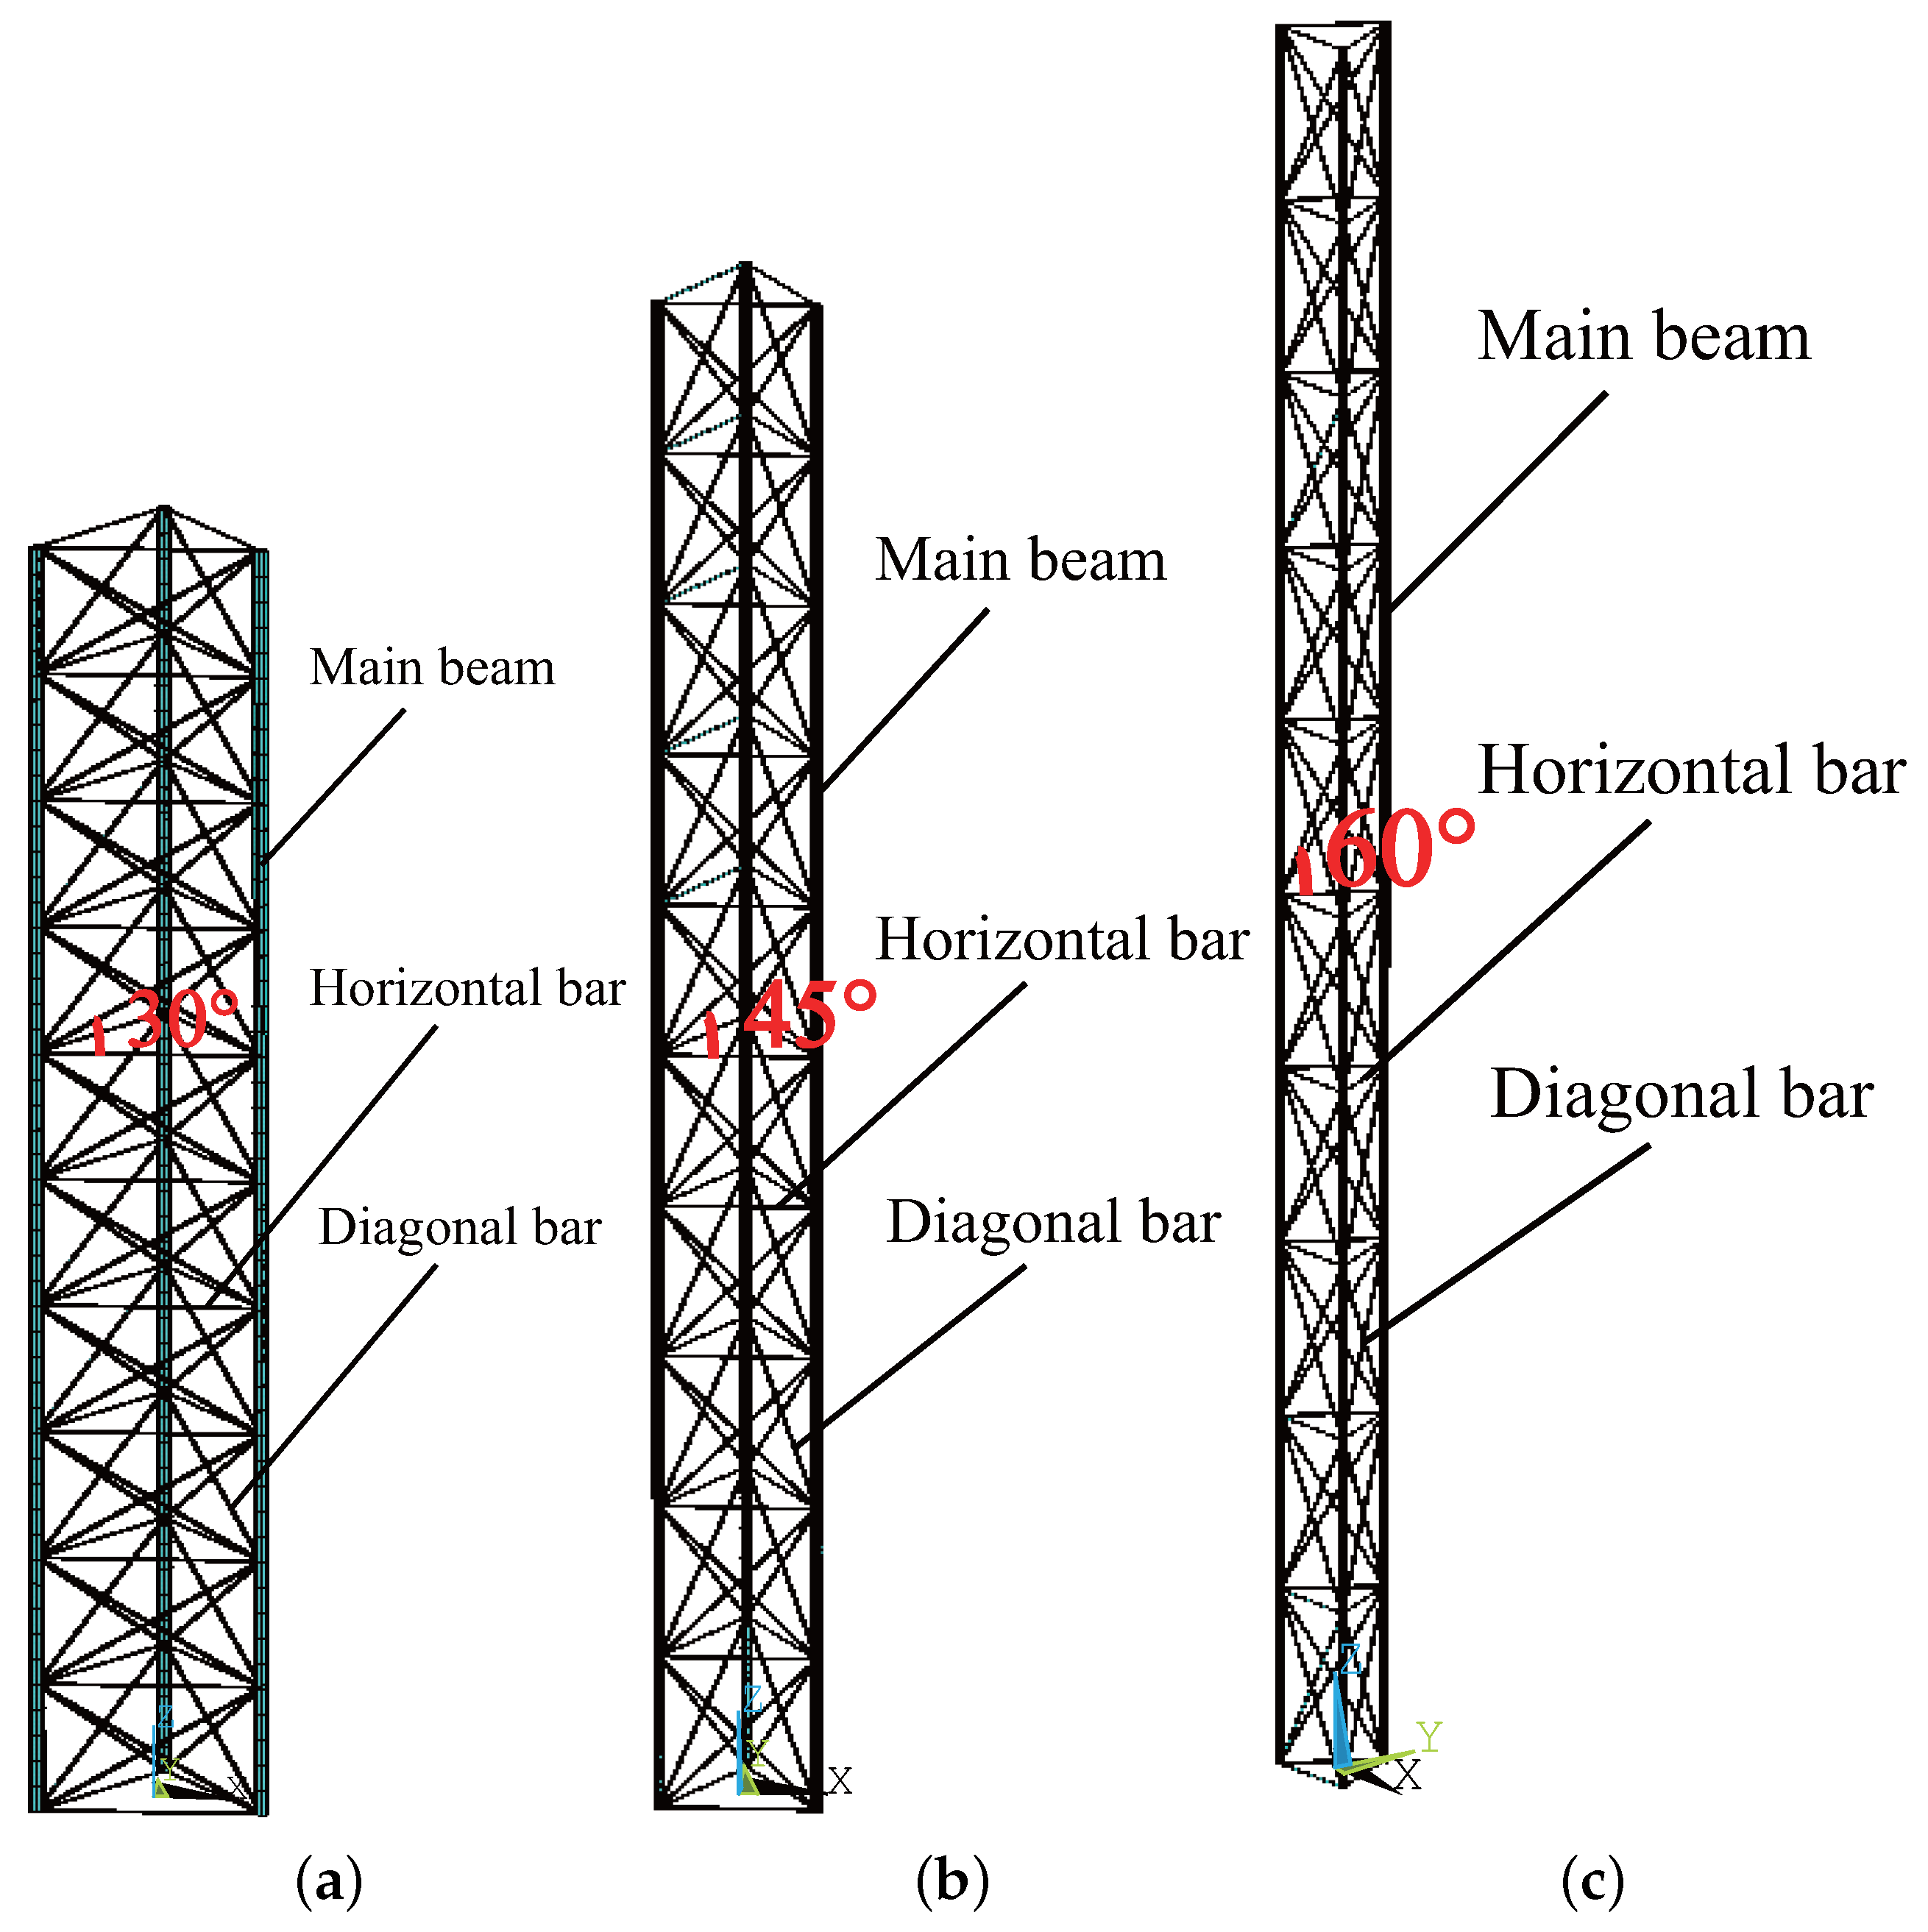
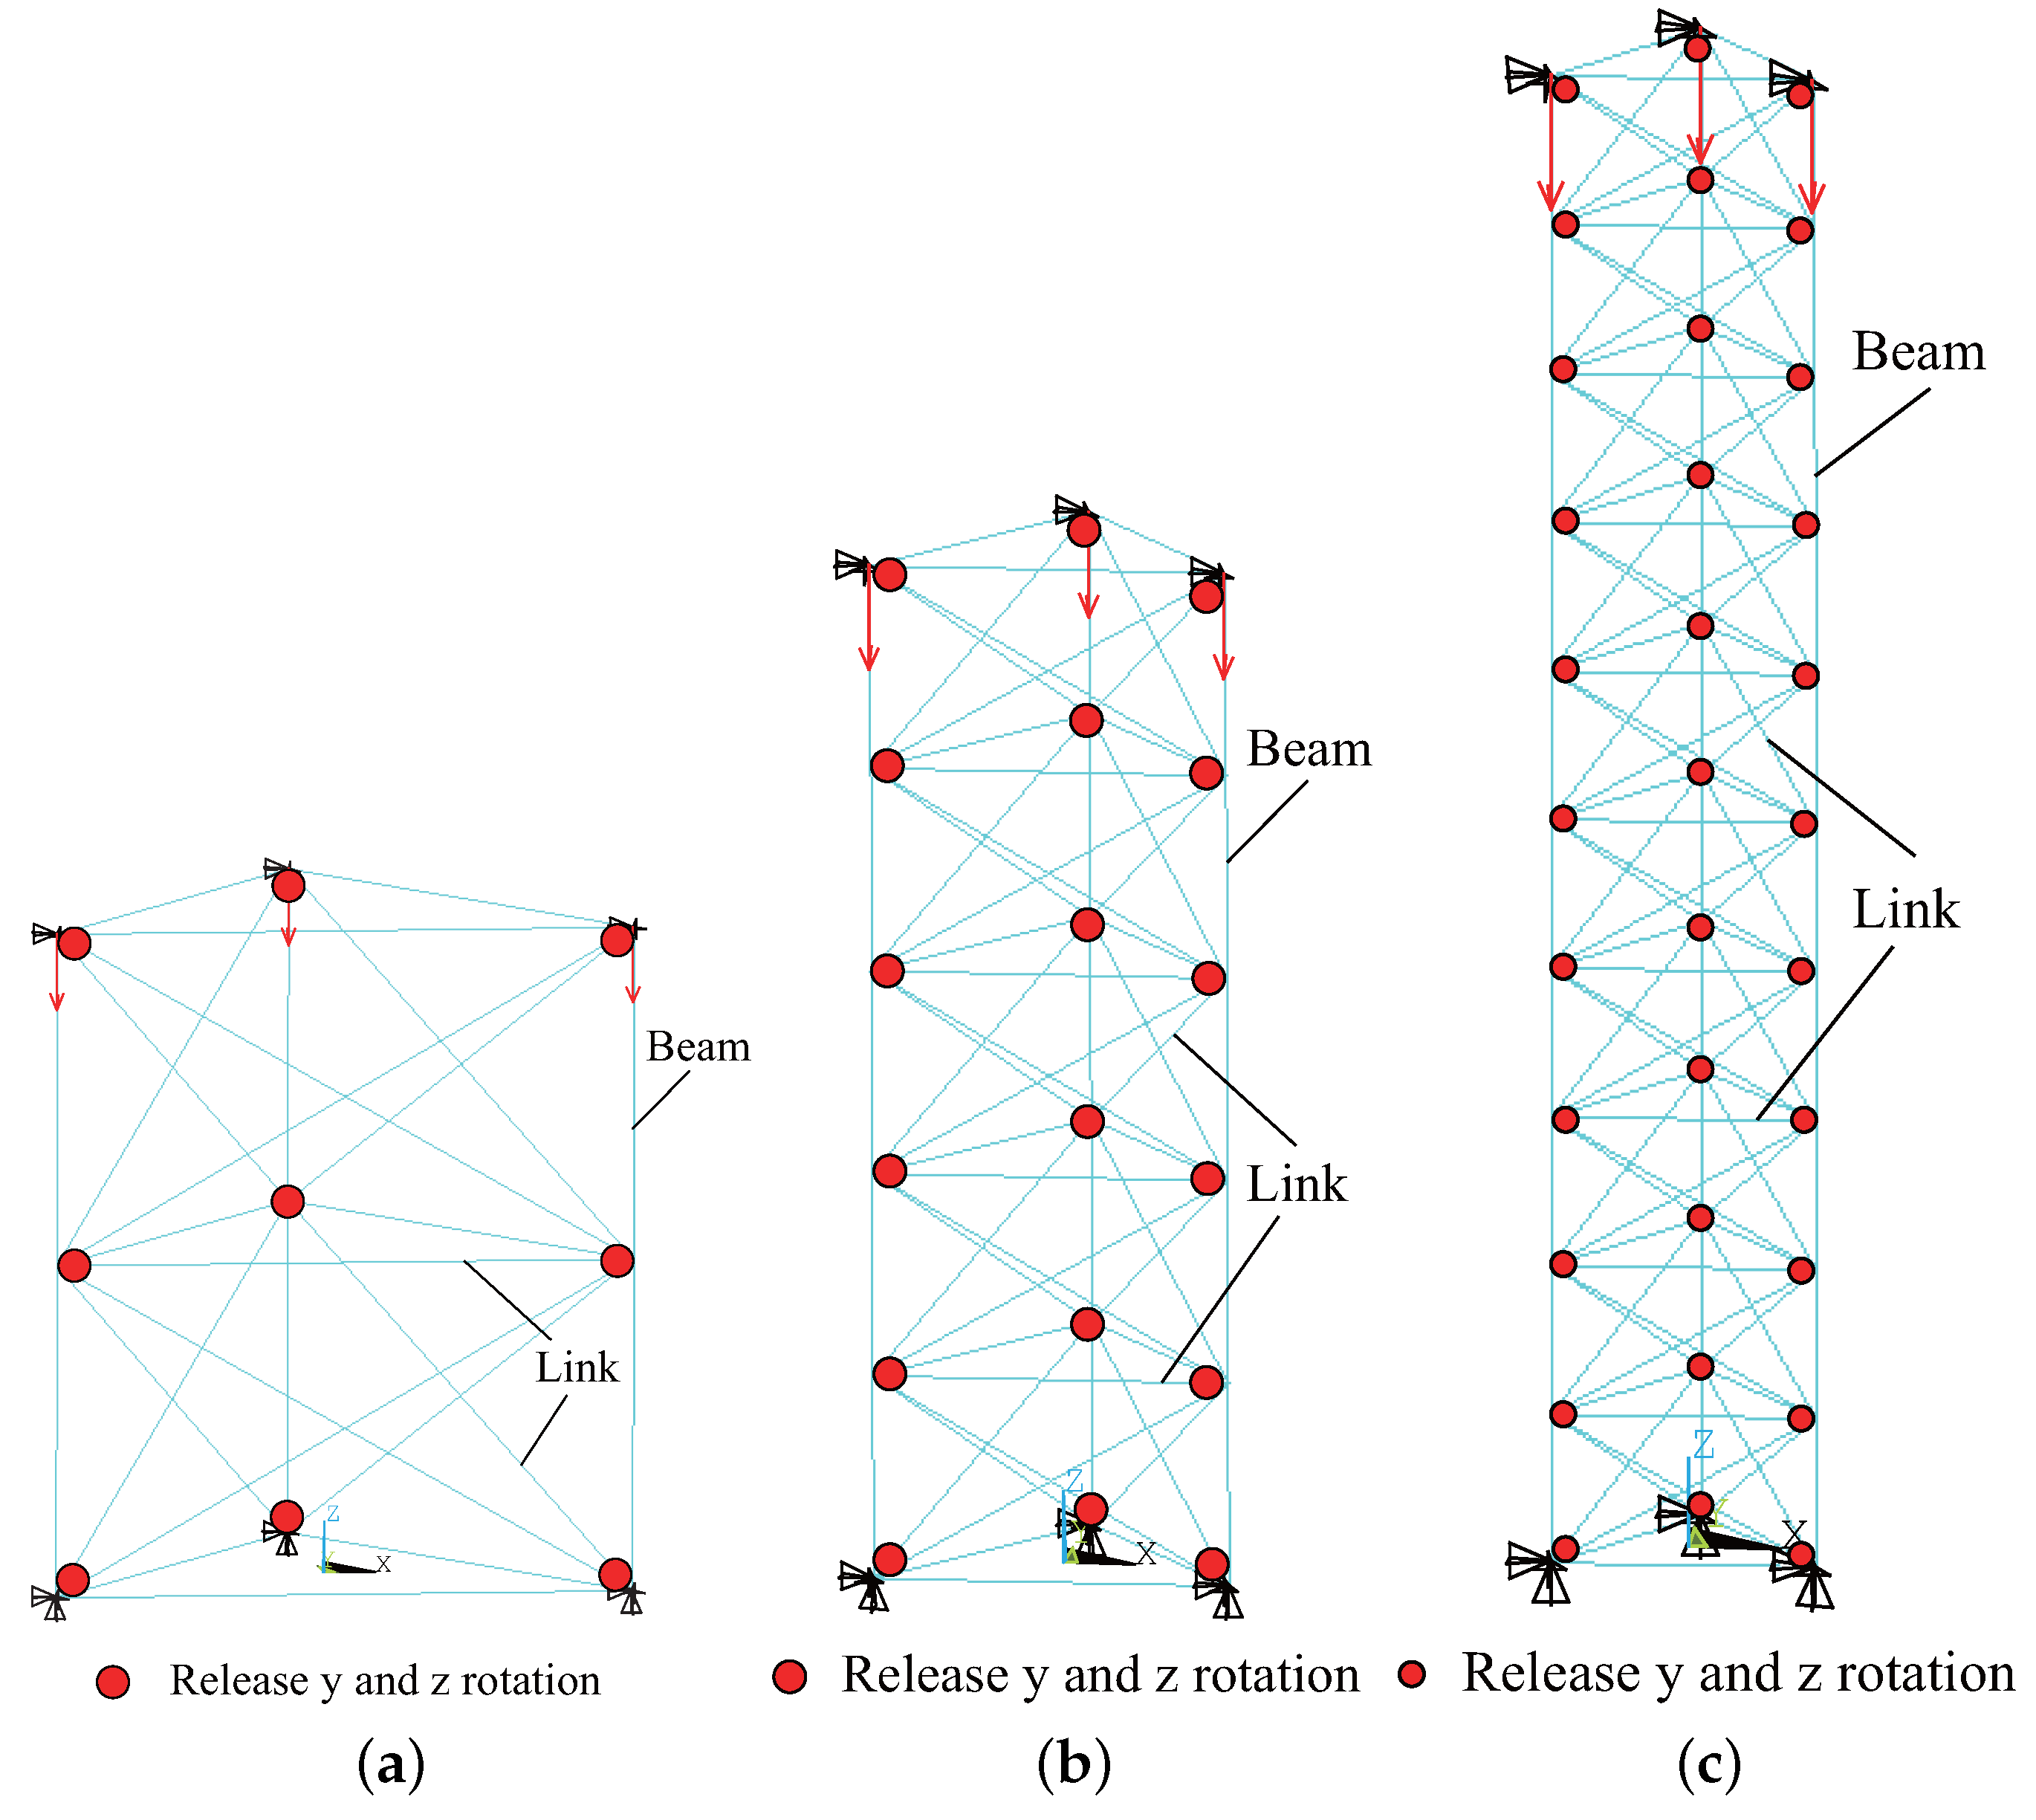
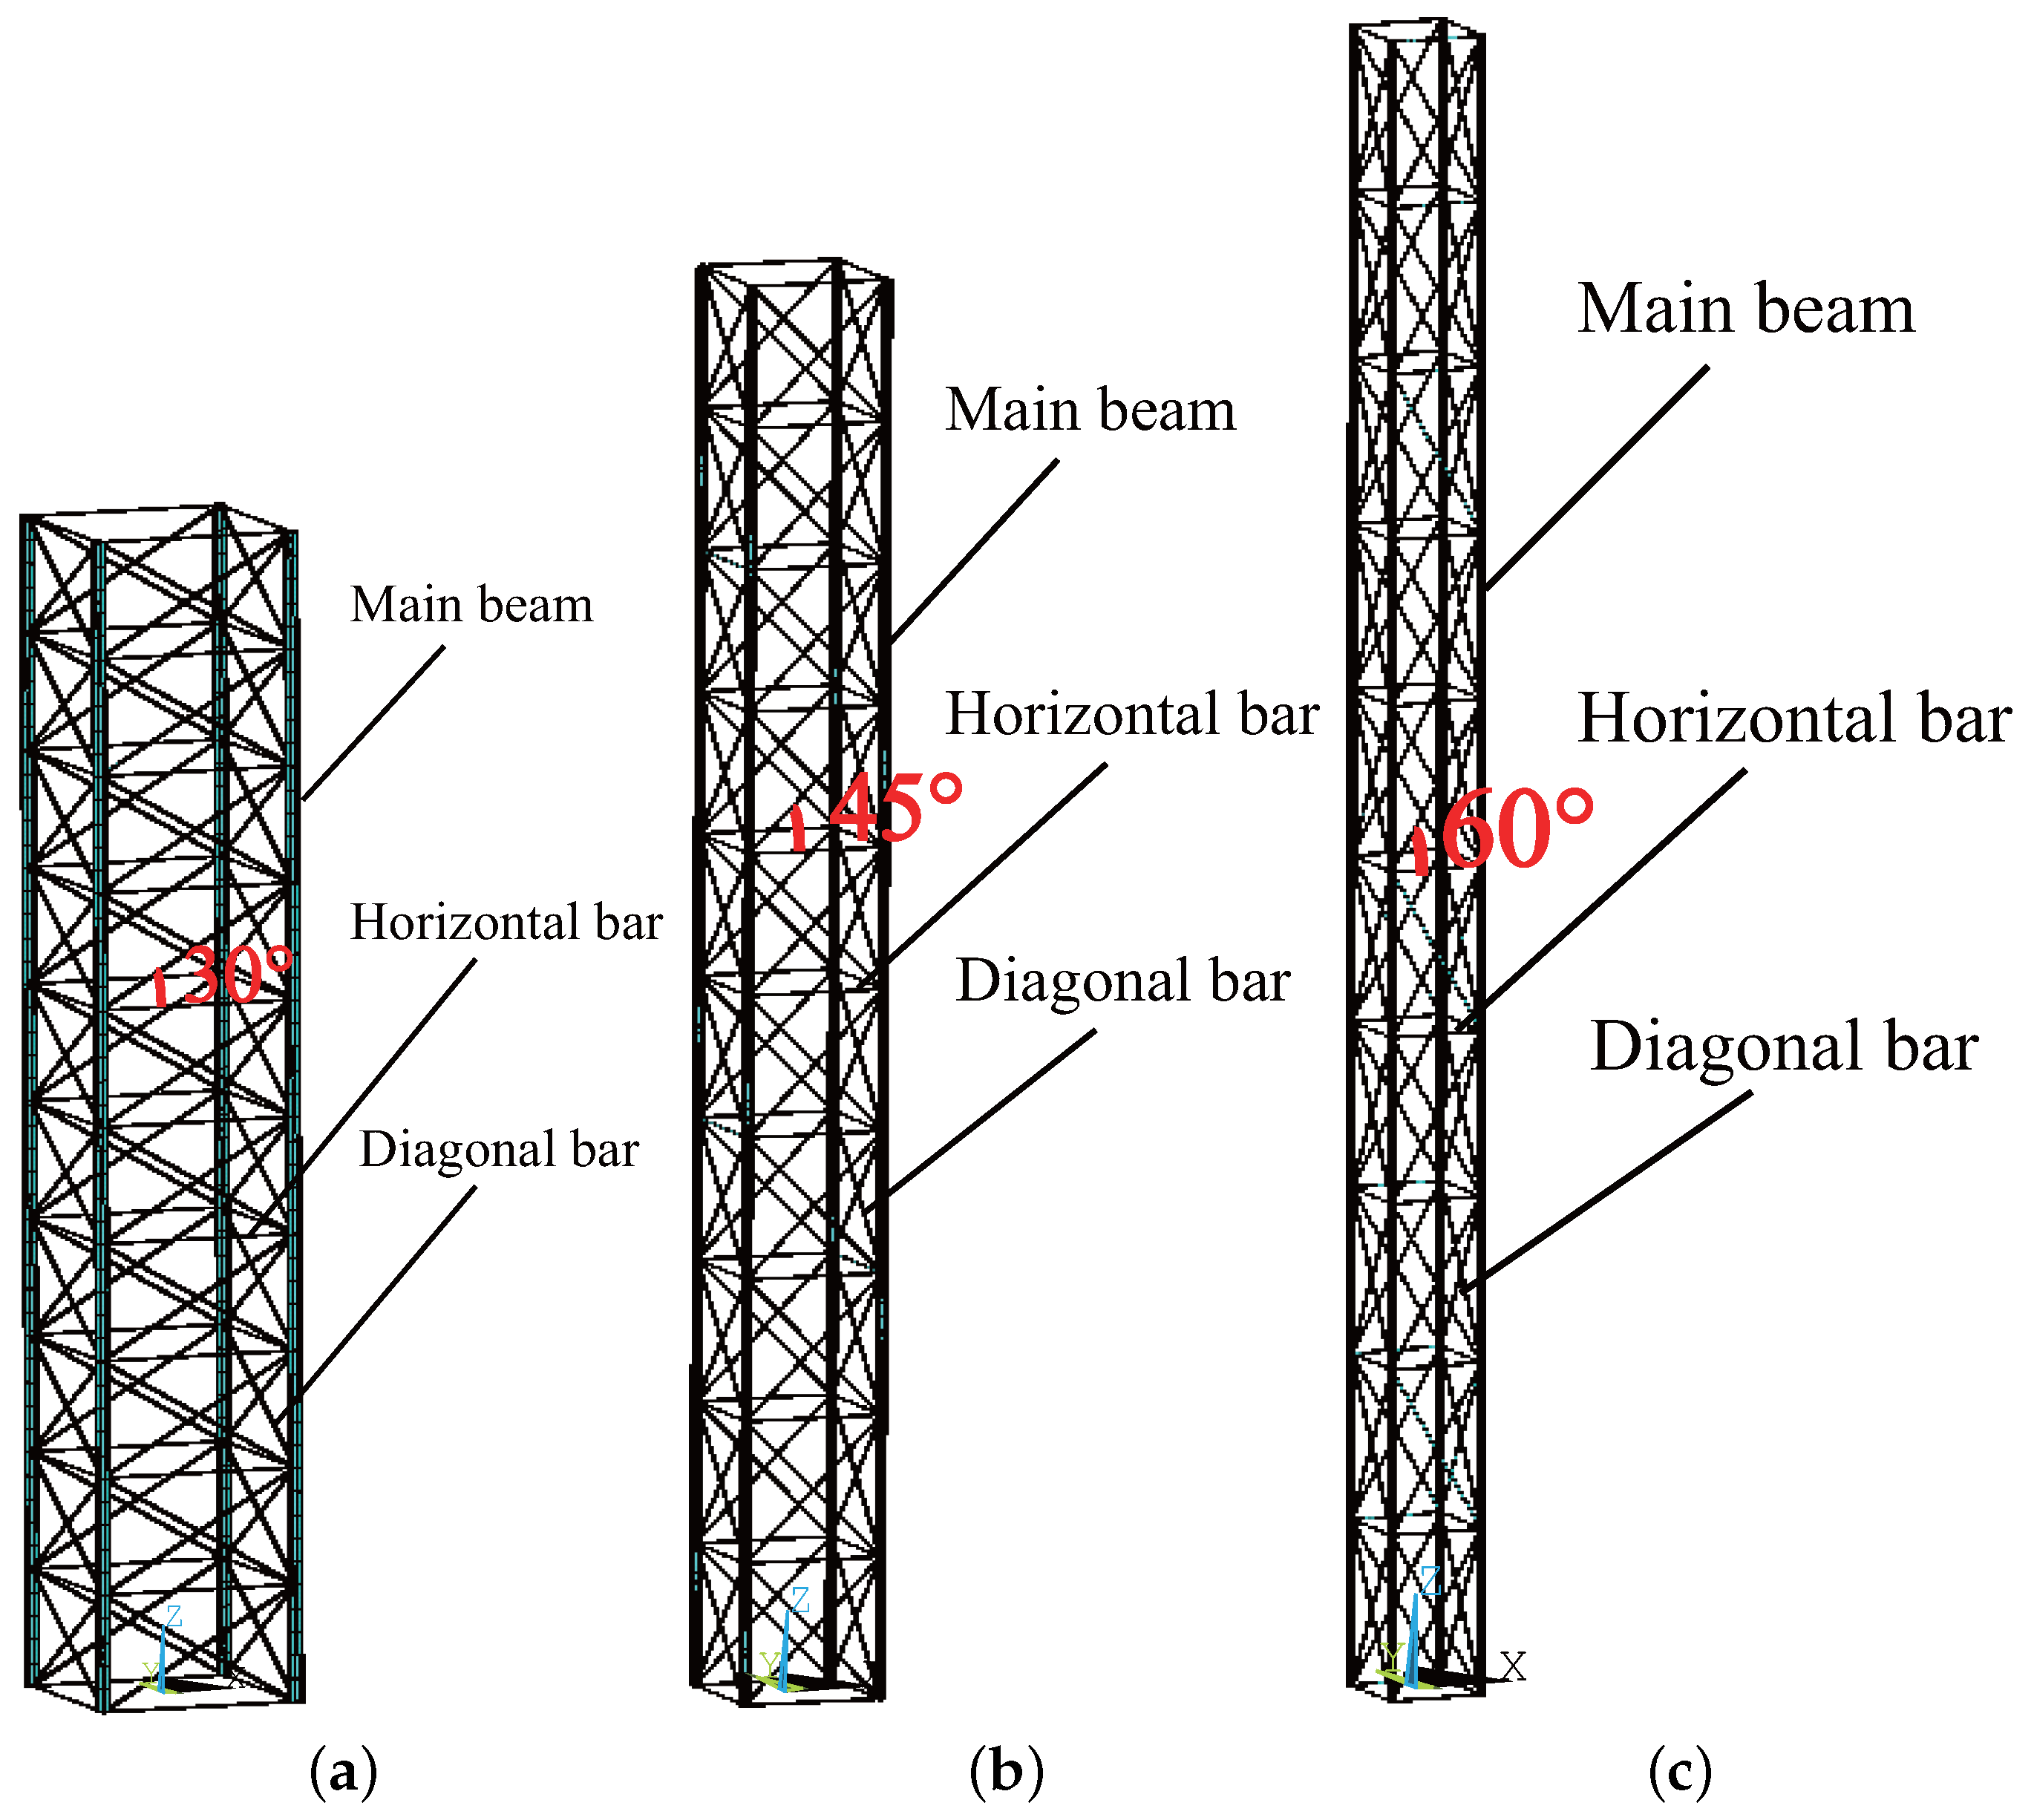
3.1. FE Model of TTSs

FE models of 2-layer, 5-layer, and 10-layer TTSs are established, consisting primarily of main bars, diagonal bars, and horizontal bars, and the material and cross-sectional information of each bar are shown in Table 1. The numerical simulations are performed using the BEAM44 element, which is capable of handling tension, compression, torsion, and bending. Each node of the element has 6 degrees of freedom, including translations in the x, y, and z directions, as well as rotations about their respective axes. This element enables both linear and nonlinear numerical simulations of the truss. The main bars are modeled using the BEAM44 element, with rigid connections between the i and j nodes. The diagonal bars and horizontal bars are also modeled using the BEAM44 element, with released degrees of freedom for the i and j nodes in the y and z axes. In order to investigate the influence of the truss and bar stiffness on the ultimate load-carrying capacity of the TTS, the angles of the diagonal and horizontal bars are set to 30°, 45°, and 60°, respectively. The stiffness of the horizontal bars is set to a variable stiffness, and corresponding FE models are parametrically established. The model examples are shown in Figure 3, Figure 4 and Figure 5.
The bottom of the TTS is constrained using hinged supports, which restrict the translations in the x, y, and z directions while allowing rotational freedom. At the top, there are constraints on the translations in the x and y directions, and a unit load is applied in the z direction. A schematic diagram of the TTS model is shown in Figure 6.

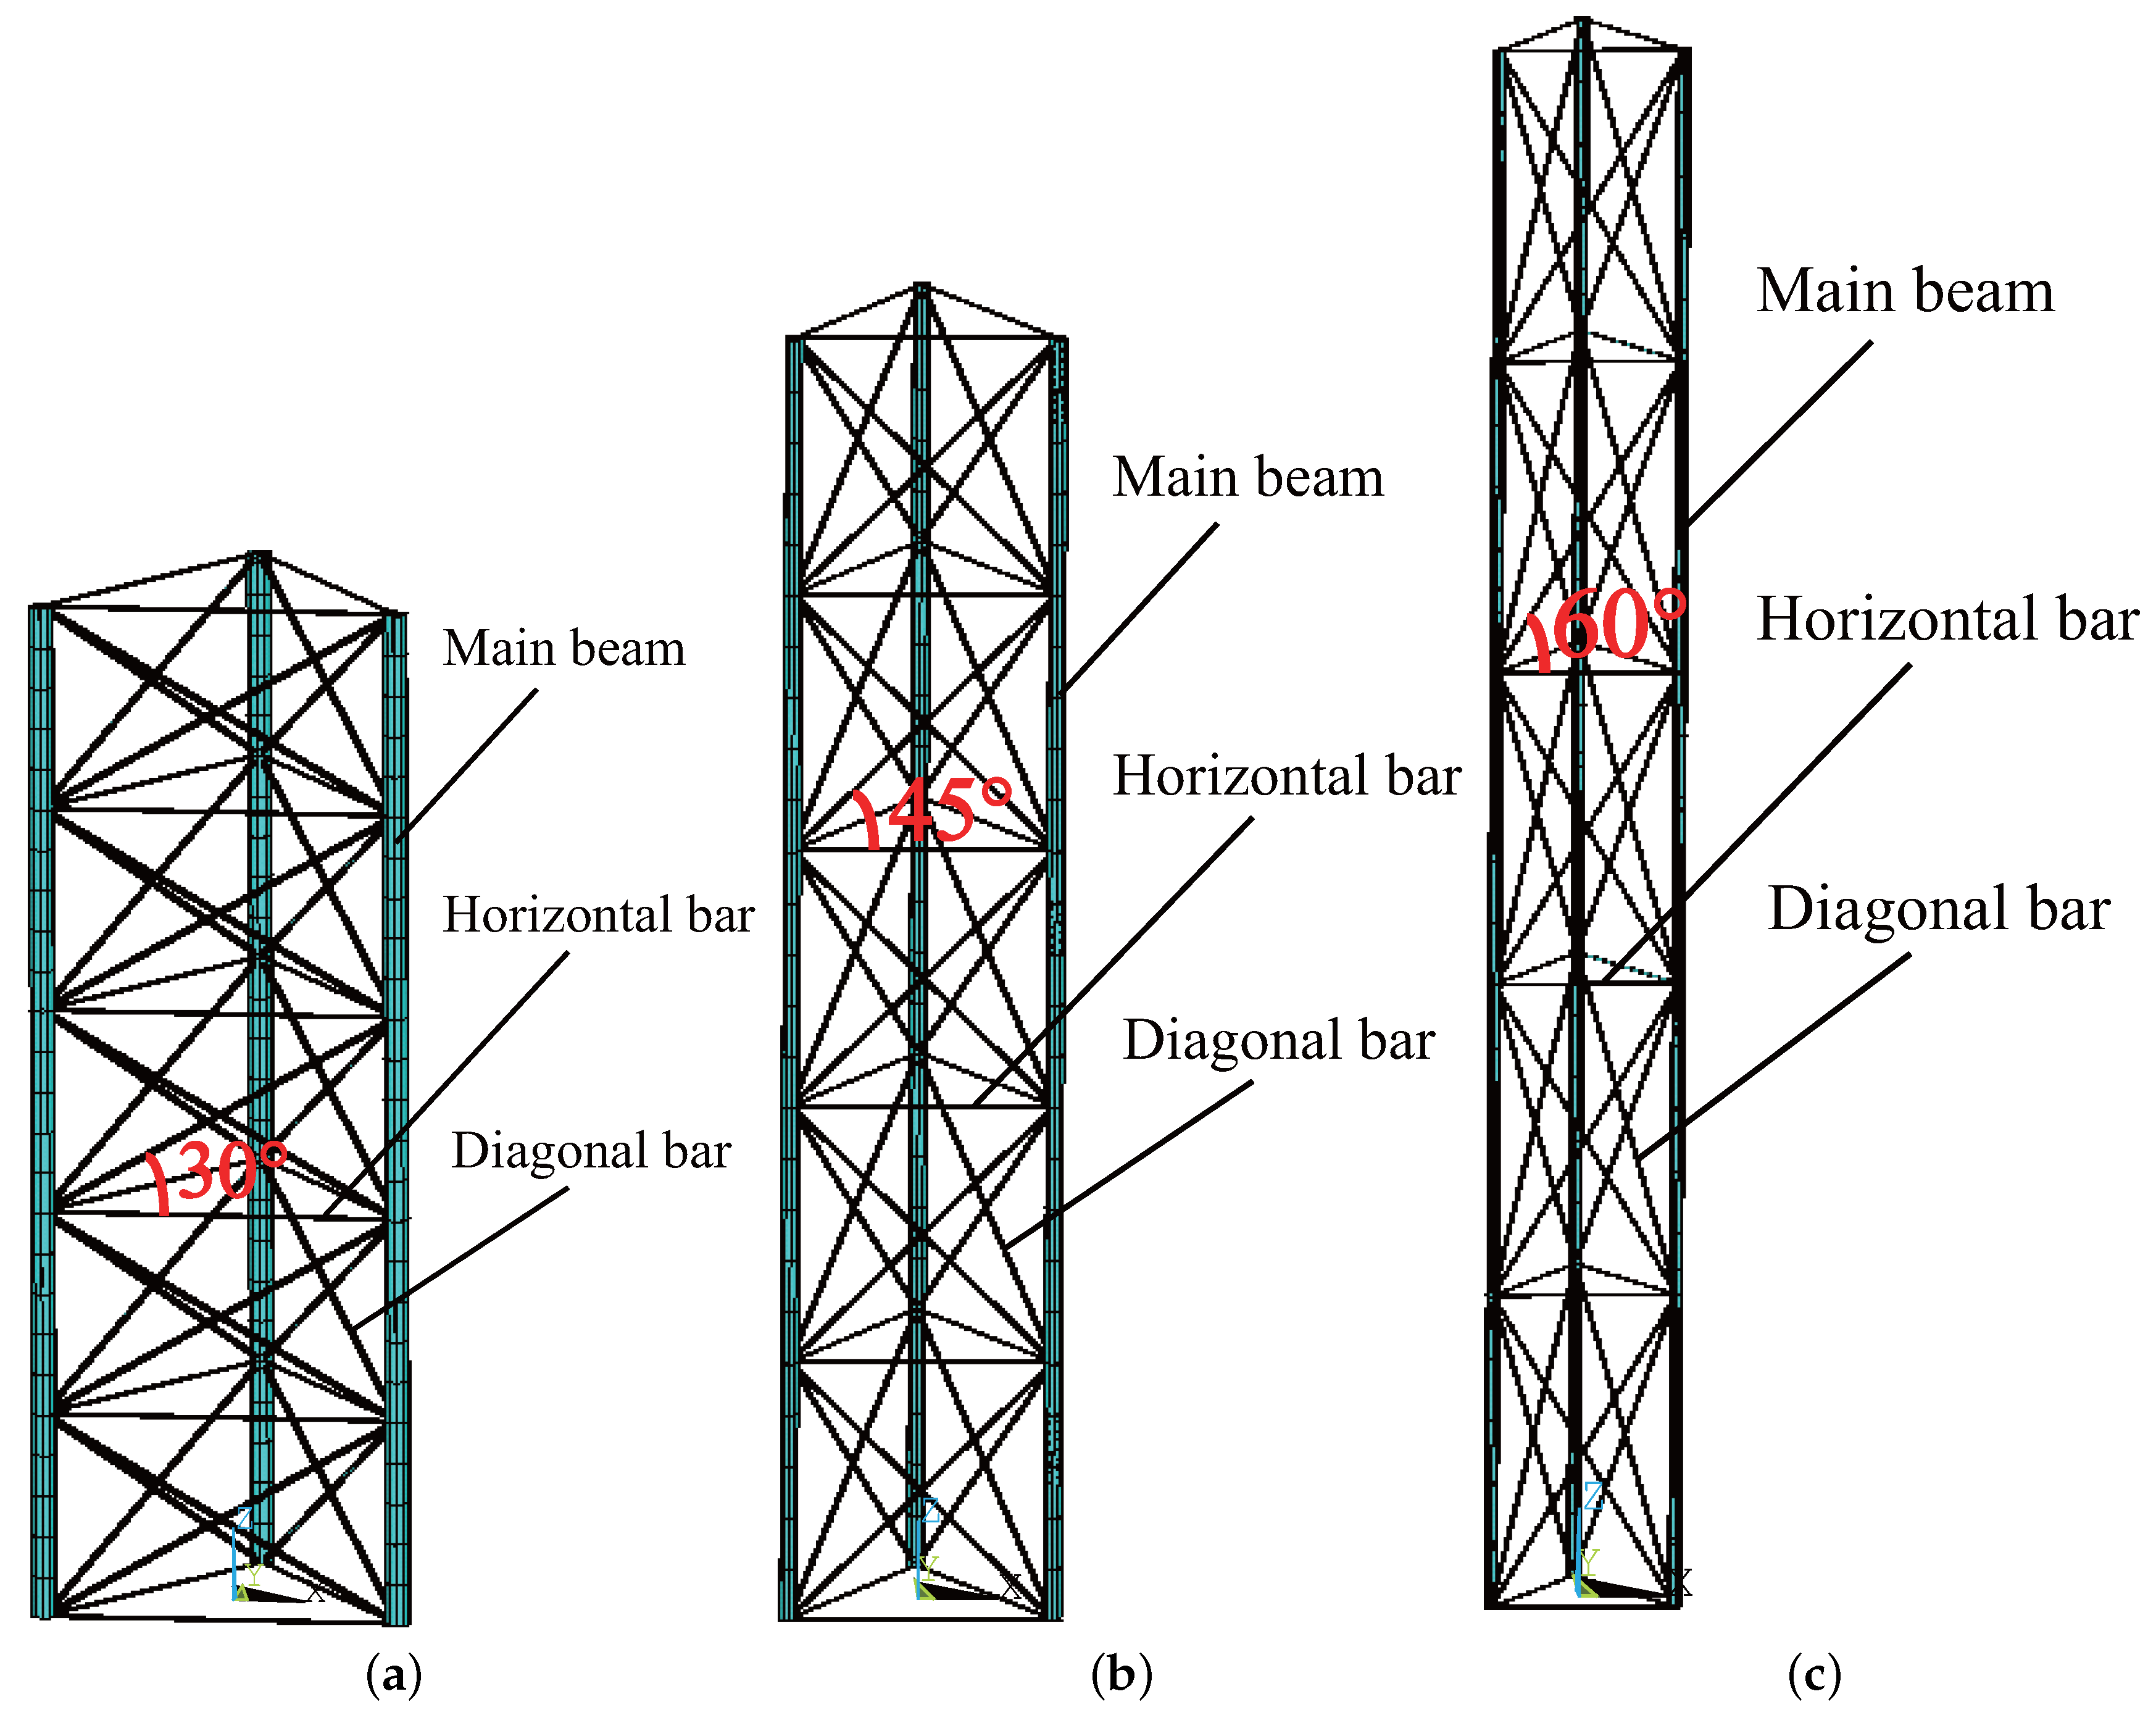
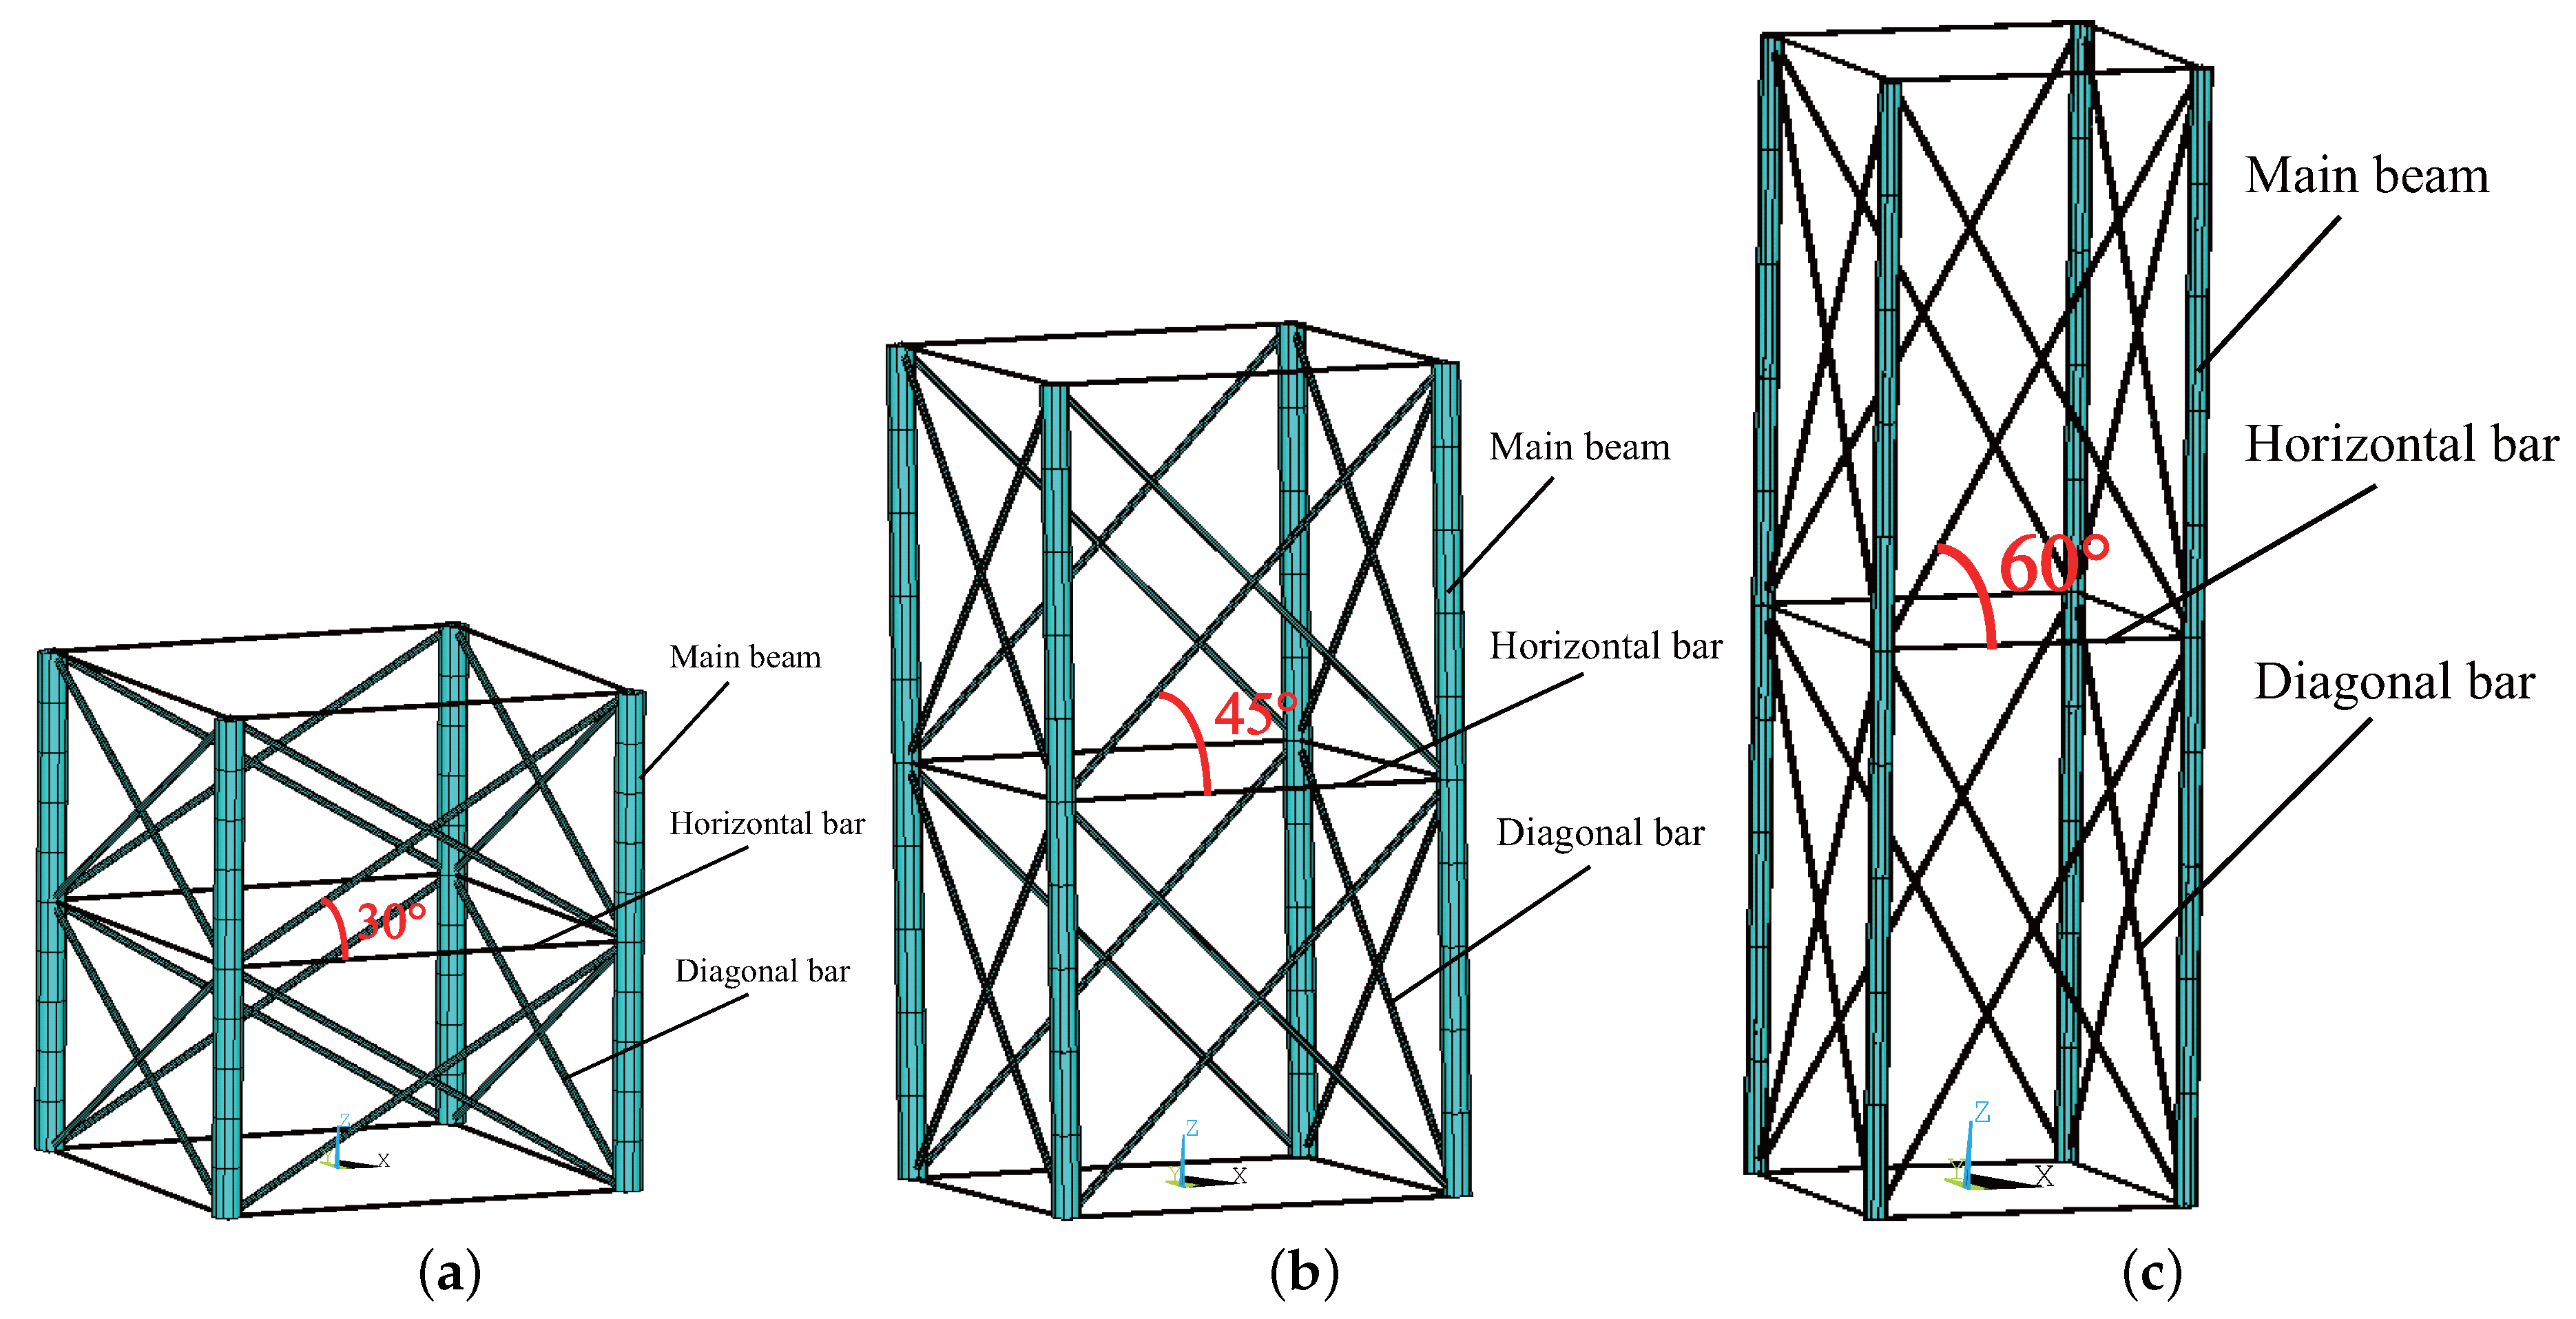
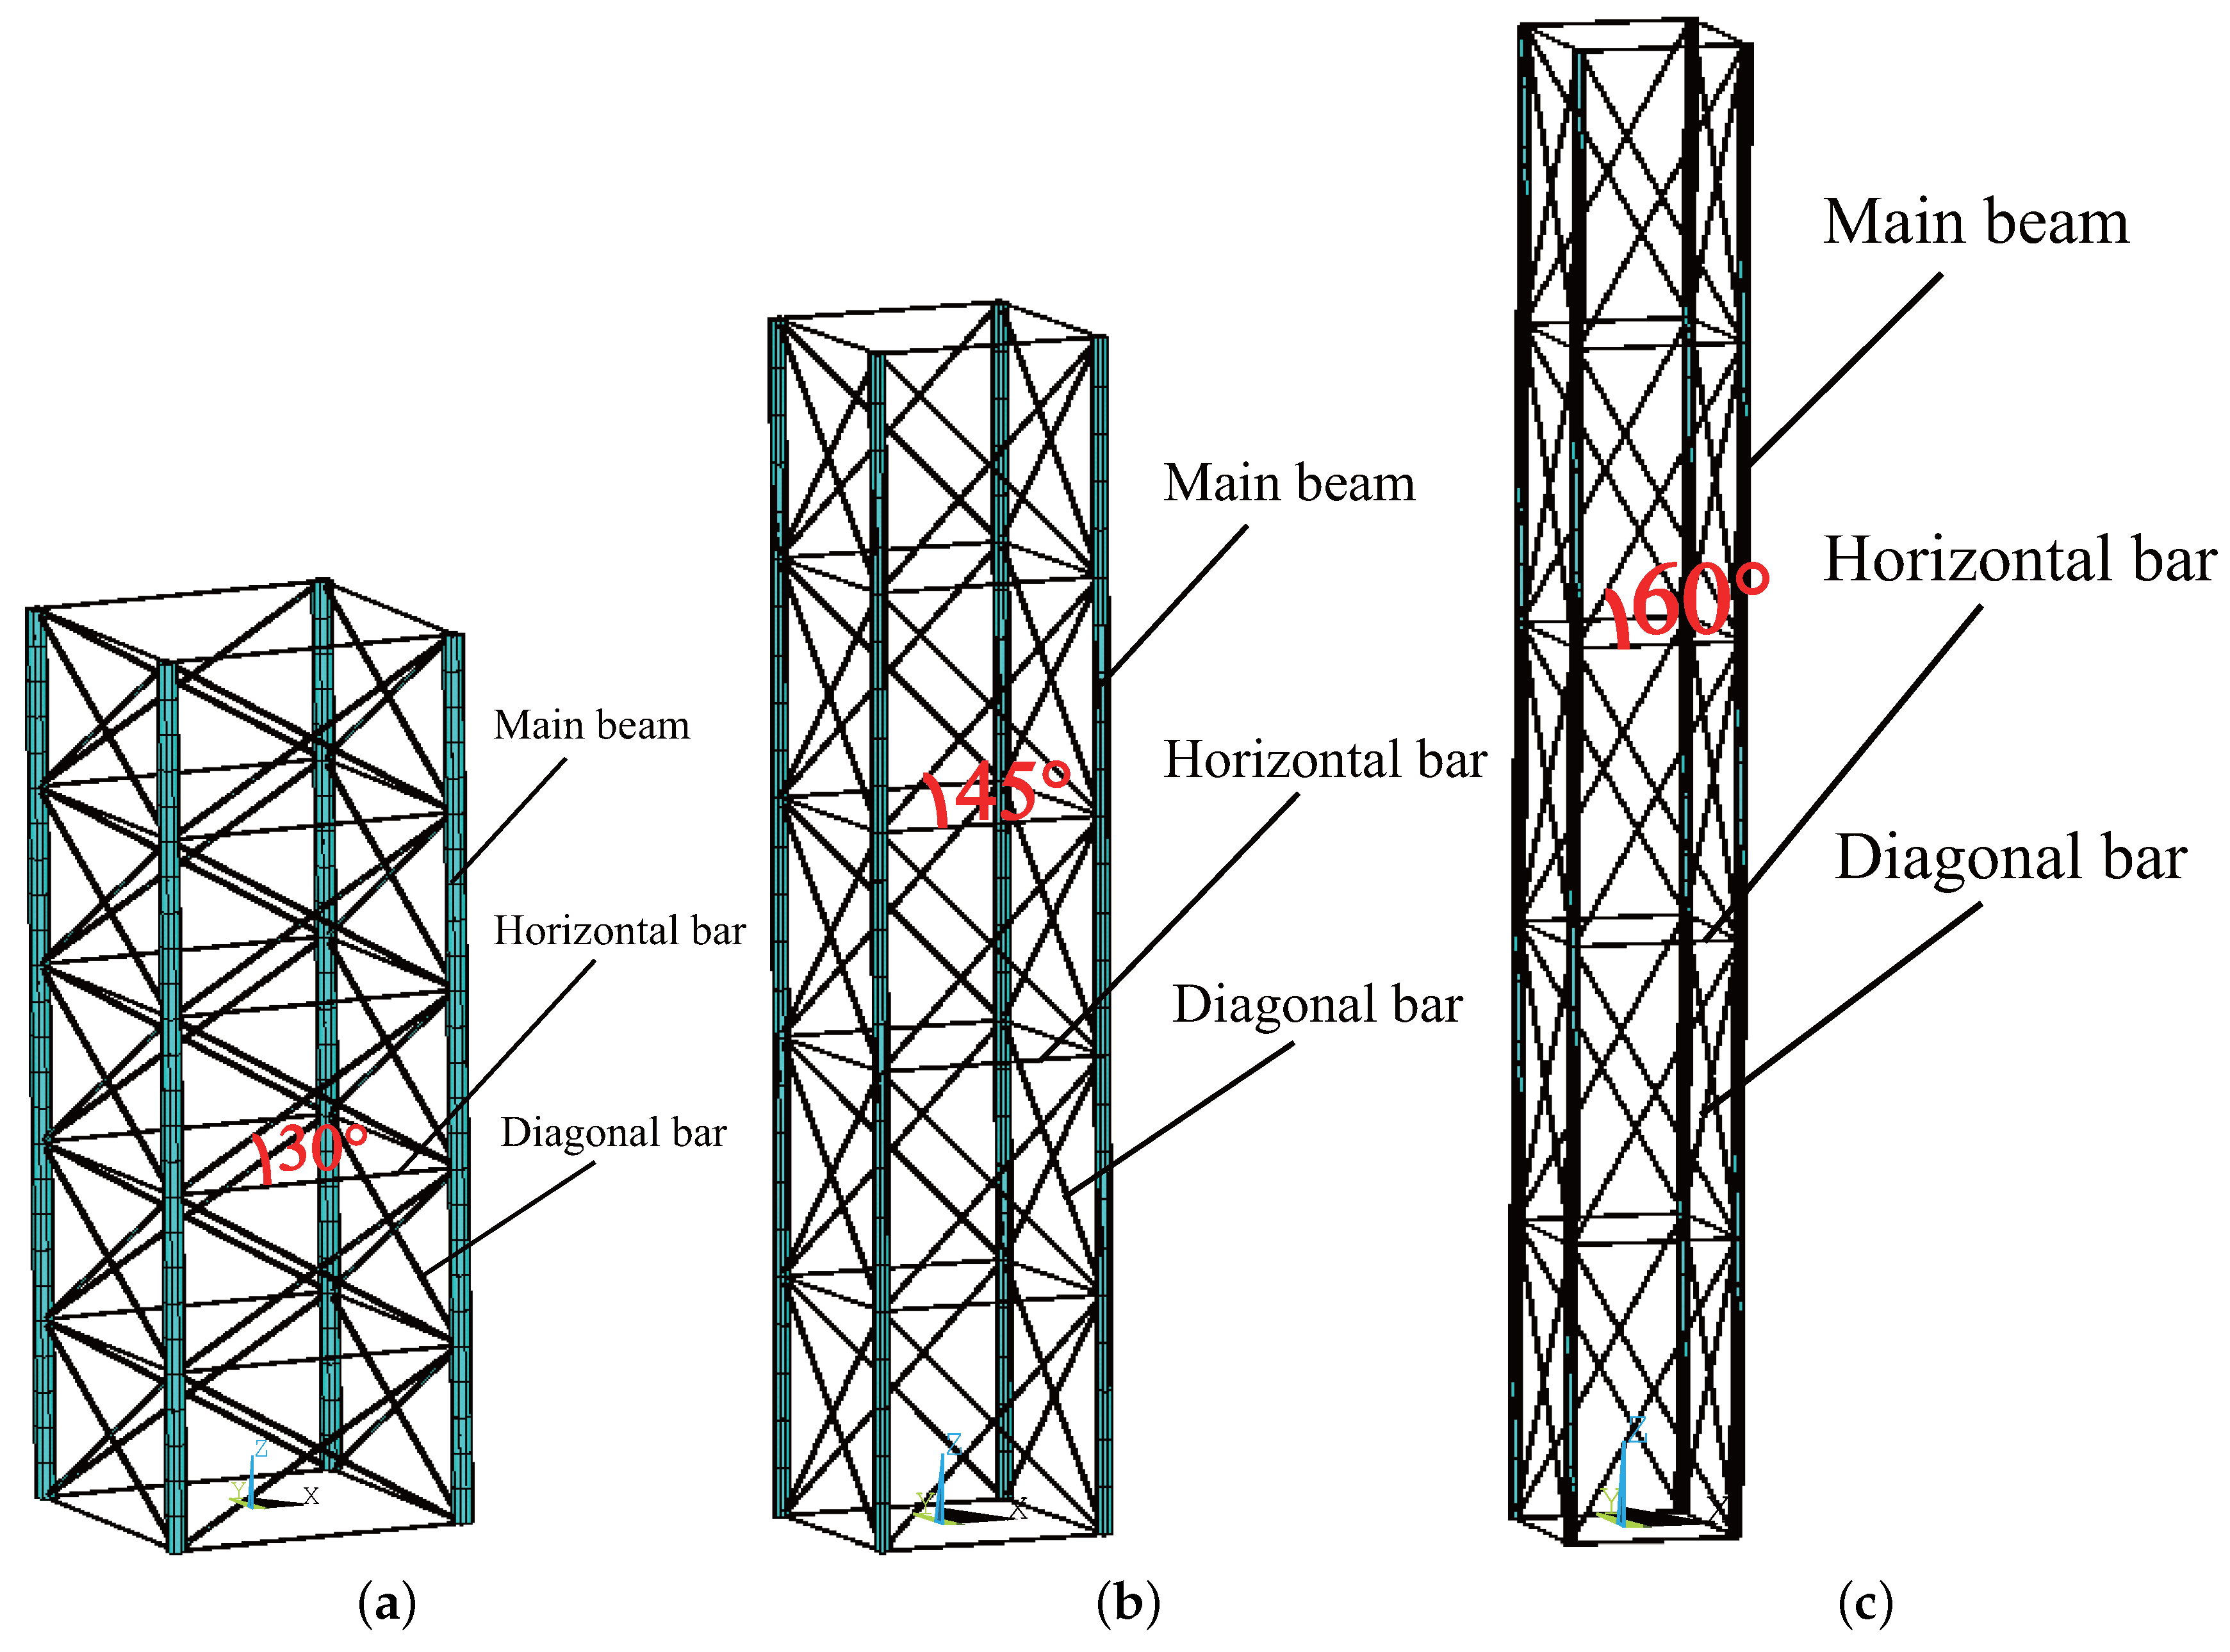
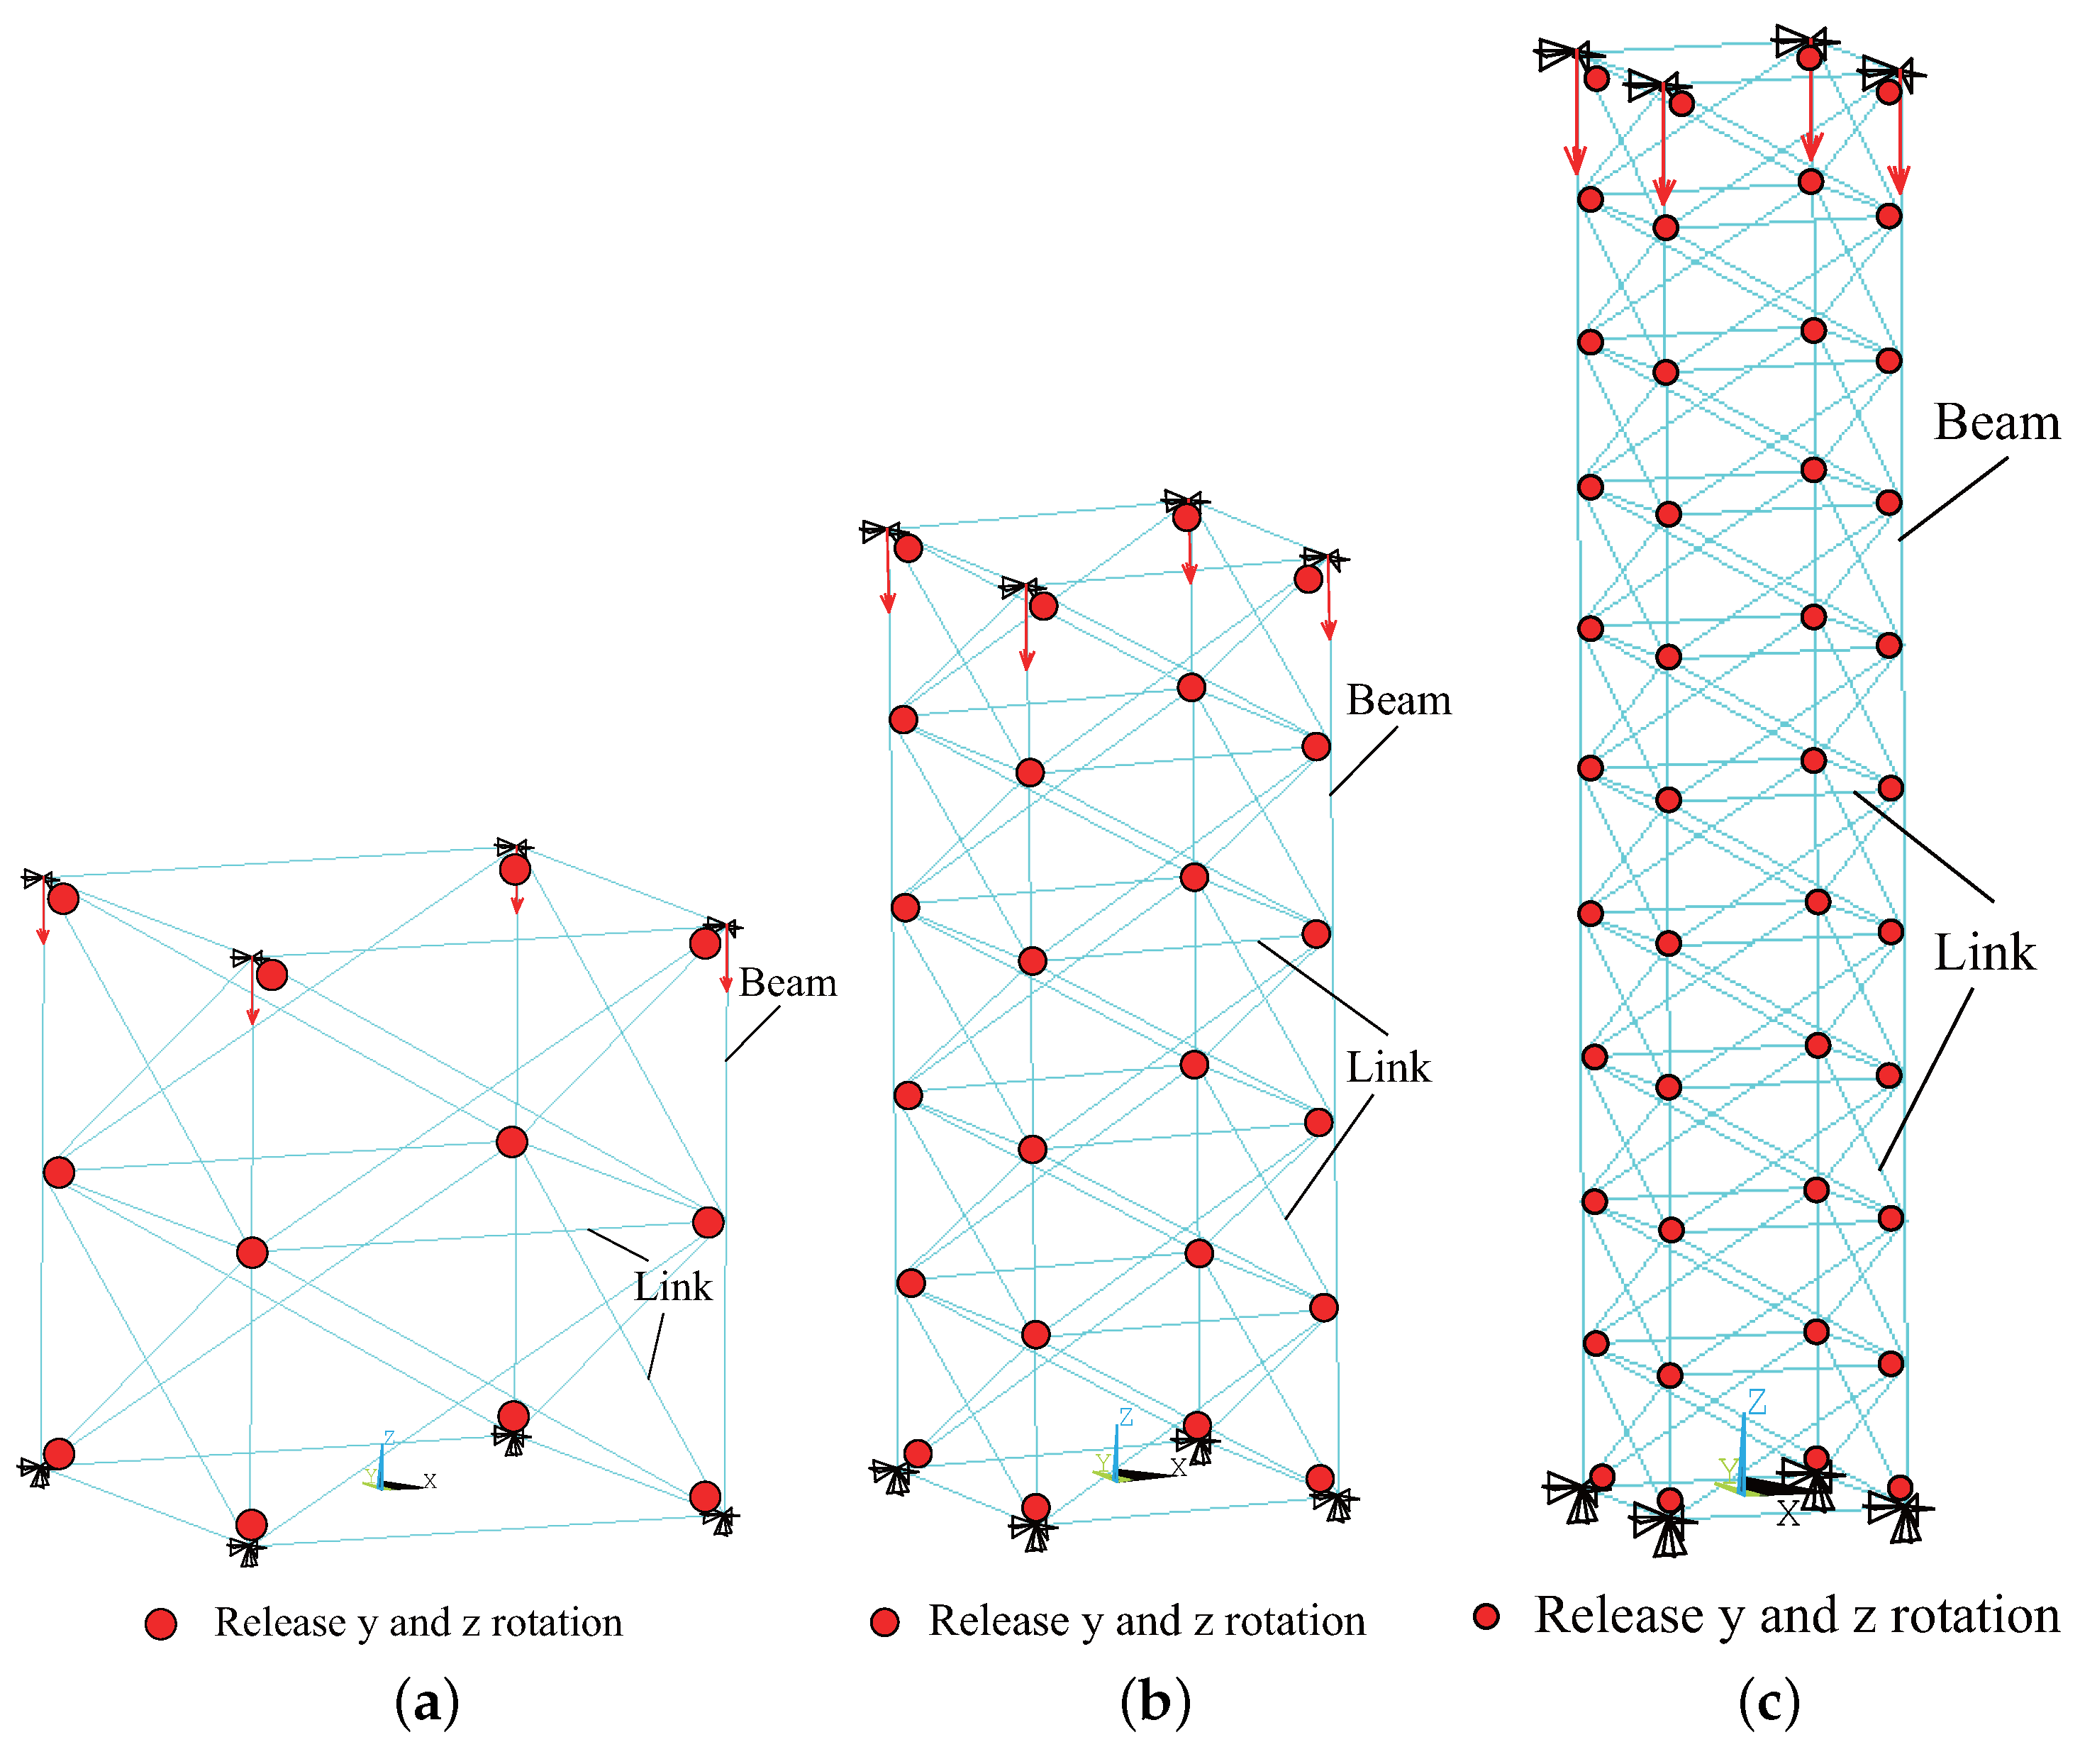
3.2. FE Model of QTSs

Similarly, FE models were created for 2-layer, 5-layer, and 10-layer QTSs, with the angles between the diagonal and horizontal bars being 30°, 45°, and 60°, respectively, as shown in Figure 7, Figure 8 and Figure 9.
A schematic diagram of the structural calculation model for the QTS is shown in Figure 10.

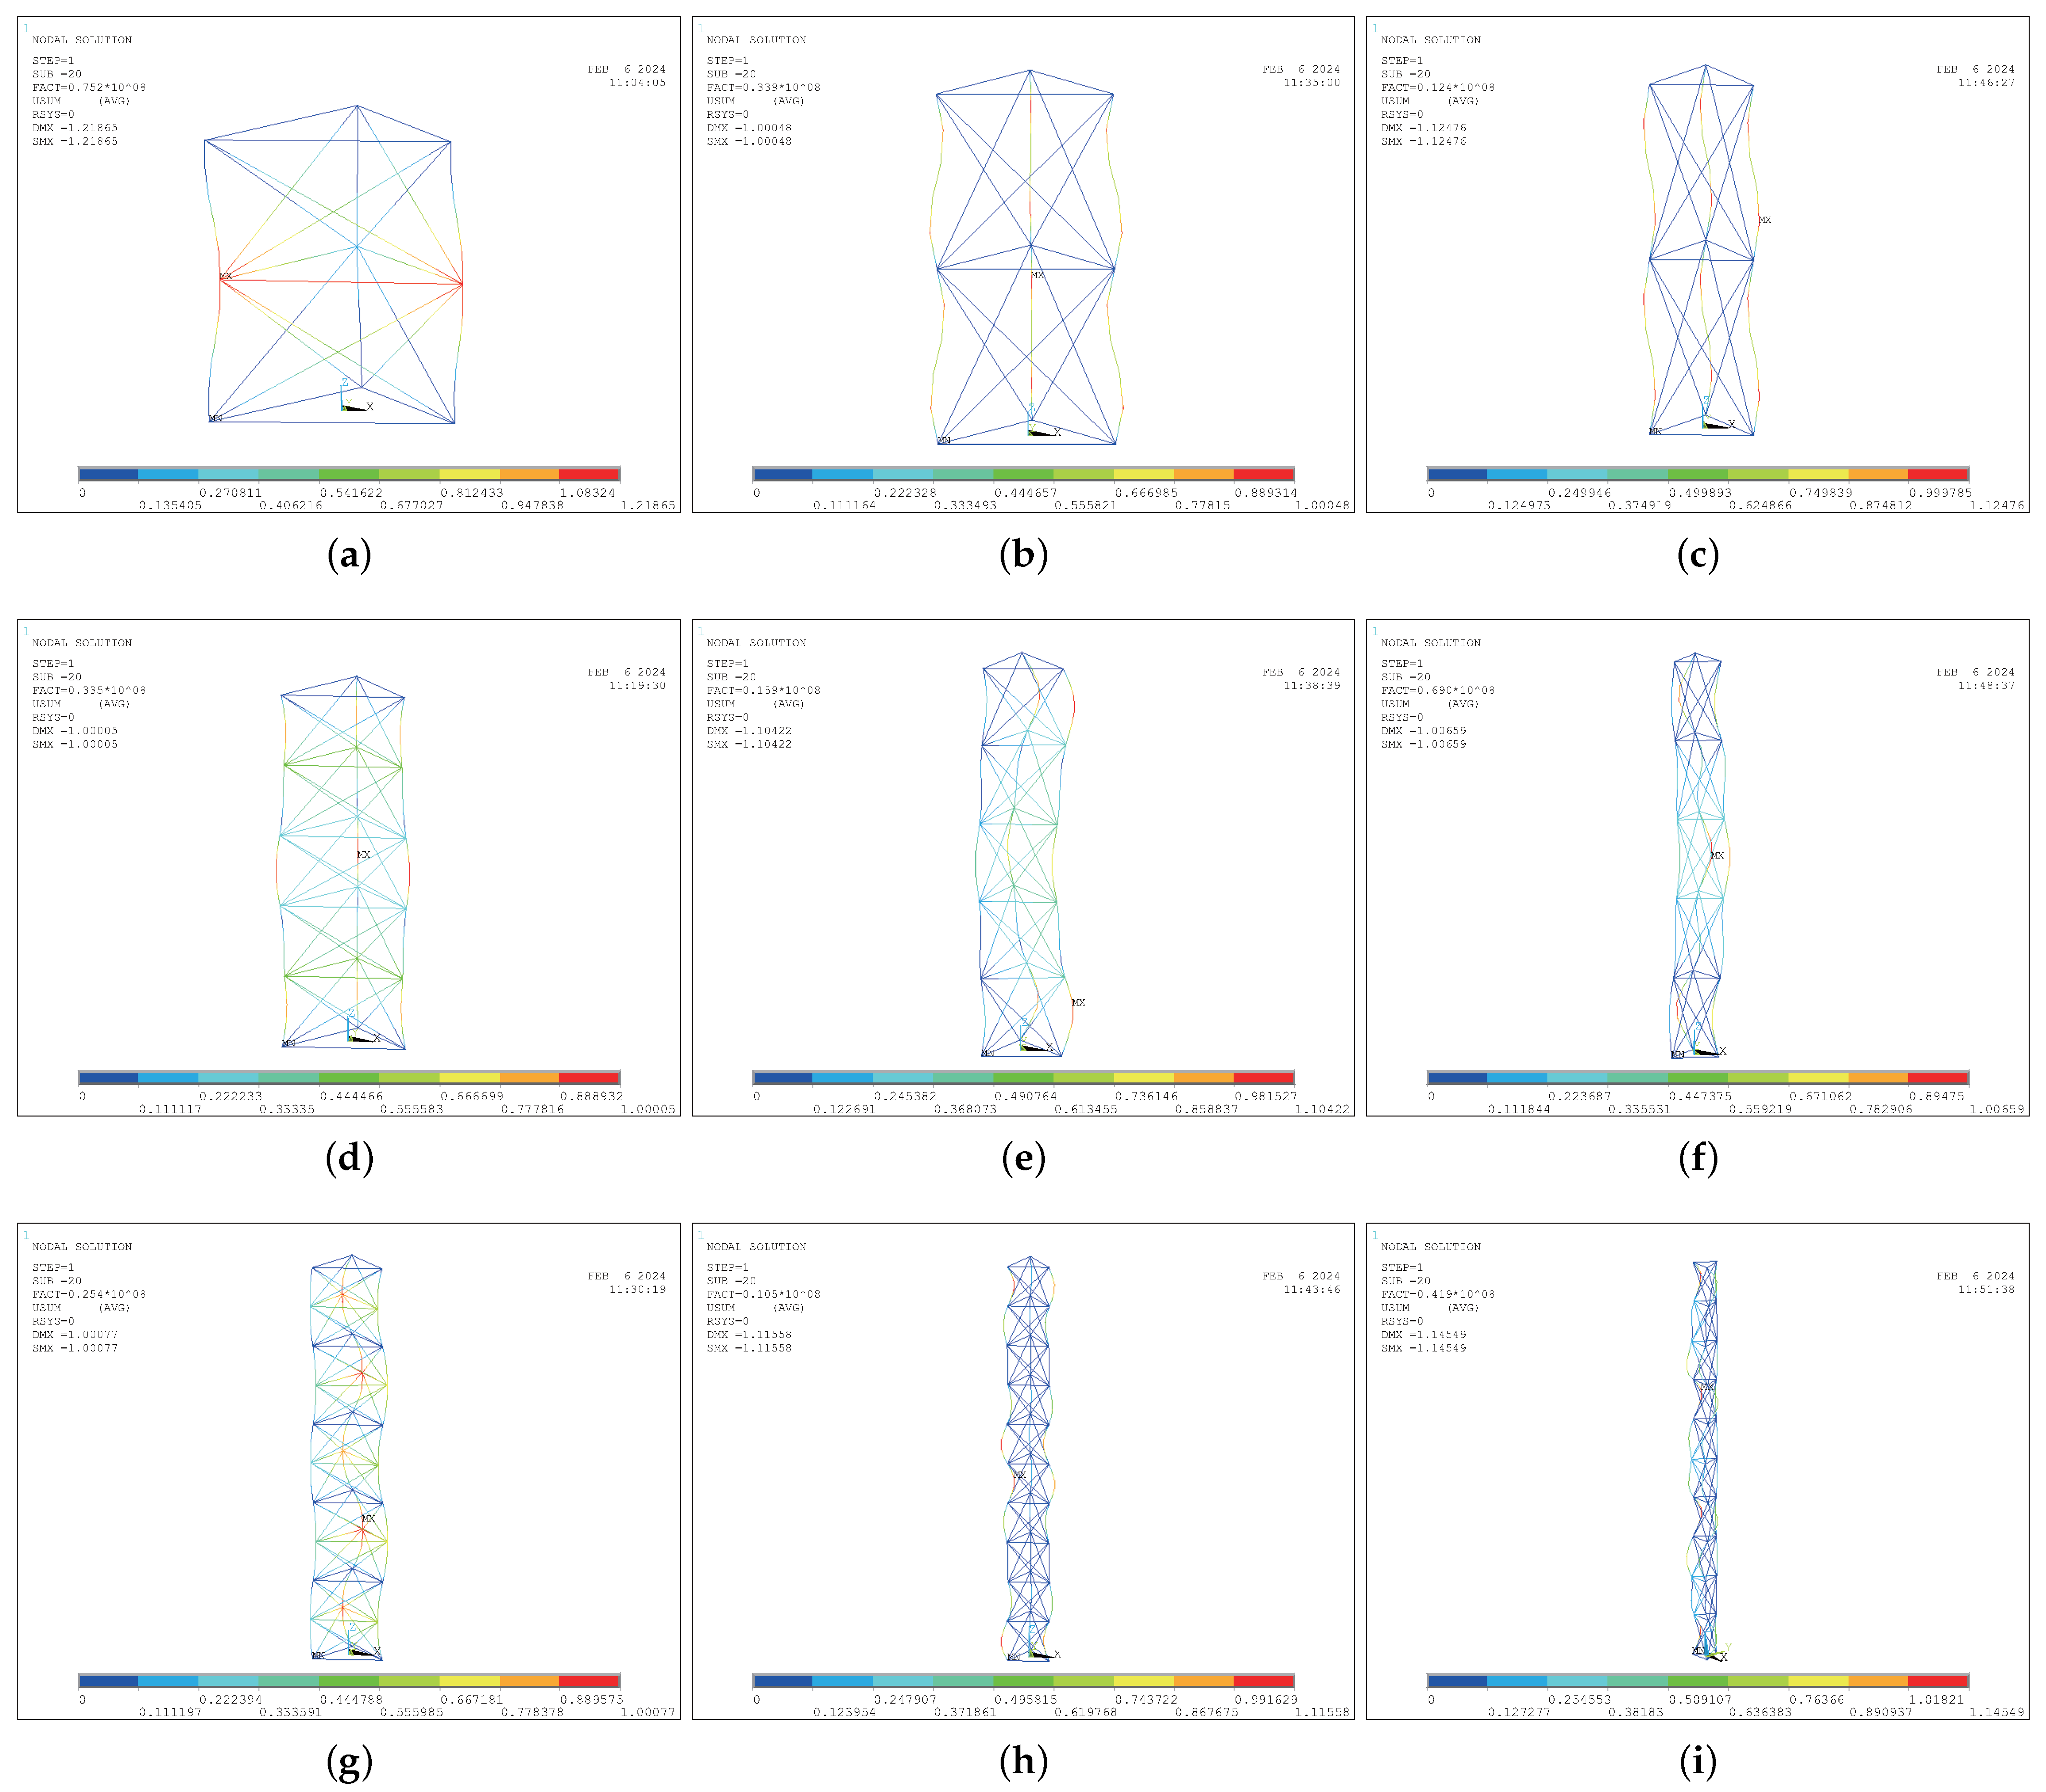
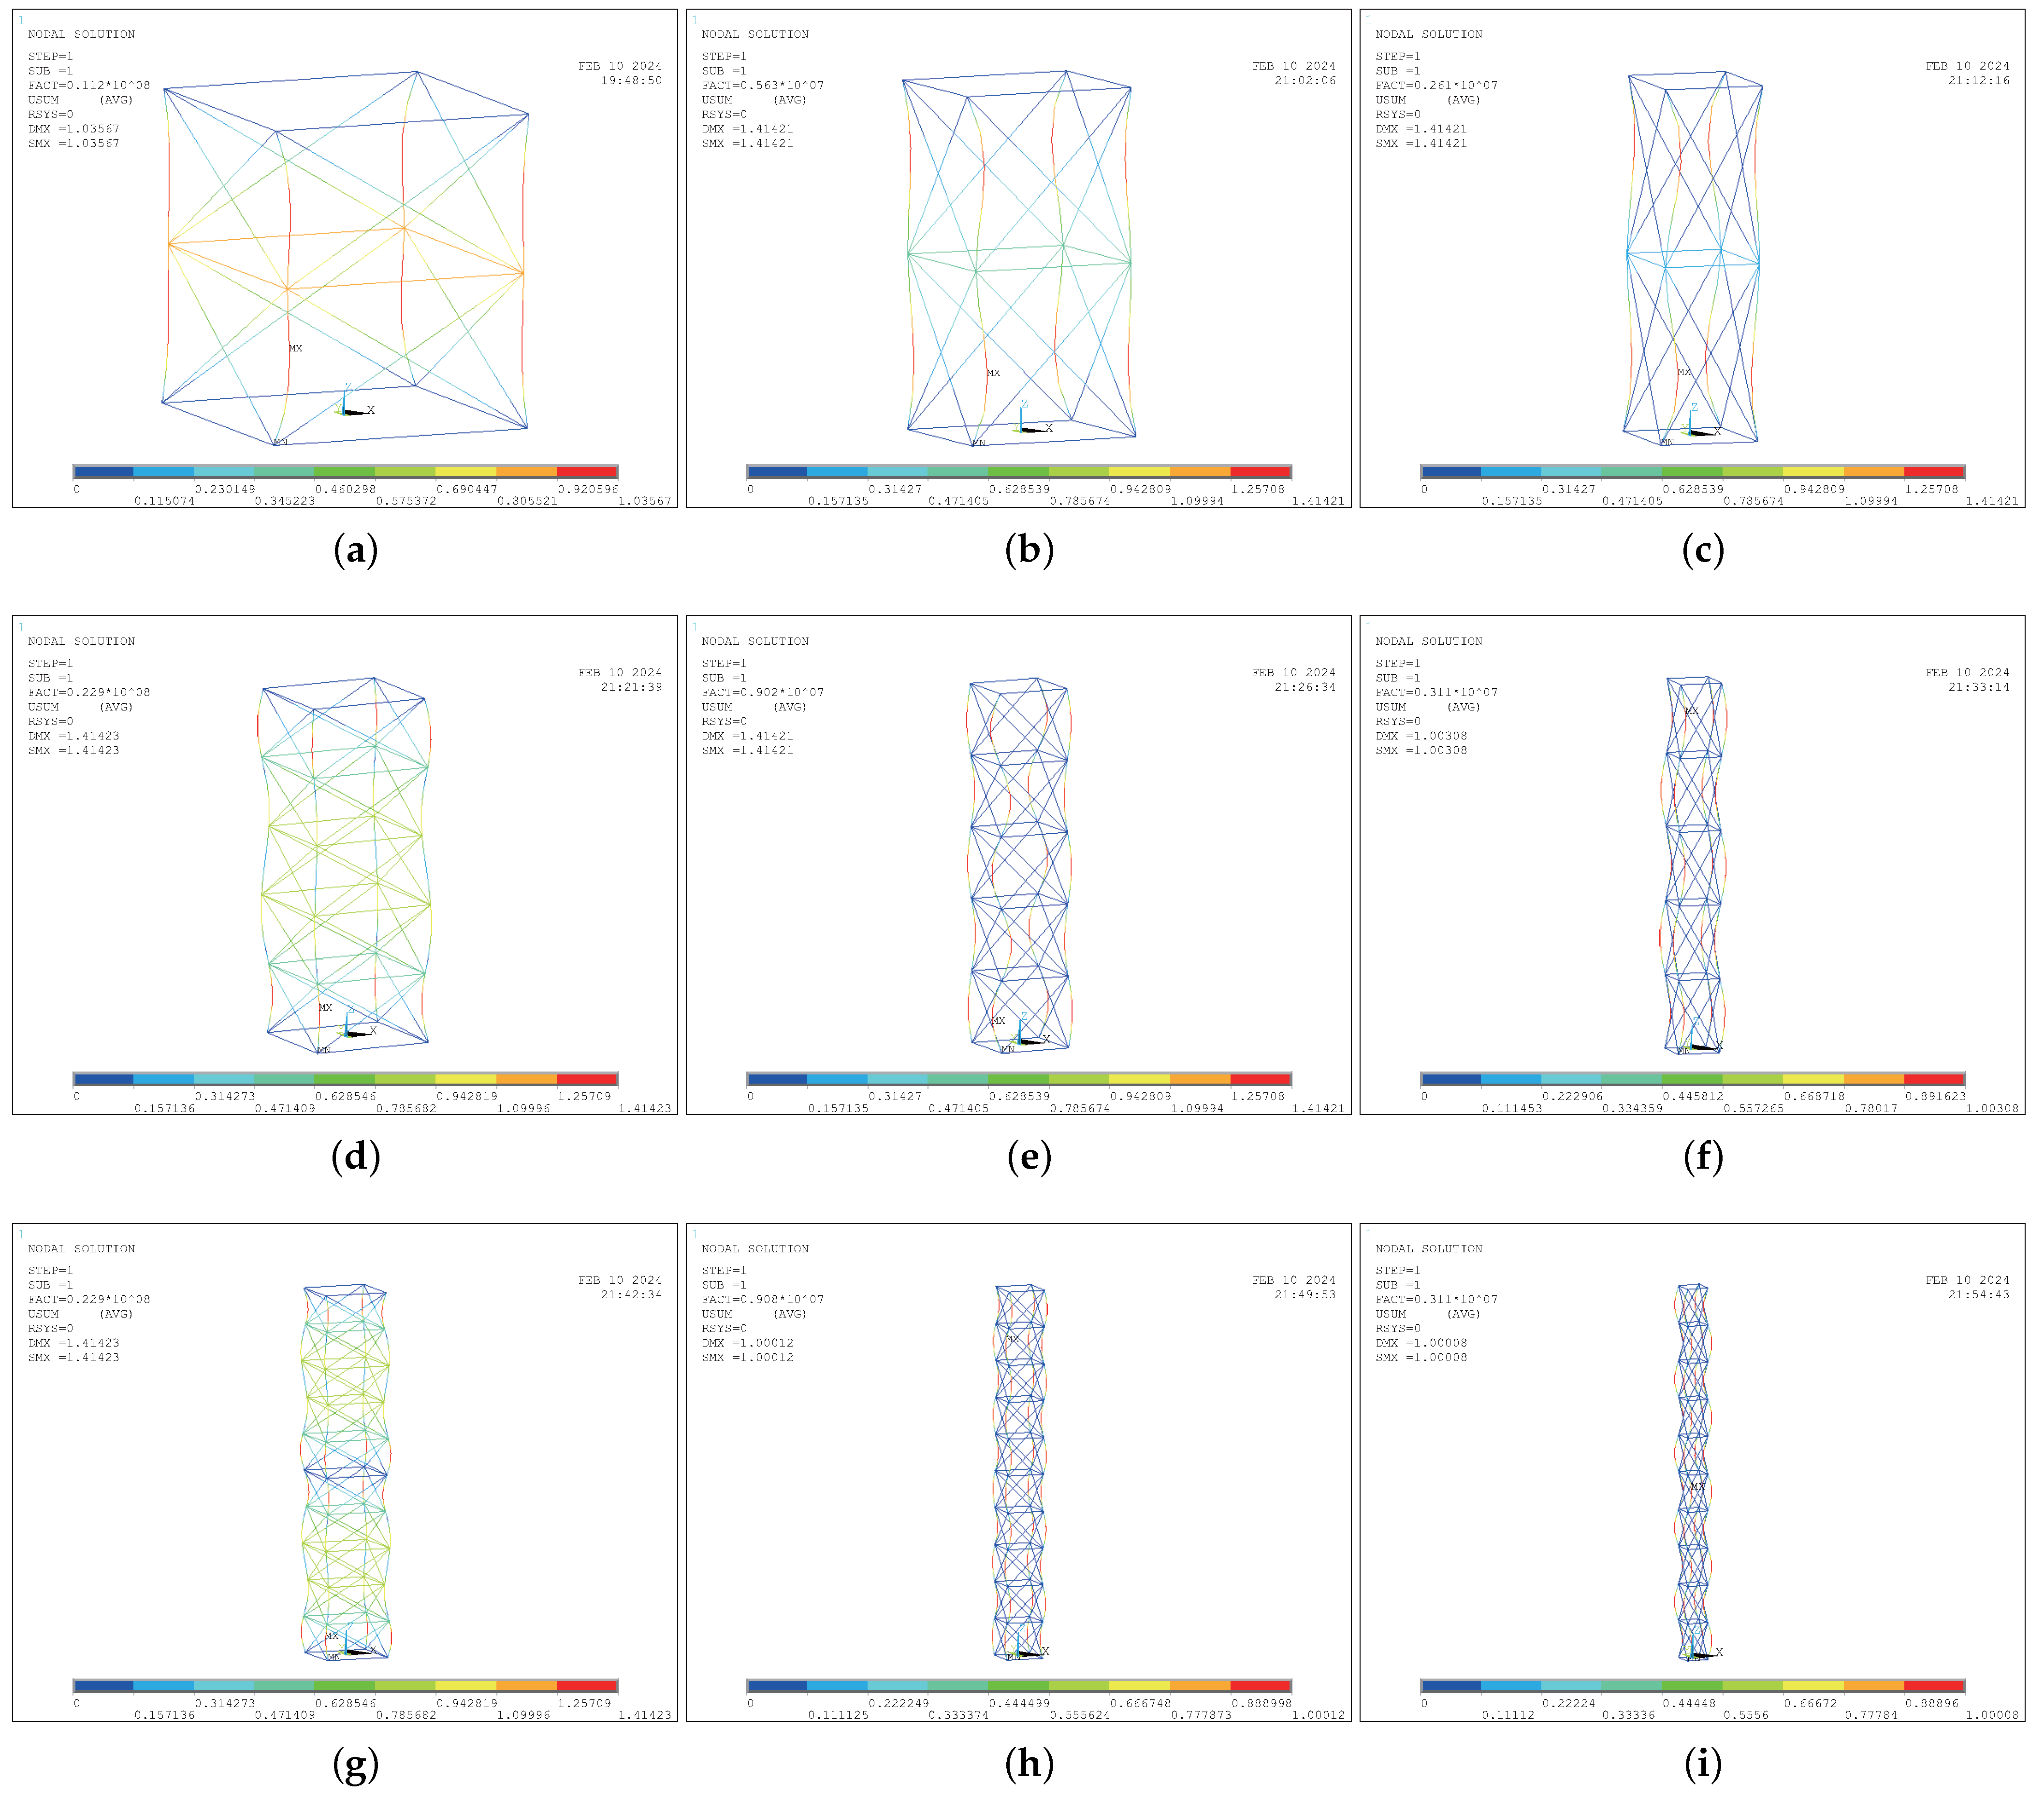
3.3. Results of Numerical Analysis

Based on the numerical calculation models established for TTSs and QTSs, and taking into account the effect of the self-weight of the STSs, a buckling analysis was conducted using eigenvalue analysis. The critical loads of truss models with different angles and different stiffnesses of horizontal bars were calculated and compared with theoretical results. Table 2 and Table 3 present the numerical analysis results of the ultimate load capacity ratio coefficients for TTSs and QTSs with horizontal bar stiffnesses of 0.16EA and 0.25EA, respectively. Figure 11 and Figure 12 present the buckling modes and buckling coefficients of the TTSs and QTSs, respectively.
The calculation results of load capacity ratio coefficients for 60 sets of models for TTSs and QTSs were obtained through eigenvalue buckling analysis. The numerical analysis results from Table 2 and Table 3 demonstrate that the load capacity ratio coefficients for TTSs and QTSs increase with an increase in the horizontal bar stiffness. As the number of tower levels increases, the load capacity ratio coefficients for TTSs and QTSs decrease. With the same conditions for the horizontal bar stiffness, number of tower levels, and horizontal bar angle, the load capacity ratio coefficients for QTSs are slightly higher than those for TTSs. Figure 11 and Figure 12 illustrate the first-mode buckling shapes of TTSs and QTSs. The observed shapes indicate that the deformations of both TTSs and QTSs under loading conform to the sinusoidal deformation pattern.
Figure 13 and Figure 14 show the comparison between the theoretical calculations and numerical simulation results for the TTSs and QTSs. The results in Figure 13 and Figure 14 demonstrate that the numerical simulation curves of the variation in the ultimate load-bearing capacity of the TTSs and QTSs with the stiffness of the horizontal bars are in good agreement with the theoretical values. During the FE analysis, the connection nodes of the main bars were modeled as rigid, while the connection nodes of the diagonal and horizontal bars were modeled as hinged. In theoretical calculations, we simplified the model and used hinged nodes for all connections. As a result, the FE analysis yields slightly higher results compared to the theoretical calculations.
Based on the calculation results from Figure 13 and Figure 14, the relative errors between the FE and theoretical calculations for TTSs and QTSs were obtained, as shown in Figure 15 and Figure 16. Table 4 and Table 5 present the relative error results of the calculation results for TTSs and QTSs. The relative error between the numerical simulation results and the theoretical results for the TTS ranges from 0.40% to 4.93%, while for the QTS, the relative error ranges from 1.59% to 4.88%. Furthermore, the relative error decreases as the stiffness of the horizontal bars increases.

4. Discussion

In order to further investigate the impact of factors such as the stiffness coefficient of the horizontal bars ζ , the number of layers n, and the angle between the diagonal and horizontal bars θ on the ultimate load-bearing capacity of TTSs and QTSs, Equations (20) and (32) were utilized. The main bars of the truss were assumed to have a cross-sectional area denoted as A Δ = A = A . In order to investigate the influence of the cross-bracing stiffness on the bearing capacity of triangular and quadrilateral truss structures, the upper limit of the cross-bracing stiffness was set to be equal to the main member stiffness. When the cross-bracing stiffness is too small, the impact on the overall structural bearing capacity can be neglected. Therefore, considering these factors collectively, the stiffness coefficient of the horizontal bars varied within the range ζ Δ = ζ = 1 400 1 . The number of layers was denoted as n Δ = n = 1 10 , and considering the convenience of construction at truss structure connection joints and taking into account the modular dimensions commonly used in engineering structures, the angle between the diagonal and horizontal bars was denoted as θ Δ = θ = 30 , 45 , 60 .

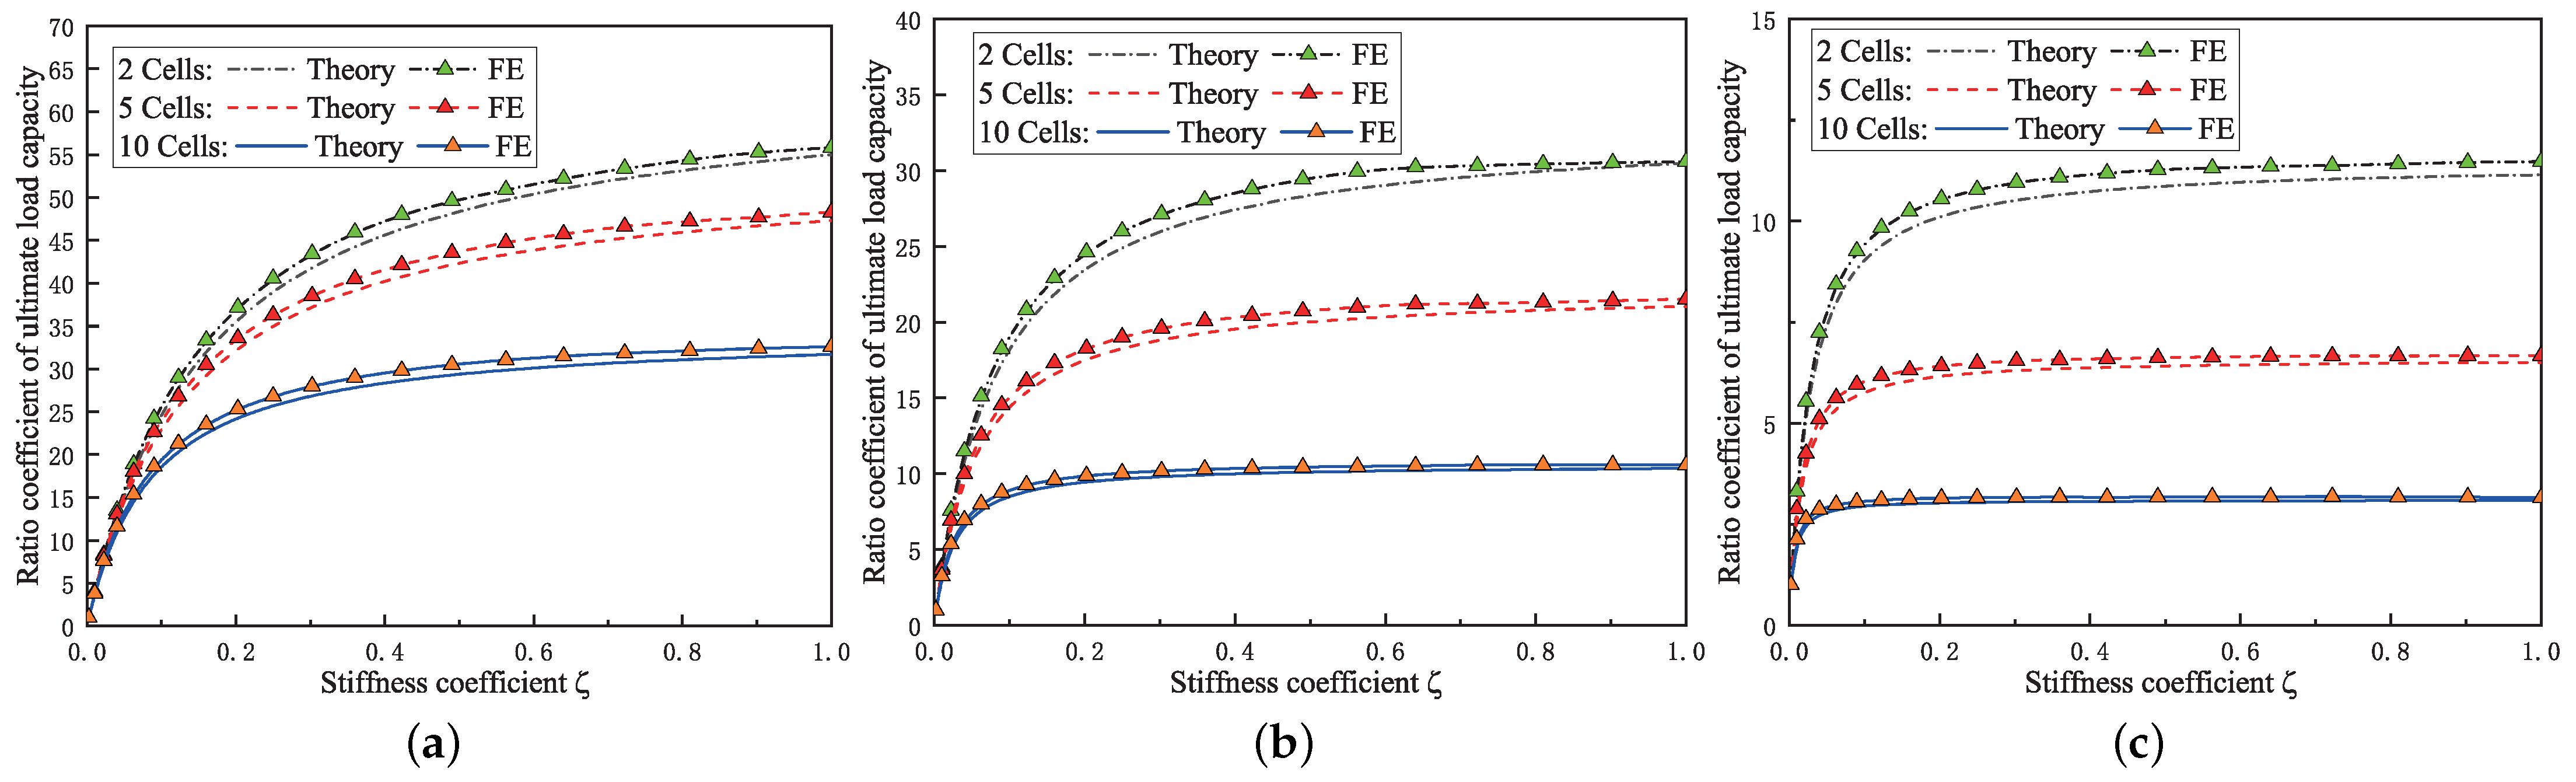
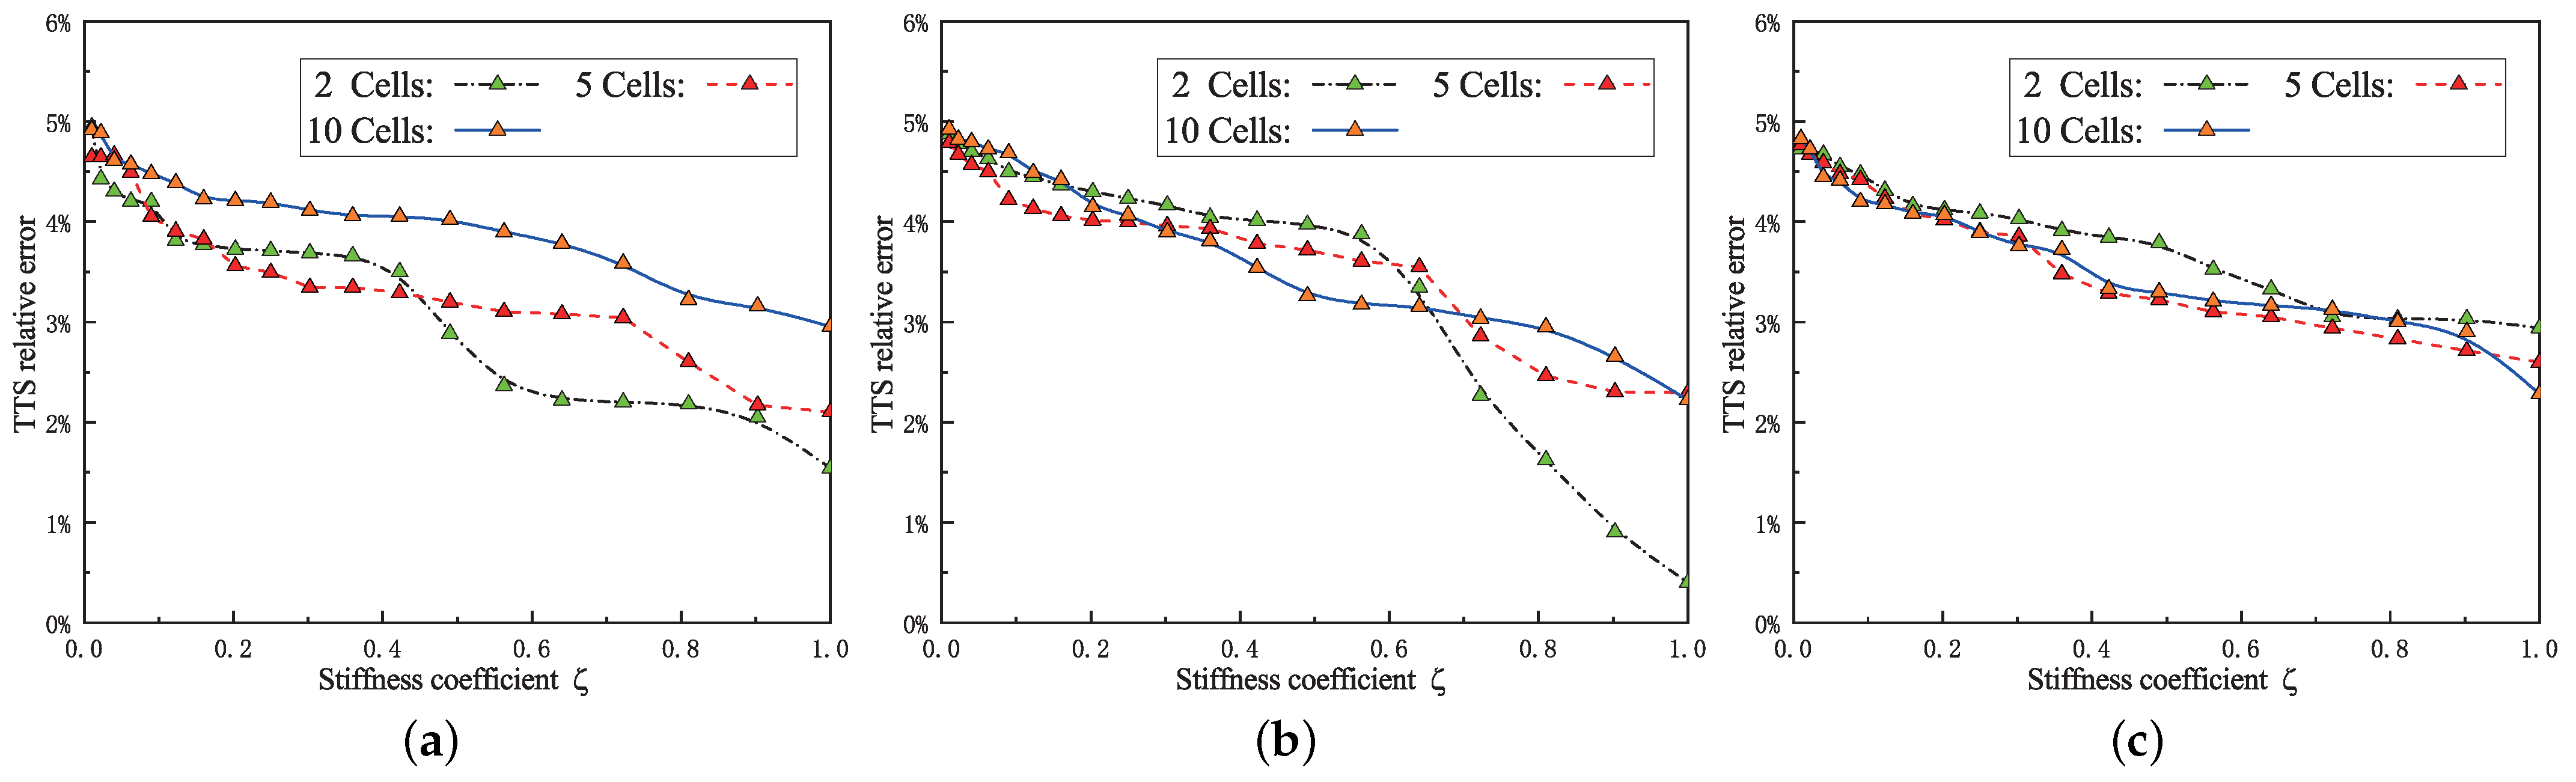
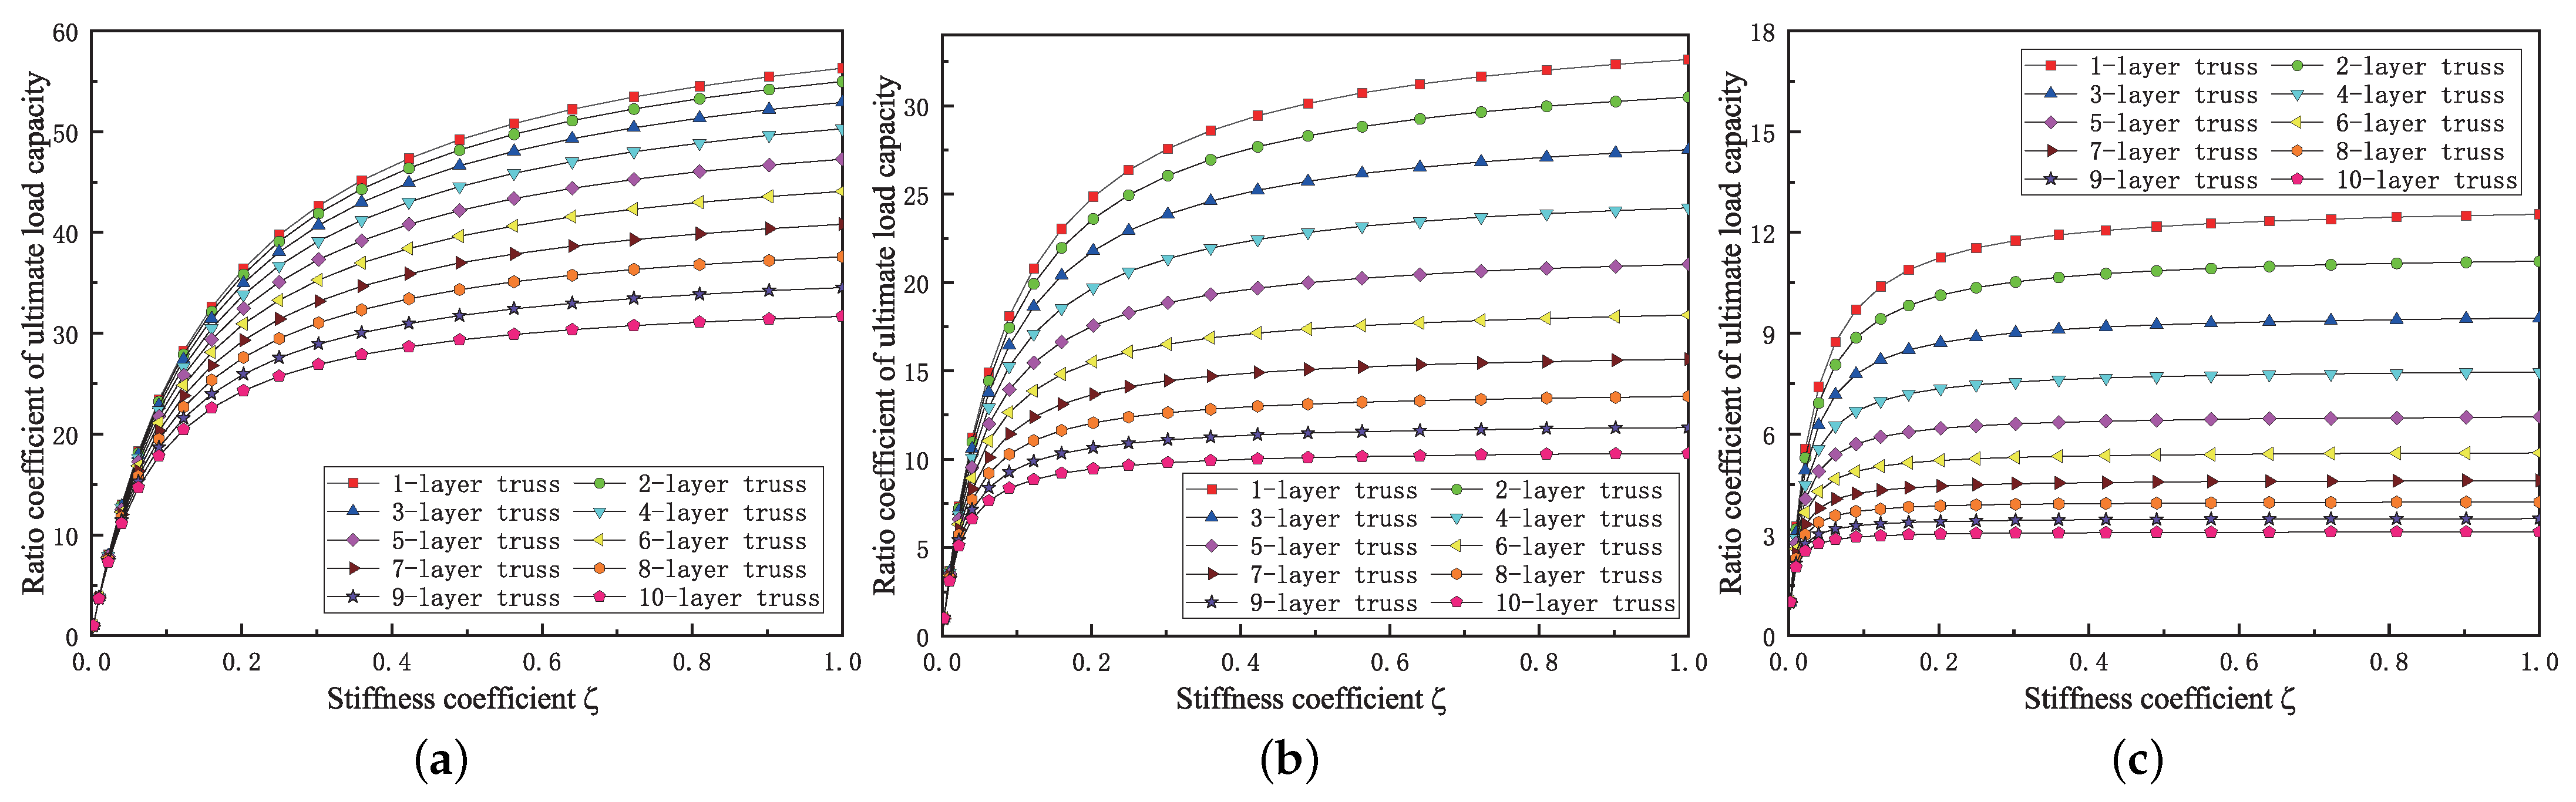
4.1. The Result of the TTS

According to Equation (20), through computational analysis, the ultimate load-bearing capacity of TTSs under different conditions is obtained. In order to observe the variation pattern of the structural load-bearing capacity, the ultimate load-bearing capacity of the model with the minimum stiffness of the horizontal bars is taken as a reference. By using Equation (33), the proportionality coefficient R of the structural load-bearing capacity is obtained. Through further computational analysis, the relationship curve between the proportionality coefficient of the load-bearing capacity and the stiffness of the horizontal bars, the number of layers, and the angle between the diagonal and horizontal bars is derived, as shown in Figure 17.
R = P c r i = ζ P c r 1 / 400
where R represents the proportionality coefficient for the load-bearing capacity of the truss, P c r i = ζ represents the ultimate load-bearing capacity of the truss when the stiffness coefficient of the horizontal bar is ζ , and P c r 1 / 400 represents the ultimate load-bearing capacity of the truss when the stiffness coefficient of the horizontal bar is 1 400 .

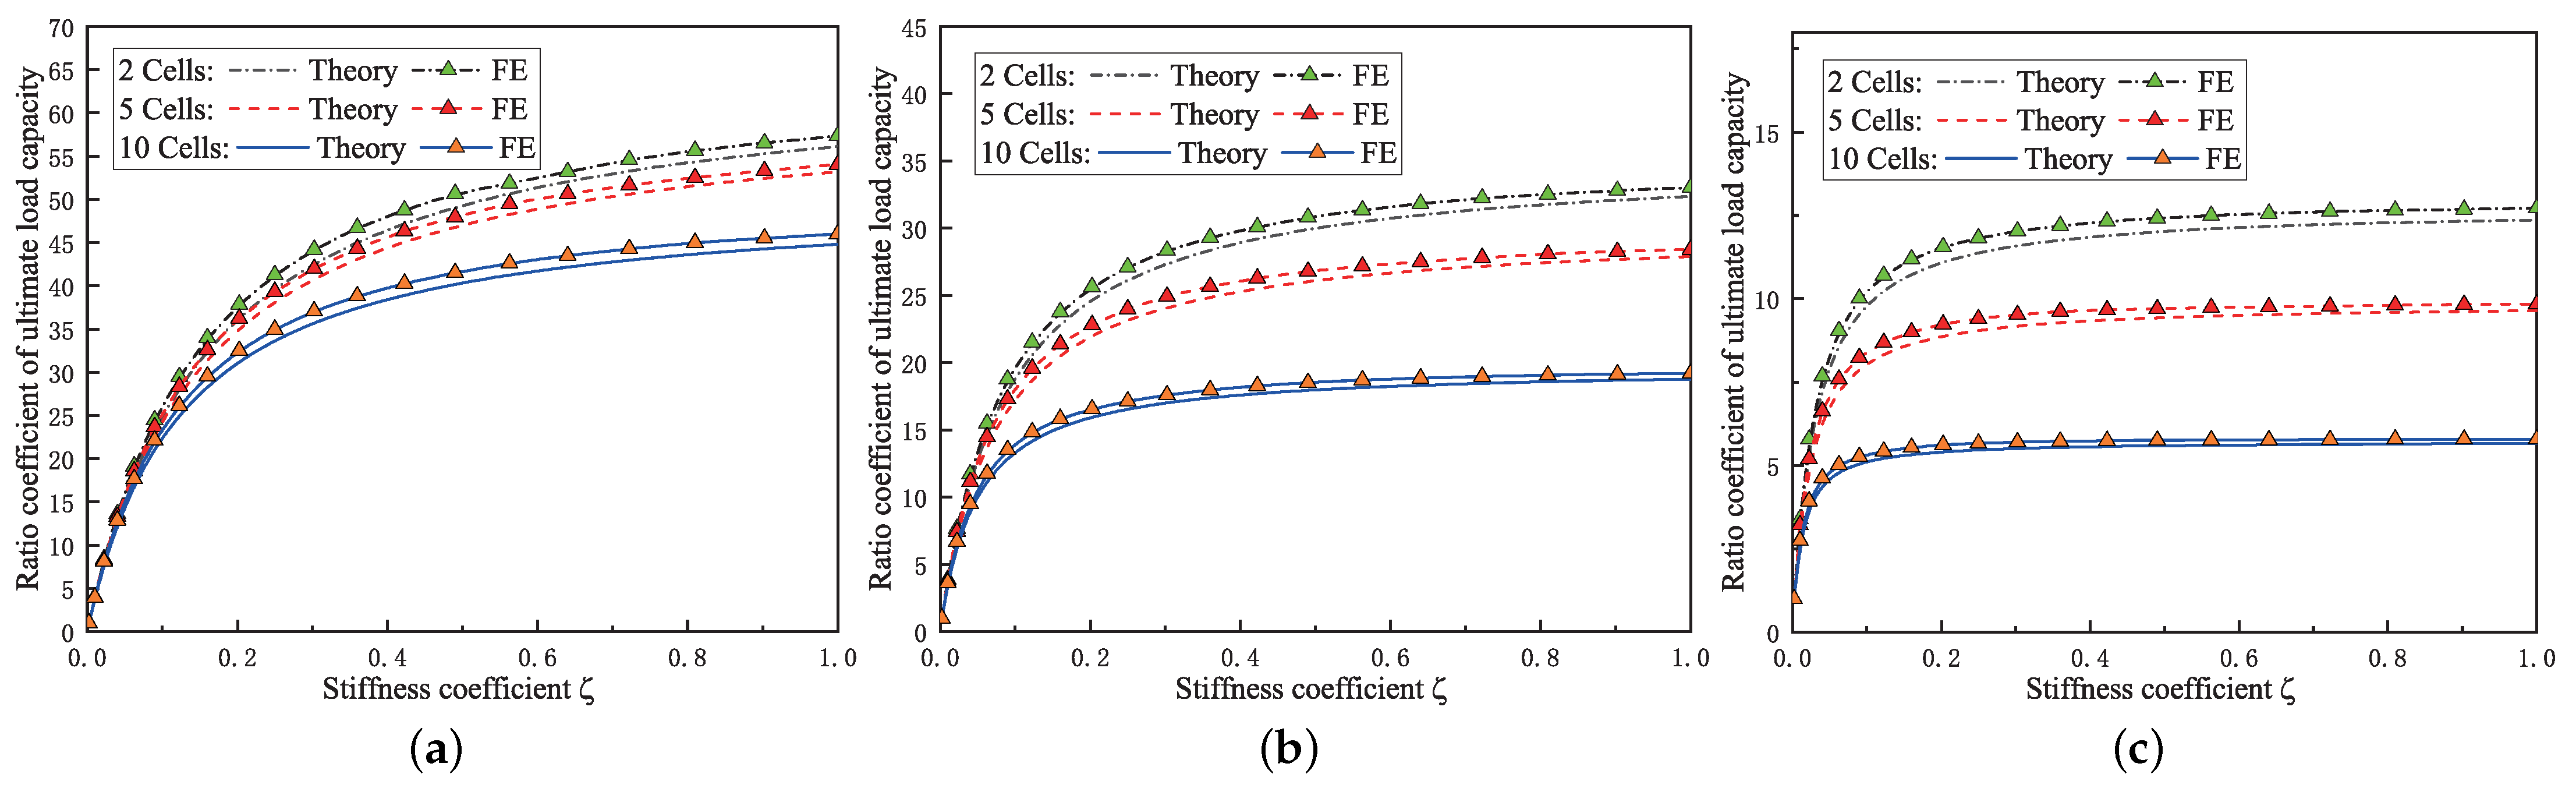
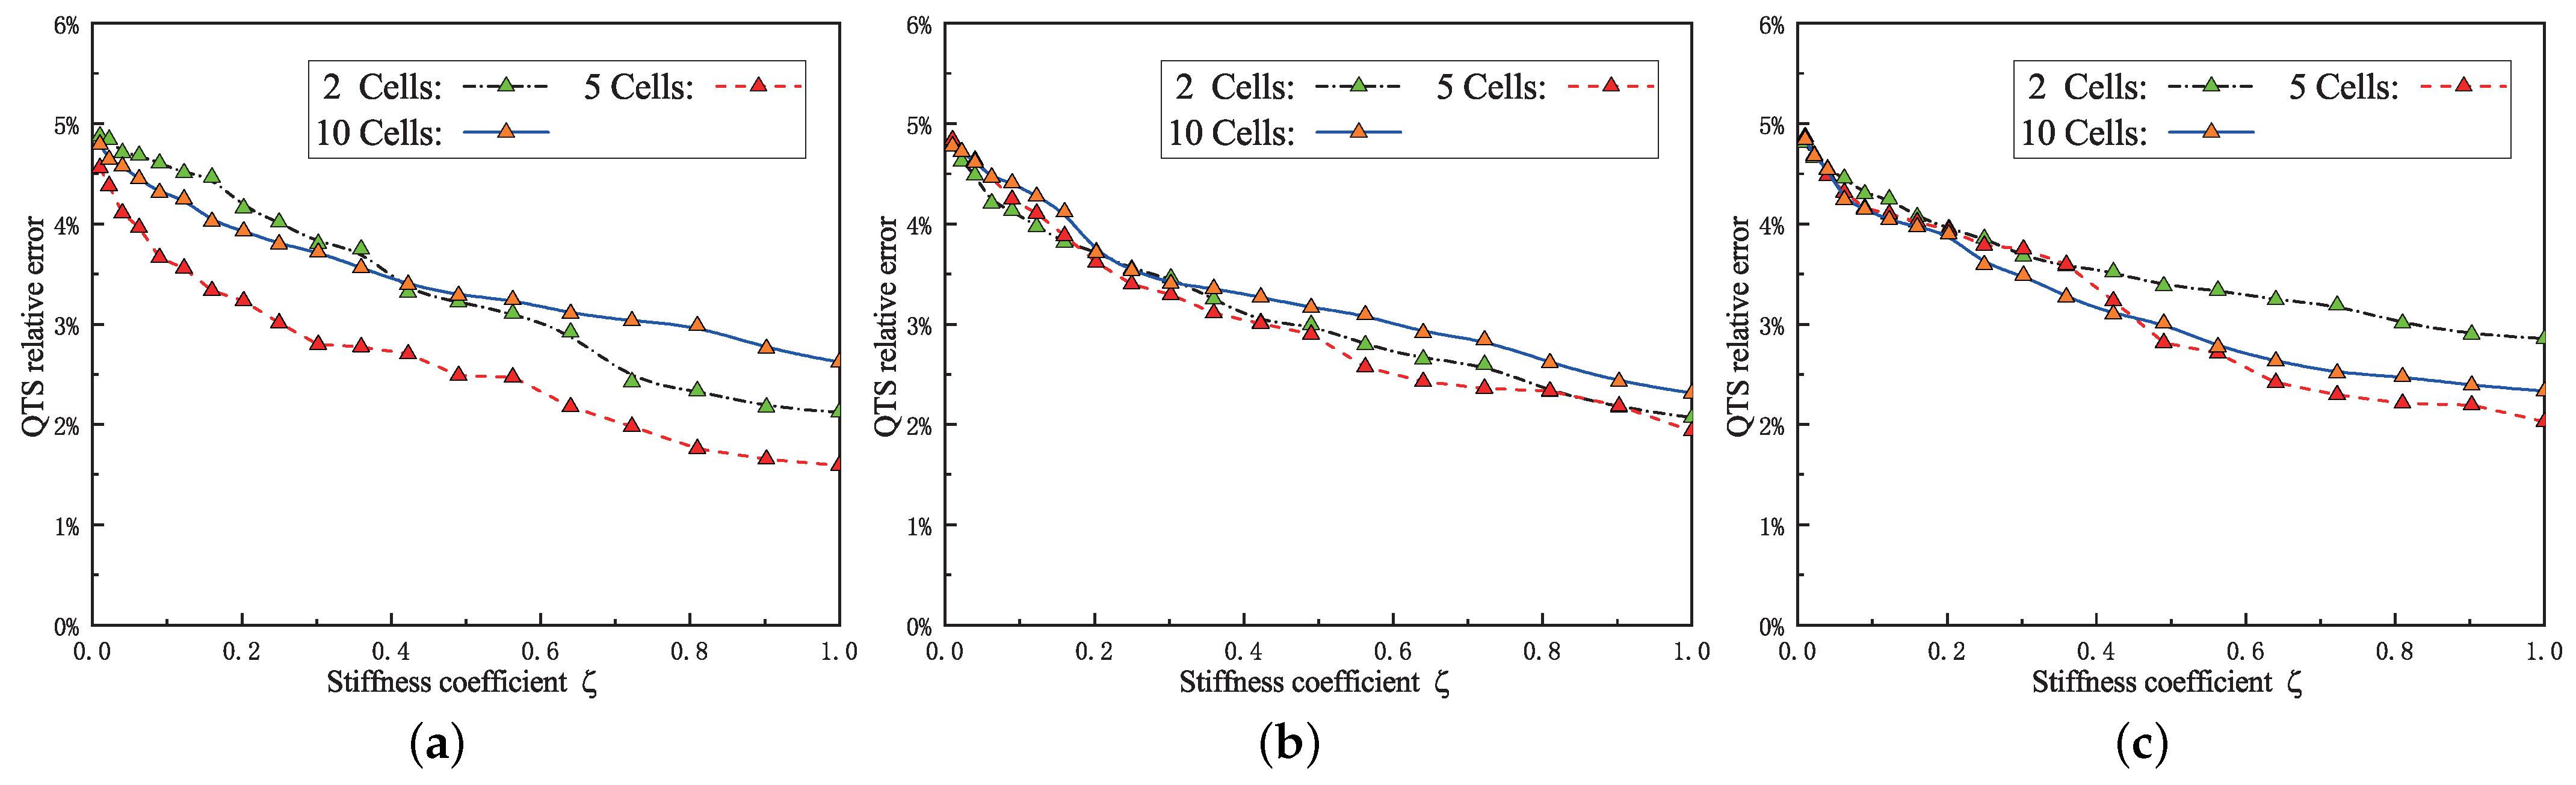
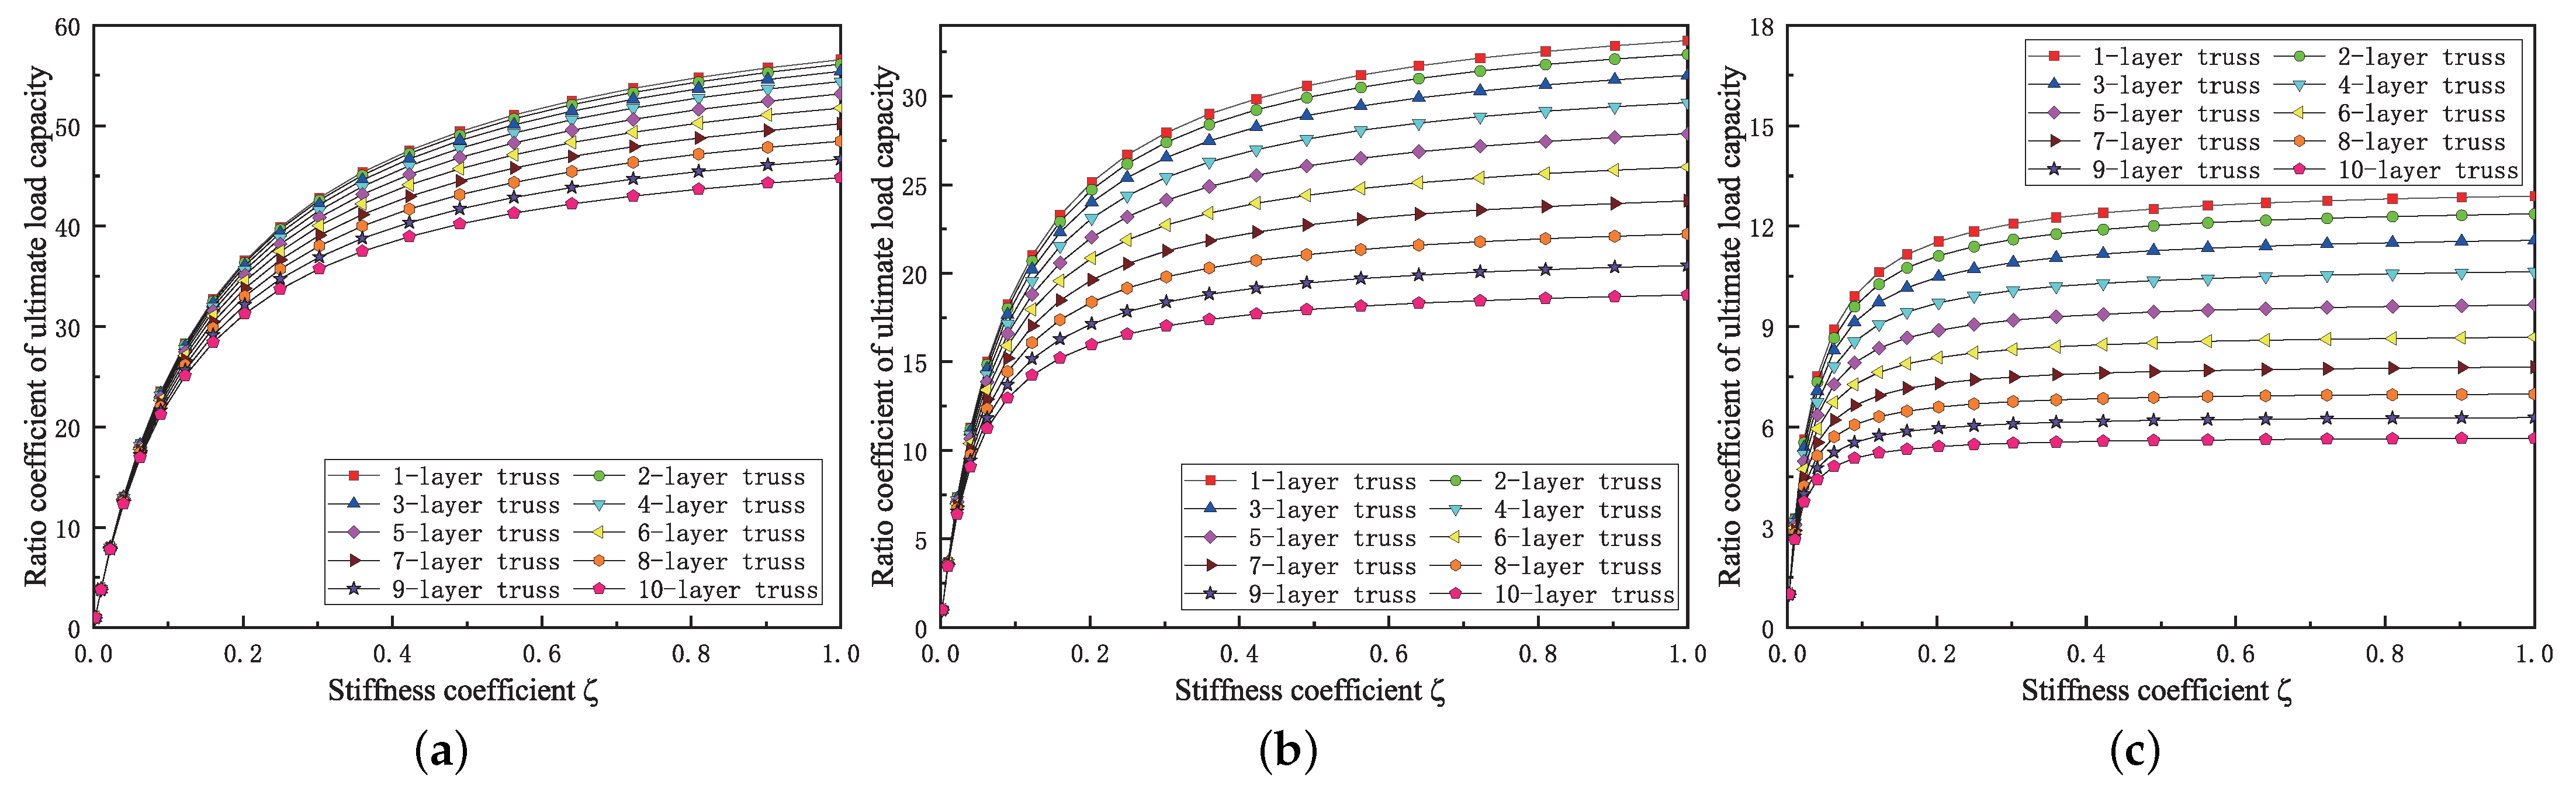
4.2. The Result of the QTS

According to Equation (32), by performing calculations and analysis, the ultimate load-bearing capacity of the QTS under different conditions is obtained. Utilizing Equation (33), the proportionality coefficient R for the structural load-bearing capacity is determined, along with the relationship curve between the stiffness of the horizontal bar, the number of layers, and the angle between the diagonal and horizontal bars, as shown in Figure 18.

4.3. Result Analysis

The findings from Figure 17 and Figure 18 reveal that, when keeping the number of truss layers and the angles between diagonal and horizontal bars constant, the load capacity proportional coefficients of both TTSs and QTSs demonstrate a growing trend as the stiffness coefficient of the horizontal bars varies from 0 to 1. Moreover, this increase is characterized by a rapid initial growth followed by a subsequent stabilization in the later stages. Within the range of 0 to 0.2, the load capacity’s proportional coefficient is most significantly affected by the stiffness coefficient. However, beyond a stiffness coefficient of 0.2, it tends to stabilize. Under conditions where the stiffness coefficient and angles between diagonal and horizontal bars are constant, as the number of truss layers varies from 1 to 10, the proportional load capacity coefficients of both TTSs and QTSs gradually decrease. Additionally, the load capacity coefficient of the TTS is more significantly affected by the number of layers. Under conditions where the number of truss layers and stiffness coefficient are constant, as the angle between diagonal and horizontal bars varies from 30 degrees to 60 degrees, the proportional load capacity coefficients of the truss structure gradually decrease.
Regarding the value of horizontal stiffness, there is no exact specification in the design codes for TTSs and QTSs. In the “Standard for Design of Steel Structures” (GB 50017-2017) [42], for auxiliary bars between main bars and diagonal bars in tower and truss structures, the design value of the load-bearing capacity should be taken as 1/80 and 1/100 of the compressive design value of the main bars, depending on the number of sections in the tower or truss. Theoretical analysis and numerical simulations have shown that the load-bearing capacity of tower structures varies significantly when the stiffness coefficient of the horizontal bars is between 0 and 0.1. As the horizontal bar stiffness reaches 0.2, the load-bearing capacity of the truss structure gradually stabilizes. The current specifications underestimate the stiffness of the auxiliary bars. By further increasing the stiffness of the auxiliary bars, the ultimate load-carrying capacity of TTSs and QTSs can be greatly improved.

5. Conclusions

This paper explores the impact of the stiffness coefficient of horizontal bars, the number of truss layers, and the angle between diagonal and horizontal bars on the ultimate load-bearing capacity of TTSs and QTSs. This study was carried out through a combination of theoretical analysis and numerical simulations. The following conclusions have been derived:
  • By utilizing the energy method, theoretical expressions for the ultimate load-bearing capacity of TTSs and QTSs have been derived. These expressions incorporate the influences of the stiffness coefficient of the horizontal bars, the number of truss layers, and the angle between diagonal and horizontal bars on the ultimate load-bearing capacity.
  • Parameterized FE models for TTSs and QTSs have been established through numerical simulations. By conducting numerical analyses, the correctness of the theoretical expressions has been validated, with errors remaining within 5%. This demonstrates that the theoretical expressions meet the requirements for engineering design.
  • Further investigations were conducted to explore the influence of the stiffness coefficient of the horizontal bars, the number of truss layers, and the angle between diagonal and horizontal bars on the ultimate load-bearing capacity of the truss. The results indicate that as the stiffness coefficient of the horizontal bars increases, the load capacity proportional coefficient of the truss initially shows an increasing trend and then stabilizes. It reaches an equilibrium state when the stiffness coefficient is at 0.2 A . Moreover, as the number of truss layers and the angle between diagonal and horizontal bars increase, the load capacity proportional coefficient gradually decreases.
  • The comparison of results between TTSs and QTSs indicates that the stiffness coefficient of the horizontal bars, the number of truss layers, and the angle between diagonal and horizontal bars have a more significant impact on the ultimate load-bearing capacity of TTSs.
This paper investigates the influence of the stiffness coefficient of the horizontal bars, the number of truss layers, and the angle between diagonal and horizontal bars on the ultimate load-bearing capacity of TTSs and QTSs through theoretical analysis, numerical simulations, and comparative studies. The research findings have theoretical and practical value. This study is based on certain assumptions and can serve as a reference for the design of STSs. However, it should be noted that the effects of connection joints and local phenomena were not considered during the research, and this study did not consider the correlation analysis between the horizontal bar weight and its impact on the load-bearing capacity of the truss structure. Therefore, the results can also provide some insights into the impact patterns of local effects and the optimization design of truss structures.

Author Contributions

Conceptualization, X.W.; methodology, D.L. and C.Z.; software, Y.Q. and P.S.; validation, P.S., S.X. and Y.Q.; formal analysis, Y.Q. and J.Y.; investigation, D.L., J.Y. and P.S.; resources, X.W. and S.X.; data curation, C.Z. and T.Z.; writing—original draft preparation, T.Z. and D.L.; writing—review and editing, X.W.; supervision, J.Y. and S.X.; project administration, X.W. and T.Z. All authors have read and agreed to the published version of the manuscript.

Funding

This research was supported by the Jiangxi Provincial Natural Science Foundation (Awards Nos. 20224BAB214072) and Ningbo Municipal Housing and Urban-Rural Development Bureau Science and Technology Project.

Data Availability Statement

The data of this study are available from the corresponding authors upon request.

Conflicts of Interest

Authors Xianquan Wang, Yong Qiu, Jie Yuan, Dongyan Liu, Peiyu Shi, Chenchen Zhao and Tengfei Zhao were employed by the company Zhejiang Provincial Erjian Construction Group LTD. The remaining authors declare that the research was conducted in the absence of any commercial or financial relationships that could be construed as a potential conflict of interest.

References

  1. Hashemi, Z.; Zamanifard, A.; Gholampour, M.; Liaw, J.S.; Wang, C.C. Recent Progress in Fill Media Technology for Wet Cooling Towers. Processes 2023, 11, 2578. [Google Scholar] [CrossRef]
  2. Randiligama, S.C.M.; Thambiratnam, D.P.; Chan, T.H.; Fawzia, S. Damage assessment in hyperbolic cooling towers using mode shape curvature and artificial neural networks. Eng. Fail. Anal. 2021, 129, 105728. [Google Scholar] [CrossRef]
  3. Gould, P.L.; Krätzig, W.B. Cooling tower structures. In Handbook of Structural Engineering; CRC Press: Boca Raton, FL, USA, 1999; Volume 27. [Google Scholar]
  4. Park, H.J.; Koo, K.Y.; Yun, C.B. Modal flexibility-based damage detection technique of steel beam by dynamic strain measurements using FBG sensors. Steel Struct. 2007, 7, 11–18. [Google Scholar]
  5. Mang, H.A.; Floegl, H.; Trappel, F.; Walter, H. Wind-loaded reinforced-concrete cooling towers: Buckling or ultimate load? Eng. Struct. 1983, 5, 163–180. [Google Scholar] [CrossRef]
  6. Zhang, J.F.; Pei, H.; Li, J.; Ge, Y.J.; Zhao, L. Failure process and ultimate strength of RC hyperbolic cooling towers under equivalent static wind loads. Thin-Walled Struct. 2022, 176, 109307. [Google Scholar] [CrossRef]
  7. Wang, H.; Ke, S.; Wang, T.; Ge, Y.; Zhu, R. Comparison of wind-induced dynamic property of super-large cooling tower considering different four-tower interferences. Struct. Des. Tall Spec. Build. 2020, 29, e1749. [Google Scholar] [CrossRef]
  8. Song, G.; Zhi, X.; Li, Z.; Fan, F.; Jin, X. Study on the layout methods of stiffening rings for steel cooling towers. Structures 2023, 51, 1438–1449. [Google Scholar] [CrossRef]
  9. Bamu, P.C.; Zingoni, A. Damage, deterioration and the long-term structural performance of cooling-tower shells: A survey of developments over the past 50 years. Eng. Struct. 2005, 27, 1794–1800. [Google Scholar] [CrossRef]
  10. Bosman, P.B.; Strickland, I.G.; Prukl, R.P. Strengthening of natural draught cooling tower shells with stiffening rings. Eng. Struct. 1998, 10, 909–914. [Google Scholar]
  11. Mungan, I.; Wittek, U. (Eds.) Natural Draught Cooling Towers: Proceedings of the Fifth International Symposium on Natural Draught Cooling Towers, Istanbul, Turkey, 20–22 May 2004; CRC Press: Boca Raton, FL, USA, 2004. [Google Scholar]
  12. Tang, Z.; Li, Z.; Wang, T. Probabilistic bearing capacity assessment for unequal-leg angle cross-bracings in transmission towers. J. Constr. Steel Res. 2023, 200, 107672. [Google Scholar] [CrossRef]
  13. Vettoretto, G.; Li, Z.; Affolter, C. Evaluation of the Ultimate Collapse Load of a High-Voltage Transmission Tower under Excessive Wind Loads. Buildings 2023, 13, 513. [Google Scholar] [CrossRef]
  14. Krajewski, M.; Iwicki, P. Stability and load bearing capacity of a truss with elastic braces. In Recent Advances in Computation Mechanics; CRC Press: Boca Raton, FL, USA, 2014; pp. 17–22. [Google Scholar]
  15. Milašinović, D.D.; Kozarić, L.; Bursać, S.; Bešević, M.; Miličić, I.; Varju, Đ. Load-bearing capacity and resonance stability of inelastic beams and plane trusses with initial defects. Eng. Comput. 2022, 39, 858–892. [Google Scholar] [CrossRef]
  16. Krajewski, M.; Iwicki, P. 05.30: Stability and load bearing capacity of a braced truss under upward wind loading. ce/papers 2017, 1, 1295–1304. [Google Scholar] [CrossRef]
  17. Stümpel, M.; Mathern, A.; Marx, S. Experimental investigations on a novel concrete truss structure with cast iron nodes. Eng. Struct. 2021, 232, 111843. [Google Scholar] [CrossRef]
  18. Gao, H.; Zhang, K.; Wu, X.; Liu, H.; Zhang, L. Application of BRB to Seismic Mitigation of Steel Truss Arch Bridge Subjected to Near-Fault Ground Motions. Buildings 2022, 12, 2147. [Google Scholar] [CrossRef]
  19. Li, X.; Pan, J.; Zhou, X. Impact resistance analysis and optimization of variant truss beam structure based on material properties. Materials 2021, 14, 5847. [Google Scholar] [CrossRef] [PubMed]
  20. Cai, Q.; Feng, R.; Zhang, Z. Topology optimization of truss structure considering nodal stability and local buckling stability. Structures 2022, 40, 64–73. [Google Scholar] [CrossRef]
  21. Li, N.; Cao, Z.; Bao, W.; Lin, S.; Zou, T.; Yan, M. Experimental study and finite element analysis of heavy-duty escalator truss under full load conditions. Sci. Rep. 2024, 14, 4825. [Google Scholar] [CrossRef]
  22. Yao, H.; Huang, Y.; Ma, W.; Liang, L.; Zhao, Y. Dynamic Analysis of a Large Deployable Space Truss Structure Considering Semi-Rigid Joints. Aerospace 2023, 10, 821. [Google Scholar] [CrossRef]
  23. Jiang, W.Q.; Wang, Z.Q.; McClure, G.; Wang, G.L.; Geng, J.D. Accurate modeling of joint effects in lattice transmission towers. Eng. Struct. 2011, 33, 1817–1827. [Google Scholar] [CrossRef]
  24. Li, R.; Qi, L.; Dong, Y.R.; Wang, H. Nonlinear Performance of Steel Tube Tower in Ultra-High Voltage Transmission Lines under Wind Loads. Buildings 2024, 14, 140. [Google Scholar] [CrossRef]
  25. Tang, Z.; Wang, T.; Li, Z. Probabilistic bearing capacity assessment for cross-bracings with semi-rigid connections in transmission towers. Struct. Eng. Mech. 2024, 89, 309–321. [Google Scholar]
  26. Hao, X.; Zhu, R.; Li, R.; Li, F. Effect of Joint Stiffness on Flexural Performance of a Hybrid FRP-Aluminum Space Truss Structure. J. Struct. Eng. 2021, 147, 04021214. [Google Scholar] [CrossRef]
  27. Jiang, W.Q.; Liu, Y.P.; Chan, S.L.; Wang, Z.Q. Direct analysis of an ultrahigh-voltage lattice transmission tower considering joint effects. J. Struct. Eng. 2017, 143, 04017009. [Google Scholar] [CrossRef]
  28. Deng, H.; Li, C. Simplified joint-slippage model of bolted joint in lattice transmission tower. Structures 2021, 32, 1192–1206. [Google Scholar]
  29. Ma, H.; Yu, Z.; Zhao, Y.; Fan, F. Behavior of HCR semi-rigid joints under complex loads and its effect on stability of steel cooling towers. Eng. Struct. 2020, 222, 111062. [Google Scholar] [CrossRef]
  30. Yang, H. Performance analysis of semi-rigid connections in prefabricated high-rise steel structures. Structures 2020, 28, 837–846. [Google Scholar] [CrossRef]
  31. Han, Q.; Wang, C.; Xu, Y.; Zhang, X.; Liu, Y. Mechanical performance of AH joints and influence on the stability behaviour of single-layer cylindrical shells. Thin-Walled Struct. 2020, 146, 106459. [Google Scholar] [CrossRef]
  32. Zhao, T.; Li, A.; Yan, H.; Zhang, L.; Lan, Z.; Huang, M.; Wu, H. Comparison of the influence of double-limb double-plate joint on the stability bearing capacity of triangular and quadrilateral transmission tower structures. Buildings 2022, 12, 784. [Google Scholar] [CrossRef]
  33. Hou, R.; Beck, J.L.; Zhou, X.; Xia, Y. Structural damage detection of space frame structures with semi-rigid connections. Eng. Struct. 2021, 235, 112029. [Google Scholar] [CrossRef]
  34. Ashraf, M.; Hasan, M.J.; Al-Deen, S. Semi-rigid behaviour of stainless steel beam-to-column bolted connections. Sustain. Struct. 2021, 1, 2. [Google Scholar] [CrossRef]
  35. Teter, A.; Mania, R.J.; Kolakowski, Z. Effect of selected elements of the coupling stiffness submatrix on the load-carrying capacity of hybrid columns under compression. Compos. Struct. 2017, 180, 140–147. [Google Scholar] [CrossRef]
  36. Liu, Y.; Peng, L.; Li, Z.; Lu, H.; Shu, D.W. 3D Printed Nonuniform Auxetic Structure: Programmable Local Stiffness to Improve Mechanical Property by Avoiding Buckling. Int. J. Appl. Mech. 2022, 14, 2250098. [Google Scholar] [CrossRef]
  37. Silvestre, N.; Young, B.; Camotim, D. Non-linear behaviour and load-carrying capacity of CFRP-strengthened lipped channel steel columns. Eng. Struct. 2008, 30, 2613–2630. [Google Scholar] [CrossRef]
  38. Blachowski, B.; Gutkowski, W. Effect of damaged circular flange-bolted connections on behaviour of tall towers, modelled by multilevel substructuring. Eng. Struct. 2016, 111, 93–103. [Google Scholar] [CrossRef]
  39. Hartmann, F. The Mathematical Foundation of Structural Mechanics; Springer Science & Business Media: Berlin/Heidelberg, Germany, 2012. [Google Scholar]
  40. Langhaar, H.L. Energy Methods in Applied Mechanics; Courier Dover Publications: Mineola, NY, USA, 2016. [Google Scholar]
  41. Zhao, T.; Yan, H.; He, P.; Zhang, L.; Lan, Z.; Huang, M. Influence of Double-Limb Double-Plate Connection on Stable Bearing Capacity of Quadrilateral Transmission Tower. Appl. Sci. 2021, 11, 12024. [Google Scholar] [CrossRef]
  42. GB 50017-2017; Standard for Design of Steel Structures. China Architecture & Building Press: Beijing, China, 2017.
Figure 1. A calculation diagram of the TTS.
Buildings 14 00928 g001
Figure 2. A calculation diagram of the QTS.
Buildings 14 00928 g002
Figure 3. FE model of the 2-layer TTS cell with different angles between diagonal and horizontal bars: (a) 30 degrees; (b) 45 degrees; (c) 60 degrees.
Buildings 14 00928 g003
Figure 4. FE model of the 5-layer TTS cell with different angles between diagonal and horizontal bars: (a) 30 degrees; (b) 45 degrees; (c) 60 degrees.
Buildings 14 00928 g004
Figure 5. FE model of the 10-layer TTS cell with different angles between diagonal and horizontal bars: (a) 30 degrees; (b) 45 degrees; (c) 60 degrees.
Buildings 14 00928 g005
Figure 6. Calculation models of the TTS with different numbers of layers: (a) 2 layers; (b) 5 layers; (c) 10 layers.
Buildings 14 00928 g006
Figure 7. FE model of the 2-layer QTS cell with different angles between diagonal and horizontal bars: (a) 30 degrees; (b) 45 degrees; (c) 60 degrees.
Buildings 14 00928 g007
Figure 8. FE model of the 5-layer QTS cell with different angles between diagonal and horizontal bars: (a) 30 degrees; (b) 45 degrees; (c) 60 degrees.
Buildings 14 00928 g008
Figure 9. FE model of the 10-layer QTS cell with different angles between diagonal and horizontal bars: (a) 30 degrees; (b) 45 degrees; (c) 60 degrees.
Buildings 14 00928 g009
Figure 10. Calculation models of the QTS with different numbers of layers: (a) 2 layers; (b) 5 layers; (c) 10 layers.
Buildings 14 00928 g010
Figure 11. Stability coefficients of different TTS models: (a) 2-layer model with 30-degree angle; (b) 2-layer model with 45-degree angle; (c) 2-layer model with 60-degree angle; (d) 5-layer model with 60-degree angle; (e) 5-layer model with 60-degree angle; (f) 5-layer model with 60-degree angle; (g) 10-layer model with 60-degree angle; (h) 10-layer model with 60-degree angle; (i) 10-layer model with 60-degree angle.
Buildings 14 00928 g011
Figure 12. Stability coefficients of different QTS models: (a) 2-layer model with 30-degree angle; (b) 2-layer model with 45-degree angle; (c) 2-layer model with 60-degree angle; (d) 5-layer model with 60-degree angle; (e) 5-layer model with 60-degree angle; (f) 5-layer model with 60-degree angle; (g) 10-layer model with 60-degree angle; (h) 10-layer model with 60-degree angle; (i) 10-layer model with 60-degree angle.
Buildings 14 00928 g012
Figure 13. Comparison of theoretical and numerical results for TTSs: (a) 30 degrees; (b) 45 degrees; (c) 60 degrees.
Buildings 14 00928 g013
Figure 14. Comparison of theoretical and numerical results for QTSs: (a) 30 degrees; (b) 45 degrees; (c) 60 degrees.
Buildings 14 00928 g014
Figure 15. Relative error between the FE and theoretical calculations for TTSs: (a) 30 degrees; (b) 45 degrees; (c) 60 degrees.
Buildings 14 00928 g015
Figure 16. Relative error between the FE and theoretical calculations for QTSs: (a) 30 degrees; (b) 45 degrees; (c) 60 degrees.
Buildings 14 00928 g016
Figure 17. The variation curve of the proportionality coefficient for the ultimate load-bearing capacity of the TTS: (a) 30 degrees; (b) 45 degrees; (c) 60 degrees.
Buildings 14 00928 g017
Figure 18. The variation curve of the proportionality coefficient for the ultimate load-bearing capacity of the QTS: (a) 30 degrees; (b) 45 degrees; (c) 60 degrees.
Buildings 14 00928 g018
Table 1. Material and cross-sectional properties of the bars.
TypeMaterialElastic Modulus (GPa)Poisson’s RatioDensity (kg/m3)Cross-Sectional ShapeArea
Main barQ2352100.37850CircularA
Diagonal barQ2352100.37850Circular0.25A
Horizontal barQ2352100.37850Circular ζ A 1
1  ζ represents the variation coefficient of the cross-sectional area of the horizontal bars.
Table 2. Ratio coefficient of ultimate load capacity for the TTS with representative horizontal bar stiffness.
Degree of Angle (°C)Horizontal Bar Stiffness: 0.16EAHorizontal Bar Stiffness: 0.25EA
2-Layer5-Layer10-Layer2-Layer5-Layer10-Layer
3033.3564930.5115623.5198440.5555136.3020326.81691
4522.9260817.323429.6171626.0133319.0138910.05655
6010.2446.312873.129710.780946.489733.16024
Table 3. Ratio coefficient of ultimate load capacity for the QTS with representative horizontal bar stiffness.
Degree of Angle (°)Horizontal Bar Stiffness: 0.16EAHorizontal Bar Stiffness: 0.25EA
2-Layer5-Layer10-Layer2-Layer5-Layer10-Layer
3033.9869532.5840229.5667941.2790639.3473334.98508
4523.7871721.3921715.8438527.1218623.9774917.14792
6011.194999.006895.5434811.831189.397935.66349
Table 4. Relative error of TTS calculation results.
Category30 Degrees45 Degrees60 Degrees
2-Layer5-Layer10-Layer2-Layer5-Layer10-Layer2-Layer5-Layer10-Layer
Maximum error4.94%4.67%4.92%4.87%4.79%4.93%4.73%4.76%4.83%
Minimum error1.54%2.10%2.96%0.40%2.30%2.22%2.94%2.60%2.28%
Table 5. Relative error of QTS calculation results.
Category30 Degrees45 Degrees60 Degrees
2-Layer5-Layer10-Layer2-Layer5-Layer10-Layer2-Layer5-Layer10-Layer
Maximum error4.88%4.56%4.79%4.78%4.84%4.78%4.81%4.87%4.84%
Minimum error2.12%1.59%2.62%2.07%1.94%2.31%2.86%2.03%2.33%
Disclaimer/Publisher’s Note: The statements, opinions and data contained in all publications are solely those of the individual author(s) and contributor(s) and not of MDPI and/or the editor(s). MDPI and/or the editor(s) disclaim responsibility for any injury to people or property resulting from any ideas, methods, instructions or products referred to in the content.

