
Model Test on the Collapse Evolution Law of Tunnel Excavation in Composite Strata with a Cavity

1
Shandong Provincial Communications Planning and Design Institute Group Co., Ltd., Jinan 250101, China
2
School of Civil Engineering, Qingdao University of Technology, Qingdao 266033, China
*
Author to whom correspondence should be addressed.
Buildings 2024, 14(4), 932; https://0-doi-org.brum.beds.ac.uk/10.3390/buildings14040932
Submission received: 22 February 2024
/
Revised: 22 March 2024
/
Accepted: 25 March 2024
/
Published: 28 March 2024
(This article belongs to the Special Issue Design, Construction and Maintenance of Underground Structures)
Abstract
:More complex geological conditions could be encountered with the construction of urban subway projects. At present, many subway tunnels have been built in composite strata with upper soft and lower hard layers, but the presence of a cavity in the strata increases the risk of collapse during construction. In this paper, a series of model experiments and discrete element methods were conducted to investigate the failure behavior of composite strata with a cavity caused by tunnel excavation disturbance. The influence of the distance between the cavity and vault (hd) and the distance between the soil–rock interface and vault (hr) on the collapse of the composite strata are analyzed. The research results indicate that tunnel collapse exhibits progressive failure because of the forming of a collapsed arch in the strata. If the hd is greater than the tunnel span (D), the arch can be stabilized without other disturbances. Additionally, the thickness of the tunnel rock layer affects the height of the collapsed arch significantly, as it is difficult to form a stable arch when the hr is less than 2/3 D. Finally, reasonable construction safety distances are proposed based on the possibility of forming a stable arch collapse in the tunnel and determining the range of the collapse.
1. Introduction
The construction of the subway brings great convenience to public travel [1,2,3,4]; however, affected by geological conditions, ground defects, improper construction operation, and other factors, subway construction-induced ground destabilization and collapse accidents also occur frequently [5,6,7]. It has been found that ground cavities are an important cause of tunnel collapse accidents [8,9,10,11,12]. In the construction of subways in cities such as Beijing and Chengdu, geological strata containing cavities are encountered. For the detection of cavities, scholars have conducted extensive research utilizing radar detection technology [13,14]. Kravitz et al. [15] used ground-penetrating radar to detect cavities, determining the most appropriate antenna frequency that can penetrate through the steel-reinforced segments and produce the best resolution. Despite continual improvements in detection techniques, comprehensive investigation of these cavities remains challenging due to their inherent concealment [16,17], and collapse caused by construction often happens. To address the above issues, it is necessary to investigate the failure mechanism of strata with a cavity.
Recently, there has been a great deal of research into the collapse mechanism of the tunnel. For example, Torres [18] used theoretical analysis to evaluate the safety factor of circular tunnel excavation in cohesive foundations and compared the analytical solution with the numerical solution. Huang et al. [19] derived analytical solutions for the collapse surfaces of surrounding rocks in karst regions based on the upper bound theory and mapped the shapes of the collapse surfaces. However, these theoretical models are usually simplified to isotropic media and circular tunnels. Model tests have become an effective means of studying stratum deformation and failure due to their intuitiveness and authenticity. At present, subway construction has caused widespread attention to strata deformation and failure. For the research on ground deformation caused by tunnel construction, Xu et al. [20] focused on the relationship between collapse and longitudinal topography in loess tunnel construction and obtained the surrounding rock stress and ground displacement through modeling tests. Li et al. [21] investigated the deformation and failure mechanism of tunnels with different excavation conditions by using strain monitoring and image acquisition and described the deformation and failure process of the tunnels. Concerning the ground failure law, Qin et al. [22] studied the collapse failure model caused by excavation and rainfall through a physical modeling test aimed at the mixed boulder–cobble stratum and proposed corresponding preventive and control measures. Zhang et al. [23] investigated the failure behavior of composite strata caused by tunnel excavation under seepage conditions. Liu et al. [24] employed model tests and discrete element methods to comparatively verify the progressive collapse mechanism of tunnels in composite strata and proposed a reasonable minimum rock-to-span ratio. Yang et al. [25] studied the effect of alternating soft and hard strata on the stability of rock surrounding tunnels. Meanwhile, numerical simulations also have been employed in tunnel collapse analysis. Xiang et al. [26] investigated the influences of the surrounding material (rock and soil) strengths and buried depths on the deformation and failure mechanisms through the transparent soil model test technique and PFC3D numerical simulation. Wu et al. [27] applied Particle Flow Code (PFC) to examine the mechanical response of a horseshoe shape. Liu et al. [28] adopted the discrete element method (DEM) to investigate the influence of material defects on the mechanical performance of the concrete and the progressive failure process of the lining structure opening in prismatic rock models under biaxial compression. It can be seen that the collapse mechanism of the tunnel in composite strata differs from that in isotropic media, which should be paid more attention.
Meanwhile, Kenta et al. [29] conducted a series of prototype-scale experiments to reproduce the process of cavity formation and collapse. Shiau et al. [30] investigated the problem of sinkhole stability in an ellipsoidal cavity under both blowout and collapse conditions using advanced finite element limit analysis with adaptive meshing in axisymmetric conditions. Zhou et al. [31] calculated the crack coalescence behavior, crack initiation time, and stress field around the elliptical cavity and the crack tips by using numerical simulation. Chen et al. [32] analyzed the characteristics and failure mechanisms of a railway tunnel collapse influenced by cavities. Zhao et al. [33] demonstrated that the construction deficiency of cavities around surrounding rocks played an important role in the stability of tunnel structures. It can be seen that cavities can significantly affect the stress state and stability of the tunnel.
It is worth noting that the results of the current research have been achieved, but mostly for a single stratum or composite strata without cavities [23,24,25]. The subway construction in Qingdao, Dalian, Xiamen, Nanjing, and other cities is dominated by typical soil–rock composite strata (commonly known as “soft upper and hard lower” strata). Due to the differences between soft and hard strata with cavities, there are also significant differences in the way of collapse and the progressive failure mode, and the different stratigraphic parameters make the failure behavior more complicated. Therefore, for the soil–rock composite strata with cavities, only by clarifying the evolution and characteristic law of tunnel collapse in soil–rock composite strata with cavities can we make a positive and effective response to the prevention and control of tunnel collapse. In this paper, the similar model test and DEM were adopted to study the collapse mechanism at different soil–rock interface locations and different cavity locations. Based on the test results, a safe thickness is proposed, which can provide a reference for disaster prevention and control.
2. Model Test Method
2.1. Test Apparatus
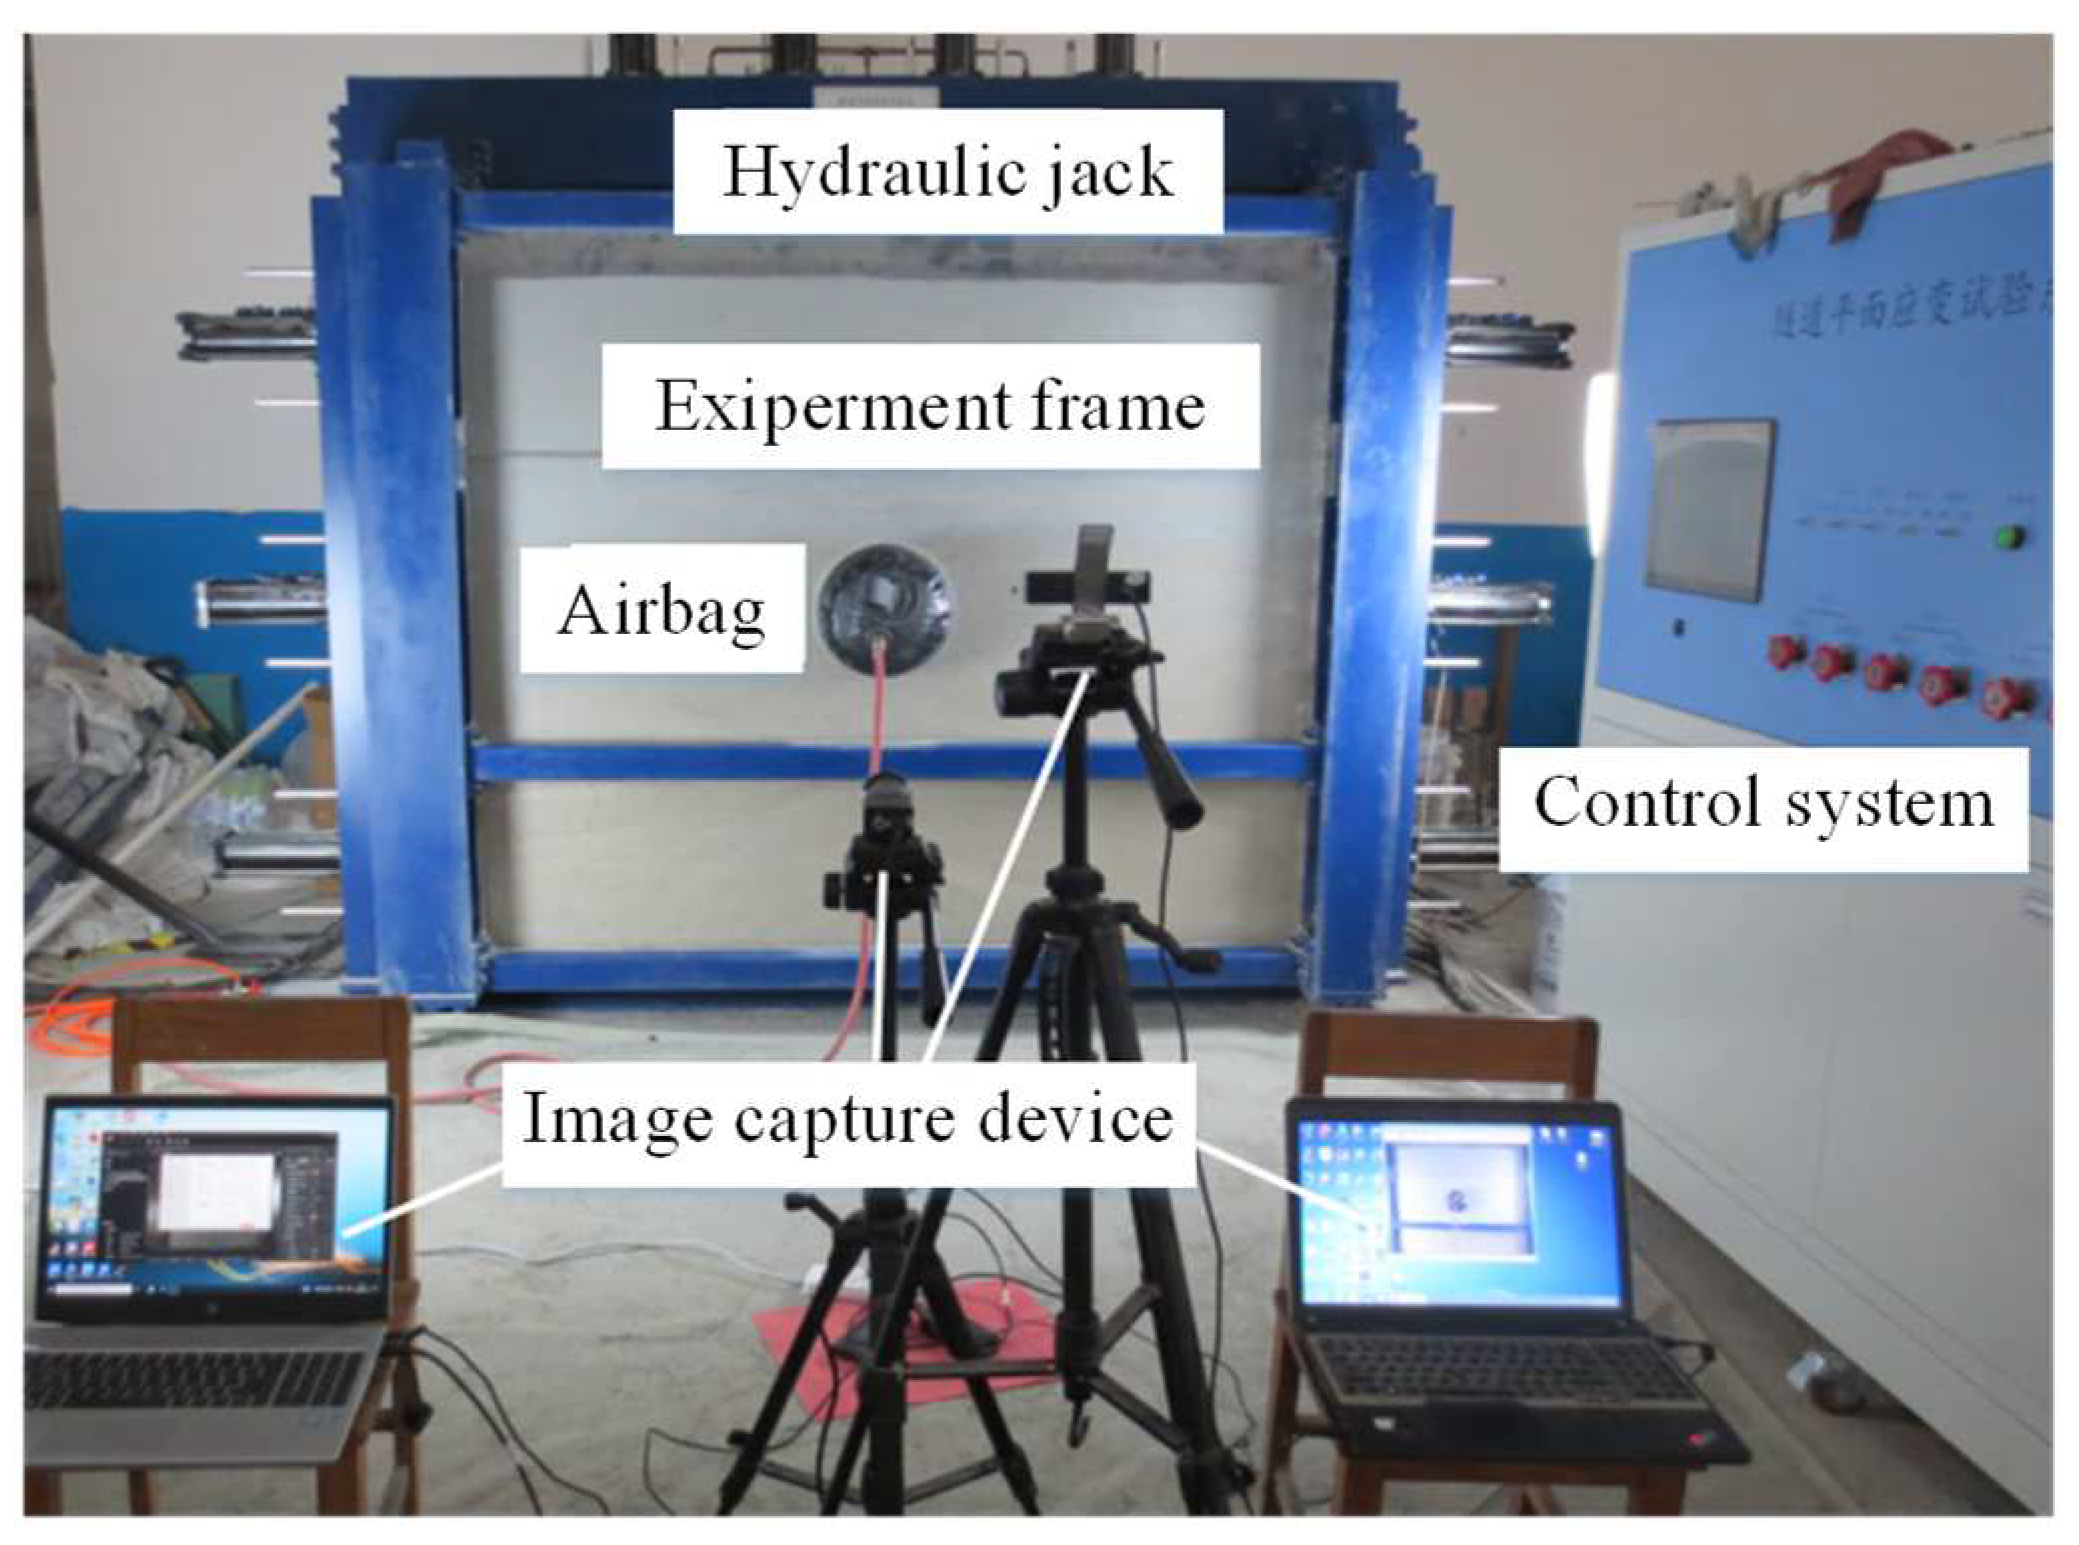
The whole test system includes a tunnel plane strain test system, airbag unloading system, and image monitoring system, as shown in Figure 1. The inner chamber of the test frame is 1.8 m × 0.3 m × 2.0 m (length × width × height), and the front wall of the test frame is a 3 cm thick plexiglass plate, which is convenient for observing the gradual collapse process of the stratum during the test. A hole with a diameter of 30 cm was reserved on the front side of the Plexiglas plate, and the airbag was placed in the middle position. The surface of the inner steel plate was covered with smooth tin foil to minimize the influence of boundary effects. The airbag was connected to the air compressor through a pressure valve, and the pressure value inside the airbag was regulated through the pressure valve. After the model box was filled, the pressure was gradually released through the pressure valve to simulate the stress release process during tunnel excavation.
2.2. Similar Law
To truly and accurately reflect the actual engineering situation, the model test needs to determine a suitable similarity relationship with the prototype. Considering the feasibility and economy of the test, the geometrical similarity ratio of the model was finally chosen to be 1:20 and the density ratio was 1:1 for the test. When these two parameters are fixed, the ratios of other physical quantities can be obtained [25,34]. The similarity conditions in the test are shown in Table 1.
Since mixtures of artificial materials have been proven to be suitable for scaling model tests, based on the research results of similar materials for existing model tests, barite powder, quartz sand, and petroleum jelly were selected as raw materials to formulate similar materials for surrounding rocks [35,36]. Through a series of tests, the mixing ratios of the soft soil layer and hard rock layer were determined as 8:5:0.6 and 10:4.8:1, respectively. According to the actual background of the soil–rock composite stratum in Qingdao Metro, the mixture can reproduce the properties of soil and rock. The mechanical parameters of the simulated materials obtained through triaxial tests are shown in Table 2.
2.3. Test Scheme
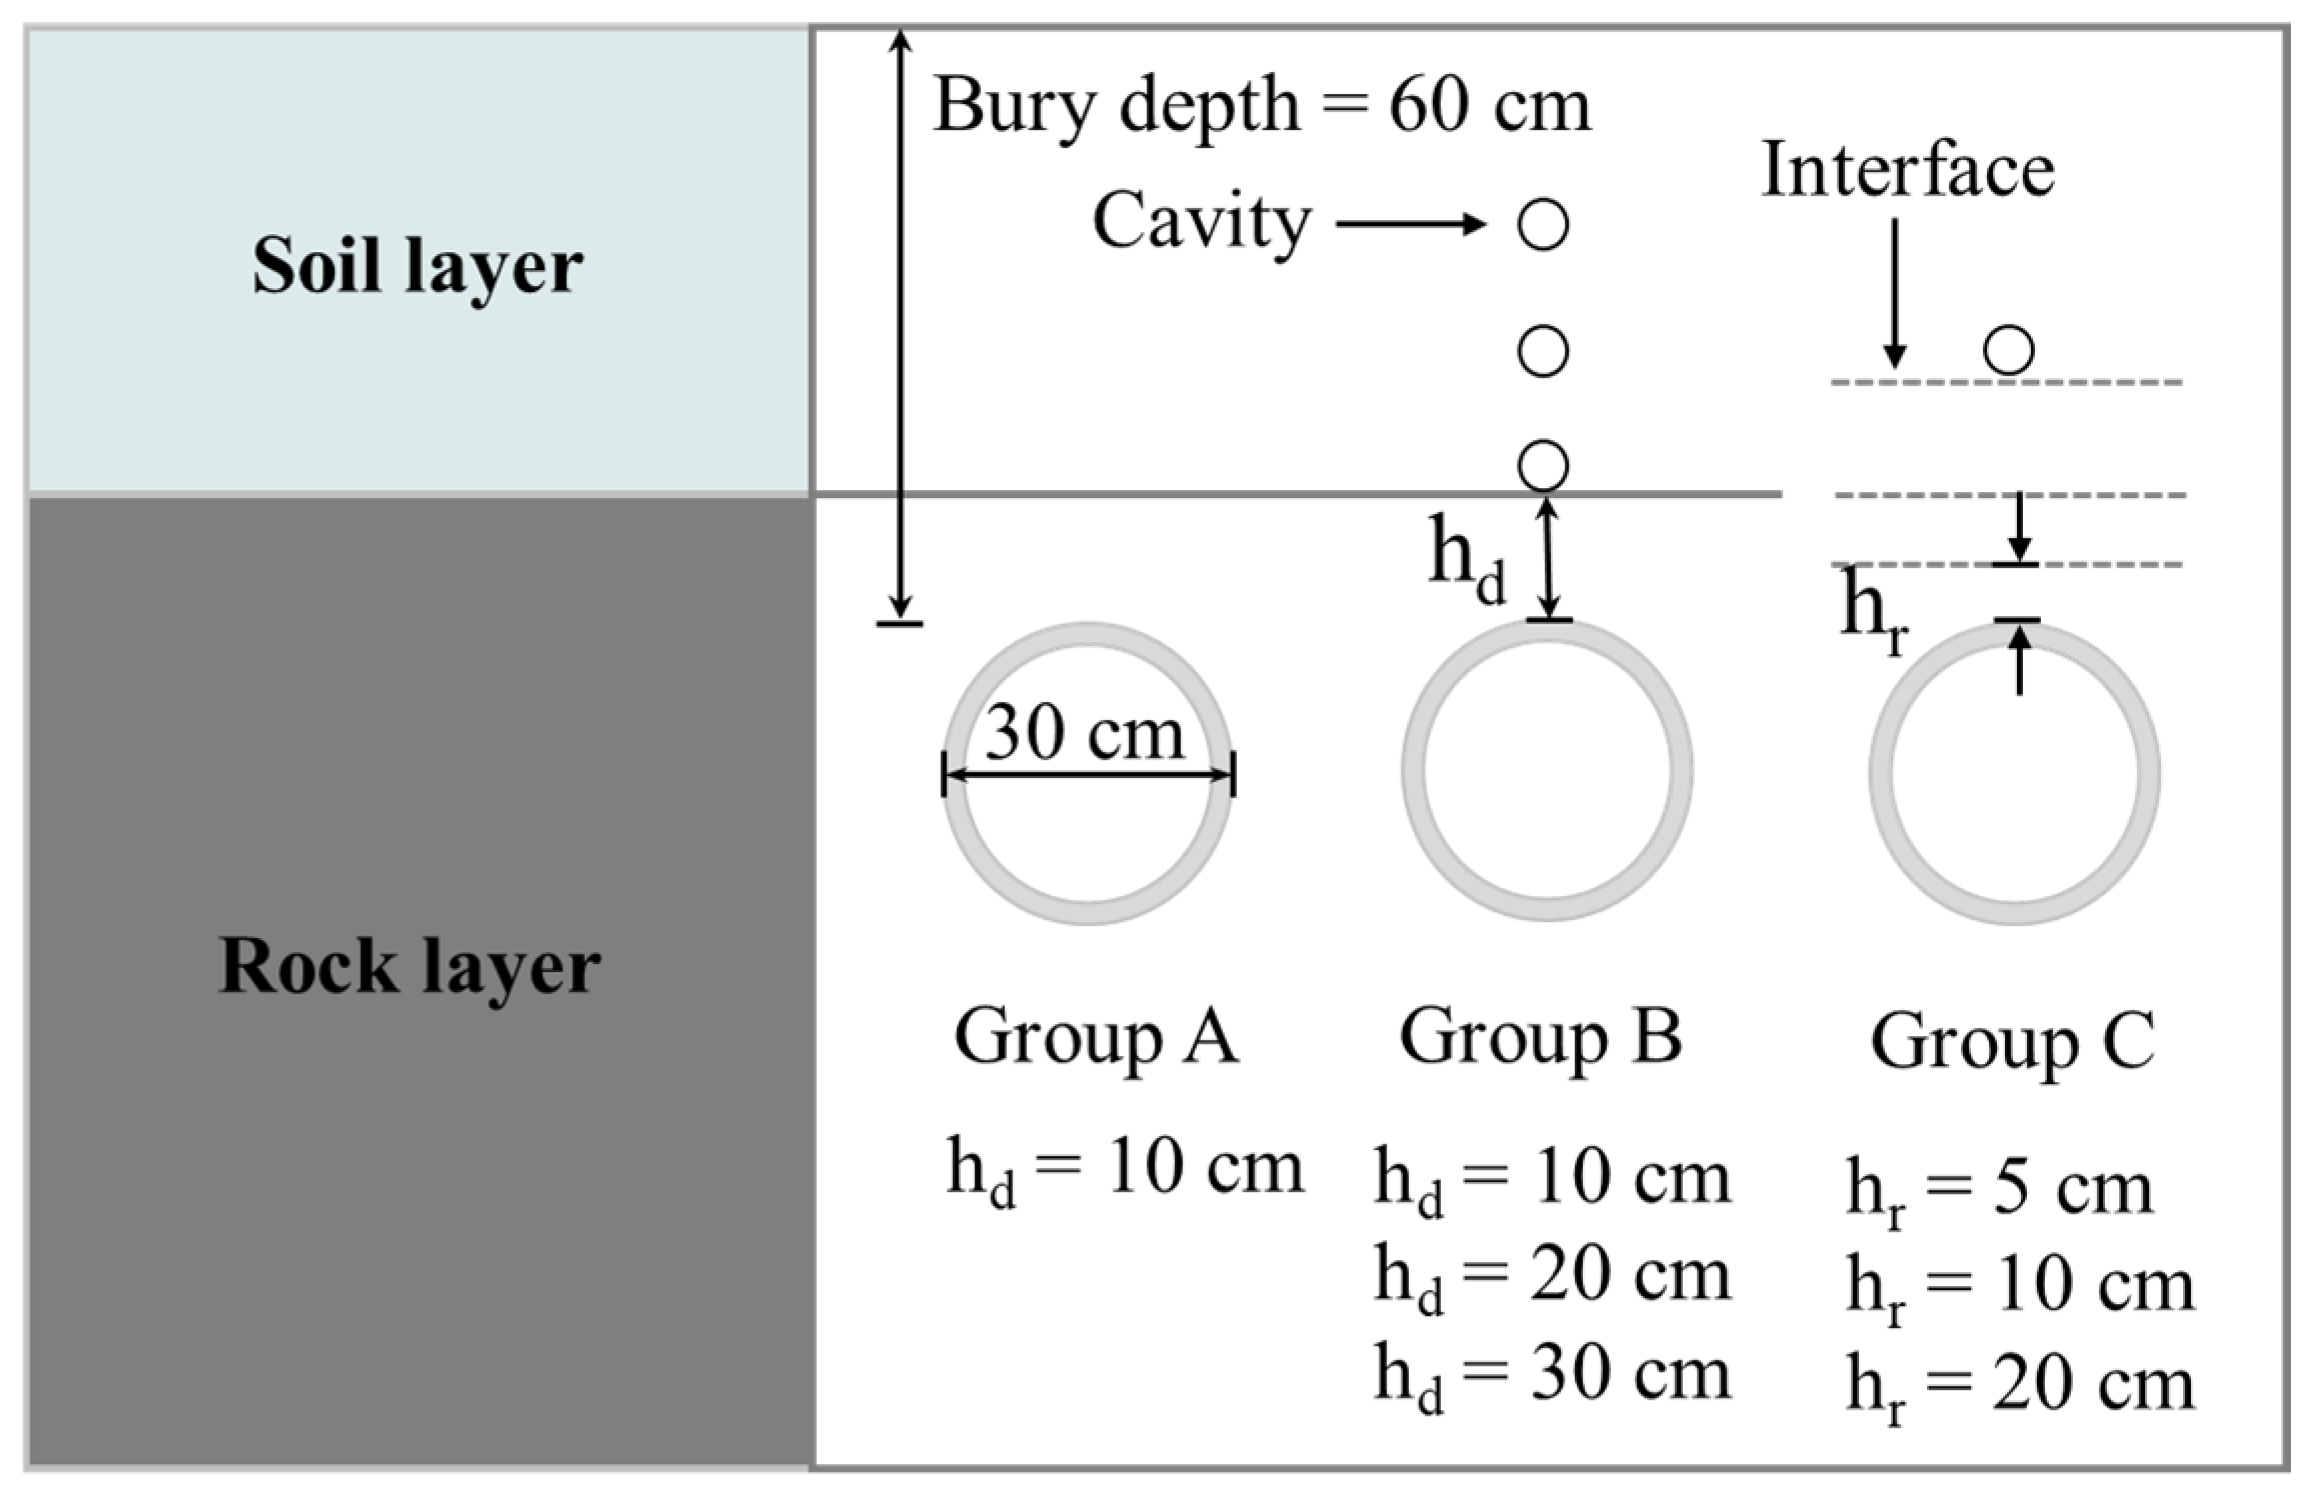
According to the geological exploration data of Qingdao subway, the buried depth of the study tunnel is between 11.5 m and 12.8 m, and the thickness of hard rock above the tunnel roof is between 0.3 and 3.8 m; therefore, the buried depth of the test tunnel is 60 cm, and the diameter (D) is 30 cm, which corresponds to the prototype tunnel with a diameter of 6 m and a buried depth of 12 m. The main purpose of this test was to study the influence of void location and overburdened rock thickness on the collapse of the tunnel, to simplify the tunnel surrounding rock into two homogeneous materials, the soil layer and rock layer, and to simplify the tunnel section into a circle, and the specific test scheme is shown in Table 3. During the model testing process, the thickness of the rock layer was increased to achieve the desired simulation changes after each condition was completed, as shown in Figure 2.
3. Model Test Results
3.1. Effect of Distance between Cavity and Vault in Model Test
This group of tests is to study the destabilization and failure law of composite strata when the ground cavity and the tunnel have different clearances. In Case 1, the strata do not contain cavities and are used for comparison. In all other conditions, except Case 1, the strata contain cavities, which are 10 cm, 20 cm, and 30 cm away from the vault, respectively.
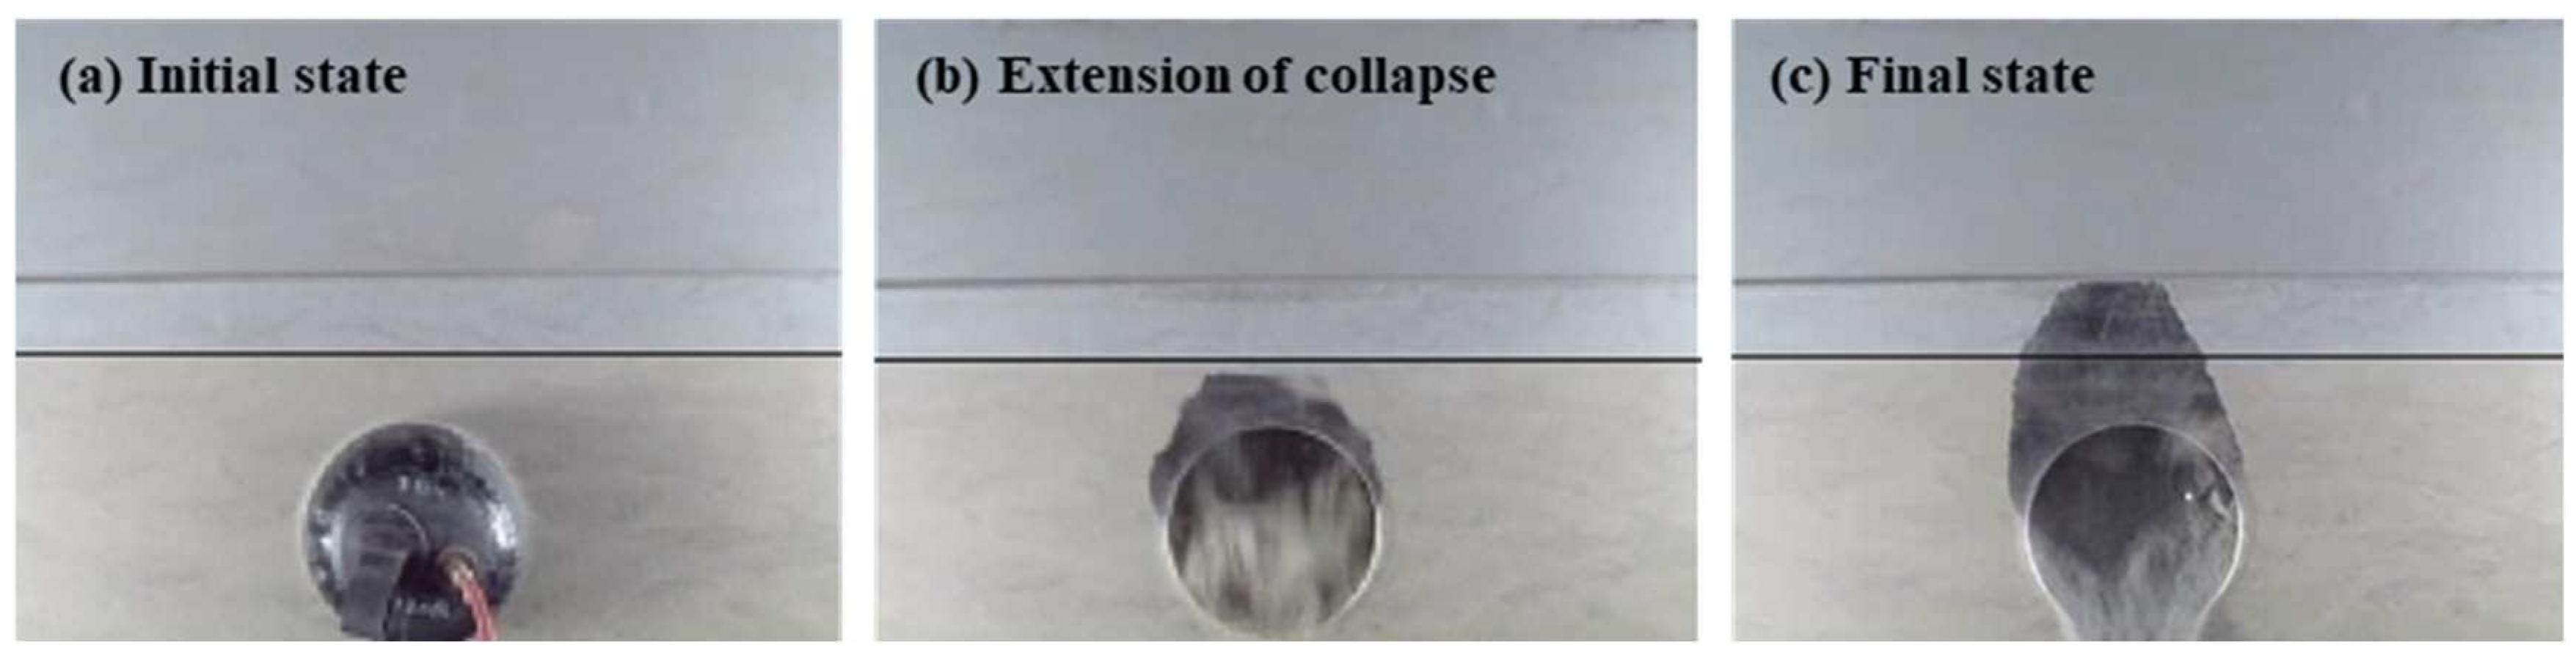
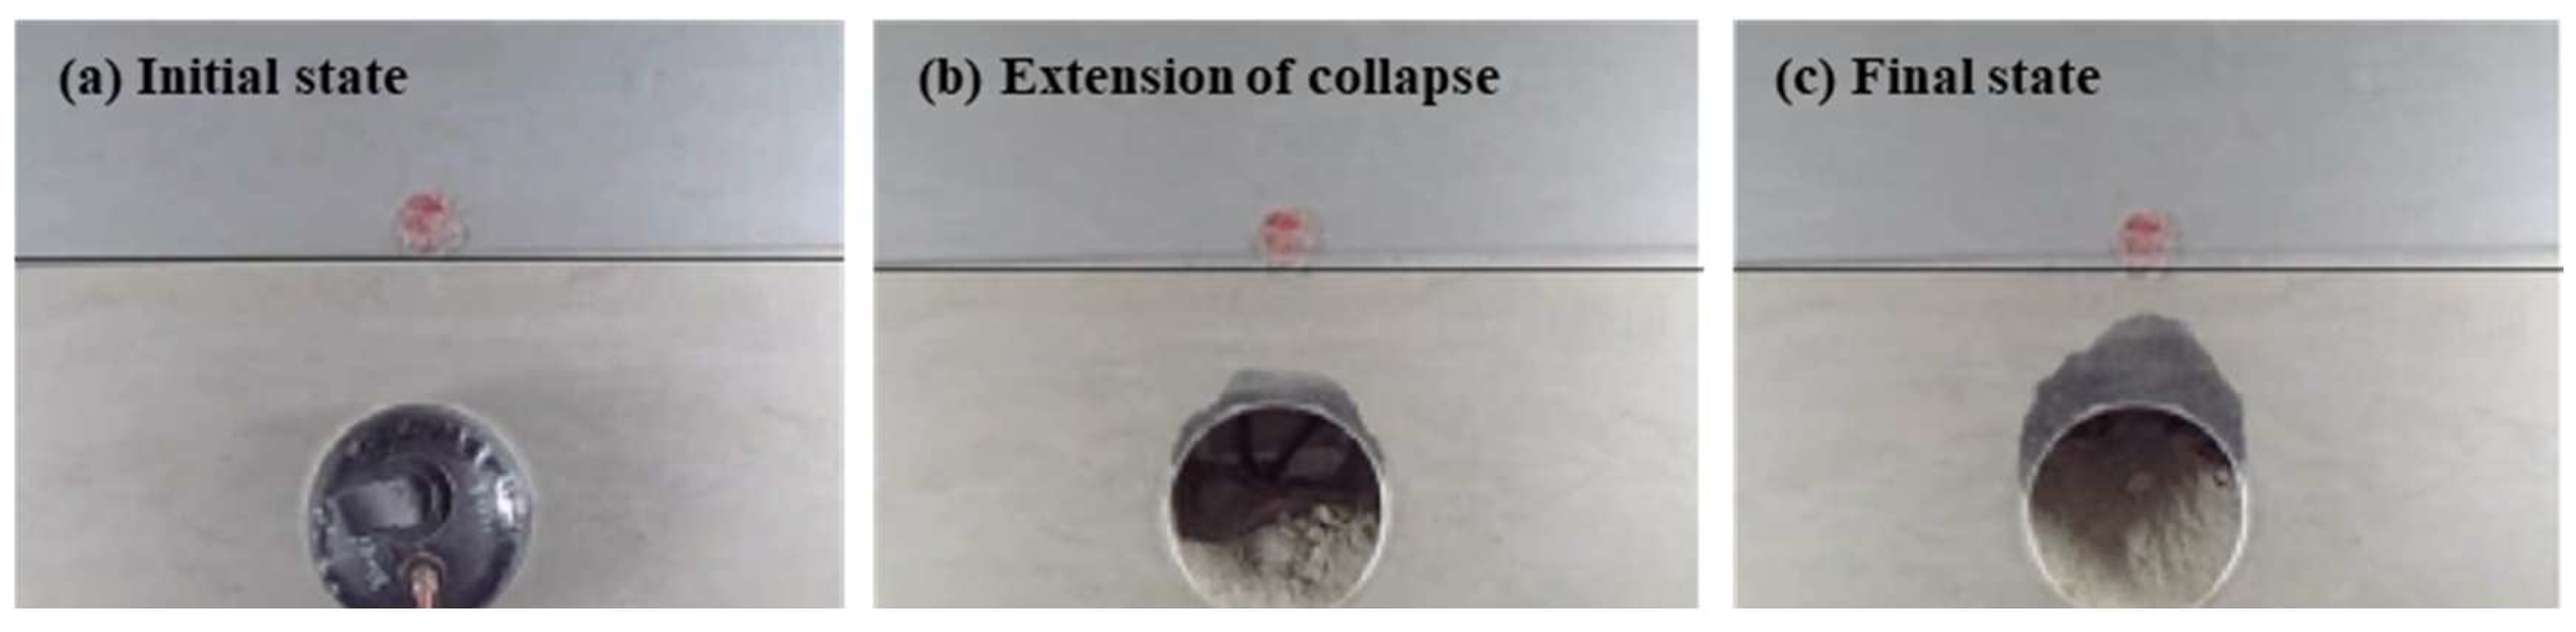
Figure 3, Figure 4, Figure 5 and Figure 6 illustrate the detailed collapse process for Cases 1–4, where the soil–rock interface is marked by a solid black line. The three main stages of the collapse process were taken from left to right in each figure, which were the initial stage, the ground collapse stage, and the final collapse stage. When there was no cavity in the strata, the collapse first occurred at the location of the tunnel vault as the airbag was unloaded, and then gradually progressed to the soil–rock interface. Subsequently, the collapse continued to the soil layer and a stable collapsed arch is formed finally with a height of 20.1 cm, that is, 0.67 D.
When the hd was 10 cm, a through crack was formed between the vault and the cavity as the airbag was unloaded. After the airbag was pulled out, the top and sides of the tunnel dropped blocks. The collapse then extended to the location of the stratum cavity, and the stratum was rapidly destabilized, causing more extensive damage. The height of the final collapsed arch was also larger, with a height of 24.5 cm, or 0.82 D, which was larger than the collapsed arch in the no-cavity condition.
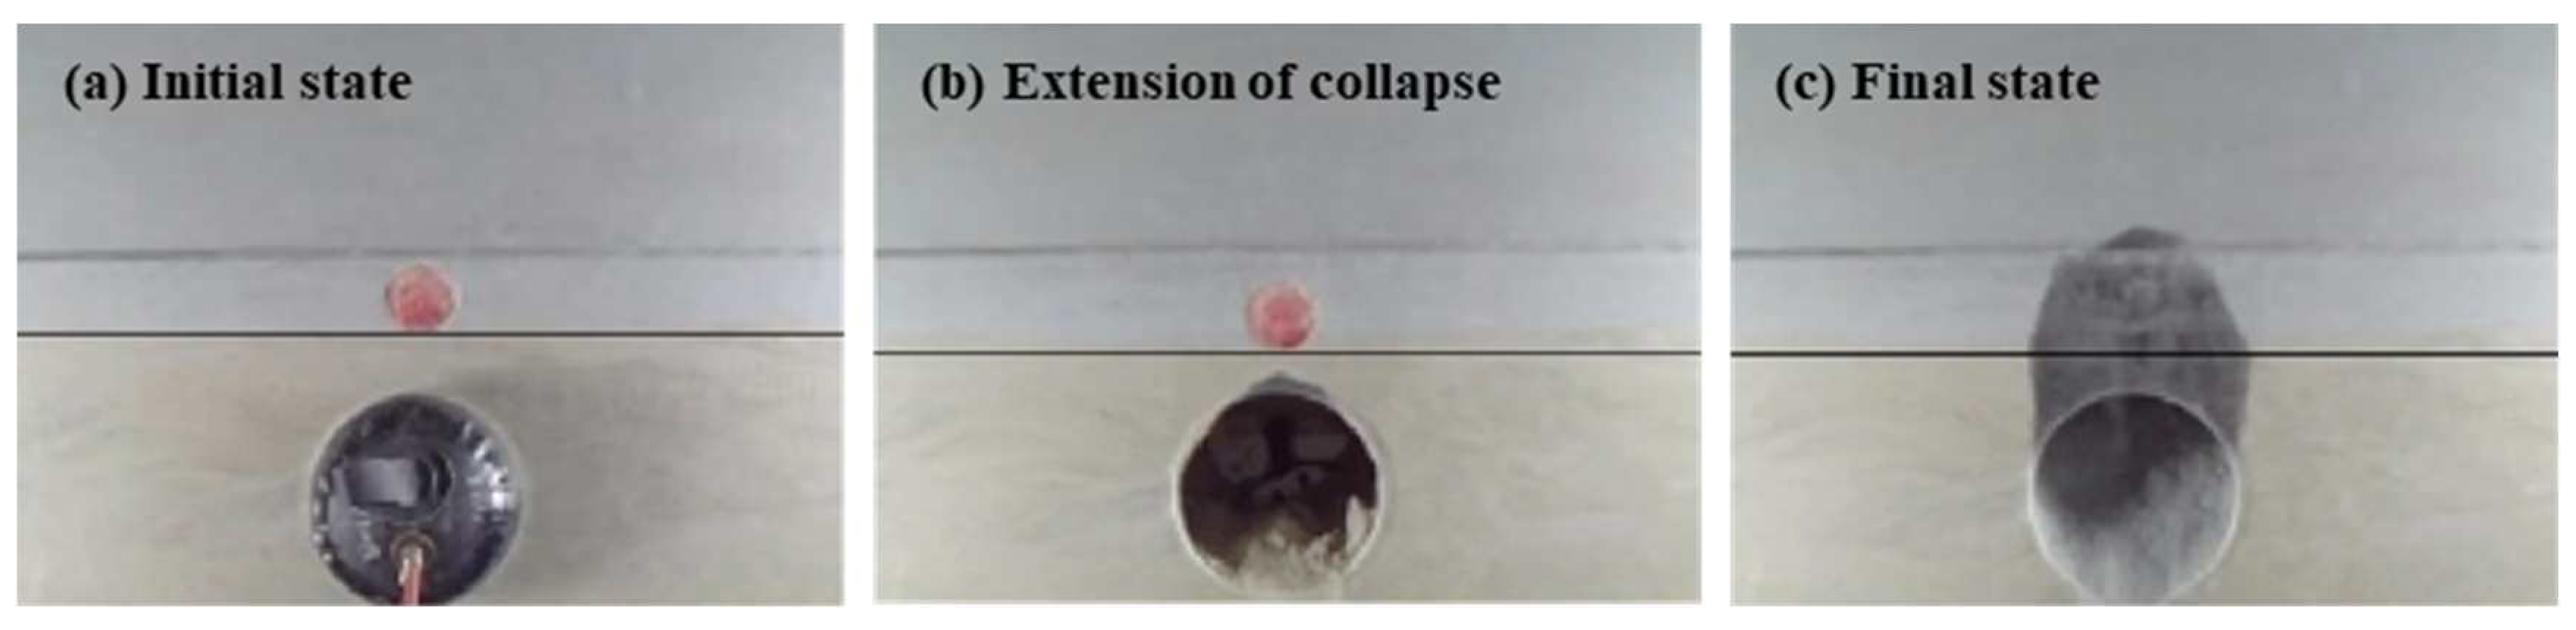
When the hd was 20 cm, the collapse process was similar to Case 2. The collapse developed upwards and formed a temporary stabilized collapsed arch. The presence of the ground cavity led to the creation of joint cracks between the arch and the cavity, and the soil layer was gradually destabilized and damaged. A larger collapse was formed above the temporary arch, and the two collapses were superimposed, resulting in a stable collapsed arch with a height of 35.6 cm, that is, 1.2 D.
When the hd was 30 cm, there was no through crack between the tunnel and the ground cavity after the airbag unloading. With the prolonged collapse, the rock block dropped at the tunnel vault. Then, the collapse interface gradually developed towards the soil–rock interface, accelerating the destruction speed and forming a stable collapsed arch. Finally, the height of the collapsed arch was 20.6 cm, corresponding to 4.12 m (0.69 D) of the actual prototype, which is close to the results of condition 1.
3.2. Effect of the Distance between Interface and Vault in Model Test
This group of tests is to study the destabilization and failure law of composite strata when the interfaces of the strata and the tunnel are at different clearance distances. The distance between the cavity and the vault is fixed at 20 cm, and the distance between the interface is 5 cm, 10 cm, and 20 cm, respectively.
As shown in Figure 7, the collapse started in the rock layer and then reached the soil layer when hr = 5 cm. When the collapse reached the location of the cavity, the collapse developed upward rapidly and finally formed a stable collapsed arch with a height of 39.1 cm, that is, 1.3 D, which was greater than the height of the final state collapsed arch in Scenario 3 (Figure 8). When hr = 20 cm (Figure 9), the top of the arch and the shoulder of the arch first collapsed and then developed upwards to form an arch. A stable collapsed arch was formed in the rock layer. The collapse did not continue because the top of the collapsed arch did not develop to the soil–rock separation interface. The final height of the collapsed arch was 13.2 cm, which corresponds to 0.44 D.
It is worth noting that the collapse behavior in composite strata under seepage conditions [23], upper soft and lower hard composite strata [24], and alternating soft and hard strata [25] is significantly different from the collapse mechanism in strata with cavities. The presence of cavities deteriorates the stratigraphic conditions and exacerbates the area of collapse.
4. Numerical Simulation of Failure Pattern
The finite element method is suitable for analyzing deformable media. However, the limitations of the classical finite element method make it inadequate for accurately simulating the failure process of formation instability. This is due to its inability to account for the intricate interplay between particles, highly nonlinear behavior, and other factors such as large deformation and discontinuity in rock mass [37,38,39]. The Particle Flow Code (PFC), proposed by American scholar Cundall [40], is a computational method that simulates rock masses by setting a large number of particles to simulate the movement and interaction between particles, thus providing a better simulation of the process of strata instability and failure [24]. At present, the PFC, a leading discrete element tool, has been widely applied to the simulation analysis and microscopic mechanism of soil deformation and particle migration. The PFC has also been widely used in tunnel collapse [41,42,43,44]. The primary concern in numerical analysis using the Particle Flow Code (PFC) is the calibration of micro-scale parameters.
In this study, the relevant macroscopic parameters were obtained through biaxial numerical simulation tests embedded in the PFC2D 5.0 software and were subsequently compared with the macroscopic parameters of the actual prototype rock mass. Subsequently, the micro-scale parameters were adjusted to ensure that the stress–strain curves outputted by PFC2D closely matched the measured values. Through extensive tuning, the specific micro-scale parameters for both soil and rock particles were ultimately determined, as detailed in Table 4.
4.1. Model Establishment
This section utilizes the Particle Flow Code (PFC) 2D 5.0 numerical analysis software to simulate the process of instability and failure in composite soil–rock strata with defects induced by subway tunnel construction. In the PFC simulation process, the time step is set to 1 to accelerate computation. To avoid removing suspended particles, the radius of suspended particles is increased by 1.1 times each time. Then, the suspended particles are traversed again. If there are still suspended particles, the radius is increased again. After dividing the particles into two groups, gravity and cohesion are applied, and the microscopic parameters of each group of particles are set. After a certain number of calculation cycles, equilibrium is achieved. The aim is to investigate the effects of different distances between stratum defects and tunnel clearances, as well as the ratio of rock to span, on the process of instability and failure in composite strata. Additionally, variations in strata settlement under different conditions are analyzed. The numerical simulation process involves defining microscopic parameters of soil and rock particles to simulate their respective layers. By altering the range of microscopic parameters assigned to the particles, various conditions can be simulated. The specific simulation schemes are detailed in Table 5.
4.2. Numerical Results Analysis
4.2.1. Effect of Distance between Cavity and Vault in Numerical Simulation
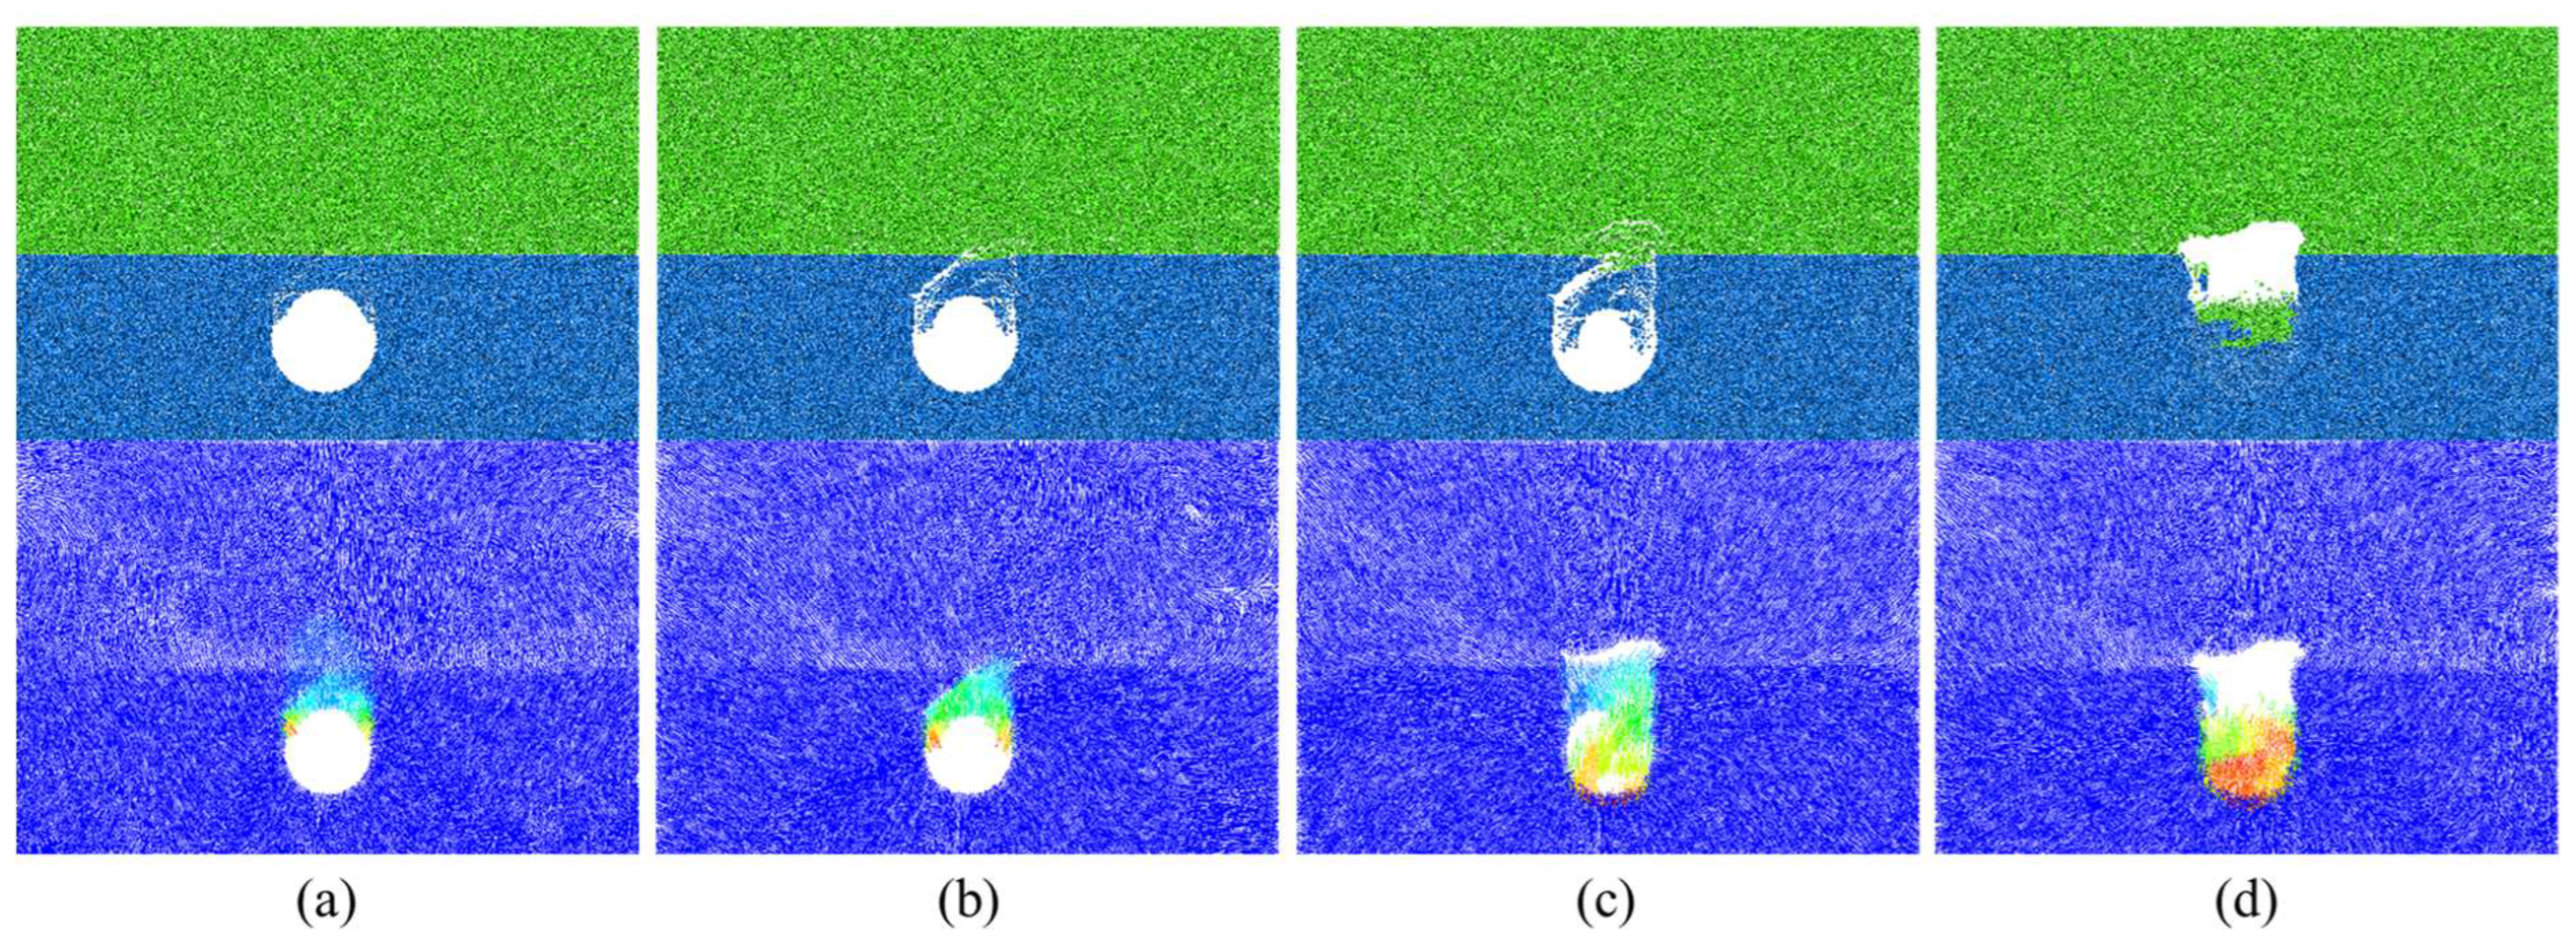
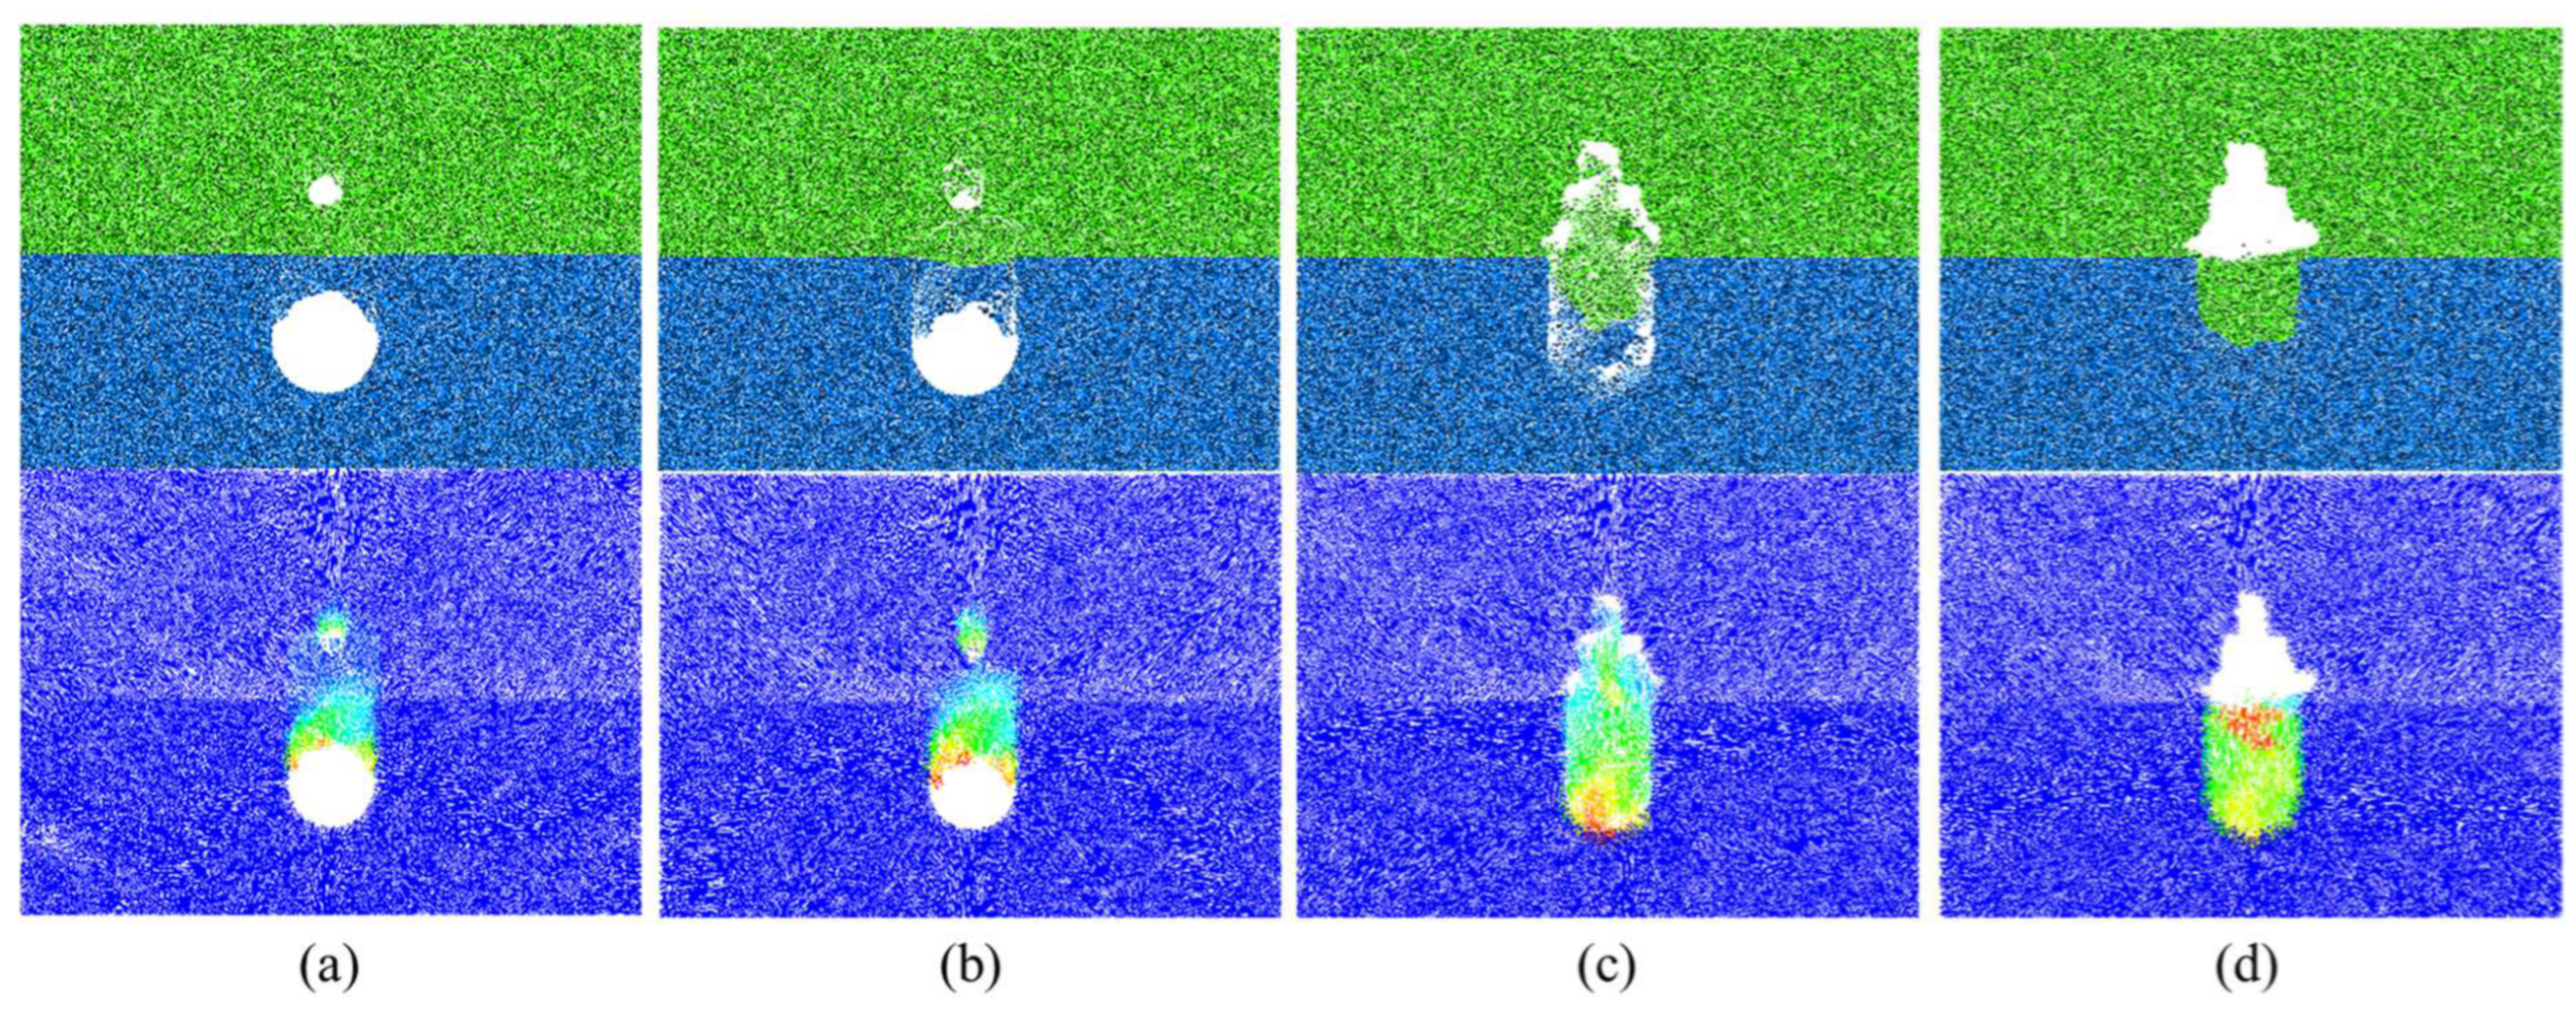
As shown in Figure 10, the composite strata instability and failure process diagram for Scheme A is presented. The above figures depict the inter-particle instability and failure process, while the below figures illustrate the corresponding instantaneous displacement vector for each cycle, reflecting the direction and magnitude of particle displacement during simulation moments. By combining the analysis of the tunnel surrounding rock instability and failure process with the inter-particle instability and failure process diagram, the calculation reaches a relative equilibrium state as set by the PFC software. It was observed that under the condition of no defects in the strata, with an overlying rock layer thickness of 2 m and a soil layer thickness of 13 m, the vertical displacement of the ground surface after tunnel excavation was minimal, exhibiting overall subsidence without cracking or sinkhole collapse. From tunnel excavation to the calculation of 2000 cycles, the damage to the tunnel cavity began from the top and sides of the tunnel. More blocks were falling from the top compared to the sides, but the rate of development of loose particles was very slow at this stage. Upon reaching 4000 cycles, the top block of the tunnel cavity continued to develop, and loose particles gradually extended to the soil layer. By the time 6000 cycles were reached, loose particles had extended to the soil layer, and the rate of block falling began to accelerate, attributed to the weaker physical properties of the soil layer compared to the rock layer. After loose particles extended to the soil layer, the rate of block falling accelerated. When the relative equilibrium state was reached, a stable collapsed arch was formed in the tunnel chamber, and the height of the collapsed arch was 3.94 m (0.66 D). The numerical simulation results were consistent with the model test results, which verified the feasibility of the numerical simulation of PFC.
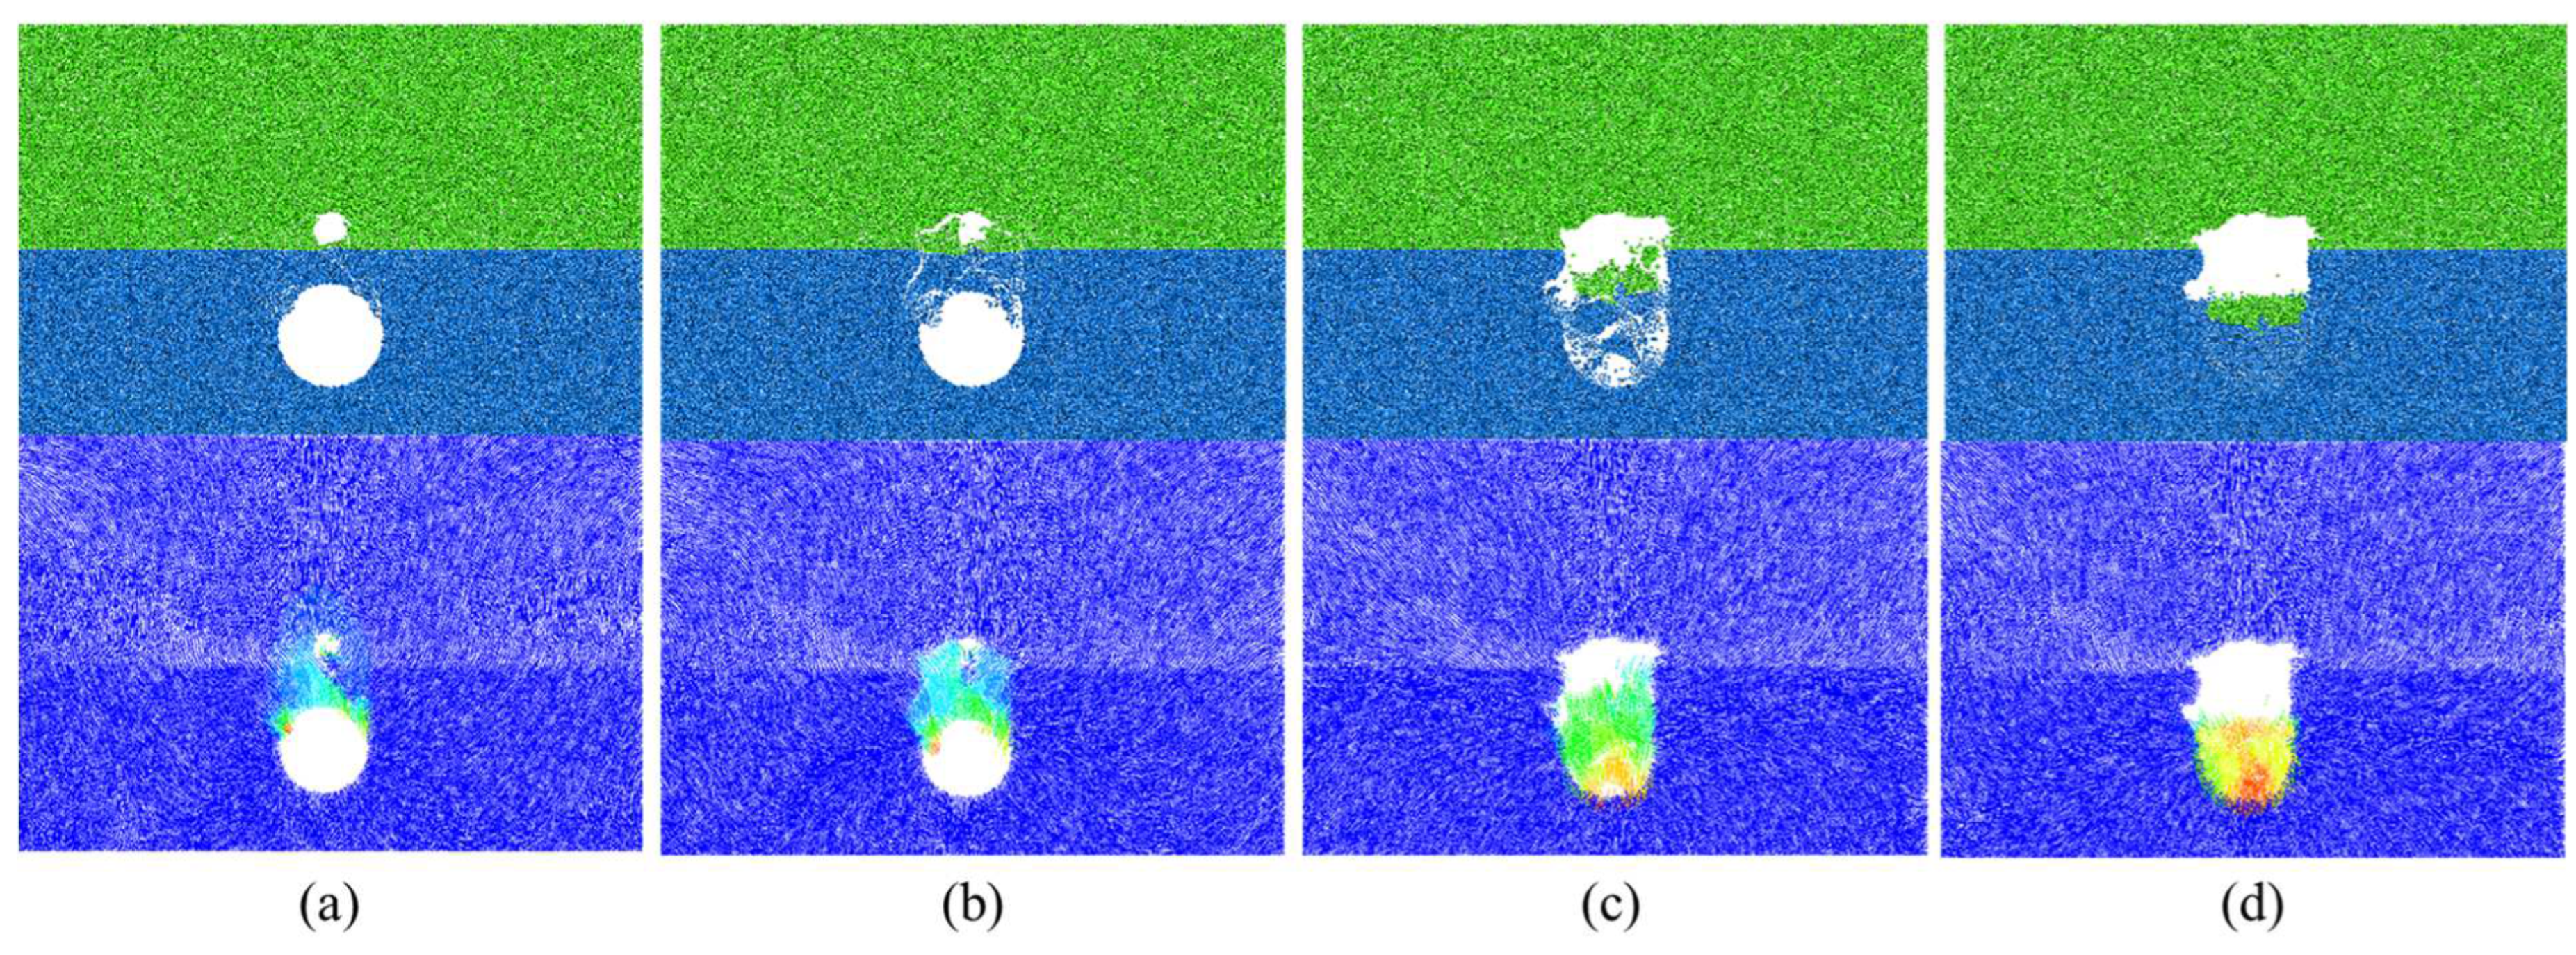
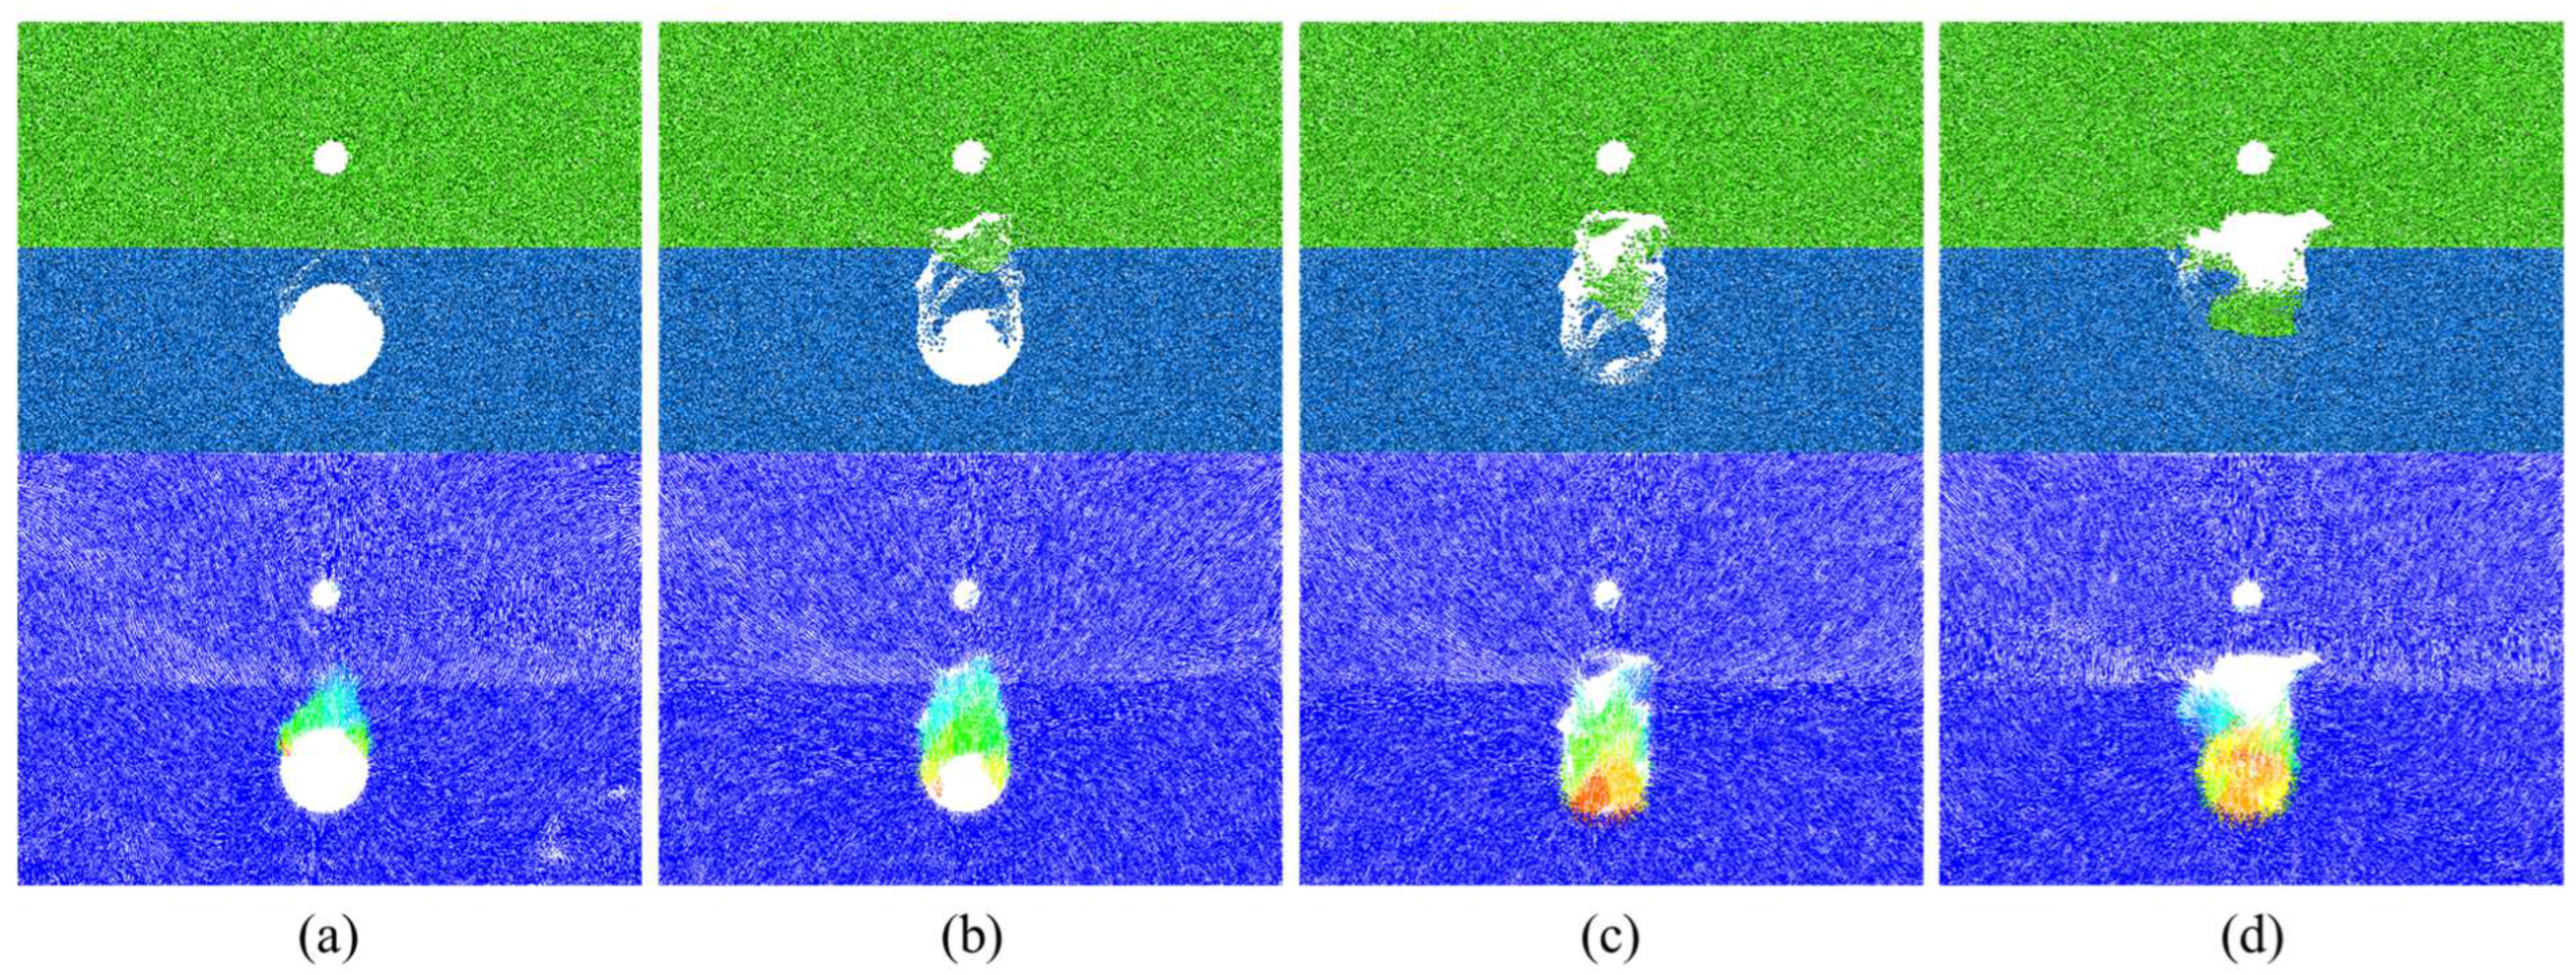
It can be seen from Figure 11 that under the condition of a stratum defect with a tunnel clearance of 2 m (1/3 D), an overlying rock layer thickness of 2 m, and a soil layer thickness of 13 m, compared to Scheme A without stratum defects, when both schemes were calculated up to 2000 cycles, Scheme B exhibited more blocks falling from the top and sides of the tunnel cavity, and the overall subsidence of the composite strata after tunnel excavation was greater. This was because the presence of the stratum defect weakened the stability of the composite strata, accelerated the rate of strata destruction, and led to the generation of penetrating cracks between the tunnel cavity and the stratum defect. By the time 4000 cycles were reached, loose particles had extended to the soil layer, indicating the instability and initiation of destruction of the stratum defect. In contrast, it was not until 6000 cycles that loose particles extended to the soil layer in Scheme A, demonstrating that within the influence range of the collapsed arch of the tunnel cavity caused by the stratum defect, the collapsed arches of both the tunnel cavity and the stratum defect were superimposed, accelerating the destruction of the composite strata. Upon reaching 6000 cycles, the stratum defect became completely unstable, with a large number of soil particles falling, and a rapid destruction rate was observed around the tunnel cavity. When reaching a relative equilibrium state, a stable collapsed arch formed in the tunnel cavity, with a collapsed arch height of 4.32 m (0.72 D), greater than that of the condition without defects. This was because the stratum defect in this condition was within the range of the collapsed arch of the tunnel cavity, and the collapsed arches of the stratum defect and the tunnel cavity were superimposed, resulting in a greater collapsed arch height under the final stable state compared to the condition without defects.
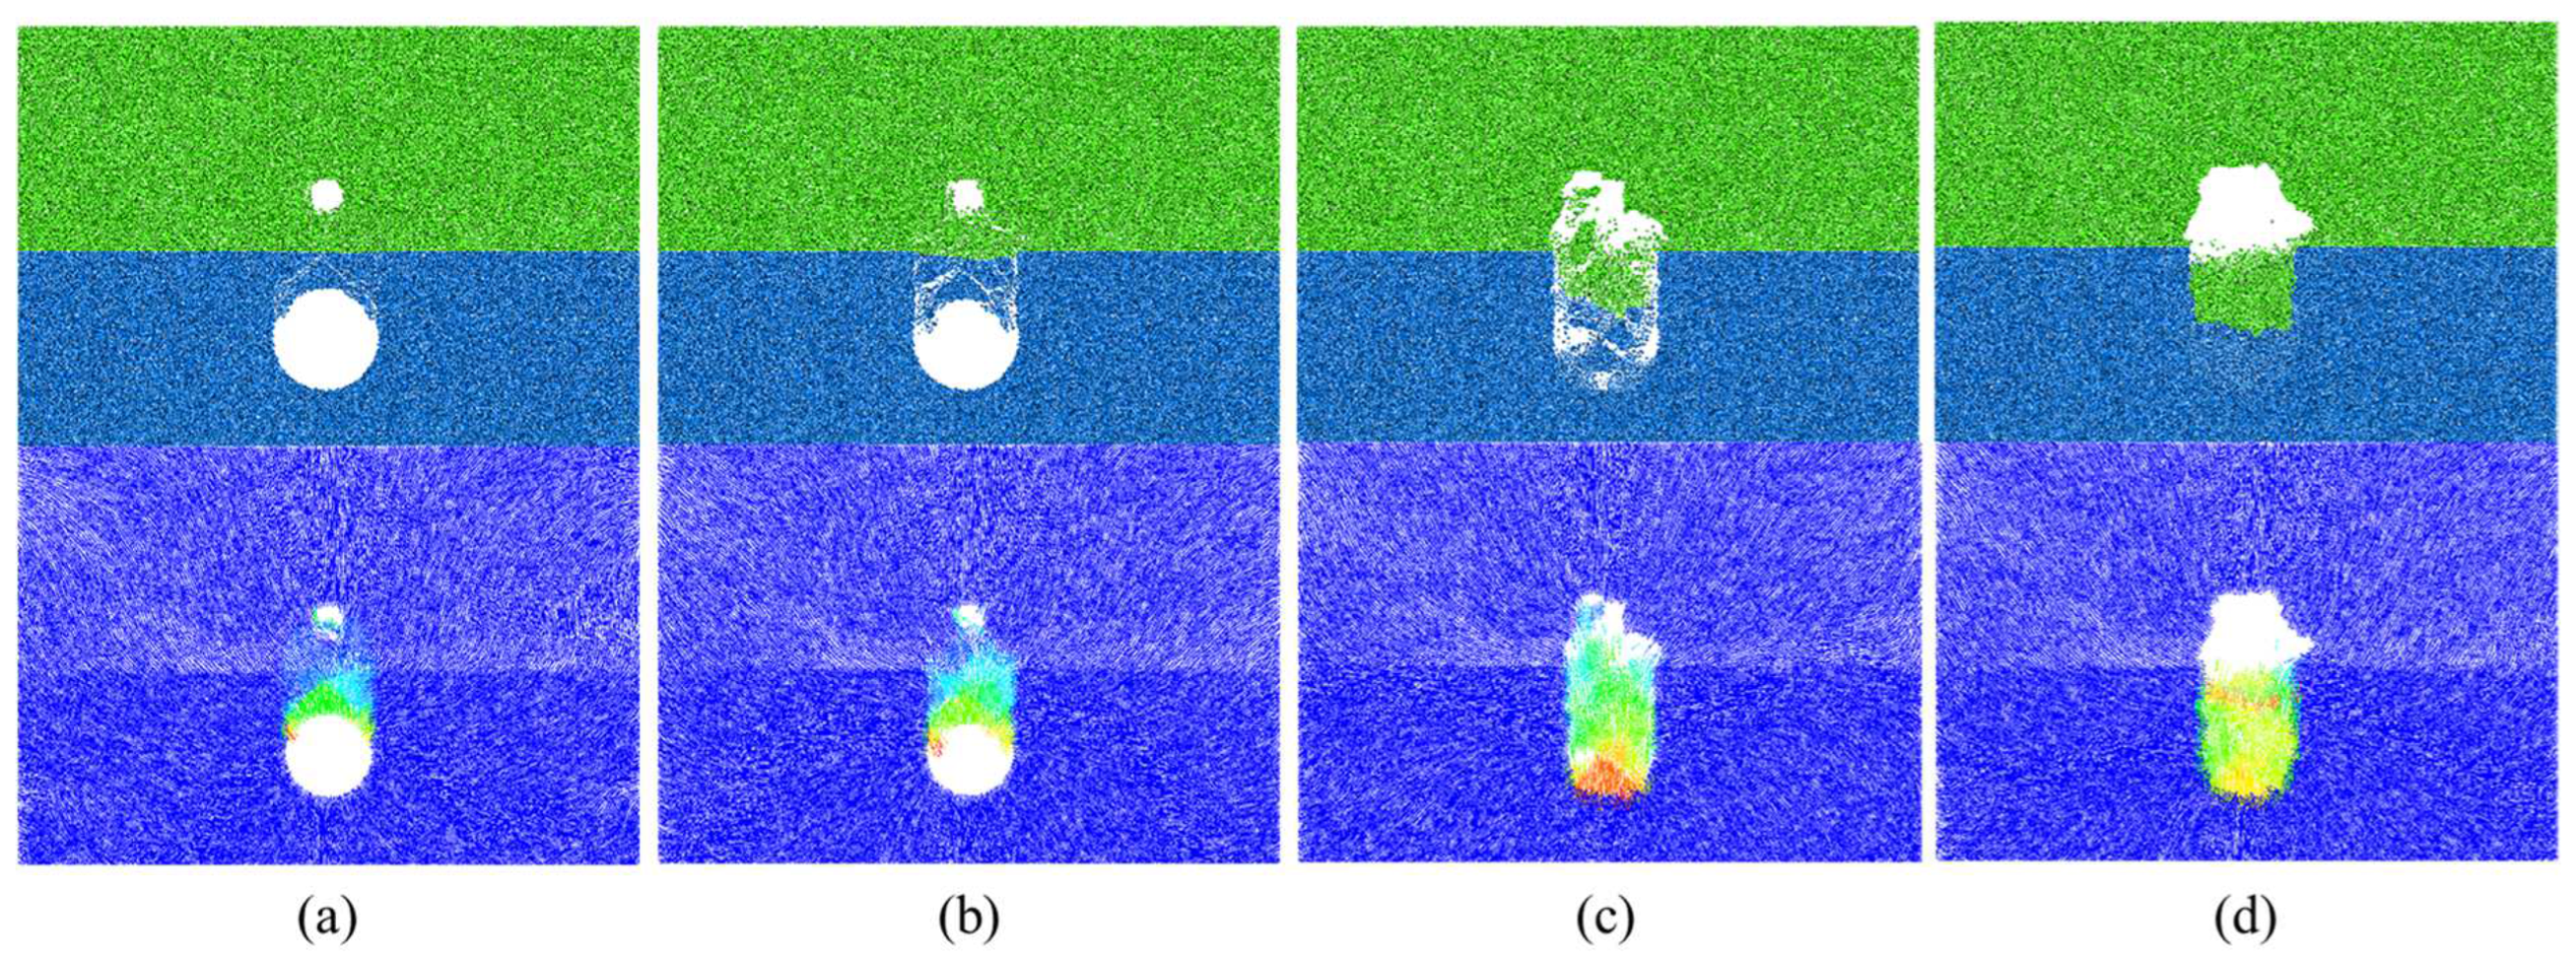
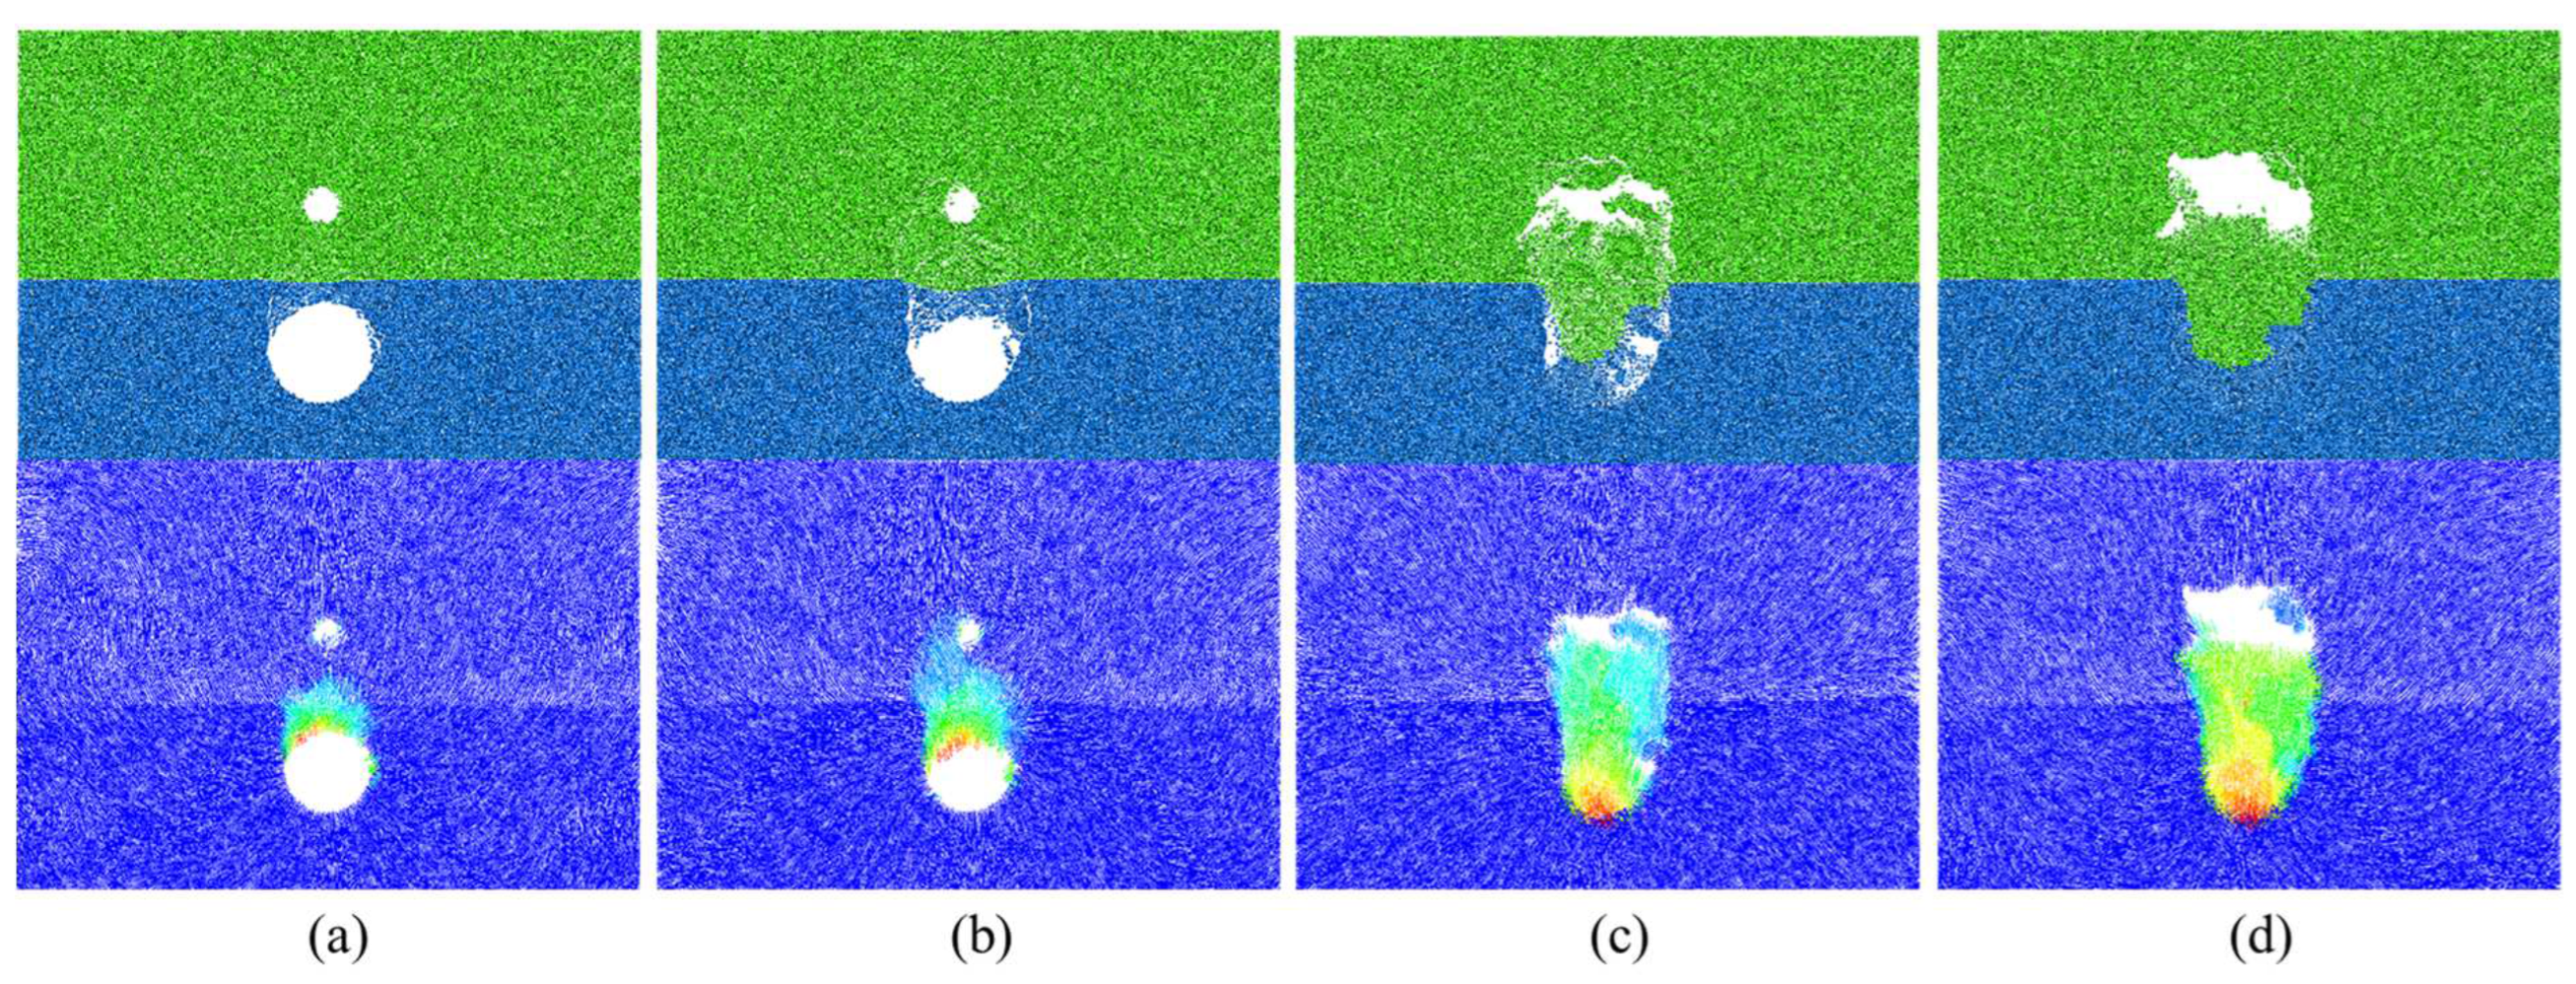
Figure 12 illustrates the composite strata instability and failure process for Scheme C. By the time 2000 cycles were reached, similar to the previous two schemes, the composite strata underwent overall subsidence after tunnel excavation. The top and sides of the tunnel cavity exhibited damage before the stratum defect, and penetrating cracks gradually developed between the tunnel cavity and the stratum defect. The rate of development of loose particles in Scheme C was slower than that in Scheme B. This was because the stratum defect was further away from the tunnel cavity in Scheme C, resulting in a relatively slower rate of connection between the stratum defect and the tunnel cavity. By the time 4000 cycles were reached, loose particles gradually extended to the soil layer, with only a small amount of particles falling around the stratum defect, but the system remained in a relatively stable state. Numerous penetrating cracks developed between the tunnel cavity and the stratum defect. Upon reaching 10,000 cycles, the development of loose particles gradually completed until reaching a final relative equilibrium state, forming a stable collapsed arch in the tunnel cavity, with a collapsed arch height of 6.74 m (1.12 D), greater than the final collapsed arch height in Scheme B. In this condition, the stratum defect was 4 m away from the tunnel cavity, and the height of the collapsed arch under the condition without defects was also 4 m in Scheme A. Therefore, the stratum defect was external to the collapsed arch of the tunnel, and the influence range of the stratum defect and the collapsed arch of the tunnel cavity was large, resulting in a larger damage range.
In the model experiments, the critical value of the clearance was found to be 4 m (2/3 D), indicating that when the stratum defect was external to the collapsed arch of the tunnel, the two collapsed arches had the largest overlap influence range. However, due to the large workload of model experiments, the conditions of the model experiments were not comprehensive enough. In reality, when the stratum defect is at a certain small distance from the tunnel collapsed arch, the two collapsed arches can still overlap. At this time, the overlap influence range of the two collapsed arches was the largest, thus obtaining the most unfavorable clearance. Therefore, a large number of numerical simulations were conducted within the range of 4–6 m for the clearance between the stratum defect and the tunnel. Eventually, it was found that when the clearance between the stratum defect and the tunnel was 4.5 m (3/4 D), the overlap influence range of the collapsed arches of both the tunnel and the stratum defect was the largest.
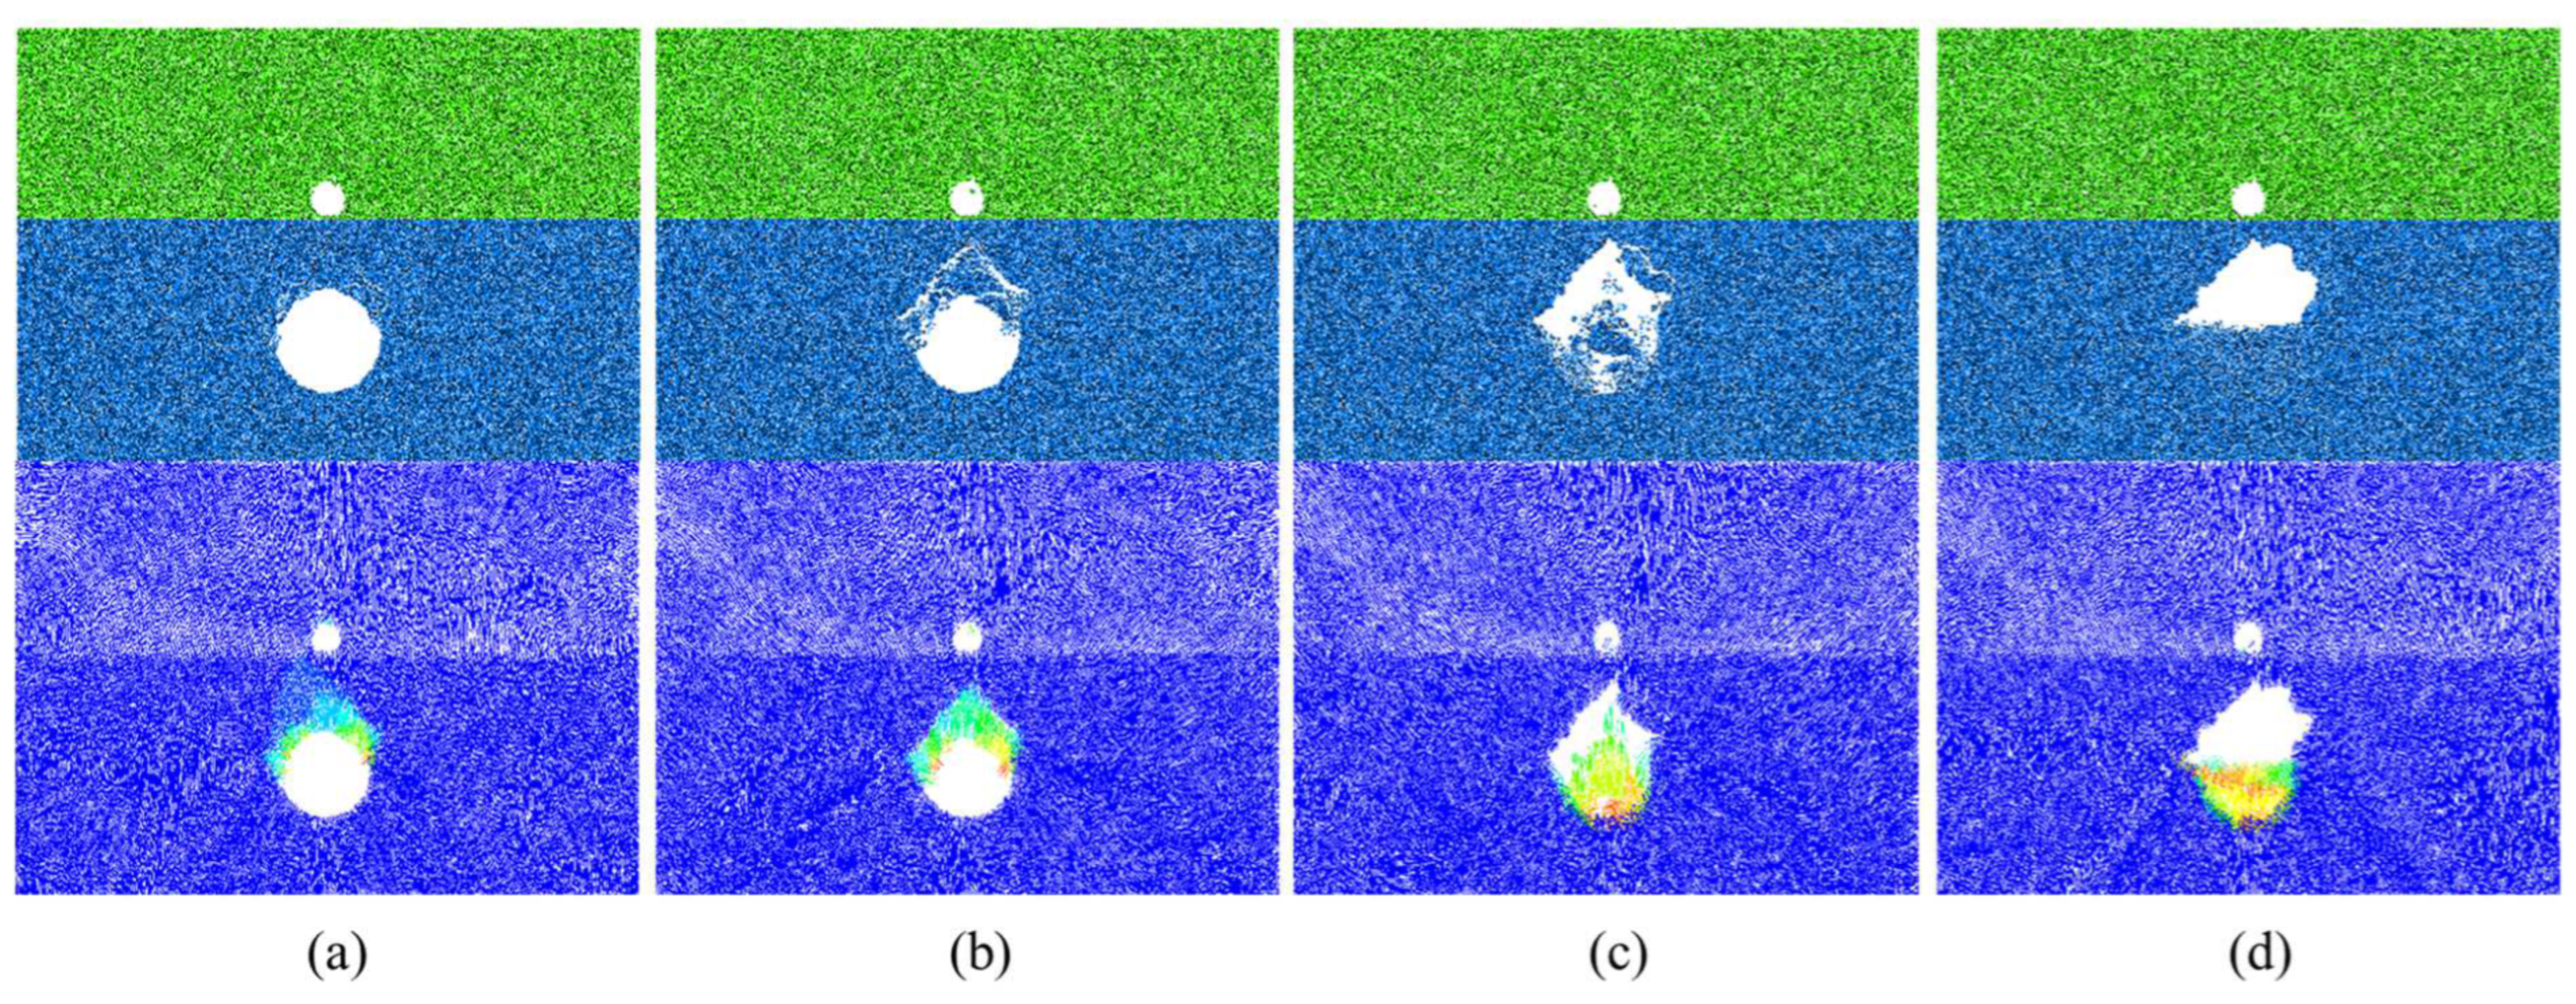
Under the condition where the clearance between the stratum defect and the tunnel was 4.5 m (Figure 13), with an overlying rock layer thickness of 2 m and a soil layer thickness of 13 m, when calculated up to 2000 cycles, similar to the previous three schemes, the composite strata underwent overall subsidence after tunnel excavation. The top and sides of the tunnel cavity exhibited damage before the stratum defect, and the rate of development of loose particles in Scheme D was slower than that in Scheme C. This was because, in Scheme D, the clearance between the stratum defect and the tunnel cavity was larger, resulting in a relatively slower rate of connection between the stratum defect and the tunnel cavity. By the time 4000 cycles were reached, penetrating cracks gradually developed between the tunnel cavity and the stratum defect, and loose particles gradually extended near the stratum defect. The stratum defect also began to become unstable and underwent destruction, gradually connecting with the tunnel cavity, and the collapsed arches of the two overlapped, leading to a sharp increase in particle destruction rate. Upon reaching 10,000 cycles, the development of loose particles gradually completed until reaching a final relative equilibrium state, forming a stable collapsed arch in the tunnel cavity, with a collapsed arch height of 8.1 m (1.35 D), greater than the final collapsed arch height in Scheme C. In this condition, the clearance between the stratum defect and the tunnel cavity was 4.5 m, and in Scheme A, the height of the collapsed arch under the condition without defects was 4 m. Thus, the distance between the stratum defect and the tunnel collapsed arch was 0.5 m, resulting in the largest overlap influence range of the two collapsed arches and the largest damage range. Therefore, it was determined that the most unfavorable clearance between the stratum defect and the tunnel cavity is 4.5 m (3/4 D).
Figure 14 illustrates the composite strata instability and failure process for Scheme E, which is consistent with the previous four schemes. After tunnel excavation, the composite strata underwent overall subsidence, but to a lesser extent compared to Schemes B, C, and D. By the time 2000 cycles were reached, the phenomenon of the top and sides of the tunnel cavity experiencing damage before the stratum defect occurred was observed, and the development of loose particles was slow. Upon reaching 10,000 cycles, the development of loose particles gradually completed until reaching a final relative equilibrium state, forming a stable collapsed arch in the tunnel cavity, with a collapsed arch height of 4.12 m (0.69 D), which was essentially consistent with the collapsed arch height in Scheme A without stratum defects. This was because the collapsed arch of the stratum defect was not within the influence range of the collapsed arch of the tunnel cavity, and the two collapsed arches did not overlap. At this point, the impact of the stratum defect on the tunnel cavity was minimal and could even be neglected. However, compared to the condition without stratum defects, there was still a significant overall subsidence of particles, indicating that the influence of the stratum defect on the composite strata still existed.
Combined with the numerical simulation of schemes A, B, C, D, and E, it can be seen that there is an overall subsidence of the strata after tunnel excavation, regardless of the presence or absence of defects in the composite strata. As the existence of stratum defects weakened the stability of composite strata, the existence of stratum defects in the case of the composite strata allowed more overall subsidence of the composite stratum. In the case of ground defects, the smaller the clear distance between the ground defects and the tunnel chamber, the faster the connection between the two occurs, and the faster the rate of development of loose particles. The five numerical simulation schemes of rock particle thickness were 1/3 D, when the formation did not have defects and the collapsed arch height was 0.66 D; when the formation had defects and the tunnel clear distance was 1/3 D, that is, the formation defects were located in the tunnel within the collapsed arch, the two collapsed arches were super positioned, the final collapsed arch height was 0.72 D, and the collapsed arch height was greater than the no-flat defect conditions; when the formation had defects and the tunnel clearance was 2/3 D, that is, the formation had defects and the tunnel clearance distance was 2/3 D, i.e., the stratum defects were tangential to the tunnel collapsed arch, and the two collapsed arches produced a larger range of superposition, and the final height of the collapsed arch was 1.12 D; when the stratum had defects and the tunnel clear distance was 3/4 D, i.e., the distance between the stratum defects and the tunnel collapsed arch was 0.5 m, and the two collapsed arches produced a maximum range of superposition, the final height of the collapsed arch was 1.35 D, and at this time, the stratum had defects and the clear distance from the tunnel chamber was the most unfavorable clear distance. At this time, the net distance between the stratum defect and the tunnel chamber was the most unfavorable net distance; when the net distance between the stratum defect and the tunnel was 1 D, the collapsed arch of the stratum defect was not within the influence range of the collapsed arch of the tunnel chamber, there was no superposition of the two collapsed arches, and the final height of the collapsed arch was the same as that of the working condition with no stratum defect, which was 0.69 D.
4.2.2. Effect of Distance between Interface and Vault in Numerical Simulation
As shown in Figure 15, under the condition where the clearance between the stratum defect and the tunnel was 4 m, with an overlying rock layer thickness of 1 m and a soil layer thickness of 14 m (rock–span ratio ζ = 1/6), when calculated up to 2000 cycles, loose particles had already extended to the soil layer, and there were signs of sinking in the soil particles. Compared to Scheme C (rock–span ratio ζ = 1/3), the development rate of loose particles was faster, and damage occurred at the top and sides of the tunnel cavity before the strata defected. By the time 4000 cycles were reached, a large number of soil particles sank, the tunnel cavity gradually became unstable, and a large number of particles sank into the tunnel void. Upon reaching 10,000 cycles, the development of loose particles gradually occurred until a final relative equilibrium state was reached, forming a stable collapsed arch in the tunnel cavity, with a collapsed arch height of 8.06 m (1.34 D), greater than the final collapsed arch height in Scheme C. This was because the rock–span ratio was smaller, meaning that the thickness of rock layer particles was smaller while the thickness of soil layer particles was larger. Moreover, the physical properties of soil layer particles were weaker relative to rock layer particles, resulting in a higher collapsed arch height in the final stage of this scheme.
When the rock–span ratio ζ = 2/3 was calculated up to 2000 cycles, the rate of destruction was very slow, and the overall change was small. By the time 4000 cycles were reached, the tunnel cavity gradually became unstable and collapsed, but the loose particles never developed near the stratum defect. This was because, in this scheme, the thickness of rock layer particles was larger, resulting in a smaller collapsed arch height in the tunnel cavity. Upon reaching 10,000 cycles, the development of loose particles gradually completed until reaching a final relative equilibrium state, forming a stable collapsed arch in the tunnel cavity, with a collapsed arch height of 2.96 m (0.49 D), smaller than the final collapsed arch height in Schemes C and F. This was because in this scheme, the thickness of rock layer particles was larger, and the physical properties of rock layer particles were stronger, resulting in a smaller collapsed arch height in the tunnel cavity. Consequently, the stratum defect was further away from the collapsed arch of the tunnel cavity, and the impact of the stratum defect on the tunnel cavity was minimal.
Combining numerical simulation Schemes C, F, and G, it can be concluded that the clearance between the stratum defect and the tunnel cavity was 2/3 D for all three schemes. When the rock–span ratio ζ = 1/6, the collapsed arch height was 1.34 D. When the rock–span ratio ζ = 1/3, the thickness of rock layer particles increased, leading to a decrease in the collapsed arch height of the tunnel cavity due to the stronger physical properties of the rock layer material. Consequently, the overlap influence range of the collapsed arches of the tunnel cavity and the stratum defect decreased, and the final collapsed arch height was 1.12 D. When the rock–span ratio ζ = 2/3 (Figure 16), the thickness of rock layer particles was larger, resulting in a smaller collapsed arch height in the tunnel cavity. The collapsed arch of the stratum defect was not within the influence range of the collapsed arch of the tunnel cavity, and the two collapsed arches did not overlap, resulting in a smaller final collapsed arch height of 0.49 D. As the rock–span ratio increased, the thickness of rock layer particles increased, resulting in a decrease in the final collapsed arch height, indicating an increase in the stability of the composite strata. Essentially, the increase in the thickness of rock layer particles led to a decrease in the collapsed arch height of the tunnel cavity, resulting in a smaller overlap of collapsed arches between the tunnel cavity and the stratum defect.
5. Discussion of Failure Mechanism and Collapsed Arch
The collapse heights for different working conditions are shown in Figure 17. It can be seen that the presence of cavities increases the collapse range. For Group B, the critical value is when the ground cavity has a clearance of 2/3 D from the tunnel. The height of the collapsed arch is maximum at this time, which is due to the superposition of the collapse caused by tunnel excavation and the collapse caused by the cavity. For Group C, the height of the final collapsed arch decreases with increasing rock thickness when the location of the cavity is determined.
The test results show that the collapse height is the highest in Case 5, so it is further analyzed as a typical case, as shown in Figure 18. The failure of the strata is progressive and the shape of the arch is also different. The shape of collapsing arches has been an interesting subject of study in the past [45,46]. It has been established in the literature that curved arches initially form when the trapdoor translation is minimal. Then, as the trapdoor translation increases, the arch evolves into a triangular curved arch, a triangular arch, and finally a rectangular shape [47]. In this experiment, the collapse first appeared in the rock layer and a temporary triangular arch structure was formed, as shown in Figure 18a. Vertically extending cracks appeared as the cavity deteriorated the stratigraphic conditions. A second collapse occurred when the fracture surfaces in the strata were connected. In this stage, the collapse interface developed to the sides and the collapse was more extensive. Then a collapsed arch with a combination of rectangular and curved shapes was formed. The final collapse height was enlarged by about 105% from the first one. Based on the above results, the forms of failure can be summarized into two types [48,49,50]:
Tensile failure. It mainly manifests as tensile failure above the vault. As a result of tunnel excavation, a loose area is formed around the tunnel. After tunnel excavation, a loose area is formed around the tunnel. Collapse occurs due to insufficient cohesion between the particles to withstand the loosening loads of the ground.
Shear failure. It is mainly a shear failure along the failure surface. The ground pressure in the collapse zone is transferred from the shear stresses to the nearby non-yielding zone. The ground shear stresses in the collapse zone are transferred to the nearby non-yielding zone. As the unstable strata move downward, the shear stresses on the sliding surface are transferred to the attached stable strata. A stress redistribution phenomenon thus occurs, and a temporarily stable arch structure may be formed, as shown in Figure 18c, which is shown in Figure 18c.
It can be determined that the arch may be stable if hd > D regardless of the presence of cavities. If hd < D, interventions should be taken to reinforce the area promptly when a small-scale collapse occurs during tunnel construction. The collapse range should be controlled within the shallow disturbance area to prevent damage to the larger pressure arch area and cause large-scale collapse. The thickness of the rock layer affects the height of the collapsed arch, and a stable arched structure may not be formed when the hs is less than 2/3 D. Therefore, special attention should be paid during construction in shallow buried areas, and if necessary, grouting reinforcement should be carried out on the strata.
6. Conclusions
This study investigated the mechanism of collapse in composite strata with voids caused by tunnel excavation using model experiments. The evolution characteristics and final form of collapse are explored. These key points can be drawn based on this study:
- Tunnel excavation causes the collapse of the strata in the arch-loosening zone, and the presence of pressure arches suppresses the deformation of the surrounding rock.
- The presence of a cavity deteriorates the stratigraphic conditions and contributes to the emergence of cracks, which leads to secondary collapses after temporary stabilization.
- When hd < D, small-scale collapse occurs during tunnel excavation, and timely measures should be taken to reinforce the unstable zone and control the collapse within the shallow disturbance zone to prevent secondary collapse.
- The thickness of the rock layer affects the height of the collapsed arch. A stable arched structure is difficult to form when the hs is less than 2/3 D. Therefore, special attention should be paid during construction in shallow buried areas, and if necessary, grouting reinforcement should be carried out on the strata.
In this paper, considering the limitations of model testing in tunnel engineering, we did not capture the size effect in this study [51]. However, the experimental results still comprehensively reveal the collapse mechanism of soil–rock composite strata with cavities, providing a reference for tunnel collapse prevention and control. However, the influence of the size effect on the collapse mechanism of composite strata merits further investigation in future work.
Author Contributions
Conceptualization, C.Z., Z.W. and C.L.; Methodology, Z.W.; Software, Z.W.; Validation, C.Z.; Formal analysis, C.Z. and J.G.; Investigation, J.G. and Z.W.; Resources, C.Z. and C.L.; Writing—original draft, J.G.; Writing—review & editing, C.L.; Visualization, J.G.; Project administration, C.L.; Funding acquisition, C.Z. and C.L. All authors have read and agreed to the published version of the manuscript.
Funding
The Open Fund of the Key Laboratory of Urban Underground Engineering of Ministry of Education (No. TUL2023-01), National Natural Science Foundation of China (No. 51978356), Demonstration Project of Benefiting People with Science and Technology of Qingdao (No. 23-2-8-cspz-14-nsh).
Data Availability Statement
The raw data supporting the conclusions of this article will be made available by the authors on request.
Acknowledgments
The authors gratefully acknowledge the support of the Open Fund of the Key Laboratory of Urban Underground Engineering of Ministry of Education (No. TUL2023-01), the National Natural Science Foundation of China (No. 51978356), and the Demonstration Project of Benefiting People with Science and Technology of Qingdao, China (No. 23-2-8-cspz-14-nsh).
Conflicts of Interest
Author Changan Zhang was employed by the company Shandong Provincial Communications Planning and Design Institute Group Co., Ltd. The remaining authors declare that the research was conducted in the absence of any commercial or financial relationships that could be construed as a potential conflict of interest.
References
- Cui, H.; Ren, X.; Mao, Q.; Hu, Q.; Wang, W. Shield Subway Tunnel Deformation Detection Based on Mobile Laser Scanning. Autom. Constr. 2019, 106, 102889. [Google Scholar] [CrossRef]
- Li, Q.; Song, L.; List, G.F.; Deng, Y.; Zhou, Z.; Liu, P. A New Approach to Understand Metro Operation Safety by Exploring Metro Operation Hazard Network (MOHN). Saf. Sci. 2017, 93, 50–61. [Google Scholar] [CrossRef]
- Qi, H.; Zhou, Z.; Yuan, J.; Li, N.; Zhou, J. Accident Pattern Recognition in Subway Construction for the Provision of Customized Safety Measures. Tunn. Undergr. Space Technol. 2023, 137, 105157. [Google Scholar] [CrossRef]
- Lin, D.; Nelson, J.D.; Cui, J. Exploring Influencing Factors on Metro Development in China from Urban and Economic Perspectives. Tunn. Undergr. Space Technol. 2021, 112, 103877. [Google Scholar] [CrossRef]
- Zhang, C.; Yue, Y.; Wang, M. Influence of Pipeline Leakage on Ground Collapse and Its Control during Adjacent Tunnelling. Tumu Gongcheng Xuebao/China Civ. Eng. J. 2015, 48, 351–356. [Google Scholar]
- Wu, Y.Q.; Wang, K.; Zhang, L.Z.; Peng, S.H. Sand-Layer Collapse Treatment: An Engineering Example from Qingdao Metro Subway Tunnel. J. Clean. Prod. 2018, 197, 19–24. [Google Scholar] [CrossRef]
- Yan, F.; Qiu, W.; Sun, K.; Jiang, S.; Huang, H.; Hong, Y.; Hou, Z. Investigation of a Large Ground Collapse, Water Inrush and Mud Outburst, and Countermeasures during Subway Excavation in Qingdao: A Case Study. Tunn. Undergr. Space Technol. 2021, 117, 104127. [Google Scholar] [CrossRef]
- Tao, M.; Zhao, H.; Li, X.; Li, X.; Du, K. Failure Characteristics and Stress Distribution of Pre-Stressed Rock Specimen with Circular Cavity Subjected to Dynamic Loading. Tunn. Undergr. Space Technol. 2018, 81, 1–15. [Google Scholar] [CrossRef]
- Li, A.; Liu, Y.; Dai, F.; Liu, K.; Wei, M. Continuum Analysis of the Structurally Controlled Displacements for Large-Scale Underground Caverns in Bedded Rock Masses. Tunn. Undergr. Space Technol. 2020, 97, 103288. [Google Scholar] [CrossRef]
- Zhang, Y.; Yang, J.; Yang, F. Field Investigation and Numerical Analysis of Landslide Induced by Tunneling. Eng. Fail. Anal. 2015, 47, 25–33. [Google Scholar] [CrossRef]
- Huang, S.; Liu, Q.; Liu, Y.; Kang, Y.; Cheng, A.; Ye, Z. Frost Heaving and Frost Cracking of Elliptical Cavities (Fractures) in Low-Permeability Rock. Eng. Geol. 2018, 234, 1–10. [Google Scholar] [CrossRef]
- Zhang, C.; Zhang, D.; Wang, M.; Li, Q.; Liu, S. Catastrophe Mechanism and Control Technology of Ground Collapse Induced by Urban Tunneling. Tunn. Undergr. Space Technol. 2010, 31, 303–309. [Google Scholar]
- Liu, H.; Yue, Y.; Lian, Y.; Meng, X.; Du, Y.; Cui, J. Reverse-Time Migration of GPR Data for Imaging Cavities behind a Reinforced Shield Tunnel. Tunn. Undergr. Space Technol. 2024, 146, 105649. [Google Scholar] [CrossRef]
- Yue, Y.; Liu, H.; Lin, C.; Meng, X.; Liu, C.; Zhang, X.; Cui, J.; Du, Y. Automatic Recognition of Defects behind Railway Tunnel Linings in GPR Images Using Transfer Learning. Meas. J. Int. Meas. Confed. 2024, 224, 113903. [Google Scholar] [CrossRef]
- Kravitz, B.; Mooney, M.; Karlovsek, J.; Danielson, I.; Hedayat, A. Void Detection in Two-Component Annulus Grout behind a Pre-Cast Segmental Tunnel Liner Using Ground Penetrating Radar. Tunn. Undergr. Space Technol. 2019, 83, 381–392. [Google Scholar] [CrossRef]
- Qin, H.; Zhang, D.; Tang, Y.; Wang, Y. Automatic Recognition of Tunnel Lining Elements from GPR Images Using Deep Convolutional Networks with Data Augmentation. Autom. Constr. 2021, 130, 103830. [Google Scholar] [CrossRef]
- Loupos, K.; Doulamis, A.D.; Stentoumis, C.; Protopapadakis, E.; Makantasis, K.; Doulamis, N.D.; Amditis, A.; Chrobocinski, P.; Victores, J.; Montero, R.; et al. Autonomous Robotic System for Tunnel Structural Inspection and Assessment. Int. J. Intell. Robot. Appl. 2018, 2, 43–66. [Google Scholar] [CrossRef]
- Carranza-Torres, C.; Reich, T. Analytical and Numerical Study of the Stability of Shallow Underground Circular Openings in Cohesive Ground. Eng. Geol. 2017, 226, 70–92. [Google Scholar] [CrossRef]
- Huang, F.; Zhao, L.H.; Ling, T.H.; Yang, X.L. Rock Mass Collapse Mechanism of Concealed Karst Cave beneath Deep Tunnel. Int. J. Rock Mech. Min. Sci. 2017, 91, 133–138. [Google Scholar] [CrossRef]
- Xu, S.; Lei, H.; Li, C.; Liu, H.; Lai, J.; Liu, T. Model Test on Mechanical Characteristics of Shallow Tunnel Excavation Failure in Gully Topography. Eng. Fail. Anal. 2021, 119, 104978. [Google Scholar] [CrossRef]
- Li, G.; Ma, F.; Guo, J.; Zhao, H. Experimental Research on Deformation Failure Process of Roadway Tunnel in Fractured Rock Mass Induced by Mining Excavationng the Distinct Element Method. Environ. Earth Sci. 2022, 81, 243. [Google Scholar] [CrossRef]
- Qin, Y.; Lai, J.; Cao, X.; Zan, W.; Feng, Z.; Xie, Y.; Zhang, W. Experimental Study on the Collapse Evolution Law of Unlined Tunnel in Boulder-Cobble Mixed Formation. Tunn. Undergr. Space Technol. 2023, 139, 105164. [Google Scholar] [CrossRef]
- Zhang, S.; Bao, T.; Liu, C. Model Tests and Numerical Modeling of the Failure Behavior of Composite Strata Caused by Tunneling under Pipeline Leakage Conditions. Eng. Fail. Anal. 2023, 149, 107287. [Google Scholar] [CrossRef]
- Liu, C.; Zhang, S.; Zhang, D.; Zhang, K.; Wang, Z. Model Tests on Progressive Collapse Mechanism of a Shallow Subway Tunnel in Soft Upper and Hard Lower Composite Strata. Tunn. Undergr. Space Technol. 2023, 131, 104824. [Google Scholar] [CrossRef]
- Yang, S.Q.; Chen, M.; Fang, G.; Wang, Y.C.; Meng, B.; Li, Y.H.; Jing, H.W. Physical Experiment and Numerical Modelling of Tunnel Excavation in Slanted Upper-Soft and Lower-Hard Strata. Tunn. Undergr. Space Technol. 2018, 82, 248–264. [Google Scholar] [CrossRef]
- Xiang, Y.; Liu, H.; Zhang, W.; Chu, J.; Zhou, D.; Xiao, Y. Application of Transparent Soil Model Test and DEM Simulation in Study of Tunnel Failure Mechanism. Tunn. Undergr. Space Technol. 2018, 74, 178–184. [Google Scholar] [CrossRef]
- Hao, W.U.; Zhao, G.Y. Failure Behavior of Horseshoe-Shaped Tunnel in Hard Rock under High Stress: Phenomenon and Mechanisms. Trans. Nonferrous Met. Soc. China (Engl. Ed.) 2022, 32, 639–656. [Google Scholar] [CrossRef]
- Liu, C.; Zhang, D.; Fang, Q.; Zhang, S.; Sun, Z. Investigation of Progressive Failure Mechanism of Tunnel Lining with Material Defects Using Discrete Element Method. Theor. Appl. Fract. Mech. 2023, 125, 103832. [Google Scholar] [CrossRef]
- Kudai, K.; Sassa, S.; Yang, S.; Takada, K. Influence of Soil and Hydraulic Conditions on the Processes of Internal Erosion, Cavity Formation and Collapse behind Coastal Structures. Coast. Eng. 2021, 170, 104013. [Google Scholar] [CrossRef]
- Shiau, J.; Leung, P.C.; Keawsawasvong, S.; Seehavong, S.; Sugawara, J. Ground Stability of Ellipsoidal Cavity Due to Pipeline Defects. Appl. Eng. Sci. 2023, 16, 100163. [Google Scholar] [CrossRef]
- Zhou, L.; Ma, L.; Zhu, Z.; Dong, Y.; Huang, J.; Cui, S. Study of the Coupling Effect of Elliptical Cavities and Cracks on Tunnel Stability under Dynamic Loads. Theor. Appl. Fract. Mech. 2022, 121, 103502. [Google Scholar] [CrossRef]
- Chen, L.; Wang, Z.F.; Wang, Y.; Bai, X.; Lai, J. Characteristics and Failure Analysis of a Railway Tunnel Collapse Influenced by Cavity in Phyllite Strata. Eng. Fail. Anal. 2022, 142, 106794. [Google Scholar] [CrossRef]
- Zhao, Y.; Liu, C.; Zhang, Y.; Yang, J.; Feng, T. Damaging Behavior Investigation of an Operational Tunnel Structure Induced by Cavities around Surrounding Rocks. Eng. Fail. Anal. 2019, 99, 203–209. [Google Scholar] [CrossRef]
- Huang, F.; Wu, C.; Jang, B.A.; Hong, Y.; Guo, N.; Guo, W. Instability Mechanism of Shallow Tunnel in Soft Rock Subjected to Surcharge Loads. Tunn. Undergr. Space Technol. 2020, 99, 103350. [Google Scholar] [CrossRef]
- Huang, F.; Zhu, H.; Xu, Q.; Cai, Y.; Zhuang, X. The Effect of Weak Interlayer on the Failure Pattern of Rock Mass around Tunnel-Scaled Model Tests and Numerical Analysis. Tunn. Undergr. Space Technol. 2013, 35, 207–218. [Google Scholar] [CrossRef]
- Wang, Y.; Jing, H.; Su, H.; Xie, J. Effect of a Fault Fracture Zone on the Stability of Tunnel-Surrounding Rock. Int. J. Geomech. 2017, 17, 04016135. [Google Scholar] [CrossRef]
- Wang, J.; Tian, N.; Lin, G.; Feng, K.; Xie, H. Face Failure of Deep EPB Shield Tunnels in Dry Graded Cobble-Rich Soil: A DEM Study. Tunn. Undergr. Space Technol. 2024, 147, 105622. [Google Scholar] [CrossRef]
- Yin, Z.Y.; Wang, P.; Zhang, F. Effect of Particle Shape on the Progressive Failure of Shield Tunnel Face in Granular Soils by Coupled FDM-DEM Method. Tunn. Undergr. Space Technol. 2020, 100, 103394. [Google Scholar] [CrossRef]
- Chen, L.; Jin, A.; Wu, S.; Chu, C.; Li, X. Numerical Study on Spalling Failure of Rock Surrounding Deep Buried Tunnel Based on DEM. Comput. Geotech. 2022, 145, 104653. [Google Scholar] [CrossRef]
- Cundall, P.A. A Computer Model for Simulating Progressive, Large-Scale Movement in Blocky Rock System. Proc. Int. Symp. Rock Mech. 1971, 8, 129–136. [Google Scholar]
- Fakhimi, A.; Carvalho, F.; Ishida, T.; Labuz, J.F. Simulation of Failure around a Circular Opening Using CWFS Model. Int. J. Rock Mech. Min. Sci. 2002, 39, 507–515. [Google Scholar]
- Li, X.; Chen, R.; Liu, L.; Zhou, C.; Bate, B. A Non-Darcy Flow CFD–DEM Method for Simulating Ground Collapse Induced by Leakage through Underground Pipeline Defect. Comput. Geotech. 2023, 162, 105695. [Google Scholar] [CrossRef]
- Gutiérrez-Ch, J.G.; Senent, S.; Zeng, P.; Jimenez, R. DEM Simulation of Rock Creep in Tunnels Using Rate Process Theory. Comput. Geotech. 2022, 142, 104559. [Google Scholar] [CrossRef]
- Li, J.; Wang, B.; Pan, P.; Chen, H.; Wang, D.; Chen, P. Computers and Geotechnics Failure Analysis of Soil-Rock Mixture Slopes Using Coupled MPM-DEM Method. Comput. Geotech. 2024, 169, 106226. [Google Scholar] [CrossRef]
- Tong, B.; Yoo, C. Application of Digital Image Correlations (DIC) Technique on Geotechnical Reduced-Scale Model Tests. J. Korean Geosynth. Soc. 2022, 21, 33–48. [Google Scholar]
- Iglesia, G.R.; Einstein, H.H.; Whitman, R.V. Investigation of Soil Arching with Centrifuge Tests. J. Geotech. Geoenviron. Eng. 2014, 140, 04013005. [Google Scholar] [CrossRef]
- Khatami, H.; Deng, A.; Jaksa, M. An Experimental Study of the Active Arching Effect in Soil Using the Digital Image Correlation Technique. Comput. Geotech. 2019, 108, 183–196. [Google Scholar] [CrossRef]
- Liu, T.; Xie, Y.; Feng, Z.; Luo, Y.; Wang, K.; Xu, W. Better Understanding the Failure Modes of Tunnels Excavated in the Boulder-Cobble Mixed Strata by Distinct Element Method. Eng. Fail. Anal. 2020, 116, 104712. [Google Scholar] [CrossRef]
- De Frias Lopez, R.; Silfwerbrand, J.; Jelagin, D.; Birgisson, B. Force Transmission and Soil Fabric of Binary Granular Mixtures. Geotechnique 2016, 66, 578–583. [Google Scholar] [CrossRef]
- de Frias Lopez, R.; Ekblad, J.; Silfwerbrand, J. Resilient Properties of Binary Granular Mixtures: A Numerical Investigation. Comput. Geotech. 2016, 76, 222–233. [Google Scholar] [CrossRef]
- Mercuri, M.; Pathirage, M.; Gregori, A.; Cusatis, G. Influence of Self-Weight on Size Effect of Quasi-Brittle Materials: Generalized Analytical Formulation and Application to the Failure of Irregular Masonry Arches. Int. J. Fract. 2023, 1–28. [Google Scholar] [CrossRef]
Figure 1.
Model test apparatus.

Figure 2.
Schematic diagram of the model test program.

Figure 3.
No cavity.

Figure 4.
Distance between vault and cavity hd = 10 cm.

Figure 5.
Distance between vault and cavity hd = 20 cm.

Figure 6.
Distance between vault and cavity hd = 30 cm.

Figure 7.
Distance between vault and interface hr = 5 cm.

Figure 8.
Distance between vault and interface hr = 10 cm.

Figure 9.
Distance between vault and interface hr = 20 cm.

Figure 10.
The failure process of composite strata in Scheme A ((a–d) represent 2000, 4000, and 6000 calculation cycle states and the final relative equilibrium state, respectively).
Figure 10.
The failure process of composite strata in Scheme A ((a–d) represent 2000, 4000, and 6000 calculation cycle states and the final relative equilibrium state, respectively).

Figure 11.
The failure process of composite strata in Scheme B ((a–d) represent 2000, 4000, and 10,000 calculation cycle states and the final relative equilibrium state, respectively).
Figure 11.
The failure process of composite strata in Scheme B ((a–d) represent 2000, 4000, and 10,000 calculation cycle states and the final relative equilibrium state, respectively).

Figure 12.
The failure process of composite strata in Scheme C ((a–d) represent 2000, 4000, and 10,000 calculation cycle states and the final relative equilibrium state, respectively).
Figure 12.
The failure process of composite strata in Scheme C ((a–d) represent 2000, 4000, and 10,000 calculation cycle states and the final relative equilibrium state, respectively).

Figure 13.
The failure process of composite strata in Scheme D ((a–d) represent 2000, 4000, and 10,000 calculation cycle states and the final relative equilibrium state, respectively).
Figure 13.
The failure process of composite strata in Scheme D ((a–d) represent 2000, 4000, and 10,000 calculation cycle states and the final relative equilibrium state, respectively).

Figure 14.
The failure process of composite strata in Scheme E ((a–d) represent 2000, 4000, and 10,000 calculation cycle states and the final relative equilibrium state, respectively).
Figure 14.
The failure process of composite strata in Scheme E ((a–d) represent 2000, 4000, and 10,000 calculation cycle states and the final relative equilibrium state, respectively).

Figure 15.
The failure process of composite strata in Scheme F ((a–d) represent 2000, 4000, and 10,000 calculation cycle states and the final relative equilibrium state, respectively).
Figure 15.
The failure process of composite strata in Scheme F ((a–d) represent 2000, 4000, and 10,000 calculation cycle states and the final relative equilibrium state, respectively).

Figure 16.
The failure process of composite strata in Scheme G ((a–d) represent 2000, 4000, and 10,000 calculation cycle states and the final relative equilibrium state, respectively).
Figure 16.
The failure process of composite strata in Scheme G ((a–d) represent 2000, 4000, and 10,000 calculation cycle states and the final relative equilibrium state, respectively).

Figure 17.
Comparison of collapse height.

Figure 18.
Failure evolution process.


Table 1.
The similarity ratios of the materials.
| Parameter | Symbol | Definition | Ratio |
|---|---|---|---|
| Dimension | l | 1:20 | |
| Unit weight | γ | 1:1 | |
| Elastic modulus | E | 1:20 | |
| Passion’s ratio | µ | 1:1 | |
| Friction angle | f | 1:1 | |
| Cohesion | c | 1:20 |
Table 2.
The mechanical parameters of similar materials.
| Strata | Type | Unit Weight (kN/m3) | Elastic Modulus (Gpa) | Poisson’s Ratio | Friction Angle (°) | Cohesion (kPa) |
|---|---|---|---|---|---|---|
| Soil | Prototype | 18 | 60 | 0.35 | 32 | 40 |
| Similar materials | 18.4 | 2.58 | 0.32 | 32.5 | 2 | |
| Rock | Prototype | 20 | 3100 | 0.32 | 35 | 640 |
| Similar materials | 20.1 | 1500 | 0.30 | 34.2 | 32 |
Table 3.
Test schemes.
| Group | Case | Distance between Vault and Cavity (hd) | Distance between Vault and Interface (hr) | Remarks |
|---|---|---|---|---|
| A | 1 | / | 10 cm | No underground cavity |
| B | 2 | 10 cm | 10 cm | Interface location fixed |
| 3 | 20 cm | |||
| 4 | 30 cm | |||
| C | 5 | 20 cm | 5 cm | Cavity location fixed |
| 3 | 10 cm | |||
| 6 | 20 cm |
Table 4.
Parameter for PFC model.
| Parameter | Rock | Soil |
|---|---|---|
| Particle density/(Kg/m−3) | 2000 | 1800 |
| Normal contact stiffness, kn/(MPa) | 100 | 50 |
| Tangential contact stiffness, ks/(MPa) | 100 | 50 |
| Normal bonding stiffness, pb_kn/(MPa) | 100 | 50 |
| Tangential bonding stiffness, pb_ks/(MPa) | 100 | 50 |
| Normal bonding strength, pb_ten/(KPa) | 200 | 80 |
| Tangential bonding strength, pb_coh/(KPa) | 200 | 80 |
| Internal friction angle, pb_fa/(°) | 35 | 32.5 |
| Elastic modulus/(MPa) | 3100 | 60 |
| Cohesive force/(KPa) | 640 | 40 |
| Internal friction angle/(°) | 35 | 32 |
| Poisson’s ratio | 0.32 | 0.35 |
Table 5.
Simulation schemes.
| Case | Distance between Vault and Interface (hr) | Soil Thickness | Distance between Vault and Cavity (hd) |
|---|---|---|---|
| Scheme A | 2 m | 13 m | No underground cavity |
| Scheme B | 2 m | 13 m | 2 m |
| Scheme C | 2 m | 13 m | 4 m |
| Scheme D | 2 m | 13 m | 4.5 m |
| Scheme E | 2 m | 13 m | 6 m |
| Scheme F | 1 m | 14 m | 4 m |
| Scheme G | 4 m | 11 m | 4 m |
Disclaimer/Publisher’s Note: The statements, opinions and data contained in all publications are solely those of the individual author(s) and contributor(s) and not of MDPI and/or the editor(s). MDPI and/or the editor(s) disclaim responsibility for any injury to people or property resulting from any ideas, methods, instructions or products referred to in the content. |
© 2024 by the authors. Licensee MDPI, Basel, Switzerland. This article is an open access article distributed under the terms and conditions of the Creative Commons Attribution (CC BY) license (https://creativecommons.org/licenses/by/4.0/).
Share and Cite
MDPI and ACS Style
Zhang, C.; Gao, J.; Wang, Z.; Liu, C. Model Test on the Collapse Evolution Law of Tunnel Excavation in Composite Strata with a Cavity. Buildings 2024, 14, 932. https://0-doi-org.brum.beds.ac.uk/10.3390/buildings14040932
AMA Style
Zhang C, Gao J, Wang Z, Liu C. Model Test on the Collapse Evolution Law of Tunnel Excavation in Composite Strata with a Cavity. Buildings. 2024; 14(4):932. https://0-doi-org.brum.beds.ac.uk/10.3390/buildings14040932
Chicago/Turabian StyleZhang, Changan, Jianlei Gao, Zhengzhong Wang, and Chang Liu. 2024. "Model Test on the Collapse Evolution Law of Tunnel Excavation in Composite Strata with a Cavity" Buildings 14, no. 4: 932. https://0-doi-org.brum.beds.ac.uk/10.3390/buildings14040932
Note that from the first issue of 2016, this journal uses article numbers instead of page numbers. See further details here.