Multilocus Sequence Typing (MLST) and Random Polymorphic DNA (RAPD) Comparisons of Geographic Isolates of Neoparamoeba perurans, the Causative Agent of Amoebic Gill Disease

 , and
, and
Abstract
:1. Introduction
2. Results
2.1. PCR Amplification and Sequencing
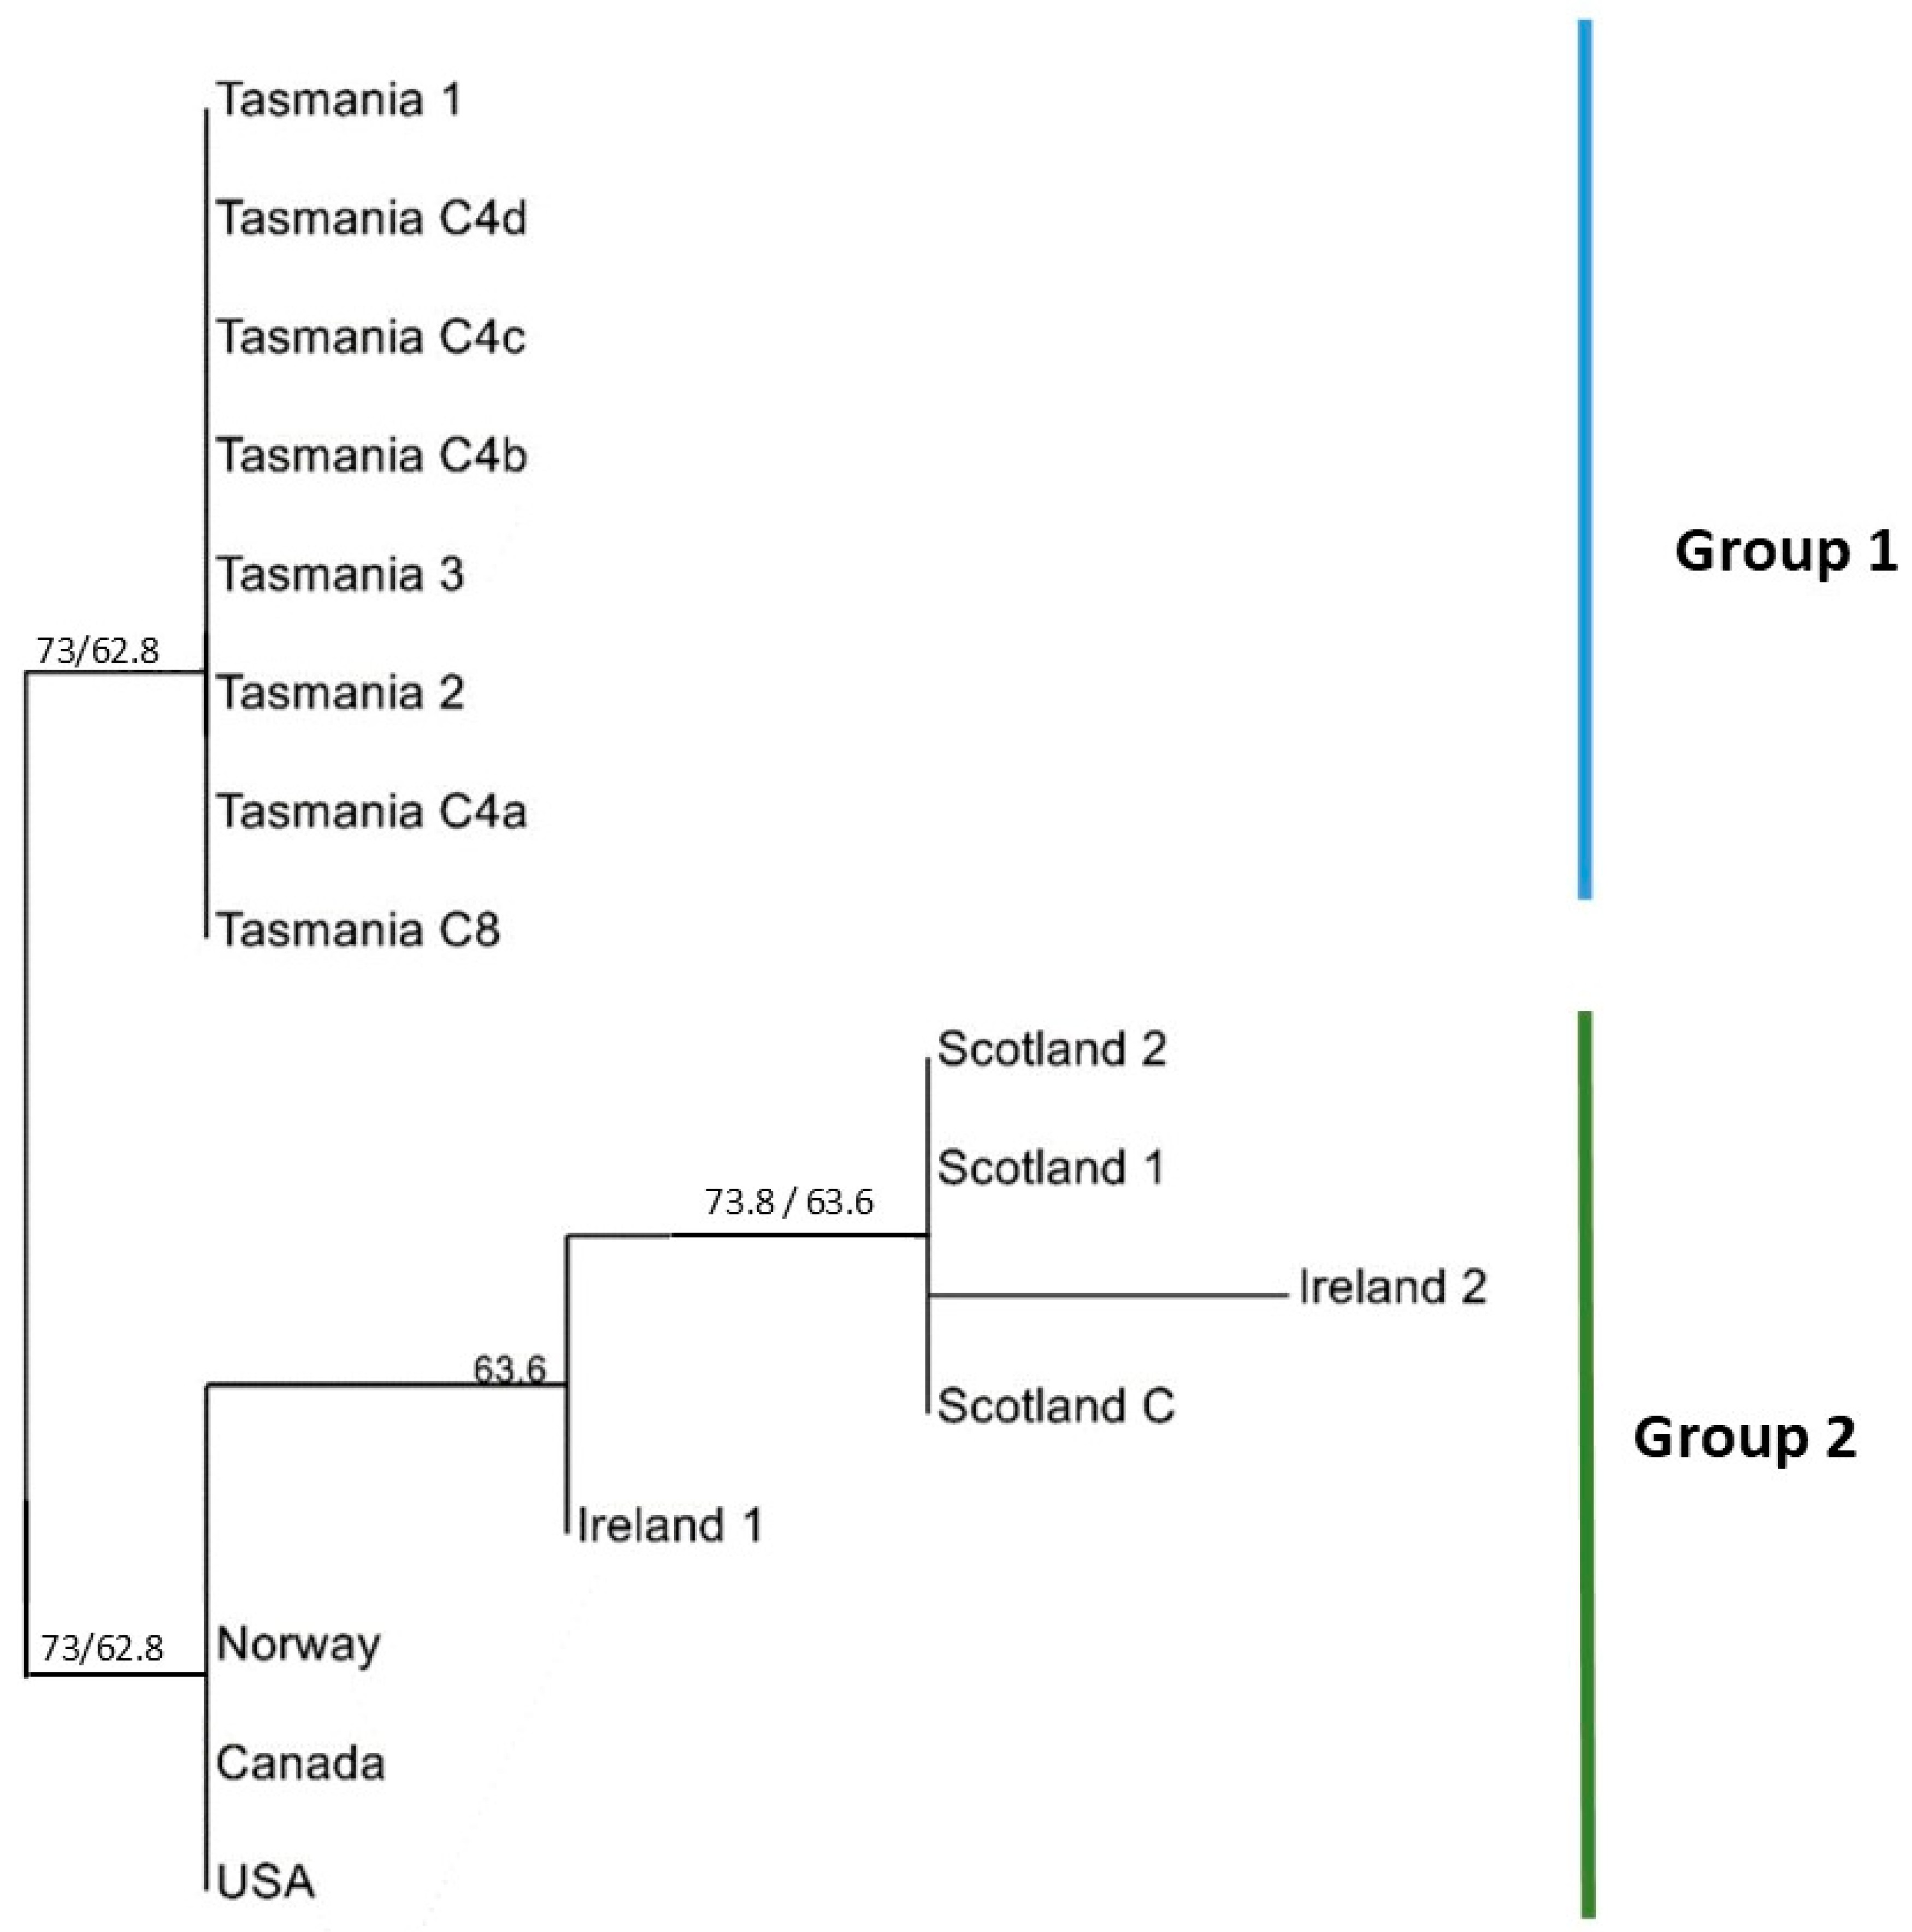
2.2. MLST Analysis
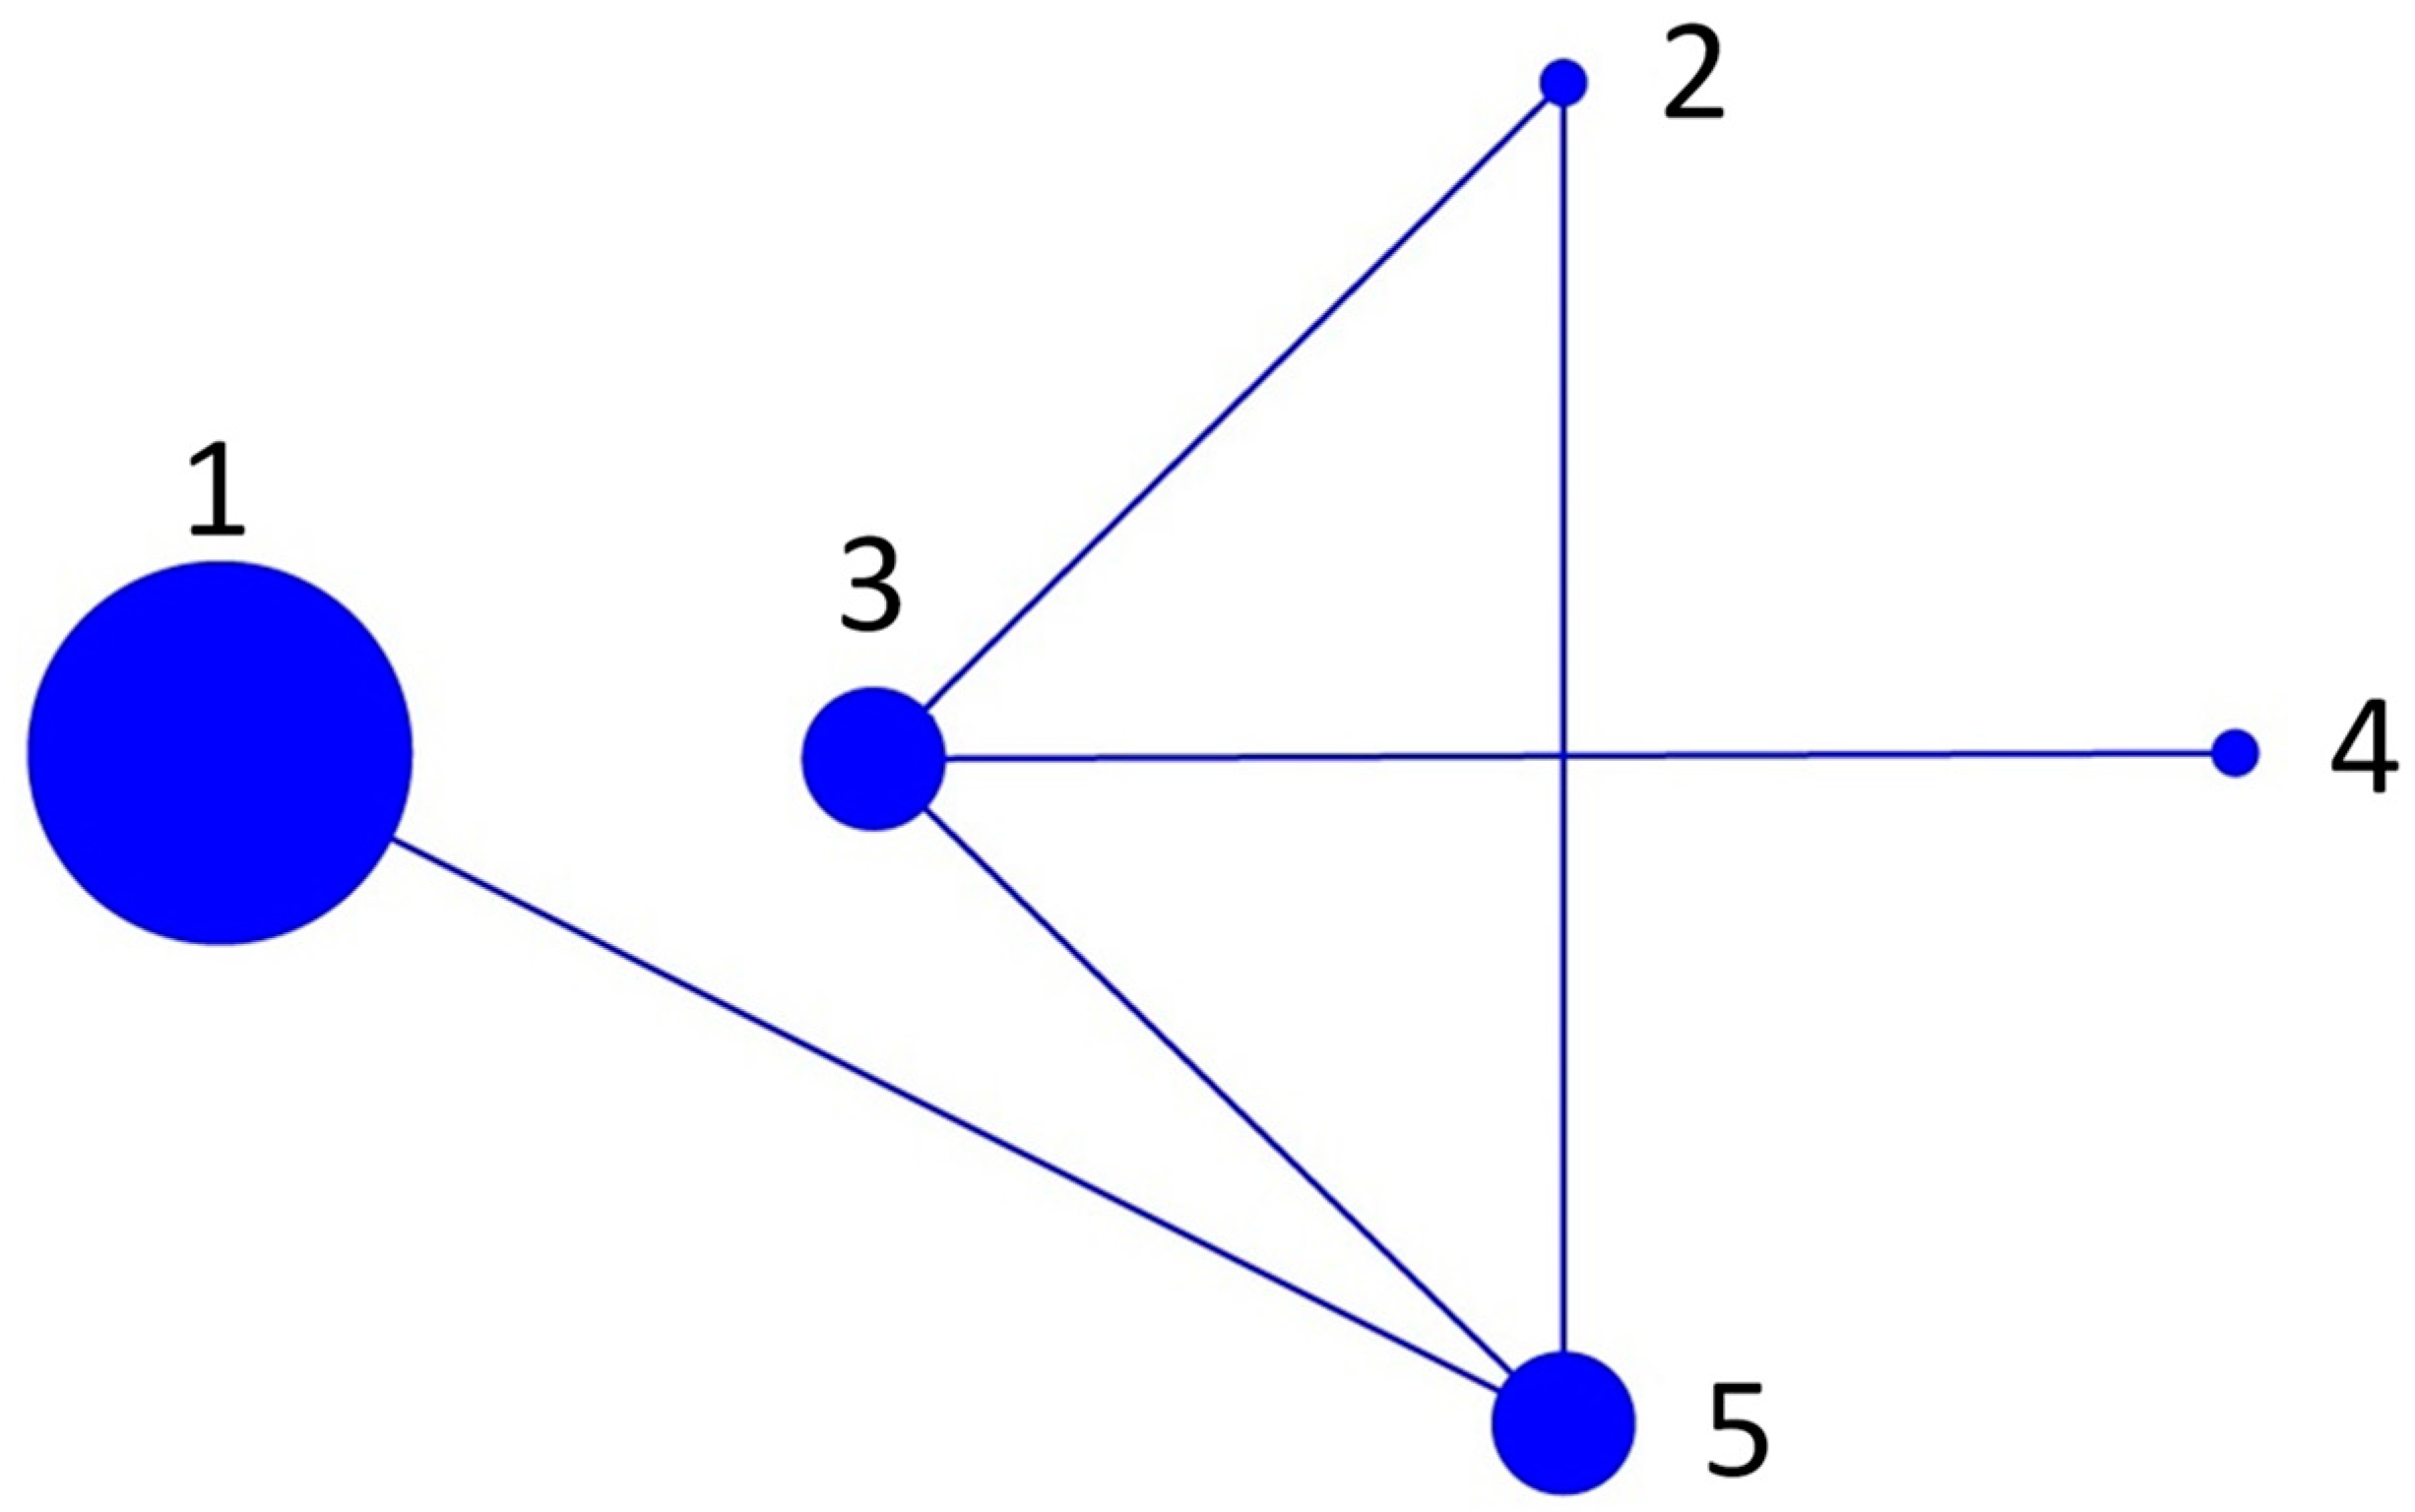
2.3. BURST Analysis
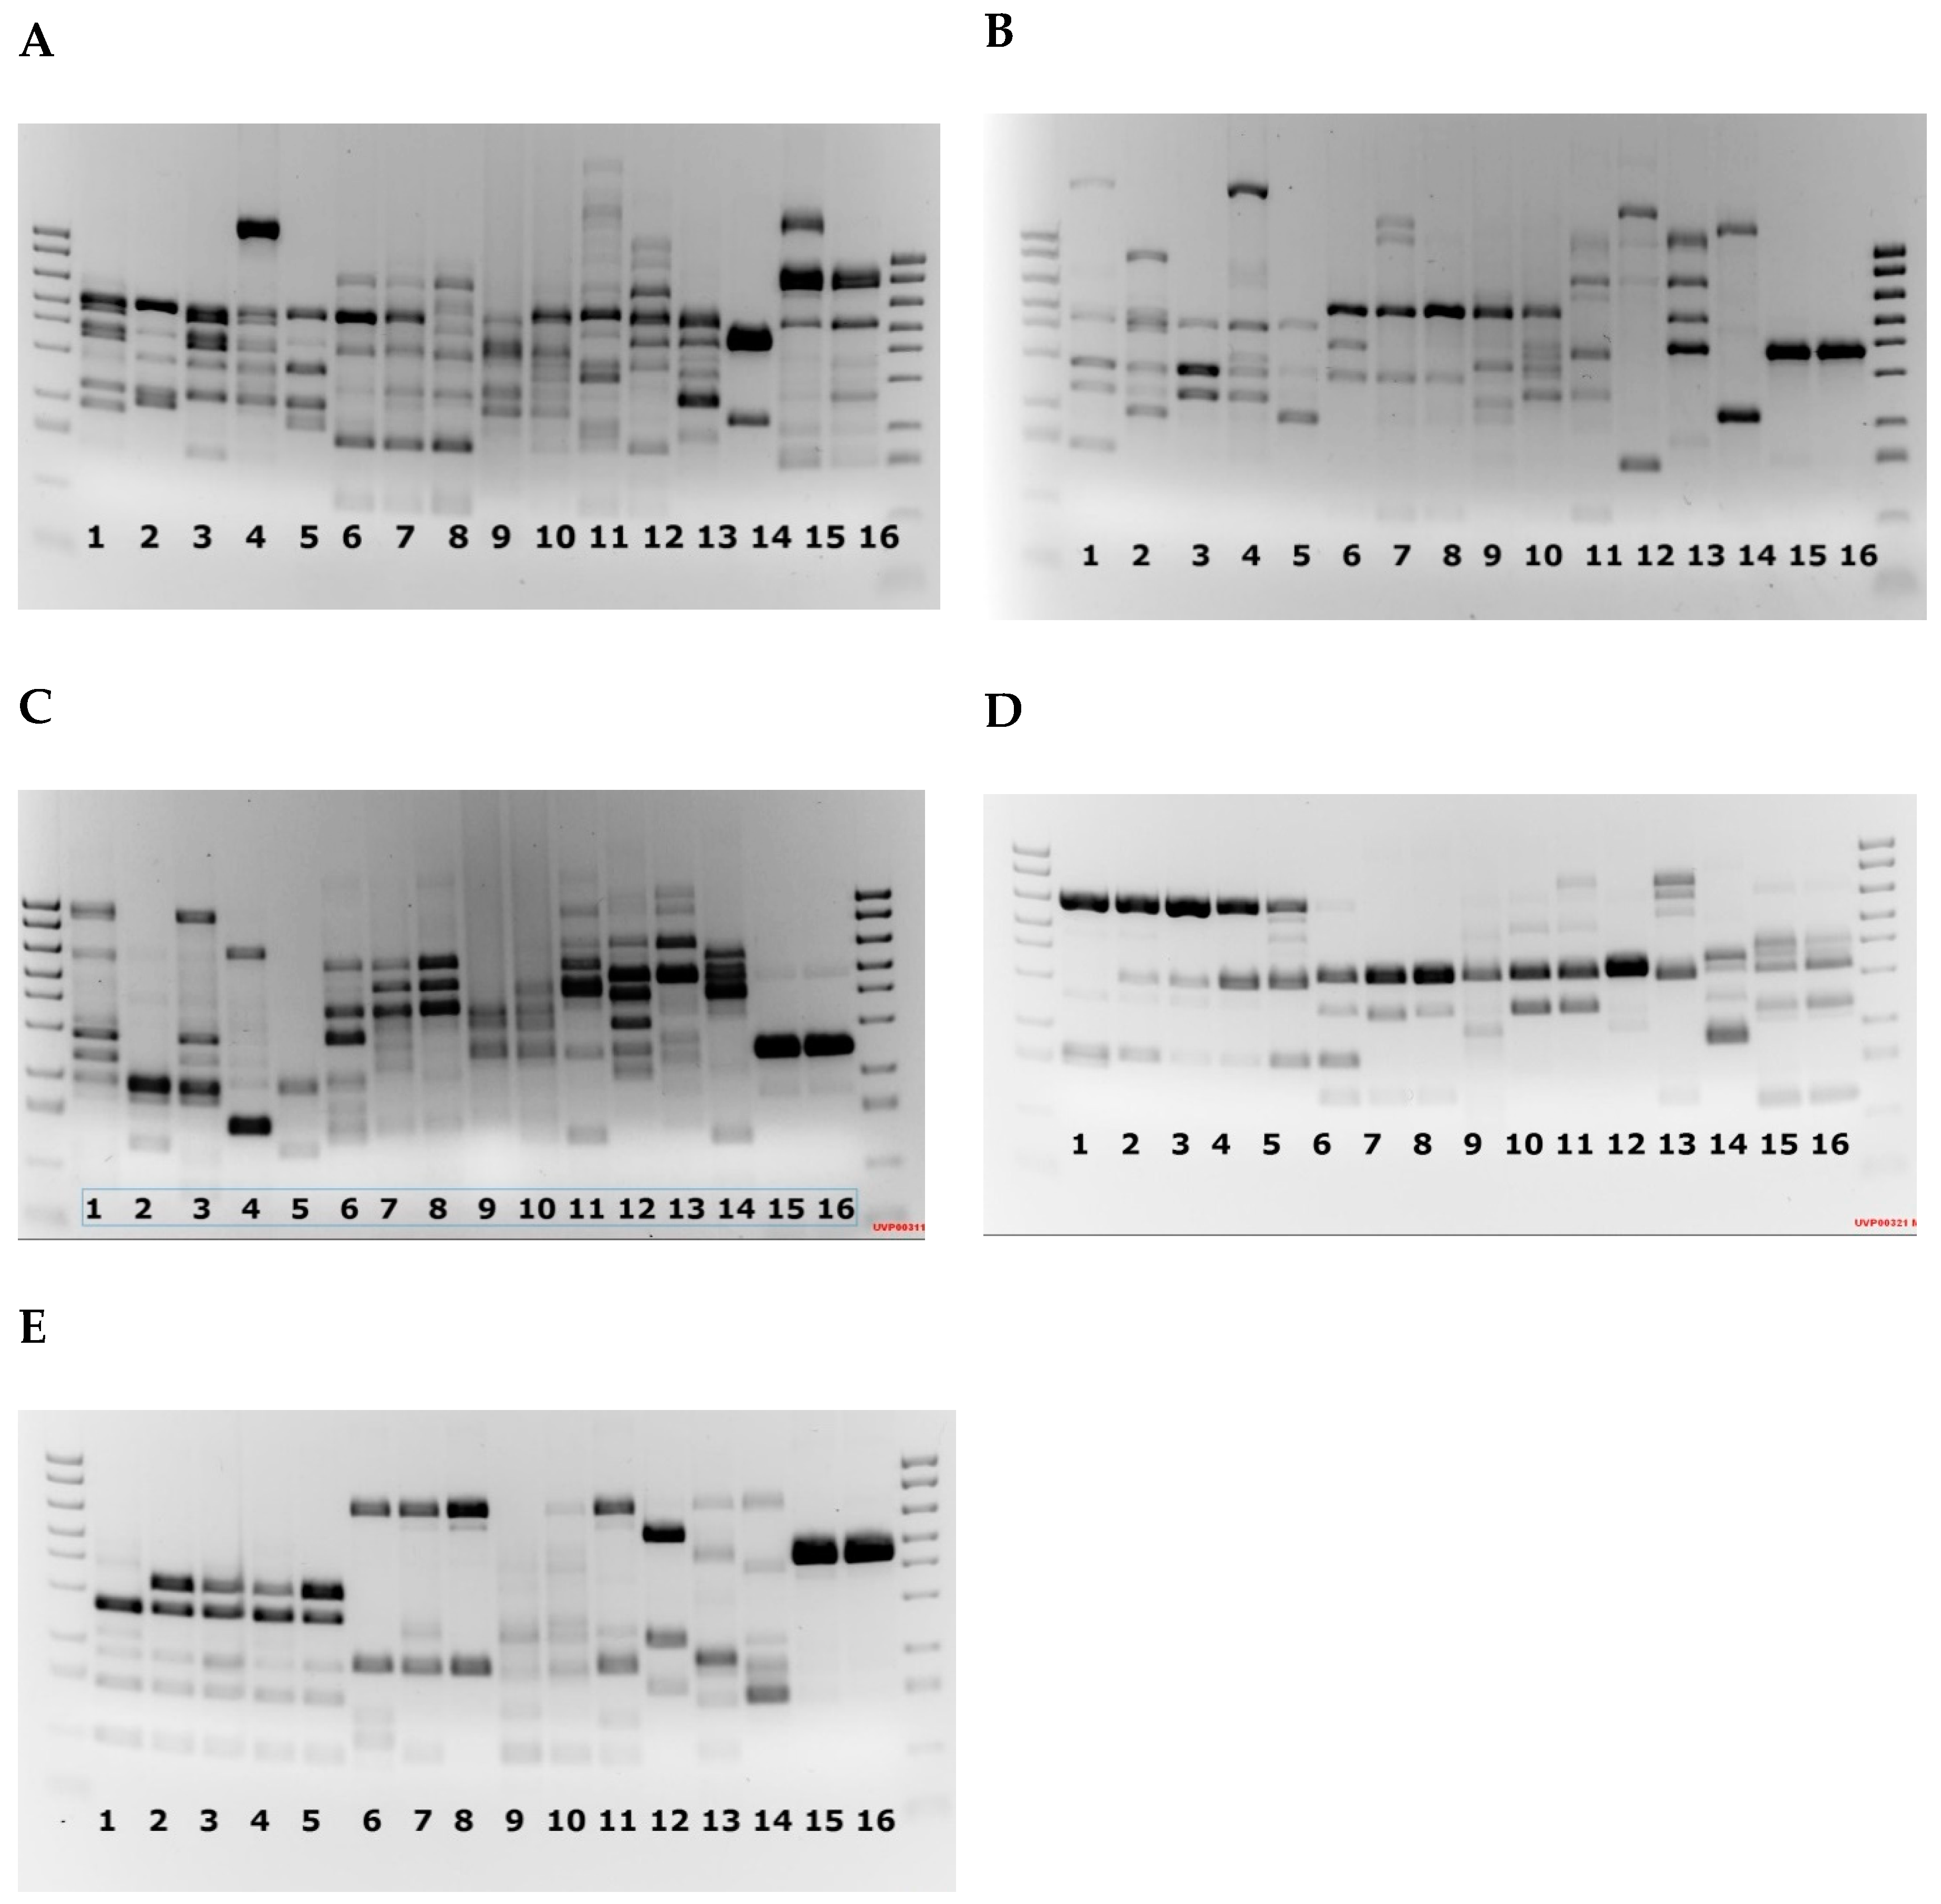
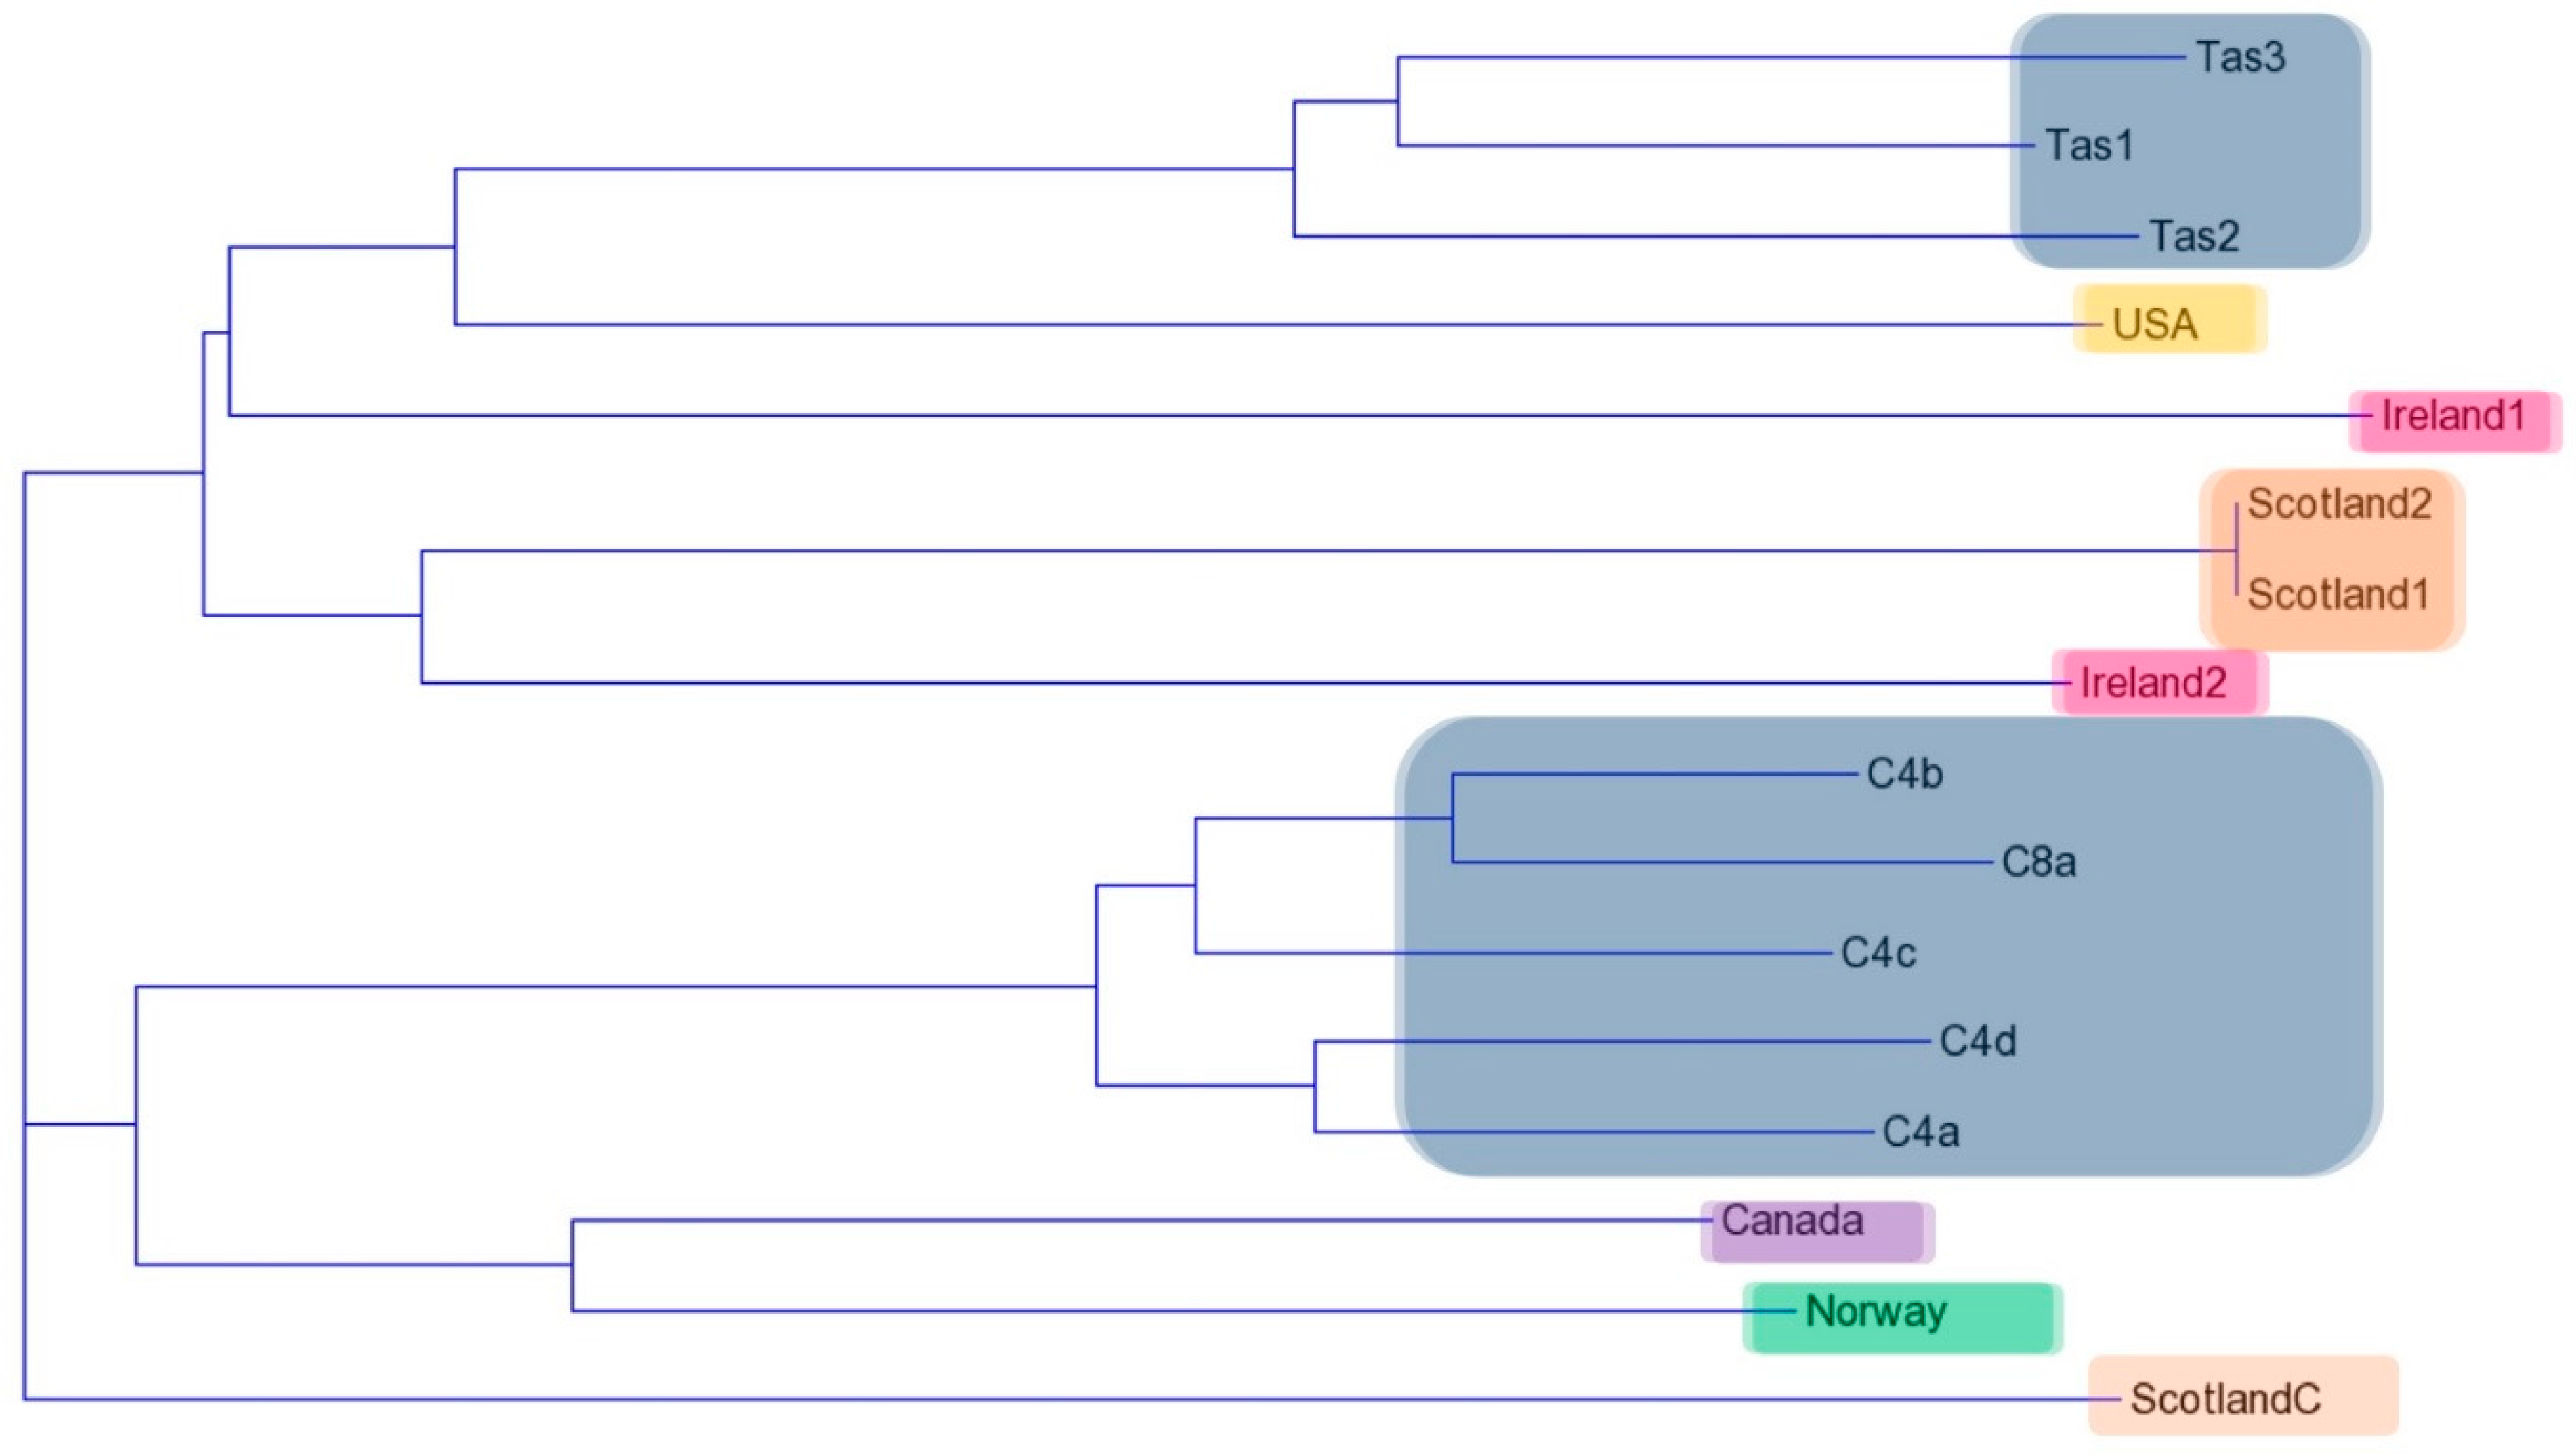
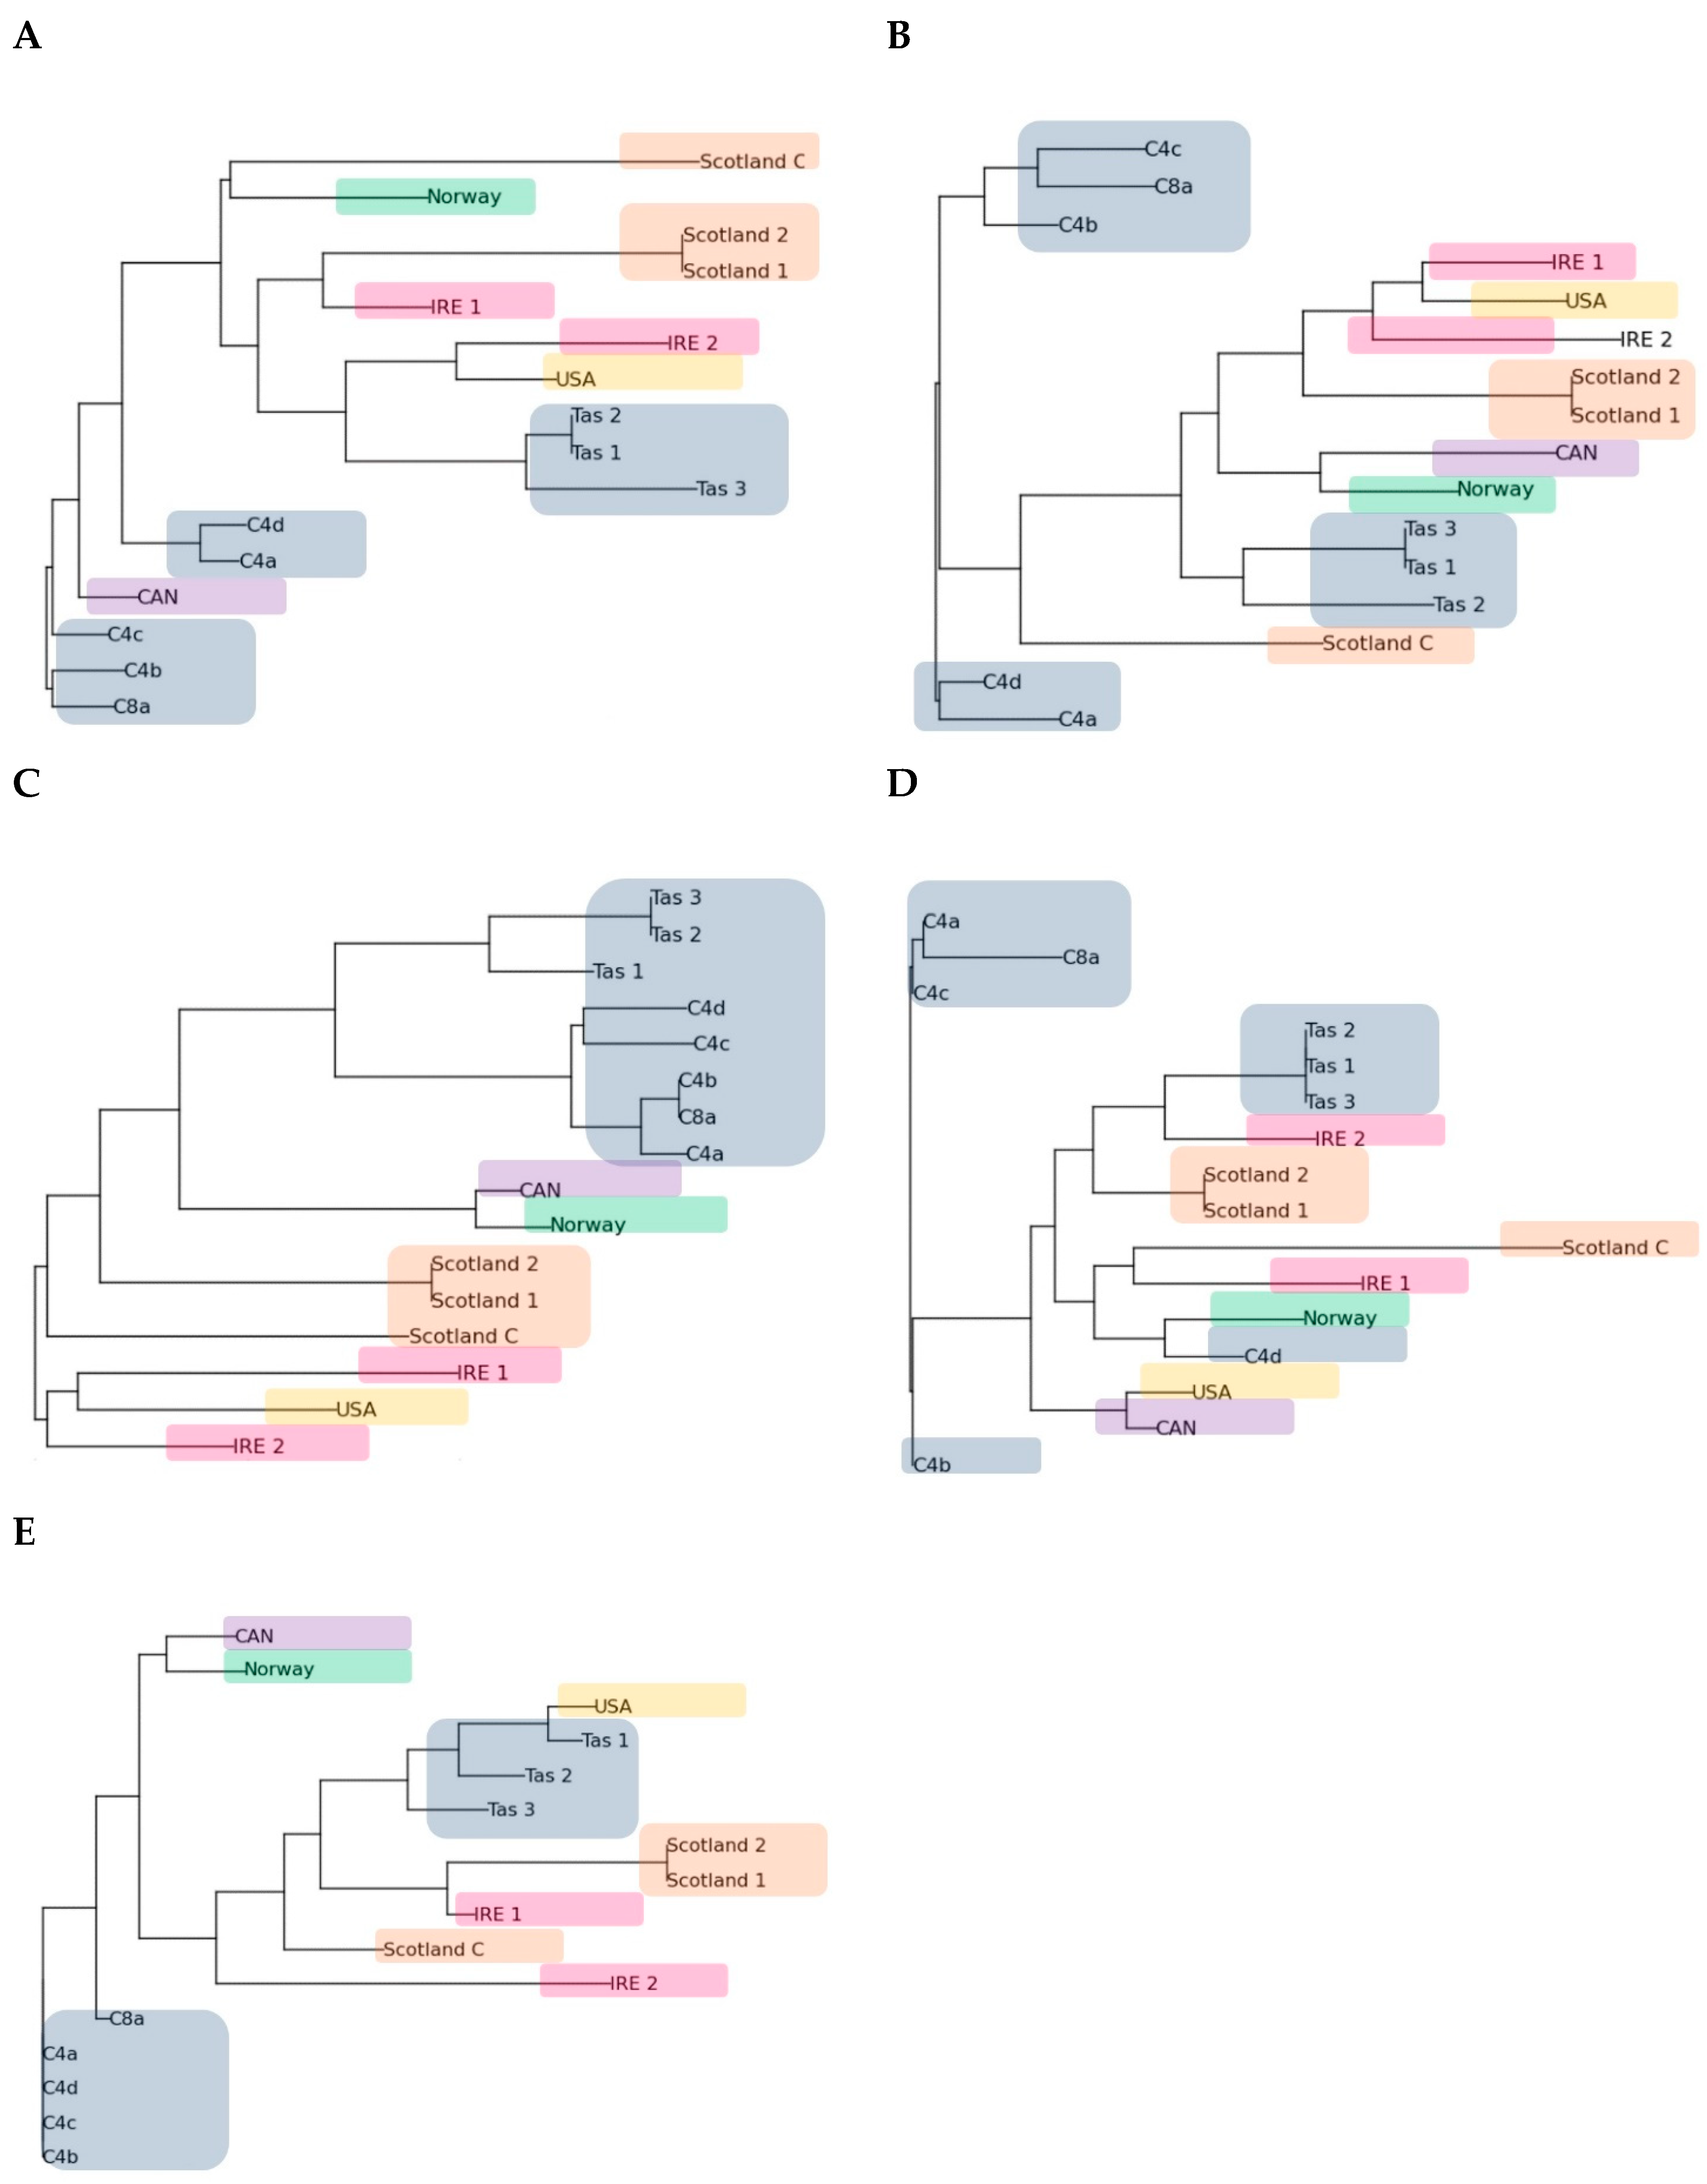
2.4. RAPD Analysis
2.5. Assessment of Potential Bacterial Contamination
3. Discussion
4. Materials and Methods
4.1. Strains and DNA Extraction
4.2. MLST Loci
4.3. MLST Data Analysis
4.4. RAPD PCR Amplification
4.5. PhyElph Analysis
4.6. Statistical Analysis
Author Contributions
Funding
Acknowledgments
Conflicts of Interest
References
- Young, N.D.; Crosbie, P.B.; Adams, M.B.; Nowak, B.F.; Morrison, R.N. Neoparamoeba perurans n. sp., an agent of amoebic gill disease of Atlantic salmon (Salmo salar). Int. J. Parasitol. 2007, 37, 1469–1481. [Google Scholar] [CrossRef] [PubMed]
- Crosbie, P.B.; Bridle, A.R.; Cadoret, K.; Nowak, B.F. In vitro cultured Neoparamoeba perurans causes amoebic gill disease in Atlantic salmon and fulfils Koch’s postulates. Int. J. Parasitol. 2012, 42, 511–515. [Google Scholar] [CrossRef] [PubMed]
- Munday, B.L. Diseases of salmonids. In Proceedings of the Workshop on Disease of Australian Fish and Shellfish; Humphrey, J.D., Langdon, J.S., Eds.; Department of Agriculture and Rural Affairs: Benalla, Australia, 1986; pp. 127–141. [Google Scholar]
- Kent, M.L.; Sawyer, T.K.; Hedrick, R.P. Paramoeba pemaquidensis (Sarcomastigophora:Paramoebidae) infestation of the gills of coho salmon Oncorhynchus kisutch reared in sea water. Diseases Aquati. Org. 1988, 5, 163–169. [Google Scholar] [CrossRef]
- Oldham, T.; Rodger, H.; Nowak, B.F. Incidence and distribution of amoebic gill disease (AGD)—An epidemiological review. Aquaculture 2016, 457, 35–42. [Google Scholar] [CrossRef]
- Dyková, I.; Nowak, B.F.; Crosbie, P.B.; Fiala, I.; Peckova, H.; Adams, M.B.; Dvorakova, H. Neoparamoeba branchiphila n. sp., and related species of the genus Neoparamoeba Page, 1987: Morphological and molecular characterization of selected strains. J. Fish Dis. 2005, 28, 49–64. [Google Scholar] [CrossRef]
- Page, F.C. A New Key to Freshwater and Soil Gymnamoebae: With Instructions for Culture; Freshwater Biological Association: Ambleside Cumbria, UK, 1988. [Google Scholar]
- Nowak, B.F.; Archibald, J.M. Opportunistic but lethal: The mystery of Paramoebae. Trends Parasitol. 2018, 34, 404–419. [Google Scholar] [CrossRef]
- Young, N.D.; Dykova, I.; Nowak, B.F.; Morrison, R.N. Development of a diagnostic PCR to detect Neoparamoeba perurans, agent of amoebic gill disease. J. Fish Dis. 2008, 31, 285–295. [Google Scholar] [CrossRef]
- Young, N.D.; Dykova, I.; Crosbie, P.B.; Wolf, M.; Morrison, R.N.; Bridle, A.R.; Nowak, B.F. Support for the coevolution of Neoparamoeba and their endosymbionts, Perkinsela amoebae-like organisms. Eur. J. Protistol. 2014, 50, 509–523. [Google Scholar] [CrossRef]
- Caraguel, C.G.; O’Kelly, C.J.; Legendre, P.; Frasca, S.J.; Gast, R.J.; Despres, B.M. Greenwood, S.J. Microheterogeneity and coevolution: An examination of rDNA sequence characteristics in Neoparamoeba pemaquidensis and its prokinetoplastid endosymbiont. J. Eukaryot. Microbiol. 2007, 54, 418–426. [Google Scholar] [CrossRef]
- Maiden, C.J.M.; Bygraves, J.; Feil, E.; Morelli, G.; Russel, J.; Urwin, R.; Spratt, B. Multilocus sequence typing: A portable approach to the identification of clones within populations of pathogenic microorganisms. Proc. Natl. Acad. Sci. USA 1998, 95, 3140–3145. [Google Scholar] [CrossRef]
- Delorme, C.; Legravet, N.; Jamet, E.; Hoarau, C.; Alexandre, B.; El-Sharoud, W.M.; Renault, P. Study of Streptococcus thermophilus population on a world-wide and historical collection by a new MLST scheme. Int. J. Food Microbiol. 2017, 242, 70–81. [Google Scholar] [CrossRef] [PubMed]
- Liu, Y.; Lai, Q.; Du, J.; Shao, Z. Genetic diversity and population structure of the Bacillus cereus group bacteria from diverse marine environments. Sci. Rep. 2017, 7, 689. [Google Scholar] [CrossRef] [PubMed]
- Bifeld, E.; Chrobak, M.; Zander, D.; Schleicher, U.; Schonian, G.; Clos, J. Geographical sequence variation in the Leishmania major virulence factor P46. Infect. Genet. Evol. 2015, 30, 195–205. [Google Scholar] [CrossRef] [PubMed]
- Crary, M. Genetic Variability and Its Relationship to Acanthamoeba Pathogenesis. Ph.D. Thesis, Ohio State University, Columbus, OH, USA, 2012. [Google Scholar]
- Gelanew, T.; Hailu, A.; Schonian, G.; Lewis, M.D.; Miles, M.A.; Yeo, M. Multilocus sequence and microsatellite identification of intra-specific hybrids and ancestor-like donors among natural Ethiopian isolates of Leishmania donovani. Int. J. Parasitol. 2014, 44, 751–757. [Google Scholar] [CrossRef]
- Gilchrist, C.A.; Ali, I.K.; Kabir, M.; Alam, F.; Scherbakova, S.; Ferlanti, E.; Caler, E. A Multilocus Sequence Typing System (MLST) reveals a high level of diversity and a genetic component to Entamoeba histolytica virulence. BMC Microbiol. 2012, 12, 151. [Google Scholar] [CrossRef]
- Roman, F.; Iniguez, A.M.; Yeo, M.; Jansen, A.M. Multilocus sequence typing: Genetic diversity in Trypanosoma cruzi I (TC I) isolated from Brazilian didelphids. Parasites Vectors 2018, 11, 107. [Google Scholar] [CrossRef]
- Tomasini, N.; Lauthier, J.J.; Llewellyn, M.S.; Diosque, P. MLSTest: Novel software for multi-locus sequence data analysis in eukaryotic organisms. Infect. Genet. Evol. 2013, 20, 188–196. [Google Scholar] [CrossRef]
- Williams, J.G.K.; Kubelik, A.R.; Livak, K.J.; Rafalski, J.A.; Tingey, S.V. DNA polymorphisms amplified by arbitrary primers are useful as genetic markers. Nucleic Acids Res. 1990, 10, 6531–6535. [Google Scholar] [CrossRef]
- Semagn, K.; Bjørnstad, A.; Ndjiondjop, M.N. An overview of molecular marker methods for plants. Afr. J. Biotechnol. 2006, 5, 2540–2568. [Google Scholar]
- Hadrys, H.; Balick, M.; Schierwater, B. Applicaions of random amplified polymorphic DNA (RAPD) in molecular ecology. Mol. Ecol. 1992, 1, 55–63. [Google Scholar] [CrossRef]
- Kuluev, B.R.; Baymiev, A.K.; Gerashchenkov, G.A.; Chemeris, D.A.; Zubov, V.V.; Kuluev, A.R.; Baymiev, A.K.; Chemeris, A.V. Random priming PCR strategies for identification of multilocus DNA polymorphism in eukaryotes. Russ. J. Genet. 2018, 54, 499–513. [Google Scholar] [CrossRef]
- Peladakis, M.; De Jonckheere, J.F.; Pernin, P. Genetic Variation in the Free-Living Amoeba Naegleria fowleri. Appl. Environ. Microbiol. 1998, 64, 2977–2981. [Google Scholar]
- Alves, J.M.P.; Gusmão, C.X.; Teixeira, M.M.G.; Freitas, D.; Foronda, A.S.; Affonso, H.T. Random amplified polymorphic DNA profiles as a tool for the characterization of Brazilian keratis isolates of the genus Acanthamoeba. Braz. J. Med. Biol. Res. 2000, 33, 19–26. [Google Scholar] [CrossRef] [PubMed]
- Saitou, N.; Nei, M. The Neighbor-joining Method: A New Method for Reconstructing Phylogenetic Trees. Mol. Biol. Evol. 1987, 4, 406–425. [Google Scholar]
- Dyer, A.T.; Leonard, K.J. Contamination, Error, and Nonspecific Molecular Tools. Phytopathology 2000, 90, 565–567. [Google Scholar] [CrossRef]
- Michelmore, R.W.; Paran, I.; Kesseli, R.V. Identification of Markers Linked to Disease-Resistance Genes by Bulked Segregant Analysis: A Rapid Method to Detect Markers in Specific Genomic Regions by Using Segregating Populations. Proc. Natl. Acad. Sci. USA 1991, 88, 9828–9832. [Google Scholar] [CrossRef]
- Soltis, P.S.; Soltis, D.E. Applying the Bootstrap in Phylogeny Reconstruction. Stat. Sci. 2003, 18, 256–267. [Google Scholar] [CrossRef]
- Min, X.J.; Hickey, D.A. Assessing the effect of varying sequence length on DNA barcoding of fungi. Mol. Ecology Notes 2007, 7, 365–373. [Google Scholar] [CrossRef]
- Finlay, B.J. Global Dispersal of Free-Living Microbial Eukaryote Species. Science 2002, 296, 1061–1063. [Google Scholar] [CrossRef]
- Feil, E.J.; Li, B.C.; Aanensen, D.M.; Hanage, W.P.; Spratt, B.G. eBURST: Inferring Patterns of Evolutionary Descent among Clusters of Related Bacterial Genotypes from Multilocus Sequence Typing Data. J. Bacteriol 2004, 186, 1518–1530. [Google Scholar] [CrossRef]
- Mouton, A.; Crosbie, P.; Cadoret, K.; Nowak, B. First record of amoebic gill disease caused by Neoparamoeba perurans in South Africa. J. Fish Dis. 2014, 37, 407–409. [Google Scholar] [CrossRef] [PubMed]
- Casteleyn, G.; Leliaert, F.; Backeljau, T.; Debeer, A.E.; Kotaki, Y.; Rhodes, L.; Vyverman, W. Limits to Gene Flow in a Cosmopolitan Marine Planktonic Diatom. Proc. Natl. Acad. Sci. USA 2010, 107, 12952–12957. [Google Scholar] [CrossRef] [PubMed]
- Lashkari, M.; Manzari, S.; Sahragard, A.; Malagnini, V.; Boykin, L.M.; Hosseini, R. Global genetic variation in the Asian citrus psyllid, Diaphorina citri (Hemiptera: Liviidae) and the endosymbiont Wolbachia: Links between Iran and the USA detected. Pest Manag. Sci. 2014, 70, 1033–1040. [Google Scholar] [CrossRef] [PubMed]
- Dykova, I.; Fiala, I.; Lom, J.; Lukes, J. Perkinsiella amoebae-like enclosymbionts of Neoparamoeba spp., relatives of the kinetoplatid Ichthyobodo. Eur. J. Protistol. 2003, 39, 37–52. [Google Scholar] [CrossRef]
- Ruszczyk, A.; Forlenza, M.; Joerink, M.; Ribeiro, C.M.S.; Jurecka, P.; Wiegertjes, G.F. Trypanoplasma borreli cysteine proteinase activities support a conservation of function with respect to digestion of host proteins in common carp. Dev. Comp. Immunol. 2008, 32, 1348–1361. [Google Scholar] [CrossRef]
- Callahan, H.A.; Litaker, R.W.; Noga, E.J. Molecular Taxonomy of the Suborder Bodonina (Order Kinetoplastida), Including the Important Fish Parasite, Ichthyobodo necator. J. Eukaryot. Microbiol. 2002, 49, 119–128. [Google Scholar] [CrossRef]
- Tanifuji, G.; Cenci, U.; Moog, D.; Dean, S.; Nakayama, T.; David, V.; Archibald, J.M. Genome sequencing reveals metabolic and cellular interdependence in an amoeba-kinteoplastic symbiosis. Sci. Rep. 2017, 7, 11688. [Google Scholar] [CrossRef] [Green Version]
- Bridle, A.R.; Davenport, D.L.; Crosbie, P.B.; Polinski, M.; Nowak, B.F. Neoparamoeba perurans loses virulence during clonal culture. Int. J. Parasitol. 2015, 45, 575–578. [Google Scholar] [CrossRef]
- Emira, N.; Snoussi, M.; Hentati, H.; Sentandreu, R.; del Castillo, L.; Bakhrouf, A.; Valentin, E. Virulence properties and random amplification of polymorphic DNA (RAPD) fingerprinting of Candida albicans isolates obtained from Monastir dental hospital, Tunisia. Afr. J. Biotechnol. 2011, 10, 905–912. [Google Scholar] [CrossRef]
- Rezinciuc, S.; Galindo, J.; Montserrat, J.; Dieguez-Uribeondo, J. AFLP-PCR and RAPD-PCR evidences of the transmission of the pathogen Aphanomyces astaci (Oomycetes) to wild populations of European crayfish from the invasive crayfish species, Procambarus clarkii. Fungal Biol. 2014, 118, 612–620. [Google Scholar] [CrossRef]
- Rodger, H.D.; McArdle, J.F. An outbreak of amoebic gill disease in Ireland. Vet. Rec. 1996, 139, 348–349. [Google Scholar] [CrossRef] [PubMed]
- International Council for the Exploration of the Sea (ICES). Report on the Working Group on Pathology and Diseases of Marine Organisms (WGPDMO); ICES CM 2007/MCC:04; International Council for the Exploration of the Sea: Tenerife, Spain, 2007; 93p. [Google Scholar]
- International Council for the Exploration of the Sea (ICES). Report on the Working Group on Pathology and Diseases of Marine Organisms (WGPDMO); ICES CM 2015/SSGEPI:01; International Council for the Exploration of the Sea: Helsinki, Finland, 2015; 124p. [Google Scholar]
- Steinum, T.; Kvellestad, A.; Rønneberg, L.; Nilsen, H.; Asheim, A.; Fjell, K.; Dale, O. First cases of amoebic gill disease (AGD) in Norwegianseawater farmed Atlantic salmon, Salmo salar L., and phylogeny of the causative amoeba using 18S cDNAsequences. J. Fish Dis. 2008, 31, 205–214. [Google Scholar] [CrossRef] [PubMed]
- O’Donnell, K.; Humber, R.A.; Geiser, D.M.; Kang, S.; Park, B.; Robert, V.A.; Rehner, S.A. Phylogenetic diversity of insecticolous fusaria inferred from multilocus DNA sequence data and their molecular identification via FUSARIUM-ID and Fusarium MLST. Mycologia 2012, 104, 427–445. [Google Scholar] [CrossRef] [Green Version]
- Kearse, M.; Moir, R.; Wilson, A.; Stone-Havas, S.; Cheung, M.; Sturrock, S.; Dummond, A. Geneious Basic: An integrated and extendable desktop software platform for the organization and analysis of sequence data. Bioinformatics 2012, 28, 1647–1649. [Google Scholar] [CrossRef] [PubMed]
- Crosbie, P.B.B.; Bridle, A.; Leef, M.J.; Nowak, B. Effects of different batches of Neoparamoeba perurans and fish stocking densities on the severity of amoebic gill disease in experimental infections of Atlantic salmon, Salmo salar L. Aquac. Res. 2010, 41, 505–516. [Google Scholar] [CrossRef]
- Diosque, P.; Tomasini, N.; Lauthier, J.J.; Messenger, L.A.; Monje Rumi, M.M.; Ragone, P.G.; Yeo, M. Optimized multilocus sequence typing (MLST) scheme for Trypanosoma cruzi. PLOS Negl. Trop. Dis. 2014, 8. [Google Scholar] [CrossRef] [PubMed]
- Pavel, A.B.; Vasile, C.I. PyElph—a software tool for gel images analysis and phylogenetics. BMC Bioinform. 2012, 13, 9. [Google Scholar] [CrossRef] [Green Version]
- XLSTAT: A Complete Statistical Add-in for Microsoft Excel (Version 2016.03 for Windows); Addinsoft: Paris, France, 2016.
- Boc, A.; Diallo, A.B.; Makarenkov, V. T-REX: A web server for inferring, validating and visualizing phylogenetic trees and networks. Nucleic Acids Res. 2012, 40, W573–W579. [Google Scholar] [CrossRef] [Green Version]


| Gene Loci | No. of Genotypes | No. of Polymorphic Sites | Typing Efficiency | Discriminatory Power | Genbank Acquisition Number |
|---|---|---|---|---|---|
| actb | 2 | 1 | 2 | 0.588 | KX363877 KX363880 |
| tubb | 2 | 1 | 2 | 0.228 | KX363876 KX363879 |
| ef1 | 1 | 0 | infinite | 0.118 | KX363881 |
| ef2 | 3 | 1 | 3 | 0.551 | KX363875 KX363882 KX363878 |
| Rpb1 | 1 | 0 | Infinite | 0.118 | KX363883 |
| sdha | 1 | 0 | Infinite | 0.118 | MN399678 |
| Tas C8 | Tas C4a | Tas C4b | Tas C4c | Tas C4d | Tas 1 | Tas 2 | Tas 3 | Norway | Canada | USA | Ireland 1 | Ireland 2 | Scotland 1 C | Scotland 2 1 | Scotland C 2 | |
|---|---|---|---|---|---|---|---|---|---|---|---|---|---|---|---|---|
| Tas C8a | 1 | |||||||||||||||
| Tas C4a | 0.667 | 1 | ||||||||||||||
| Tas C4b | 0.806 | 0.719 | 1 | |||||||||||||
| Tas C4c | 0.667 | 0.742 | 0.774 | 1 | ||||||||||||
| Tas C4d | 0.576 | 0.759 | 0.625 | 0.700 | 1 | |||||||||||
| Tas 1 | 0.195 | 0.231 | 0.225 | 0.231 | 0.216 | 1 | ||||||||||
| Tas 2 | 0.167 | 0.200 | 0.195 | 0.200 | 0.184 | 0.680 | 1 | |||||||||
| Tas 3 | 0.171 | 0.175 | 0.200 | 0.205 | 0.158 | 0.708 | 0.640 | 1 | ||||||||
| Norway | 0.250 | 0.289 | 0.282 | 0.324 | 0.353 | 0.265 | 0.229 | 0.200 | 1 | |||||||
| Canada | 0.293 | 0.300 | 0.325 | 0.368 | 0.289 | 0.243 | 0.243 | 0.216 | 0.516 | 1 | ||||||
| USA | 0.149 | 0.128 | 0.174 | 0.152 | 0.111 | 0.343 | 0.343 | 0.278 | 0.200 | 0.342 | 1 | |||||
| Ireland 1 | 0.111 | 0.089 | 0.111 | 0.114 | 0.070 | 0.132 | 0.162 | 0.105 | 0.158 | 0.205 | 0.297 | 1 | ||||
| Ireland 2 | 0.220 | 0.195 | 0.190 | 0.167 | 0.211 | 0.194 | 0.194 | 0.200 | 0.189 | 0.205 | 0.333 | 0.189 | 1 | |||
| Scotland C | 0.179 | 0.250 | 0.211 | 0.216 | 0.235 | 0.114 | 0.147 | 0.152 | 0.111 | 0.162 | 0.128 | 0.143 | 0.176 | 1 | ||
| Scotland 1 | 0.179 | 0.154 | 0.179 | 0.154 | 0.200 | 0.219 | 0.147 | 0.188 | 0.212 | 0.162 | 0.158 | 0.176 | 0.290 | 0.091 | 1 | |
| Scotland 2 | 0.179 | 0.154 | 0.179 | 0.154 | 0.200 | 0.219 | 0.147 | 0.188 | 0.212 | 0.162 | 0.158 | 0.176 | 0.290 | 0.091 | 1 | 1 |
| Origin | Isolate | Year | Type | Fixation | Year of First Recorded AGD Outbreak (Reference) |
|---|---|---|---|---|---|
| Tasmania, Australia | Tasmania C8a | First Isolated 2008, In clonal culture since 2010 | Clonal | Lab Isolate | 1985 [3] |
| Tasmania, Australia | Tasmania C4a | First Isolated 2008, In clonal culture since 2010 | Clonal | Lab Isolate | |
| Tasmania, Australia | Tasmania C4b | First Isolated 2008, In clonal culture since 2010 | Clonal | Lab Isolate | |
| Tasmania, Australia | Tasmania C4c | First Isolated 2008, In clonal culture since 2010 | Clonal | Lab Isolate | |
| Tasmania, Australia | Tasmania C4d | First Isolated 2008, In clonal culture since 2010 | Clonal | Lab Isolate | |
| Tasmania, Australia | Tasmania 1 | 2014 | RNA preservation solution | ||
| Tasmania, Australia | Tasmania 2 | 2015 | RNA preservation solution | ||
| Tasmania, Australia | Tasmania 3 | 2015 | RNA preservation solution | ||
| Ireland | Ireland 1 | 2014 | RNA preservation solution | 1995 [44] | |
| Ireland | Ireland 2 | 2015 | RNA preservation solution | ||
| Scotland | Scotland 1 | 2012 | RNA preservation solution | 2006 [45] | |
| Scotland | Scotland 2 | 2014 | RNA preservation solution | ||
| Scotland | Scotland C | 2014 | Clonal | RNA preservation solution | |
| Washington, USA | USA | 2015 | Mixed Gill Isolation | Lysis Buffer | 1985 [4] |
| British Columbia, Canada | Canada | 2015 | Mixed Gill Isolation | Lysis Buffer | 2014 [46] |
| Norway | Norway | 2014 | Gill Arch | 96% Ethanol | 2006 [47] |
| Gene | Sense Primer Sequence 5′-3 | Antisense Primer Sequence | Amplicon Length (bp) |
|---|---|---|---|
| ef1 Sense | AGAAGGAAGCCGCCGATATG | GACAACCATACCGGGCTTCA | 558 |
| ef2 Sense | GAGGAGTACGCCCAAATCCC | CCATAGATACCACCACGGGC | 480 |
| Rpb1 Sense | GCTGAGGATCGACCCCAAAA | CGCGACGTATCTCTGAAGCT | 512 |
| bact Sense | CATCTATGAGGGTTATG | GATGATCTTGATCTTCA | 375 |
| tubb Sense | CTTTGTCCCTCCACCAGCTT | CGCTGGACTTTTGTTGGAGC | 378 |
| sdha Sense | GGTGGTATTACTGGACGACATCT | GGCAGAGATTGGAAGGAA | 340 |
© 2019 by the authors. Licensee MDPI, Basel, Switzerland. This article is an open access article distributed under the terms and conditions of the Creative Commons Attribution (CC BY) license (http://creativecommons.org/licenses/by/4.0/).
Share and Cite
Johnson-Mackinnon, J.C.; Crosbie, P.B.B.; Karlsbakk, E.; Marcos-Lopez, M.; Paley, R.; Nowak, B.F.; Bridle, A.R. Multilocus Sequence Typing (MLST) and Random Polymorphic DNA (RAPD) Comparisons of Geographic Isolates of Neoparamoeba perurans, the Causative Agent of Amoebic Gill Disease. Pathogens 2019, 8, 244. https://0-doi-org.brum.beds.ac.uk/10.3390/pathogens8040244
Johnson-Mackinnon JC, Crosbie PBB, Karlsbakk E, Marcos-Lopez M, Paley R, Nowak BF, Bridle AR. Multilocus Sequence Typing (MLST) and Random Polymorphic DNA (RAPD) Comparisons of Geographic Isolates of Neoparamoeba perurans, the Causative Agent of Amoebic Gill Disease. Pathogens. 2019; 8(4):244. https://0-doi-org.brum.beds.ac.uk/10.3390/pathogens8040244
Chicago/Turabian StyleJohnson-Mackinnon, Jessica C., Philip B. B. Crosbie, Egil Karlsbakk, Mar Marcos-Lopez, Richard Paley, Barbara F. Nowak, and Andrew R. Bridle. 2019. "Multilocus Sequence Typing (MLST) and Random Polymorphic DNA (RAPD) Comparisons of Geographic Isolates of Neoparamoeba perurans, the Causative Agent of Amoebic Gill Disease" Pathogens 8, no. 4: 244. https://0-doi-org.brum.beds.ac.uk/10.3390/pathogens8040244