
Active Vibration-Based Condition Monitoring of a Transmission Line


1
Guangdong Power Grid Company Limited, China Southern Power Grid, Guangzhou 510050, China
2
Yangjiang Power Supply Bureau, Guangdong Power Grid Co. Ltd., Yangjiang 529599, China
3
Planning Research Center, Guangdong Power Grid Co. Ltd., Guangzhou 510699, China
4
School of Electronics and Information, Xi’an Polytechnic University, Xi’an 710048, China
*
Author to whom correspondence should be addressed.
Actuators 2021, 10(12), 309; https://0-doi-org.brum.beds.ac.uk/10.3390/act10120309
Submission received: 21 October 2021
/
Revised: 16 November 2021
/
Accepted: 17 November 2021
/
Published: 25 November 2021
(This article belongs to the Special Issue Vibration Control and Structure Health Monitoring)
Abstract
:In the power system, the transmission tower is located in a variety of terrains. Sometimes there will be displacement, inclination, settlement and other phenomena, which eventually lead to the collapse of the tower. In this paper, a method for monitoring the settlement of a transmission tower based on active vibration response is proposed, which is based on the principle of modal identification. Firstly, a device was designed, which includes three parts: a monitoring host, wireless sensor and excitation device. It can tap the transmission tower independently and regularly, and collect the vibration response of the transmission tower. Then, vibration analysis experiments were used to validate the horizontal vibration responses of transmission towers which can be obtained by striking the transmission towers from either the X direction or Y direction. It can be seen from the frequency response function that the natural frequencies obtained from these two directions are identical. Finally, the transmission tower settlement experiment was carried out. The experimental results show that the third to fifth natural frequencies decreased most obviously, even up to 2.83 Hz. Further, it was found that under different conditions, as long as the tower legs adjacent to the excitation position settle, the natural frequency will decrease more significantly, which is very helpful for engineering application.
1. Introduction
Transmission towers, like other large-scale structures, may settle due to their weight, soil void compaction and water content, especially in mountainous areas, river beaches, coal mines and other unattended areas. If such settlement cannot be repaired in time, it may cause severe accidents, such as transmission tower collapse and transmission line conductor disconnection [1]. Due to the settlement-induced changes in the stresses in transmission towers [2], many scholars have attempted to analyze the failure behavior of transmission towers through finite element analysis [3,4]. The purpose of such studies is to optimize the tower structure; however, at present, there is no way to avoid the risk of damage [5].
To comprehensively track the structural health of transmission towers in real time, many online monitoring technologies have been proposed and applied. The online monitoring of a transmission tower tilt is currently the most widely used technology for this purpose, especially in China. This approach measures the inclination of a transmission tower through two inclination sensors and provides an early warning when certain conditions are met [6]. This approach is a simple structural health monitoring (SHM) method for transmission towers, which replaces previous techniques using theodolite measurements and enables the remote monitoring of transmission towers. However, in this approach, when the system detects that the tower is inclined, the tower has already been severely deformed, and correcting the tower orientation is not only costly but also creates a large potential safety hazard after maintenance. Automatic recognition from photographs is an intuitive SHM method for engineering systems, which replaces conventional sensors, such as strain gauges, that can only produce results at a discrete number of points [7]. Many engineers and scholars have attempted to use this method to identify changes in transmission tower structures [8], for which robots and unmanned aerial vehicles (UAVs) are widely used [9,10]. There are also methods based on close-range photogrammetry technology and synthetic-aperture radar, which are also used to detect the deformation of transmission towers, avoiding the shortcomings of strain gauges [11,12]. However, these methods have many limitations, such as certain weather conditions (e.g., heavy fog and snow), the camera location, and the photograph background. There are also some transmission towers in some areas that use stress monitoring to monitor the state of the reaction structure, including the use of resistance-type strain gauges and fiber Bragg grating strain gauges [13,14]. This method requires that the number and location of the sensors be adjusted after installation. In addition, this method requires a strong adhesive, which increases the difficulty of field work.
A vibration signal usually contains the structural parameters of an object because its structural change will cause variations in the natural frequency. In engineering, modal analysis is often used to identify structural damage in structures such as bridges [15], wind turbine [16], and transmission wires [17]. Other studies have performed vibration analyses of transmission towers [18], such as the improved neural network used to predict the damage of offshore wind turbine towers [19]. Some scholars have carried out nonlinear buckling analyses of tower line systems, through which they determined the critical wind load and analyzed the dynamic characteristics of tower line systems under different wind loads. The results in the literature show that the lower natural frequency is a useful index for predicting the occurrence of structural instability [20]. Moreover, scholars have established transmission towers in mountainous areas to observe the corresponding wind forces and have obtained the wind characteristics and wind response of transmission towers through experiments [21]. Wireless acceleration sensors are widely used in SHM to monitor the dynamic response of systems [22]. Especially in recent years, there has been growing interest in using micro electro-mechanical system (MEMS) accelerometers—which have a small volume and a high precision—for SHM [23]. Some scholars have studied the vibration response of transmission towers under environmental loads by monitoring the wind speed and vibration acceleration [24,25]. A fiber Bragg grating sensor was designed to measure tower vibrations under hurricane and strong wind conditions [26] and identify structural damage. Most of the above methods detect structural damage based on an analysis of wind-induced vibrations. However, sometimes the vibration of a tower is weak under the action of wind. Therefore, if vibration monitoring is used for tower settlement monitoring, it needs a longer measurement time span to obtain better results, which will lead to excessive power consumption. Moreover, as the data increase, the analysis time increases.
To increase the feasibility of using the vibration method to measure the settlement of a transmission tower, an active vibration-based SHM system was designed for a transmission tower in this paper. This SHM system uses a force-generating device to automatically strike the tower—causing vibrations—and then analyzes the tower settlement from the vibration signal. This method does not rely on the weak signals of wind-induced vibrations, allowing more stable vibration information to be obtained. Finally, a field test was conducted on a 110 kV transmission tower, and how the natural frequency of the tower changed under different settlement conditions was analyzed.
2. Operating Principle and Monitoring System
2.1. Operating Principle
When a transmission tower vibrates, the vibration has multiple degrees of freedom. The Equation of motion of a forced, damped linear system of the transmission tower can be expressed as follows:
where M, C and K are the mass, damping and stiffness matrices of the tower structure, respectively; is the displacement matrix of the tower vibration signal; is the velocity matrix of the tower vibration signal; is the acceleration matrix of the tower vibration signal; and is the force that causes the tower vibration.
Equation (1) shows that when the force is constant, the mass, damping and stiffness matrices can be calculated from the vibration signal [27,28]. The stiffness matrix K and the damping matrix C of the transmission tower will change when tower settlement occurs, especially when the settlement of the tower foundation is uneven. Moreover, previous studies have theoretically shown that different frequency bands from different forces can excite different order modes; nevertheless, this phenomenon will not substantially affect the modal parameters of the system. In actual operation, the main factor causing the vibration of the transmission tower is the natural wind load. However, the effect of the natural wind load is not continuous, and the magnitude of this load varies. In some areas, the wind load is not sufficient to induce obvious transmission tower vibrations. The analysis process is obviously affected by time, so the accuracy of the identification effect is limited. For this reason, an excitation device was designed for the modal identification of transmission towers, which can use the natural frequency of the tower to monitor whether tower settlement has occurred.
The designed monitoring system consists of a monitoring device, a force-generating device, a wireless acceleration sensor and a monitoring center. The monitoring device controls the force-generating device, which excites the tower either at a certain time or in a regular pattern. The vibration data from the acceleration sensor are sent to the monitoring center through a 4G network for analysis.
2.2. Monitoring Device
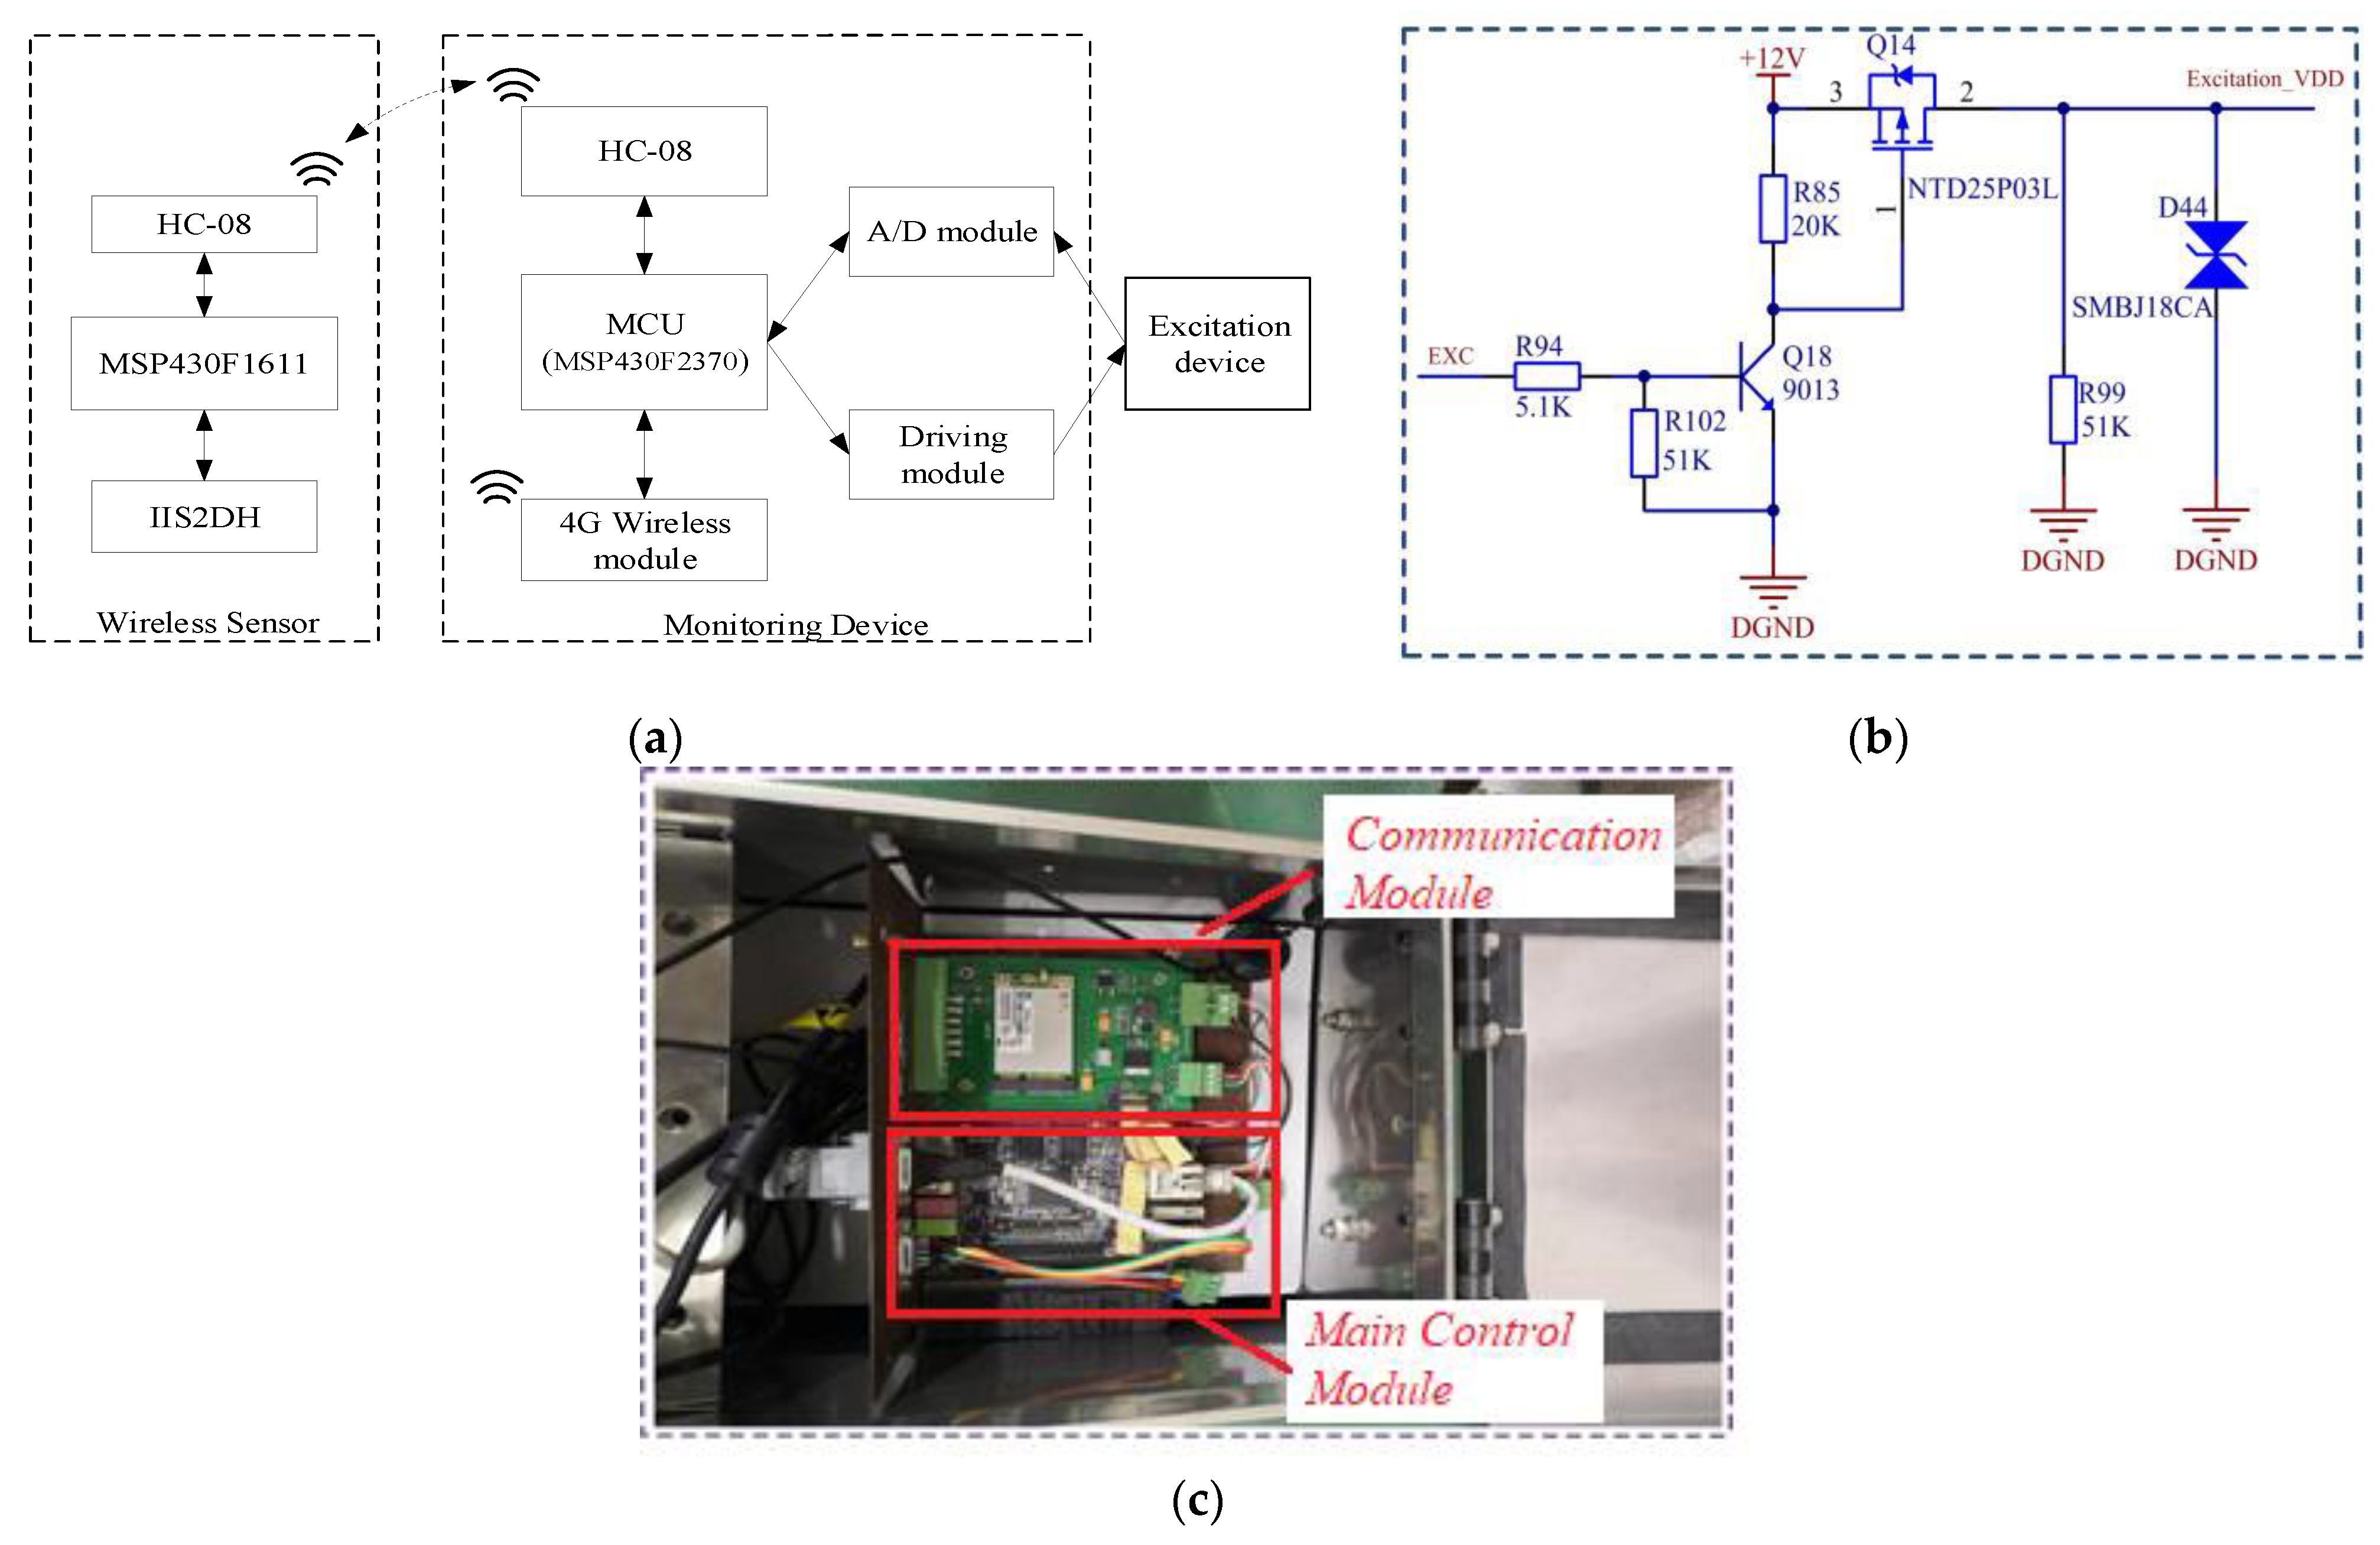
The monitoring device controls the force-generating device to strike the transmission tower, collects the impact force signal, and collects the transmission tower vibration data from the wireless acceleration sensor. The monitoring device is composed of a power module, a main control module, a 4G wireless module, a Bluetooth module, an analog-to-digital (A/D) sampling module and a driver module, as shown in Figure 1a. The power module, which is composed of a solar panel, a battery and a controller, provides power for the whole device. The main control module is composed of a MSP430F2370 microcontroller, an HC-08 Bluetooth module and a 4G wireless module, which serves as the communication module. The 4G wireless module is used for communication between the monitoring device and the remote monitoring center. The HC-08 Bluetooth module is used to communicate with the wireless acceleration sensor. The force-generating device is driven by current. To achieve this, a driving module is added to the monitoring device, as shown in Figure 1b. The on/off capability of the triode in the figure is controlled by the input/output (IO) port of the microcontroller. For the A/D sampling module, an AD7705 chip is used to record the impact force signal from the excitation device. Figure 1c shows a photograph of the main control board and power control board.
2.3. Force-Generating Device
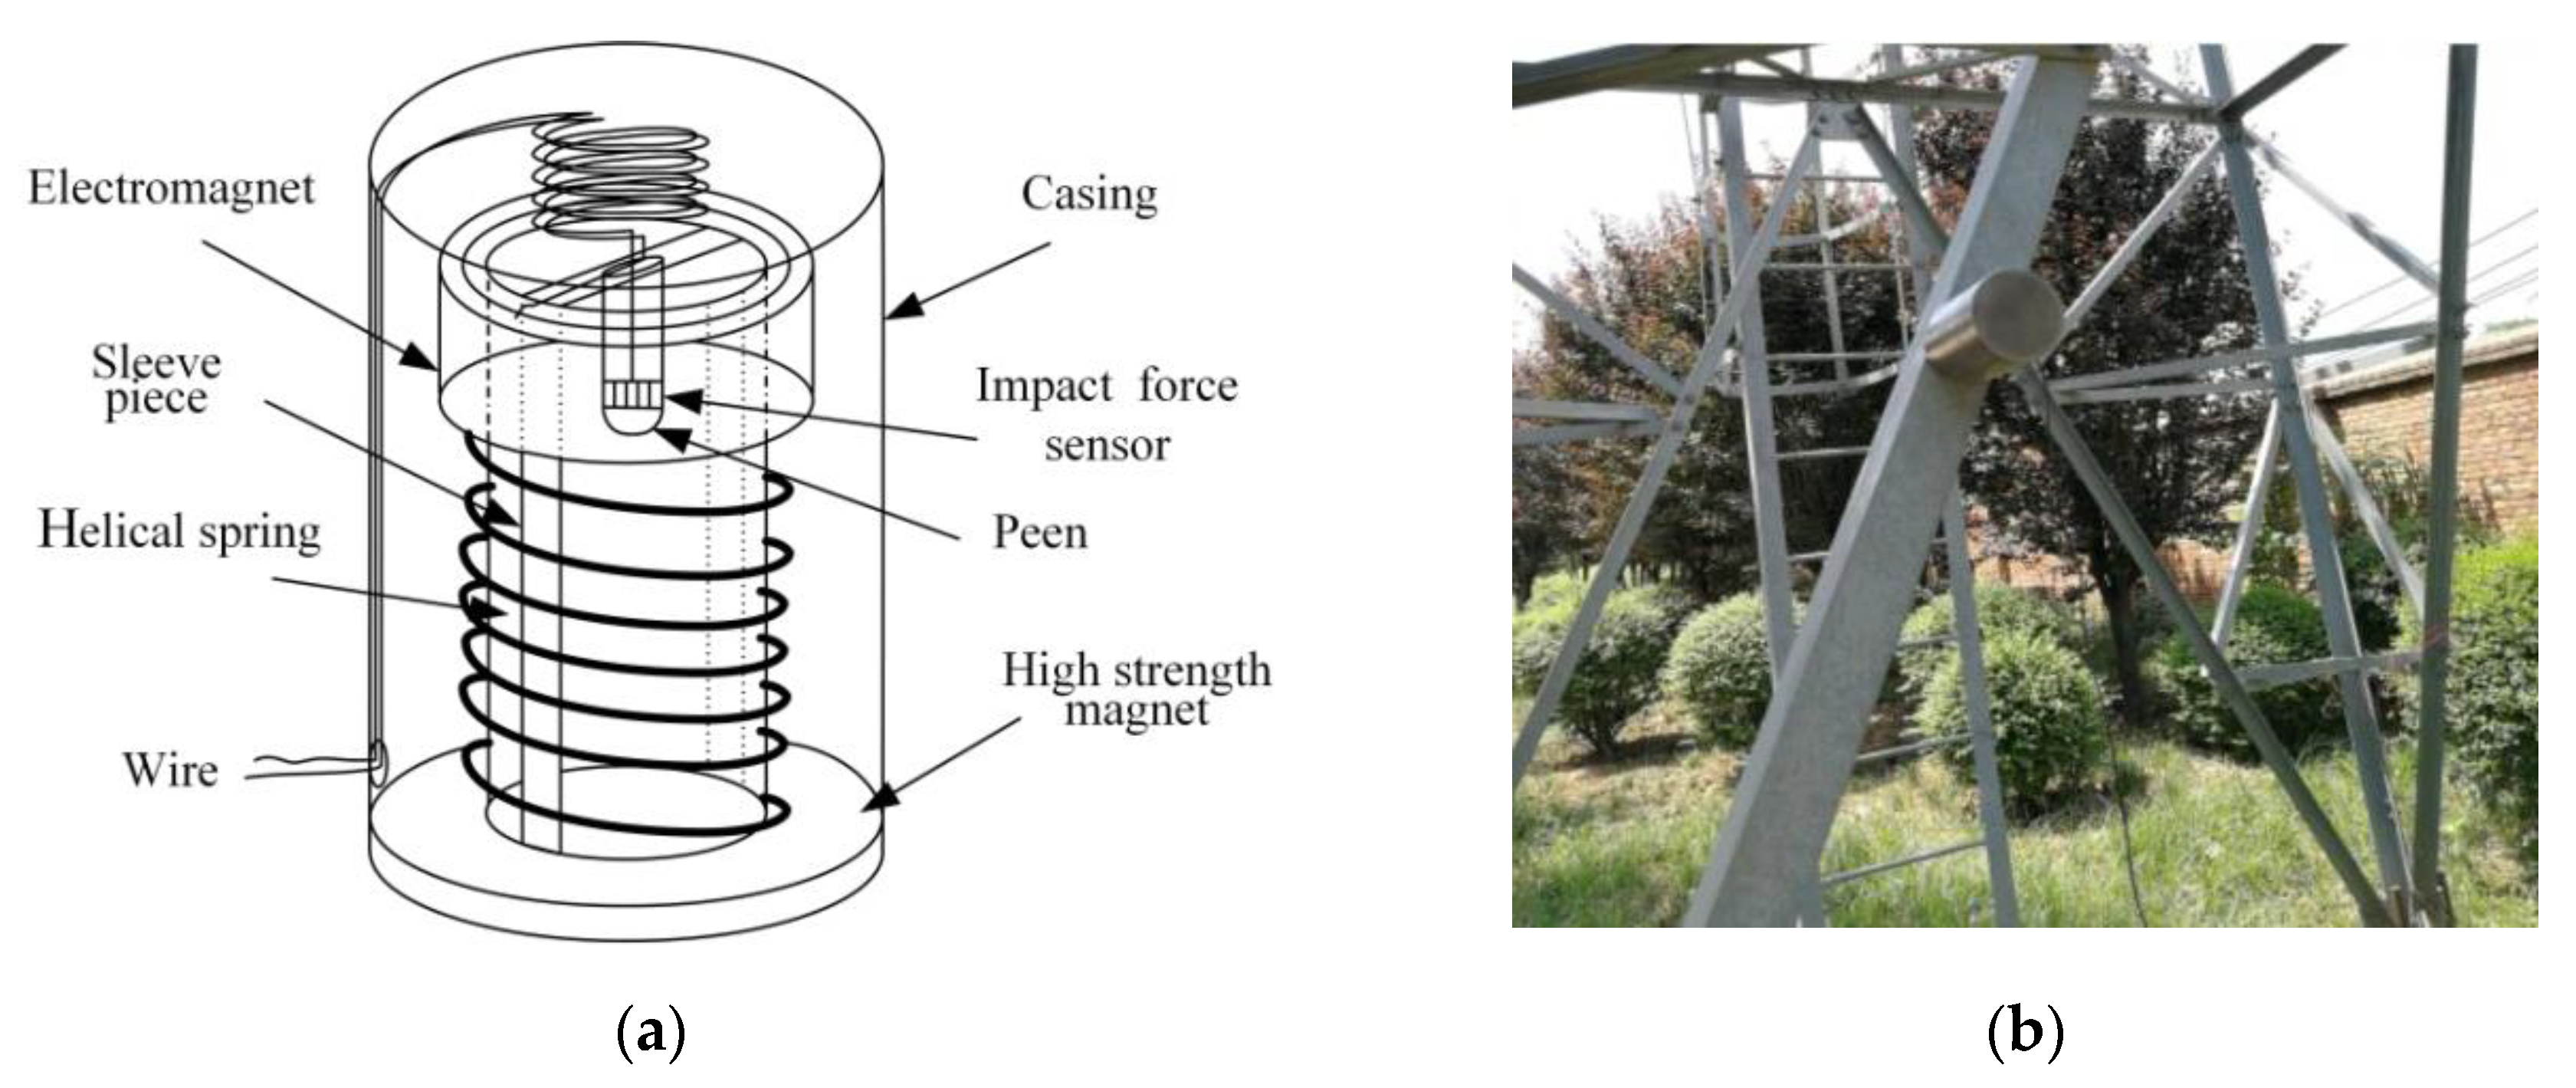
The force-generating device strikes the tower under the control of the monitoring device. As shown in Figure 2, the force-generating device designed in this paper is mainly composed of an electromagnet, a high-strength magnet, a helical spring, an impact force sensor, a sleeve, a hammer head, a casing and an expansion wire. The working process of the force-generating device is described hereafter. When a force pulse is needed, the main control module generates an approximately 5-ms pulse through the I/O port. At this time, the electromagnet is magnetized under the action of the current and the coil spring is compressed under the attraction of the high-strength magnet, which causes the hammer fixed on the electromagnet to hit the tower, generating a force pulse of approximately 40 N. Then, under the restoring force of the coil spring, the hammer head returns to the initial position and waits for the next trigger.
The generation and dispersion of the force is very important. Although this SHM method only requires a force of approximately 40 N, the magnitude of the force pulse is affected by the current, the electromagnet and the permanent magnet. For this system, a traction electromagnet and neodymium boron permanent magnet were used. When driving by a power supply at 12 V and 1 A, the system can produce a striking force of approximately 45 N. The spring is the key to the spring back of the hammer head. The spring used in this system is composed of soft stainless steel and has a spring constant of 13.3 N/mm.
The hammer head is one of the most important parts of the force-generating device because the system must excite the low-order modes of the tower (which are useful for predicting the occurrence of structural instability) to enable easy identification of tower settlement. If the hammer head was too hard, the frequency band of the excitation signal would be too wide, and the excitation energy per unit frequency would not be sufficiently high, which would affect the signal-to-noise ratio of the system. Moreover, because the acceleration sensor is particularly sensitive to high-frequency signal components, an excessively wide frequency band would make it inconvenient to analyze the low-frequency signal. In previous studies, different hammers were attempted, such as steel hammers, aluminum alloy hammers and nylon hammers, and it was found that the frequency bands created by steel hammers and aluminum alloy hammers were too wide; it was easier to identify the low-order frequency response of the system with nylon hammers. Therefore, the hammer head is made of a nylon material and is attached with a threaded connection, which makes it easy to fix the impact force sensor on the hammer head.
Furthermore, the casing is a hollow cylinder made of 304 stainless steel. The bottom of the casing is a ring-shaped, high-strength, neodymium boron magnet, which allows the whole device to firmly contact the tower. The sleeve is made of a light aluminum alloy, and the soft 304 stainless-steel helical spring is wound around the sleeve at equal intervals. A circular electromagnet is fixed at the top of the spring coil. The impact sensor in this system is a piezoelectric force sensor, which is fixed on the electromagnet through a bar structure and can be directly sampled by the A/D module. Figure 2a shows a schematic of the excitation device.
2.4. Wireless Acceleration Sensor
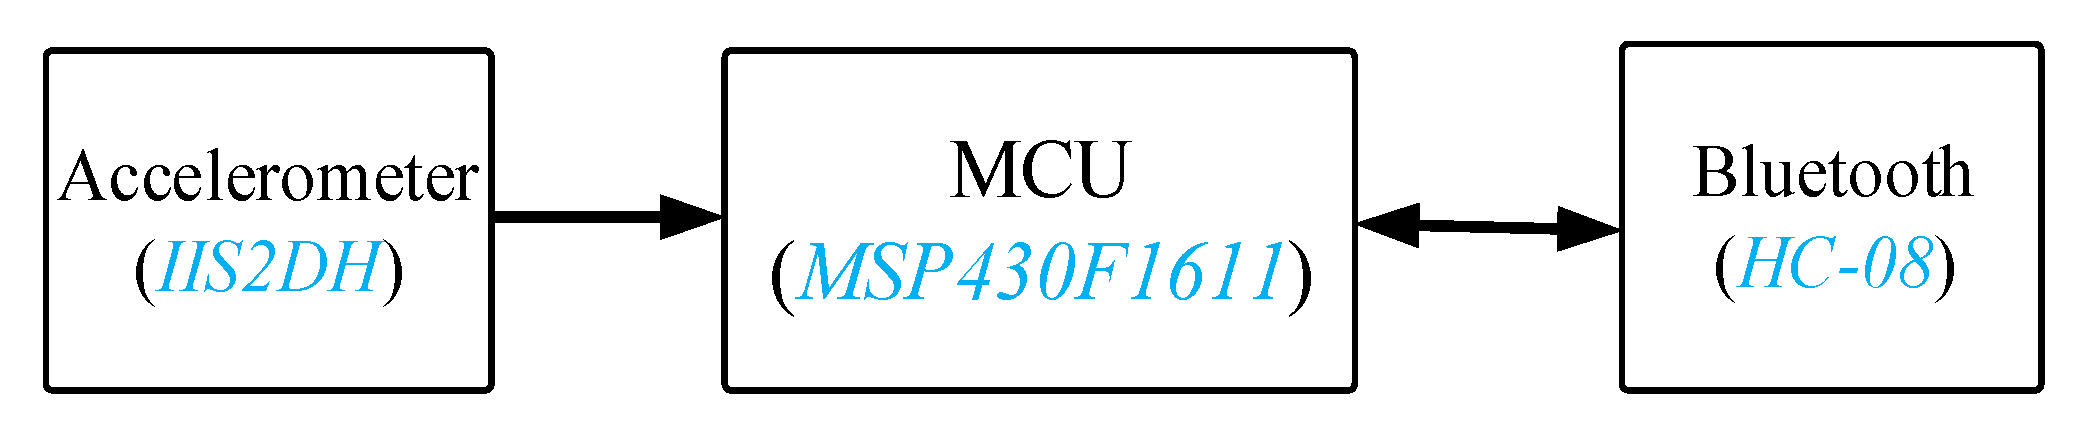
A wireless acceleration sensor is used to measure the vibration data of the transmission tower, which it wirelessly transmits to the monitoring device. The sensor consists of three parts (see Figure 3). An IIS2DH triaxial accelerometer is used to sense the acceleration in three directions. This accelerometer has the characteristics of ultralow power consumption (2 μA) and high precision (0.98 mg/digit). The HC-08 Bluetooth module is used to receive the data acquisition command sent by the monitoring device and send the acquired acceleration to the monitoring device. The sleep current of this module is only 0.4 μA. A MSP430F1611 microcontroller is connected to the accelerometer through the serial peripheral interface (SPI).
2.5. Workflow of the Monitoring System
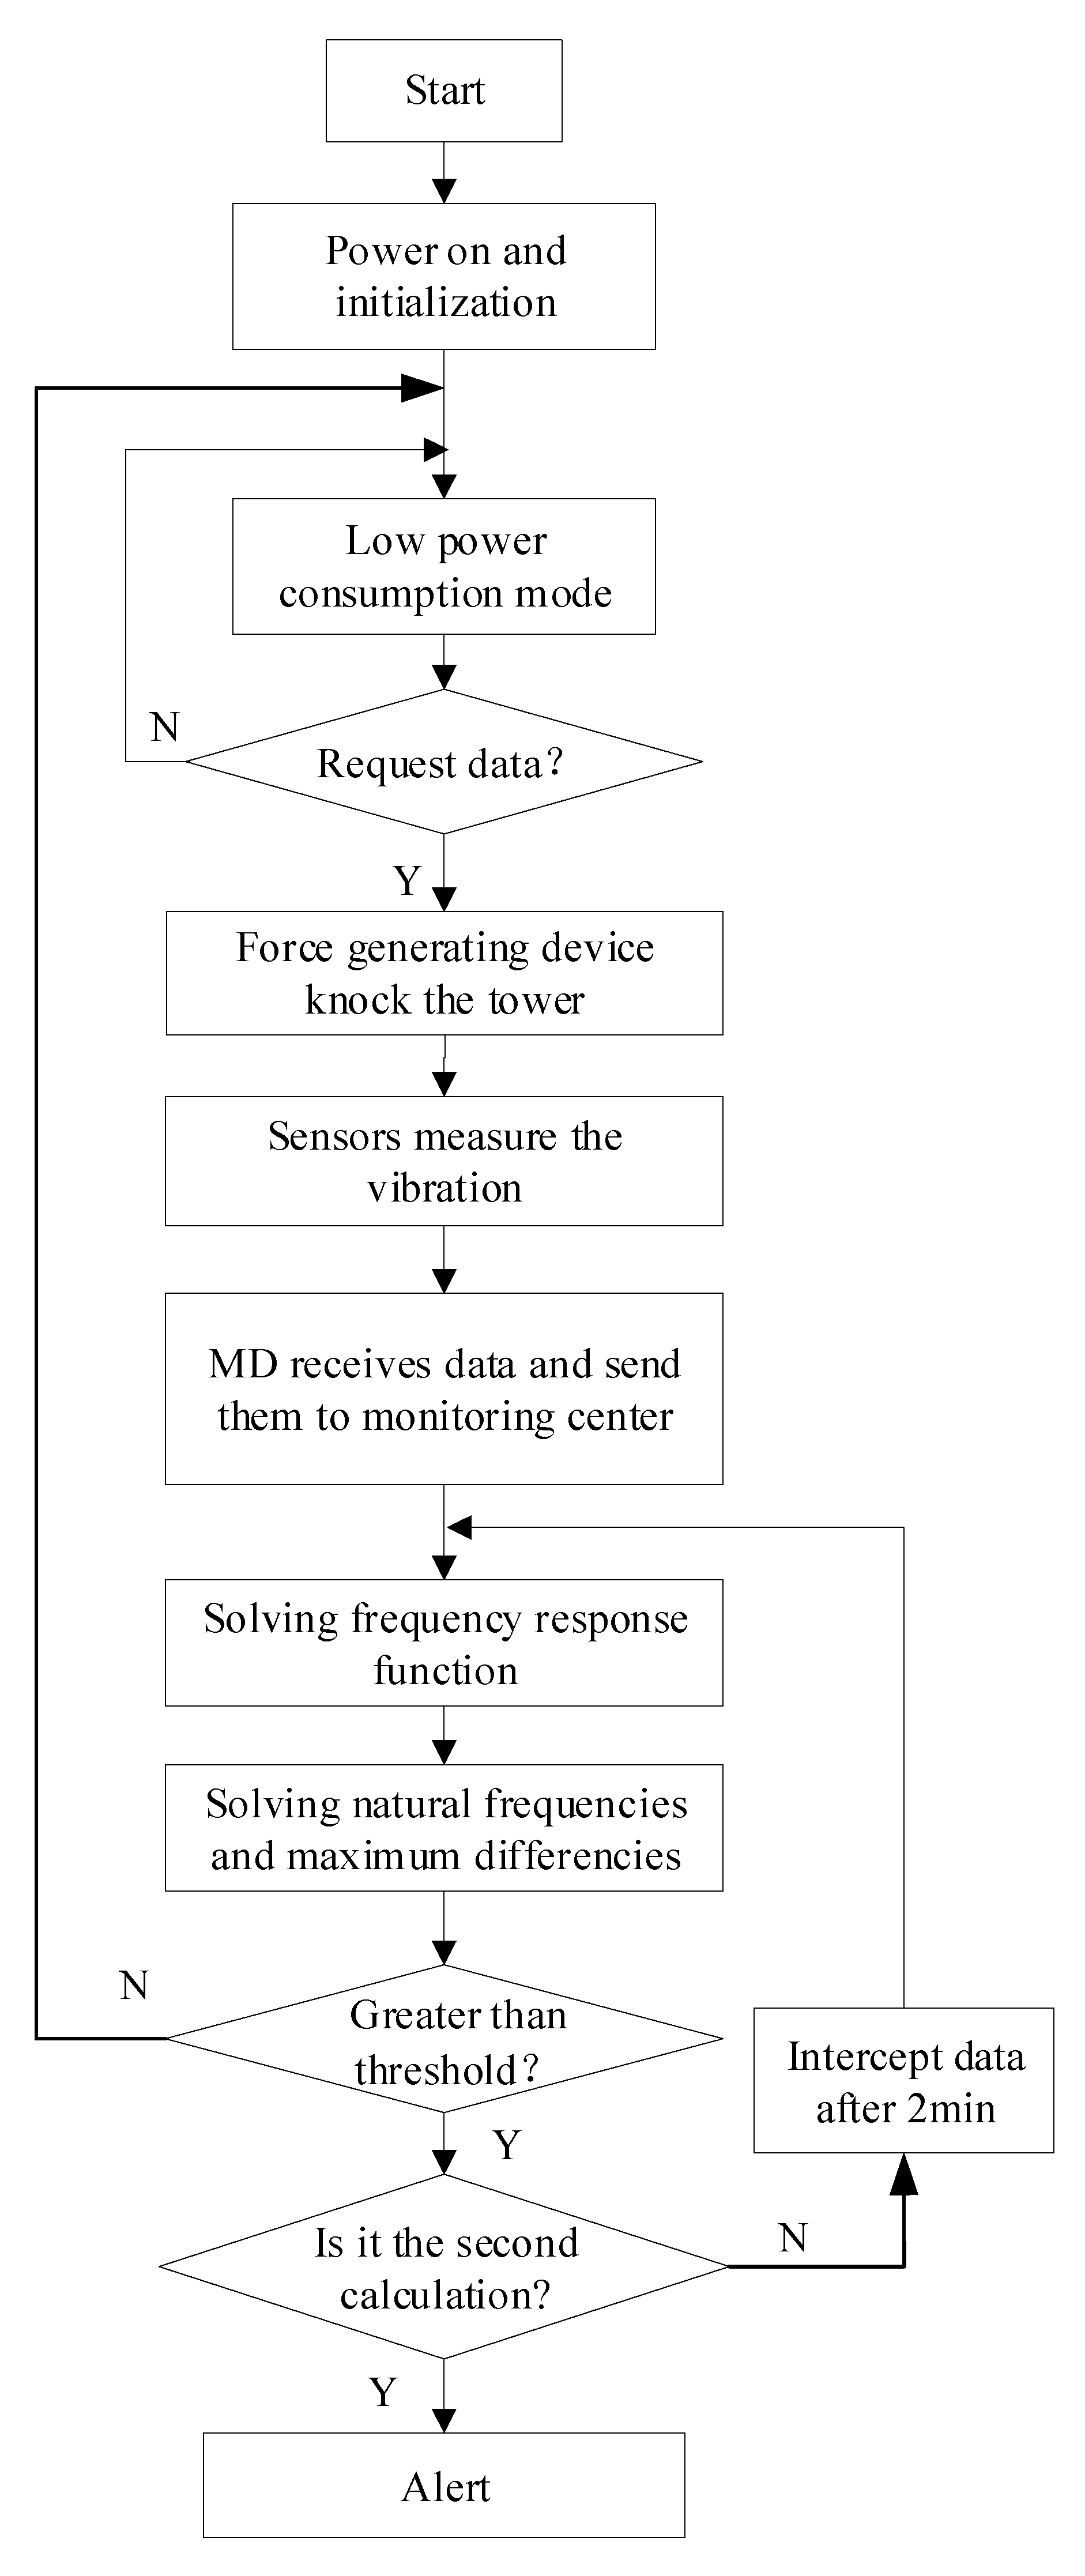
Figure 4 shows a chart of the system workflow. The monitoring device and sensors will enter low power consumption mode as soon as they are powered on for initialization. If the monitoring device receives the data acquisition command from the monitoring center, it will issue a command to the sensor to exit sleep mode. Then, the monitoring device will control the force-generating device to strike the tower and simultaneously collect the vibration signal of the tower and the signal of the excitation device.
Afterwards, the measurement data will be sent to the monitoring center, and the natural frequencies of each order of the tower will be determined. This information is compared with the natural frequency when the structure is operating in normal conditions, the variations in the natural frequency are obtained, and the maximum variation is determined. If the maximum change in natural frequency exceeds the set threshold value, the data after 2 min will be intercepted for analysis. If the result of the second measurement still exceeds the set threshold value, the tower structure will be considered to have changed.
3. Experiment and Analysis
3.1. Experimental Platform
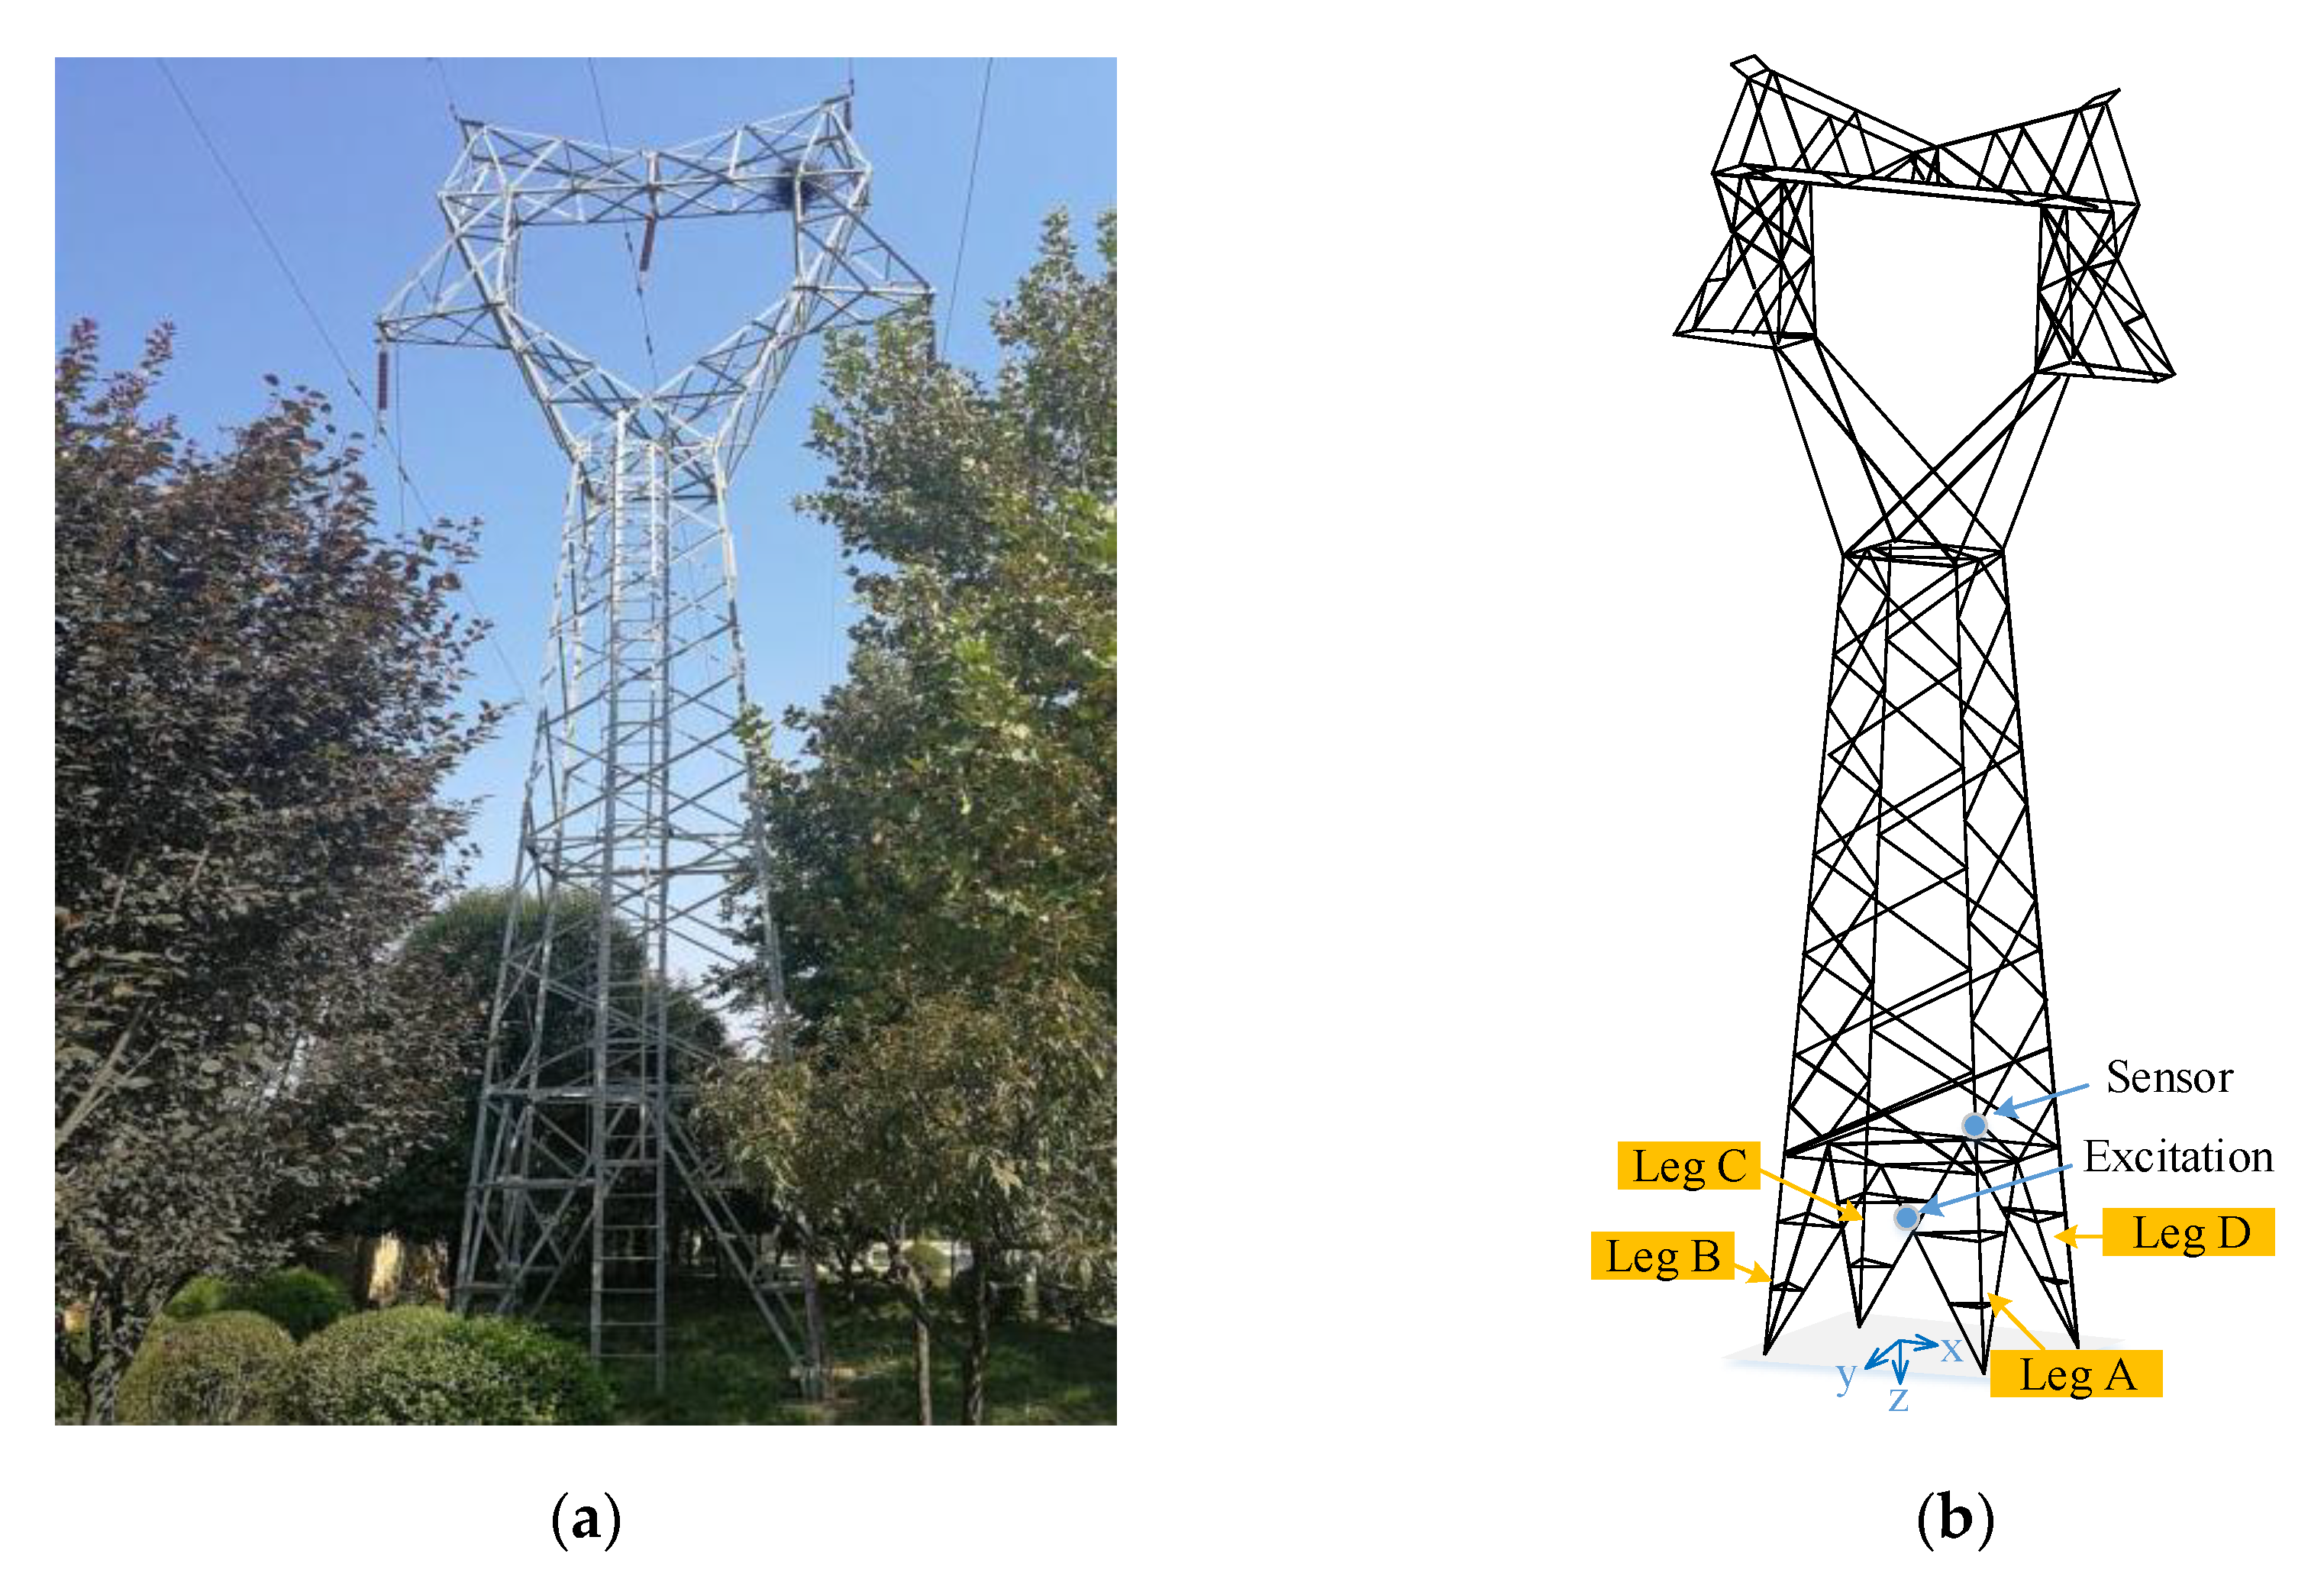
In this paper, the proposed settlement monitoring device, which operates based on the main vibration response of the transmission tower, is tested on site. The experimental site is the ZM-110 kV transmission tower at Xi’an University of Engineering. An LGJ-95/15 conductor is set on the tower. The line runs north to south. The total height of the transmission tower is 19 m, and the root opening is 3.103 m. Figure 5a shows the transmission tower used in this experiment. Figure 5b shows the schematic of the test platform.
3.2. Selection of the Sampling Frequency
Because the low-order natural frequencies of the tower system are less than 50 Hz, the sampling frequency of the device should be greater than 100 Hz according to the Shannon theorem. In addition, the force pulse duration of the self-designed excitation device is 50 ms. Therefore, to ensure the sampling accuracy of the force pulse, the sampling frequency should satisfy the following inequality [29]:
where Tc is the pulse width. Hence, the sampling frequency must be greater than 80 Hz. Moreover, the former natural frequencies of the tower are in the dense mode region within 50 Hz, so the frequency resolution must be considered. The frequency resolution can be expressed as follows:
Combined with the abovementioned factors, the sampling frequency is set to 200 Hz.
3.3. Implementation
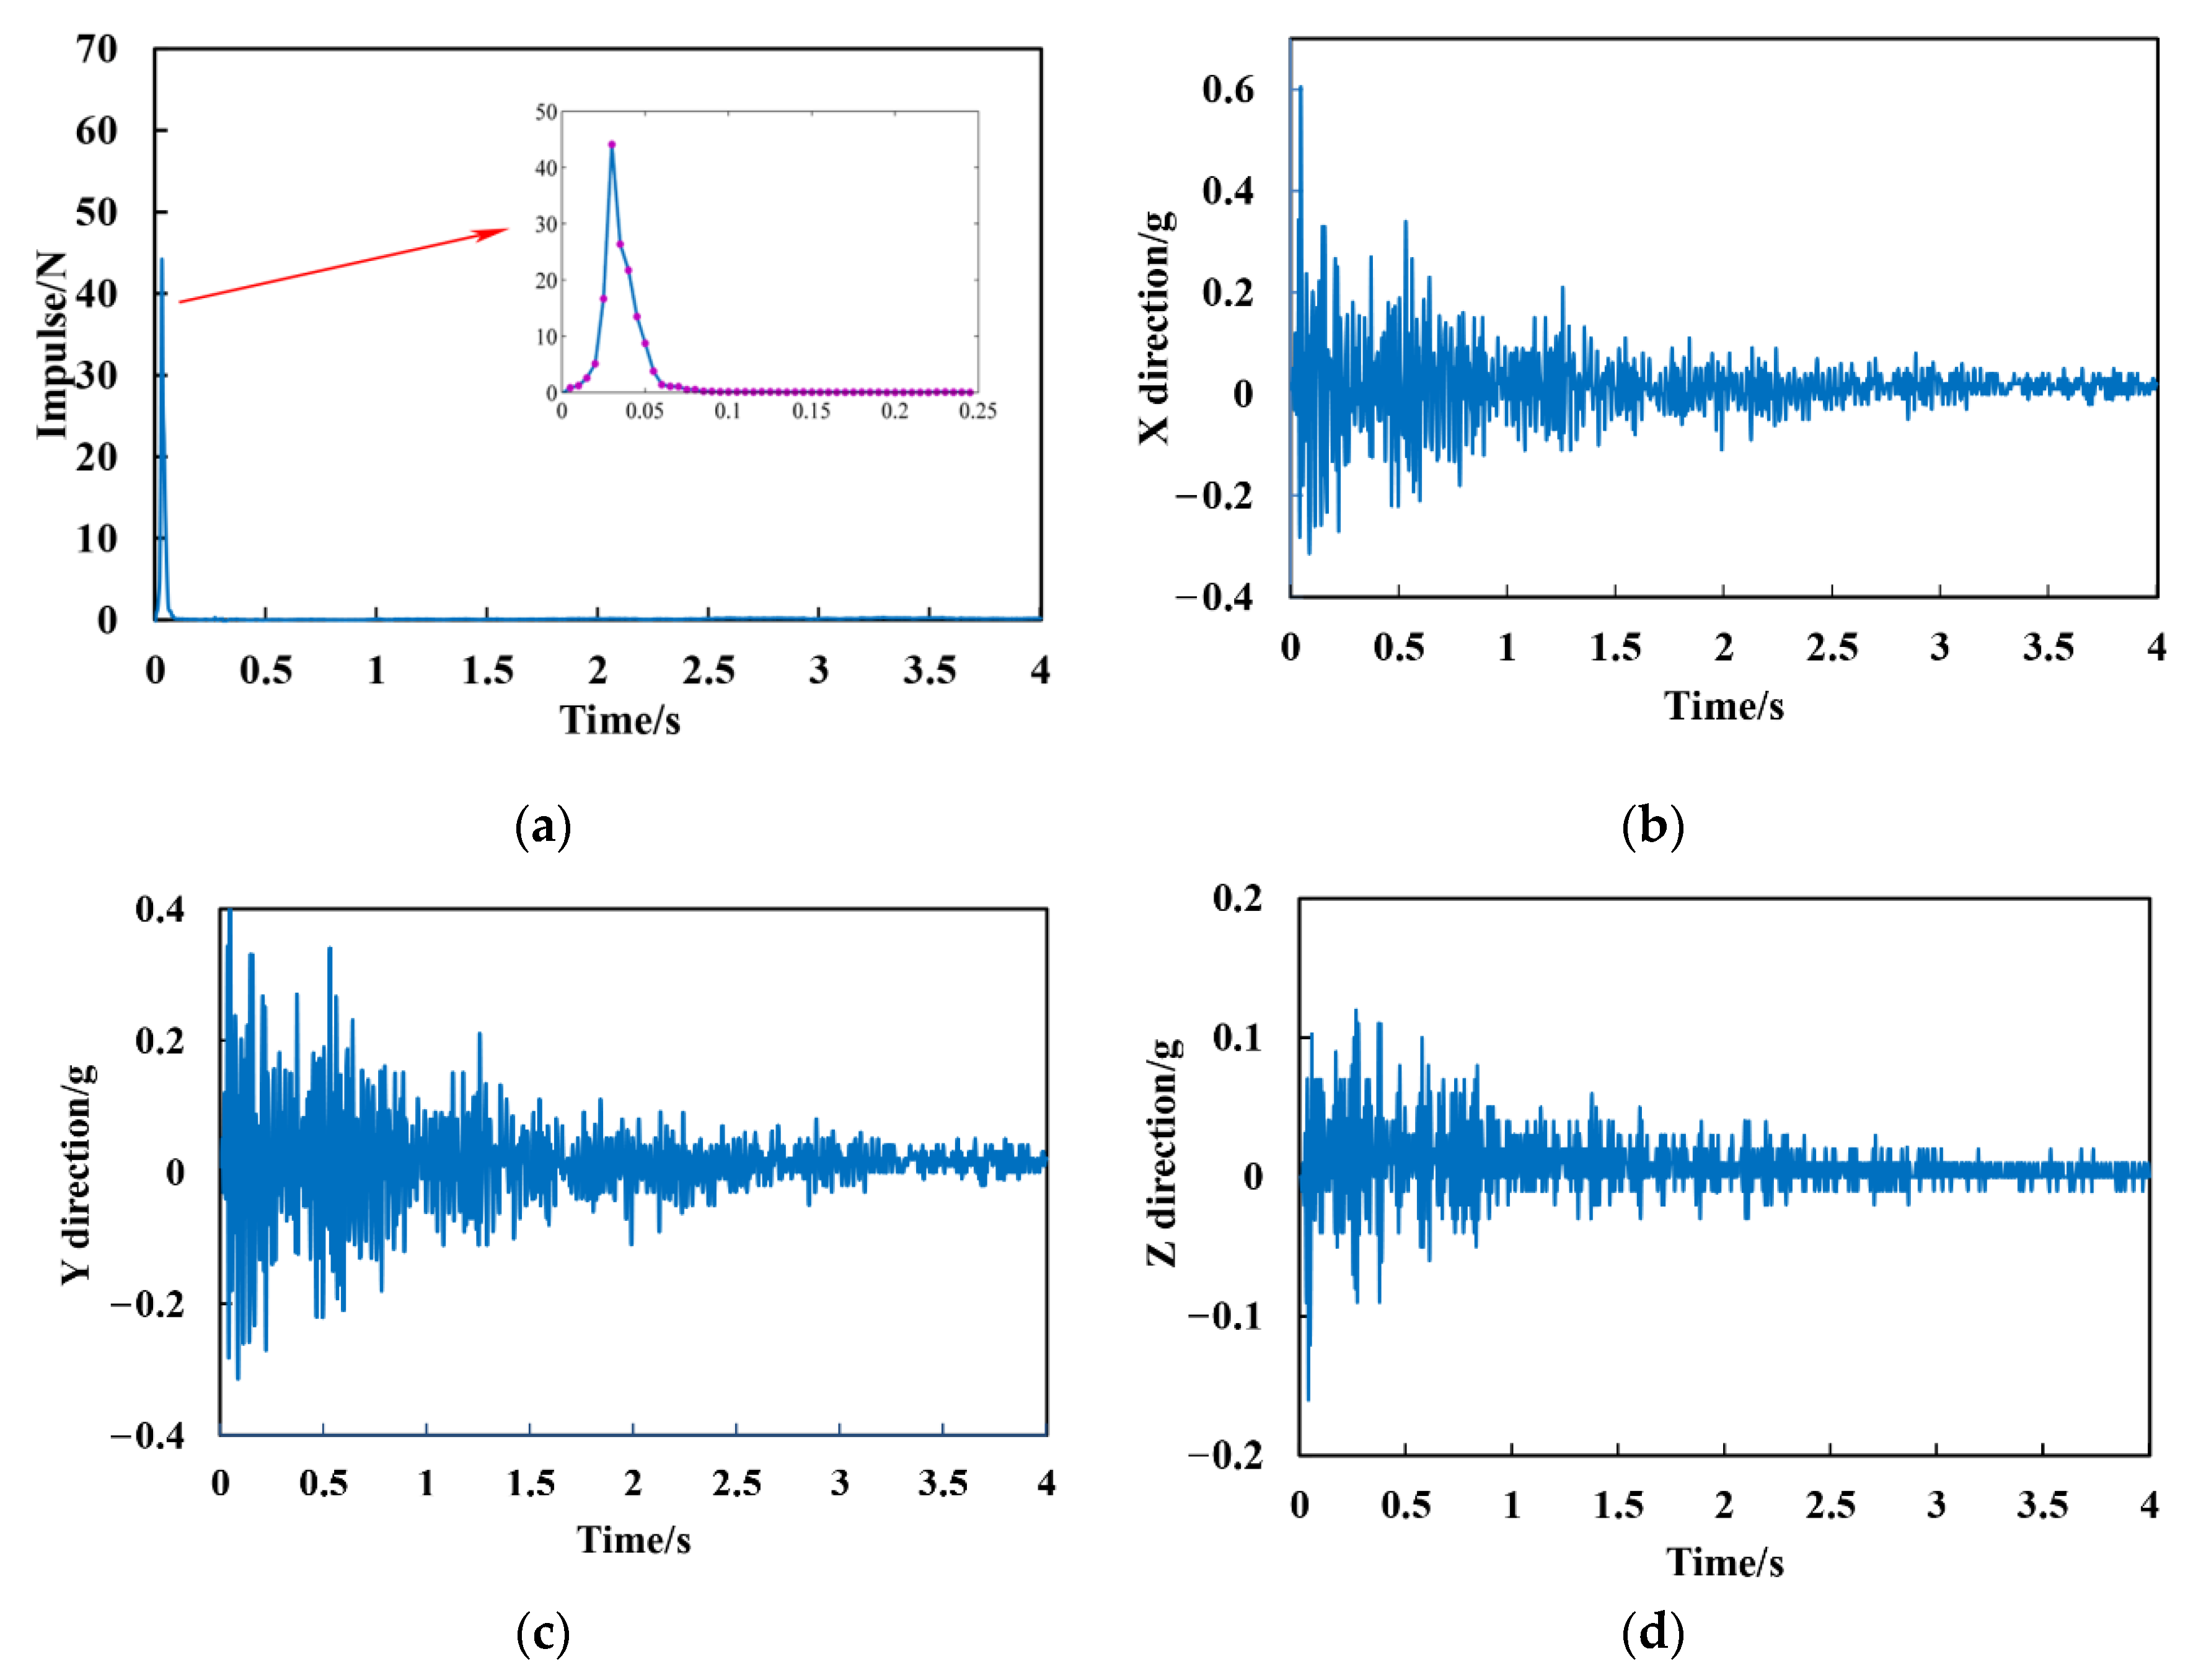
On 11 March 2019, field measurements and subsequent analyses were conducted. First, the excitation device was used to apply a sequence of force pulses to the tower in the X, Y and Z directions, during which the acceleration responses of the tower in the X, Y and Z directions were simultaneously extracted by the acceleration sensor. Then, the frequency response function of the tower system was established, and the first five natural frequencies were determined. When the tower foundation subsides, the tower structure and stress will change, which will subsequently change the natural frequencies. A finite element simulation in reference [1] showed that the stresses developed from the settlement and uplift of the tower foundation exhibit a similar trend as the stresses measured in the tower members. Accordingly, an experimental platform for tower base lifting was built, the settlement process of the transmission tower base was manually simulated, and the low-order natural frequencies of the transmission tower system before and after settlement were extracted and analyzed. Figure 6 shows the system vibration acceleration when the excitation device is installed in the X direction. Figure 6a shows the transient variation in the force pulse generated by the excitation device. Here, you can see that the force pulse is about 45 N and its duration is very short. Figure 6b–d represent the acceleration responses of the tower in the X, Y and Z directions, respectively.
3.4. Identification of the Natural Frequencies
The frequency response function of the vibration can be expressed as follows:
where δ0(ω) is the matrix afterFourier transformation of the measured force, X0(ω) is the matrix after Fourier transformation of the measured acceleration, and H0(ω) is the frequency response function.
However, the frequency response will be different when the direction of the excitation force changes. Therefore, the objective of the monitoring technology is to determine the strike direction. In this experiment, the directions of the impact were along the X axis, Y axis and Z axis, and the acceleration was simultaneously measured in all three directions.
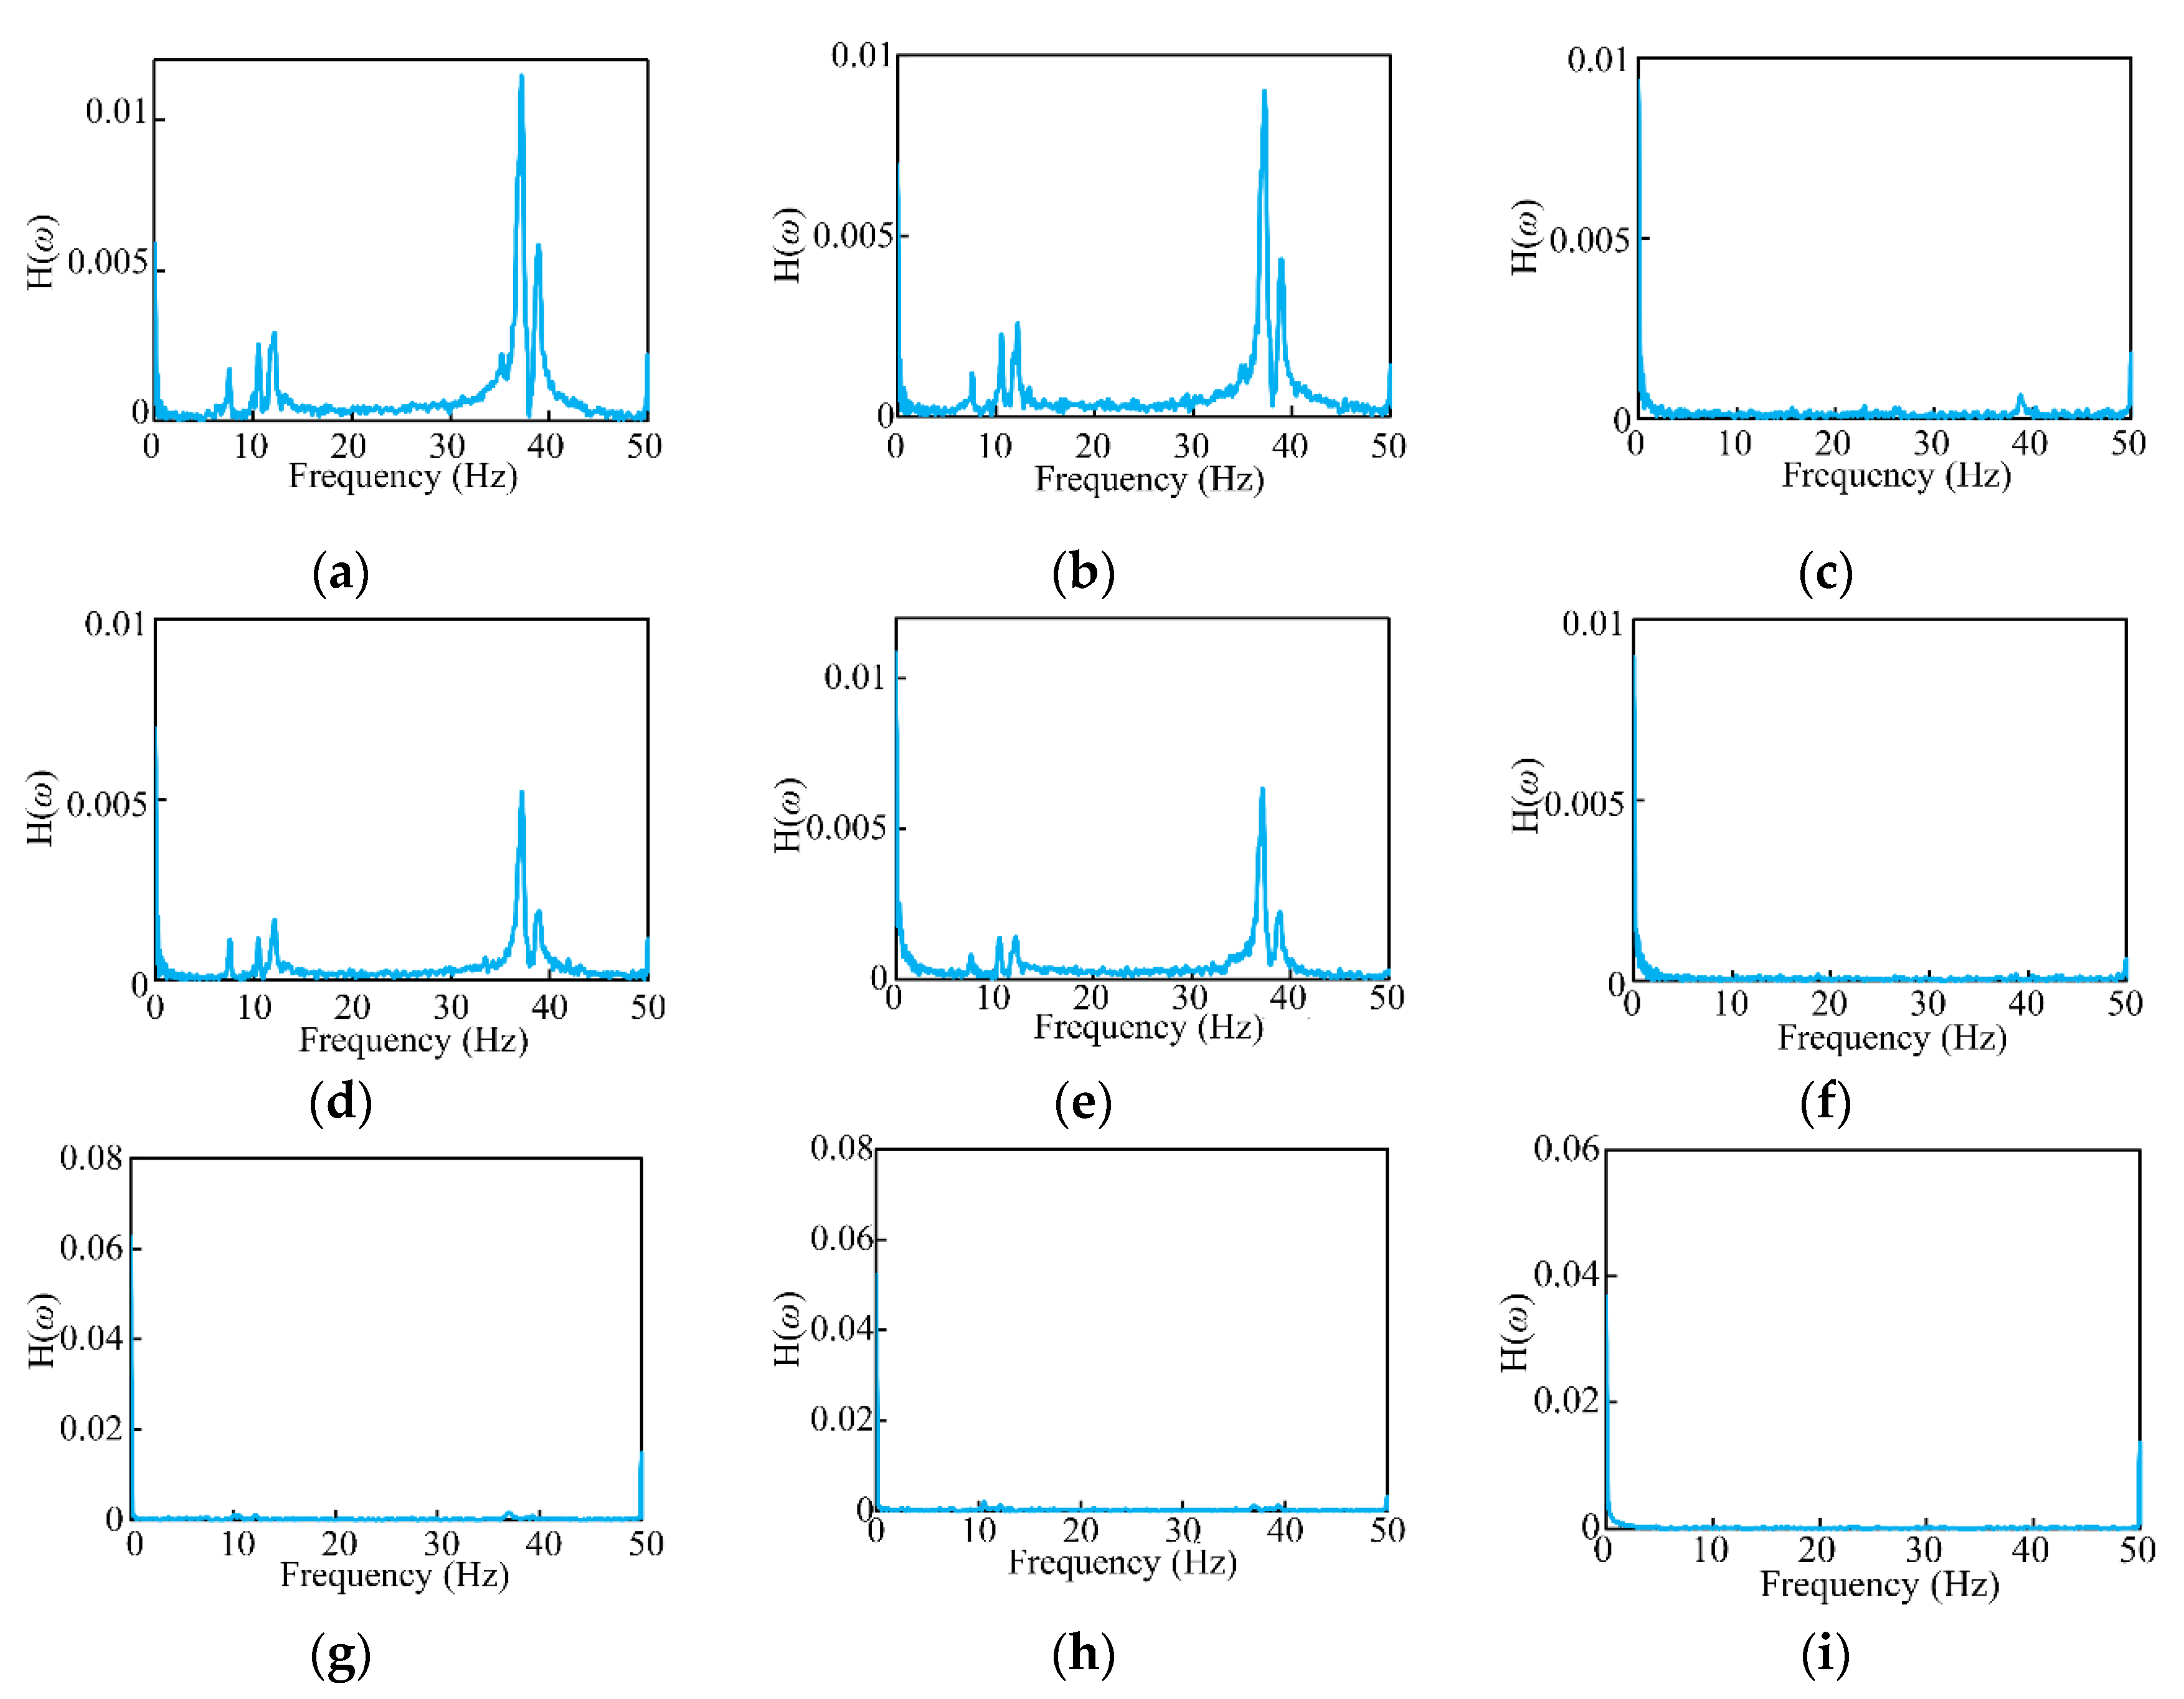
Figure 7 shows the frequency response function of the tower system where “F-x & A-y” was used to represent the frequency response function in the Y axis when a force pulse is applied in the X direction. Figure 7a–c show the frequency response function curves of the system when the force pulse is applied in the X direction. Figure 7d–f shows the frequency response function curves of the system when the force pulse is applied in the Y direction. Figure 7g–i shows the frequency response function curves of the system when the force pulse is applied in the Z direction.
It can be seen from Figure 7 that when the force pulse acts on the X and Y directions of the transmission tower, the modal frequency can be extracted more effectively from the crest abscissa of the frequency response curve of the X axis ((a),(d)) and Y axis ((b),(e)), but the Z axis ((c),(f)), the frequency response curve of almost no crest, unable to extract modal frequency. Moreover, similarly, when the force impulse acts on the Z direction, the frequency response functions of the X axis (g), Y axis (h) and Z axis (i) do not show obvious crest characteristics, which means that it is difficult to identify the natural frequency when the force impulse acts on the transmission tower from the Z direction.
In addition, the vibration of the tower mainly occurs in the X direction and Y direction. This is because, from a macro point of view, the tower is like a cantilever beam fixed at one end, and the vibration mainly occurs in the other two directions. Specifically, on the one hand, the axial stiffness of the tower is much greater than the bending stiffness, which makes the deformation in the z-axis direction very small; on the other hand, the Z direction is constrained by the ground, while the X and Y directions are not constrained. Therefore, it can be seen in Figure 7 that the response mainly occurs in the X direction and Y direction.
The peak values of the frequency response function were extracted as the natural frequencies at different orders. It is worth noting that in a large number of experiments, the natural frequency of 1~2 Hz cannot be obtained. The smallest natural frequency excited by this method is 7.617 Hz. When the force pulses of the normal structure were applied in the X and Y directions, the first five natural frequencies extracted from the peak values of the frequency response function. They are 7.617, 10.55, 12.3, 37.3 and 38.96 Hz. This shows that the first five natural frequencies of the tower can be effectively extracted from the acceleration response in either the X or Y direction with good consistency, regardless of whether the force pulse is applied in the X direction or Y direction.
When the natural frequency is used to judge structural changes, the low-order frequency is usually analyzed because the higher-order frequency is always changeable. To see if these natural frequencies are highly variable in the case where no changes occur in the tower structure, 10 repeated measurements were carried out. The consistency of extracting the natural frequency of the tower system by using the frequency response function was very good, and the maximum error was only 0.09 Hz.
3.5. Tower Leg Displacement Experiment
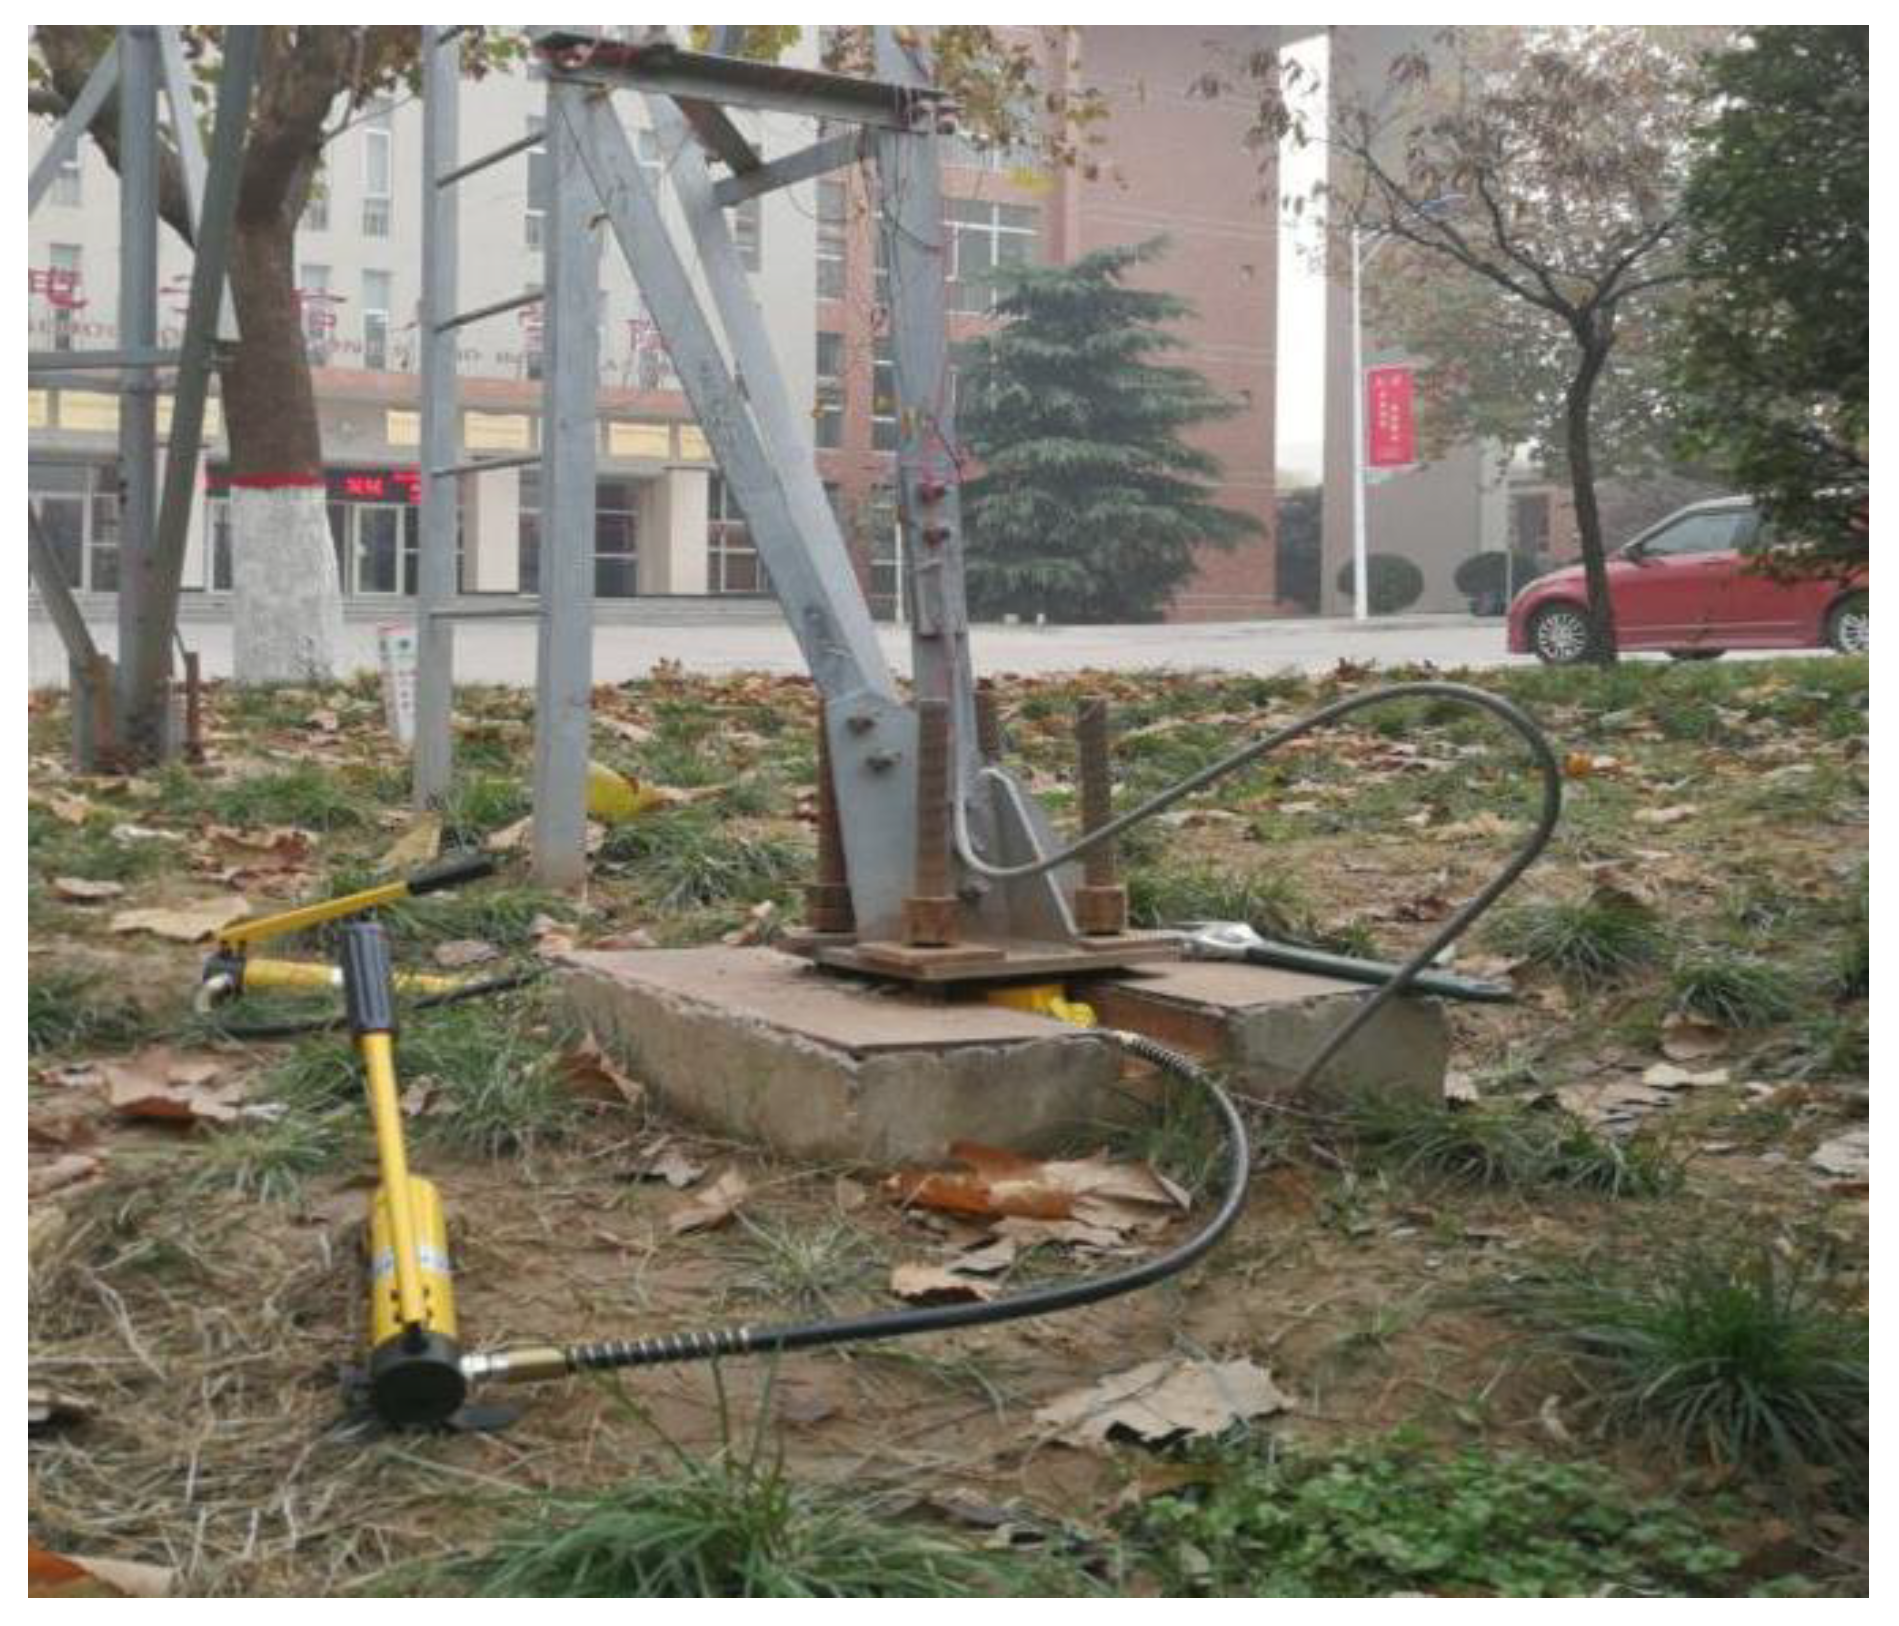
During the construction of the ZM-110 kV transmission tower at Xi’an University of Engineering, grooves were left in the foundation, which made it very convenient for us to lift the tower legs to simulate their displacement. Figure 8 shows a photograph of the experimental site. Before the test, the tower base was carefully cleaned to avoid introducing unnecessary errors. Because foundation settlement is not easy to achieve, lifting the tower legs is instead. In the experiment, the bolts fixing the tower base were first released, and then an ultrathin hydraulic jack was placed below the tower base to raise the tower legs. When one leg was raised, it corresponded to the settlement of the other legs. For example, if the foot of tower leg A was lifted, this corresponded to the settlement of tower legs B–D. At this time, the whole structure of the tower was deformed, especially the strain in some members of the tower legs [1].
Figure 7 shows that the frequency response function can be obtained by striking the tower in both the X and Y directions. Furthermore, the modal parameters of a mechanical system can theoretically be extracted from the measurement results of an acceleration sensor. Therefore, in this experiment, the excitation device and acceleration sensor were installed in the X direction of tower leg A.
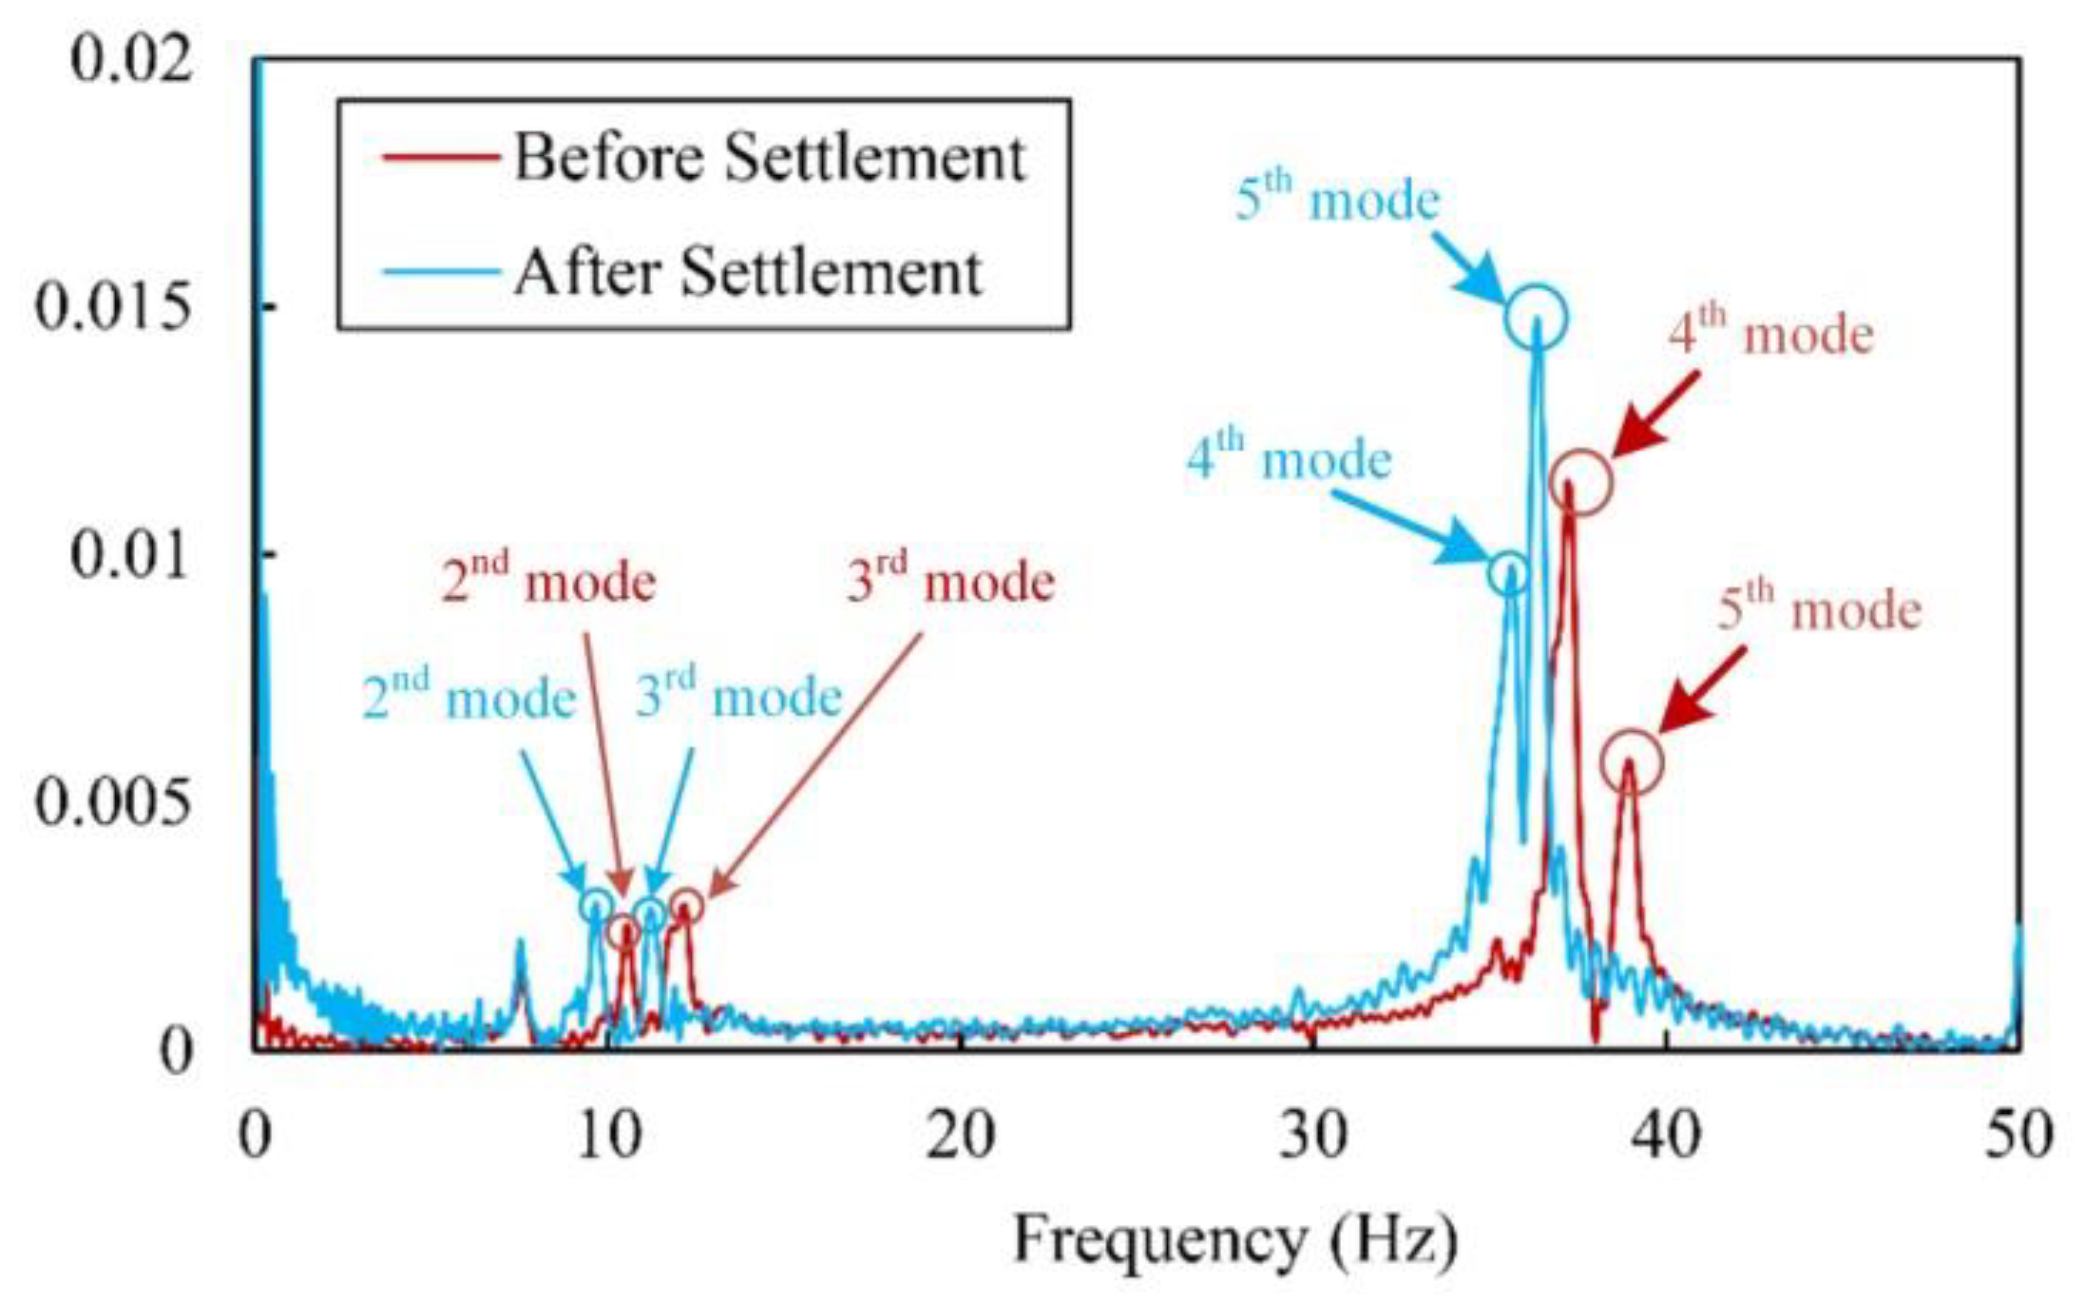
Figure 9 shows the frequency response function curve before and after the settlement of BCD. After the settlement of BCD, the structure of the tower changed, and the reduced stiffness in the bolted connection caused different boundary conditions in leg A, which may result in a downward shift of the frequency. Figure 9 shows that for these two cases, the frequency response function curves were very similar, but after settlement, the natural frequencies of each stage were reduced, especially the fourth and fifth natural frequencies, which sustained the most obvious changes.
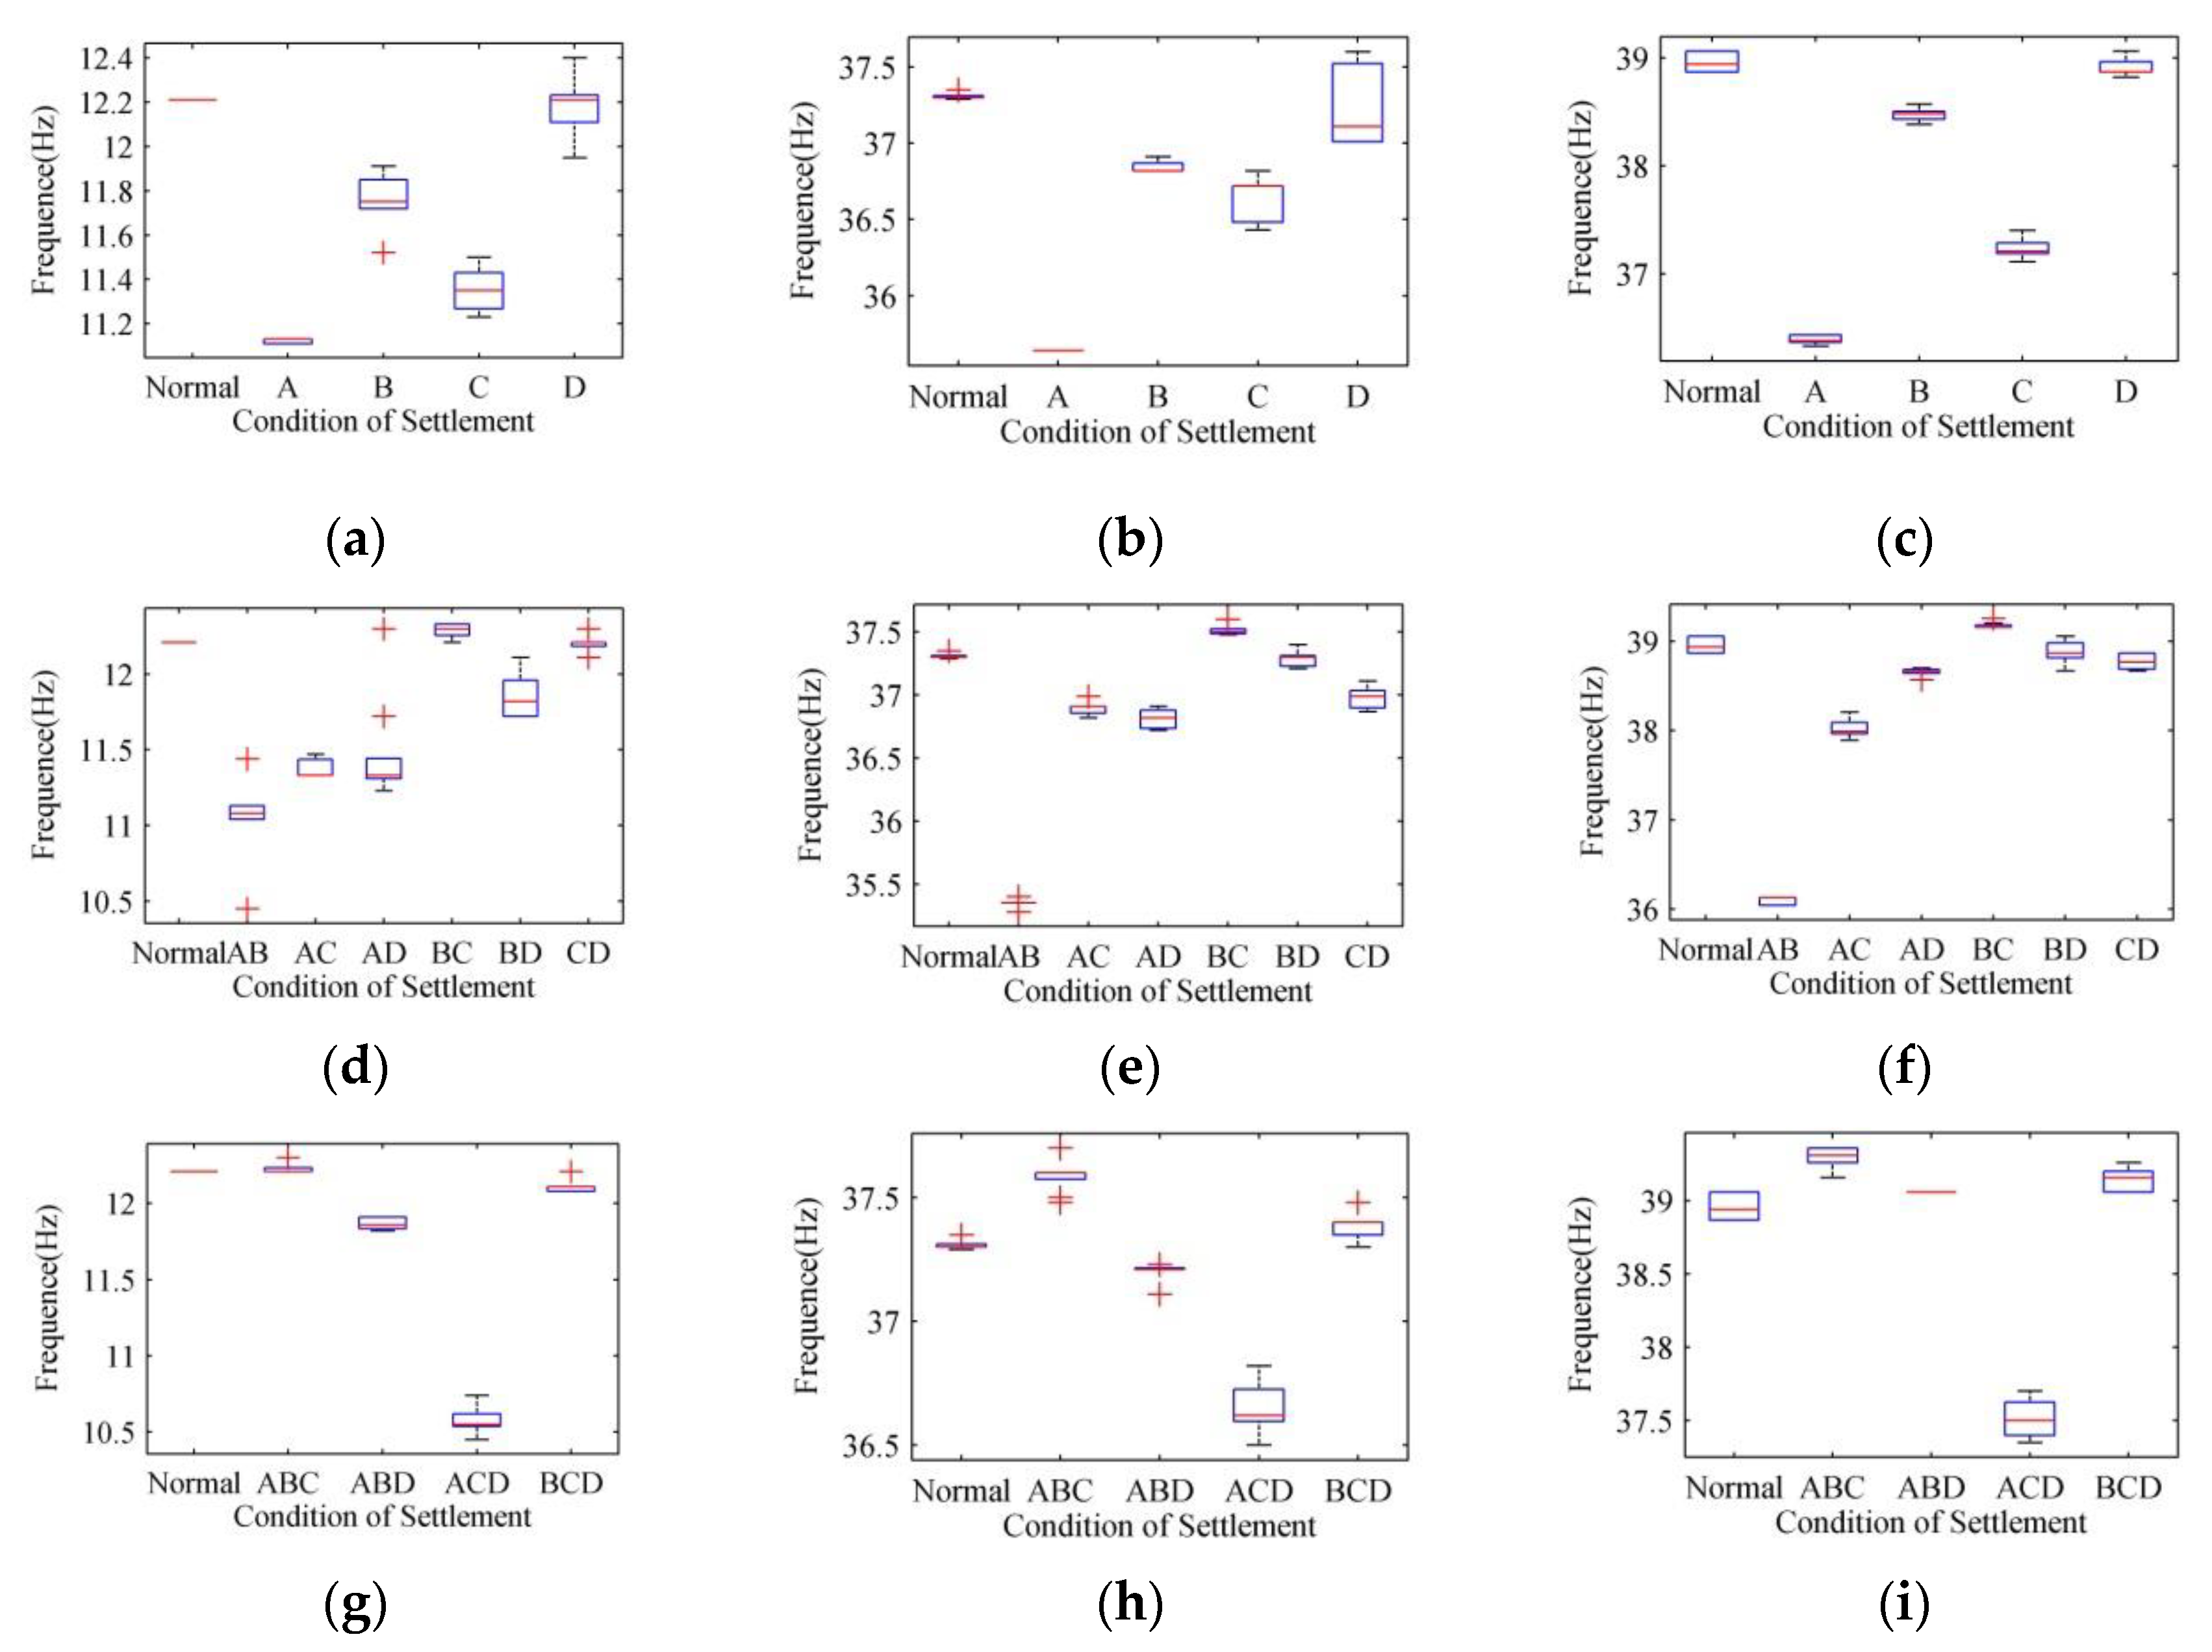
In order to further observe the change of natural frequency after settlement, the above experiment process was repeated with sampling frequencies of 100, 200 and 500 Hz, different tower leg settlement experiments were carried out, the natural frequency of the transmission tower of third-, fourth- and fifth-order was extracted, and the box diagram shown in Figure 10 was obtained. In the figure, Normal means that the transmission tower does not settle, while letters A–D and different combinations of letters represent different settling conditions of the transmission tower.
In Figure 10, a–c, d–f and g–i respectively represent the settlement of a single tower leg, two tower legs and three tower legs and the comparison of the third, fourth and fifth natural frequencies when the transmission tower is in normal conditions (the tower leg does not settle).
It can be seen from the figure that the natural frequencies of the settling legs of a single tower vary with respect to normal conditions, and the natural frequencies of the settling legs of different towers are obviously distinguished. For example, the attenuation of the third-, fourth- and fifth-order natural frequencies of A–C and the natural frequencies under normal conditions are 1.1, 0.4, and 0.8 Hz, respectively. For the settlement of the legs of the two towers, the attenuation of the third-, fourth- and fifth-order natural frequencies of the transmission tower is the most obvious when AB, AC and AD are settling, and the attenuation range of the fifth-order natural frequency reaches 3 Hz when AB is settling. For the settlement of the legs of the three towers, the natural frequencies of the third-, fourth- and fifth-order of the transmission tower are obviously attenuated during the ACD settlement, among which the third- and fifth-order frequencies attenuated by 1.1 and 1.2 Hz.
For the settlement of these conditions, monitoring frequencies can identify whether there is settling for transmission towers. But some settlement is not linear. For example, the tower leg BC, BD settlement, and tower leg BCD settlement, their average frequencies are very close to the natural frequency of normal towers
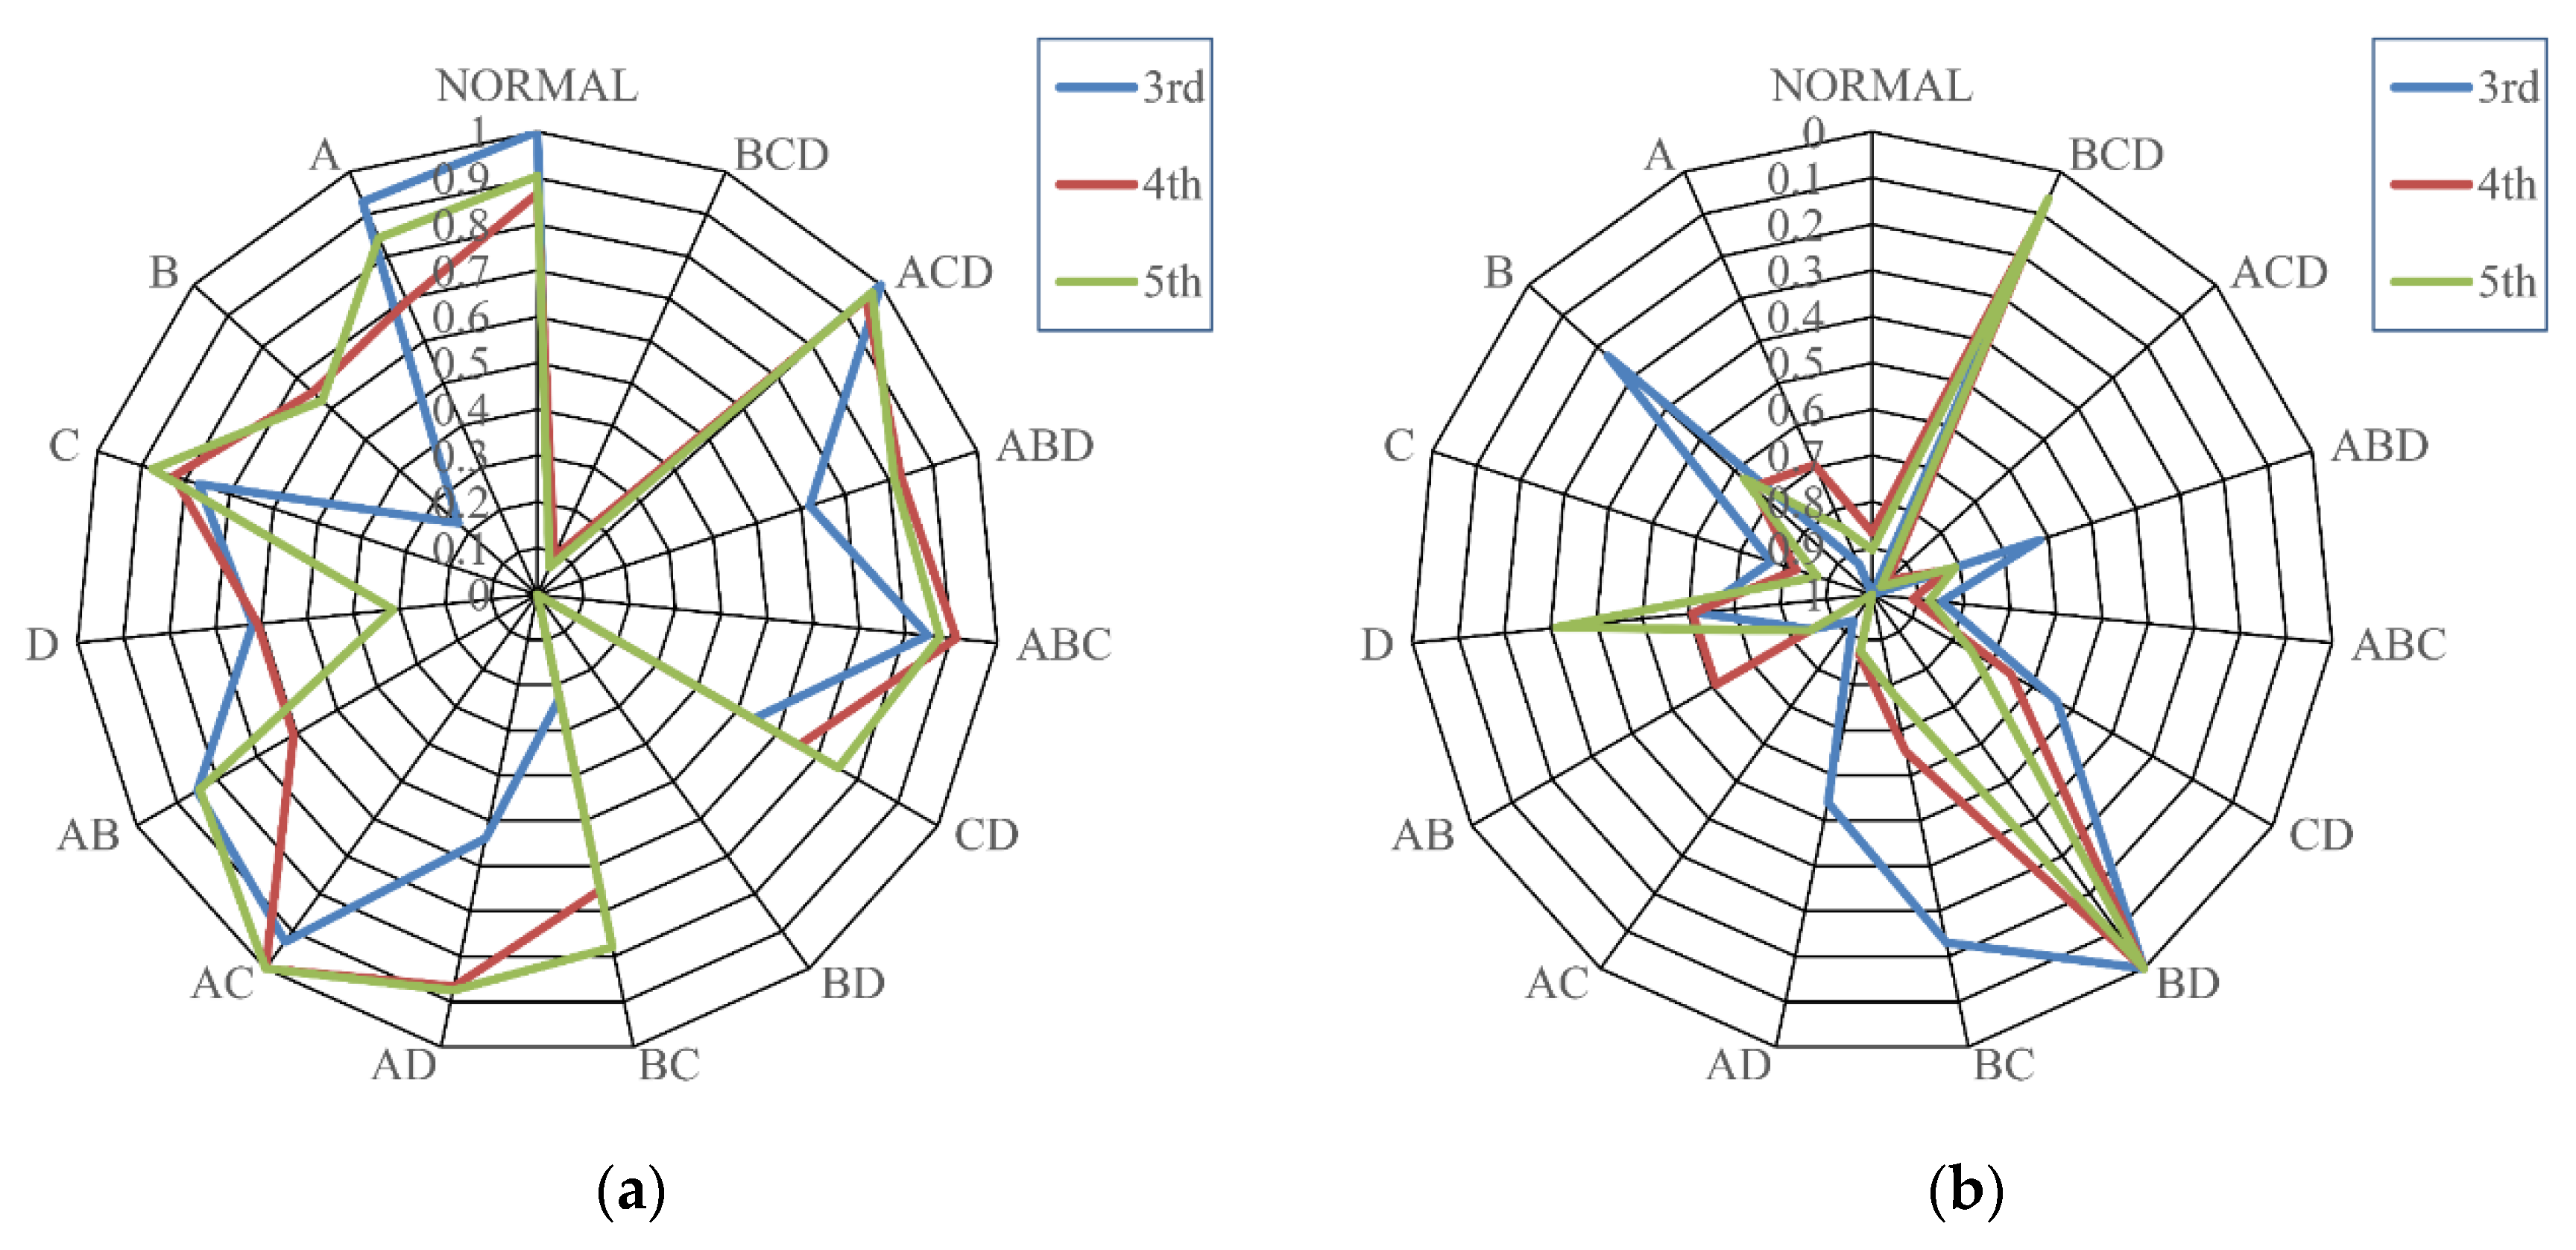
To further characterize the settlement behavior, the data were normalized in Figure 10 to obtain the radar chart shown in Figure 11a. Figure 11b shows the same radar chart with the coordinate axis reversed.
As previously mentioned, the excitation was applied to tower leg A, and the sensor was also installed on leg A. Accordingly, among the cases of single-leg settlement, the natural frequencies most obviously decreased in response to the settlement of legs B or D, which are adjacent to leg A. For the cases of two-leg settlement, the natural frequencies exhibited the most obvious decline in response to the settlement of legs BD, whereas marked decreases were also observed with the simultaneous settlement of legs AD, legs BC and legs CD. For the cases of three-leg settlement, the natural frequencies decreased most obviously in response to the settlement of legs B–D. In conclusion, the natural frequencies will decrease obviously when the settlement occurs in the tower legs adjacent to those where the sensors and excitation de-vices are installed. In contrast, the decrease in the natural frequencies will not be as obvious when settlement occurs in the instrumented tower leg or in the tower leg diagonal to the instrumented leg.
In practical application, the natural frequency may fluctuate a little due to external influence, which may cause misjudgment. However, the settlement value of a tower usually changes slowly. Therefore, long-term monitoring is an effective method. Generally, the device can be set to measure once every 12 h. When the natural frequency changes significantly, the measurement frequency increases. If the natural frequency change trend is consistent for two consecutive days, the staff can go to the site for further investigation.
4. Conclusions
In this paper, a settlement monitoring method based on the main vibration response of the transmission tower is proposed and applied to the cat-head tower in the ZM-110kV transmission line of Xi’an Polytechnic University. The effectiveness of the method is verified.
By measuring the vibration response of transmission tower in real time, it is found that the acceleration response in the X and Y directions can be used to construct the frequency response function of a transmission tower structural system when applying force pulse in the X and Y directions. The first five natural frequencies of the tower system can be extracted by this method with a maximum error of 0.09 Hz. However, the Z direction frequency response function curve has no obvious characteristics, so the natural frequency of a transmission tower cannot be extracted from it. It was also found that when the force pulse acts in the Z direction of the transmission tower, the frequency response functions of the X–Z axis also do not show obvious characteristics, which indicates that the X or Y direction force pulse is applied to the transmission tower, and the acceleration response in the X or Y direction can be used to extract the natural frequency of the transmission tower.
Based on the above conclusions, the experiment of simulating the settlement of transmission tower by lifting tower shows that the natural vibration frequency of transmission tower decreases obviously after settlement. For single-pile settlement, the maximum attenuation of the third, fourth and fifth natural frequencies are 0.97, 0.58 and 1.85 Hz, respectively. For leg settlement, the maximum attenuation of the third, fourth and fifth natural frequencies are 1.26, 1.95 and 2.83 Hz, respectively. For the three-leg settlement, the maximum attenuation of third-order, fourth-order and fifth-order natural frequencies is 1.17, 1.75 and 2.63 Hz, respectively. The results show that the variation of natural frequency after settlement can be measured and can be used as an effective basis to judge the settlement of a transmission tower.
This paper also designs a transmission tower settlement monitoring system which is composed of a monitoring center, wireless sensor and excitation device, which can impact the tower and record its vibration response. The design of the excitation device applies a stable force pulse to the transmission tower, so as to overcome the weak vibration caused by natural load and the difficulty of signal extraction.
The above work shows that it is feasible to apply force pulse on the transmission tower to collect and analyze vibration information to monitor the device. The online monitoring device designed according to this principle can realize the on-line monitoring of transmission tower settlement and provide an effective solution for the protection of transmission line safety.
The common faults of towers mainly include settlement, inclination, loose bolts and rod deformation. This paper mainly discusses the variation law of natural frequency after settlement. In the follow-up work, we will further study and simulate more working conditions through more experiments, and explore the evaluation methods of these working conditions.
Author Contributions
Conceptualization, L.Z. and L.W.; methodology, L.Z.; validation, X.Z., C.L. and Z.X.; investigation, W.Z.; resources, W.Z.; data curation, L.Z.; writing—original draft preparation, L.W.; project administration, W.Z.; funding acquisition, L.Z. All authors have read and agreed to the published version of the manuscript.
Funding
This work was supported in part by the Key Research and Development Projects of Shaanxi Province under Grant 2021GY-068.
Institutional Review Board Statement
Not applicable.
Informed Consent Statement
Not applicable.
Data Availability Statement
The raw/processed data required to reproduce these findings cannot be shared at this time as the data also forms part of an ongoing study.
Conflicts of Interest
The authors declare no conflict of interest.
References
- Huang, X.; Zhao, L.; Chen, Z.; Liu, C. An online monitoring technology of tower foundation deformation of transmission lines. Struct. Health Monit. 2019, 18, 949–962. [Google Scholar] [CrossRef]
- Huang, X.; Chen, Z.; Zhao, L.; Zhu, Y.; Xu, G.; Si, W. Stress simulation and experiment for tower foundation settlement of 110 kV transmission line. Electr. Power Autom. Equip. 2017, 37, 361–370. [Google Scholar]
- Rao, N.P.; Knight, G.S.; Mohan, S.; Lakshmanan, N. Studies on failure of transmission line towers in testing. Eng. Struct. 2012, 35, 55–70. [Google Scholar] [CrossRef]
- Albermani, F.; Kitipornchai, S.; Chan, R. Failure analysis of transmission towers. Eng. Fail. Anal. 2009, 16, 1922–1928. [Google Scholar] [CrossRef]
- An, L.; Jiang, W.; Liu, Y.; Shi, Q.; Wang, Y.; Liu, S. Experimental study of mechanical behavior of angles in transmission towers under freezing temperature. Adv. Steel Construct. 2018, 14, 461–478. [Google Scholar]
- Malhara, S.; Vittal, V. Mechanical State Estimation of Overhead Transmission Lines Using Tilt Sensors. IEEE Trans. Power Syst. 2010, 25, 1282–1290. [Google Scholar] [CrossRef]
- Reagan, D.; Sabato, A.; Niezrecki, C. Feasibility of using digital image correlation for unmanned aerial vehicle structural health monitoring of bridges. Struct. Health Monit. 2018, 17, 1056–1072. [Google Scholar] [CrossRef]
- Huang, X.; Yang, L.; Zhang, Y.; Zhu, Y.; Zhang, G. A Measurement Technology of Space Distance Among Transmission Bundle Conductors Based on Image Sensors. IEEE Trans. Instrum. Meas. 2018, 68, 4003–4014. [Google Scholar] [CrossRef]
- Zhong, M.; Cao, Q.; Guo, J.; Zhou, D. Simultaneous Lever-Arm Compensation and Disturbance Attenuation of POS for a UAV Surveying System. IEEE Trans. Instrum. Meas. 2016, 65, 2828–2839. [Google Scholar] [CrossRef]
- Bian, J.; Hui, X.; Zhao, X.; Tan, M. A monocular vision–based perception approach for unmanned aerial vehicle close proximity transmission tower inspection. Int. J. Adv. Robot. Syst. 2019, 16, 1729881418820227. [Google Scholar] [CrossRef]
- Xiao, Z.; Liang, J.; Yu, D.; Asundi, A. Large field-of-view deformation measurement for transmission tower based on close-range photogrammetry. Measurement 2011, 44, 1705–1712. [Google Scholar] [CrossRef]
- Zeng, T.; Gao, Q.; Ding, Z.; Tian, W.; Yang, Y.; Zhang, Z. Power Transmission Tower Detection Based on Polar Coordinate Semivariogram in High-Resolution SAR Image. IEEE Geosci. Remote. Sens. Lett. 2017, 14, 2200–2204. [Google Scholar] [CrossRef]
- Xia, Y.; Zhang, P.; Ni, Y.-Q.; Zhu, H.-P. Deformation monitoring of a super-tall structure using real-time strain data. Eng. Struct. 2014, 67, 29–38. [Google Scholar] [CrossRef] [Green Version]
- Bang, H.-J.; Kim, H.-I.; Lee, K.-S. Measurement of strain and bending deflection of a wind turbine tower using arrayed FBG sensors. Int. J. Precis. Eng. Manuf. 2012, 13, 2121–2126. [Google Scholar] [CrossRef]
- Rainieri, C.; Magalhães, F.; Gargaro, D.; Fabbrocino, G.; Cunha, Á. Predicting the variability of natural frequencies and its causes by Second-Order Blind Identification. Struct. Health Monit. 2019, 18, 486–507. [Google Scholar] [CrossRef]
- Di Lorenzo, E.; Petrone, G.; Manzato, S.; Peeters, B.; Desmet, W.; Marulo, F. Damage detection in wind turbine blades by using operational modal analysis. Struct. Health Monit. 2016, 15, 289–301. [Google Scholar] [CrossRef]
- Zhao, L.; Huang, X.; Jia, J.; Zhu, Y.; Cao, W. Detection of Broken Strands of Transmission Line Conductors Using Fiber Bragg Grating Sensors. Sensors 2018, 18, 2397. [Google Scholar] [CrossRef] [PubMed] [Green Version]
- Zhang, M.; Zhao, G.F.; Wang, L.L.; Li, J. Wind-Induced Coupling Vibration Effects of High-Voltage Transmission Tow-er-Line Systems. Shock Vib. 2017, 2017, 1205976. [Google Scholar]
- Qiu, B.; Lu, Y.; Sun, L.; Qu, X.; Xue, Y.; Tong, F. Research on the damage prediction method of offshore wind turbine tower structure based on improved neural network. Measurement 2020, 151, 107141. [Google Scholar] [CrossRef]
- Fei, Q.; Zhou, H.; Han, X.; Wang, J. Structural health monitoring oriented stability and dynamic analysis of a long-span transmission tower-line system. Eng. Fail. Anal. 2012, 20, 80–87. [Google Scholar] [CrossRef]
- Okamura, T.; Ohkuma, T.; Hongo, E.; Okada, H. Wind response analysis of a transmission tower in a mountainous area. J. Wind. Eng. Ind. Aerodyn. 2003, 91, 53–63. [Google Scholar] [CrossRef]
- Lynch, J.P.; Loh, K.J. A summary review of wireless sensors and sensor networks for structural health monitoring. Shock Vib. Dig. 2006, 38, 91–130. [Google Scholar] [CrossRef] [Green Version]
- Sabato, A.; Niezrecki, C.; Fortino, G. Wireless MEMS-Based Accelerometer Sensor Boards for Structural Vibration Moni-toring: A Review. IEEE Sens. J. 2017, 17, 226–235. [Google Scholar] [CrossRef]
- Huang, X.; Zhao, Y.; Zhao, L.; Yang, L. A Method for Settlement Detection of the Transmission Line Tower under Wind Force. Sensors 2018, 18, 4355. [Google Scholar] [CrossRef] [PubMed] [Green Version]
- Wang, J.; Wang, Z.; Feng, Y. Measurement and Analysis of Structure Vibration of In-service High Voltage Transmission Tower. J. North China Electr. Power Univ. 2016, 43, 62–65. [Google Scholar]
- Nan, Y.; Xie, W.; Min, L.; Cai, S.; Ni, J.; Yi, J.; Luo, X.; Wang, K.; Nie, M.; Wang, C.; et al. Real-Time Monitoring of Wind-Induced Vibration of High-Voltage Transmission Tower Using an Optical Fiber Sensing System. IEEE Trans. Instrum. Meas. 2020, 69, 268–274. [Google Scholar] [CrossRef]
- Anindya, G.; Mannur, J.S.; Mark, J.S.; Frank, P.P. Structural health monitoring techniques for wind turbine blades. J. Wind Eng. Ind. Aerodyn. 2000, 85, 309–324. [Google Scholar]
- Zhang, H.; Schulz, M.; Naser, A.; Ferguson, F.; Pai, P. Structural Health Monitoring Using Transmittance Functions. Mech. Syst. Signal Process. 1999, 13, 765–787. [Google Scholar] [CrossRef]
- Xiao-feng, H. On the setting of impulse-respouse method. J. Changde Teach. Univ. 2003, 2, 15. [Google Scholar]
Figure 1.
Monitoring device: (a) Operating principle block diagram; (b) Drive circuit; (c) Photograph of the monitoring device.
Figure 1.
Monitoring device: (a) Operating principle block diagram; (b) Drive circuit; (c) Photograph of the monitoring device.

Figure 2.
The force generating device: (a) Structural of the force generating device; (b) A photo of the force generating device.
Figure 2.
The force generating device: (a) Structural of the force generating device; (b) A photo of the force generating device.

Figure 3.
Wireless acceleration sensor.

Figure 4.
System workflow chart.

Figure 5.
Test platform: (a) A photo of test platform; (b) A schematic of the test platform.

Figure 6.
Excitation and response curve: (a) The curve of the force; (b) Acceleration in the X direction; (c) Acceleration in the Y direction; (d) Acceleration in the Z direction.
Figure 6.
Excitation and response curve: (a) The curve of the force; (b) Acceleration in the X direction; (c) Acceleration in the Y direction; (d) Acceleration in the Z direction.

Figure 7.
Frequency response functions of the tower system: (a) F-x & A-x; (b) F-x & A-y; (c) F-x & A-z; (d) F-y & A-x; (e) F-y & A-y; (f) F-y & A-z; (g) F-z & A-x; (h) F-z & A-y; and (i) F-z & A-z.
Figure 7.
Frequency response functions of the tower system: (a) F-x & A-x; (b) F-x & A-y; (c) F-x & A-z; (d) F-y & A-x; (e) F-y & A-y; (f) F-y & A-z; (g) F-z & A-x; (h) F-z & A-y; and (i) F-z & A-z.

Figure 8.
Experimental site.

Figure 9.
Frequency response function before and after settlement.

Figure 10.
Box diagram: (a) 3rd mode at single leg settlement; (b) 4th mode at single leg settlement; (c) 5th mode at single leg settlement; (d) 3rd mode at two legs settlement; (e) 4th mode at two legs settlement; (f) 5th mode at two legs settlement; (g) 3rd mode at three legs settlement; (h) 4th mode at three legs settlement; and (i) 5th mode at three legs settlement.

Figure 11.
Normalized radar chart: (a) Positive sequence; (b) Inverted sequence.

Publisher’s Note: MDPI stays neutral with regard to jurisdictional claims in published maps and institutional affiliations. |
© 2021 by the authors. Licensee MDPI, Basel, Switzerland. This article is an open access article distributed under the terms and conditions of the Creative Commons Attribution (CC BY) license (https://creativecommons.org/licenses/by/4.0/).
Share and Cite
MDPI and ACS Style
Wang, L.; Liu, C.; Zhu, X.; Xu, Z.; Zhu, W.; Zhao, L. Active Vibration-Based Condition Monitoring of a Transmission Line. Actuators 2021, 10, 309. https://0-doi-org.brum.beds.ac.uk/10.3390/act10120309
AMA Style
Wang L, Liu C, Zhu X, Xu Z, Zhu W, Zhao L. Active Vibration-Based Condition Monitoring of a Transmission Line. Actuators. 2021; 10(12):309. https://0-doi-org.brum.beds.ac.uk/10.3390/act10120309
Chicago/Turabian StyleWang, Liuhuo, Chengfeng Liu, Xiaowei Zhu, Zhixian Xu, Wenwei Zhu, and Long Zhao. 2021. "Active Vibration-Based Condition Monitoring of a Transmission Line" Actuators 10, no. 12: 309. https://0-doi-org.brum.beds.ac.uk/10.3390/act10120309
Note that from the first issue of 2016, this journal uses article numbers instead of page numbers. See further details here.