Article

Characterisation of Type II DNA Methyltransferases of Metamycoplasma hominis

Institute of Medical Microbiology and Hospital Hygiene, Medical Faculty of the Heinrich-Heine-University Duesseldorf, Universitätsstraße 1, 40225 Duesseldorf, Germany
*
Author to whom correspondence should be addressed.
These authors contributed equally to this work.
Submission received: 27 March 2023 / Revised: 2 June 2023 / Accepted: 13 June 2023 / Published: 15 June 2023
(This article belongs to the Special Issue Mycoplasma Pathogenicity, Persistence and Virulence)

Abstract

:
Bacterial virulence, persistence and defence are affected by epigenetic modifications, including DNA methylation. Solitary DNA methyltransferases modulate a variety of cellular processes and influence bacterial virulence; as part of a restriction-modification (RM) system, they act as a primitive immune system in methylating the own DNA, while unmethylated foreign DNA is restricted. We identified a large family of type II DNA methyltransferases in Metamycoplasma hominis, comprising six solitary methyltransferases and four RM systems. Motif-specific 5mC and 6mA methylations were identified with a tailored Tombo analysis on Nanopore reads. Selected motifs with methylation scores >0.5 fit with the gene presence of DAM1 and DAM2, DCM2, DCM3, and DCM6, but not for DCM1, whose activity was strain-dependent. The activity of DCM1 for CmCWGG and of both DAM1 and DAM2 for GmATC was proven in methylation-sensitive restriction and finally for recombinant rDCM1 and rDAM2 against a dam-, dcm-negative background. A hitherto unknown dcm8/dam3 gene fusion containing a (TA) repeat region of varying length was characterized within a single strain, suggesting the expression of DCM8/DAM3 phase variants. The combination of genetic, bioinformatics, and enzymatic approaches enabled the detection of a huge family of type II DNA MTases in M. hominis, whose involvement in virulence and defence can now be characterized in future work.

1. Introduction

Metamycoplasma hominis is a facultative pathogen of the human urogenital tract, controversially discussed to be associated with bacterial vaginosis, pelvic inflammatory disease, preterm birth [1], and disseminated infections, such as septic arthritis, (neonatal) meningitis, or abscesses [2,3]. M. hominis belongs to the class of the cell wall-less mollicutes that have evolved from gram-positive species by reductive evolution, initiated by a parasitic life on the mucosal surfaces of the host with the result of a minimized genome and limited metabolic activity [4]. Against this rather unexpected background, mycoplasmas possess a large repertoire of mobile genetic elements (MGEs), defence islands, and genomic hotspots, which account for their phenotypic intra-species heterogeneity [5]. DNA methyltransferases (MTases) were found to be encoded by genes of hotspots and defence islands, either solitary or as part of a restriction-modification (RM) system [6]. RM systems were more often detected in small MGEs that were sometimes affected by degradation, resulting in the expression of residual RM genes, whereas solitary MTase genes are transferred by large MGEs [7].
Methylation is the main epigenetic modification of bacterial DNA [8], and the repertoire of DNA MTases represents a characteristic signature of the respective strain, associated with vitality, defence, and virulence [9]. DNA MTases transfer a methyl group from S-adenosine-L-methionine (SAM or AdoMet) to the N6 position of adenine (6mA MTases) or the N4 or C5 position of cytosine (4mC or 5mC MTases) of a specific recognition sequence [10]. The exocyclic N-targeting, N-6-adenine, and N-4-cytosine MTases contain nine conserved domains [11] and are subdivided into six groups (α, β, γ, ξ, δ, and ε) due to their SAM binding site (motifs X, I–III), catalytic site (motifs IV–VIII), and target recognition site (TRD) [12], whereas C-5 MTases contain 10 motifs (I–X) in a common two-domain architecture ([I–VIII]—TRD-[IX–X] [13,14,15]), of which six motifs (I, IV, VI, VIII, IX, and X) are higher conserved [15,16,17].
DNA methylations by solitary MTases are known to affect gene regulation [9,18] or modulate various cellular processes, such as DNA repair, cell cycle control, or mismatch repair [19,20,21]. RM systems primarily serve as a rudimentary bacterial immune system to defend against foreign DNA [22,23]. Protecting their own DNA with a specific methylation of a sequence motif (MTase activity), the foreign DNA (e.g., derived from bacteriophages [24]) will be restricted at the respective non-methylated DNA-motif (REase activity). Over 3000 different RM systems have been identified in prokaryotes to date [25], of which the largest class comprises type II RM systems. MTase and REase of type II RM systems are organized in the same operon, but they act independently on short (usually 4–8 bp) palindromic recognition sequences.
In mycoplasmas, DNA methylation and associated RM systems have been poorly studied. A large-scale study by Dordet-Frisoni et al. examined the effects of M. agalactiae RM systems on genome plasticity and pan-epigenomic dynamics [26]. Samashko et al. characterized the type I RM system dependent downregulation of gene expression in M. gallisepticum to depend on 6mA modification of the promoter region in the -10-box [27]; Chernov et al. demonstrated for M. hyorhinis, a host cell-invasive mycoplasma species, that special GmATC- and mCG-specific MTases can selectively and efficiently methylate the host genome, thus altering the epigenetic landscape in human cells [28]. A comprehensive characterisation of the methylome of M. genitalium and M. pneumoniae was done in using SMRT (Single-Molecule-Real-Time) sequencing and led to the identification of a formerly unknown bacterial 6mA methylation motif (CTmAT) [29]. In M. hominis, an MTase gene was detected in type strain ATCC23114 by comparative genomics and later characterized as conserved part on ICEHo-I, an integrative and conjugative element [13,30,31]. Apart from this postulated C5-cytosine DNA MTase (named DCM1 in this study), no further 5mC, 4mC, or 6mA type II DNA MTases had been characterised in M. hominis so far. The aim of this study was to fill this knowledge gap by characterizing novel MTase homologs.

2. Material and Methods

2.1. Bacterial Culturing and Nucleic Acid Preparations

M. hominis strains, which were isolated from human specimens, were cultivated in arginine medium as described in detail previously [32]. Escherichia coli clones were cultivated overnight in LB medium supplemented with 100 mg/L ampicillin and 25 mg/L chloramphenicol.
For qPCR analysis, cell sediment of 1 mL culture was suspended in 200 µL proteinase K solution (66 µg/mL Proteinase K (Roche, Mannheim, Germany)/3.3 mM Tris/HCl, pH 8.0) and incubated for 1 h at 56 °C. After heat inactivation of the proteinase K for 30 min at 95 °C, insoluble material of the cell lysate was sedimented at 13,000× g for 10 min. The DNA containing supernatant was stored at −20 °C until use in PCR.
For restriction analysis, genomic DNA of bacterial strains was isolated by the use of the DNeasy Blood and Tissue kit (Qiagen, Hilden, Germany) following the tissue protocol with minor modifications for mycoplasma DNA as published [33].
For RT-PCR analysis, RNA was prepared with the RNeasy Kit (Qiagen GmbH, Hilden, Germany) and cDNA synthesised as published [34].
Concentration of genomic DNA and RNA was measured by Invitrogen Qubit 4 Fluorometer Qubit (ThermoFisher Scientific, Waltham, MA, USA). Quality of DNA and RNA was verified by NanoDrop 1000 Spectrophotometer (ThermoFisher Scientific, Waltham, MA, USA).

2.2. qPCR

Oligonucleotides used in qPCRs were designed using Probefinder (Roche Applied Science, Penzberg, Germany) (https://qpcr.probefinder.com, accessed on 17 February 2022) or PrimerSelect of DNASTAR (Madison, WI, USA). Primers are listed in Table 1.
qPCR assays were carried out in a total volume of 25 μL consisting of 1 × MesaGreen MasterMix (incl. reaction buffer, 4 mM MgCl2, dNTPs (N = A, C, G, T, U), Meteor Taq polymerase, SYBRGreen I, stabilizers, and fluorescein), 300 nM of each primer, and 2.5 μL of genomic DNA or cDNA solution, which was derived from 100 ng RNA [34]. Thermal cycling conditions were as follows: 1 cycle at 50 °C for 10 min, 1 cycle at 95 °C for 5 min, and 35 cycles at 95 °C for 15 s and 60 °C for 1 min. The product was then heated from 6 °C to 95 °C with an increment of 0.5 °C/15 s, and the plate read for melt curve analysis to check the identity of the amplicon. Cycling, fluorescent data collection, and analysis were carried out on a CFX-Cycler of BioRad Laboratories (Munich, Germany) according to the manufacturer’s instructions. Ct values were interpreted relative to the chromosomal M. hominis-specific hitA gene (genomic DNA) or the mean of three (housekeeping) genes gap, lgt, and mho_0150 (cDNA), which were shown to be differentially unregulated as formerly published [31,34]. Ct values >30 were interpreted as negative.

2.3. Methylation Sensitive Restriction (MSR) Analysis

Genomic DNA (0.75 µg) was digested with 3 U restriction enzyme in 15 µL for 1 h at 37 °C followed by heat inactivation of the enzyme at 80 °C for 20 min. Methylation specificities are listed in Table 2. Restricted DNA was analysed on 1% agarose gels.

2.4. Heterologous Expression of rDCM1 and rDAM2

Open reading frames of dcm1 (isolate FBG) and dam2 (isolate 8958) were codon optimized for best expression in E. coli and cloned into BamHI-HinDIII sites of pcDNA3.1(-)-myc-HisA (GenScript Biotech B.V., Leiden, The Netherlands). Plasmids were propagated into dam/dcm-deficient E. coli (New England Biolabs GmbH, Frankfurt am Main, Germany) and cultivated in LB medium supplemented with 100 mg/L ampicillin and 25 mg/L chloramphenicol. Heterologous expression of His6-tagged proteins was documented in His4-immunostaining as formerly published [35].

2.5. Tailored Tombo-Analysis

The present study was based on a re-analysis of Nanopore sequencing data generated for an earlier study [31]; full details on sample preparation and sequencing data generation are given in Henrich et al. (2020) [31]. Briefly, M. hominis isolates were sequenced on a MinION MK1B device (Oxford Nanopore Technologies, Oxford, UK); sequencing libraries from quality-controlled genomic DNA were prepared according to the manufacturer’s instructions and sequenced using the barcode ligation-based protocol. The methylation status for each cytosine and adenine in the analyzed mycoplasma isolates was determined with Tombo 1.5 (https://github.com/Nanoporetech/Tombo) [36], and the results were processed in R 4.2.1 [37]. The normalized signal was base-called by Tombo, and a methylation score was calculated for the specified bases. Modified base detection for 5mC and 6mA was calculated with the alternative 5mC and 6mA models, which are implemented in Tombo (parameter --alternate-bases 6mA 5mC). Output in bigwig format was specified via the parameter -–file-types coverage dampened_fraction. Motif-specific methylation scores were calculated by determining motif positions relative to the reference genome in R version 4.2.1 [36] and by extracting the methylation scores of the corresponding motif-contained A and C bases. A or C reference genome positions for which no methylation score was produced by Tombo were ignored; the effect of this was confirmed to be negligible (<1–2% of relevant positions per isolate). Visualization of methylation scores was carried out with the boxplot function in R.

2.6. Bioinformatic Analyses

Multiple sequence alignments were calculated using Genious Pro vers. 5.5.8 (Dotmatics, Boston, MA, USA) or MegAlign version 5.08 of the Lasergene software package (DNAStar, Madison, WI, USA). Genome alignments illustrating gene gain, loss, and rearrangement were performed with Genious. BLASTP 2.14.0 (https://blast.ncbi.nlm.nih.gov/Blast.cgi?PAGE=Proteins, accessed on 25 June 2022) and Phyre2 ver. 2.0 web portal (http://www.sbg.bio.ic.ac.uk/phyre2/html/page.cgi?id=index) [38] were used for protein prediction and analysis. REBASE ver. 306 (http://rebase.neb.com/rebase/rebase.html, accessed on 5 June 2022) was used for the prediction of restriction-modification systems and related proteins/MTases.

2.7. Statistical Analyses

Statistical analysis of the prevalence of (active) MTases and MGEs was carried out in Python version 3.8.16 using Jupyter Notebook version 6.4.12 (Project Jupyter, https://jupyter.org/). For analyses, the pandas version 1.4.3 and SciPy version 1.10.0 modules were primarily employed [37]. For Mann–Whitney U and Kruskal–Wallis tests, p-values were calculated using SciPy. No multiple testing corrections were used. For correlation analysis, correlation coefficients and p-values were calculated using Pearson’s R test. Visualization was performed using seaborn package version 0.11.2 [38].

3. Results

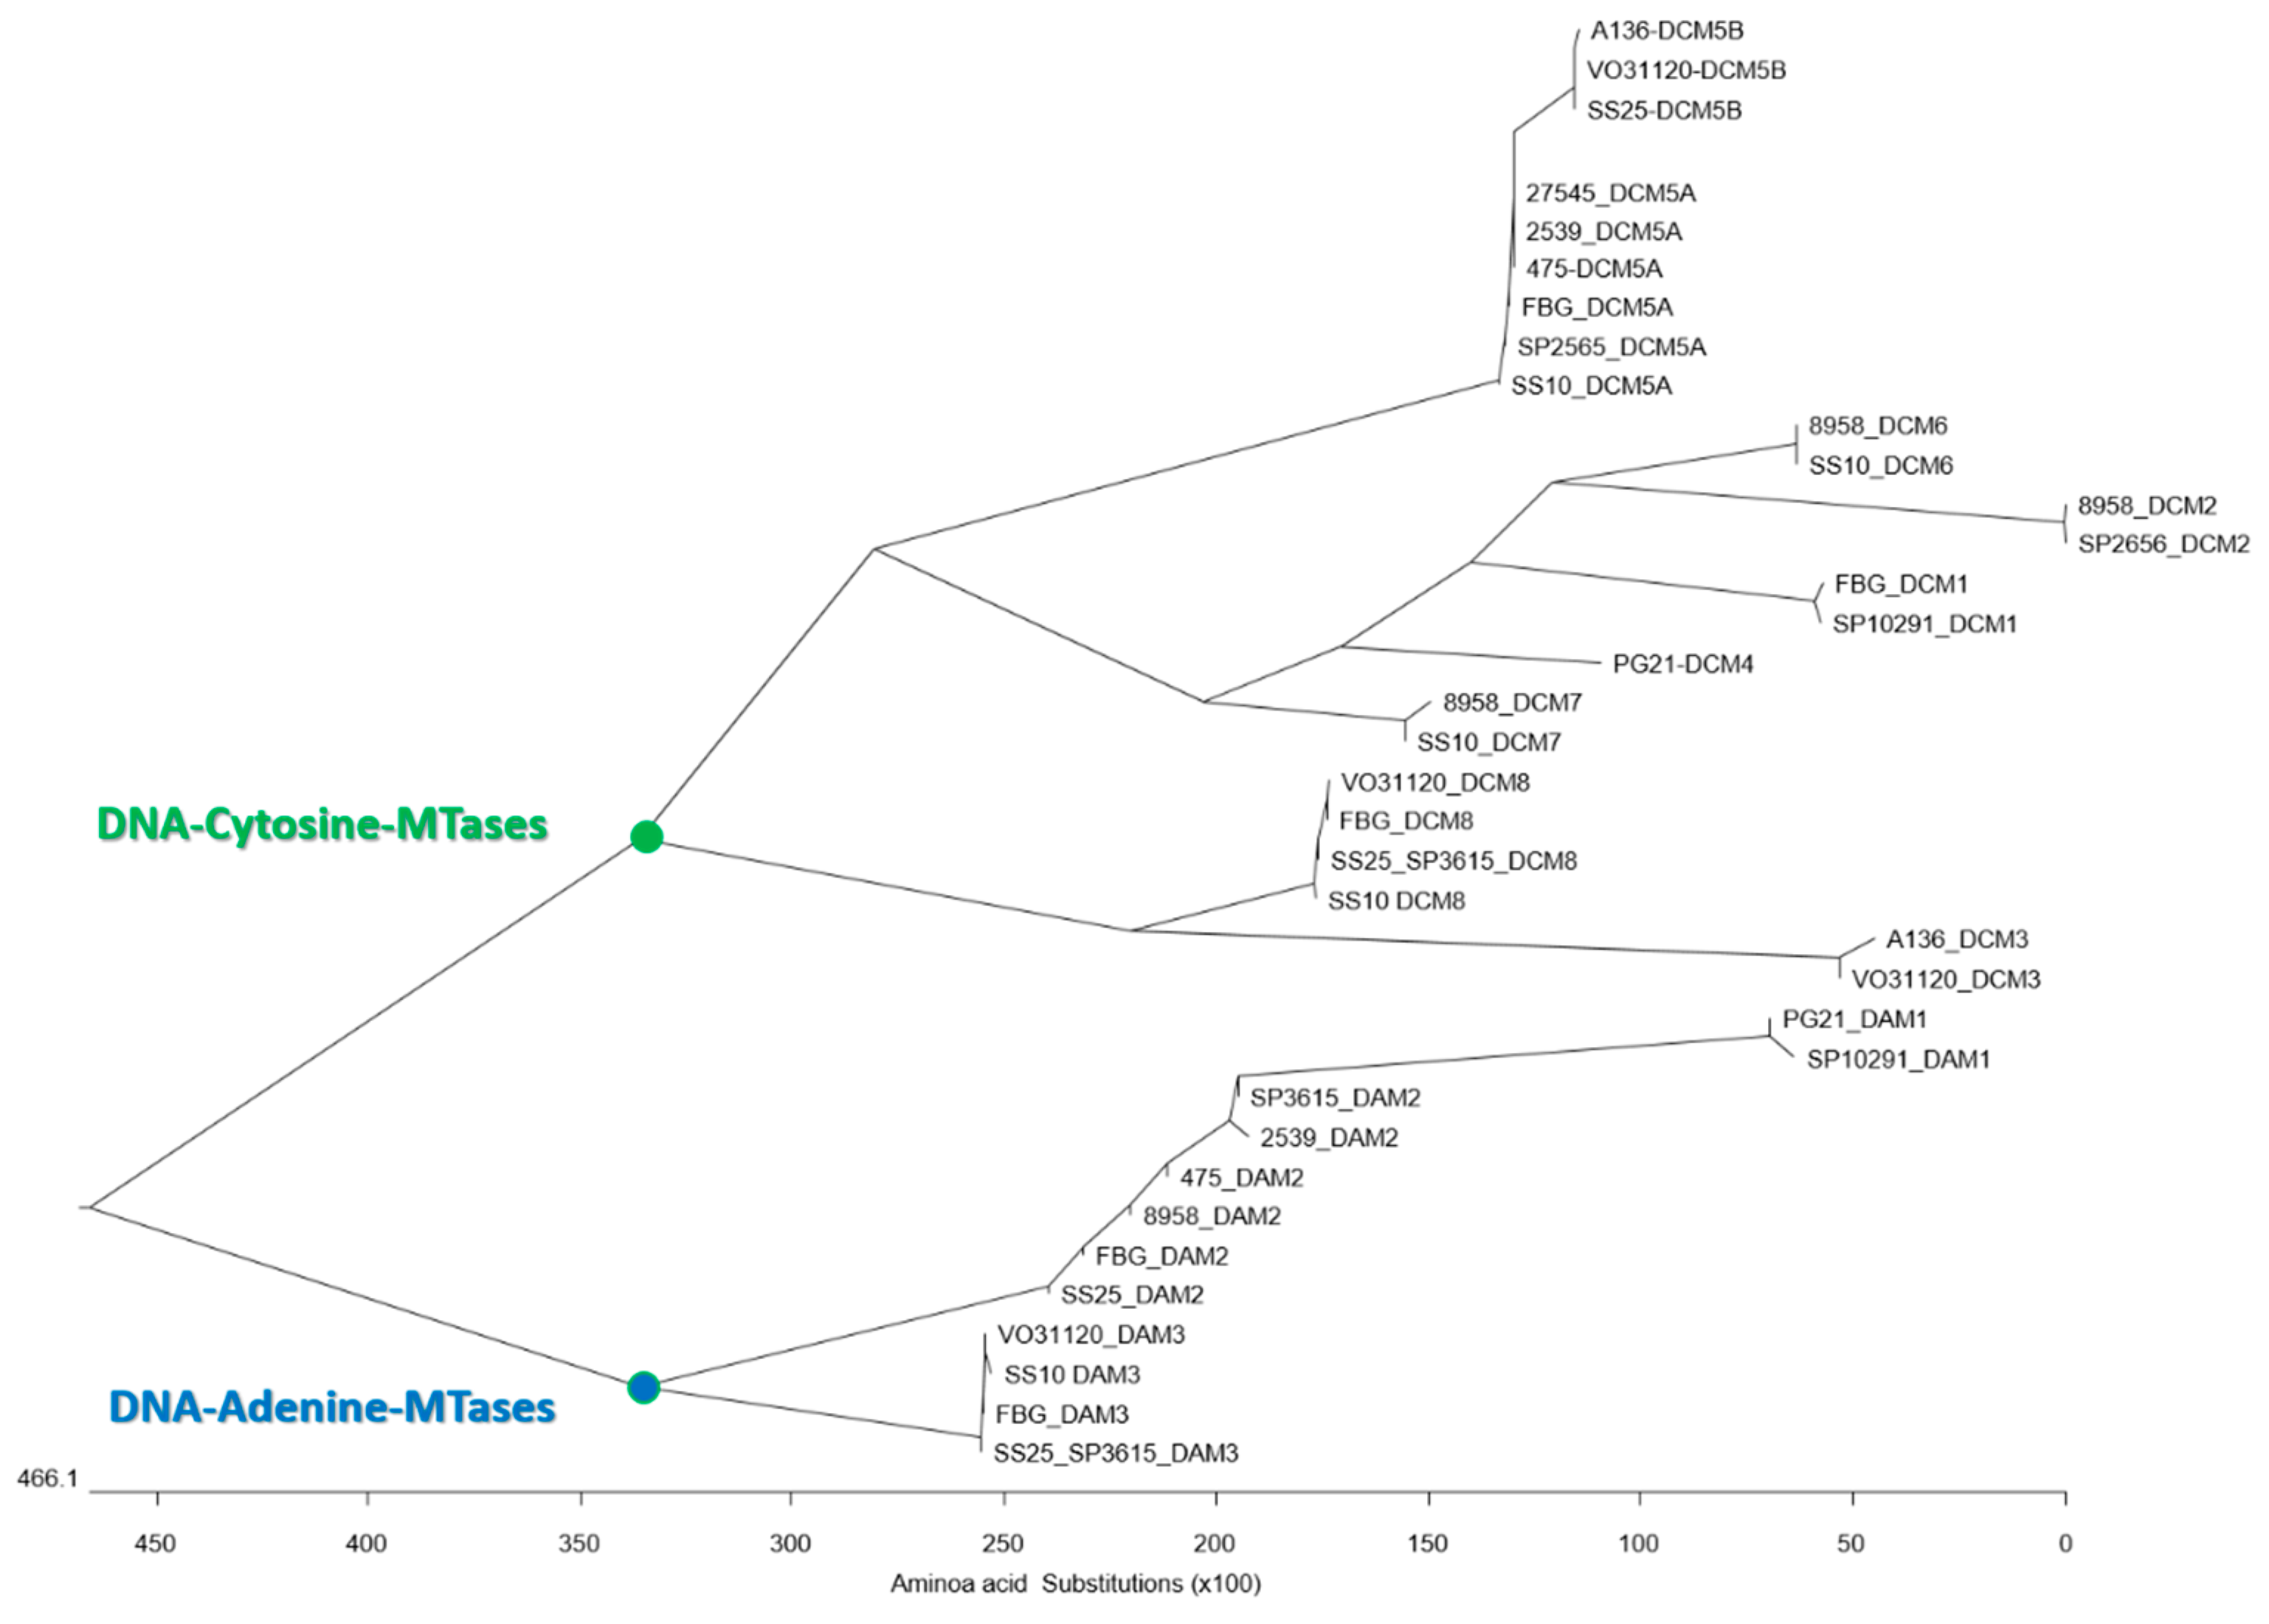
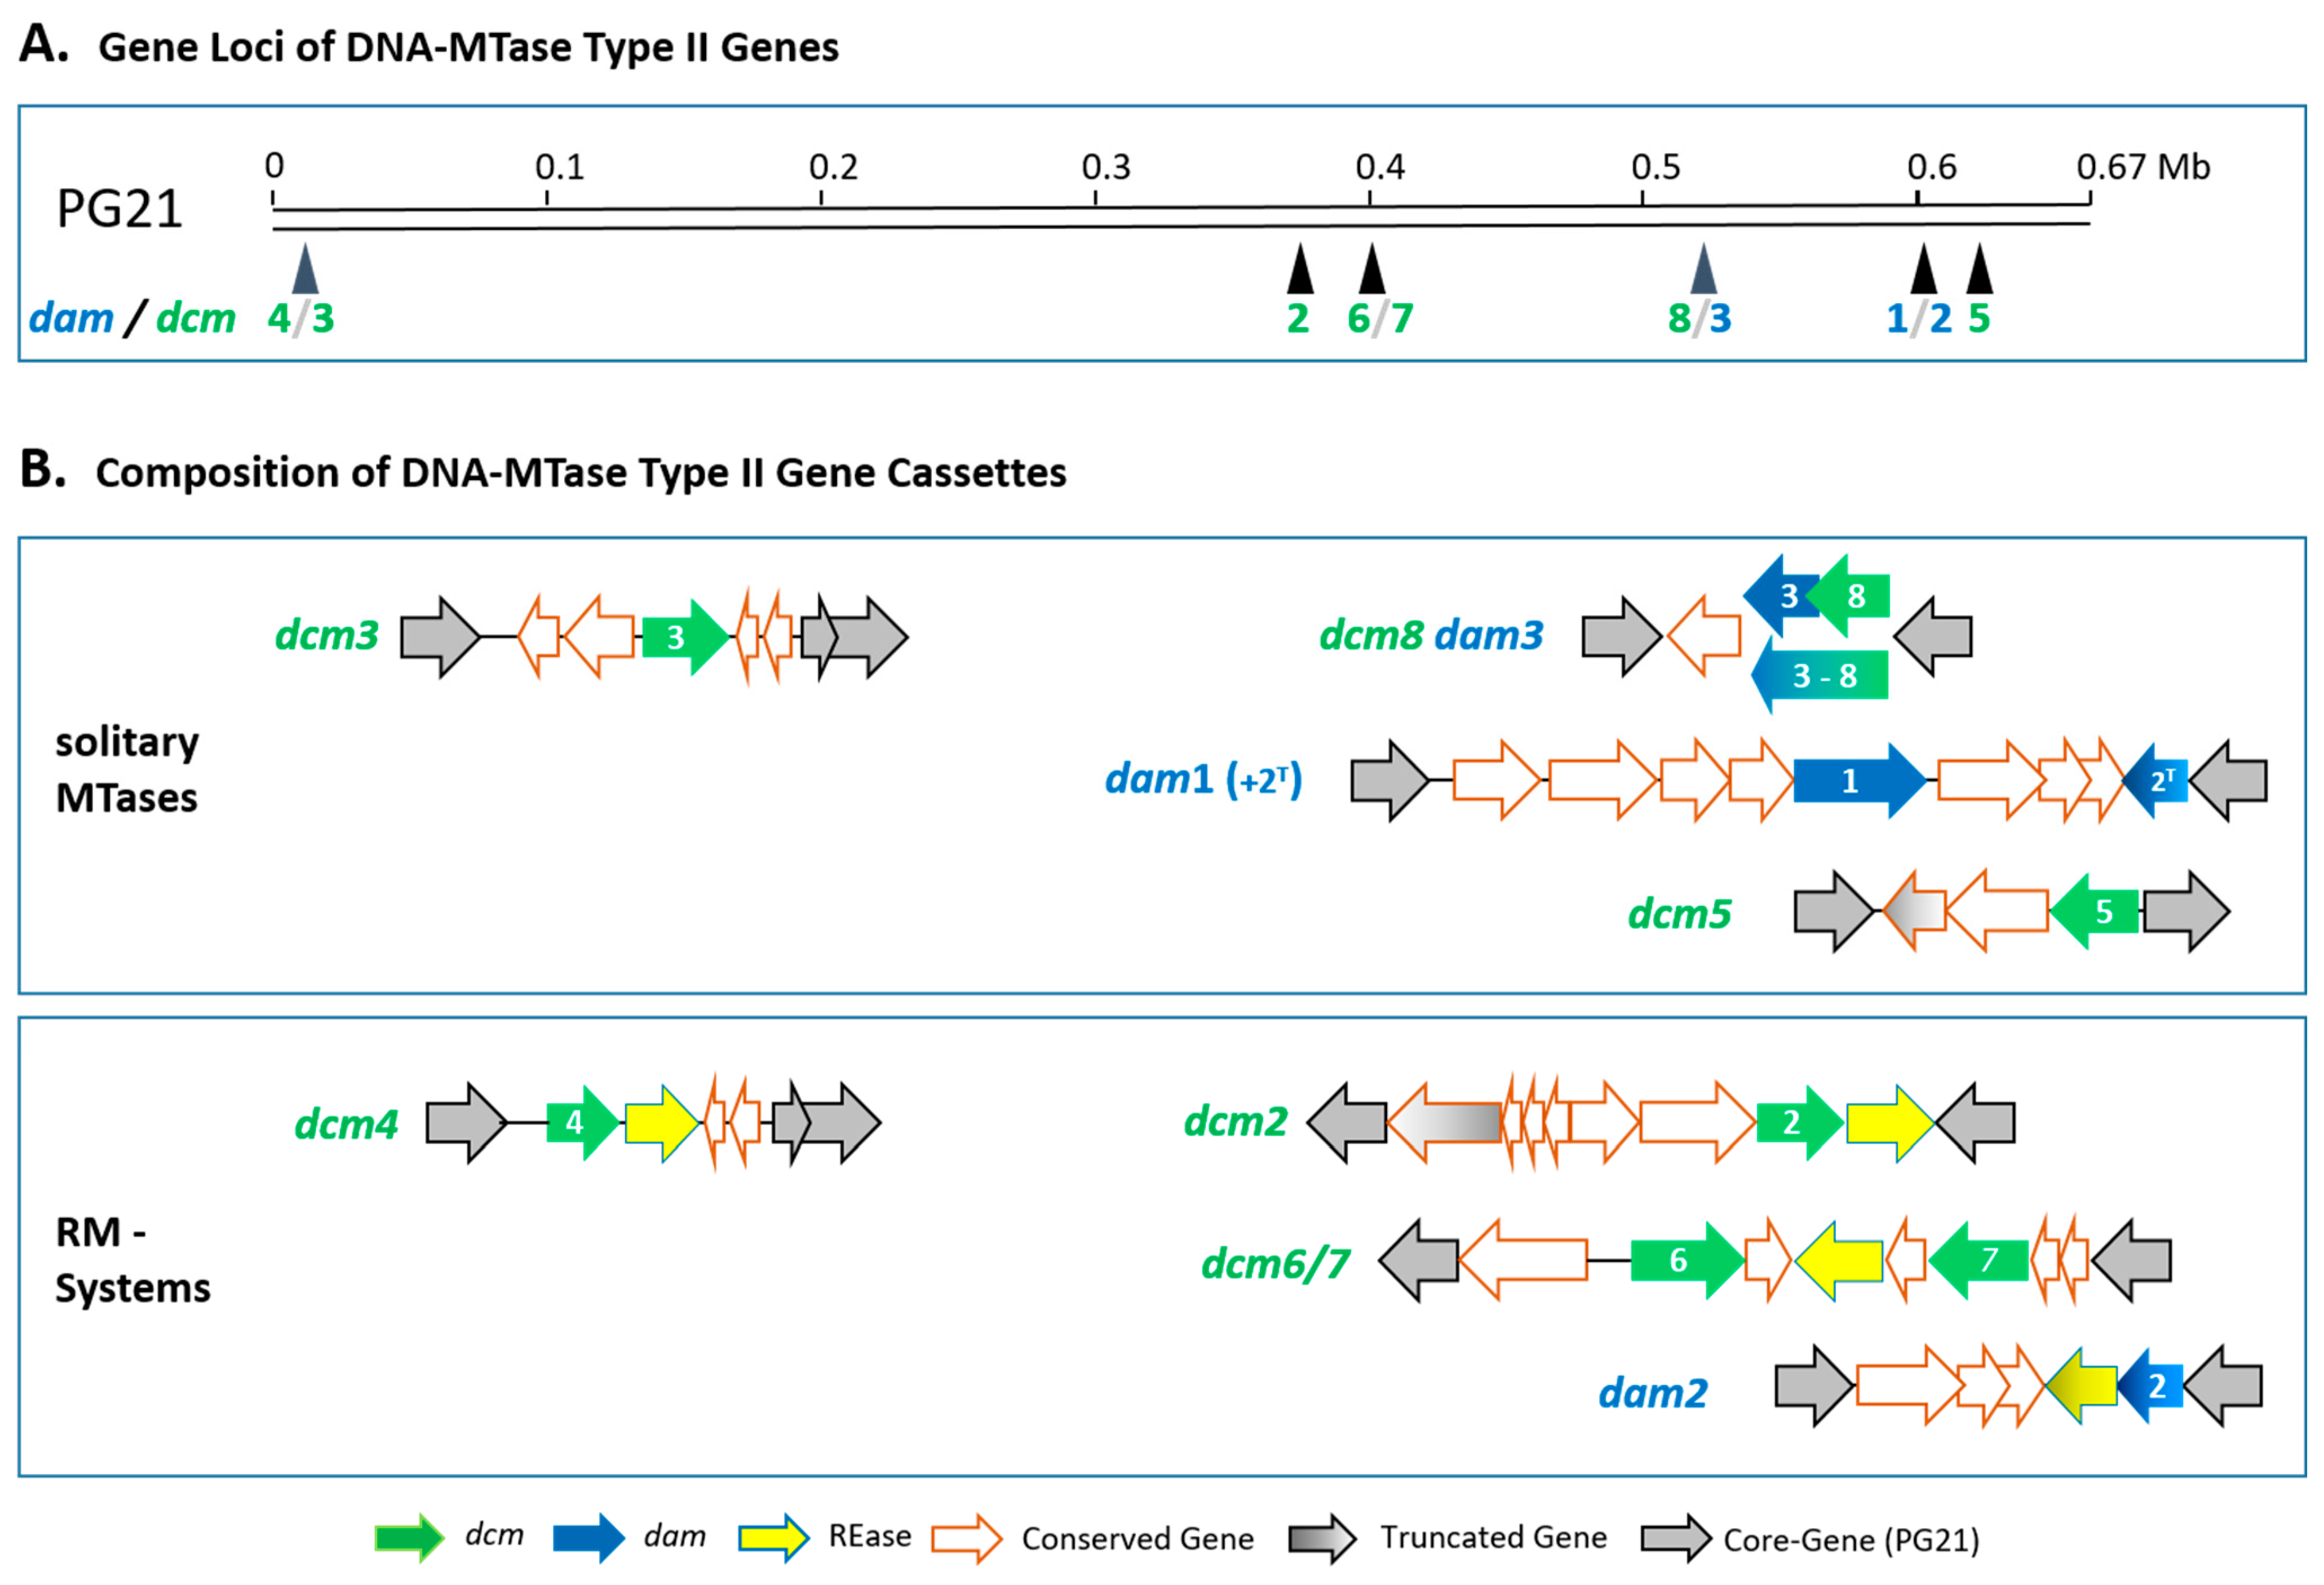
3.1. Detection of Type II MTases

In a BLASTP analysis, two M. hominis proteins of different lengths were detected as the highest homolog to the E. coli DAM protein sequence (283 AA; acc-no. QNJ69579.1): a 442 AA protein with 64% coverage and 32% AA identity in type strain PG21 (WP_012855752.1; named DAM1) and a 282 AA protein with 85% coverage and 34% identity in strain 8958 (WP_052498742.1; named DAM2). In a REBASE analysis, dcm1, dam1, and dam2 genes were detected in 9, 2, and 15 (8/15 with truncation) of 23 M. hominis genomes [31], respectively, and further gene loci identified encoding type II DNA MTases. A multiple protein sequence alignment was used for the construction of a phylogenetic tree (Figure 1). DCM1 and DAM1/DAM2 clustered in two separate branches, suggesting that members of one branch act as DNA-cytosine and the other as DNA-adenine MTases.
The DNA MTase protein sequences of M. hominis strains were aligned with ClustalW for the phylogenetic tree construction. Based on the phylogenetic branching, three different DNA-adenine MTases (DAM1 to DAM3) and eight DNA-cytosine MTases (DCM1 to DCM8) were postulated in the M. hominis strains tested.
The position of the DNA MTase genes was highly conserved; dcm1 was always present on the mobile genetic element ICEHo-I [30,31], although the integration site of the ICEHo-I element in the genomes was random. The localisation of the other MTase genes is schematically shown in Figure 2A with respect to type strain PG21 (ATCC 23114).
In addition to dcm1, five further solitary (orphan) MTase genes (dam1, dam3, dcm3, dcm5, and dcm8) and five MTase genes of RM systems (dam2, dcm2, dcm4, dcm6+dcm7) were predicted with the REBASE analysis (Figure 2B). The architecture of some MTase gene loci was strongly conserved (dam1, dcm1, dcm3, dcm4, dcm6+dcm7, and dcm8/dam3), whereas others were affected by strain-specific deletions and/or insertions of gene cassettes (dam2, dcm2, and dcm5; see Supplementary Figure S1). Four gene loci were targeted by two different MTase genes: dcm3 and dcm4; dcm6 and dcm7; dcm8 and dam3; and dam1 and dam2, respectively. The orphan MTase dcm3 and the dcm4 RM system both targeted the same genomic region corresponding to the PG21 region between genes MHO_0350 and MHO_0380. As they did not share sequence homologies to one another, a common ancestor or dcm4/REase-fusion to form dcm3 was excluded. For dam3 and dcm8, a rare fusion event was assumed in isolate SS10. As the fusion did not lead to a frameshift, the activity of both MTase parts was assumed. Dcm6 and dcm7 always occurred as RM systems in a conserved gene cassette, which was located between the PG21 homolog region between genes MHO_3280 and MHO_3300. The REase and dcm7 gene were positioned on the same coding strand, and dcm6 was on the opposite. A similar architecture was found for the dam1 and the dam2 RM system, both located in a genome region between MHO_4730 and MHO_4840, with dam1 on one strand and the dam2 RM system on the other. This gene locus was more diverse, but the same set of additional genes (MHO_4790-MHO_4810) was present in some strains. In contrast to dcm6/7, the dam1 and full-length dam2 genes did not occur simultaneously. If the dam2/REase-RM system was unscathed (in strains 8958, 475, SS25, SP3615) or dam2 truncated at the 5′-end (strains FBG or 2539), dam1 was never found. In strains with dam1 (PG21, SP10291), only fragments of the dam2 gene (pseudogenes) were present, and the REase gene was always absent (see Supplementary Figure S1).

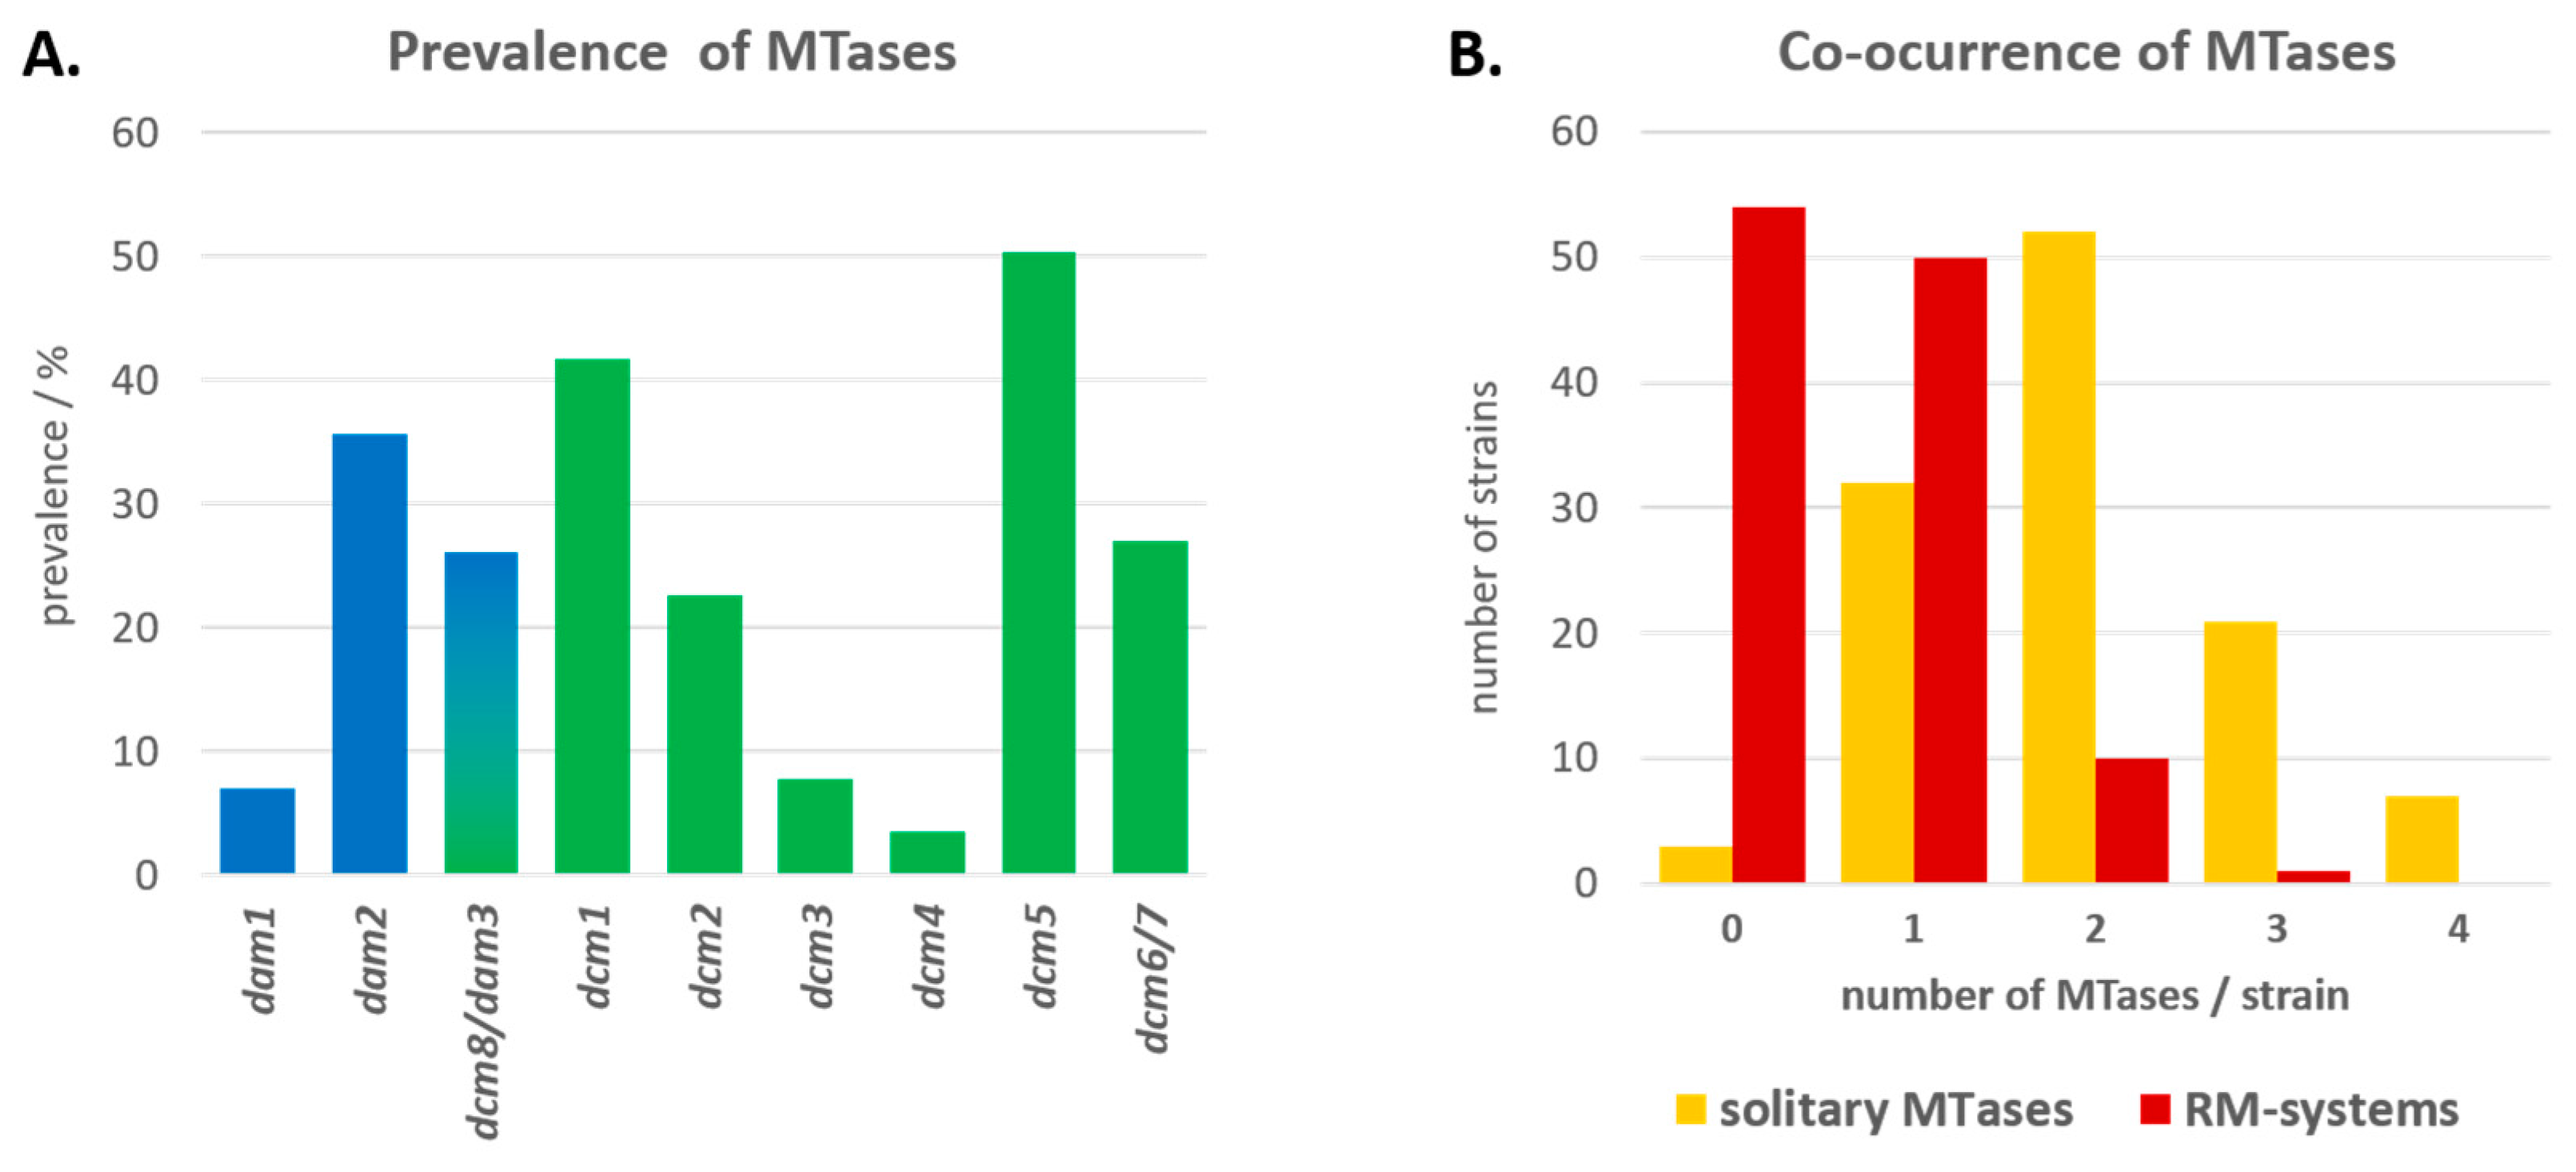
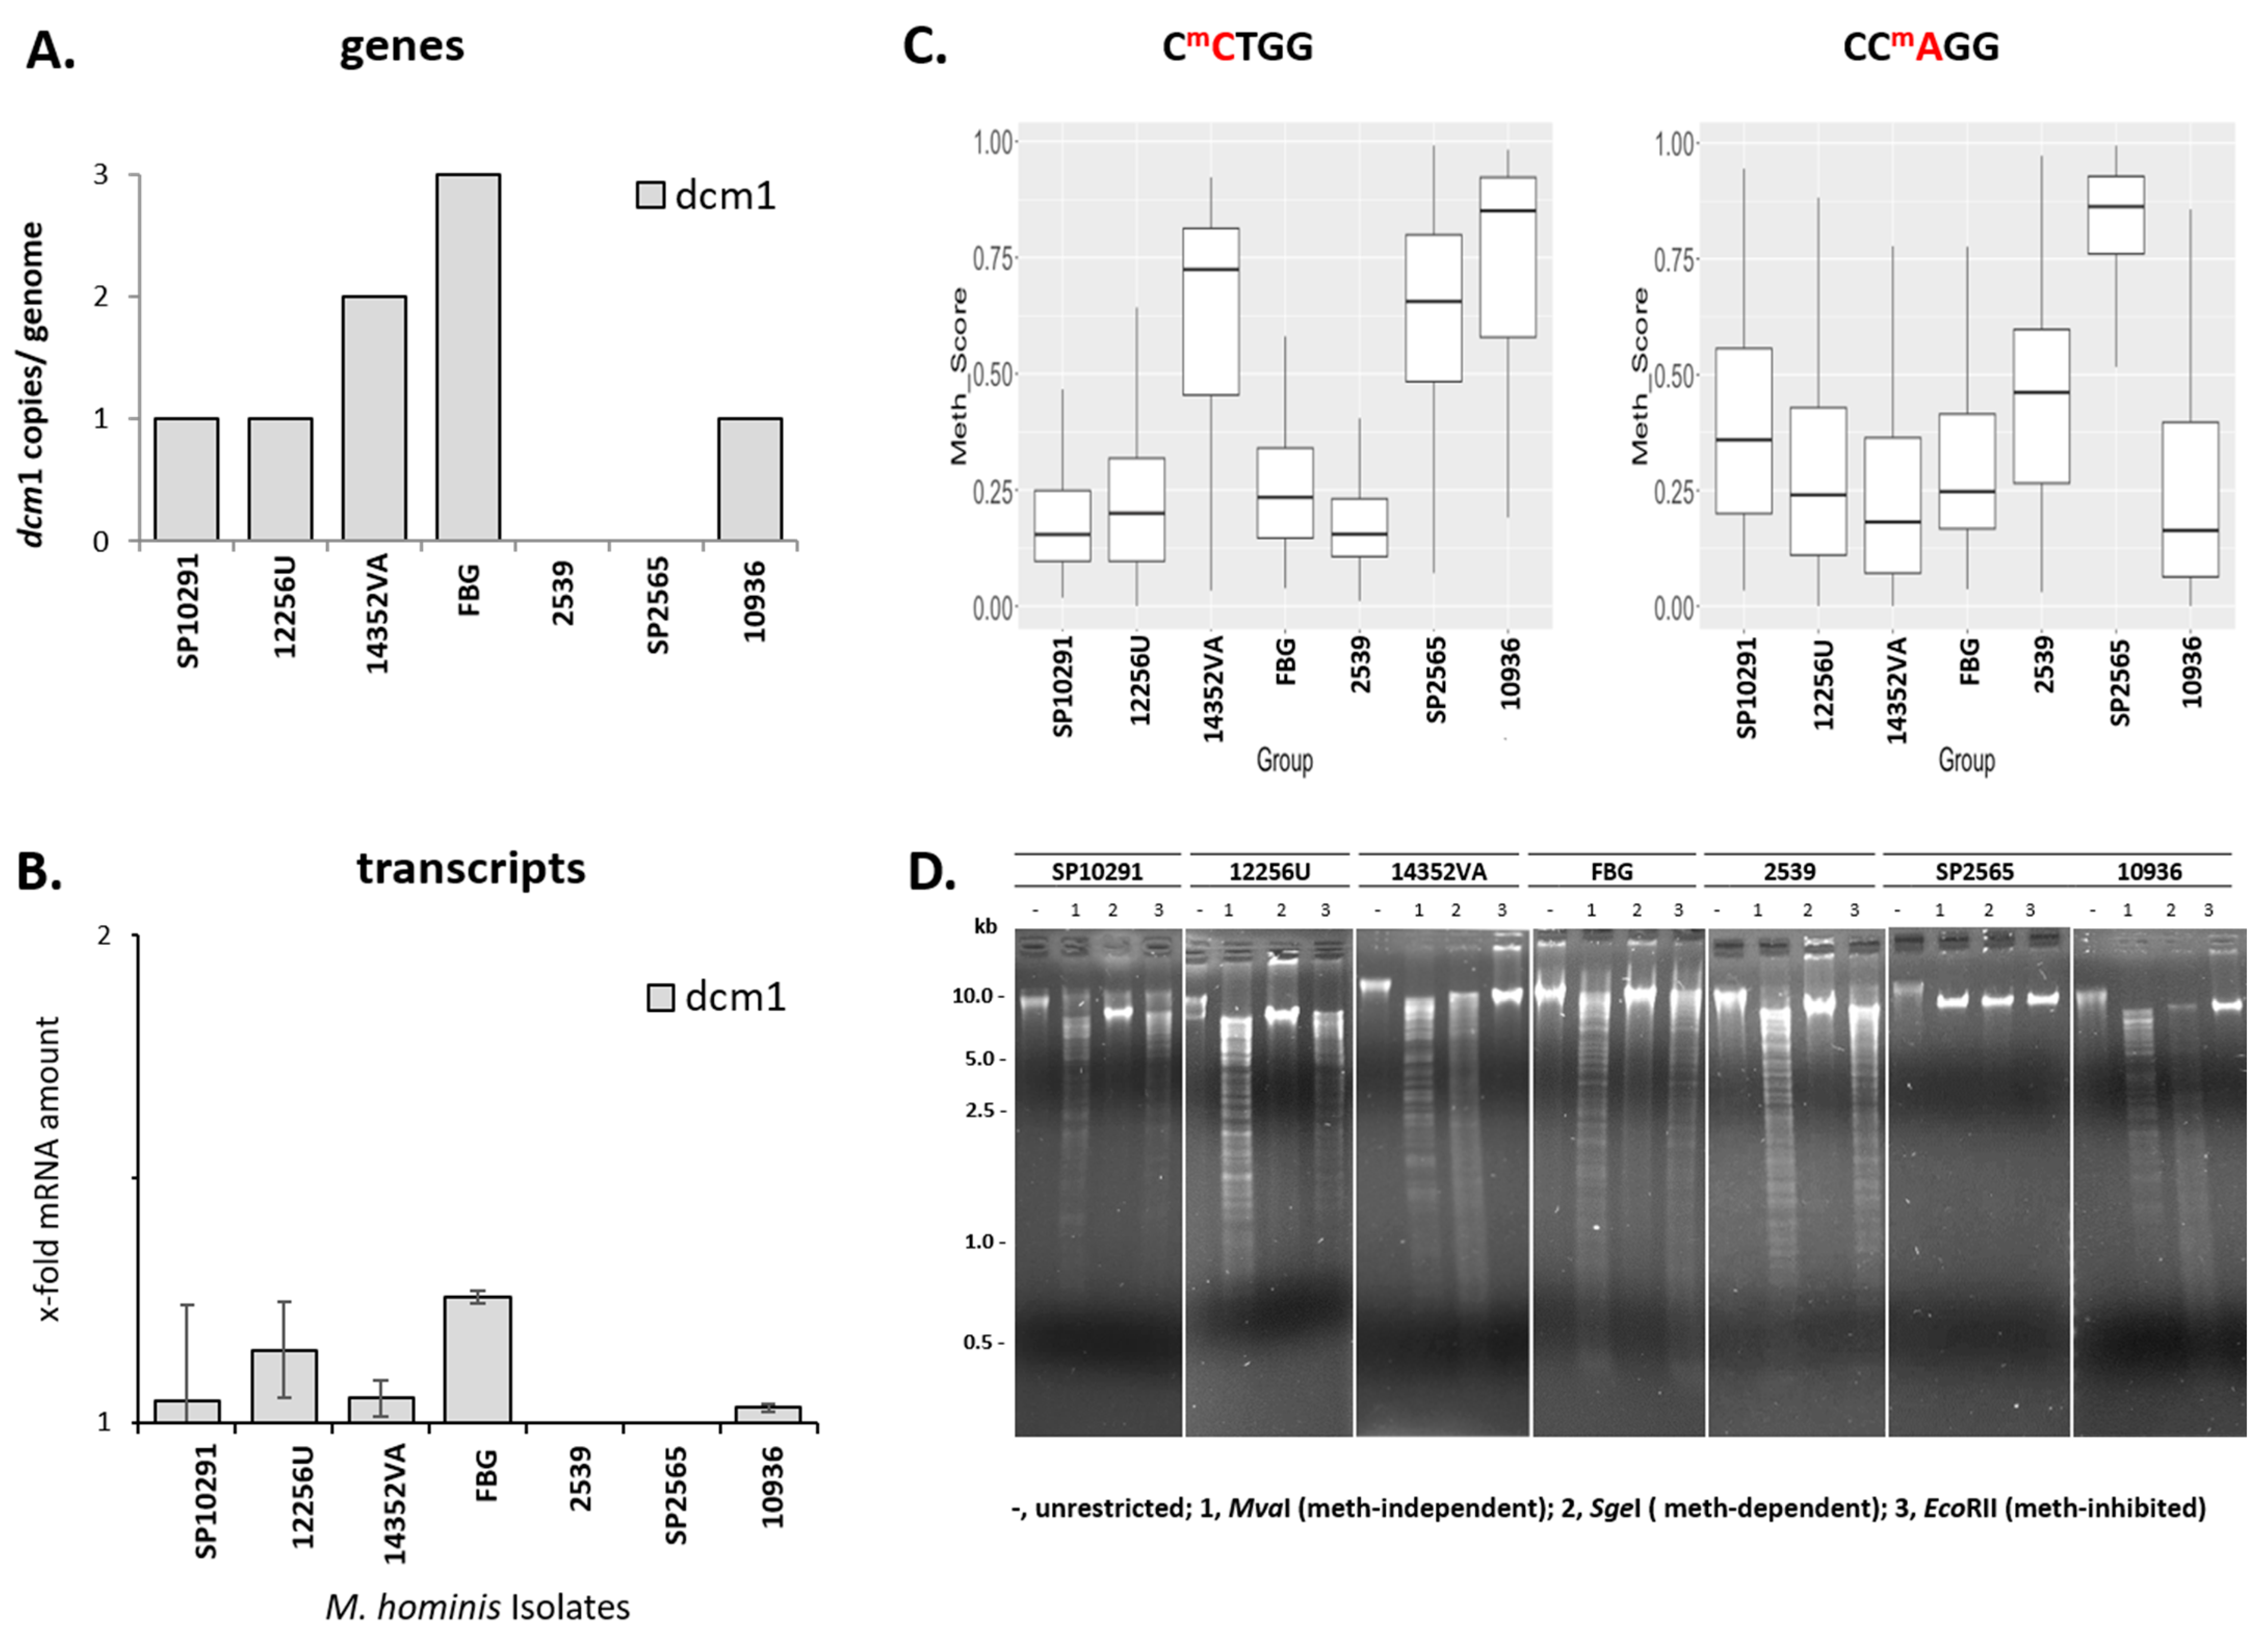
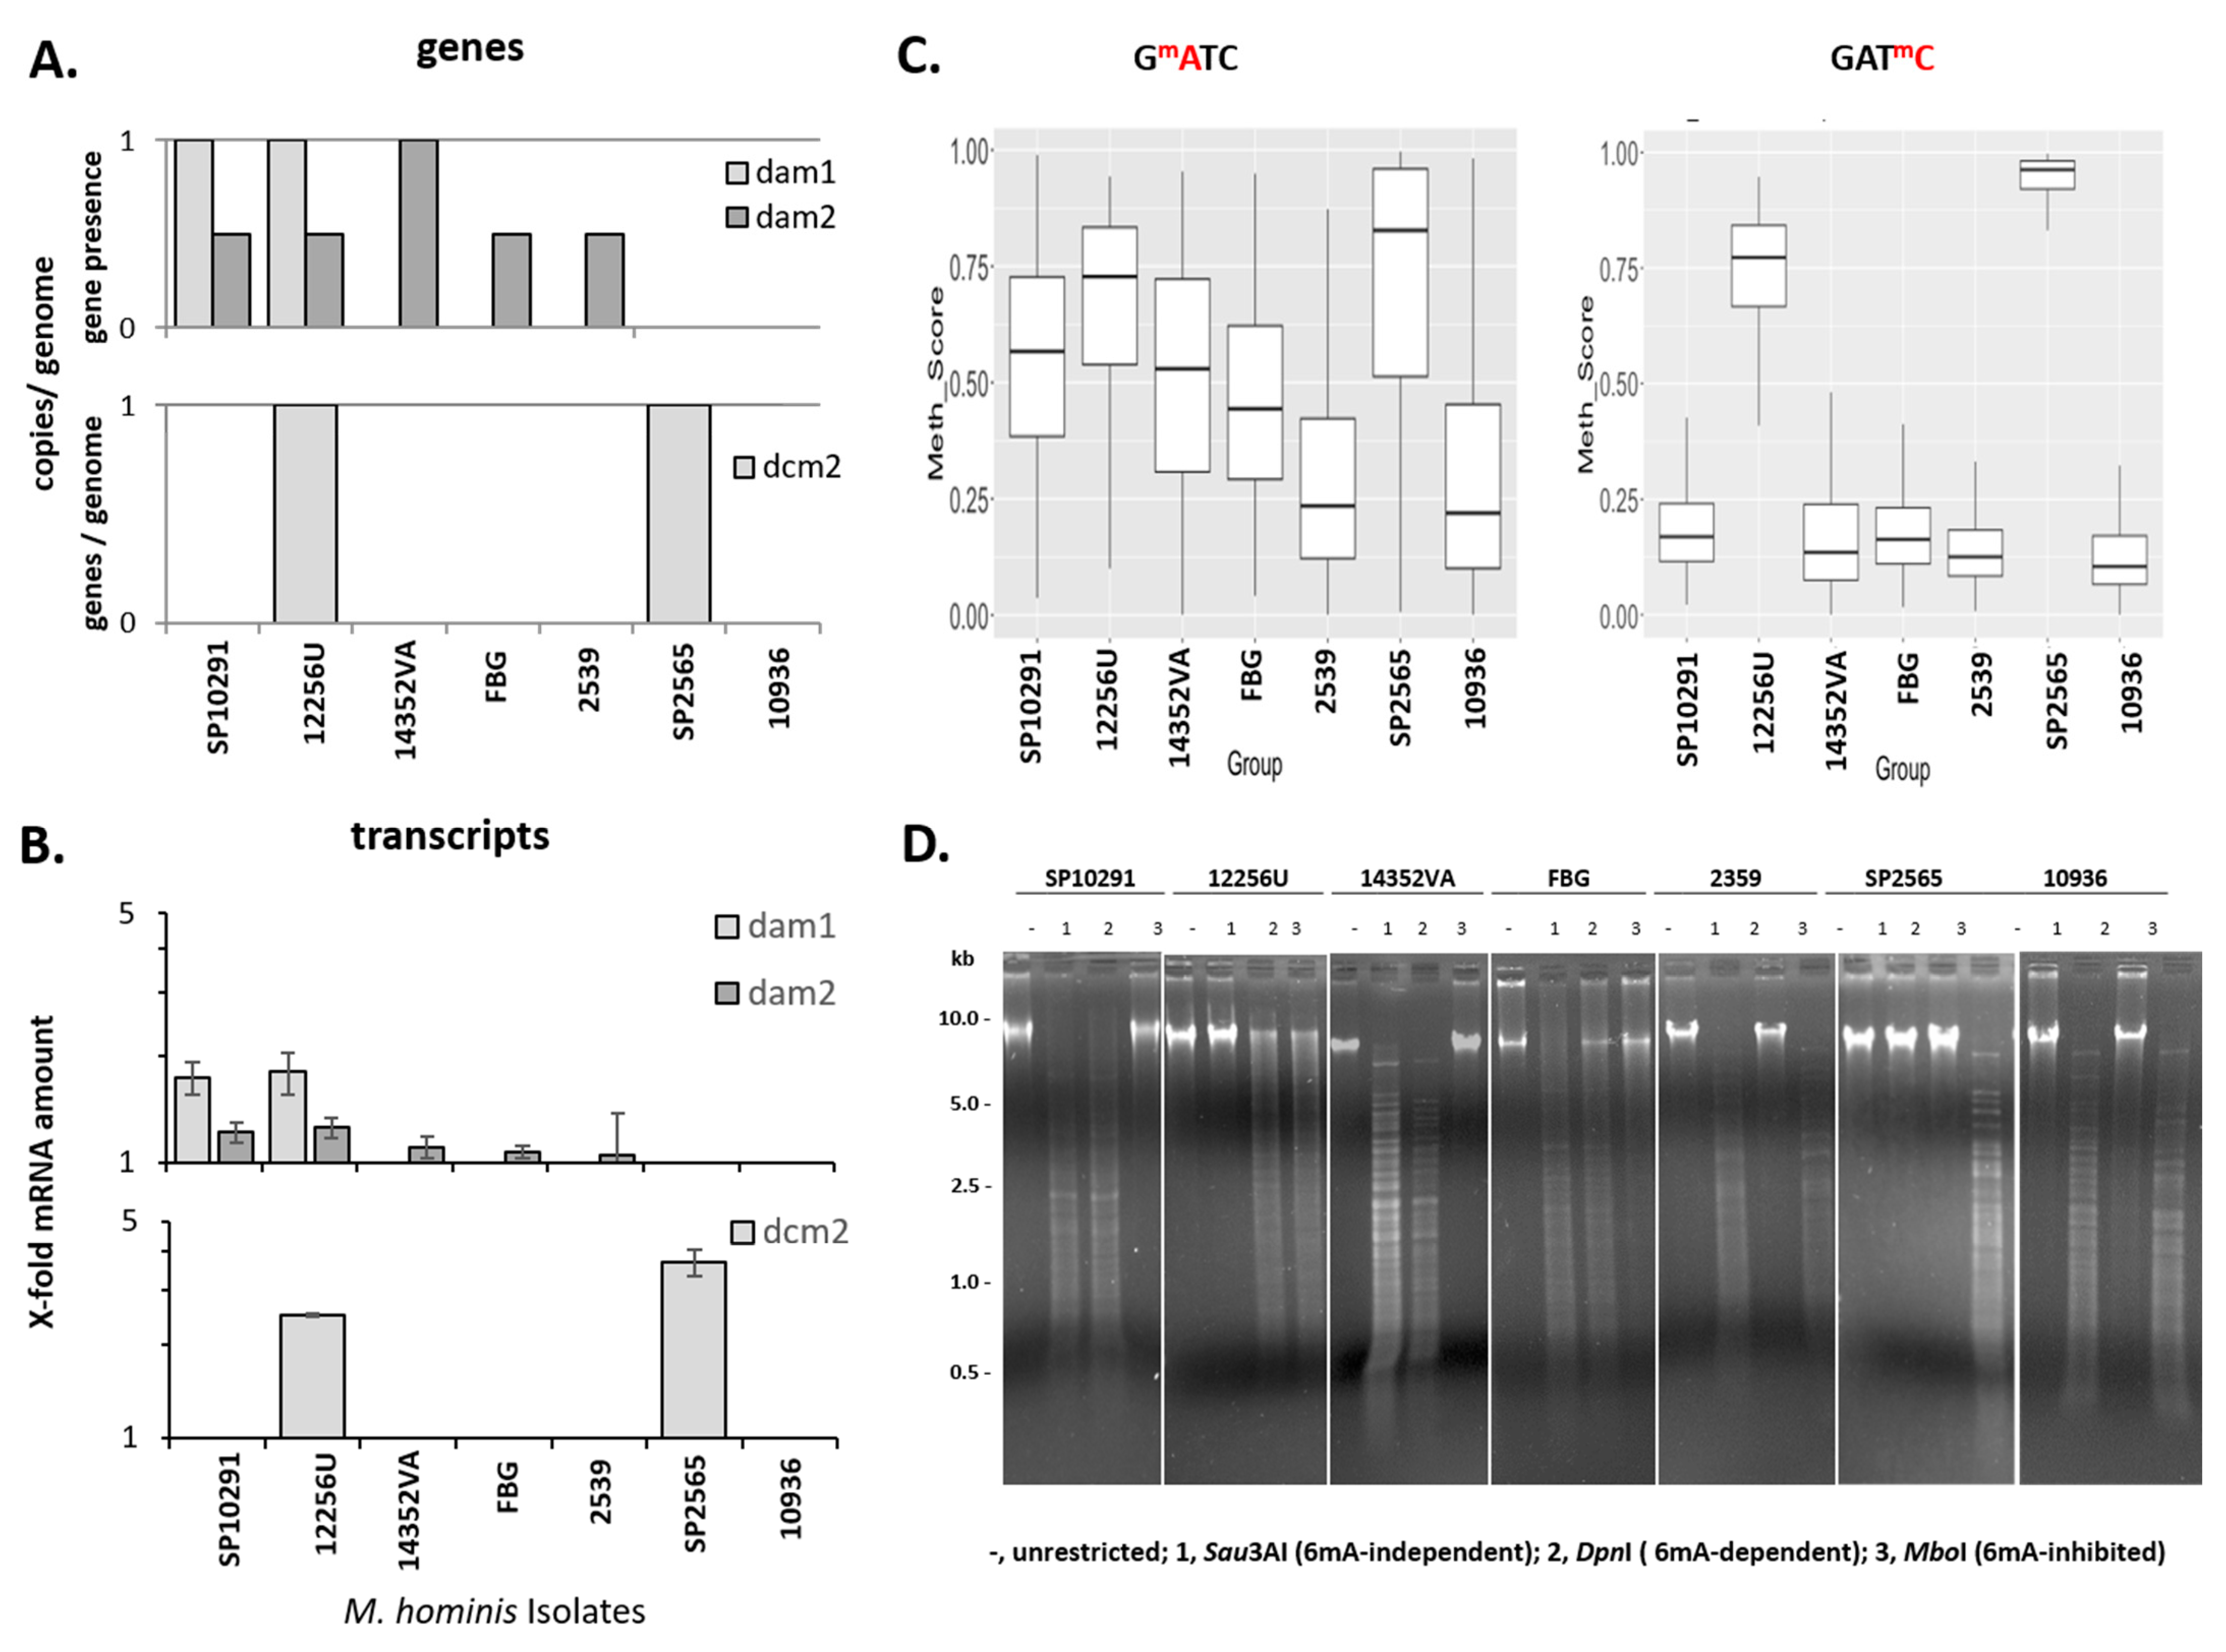
3.2. Prevalence of Type II MTases

Using a real time PCR (qPCR) screening approach, 115 isolates from the M. hominis strain collection of our institute were tested for the presence of dam and dcm homologues and related restriction endonuclease genes. To verify the accuracy of the qPCR screen, the already long-read sequenced genomes served as a control (Supplementary Table S2). The qPCR-based results were in perfect agreement for the sequenced strains. An amount of 55.7% (64/115) of the isolates carried dam homolog genes, and 93.9% (108/115) carried dcm homolog genes. Only 3/115 isolates were dam- and dcm-free. The prevalence of dam1 and dam2 was 7.0% (8/115) and 35.7% (41/115), respectively (Figure 3A). Thus, dam2 was the most common among the dam homologs; in one third of the cases (12/41), it was part of an RM system.
The prevalence of dcm8 and dam3 was 26.1% (30/115) each. It was not possible to distinguish with PCR whether they occurred as a fusion protein or individually. The prevalence of dcm genes was as follows: 41.7% dcm1 (48/115), 22.6% dcm2 (26/115), 7.8% dcm3 (9/115), 3.5% dcm4 (4/115), 50.4% dcm5 (58/115), and 27.0% dcm6/7 (31/115). Forty-nine different combinations of dcm and dam genes were found (Supplementary Table S4). Solitary MTases were found in 97.4% (112/115) of the strains. An amount of 69.6% (80/115) of the strains carried more than one orphan MTase with a dominance of two and a maximum of four MTases per strain (Figure 3B). RM systems were present in 53.0% (61/115) of the strains; 9.6% (11/115) of the strains carried more than one RM system, and only one strain (8958) carried three RM systems (dam2, dcm2, and dcm6/7).

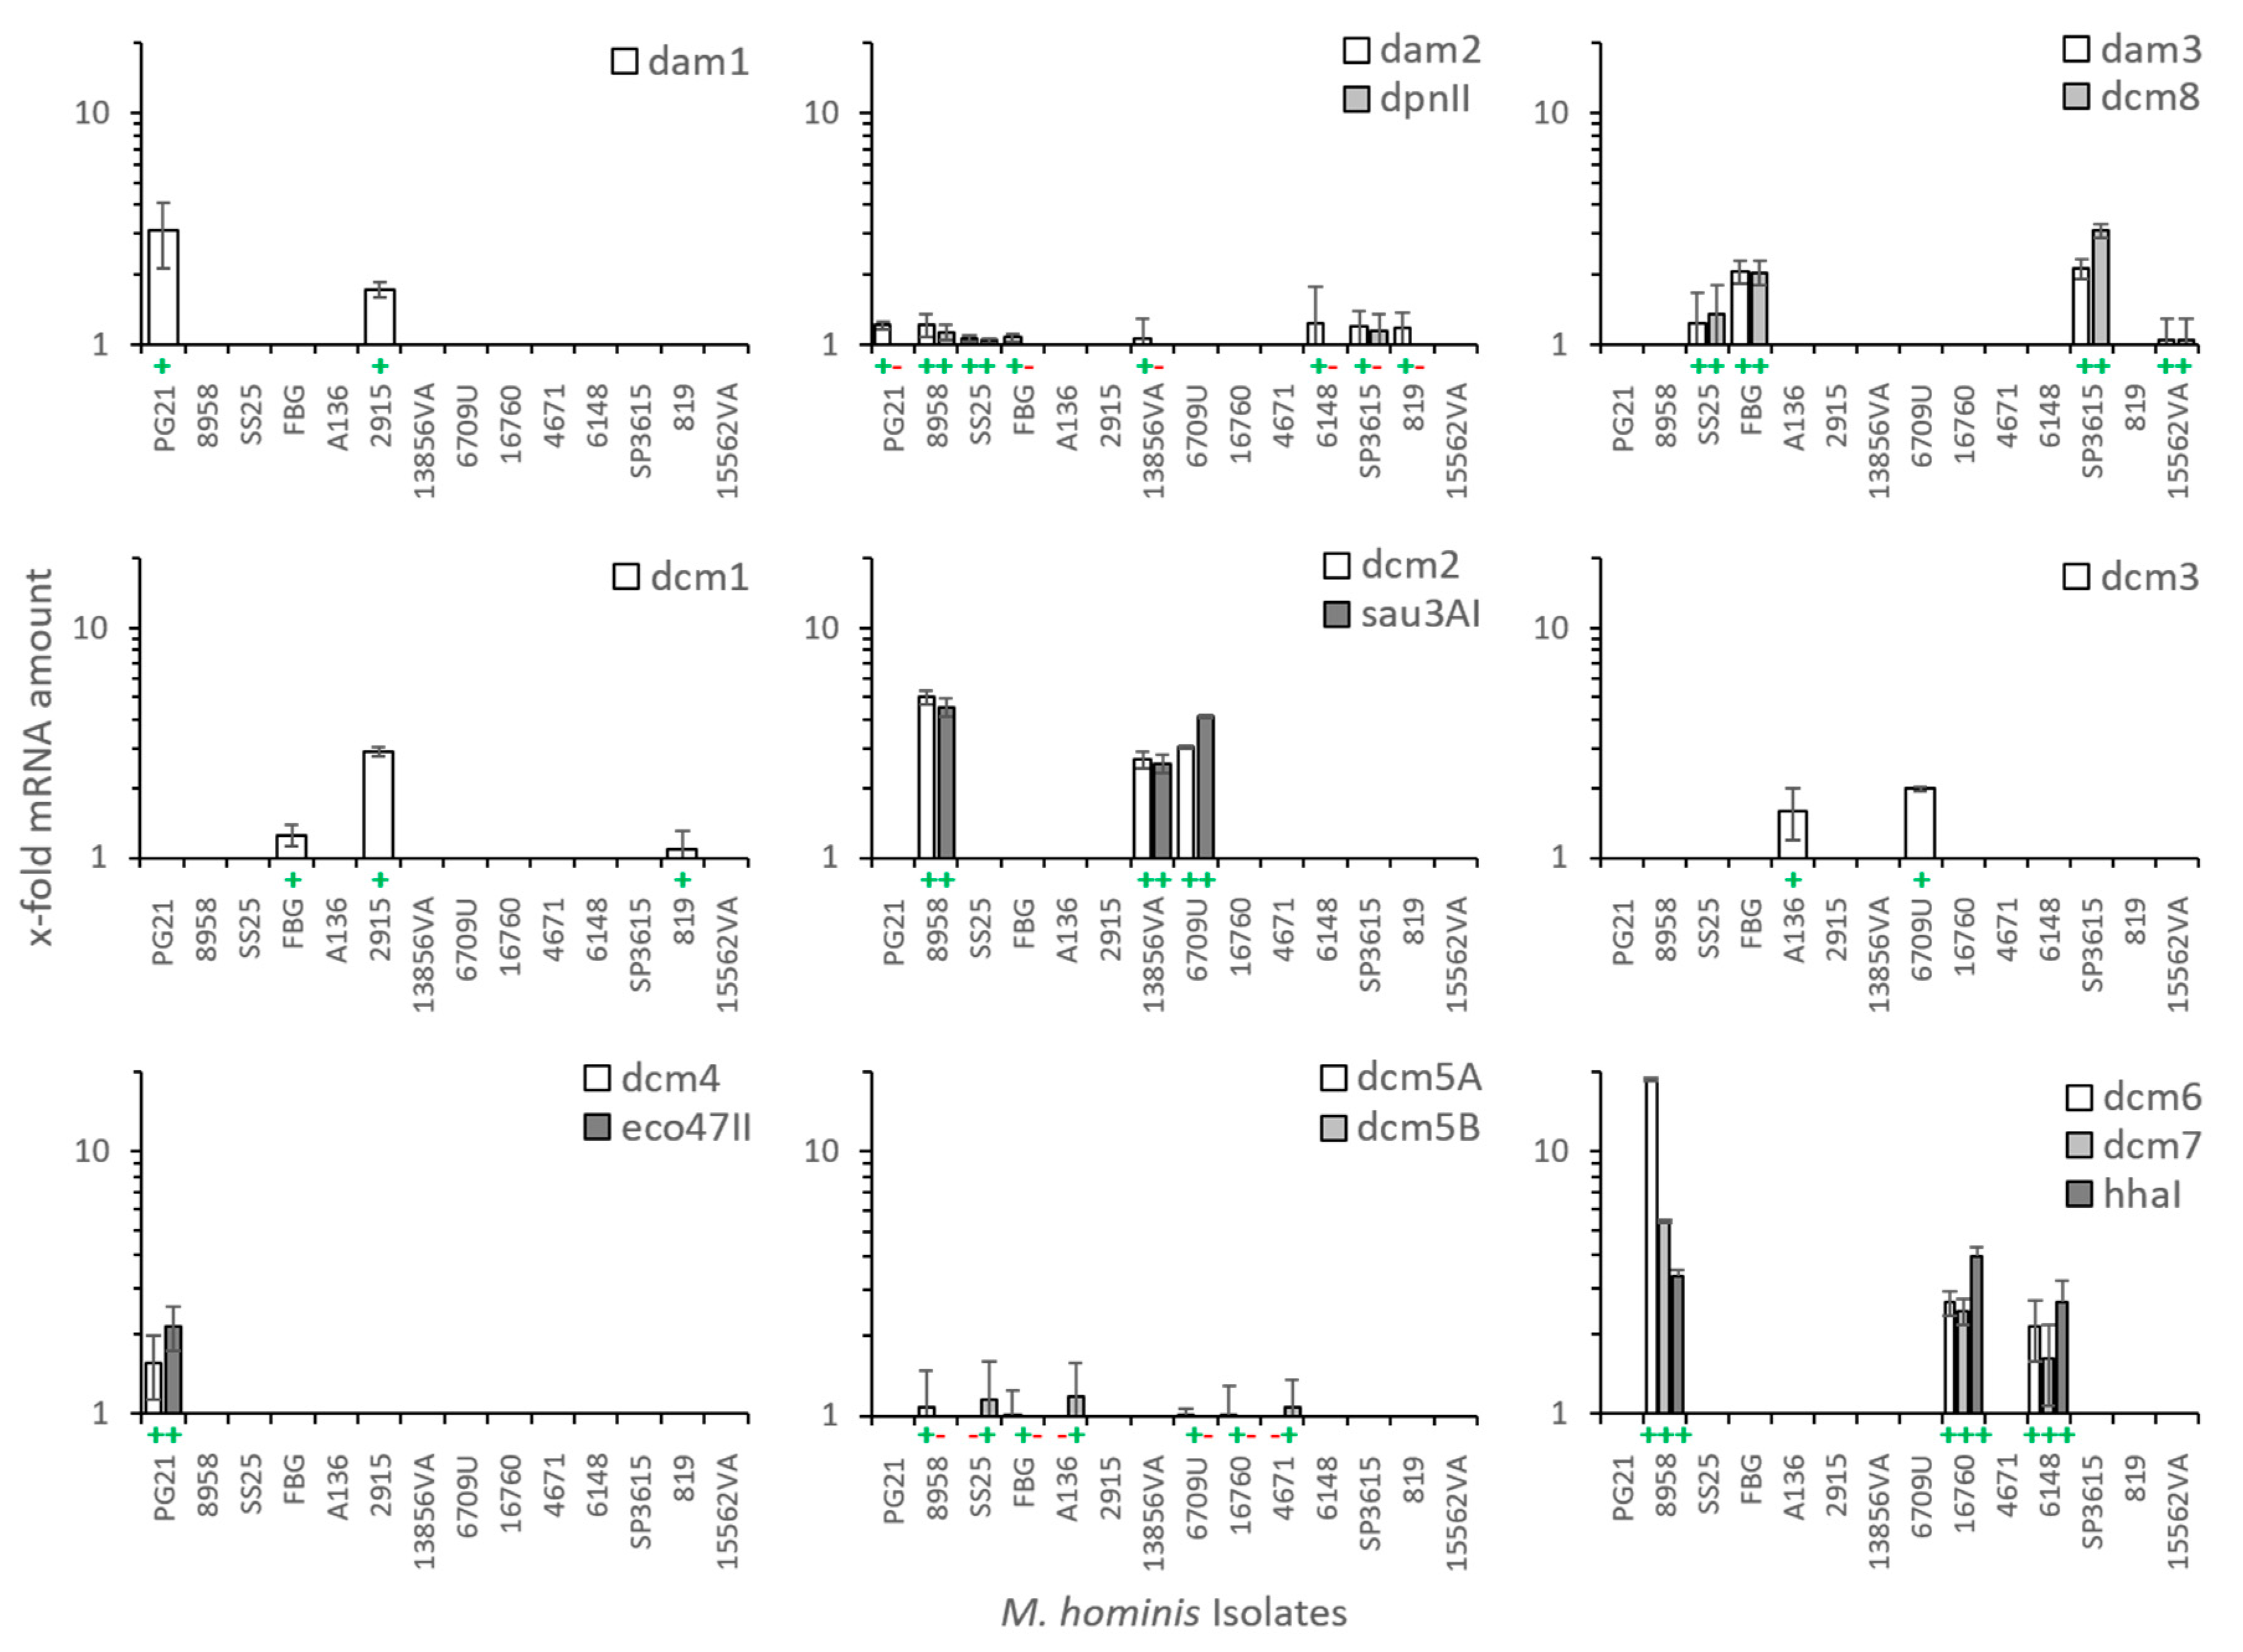
3.3. Transcription of M. hominis DNA MTases

In a selection of M. hominis strains, the expression of each DNA MTase was detected at the transcript level (Figure 4).
Strains without a respective MTase or REase gene were tested negative, and strains carrying the MTase or REase gene were tested positive. The RM system of dcm6/7 was highest expressed (4.8 (+/− 1.21)-fold increase) followed by RM-dcm2 (3.5 (+/− 0.61)-fold) and RM-dcm8/dam3 (1.7 (+/− 1.0)-fold). RM-dam2 (1.1 (+/− 0.68)-fold) and -dcm5 (A or B; 1.07 (+/− 0.9)-fold) were lowest transcribed. (Kruskal–Wallis p-value = 0.0063; for RM systems with more than one component, means of the gene expression of all components were calculated).

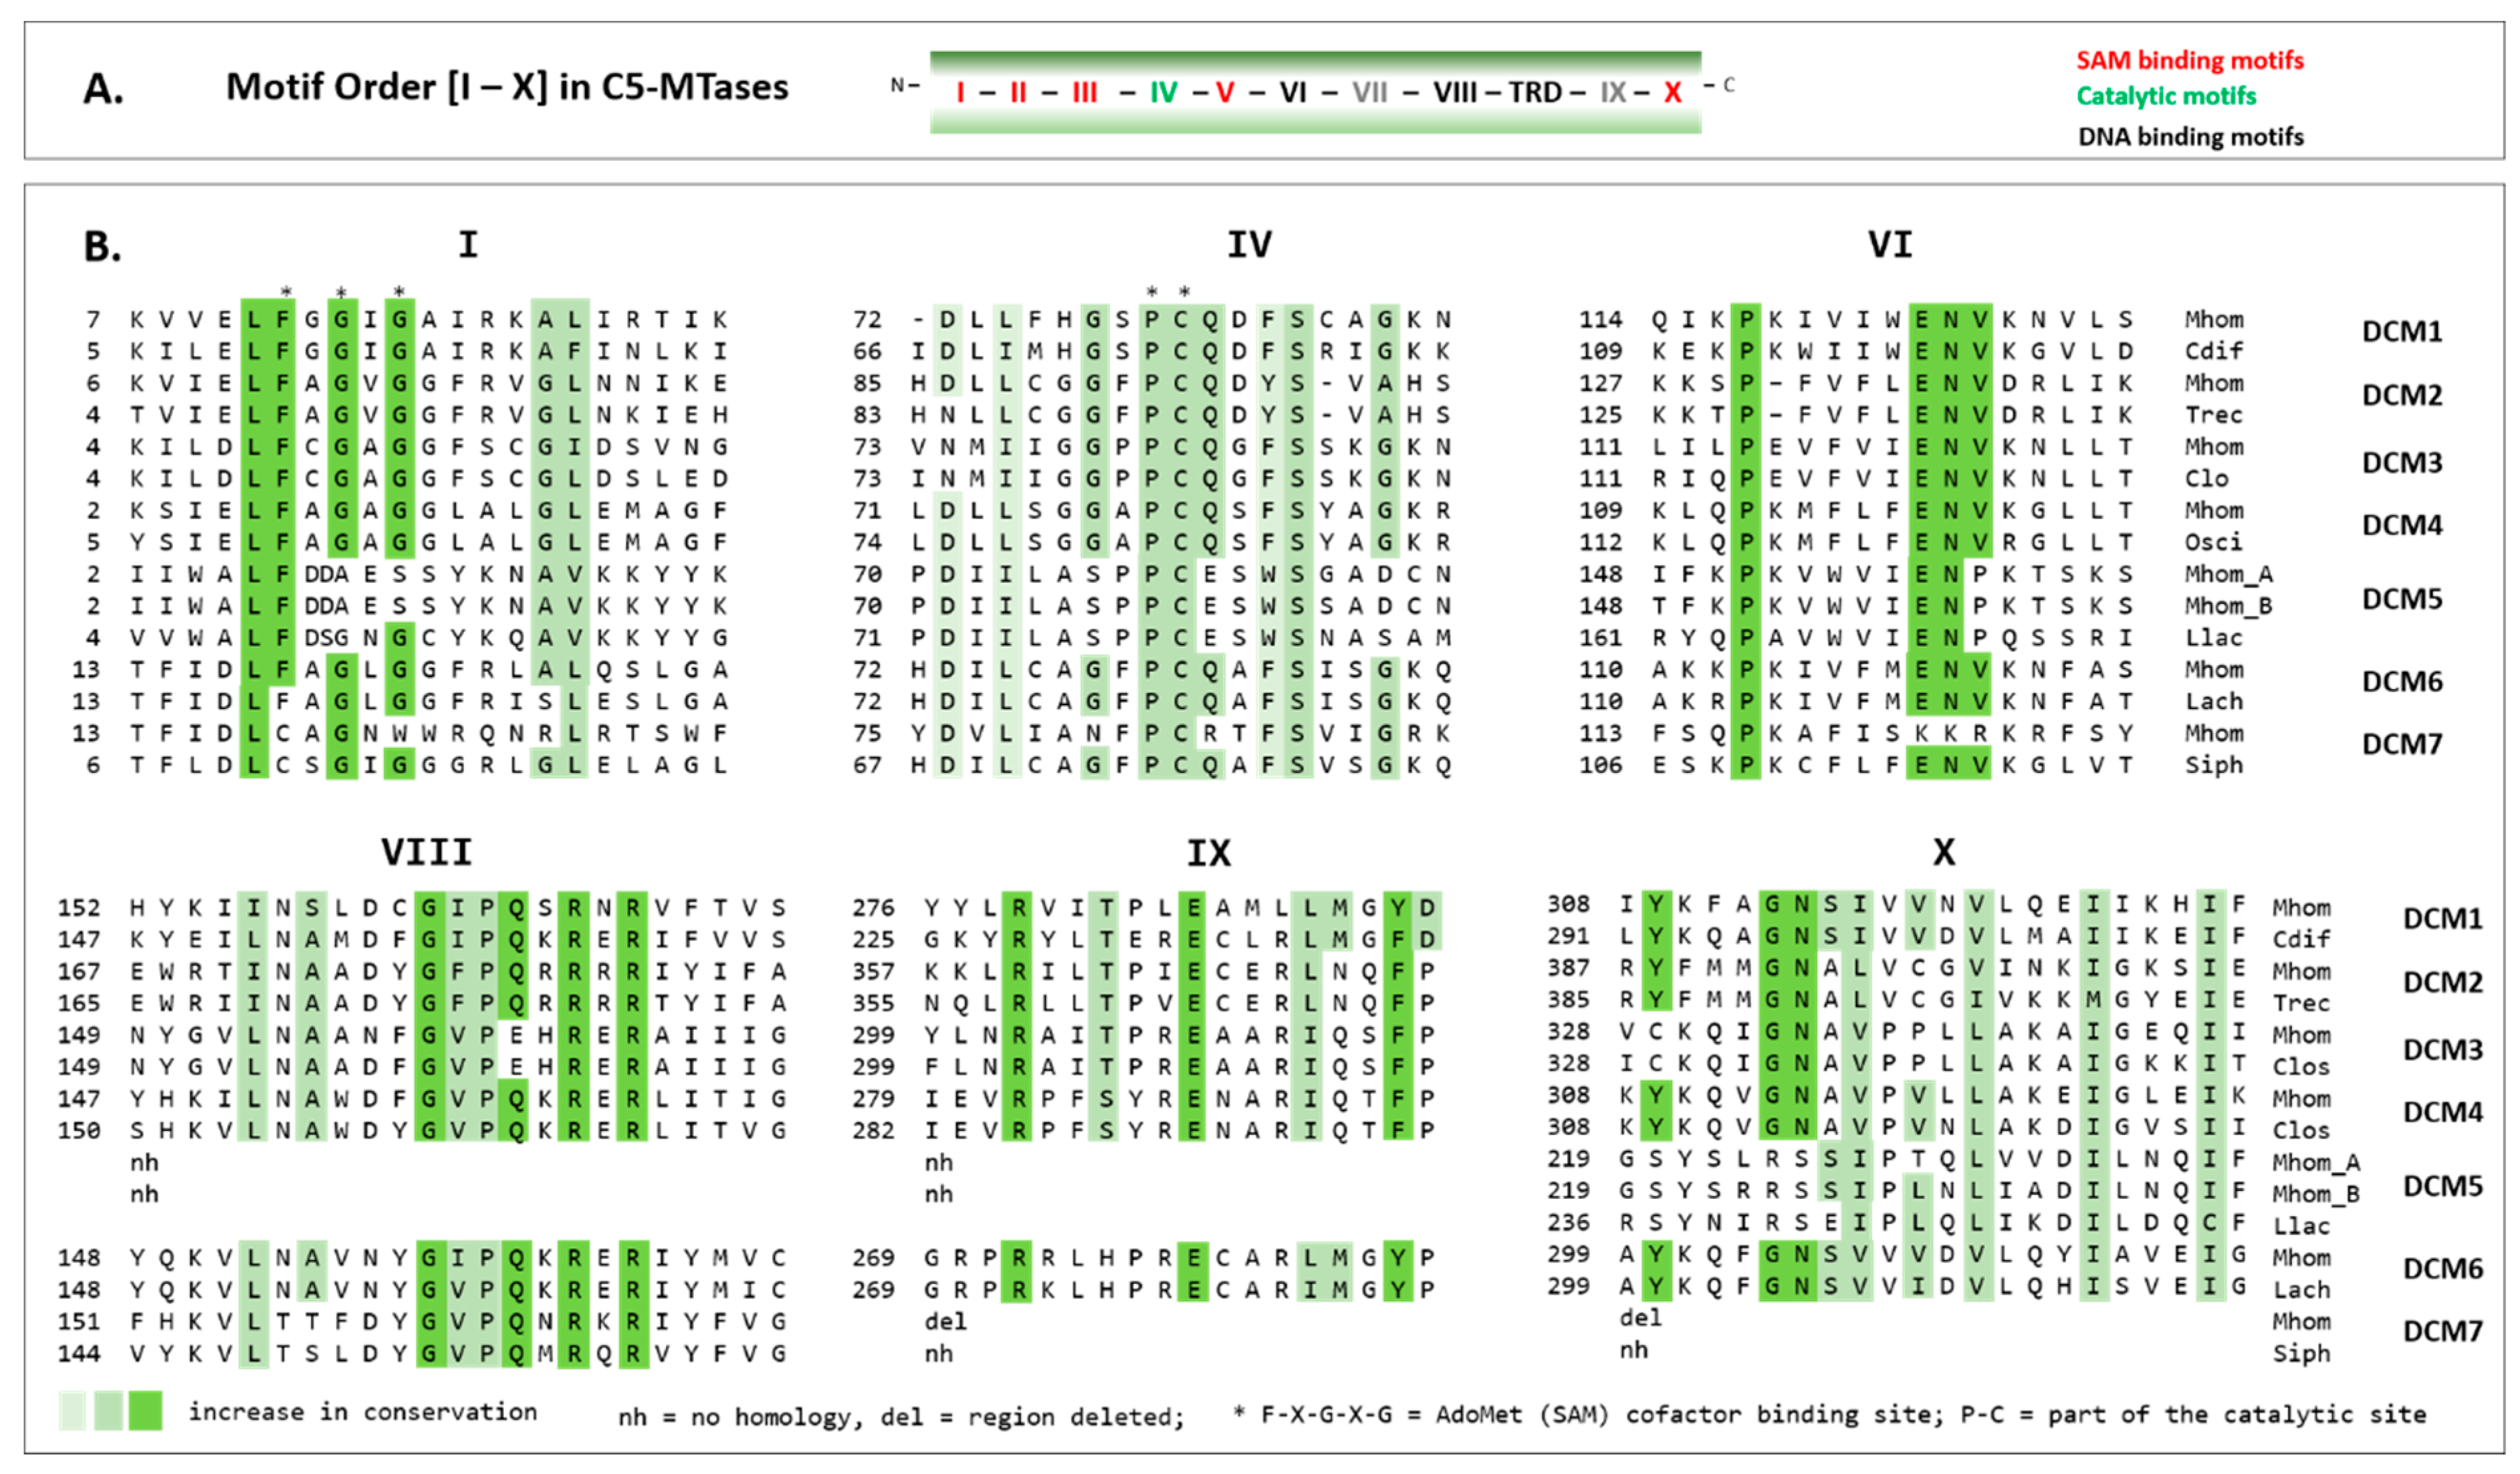
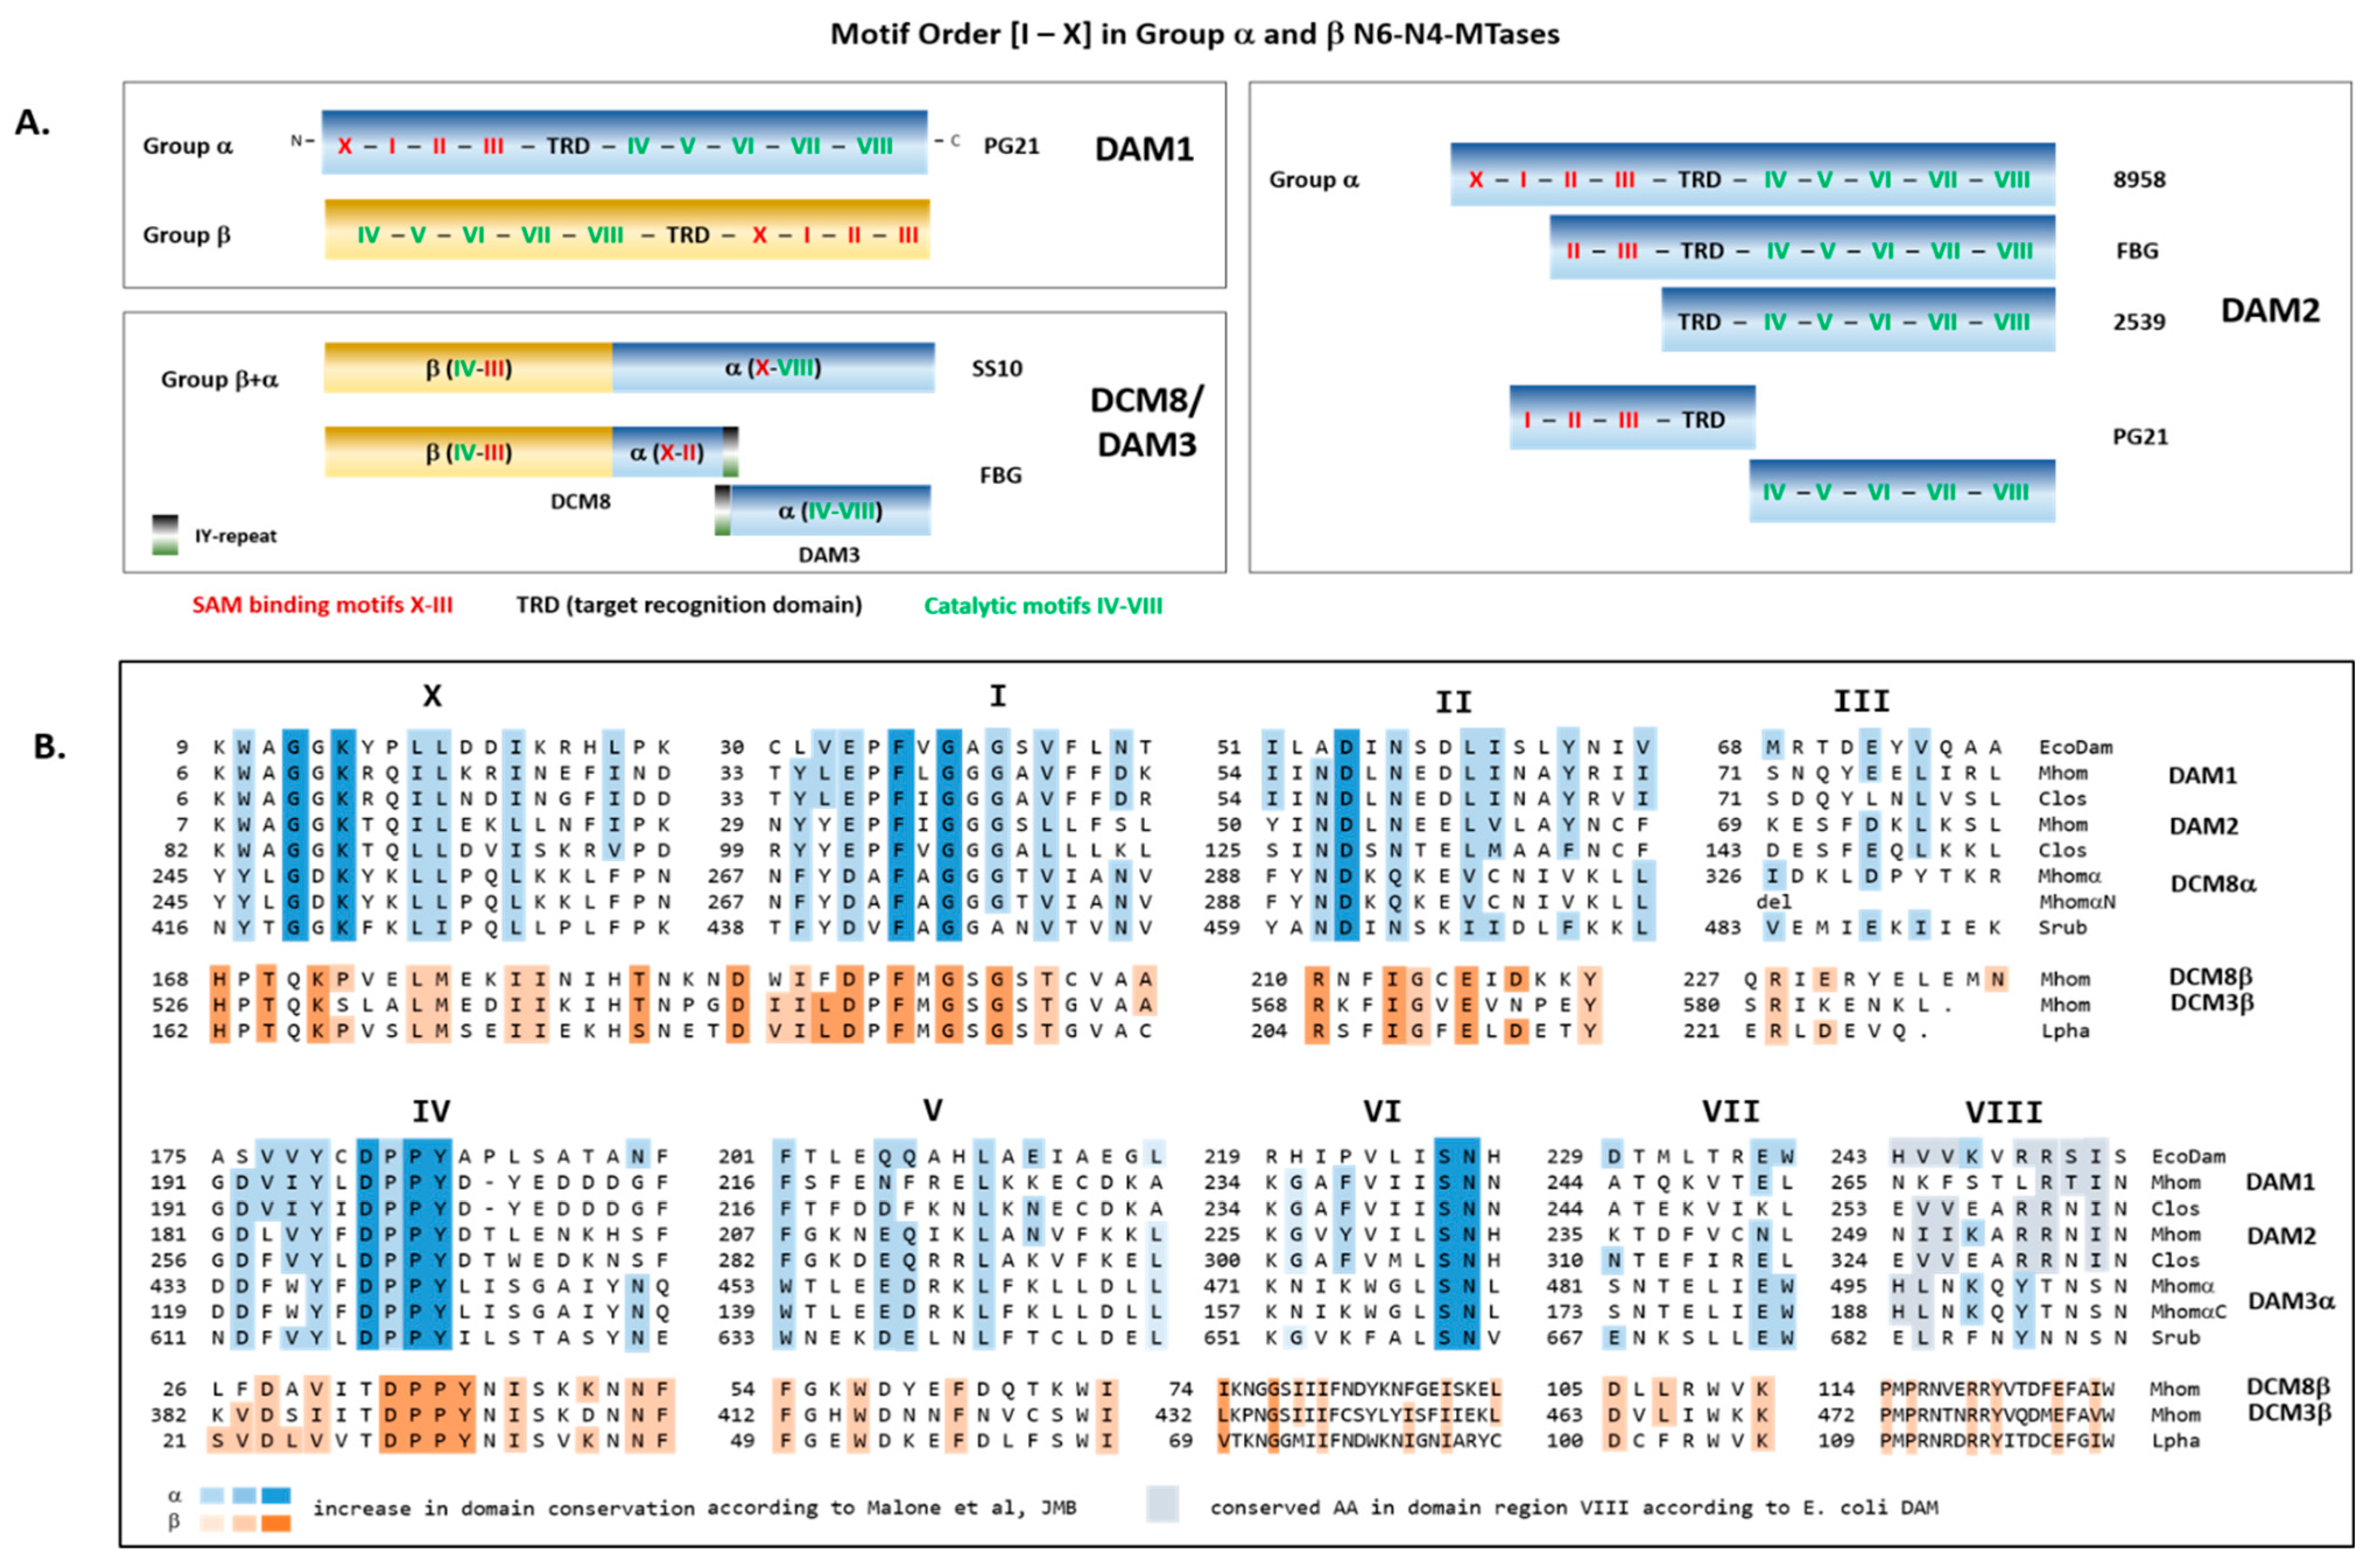
3.4. Conserved Domains of the Type II MTases

As shown in Figure 5A five motifs (I–III, V, and X, coloured in red) are known to take part in the SAM-binding domain and one motif (IV, coloured in green) to be part of the catalytic domain in C5 MTases. Six motifs (I, IV, VI, VIII, IX, and X), which were more highly conserved, were analysed in more detail in DCM1 to DCM7 in a multiple sequence alignment (Figure 5B), each with a respective non-mollicutes homolog (Table 3).
In DCM1-4 and DCM6, the motif-dependent conservation was high, suggesting the functionality of these postulated MTases. In DCM5A and DCM5B, the SAM binding site F-X-G-X-G on motif I was not expressed, and the TRD-flanking motifs VIII and IX were too variant for detection; in DCM7, the TRD-downstream motifs IX and X were completely deleted, suggesting loss of enzymatic function of DCM5 (A and B) and DCM7.
N-6-adenine and N-4-cytosine MTases are subdivided into six groups based on group-specific motif conservations. DAM1 and DAM2 were assigned to belong to the α group with the SAM-binding motifs X, I–III (coloured in red) N-terminal to the TRD region and the catalytic motifs IV–VIII (coloured in green) C-terminal (Figure 6).
Deletions within the dam2 gene, which were always accompanied by the loss of the REase gene, affected loss of motifs X and I in strain FBG and of the whole SAM-binding domain in strain 2539. In dam1-positive strains, the dam2 pseudogene fragments encode a truncated motif I, motifs II and III with the N-terminal part of the TRD region (N-terminal fragment), and the catalytic motifs IV to VIII (C-terminal fragment). A DAM2 activity of both peptides as a protein complex was ruled out due to the lack of an overlap of both fragments and the deletion of 22 amino acids in the TRD region.
Based on the motif order and characteristics, DCM3 and DCM8/DAM3 were assumed to represent fusion proteins with a β-group N6-N4-MTase: the DCM3 protein, which is composed of an N-terminal C5-Mtase (AA 1–360) fused with a C-terminal β-group N6-N4-Mtase (AA 361–592). The DCM8/DAM3 protein of strain SS10 is composed of an N-terminal β group N6-N4-cytosine MTase (AA 1–237) with a C-terminal α group N-6-adenine MTase (AA 238–534). As shown in the scheme of Figure 6A for strain FBG as representative, the DCM8/DAM3 fusion protein was disrupted in a TA repeat region of the TRD region of the α group MTase in most strains (FBG, SS25, VO31120, SP3615), which leads to IY repeats at the breaking points. In these strains expression of an active β group MTase (DCM8), and an inactive α group N6-adenine MTase remnant (DAM3) was postulated. The Sanger sequencing of a PCR product, which was primed by dcm8F and dam3R to amplify the postulated TA repeat region, revealed a mixture of TA-repeat numbers in the strains tested (SS10, SP3615, FBG), which documented the expression of both full-length [(TA)3n] and disrupted [(TA)3n(−1 or −2)] DCM8/DAM3 protein variants in the same strain without indicating the prevalent variant.
As coloured in Figure 6B, the F-X-G-X-G stretch in motif I, which is important for SAM binding, and the D-P-P-Y stretch in motif IV, part of the catalytic site, were both highly conserved in DCM3β and DCM8β. Whether DCM3 and full-length DCM8/DAM3 express both MTase activities needs further investigation.

3.5. Putative Functions of the Type II MTases

In order to assign possible methylation specificity to the orphan MTases and RM systems, conserved domains and the function of the most homolog representatives in non-M. hominis mollicutes and other bacteria were considered (Table 4).
Due to the sequence homology of the adjacent REases to known restriction endonucleases, it was possible to predict the sequence motif of methylation for some RM-MTases: (GmATC) for DAM2 with the associated DpnII-homolog, cutting unmethylated (X│G°ATC); (GATmC); for DCM2 with the associated Sau3AI-homolog, cutting unmethylated (X│GAT°C); (GGNmCmC) for DCM4 with the associated Eco47II-homolog, cutting unmethylated (G│GN°C°C) without certainty, and one of the C5-residues will be methylated; and (GmCGC) for DCM6/7 with the associated HhaI-homolog, cutting unmethylated (GCG│°C).

3.6. Bioinformatics on Methylation Profile of Nanopore Sequenced M. hominis Genomes

The Tombo script was adapted and run on the Nanopore sequenced M. hominis strains to analyse 6mA and 5mC in the above mentioned sequence motifs (5′-3′: CCWGG, GATC, GGNCC, and GCGC), motif GGATC and motifs published for other mycoplasmas (CATG, CG, CTAT, GAAG, GAGG, GGAG, GANTC, GATGC, and GCNGC) [26,28] and the reverse-complementary motifs. Methylation scores for all sequence motif variants (with W = A or T and N = A, G, C or T) are listed in the Supplementary Excel File: Tables S5 (5mC) and S6 (6mA). Nineteen isolates showed at least one sequence motif with methylation frequencies above 0.5 (Table 5). Forty-six of the seventy-four (5mC and 6mA) methylation motifs were not calculated positive; the others are listed with the pattern of dam and dcm genes in Table 5.

3.7. CCWGG Methylation

5′-CCWGG-3′ is the well-known target sequence of DCM in E. coli and other bacteria. Of the 22 Nanopore sequenced M. hominis strains, 9 were dcm1 positive even though methylation of 5′-CCWGG-3′ was only observed for strains 10936, 14352VA, and 18847. Additionally, the DNA of strain SP2565 showed methylated 5′-CCWGG-3′ motifs despite the lack of a dcm1 gene. An analysis of the methylation profile with respect to the sequence motif variants (W = A or T) revealed the highest methylation frequencies of 5′-CmCTGG-3′ followed by 5′-mCCTGG-3′ (Supplementary Table S5). The 6mA methylation of 5′-CCmAGG-3′ was observed in strains SP2565, SS10, VO31120, 18847, and 475 in descending order, indicating the presence of another, previously undiscovered 6mA DNA MTase. All CCWGG variants with respective 6mA and 5mC methylation scores are listed in Supplementary Tables S5 and S6 and shown for a selection of dcm1-positive and -negative isolates in Figure S3.

3.8. GCNGC Methylation

Exclusively in strains 10936, 14352, and 18847, a further sequence motif, 5′-GCNGC-3′, was found to be 5mC methylated. Tombo analysis of all sequence variants (N = A, G, C, or T) revealed the highest methylation scores in 5′-GCTGmC-3′ (0.9/0.8/0.8, respectively). Whether DCM1 performs an off-target 5mC methylation at this motif or a yet undetected 5mC-MTase is responsible for the methylation requires further investigation.

3.9. GATC Methylation

GATC is the target sequence motif of the well-studied 6mA MTase DAM (GmATC) and a 5mC DNA MTase (GATmC). Nanopore sequenced M. hominis strains carrying dam1 (12256U and SP10291) or full-length dam2 (14355VA, 7388VA, 942J, 475, SS25, and 8958) possessed GmATC-methylated DNA. The methylation scores of strains carrying only dam2 remnants (marked with 0.5 in Table 5) were lower than 0.5. Strains 19791 and SP2565, lacking both dam1 and dam2 genes but carrying dcm2, showed methylation frequencies of 0.6 for GmATC. In dcm2-deficient strains carrying dam1 or dam2, 6mA methylation scores of an enlarged motif (GmATCC/GGmATC) were calculated as higher than those of GmATC (Figure S4). In total, 4 of the 22 Nanopore sequenced strains were dcm2-positive (12256U, 19791, 8958, and SP2565), which correlated with GATmC methylation scores of 0.75, 0.88, 0.9, and 0.95, respectively.

3.10. CCTC Methylation

5mC methylation of the non-palindromic 5′-CCTC-3′/5′-GAGG-3′-double strand was observed in four of the 22 Nanopore sequenced strains (14352, 19791, A136, and VO31120) and correlated with a dcm3 presence. The methylation frequency was higher for the first than the second cytosine and near the background for the third. A 6mA methylation of the reverse complementary 5′-GmAGG-3′ motif was not detected.

3.11. GCGC Methylation

In 7 of the 22 Nanopore sequenced strains, 5mC methylations in the 5′-GCGC-3′-motif were detected, mainly at the first, but also at the second cytosine (MethScores about 0.9 and 0.5–0.6. respectively). As these strains all carried the dcm6/dcm7 RM system with a HhaI homolog REase (cutting GCGC), dcm6/dcm7 was assigned to the GCGC methylation.

3.12. Some Loose Ends: Methylated Sequence Motifs and MTases without Counterpart

As listed in Table 5, all but one of the other sequence motifs (GGNCC, CTTC, GGAG, GASTC) had methylation scores just above cut-off (0.5–0.6), which could indicate a high background rather than specific methylation. The methylation score for 6mA in motif CTmAT was higher than 0.6 in five strains with a maximum of 0.9 in strain 8958, suggesting the presence of an additional, yet undetected 6mA MTase.
No 6mA or 5mC methylation motif tested corresponded to the gene presence of dcm8/dam3 or dcm5 (A and B) in the analysed strains. Noteworthy, the three strains 10936, 14352VA, and 18847, which carried the 5mC methylated motifs CCWGG and GCNGC (see above), all carried dcm5A (18847) or dcm5B (10936, 14352VA) besides dcm1, but they had no other MTase gene in common.

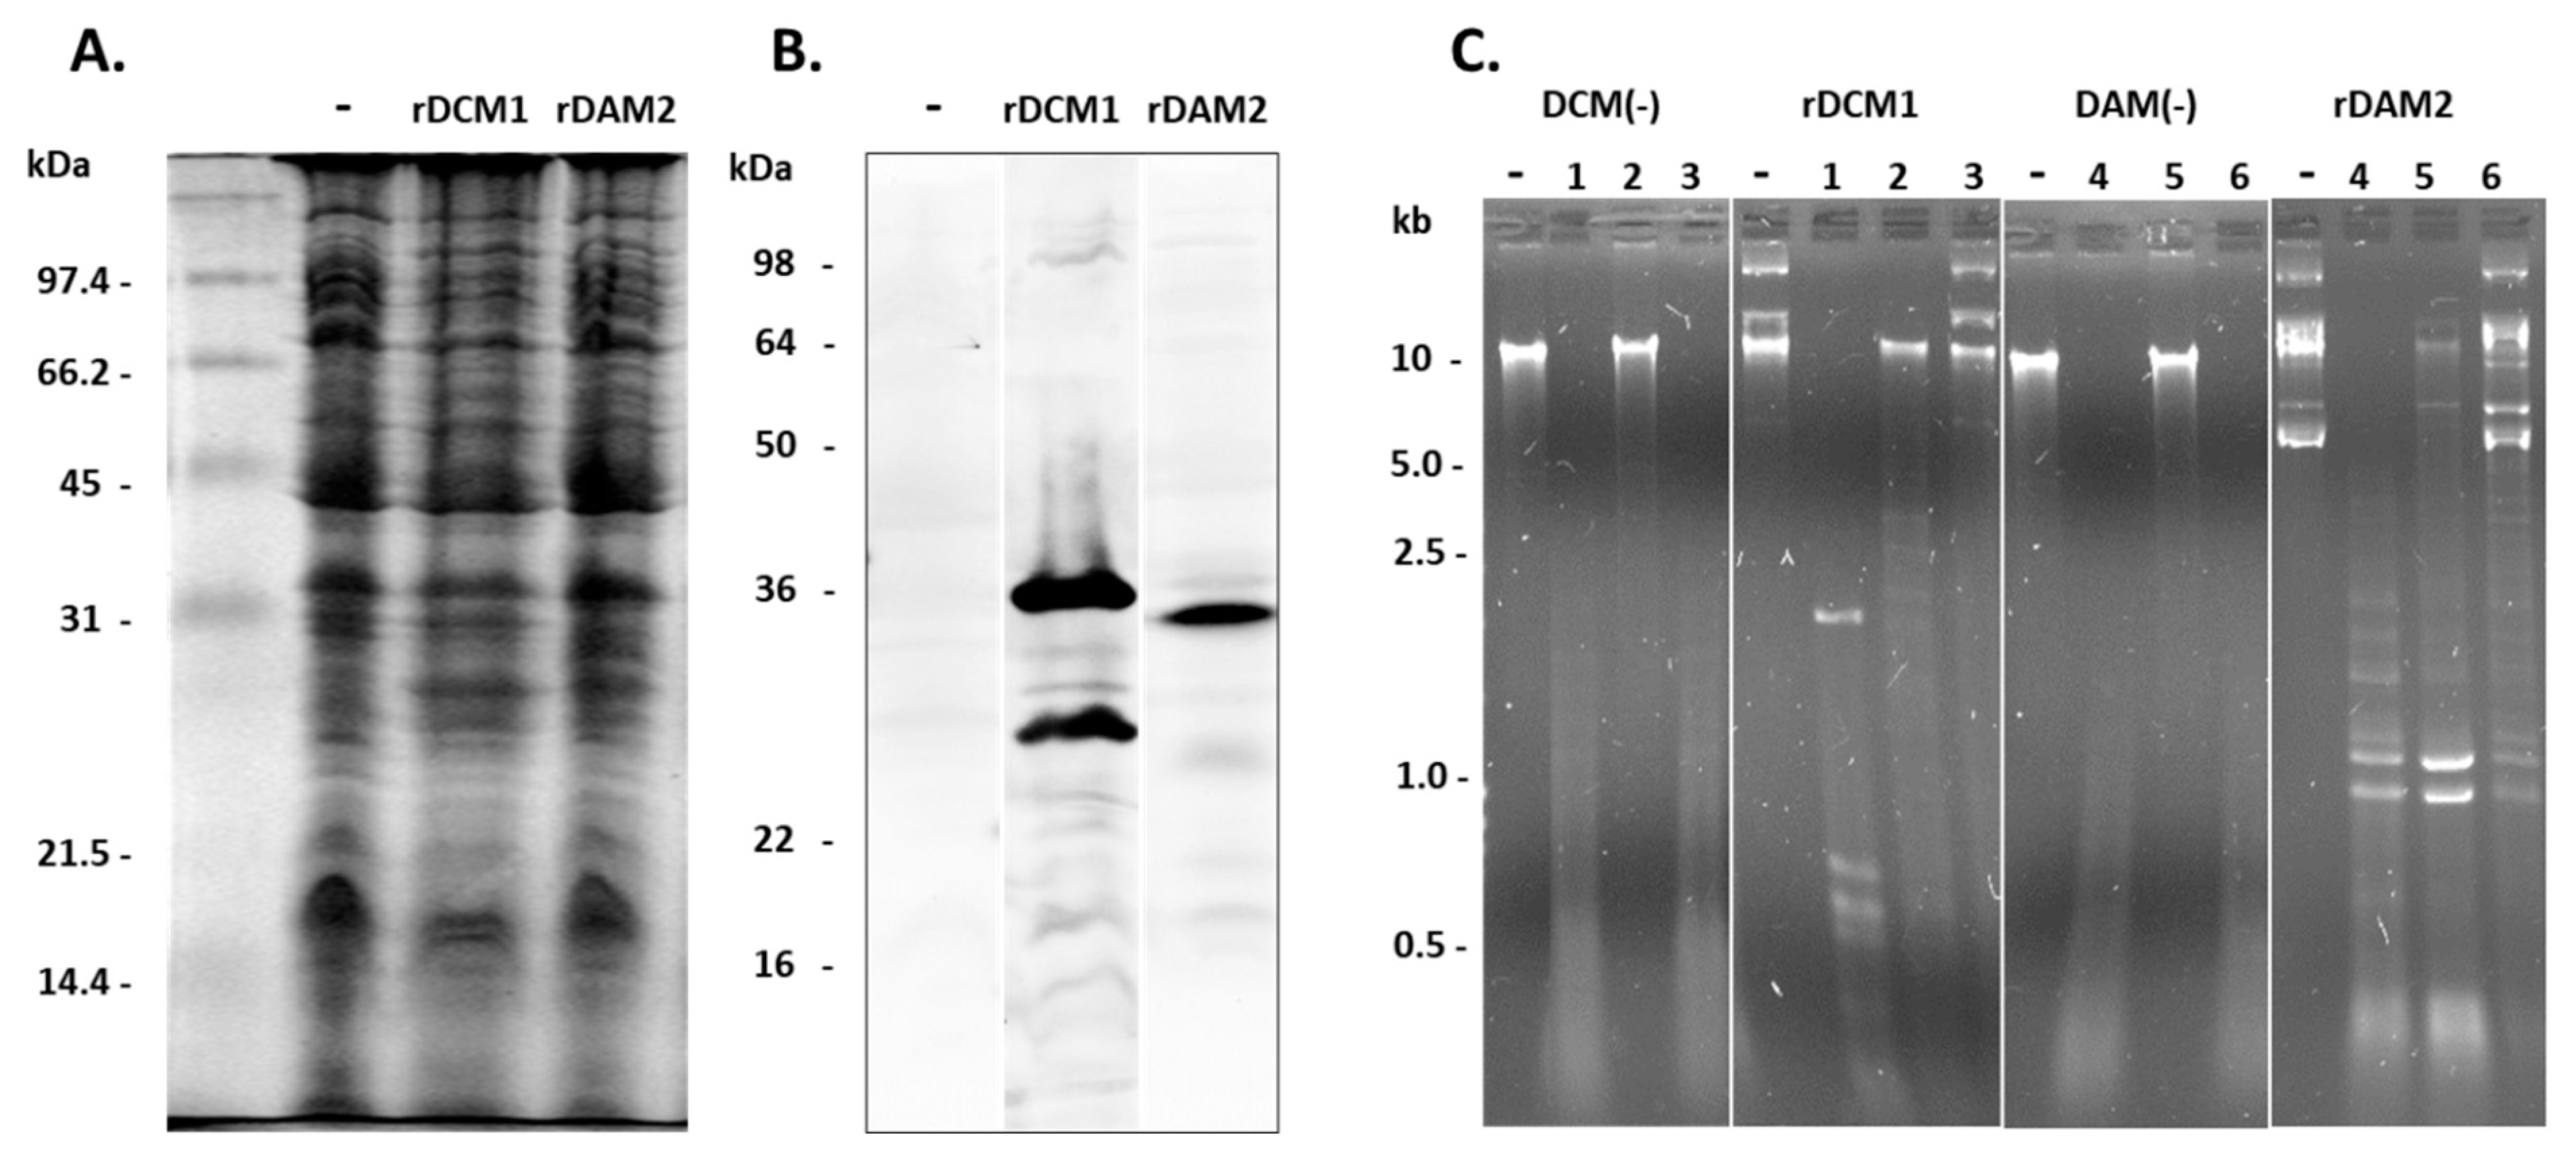
3.13. Proof of Methylation Activities

Next, the 5mC methylation of CCWGG, which had been predicted by Tombo for some dcm1-negative isolates, and 6mA methylation of GATC for some dam1/dam2-negative isolates, were verified using a methylation sensitive restriction (MSR) approach. To this end, genomic DNA from seven M. hominis strains was first subjected to a dcm1 MSR analysis (Figure 7).
Five strains (SP10291, 12256U, 14532VA, FBG, and 10936) were dcm1 genes and transcript positive (Figure 7A,B), but only strains 14352VA and 10936 expressed DCM1 activity. The DNA of these strains, with calculated methylation scores ≥ 0.7, was cut by methylation-dependent restriction endonuclease SgeI but not methylation-sensitive EcoRII, demonstrating CmCTGG methylation (Figure 7D). The DNA of the dcm1-positive strain, SP10291, 12256U, and FBG, with calculated CmCTGG methylation frequencies <0.25, showed restriction patterns of non-methylated CCWGG, such as the dcm1-deficient strain 2539 (Figure 7D). Strain SP2565, which was also dcm1 gene- and transcript-negative (Figure 7A,B), had methylation scores of 0.7 for CmCTGG and 0.9 for CCmAGG (Figure 7C). As the methylation-sensitive restriction pattern of strain SP2565 correspond to its genetic dcm1 deficiency, a Tombo-calculated 5mC methylation score of 0.7 for CmCTGG was suggested to be based on a cross-detection of the 6mA methylation of CCmAGG (Methylation Score 0.9).
Second, we took a closer look at the putative, Tombo-calculated 6mA methylation of GmATC in strains with dam1- and dam2-negative background, testing the same strains as for dcm1 activity. As shown in Figure 8, presence of the dam1-, dam2-, and dcm2-genes (Figure 8A) was accompanied by the respective transcript evidence, even in the case of gene truncations (Figure 8B).
DNA of strains carrying dam1 (SP10291 and 12256U) or full length dam2 (14352VA) with calculated methylation frequencies >0.5 (Figure 8C) was cut by DpnI demonstrating GmATC methylation (Figure 8D). Methylation sensitive GmATC restriction and Tombo-calculated methylation scores decreased from strain FBG (0.5) to 2539 (0.25), correlating with the degree of dam2 truncation (see Figure 6A).
The DNA of two analysed strains (12256U and SP2565) was not restricted by Sau3AI, the endonuclease originally intended as a control for the 6mA methylation-independent cutting of GATC. This finding could be explained by the fact that Sau3AI restriction is sensitive to 5mC methylation of a GATmC presence and that the respective strains all harboured dcm2 and a Sau3AI homolog REase gene as an RM system (see Table 4). The assumption that DCM2 methylates GATmC was further supported by restriction with 5mC methylation-independent DpnII (GAT°C) but not 5mC methylation-inhibited Sau3AI (GAT+C) (Figure S5).
The high 5mC methylation scores of GATC in strains SP2565 and 12256U were also reflected in 6mA methylation of the same motif. SP2565 does not carry dam2 (Figure 8A) and appears in methylation-sensitive restriction unmethylated in 6mA of the GATC motif. The calculation of a false-positive 6mA methylation value by Tombo due to the strong methylation of the neighboured 5mC in GATC can also be assumed here (as formerly for dcm1).
As most of the analysed strains carried more than one family member of dam or dcm homologs, the final evidence of CmCWGG and GmATC methylation activity was elucidated against a dam-/dcm-negative background. The dam-/dcm-deficient E. coli was transformed with dcm1 or dam2 expression plasmids and heterologous expression proven by tetraHis-staining in Western blotting (Figure 9A).
The recombinant proteins, rDCM1 and rDAM2, labelled with histidine at the C-terminal end were expressed at full length, but rDCM1 also showed an equally strong degradation product (Figure 9B). Methylation of the genomic DNA of rDCM1- and rDAM2-expressing E. coli clones (in contrast to plasmid-free DCM(−) and DAM(−)) was documented through methylation-sensitive restriction analysis as done before (Figure 9C). Cleavage of the E. coli DNA by the methylation-dependent restriction enzyme SgeI (rDCM1 (lane 2)) and DpnI (rDAM2 (lane 5)) demonstrated the presence of methylated CmCWGG- and GmATC-motifs and gave the final proof of DCM1 and DAM2 methylation activity, respectively.

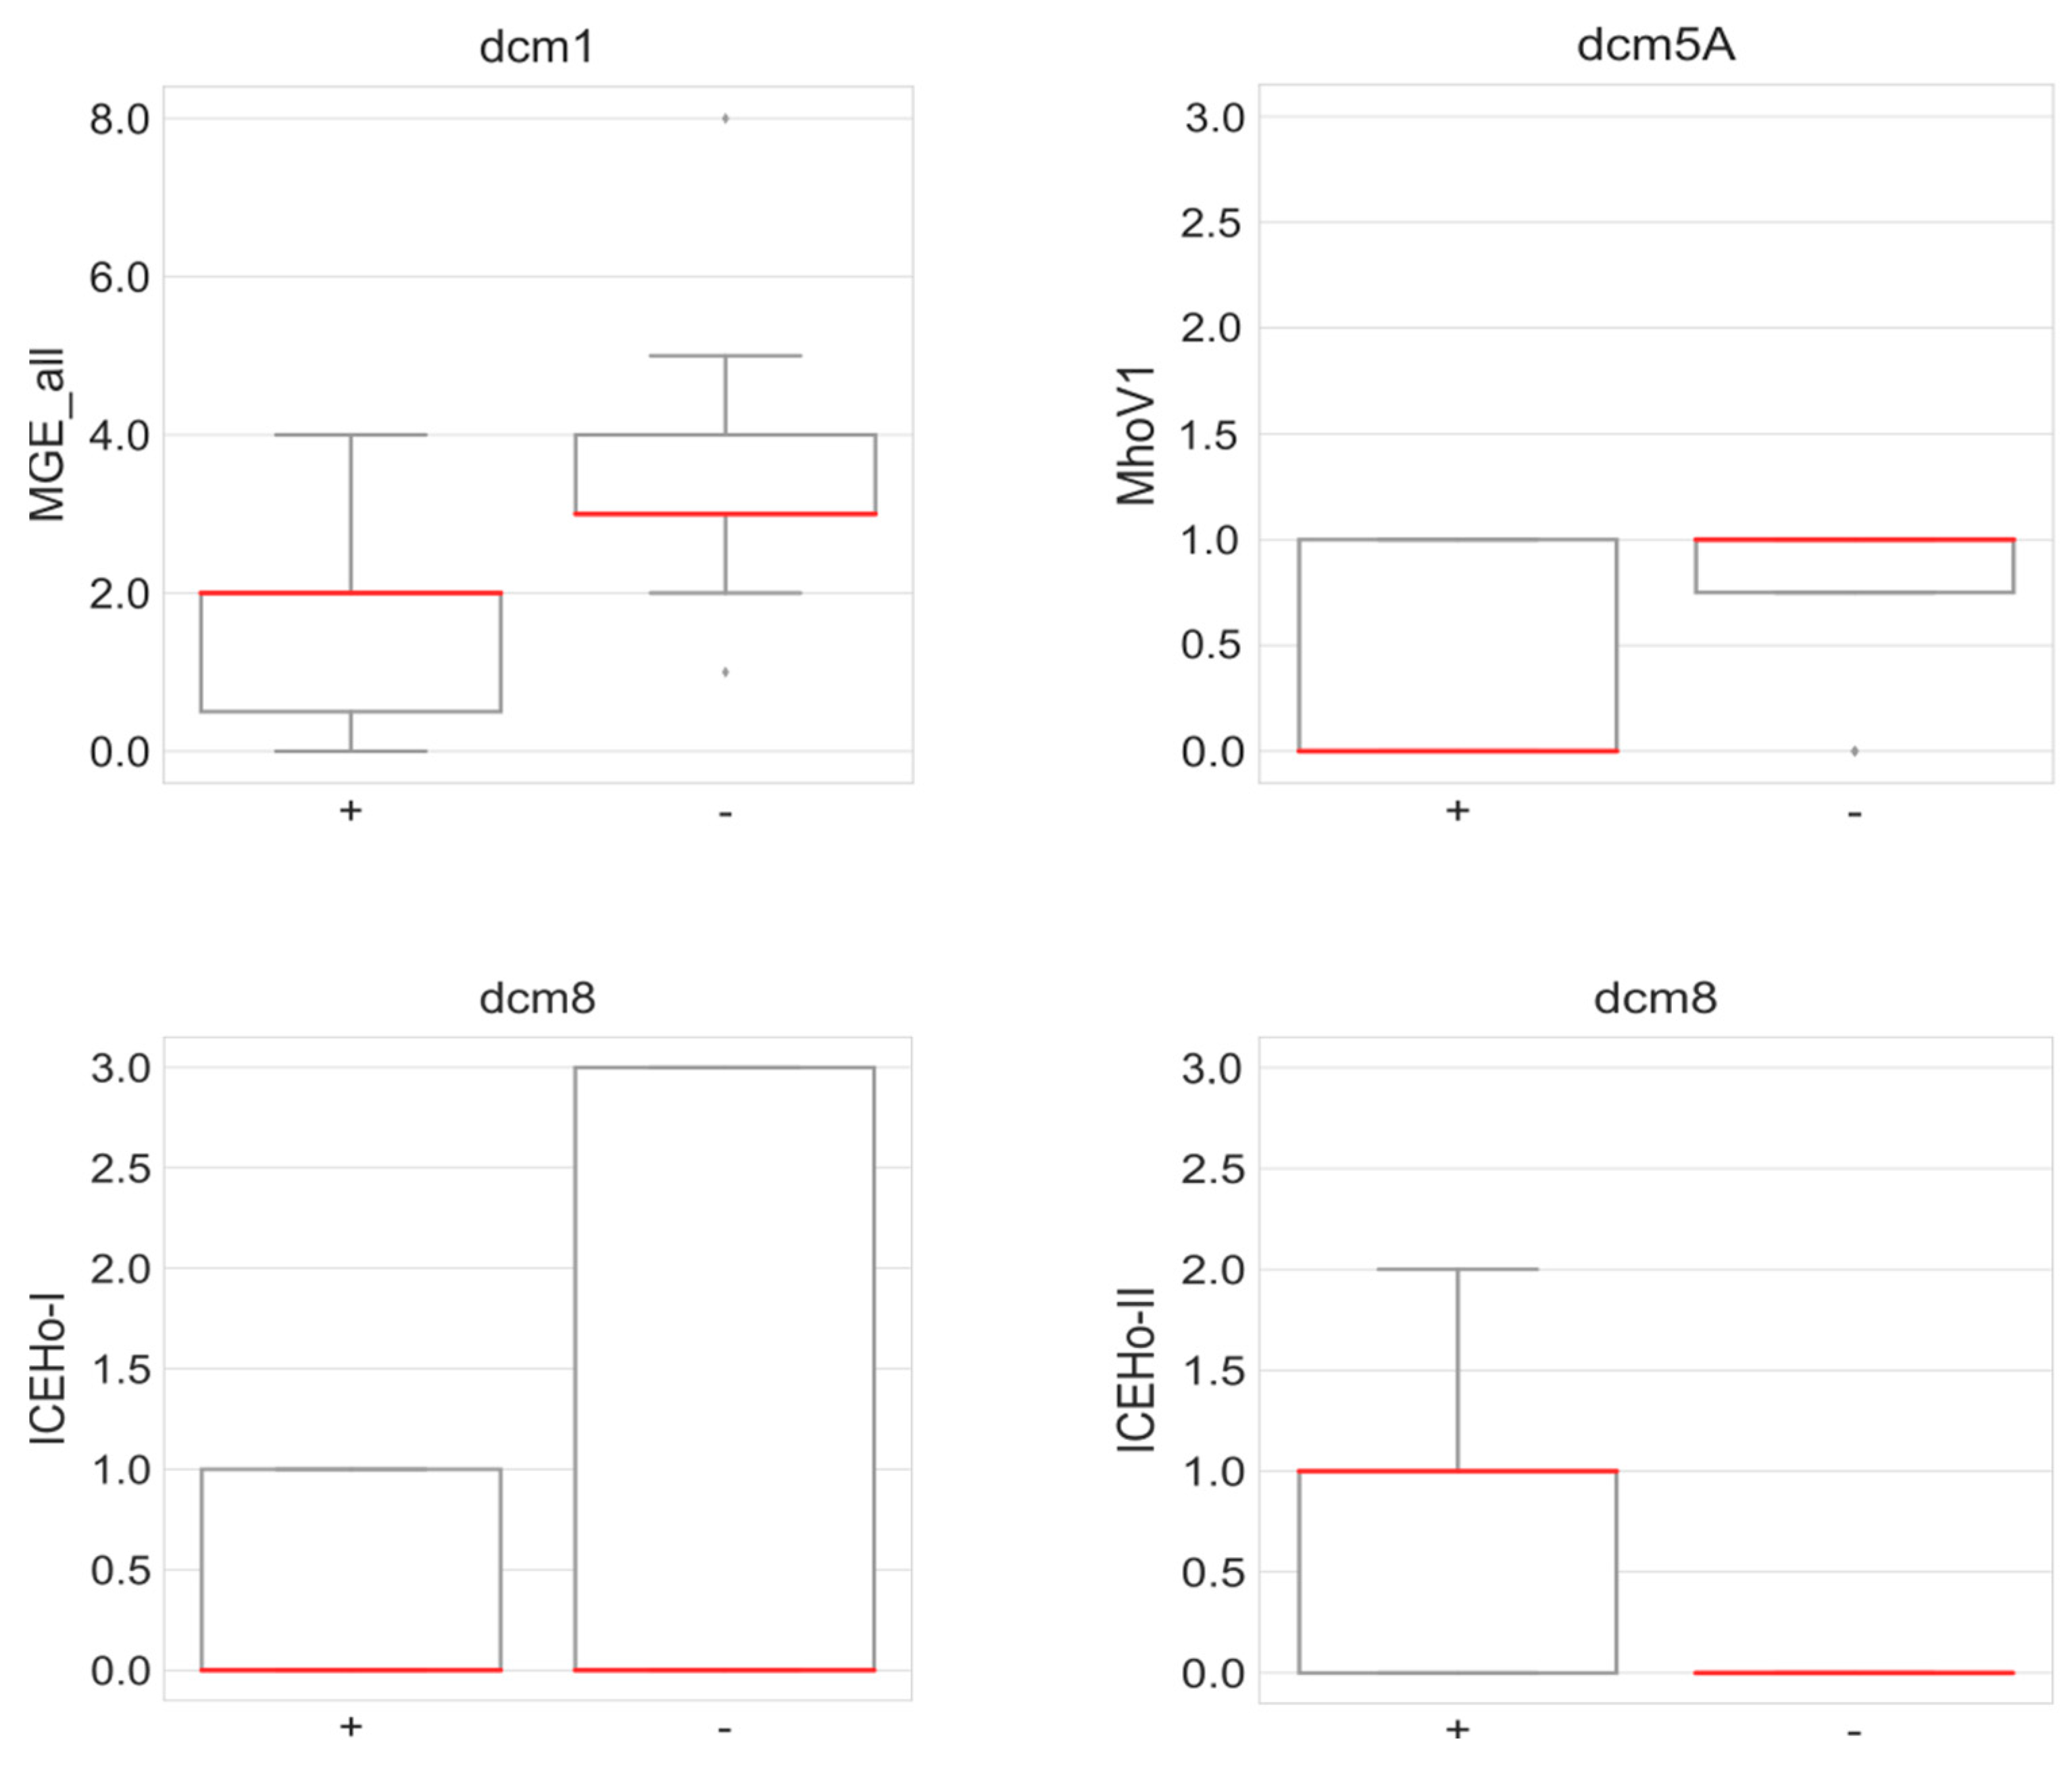
3.14. Correlation between the Presence of DNA MTases and Mobile Genetic Elements

Next, we had a look on a putative correlation between presence of DNA MTases (solitary or RM systems) and mobile genetic elements (Supplementary Figure S6). Since active RM systems should prevent the uptake of foreign DNA, a negative correlation between RM and MGE was expected; however, neither RMs and MGEs in total, nor each combination of an individual RM and MGE correlated statistically significantly. With regard to the solitary MTases, correlations were found (Figure 10).
The co-occurrence of dcm1 and MGEs (p = 0.00001) was caused by a perfect correlation between dcm1 and ICEHo-I (p < 0.0001), which was not surprising since dcm1 is a conserved gene of the ICEHo-I element [31]. In addition, the presence of dcm1 and ISMhom1 was also positively correlated (p < 0.005), and three further combinations were of statistical significance (Figure 10). We calculated a positive correlation between dcm5A and MhoV1 (p < 0.05) and dcm8/dam3 and ICEHo-I (p < 0.1) and a negative correlation between dcm8/dam3 and ICEHo-II (p < 0.05). No further correlations calculated significant with restriction on the methylation active dcm1 or dam2 strains (Figure S6).

4. Discussion

This is to the best of our knowledge the first approach to use a tailored Tombo script for motif driven analysis of 5mC and 6mA methylation frequencies in Nanopore sequenced M. hominis genomes. Our analysis benefited from the availability of completely resolved isolate genomes, enabled by the ability of the Oxford Nanopore technology (ONT) to sequence long fragments of DNA and thus generate sufficiently long reads to span repetitive genomic regions and from the ability to directly call methylated bases from raw Nanopore sequencing data. In the context of our study, the long-read sequencing aspect as well as methylation calling capability of the technology have to be counted as the main advantages of the Nanopore sequencing technology. In addition, native ONT sequencing requires no complex sample processing steps; no PCR amplification, which could result in a biased dataset; and involves no degradation and loss of input material. However, one limitation of the present study is that the Nanopore-based methylation analysis presented here could be extended and potentially improved in multiple ways. First, our analysis was based on site-specific methylation scores computed with the generic 5mC and 6mA models implemented in Tombo; in addition, the “de novo” workflow available in Tombo could be applied, which enables us to combine an analysis of raw signal data with a motif discovery tool, such as the MEME Suite, to detect sequence contexts putatively affected by methylation. Second, the analysis presented here was based on a list of pre-defined sequence motifs from the literature, and it did not take into account potential interactions between motifs (potentially relevant, e.g., when an individual C base in the analyzed genome is part of two different motifs); a follow-up analysis could implement a more comprehensive statistical model of site-specific methylation scores with support for sequence motif interaction effects and novel motif discovery (e.g., in a generalized linear model framework). Third, alternative methods for determining site-specific methylation scores from Nanopore data could be applied, such as the Hidden Markov Model-based method nanopolish [39] or the more recently published Nanodisco [40], which is also able to detect 4mC, 5mC, and 6mA in bacteria and microbiome data. Fourth, a comprehensive training dataset comprising Nanopore sequencing data from mycoplasma isolates with known or biotechnologically modified methylase activities could enable re-training or refinement of the methylation detection methods’ underlying models, enabling methylation calling in mycoplasma genomes with improved accuracy.
In the study by Dordet-Frisoni, a combination of SMRT-seq and Illumina bisulphite sequencing was used to detect all methylation sites [26]. They were able to draw a comprehensive picture of the methylome for M. agalactiae. However, some enzyme assignments were missing, as in our study, and for a final evidence of the methylation capacity of an MTase, testing against an otherwise MTase-free background seems to be essential due to the large number of different MTases per isolate. In this study, we present the methylation-sensitive restriction approach as principle proof of methylation activity of DCM1 (CmCWGG) and DAM1 and DAM2 (GmATC) as well.
Based on the bioinformatics approach of this study, a large family of dam and dcm homolog type II DNA MTase genes were identified in M. hominis. Due to the phylogenetic clustering of DNA MTases of M. hyorhinis [28] and M. agalactiae [26] with known methylation specificities with M. hominis MTase homologs (Supplementary Figure S2). The methylation motifs could be confirmed for the MAGa2700 homologs DAM1 and DAM2 (GmATC) and the Mhy3 homolog (AEX14156.1) DCM2 (GATmC), specified for the MAGa3950 homolog DCM4 (GGNmCC) and hypothesized for MAG6680 homolog DCM8 (GmANTC) and MAGa4250 homolog DCM6/7 (G4mCNGC). mCpG-methylation activity, which was detected in M. agalactiae (MAGa4470, MAG4480) and M. hyorhinis (Mhy1; AEX13846), was not evident in the M. hominis isolates tested.
In M. hominis, five solitary MTases (DAM1, DCM8/DAM3, DCM1, DCM3, DCM5) and four RM systems (DpnII-DAM2; Sau3AI-DCM2, Eco47II-DCM4, and HhaI-DCM6/7) could be identified, whose strain-specific presence generated a variety of MTase combinations, suggesting an impact on the epigenetic heterogeneity of this species. Not only the presence or absence of a DNA MTase, but also strain-dependent expression affected the methylation profile. Whenever dam1, dcm2, dcm3, or dcm6/7 were found, the respective methylation of GmATC, GATmC, CmCTC, and GmCGC occurred while the expression of DCM1 activity, shown to preferentially methylate CmCTGG, did not occur in all dcm1 bearing strains. As dcm1 transcripts were found in each dcm1 positive strain, the regulation of DCM1 activity must occur on a (post-) translational level. Remarkably, dcm1 was the only MTase gene of M. hominis being transported by an integrative and conjugative element, ICEHo-I, whose expression might require other stimuli than liquid culturing, such as a polymicrobial presence, mating, or others. However, no methylation mapping on the genome sequence was done so far. 5mC and 6mA mapping would perhaps help to assess self-regulatory methylations and to understand the on/off of DCM1 activity in M. hominis.
For two MTases, DCM5 and DCM8/DAM3, no methylation motifs could be assigned. Neither the presence of DCM5A nor of DCM5B (or of both) correlated with one of the analysed methylation motifs. This is in accordance with the findings in M. agalactiae, where the DCM5-homolog MTase MAG4030 was predicted to methylate 5mC, even though no methylation motif could be identified [26]. Although an undetected methylation motif might account for this, it is of course also conceivable that it reflects the inactivity of these MTases, which originated in lack of essential MTase domain structures, as written above. However, the statistically significant calculated occurrence of DCM5A with an MGE (MhoV1) could also indicate functionality, although the small sample size in the correlation analysis must be considered a limitation.
A DCM8 homolog was detected in M. agalactiae (see Figure S2). This MTase, MAG6680, was characterized as a solitary type II MTase targeting 6mA of the GANTC-motif. However, the presence of dcm8/dam3 did not correlate with a low-threshold methylation of GmASTC (S = G or C) detected in some of the analysed M. hominis strains, so its methylation motif is probably a different one. The results of a Phyre2 analysis of the β group MTase part of DCM3 and DCM8 revealed a structural homology to the M1.hpyavi-sam complex (with 58% and 54% amino acid identity and 100% confidence to template c5hfjF:PDB). The main substrate specificity of this DNA N6-adenine methyltransferase was GmAGG in most H. pylori strains [41]. Interestingly, the DCM3 of M. hominis was proposed to methylate the reverse complementary sequence motif, mCCTC and CmCTC, and its homolog in M. agalactiae, J7894_00205, was shown to methylate mCCTC and GmAGG. That DR-C0020 (acc.-no WP_034351354.1), a protein of Deinococcus radiodurans, was characterized as SAM-dependent C-5 methylase, although sharing amino acid sequence homologies to 4mC methylases [42], suggested that the prediction of methylation specificity (5mC or 6mA), which is only based on a global sequence similarity, should be handled with care and needs confirmation. Moreover, it has already been described that an MTase can change its target specificity [43]. With this knowledge, cross reactivity of 6mA to 5mC, as observed for CCAGG and GATC in Tombo analysis, always require a more detailed analysis to distinguish between a cross-reaction or multifunctionality in methylation.
Most of the type II MTases found in M. hominis have homologs in other bacteria, but their role in virulence and defence has not yet been studied comprehensively. In an analogy to MTases in other bacteria, the RM systems of M. hominis may mainly serve as primitive defence systems, and the solitary MTases regulate cellular processes. The correlation analysis of this study revealed that the RM systems of M. hominis are not obviously drivers of horizontal gene transfer as hypothesized in the study of Dordet-Frisoni et al. for M. agalactiae [26]. Two MTases, DCM3 and DCM5, may also take part in defence mechanisms, as the neighboured genes putatively encode (HNH-) endonucleases, family members of which are known to catalyse DNA hydrolysis.
In M. agalactiae, dam occurred as part of an RM system, but in M. hominis, dam occurred solitary (dam1) or as part of an RM system (dam2). As the solitary DAM in E. coli influences gene regulation by GATC methylation and by competing with regulatory proteins in their binding to promotor regions [44], DAM1 of M. hominis may influence gene regulation while DAM2 may take part in defence as a primary RM function. However, why do both DNA MTase systems exist in the genome-minimized M. hominis, each methylating the same GmATC motif? Murphy et al. hypothesized [45] that an orphan MTase, methylating the same sequence motif as the MTase of an RM system, enables the survival of the organism in the case of a segregational loss of the (plasmid- or MGE-encoded) RM system. This theory fits well with our findings that dam1 was only present in strains with total DpnII gene loss and a loss of DAM2 function. However, as the DAM2-RM system is affected by strain-dependent deletions of the REase gene, it would be of interest to analyze whether DAM2 function will change to regulatory functions, and it remains to be clarified whether both DAM MTases, which significantly differ in size and sequence, methylate the same GATC sites in the genome.
Furthermore, the role of DCM(1) remains ill-defined. A partial methylation of CCWGG sites was observed in E. coli cultures of a mid-exponential phase [46], and DCM heterologous was expressed in E. coli improved bacterial fitness during stationary phase at low temperatures in contrast to the DCM-free E. coli. Besides the involvement in the upregulation of ribosomal activity during the stationary phase [47], DCM was characterised to protect against the uptake and manifestation of a parasitic RM system [48], but also to be associated in MGE rearrangement and TN3 transposition [49]. DCM1 of M. hominis as conserved part of the MGE ICEHo-I is probably most involved in the last one. A general negative correlation between number of defence islands (RM systems) and ICE presence, attested in M. agalactiae, was not calculated significant in M. hominis. That M. hominis strain 8958 harbours three RM-systems, but is reduced in the number of MGEs, was not a generalised phenomenon observed in the long-read sequenced M. hominis strains. Only certain solitary MTase genes correlated with the presence or absence of certain MGEs: dcm5A correlated with MhoV1 presence, dcm8/dam3 with ICEHo-II absence, and weakly with ICEHo-I presence; suggesting that the methylation activity of DCM8/DAM3 (although of unknown motif) affects defence of the respective ICEHo uptake.
The DCM8/DAM3 fusion protein was shown to be affected by disruption within the DAM3 TRD region due to intra-strain variant numbers of a (TA) repeat. This had initially gone undetected in Nanopore and Illumina sequencing but has later been resolved by Sanger sequencing (of cloned PCR-products) in the dcm8/dam3-positive strains tested. In strain FBG, dcm8/dam3-variants with 6 to 12 TA-repeats were found, leading to full-length DCM8/DAM3 with an even TA repeat number but to an incomplete/fragmented protein because of a frameshift to stop codons with an odd TA repeat number. Short sequence repeats (SSRs) are indicative for phase-variable expression, and their gain or loss was suggested to develop during DNA replication by slipped-strand mispairing [50]. Depending on their length and multiplicity, they can lead to frameshift and consequently a premature translation stop or alter the secondary structure and specificity. So far, SSRs were characterized in a magnitude of surface proteins, affecting surface diversity and thereby improving a host immune escape, but they were also found in type I and type III RM systems of various pathogens [51]. In contrast to type II RM systems, characterized in this study, type I and type III RM(S) systems have their own domain (S) for substrate specificity. If SSRs were located at the 5′-end of M or S genes, repeat gain or loss led to an ON/OFF expression of the genes [51,52,53]. In Streptococcus suis, the OFF-mode of the type III DNA MTase ModS2-domain was shown to impact growth and ampicillin resistance. If SSRs were located within the gene (e.g., between both TRD domains of type I hsdS) repeat gain or loss led to expression of full-length or truncated protein [53,54] or (due to loss or gain of amino acid repeats) a protein with new specificity. With the detection of a TA-repeat region in the DAM3-TRD region of DCM8/DAM3, the copy numbers of which affect full-length expression of both MTase parts or only the expression of DCM8 with DAM3 remnants, this fusion protein is postulated as the first type II DNA MTase expressing phase-varions. Future studies should be done to demonstrate expression of the MTase-varions and to characterize their impact on defence and virulence of M. hominis.

5. Conclusions

The type II DNA methyltransferases of M. hominis characterized in this study correspond to homologs described in other bacteria. Unique for M. hominis are two MTases (the solitary DAM1 and the RM system based DAM2) methylating the same motif, GmATC, and the postulated intra-strain specific phase-varions of an MTases-fusion (DCM8/DAM3). The repertoire of solitary and RM-based MTases was strain specific and demonstrated gain and loss of genes in M. hominis. From an evolutionary point of view, the gain of virulence- or defence-associated genes, such as the DNA MTases, seems to counteract the parasite-induced minimization of mycoplasma genomes to contribute to the heterogeneity of this human facultative-pathogen, M. hominis.

Supplementary Materials

The following supporting information can be downloaded at: https://0-www-mdpi-com.brum.beds.ac.uk/article/10.3390/microorganisms11061591/s1, Supplementary Excel File of Tables S1–S7; Supplementary Microsoft Word File of Figures S1–S6.

Author Contributions

L.V. and D.B. conducted the PCR-based screening of M. hominis strains for MTase gene prevalence, RT-PCR and restriction analysis. A.N., A.R., S.A.S., and A.D. performed bioinformatics analyses; B.H. defined the study design and B.H. and A.D. were major contributors in writing the manuscript. All authors have read and agreed to the published version of the manuscript.

Funding

The study was funded and supported by the Juergen Manchot Foundation, Duesseldorf, Germany and by departmental funds from the Institute of Medical Microbiology and Hospital Hygiene of the Medical Faculty of the Heinrich-Heine-University of Duesseldorf, Germany.

Data Availability Statement

Genome sequences of PG21 (acc.-no. FP236530.1), A136 (CP055143.1), FBG (CP055151.1), SP10291 (CP055149.1), SP2565 (CP055144.1), SP3615 (CP055150.1), SS10 (CP055146.1), SS25 (CP055147.1), VO31120 (CP055148.1), 475 (CP055145.1), 8958 (CP055142.1) were downloaded from NCBI (https://0-www-ncbi-nlm-nih-gov.brum.beds.ac.uk/nuccore/); all other draft assemblies are available at OSF (DOI: 10.17605/OSF.IO/CZRBT). All raw sequencing data and high-quality assemblies are made available under BioProject PRJNA429440.

Conflicts of Interest

There are no conflict of interests to declare.

References

  1. Taylor-Robinson, D. Thoughts about Mycoplasma hominis. Sex. Transm. Infect. 2020, 96, 492. [Google Scholar] [CrossRef] [PubMed]
  2. Madoff, S.; Hooper, D.C. Nongenitourinary infections caused by Mycoplasma hominis in adults. Rev. Infect. Dis. 1988, 10, 602–613. [Google Scholar] [CrossRef]
  3. Stabler, S.; Faure, E.; Duployez, C.; Wallet, F.; Dessein, R.; Le Guern, R. The Brief Case: Mycoplasma hominis Extragenital Abscess. J. Clin. Microbiol. 2021, 59, e02343-20. [Google Scholar] [CrossRef] [PubMed]
  4. Pereyre, S.; Sirand-Pugnet, P.; Beven, L.; Charron, A.; Renaudin, H.; Barre, A.; Avenaud, P.; Jacob, D.; Couloux, A.; Barbe, V.; et al. Life on arginine for Mycoplasma hominis: Clues from its minimal genome and comparison with other human urogenital mycoplasmas. PLoS Genet. 2009, 5, e1000677. [Google Scholar] [CrossRef] [Green Version]
  5. Christiansen, G.; Jensen, L.T.; Boesen, T.; Emmersen, J.; Ladefoged, S.A.; Schiotz, L.K.; Birkelund, S. Molecular biology of Mycoplasma. Wien. Klin. Wochenschr. 1997, 109, 557–561. [Google Scholar]
  6. Oliveira, P.H.; Touchon, M.; Cury, J.; Rocha, E.P.C. The chromosomal organization of horizontal gene transfer in bacteria. Nat. Commun. 2017, 8, 841. [Google Scholar] [CrossRef] [PubMed] [Green Version]
  7. Oliveira, P.H.; Touchon, M.; Rocha, E.P. The interplay of restriction-modification systems with mobile genetic elements and their prokaryotic hosts. Nucleic Acids Res. 2014, 42, 10618–10631. [Google Scholar] [CrossRef]
  8. Ren, J.; Lee, H.M.; Shen, J.; Na, D. Advanced biotechnology using methyltransferase and its applications in bacteria: A mini review. Biotechnol. Lett. 2022, 44, 33–44. [Google Scholar] [CrossRef] [PubMed]
  9. Seong, H.J.; Han, S.W.; Sul, W.J. Prokaryotic DNA methylation and its functional roles. J. Microbiol. 2021, 59, 242–248. [Google Scholar] [CrossRef]
  10. Niewmierzycka, A.; Clarke, S. S-Adenosylmethionine-dependent methylation in Saccharomyces cerevisiae. Identification of a novel protein arginine methyltransferase. J. Biol. Chem. 1999, 274, 814–824. [Google Scholar] [CrossRef] [Green Version]
  11. Malone, T.; Blumenthal, R.M.; Cheng, X. Structure-guided analysis reveals nine sequence motifs conserved among DNA amino-methyltransferases, and suggests a catalytic mechanism for these enzymes. J. Mol. Biol. 1995, 253, 618–632. [Google Scholar] [CrossRef]
  12. Bujnicki, J.M. Sequence permutations in the molecular evolution of DNA methyltransferases. BMC Evol. Biol. 2002, 2, 3. [Google Scholar] [CrossRef] [PubMed] [Green Version]
  13. Brambila-Tapia, A.J.; Poot-Hernández, A.C.; Perez-Rueda, E.; Rodríguez-Vázquez, K. Identification of DNA Methyltransferase Genes in Human Pathogenic Bacteria by Comparative Genomics. Indian J. Microbiol. 2016, 56, 134–141. [Google Scholar] [CrossRef] [PubMed] [Green Version]
  14. Vilkaitis, G.; Dong, A.; Weinhold, E.; Cheng, X.; Klimasauskas, S. Functional roles of the conserved threonine 250 in the target recognition domain of HhaI DNA methyltransferase. J. Biol. Chem. 2000, 275, 38722–38730. [Google Scholar] [CrossRef] [Green Version]
  15. Kumar, S.; Cheng, X.; Klimasauskas, S.; Mi, S.; Posfai, J.; Roberts, R.J.; Wilson, G.G. The DNA (cytosine-5) methyltransferases. Nucleic Acids Res. 1994, 22, 1–10. [Google Scholar] [CrossRef] [Green Version]
  16. Ryazanova, A.Y.; Abrosimova, L.A.; Oretskaya, T.S.; Kubareva, E.A. Diverse Domains of (Cytosine-5)-DNA Methyltransferases: Structural and Functional Characterization. In Methylation; Anica, D., Ed.; IntechOpen: Rijeka, Croatia, 2012; Chapter 2. [Google Scholar] [CrossRef]
  17. Sankpal, U.T.; Rao, D.N. Structure, function, and mechanism of HhaI DNA methyltransferases. Crit. Rev. Biochem. Mol. Biol. 2002, 37, 167–197. [Google Scholar] [CrossRef]
  18. Wion, D.; Casadesús, J. N6-methyl-adenine: An epigenetic signal for DNA-protein interactions. Nat. Rev. Microbiol. 2006, 4, 183–192. [Google Scholar] [CrossRef] [PubMed]
  19. Robbins-Manke, J.L.; Zdraveski, Z.Z.; Marinus, M.; Essigmann, J.M. Analysis of global gene expression and double-strand-break formation in DNA adenine methyltransferase- and mismatch repair-deficient Escherichia coli. J. Bacteriol. 2005, 187, 7027–7037. [Google Scholar] [CrossRef] [Green Version]
  20. von Freiesleben, U.; Rasmussen, K.V.; Schaechter, M. SeqA limits DnaA activity in replication from oriC in Escherichia coli. Mol. Microbiol. 1994, 14, 763–772. [Google Scholar] [CrossRef]
  21. Joseph, N.; Duppatla, V.; Rao, D.N. Prokaryotic DNA mismatch repair. Prog. Nucleic Acid. Res. Mol. Biol. 2006, 81, 1–49. [Google Scholar] [CrossRef]
  22. Bogdanova, E.; Djordjevic, M.; Papapanagiotou, I.; Heyduk, T.; Kneale, G.; Severinov, K. Transcription regulation of the type II restriction-modification system AhdI. Nucleic Acids Res. 2008, 36, 1429–1442. [Google Scholar] [CrossRef] [PubMed] [Green Version]
  23. Semenova, E.; Minakhin, L.; Bogdanova, E.; Nagornykh, M.; Vasilov, A.; Heyduk, T.; Solonin, A.; Zakharova, M.; Severinov, K. Transcription regulation of the EcoRV restriction-modification system. Nucleic Acids Res. 2005, 33, 6942–6951. [Google Scholar] [CrossRef] [Green Version]
  24. Gordeeva, J.; Morozova, N.; Sierro, N.; Isaev, A.; Sinkunas, T.; Tsvetkova, K.; Matlashov, M.; Truncaite, L.; Morgan, R.D.; Ivanov, N.V.; et al. BREX system of Escherichia coli distinguishes self from non-self by methylation of a specific DNA site. Nucleic Acids Res. 2019, 47, 253–265. [Google Scholar] [CrossRef] [PubMed] [Green Version]
  25. Roberts, R.J.; Macelis, D. REBASE--restriction enzymes and methylases. Nucleic Acids Res. 2001, 29, 268–269. [Google Scholar] [CrossRef] [Green Version]
  26. Dordet-Frisoni, E.; Vandecasteele, C.; Contarin, R.; Sagné, E.; Baranowski, E.; Klopp, C.; Nouvel, L.-X.; Citti, C. Impacts of Mycoplasma agalactiae restriction-modification systems on pan-epigenome dynamics and genome plasticity. Microb. Genom. 2022, 8, mgen000829. [Google Scholar] [CrossRef]
  27. Semashko, T.A.; Arzamasov, A.A.; Evsyutina, D.V.; Garanina, I.A.; Matyushkina, D.S.; Ladygina, V.G.; Pobeguts, O.V.; Fisunov, G.Y.; Govorun, V.M. Role of DNA modifications in Mycoplasma gallisepticum. PLoS ONE 2022, 17, e0277819. [Google Scholar] [CrossRef]
  28. Chernov, A.V.; Reyes, L.; Xu, Z.; Gonzalez, B.; Golovko, G.; Peterson, S.; Perucho, M.; Fofanov, Y.; Strongin, A.Y. Mycoplasma CG- and GATC-specific DNA methyltransferases selectively and efficiently methylate the host genome and alter the epigenetic landscape in human cells. Epigenetics 2015, 10, 303–318. [Google Scholar] [CrossRef]
  29. Lluch-Senar, M.; Luong, K.; Lloréns-Rico, V.; Delgado, J.; Fang, G.; Spittle, K.; Clark, T.A.; Schadt, E.; Turner, S.W.; Korlach, J.; et al. Comprehensive methylome characterization of Mycoplasma genitalium and Mycoplasma pneumoniae at single-base resolution. PLoS Genet. 2013, 9, e1003191. [Google Scholar] [CrossRef] [PubMed] [Green Version]
  30. Meygret, A.; Peuchant, O.; Dordet-Frisoni, E.; Sirand-Pugnet, P.; Citti, C.; Bebear, C.; Beven, L.; Pereyre, S. High Prevalence of Integrative and Conjugative Elements Encoding Transcription Activator-Like Effector Repeats in Mycoplasma hominis. Front. Microbiol. 2019, 10, 2385. [Google Scholar] [CrossRef]
  31. Henrich, B.; Hammerlage, S.; Scharf, S.; Haberhausen, D.; Fürnkranz, U.; Köhrer, K.; Peitzmann, L.; Fiori, P.L.; Spergser, J.; Pfeffer, K.; et al. Characterisation of mobile genetic elements in Mycoplasma hominis with the description of ICEHo-II, a variant mycoplasma integrative and conjugative element. Mob. DNA 2020, 11, 30. [Google Scholar] [CrossRef]
  32. Henrich, B.; Feldmann, R.C.; Hadding, U. Cytoadhesins of Mycoplasma hominis. Infect. Immun. 1993, 61, 2945–2951. [Google Scholar] [CrossRef] [PubMed] [Green Version]
  33. Henrich, B.; Lang, K.; Kitzerow, A.; MacKenzie, C.; Hadding, U. Truncation as a novel form of variation of the p50 gene in Mycoplasma hominis. Microbiology 1998, 144 Pt 11, 2979–2985. [Google Scholar] [CrossRef] [PubMed] [Green Version]
  34. Henrich, B.; Kretzmer, F.; Deenen, R.; Kohrer, K. Validation of a novel Mho microarray for a comprehensive characterisation of the Mycoplasma hominis action in HeLa cell infection. PLoS ONE 2017, 12, e0181383. [Google Scholar] [CrossRef] [PubMed] [Green Version]
  35. Hopfe, M.; Hoffmann, R.; Henrich, B. P80, the HinT interacting membrane protein, is a secreted antigen of Mycoplasma hominis. BMC Microbiol. 2004, 4, 46. [Google Scholar] [CrossRef] [Green Version]
  36. R Core Team. R: A Language and Environment for Statistical Computing; R Foundation for Statistical Computing: Vienna, Austria, 2022. [Google Scholar]
  37. Virtanen, P.; Gommers, R.; Oliphant, T.E.; Haberland, M.; Reddy, T.; Cournapeau, D.; Burovski, E.; Peterson, P.; Weckesser, W.; Bright, J.; et al. SciPy 1.0: Fundamental algorithms for scientific computing in Python. Nat. Methods 2020, 17, 261–272. [Google Scholar] [CrossRef] [Green Version]
  38. Waskom, M.L. Seaborn: Statistical data visualization. J. Open Source Softw. 2021, 6, 3021. [Google Scholar] [CrossRef]
  39. Simpson, J.T.; Workman, R.E.; Zuzarte, P.C.; David, M.; Dursi, L.J.; Timp, W. Detecting DNA cytosine methylation using nanopore sequencing. Nat. Methods 2017, 14, 407–410. [Google Scholar] [CrossRef]
  40. Tourancheau, A.; Mead, E.A.; Zhang, X.S.; Fang, G. Discovering multiple types of DNA methylation from bacteria and microbiome using nanopore sequencing. Nat. Methods 2021, 18, 491–498. [Google Scholar] [CrossRef]
  41. Ma, B.; Ma, J.; Liu, D.; Guo, L.; Chen, H.; Ding, J.; Liu, W.; Zhang, H. Biochemical and structural characterization of a DNA N6-adenine methyltransferase from Helicobacter pylori. Oncotarget 2016, 7, 40965–40977. [Google Scholar] [CrossRef] [Green Version]
  42. Patil, N.A.; Basu, B.; Deobagkar, D.D.; Apte, S.K.; Deobagkar, D.N. Putative DNA modification methylase DR_C0020 of Deinococcus radiodurans is an atypical SAM dependent C-5 cytosine DNA methylase. Biochim. Biophys. Acta. Gen. Subj. 2017, 1861, 593–602. [Google Scholar] [CrossRef]
  43. Jeltsch, A. The cytosine N4-methyltransferase M.PvuII also modifies adenine residues. Biol. Chem. 2001, 382, 707–710. [Google Scholar] [CrossRef] [PubMed]
  44. Marinus, M.G.; Lobner-Olesen, A. DNA Methylation. EcoSal Plus 2014, 6. [Google Scholar] [CrossRef] [PubMed] [Green Version]
  45. Murphy, J.; Mahony, J.; Ainsworth, S.; Nauta, A.; van Sinderen, D. Bacteriophage orphan DNA methyltransferases: Insights from their bacterial origin, function, and occurrence. Appl. Environ. Microbiol. 2013, 79, 7547–7555. [Google Scholar] [CrossRef] [PubMed] [Green Version]
  46. Kahramanoglou, C.; Prieto, A.I.; Khedkar, S.; Haase, B.; Gupta, A.; Benes, V.; Fraser, G.M.; Luscombe, N.M.; Seshasayee, A.S. Genomics of DNA cytosine methylation in Escherichia coli reveals its role in stationary phase transcription. Nat. Commun. 2012, 3, 886. [Google Scholar] [CrossRef] [PubMed] [Green Version]
  47. Militello, K.T.; Simon, R.D.; Qureshi, M.; Maines, R.; VanHorne, M.L.; Hennick, S.M.; Jayakar, S.K.; Pounder, S. Conservation of Dcm-mediated cytosine DNA methylation in Escherichia coli. FEMS Microbiol. Lett. 2012, 328, 78–85. [Google Scholar] [CrossRef] [Green Version]
  48. Takahashi, N.; Naito, Y.; Handa, N.; Kobayashi, I. A DNA methyltransferase can protect the genome from postdisturbance attack by a restriction-modification gene complex. J. Bacteriol. 2002, 184, 6100–6108. [Google Scholar] [CrossRef] [Green Version]
  49. Yang, M.K.; Ser, S.C.; Lee, C.H. Involvement of E. coli dcm methylase in Tn3 transposition. Proc. Natl. Sci. Counc. Repub. China Part B Life Sci. 1989, 13, 276–283. [Google Scholar]
  50. Hallet, B. Playing Dr Jekyll and Mr Hyde: Combined mechanisms of phase variation in bacteria. Curr. Opin. Microbiol. 2001, 4, 570–581. [Google Scholar] [CrossRef] [Green Version]
  51. Atack, J.M.; Guo, C.; Yang, L.; Zhou, Y.; Jennings, M.P. DNA sequence repeats identify numerous Type I restriction-modification systems that are potential epigenetic regulators controlling phase-variable regulons; phasevarions. FASEB J. Off. Publ. Fed. Am. Soc. Exp. Biol. 2020, 34, 1038–1051. [Google Scholar] [CrossRef] [Green Version]
  52. Rocha, E.P.; Blanchard, A. Genomic repeats, genome plasticity and the dynamics of Mycoplasma evolution. Nucleic Acids Res. 2002, 30, 2031–2042. [Google Scholar] [CrossRef]
  53. Tram, G.; Jen, F.E.; Phillips, Z.N.; Timms, J.; Husna, A.U.; Jennings, M.P.; Blackall, P.J.; Atack, J.M. Streptococcus suis Encodes Multiple Allelic Variants of a Phase-Variable Type III DNA Methyltransferase, ModS, That Control Distinct Phasevarions. mSphere 2021, 6, e00069-21. [Google Scholar] [CrossRef] [PubMed]
  54. Adamczyk-Poplawska, M.; Lower, M.; Piekarowicz, A. Characterization of the NgoAXP: Phase-variable type III restriction-modification system in Neisseria gonorrhoeae. FEMS Microbiol. Lett. 2009, 300, 25–35. [Google Scholar] [CrossRef] [PubMed] [Green Version]
Figure 1. Phylogenetic tree of type II DNA MTases presents two main branches of DAM and DCM homologs in M. hominis. MTase sequences of the M. hominis strains tested, whose accession numbers are listed in Supplementary Table S1, were used in ClustalW-based Multiple Sequence Alignment using software program MegAlign 5.08 with default setting for phylogenetic tree construction.
Microorganisms 11 01591 g001
Figure 2. Type II DNA MTase gene loci and cassettes. (A) Position of the DNA MTase gene loci with respect to the genome sequence of ATCC23114 (type strain PG21); dam loci (1–3) in blue, dcm loci (1–8) in green. (B) Composition of the MTase gene loci. Genes are represented by arrows and coloured as follows: chromosomal core genes (accord. to PG21) in grey, conserved genes in the MTase cassettes (red), dam homologs in blue, dcm homologs in green, restriction endonuclease (REase) genes in yellow with blue frame; genes, in some isolated affected by truncation, are shaded.
Microorganisms 11 01591 g002
Figure 3. Prevalence and co-occurrence of type II DNA MTases in M. hominis. (A) Bargraphs of the different dam (blue) and dcm (green) gene prevalence (%) calculated on presence in the 115 M. hominis strains tested (Kruskal-Wallis p = 2.33 × 10−54). (B) Bargraphs of the number of M. hominis strains with zero to four different solitary MTases (orange) or MTases of RM systems (red). The combination of dam and dcm genes in view on solitary- and RM-MTases is listed in Table S3 for all strains (Mann–Whitney U p = 0.556).
Microorganisms 11 01591 g003
Figure 4. DNA MTase and REase transcripts in selected M. hominis strains. Relative transcript levels of each DNA MTase and, if associated, REase gene (rease) were calculated to the mean of three housekeeping genes (gap, mho_0150, and lgt). Presence of the respective genes is marked by (+); absence of next neighboured RM-genes is marked by (). Bar graphs show the mean of the transcripts with the standard deviation of two independent cultures, each tested in duplicate.
Microorganisms 11 01591 g004
Figure 5. Alignment of conserved motifs of C5-cytosine MTases of M. hominis. (A) Schematic representation of motif order (I to X) in C5-cytosine MTases with SAM-binding motifs in red and catalytic motifs in green. (B) Consensus sequences of motifs I, IV, VI, VIII, IX, and X in DCM1-7 of M. hominis strains (Mhom) in multiple alignment with each highest homolog non-mollicutes species. Acronyms and homologies of the bacterial species are listed in Table 3.
Microorganisms 11 01591 g005
Figure 6. Alignment of conserved motifs of N-6-adenine and N-4-cytosine MTases of M. hominis. (A) Schematic representation of motif order (I to IX) in N-6-adenine and N-4-cytosine MTases. (B) Consensus sequences of motifs I to X in N-6-adenine MTases (DAM1, DAM2, and DCM8α/DAM3α) and N-4-cytosine MTases (DCM3β and DCM8β) of M. hominis strains (Mhom) in multiple alignment with each highest homologous non-mollicutes. Colour coding of conserved amino acids corresponds to that of Malone et al. [11]. Acronyms and homologies of the bacterial species are listed in Table 3.
Microorganisms 11 01591 g006
Figure 7. Proof of DCM1 activity in methylation sensitive restriction (MSR) analysis. (A) Number of dcm1 genes per genome. (B) Relative transcript levels of dcm1, calculated to the mean of three housekeeping genes (gap, mho_0150 and lgt) with the standard deviation of two independent cultures, each tested in duplicates. (C) Plots of methylation scores calculated with tailored Tombo script (CCmAGG Kruskal–Wallis chi-squared = 649.26, df = 6, p-value < 2.2 × 10⁻¹⁶, CmCTGG Kruskal–Wallis chi-squared = 843.05, df = 6, p-value < 2.2 × 10⁻¹⁶). (D) MSR analysis. Restricted DNA was separated on 1% (w/v) agarose gels.
Microorganisms 11 01591 g007
Figure 8. Proof of DAM1 and DAM2 activity in MSR analysis. (A) Presence of full-length genes was assigned a value of 1, truncated genes a value of 0.5, and absent genes a value of 0. (B) Relative transcript levels of dam1, dam2, and dcm2, calculated to the mean of three housekeeping genes (gap, mho_0150, and lgt) with the standard deviation of two independent cultures, each tested in duplicates. (C) Plots of methylation scores calculated with tailored Tombo (GmATC Kruskal–Wallis chi-squared = 4365.2, df = 6, p-value < 2.2 × 10⁻¹⁶, GATmC Kruskal–Wallis chi-squared = 10,077, df = 6, p-value < 2.2 × 10⁻¹⁶). (D) MSR analysis. Restricted DNA was separated on 1% (w/v) agarose gels.
Microorganisms 11 01591 g008
Figure 9. rDCM1 and rDAM2 expression led to respective methylation activity of transformed E. coli. Coommassie blue staining of total protein (A) and immunostaining of histidine-tagged proteins (B) in cell lysate of dam-/dcm-deficient E. coli (−), transformed by pcDNA3.1-(codon-optimized) dcm1 of PG21 (rDCM1) or –(codon-optimized) dam2 of 8958 (rDAM2). (C) MSR analysis of the respective genomic E. coli DNAs; unrestricted (DCM(−) and DAM(−)) or restricted with MvaI (1), SgeI (2), and EcoRII (3) for rDCM1 clone and restricted with Sau3AI (4), DpnI (5), and MboI (6) for rDAM2 clone.
Microorganisms 11 01591 g009
Figure 10. Boxplots of MTases and MGEs. Presence of selected MTases (+ present, − not present) correlated with number of selected MGEs, according to the significance in Pearson’s R correlation analysis (see Figure S6). Median bar is shown in red. (Mann–Whitney U MGE_all vs. dcm1 p = 0.0001; MhoV1 vs. dcm5A p = 0.4677; ICEHo-I vs. dcm8 p = 0.2818; ICEHo-II vs. dcm8 p = 0.0930).
Microorganisms 11 01591 g010
Table 1. Primers used for qPCR screening and mRNA quantification.
TargetForward Primer Sequence (5′-3′)Reverse PrimerSequence (5′-3′)Amplicon (bp)
gapgap-FGCAGGCTCAATATTTGACTCACTgap-RGATGATTCATTGTCGTATCATGC95
hitAhitA-FTTGAGGCACAGCAATAGChitA-RAAGGCTTAGGTAAGGAATGATTAG83
lgtlgt-FTGAAATTGATTACGTCCAGGAAlgt-RCCGAAACGAATTATTCCATAATAAAC68
mho_0150mho150-FCAAGGTTCAAATGATATTGCAAAGmho150-RCAATTCCATATCCAATAGGAACAA94
dam1dam1-FATGGGCAGGCGGAAAACdam1-RGAATACTGCTCCTCCACCAATAAA118
dam2dam2_FTTGTAAAATGAGCAGGTGGHARGACACAdam2-RCTAAAAAGTAATGAACCYCCRCCAATAAATG115
R.dam2R_dam2-FAATGAGGTTGCCAGAAGTTATAGRAR_dam2-RCCRYAACCATCAGTAAATCAAASAAATG89
dam3dam3-FTGAAAATGCAAGAAACAAGAGAAdam3-RGCACCCGAAATTAAGTATGGA67
R.dam3R_dam3-FCATTGCCAATTTTTAAGGTGGATAATR_dam3-RTGTTTTAGGGCAATGTATTTTTCTGAT148
dcm1dcm1-FCACGGATCTCCTTGTCAAGATdcm1-RTGTTTCCCACAATAAACTACTTCG91
dcm2dcm2-FTTGCTTTGCGGTGGTTTTCdcm2-R1ACTCCTTTTTTRCCTTYAATACCTTTTTC86
R.dcm2R_dcm2-FAAAAGGAGCGAATAGCAHAGTTR_dcm2-RGAGGAGAATAAGACGGCAAGTT140
dcm3dcm3-FCGAAGAAGATGGGCGTAAATATGdcm3-RACGCGGATCATCTAAACCTAAATT92
dcm4dcm4-FGCGTGATATCGACCCAAATGTdcm4-RATTCTACGAAGGATTCCAGTTCGT87
R.dcm4R_dcm4-FCATTCGAATGATGAGTGTTTTTTAGR_dcm4-RGCCTTGCAGTGATTTCCATTTAC95
dcm5Adcm5A_FACCAGATATTATTTTAGCCTCACCdcm5A_RATCGAACGCAGCATTTTG78
dcm5Bdcm5B_FGGTGGAAAAATGCTACGCTCTdcm5B_RATCTGCCTCTTTCTTTTTGCTCA133
dcm6dcm6-FTACGTACAGCCACAAATCAATCAGdcm6-RCAAAAACACCACCCCCATAAG219
R.dcm6/7R_dcm6/7-FAAACGAAGCGGCTCATCCAGR_dcm6/7-RAAAACTTTATCGCCATCATCAGA110
dcm7dcm7-FGTAATTGGTGGCGGCAGAATAGdcm7-RCATTAAGTCATAAGTTCGCTTGCTAA98
dcm8dcm8-FACCGGTAGAGTTAATGGAAAAAdam8_RTTAAGGCCGCAACRCAAGTC104
Table 2. Restriction endonucleases with respective recognition sequence used for MSR analysis.
MTase-Restriction Enzyme a
Mtase MotifCut1: °XCut2: mXCut3: +X
DCM1CmCWGGMvaI
°C°CWGG
SgeI mCNNGN9EcoRII
+C+CWGG
DCM2GATmCDpnII G+AT°C-Sau3AI
G°AT+C
DAM1GmATCSau3AI
G°AT+C
DpnI
GmAT+C
MboI
G+AT°C
DAM2
a Restriction: independent on methylation of amino acid (AA) X (°X), requires methylation of AA X (mX), or is inhibited by methylation of AA X (+X); respective AA X is marked in red.
Table 3. DAM and DCM proteins of M. hominis and highest homologous non-mollicutes species.
M. hominis DNA MTaseHighest NON-MYCOPLASMA Homologe of Non-Redundant Protein Sequences (nr) by BlastP
NameReference StrainLength (AA)AccessionAcronymNameQuery CoverE ValueIdentity (%)Length (AA)Accession
dcm1FBG333QKX31507.1CdifClostridioides difficile98%2.00 × 10−7344.12%321HBE9891886.1
dcm28958414QKX36700.1TrecTreponema rectale98%0.074.75%412QOS39629.1
dcm3VO31120592QKX39759.1ClosClostridia bacterium99%0.080.38%596MCD8040040.1
dcm4PG21 (ATCC23114)337CAX37170.1OsciOscillospiraceae bacterium92%6.00 × 1018080.06%352MBP0955721.1
dcm5A475256QKX38638.1LlacLactococcus lactis94%2.00 × 10−4139.93%268WP_118263419.1
dcm5BA136253QKX37494.1LlacLactococcus lactis94%2.00 × 10−4140.30%268WP_118263419.1
dcm68958325QKX36719.1LachLachnospira sp. 99%0.082.10%330MBQ4284079.1
dcm78958213QKX36723.1SiphSiphoviridae sp. 82%1.00 × 10−4950.56%610DAG15160.1
dam1PG21 (ATCC23114)442CAX37613.1ClosClostridia bacterium97%0.062.59%439MCR4661536.1
dam28958282QKX36937.1ClosClostridia bacterium98%4.00 × 10−9358.06%355MBO4694934.1
dcm8SS10 (AA5-233)534QKX39057.1LphaLactococcus phage42%9.00 × 10−7955.46%227YP_009904999.1
dam3SS10 (221-529)534QKX39057.1SubeStreptococcus uberis57%1.00 × 10−6241.05%709WP_154631601.1
Table 4. Highest Hits of Conserved Domains in solitary MTases and RM systems of M. hominis.
M. hominis ProteinsHighest Hit of Conserved Domains
Name *IsolateLength (AA)NameAccessionDescriptionInterval
(AA x-y)
E-Value
DAM1PG21442damTIGR00571DNA- adenine methylase (dam)1–2805.25 × 10−58
DCM1FBG333Cyt_C5_DNA_methylasecd00315Cytosine-C5 specific DNA methylase1–3259.29 × 10−27
DAM28958282damTIGR00571DNA- adenine methylase (dam)2–2746.16 × 10−61
R.DAM28958291DpnIIpfam04556DpnII restriction endonuclease5–2788.47 × 10−98
DCM28958414dcmTIGR00675DNA-methyltransferase (dcm)7–4071.32 × 10−68
R.DCM28958463Sau3AI_N-likecd22356N-terminal catalytic domain of Sau3AI22–2081.34 × 10−83
Sau3AI_C-likecd22355C-term. allosteric effector domain of Sau3AI243–4594.31 × 10−65
DCM68958325DNA-methylasepfam00145C-5cytosine-specific DNA methylase29–3215.24 × 10−107
R.DCM78958262HhaI-likecd21834(Restriction) endonuclease 3–2615.79 × 10−102
DCM78958213dcmTIGR00675DNA-methyltransferase (dcm)47–1864.08 × 10−41
DCM4PG21337Cyt_C5_DNA_methylasecd00315Cytosine-C5 specific DNA methylase24–3301.81 × 10−81
R.DCM4PG21217Eco47IIpfam09553EcoR47II restriction endonuclease7–2113.76 × 10−110
DCM3VO31120592dcmCOG0270Site-specific DNA-cytosine methylase1–3552.73 × 10−85
N6_N4_MTase pfam01555DNA methylase383–5844.37 × 10−46
up_DCM3VO31120409HNHpfam01844HNH endonuclease310–3634.74 × 10−8
DCM5A475256Cyt_C5_DNA_methylasecd00315Cytosine-C5 specific DNA methlyase14–836.58 × 10⁻³
DCM5BA136253Cyt_C5_DNA_methylasecd00315Cytosine-C5 specific DNA methlyase14–852.14 × 10⁻³
down DCM5475979DUF1524pfam07510HXXP-motif protein. similar to His-Me finger endonuclease841–9159.59 × 10−03
DCM8SS10534N6_N4_Mtasepfam01555DNA methylase27–2273.38 × 10−46
DAM3 DamCOG0338site-specific DNA-adenine methylase239–5301.50 × 10−21
* R.DAM/DCM, restriction endonuclease of DAM/DCM; up_/down_DCM3, protein encoded by the gene upstream/downstream of the DCM3 gene.
Table 5. Methylation scores of variant nucleotides in the recognition sequences of selected motifs.
MTase GeneMotif *1093618847197912112712256U14352VA7388VA7447VA942J475A136SS10SS25VO31120SP2565SP102918958FBG2539
dcm1 1 **211120010000001030
CCTGG 0.80.60.20.20.20.60.20.10.10.20.20.20.20.30.60.20.20.20.2
CCTGG0.90.60.20.20.20.70.20.10.10.20.20.20.20.30.70.20.10.20.2
CCAGG 0.70.30.10.10.20.60.10.10.10.20.20.20.20.20.30.20.20.20.2
CCAGG0.60.30.10.20.20.60.20.10.10.20.20.20.20.30.40.20.20.20.2
dam?CCAGG0.20.50.30.30.20.20.30.40.30.50.40.60.40.60.90.40.50.20.5
dcm?GCAGC0.90.80.20.30.30.80.30.20.10.10.20.30.30.40.30.20.30.40.2
GCTGC0.90.80.20.30.30.80.30.10.10.10.20.20.20.40.30.10.10.30.1
GCTGC0.70.50.20.30.30.60.30.30.20.30.40.40.40.40.30.30.30.30.3
GCGGC0.60.30.30.30.30.60.30.20.30.30.30.30.30.30.30.20.60.30.3
GCCGC0.80.40.20.30.20.40.20.30.20.20.20.20.20.20.20.20.30.20.2
GCCGC0.70.30.20.20.20.50.20.20.20.20.20.20.20.20.20.20.30.10.2
GCCGC0.20.20.20.20.20.20.30.20.30.40.30.30.30.40.30.30.40.30.3
dam1 0000100000000001000
dam2 00.5 **000.5110.511001000.510.50.5
GATC0.20.20.80.20.70.50.50.30.50.60.20.20.60.20.80.60.90.40.2
GATCC0.30.30.60.20.60.70.70.50.70.70.20.30.70.30.60.60.80.50.3
GGATC0.20.30.70.20.70.60.70.40.70.70.20.20.70.20.60.60.90.50.2
dcm2 0010100000000010100
GATC0.10.10.90.10.80.10.10.10.10.20.10.10.20.11.00.20.90.20.1
GATCC0.10.10.90.10.80.20.10.10.10.20.20.20.20.21.00.21.00.20.1
GGATC0.10.10.90.10.80.20.10.10.10.20.20.20.20.21.00.20.90.20.2
dcm3 0010010000100100000
CCTC 0.10.10.50.10.10.50.10.10.10.20.80.20.20.80.20.20.20.20.2
CCTC0.10.10.50.10.10.50.10.10.10.20.70.20.20.70.20.20.10.10.2
dcm6/7 1101001010010000100
GCGC0.90.90.20.90.20.20.90.20.90.20.20.90.20.20.20.20.90.20.2
GCGC0.60.60.10.50.10.10.50.10.50.10.10.60.10.20.10.10.60.10.1
dam?CTAT0.30.30.30.30.20.30.30.30.30.60.70.60.70.70.60.60.90.70.6
CTTC 0.10.10.10.10.10.10.10.10.10.30.30.30.30.30.30.30.60.30.2
CTTC0.20.20.20.20.10.20.20.20.20.30.30.30.30.30.30.30.60.30.3
GGAG0.40.30.30.30.30.30.30.30.30.40.40.40.40.50.40.40.50.30.4
GAGTC0.40.40.40.40.30.30.30.40.30.40.40.40.40.40.40.40.50.40.4
GACTC0.40.30.30.30.30.30.30.30.30.50.50.50.60.50.50.50.30.40.5
GGACC0.50.50.50.50.40.40.50.50.50.40.40.40.40.40.40.30.30.30.5
GGACC0.40.40.30.40.30.40.30.40.30.40.40.40.40.40.40.40.50.30.4
GGGCC0.30.30.20.20.20.20.20.20.20.30.30.40.30.40.40.30.60.30.3
GGCCC0.30.20.30.20.30.30.30.30.30.40.40.40.50.40.50.30.40.30.5
dcm5 11111111111111100.511
dcm8 0001000000011100010
dam3 *** 0001000000011100010
* putatively methylated amino acid in red; ** number of MTase gene/genome; 0.5 = truncated gene; *** dam3 also with truncations. Meth.-Score > 0.5
Disclaimer/Publisher’s Note: The statements, opinions and data contained in all publications are solely those of the individual author(s) and contributor(s) and not of MDPI and/or the editor(s). MDPI and/or the editor(s) disclaim responsibility for any injury to people or property resulting from any ideas, methods, instructions or products referred to in the content.

