
Sampling and Characterization of Bioaerosols in Poultry Houses

Aerosol Technology Laboratory, Biological & Agricultural Engineering Department, Texas A&M University, College Station, TX 77843, USA
*
Author to whom correspondence should be addressed.
Microorganisms 2023, 11(8), 2068; https://0-doi-org.brum.beds.ac.uk/10.3390/microorganisms11082068
Submission received: 30 June 2023
/
Revised: 3 August 2023
/
Accepted: 4 August 2023
/
Published: 11 August 2023
(This article belongs to the Special Issue Bacterial and Antibiotic Resistance in the Environment)
Abstract
:Two poultry Confined Animal Feeding Units (CAFUs), “House A” and “House B”, were selected from the TAMU poultry facility for the study, and samples were collected over a five-day period. Bioaerosol sampling was conducted using a Wetted Wall Cyclone (WWC) bioaerosol collector at the two CAFU houses, in which House A housed approximately 720 broiler chickens and roosters, while House B remained unoccupied and served as a reference. Both houses consisted of 24 pens arranged on either side of a central walkway. Bacterial content analysis was conducted using microbial plating, real-time Polymerase Chain Reaction (PCR), and Fatty Acid Methyl Ester (FAME) analysis, while ambient temperature and relative humidity were also monitored. The concentrations of microorganisms in House A showed a highly dynamic range, ranging from 4000 to 60,000 colony forming units (CFU) per cubic meter of air. Second, the WWC samples contained approximately ten-fold more bacterial DNA than the filter samples, suggesting higher levels of viable cells captured by the WWC. Third, significant concentrations of pathogens, including Salmonella, Staphylococcus, and Campylobacter, were detected in the poultry facility. Lastly, the WWC system demonstrated effective functionality and continuous operation, even in the challenging sampling environment of the CAFU. The goal of this study was to characterize the resident population of microorganisms (pathogenic and non-pathogenic) present in the CAFUs and to evaluate the WWC’s performance in such an environment characterized by elevated temperature, high dust content, and feathers. This knowledge could then be used to improve understanding microorganism dynamics in CAFUs including the spread of bacterial infections between animals and from animals to humans that work in these facilities, as well as of the WWC performance in this type of environment (elevated temperature, high content of dust and feathers). A more comprehensive understanding can aid in improving the management of bacterial infections in these settings.
1. Introduction
The transmission of pathogenic bioaerosols and antibiotic resistance genes in poultry units is a concerning issue due to the health risk of birds, workers, and people in the surrounding areas of poultry units [1,2]. These bioaerosols are highly transmissible due to their aerodynamic properties characterized as their small diameter and lightweight [1,3]. These bioaerosols can include bacteria, fungi, viruses, and endotoxins; of the microbes in bioaerosols, more than 80% are bacteria [2,4].
Animal production has been identified as a significant source of bioaerosol concentration increase downwind of farming areas [1,5]. These bioaerosols can travel up to 1000 m downwind from the original source not only from outdoor sources but also from partially confined structures that can still spread bioaerosols to the ambient air due to winds [2]. Du et al. (2019) showed through experimentation and Computational Fluid Dynamics (CFD) modeling that higher concentrations of bioaerosols had a positive correlation to turbulence and disturbed airflow [3]. Factors influencing bioaerosol formation and transmission are convoluted and include age of the birds, stocking density, housing system, litter type, temperature relative humidity, air pollution, human activity, animal activity, land use, etc. Not only can these factors influence the formation of bioaerosols, but they can also affect the development of antibiotic resistance [6].
There also tends to be high bioaerosol concentrations around livestock and farms. The bacterial and fungal bioaerosols can range in size from 0.1 to 10 μm, which can be inhaled and potentially cause allergic reactions, cancer, and respiratory infections [7,8,9]. When exposed for long periods of time, workers or residents near poultry houses could develop lung dysfunction and severe systemic inflammatory responses occur, such as pneumonia, asthma, rhinitis, and various respiratory infections [9]. There have been multiple outbreaks at poultry facilities, such as in 2018, a multistate Psittacosis (caused by the bacterium Chlamydia psittaci) outbreak causing respiratory infections in employees [10]. Kasaeinasab et al. (2017) found that on average, 25% of workers in poultry environments suffered from cough, productive cough, breathlessness, phlegm, and wheezing, a significantly higher percentage compared to unexposed workers [11]. Higher concentrations of Staphylococcus were detected in bioaerosols that caused increased respiratory illnesses and symptoms in poultry facility workers. Endotoxins commonly released from pathogenic bacteria (Staphylococcus, Campylobacter, and Salmonella) during cell lysis can travel with larger aerosol particles and lead to immune functioning disorders and lung inflammation [9].
Numerous studies have highlighted the prevalence of Gram-positive and Gram-negative bacteria, such as Staphylococcus spp., including Staphylococcus aureus, Escherichia coli, Streptococcus suis, Actinobacillus pleuropneumoniae, Micrococcus, Proteus, Pseudomonas, and Clostridia in bioaerosol samples from poultry farming. Poultry facilities also contribute to fungal bioaerosols, most commonly Aspergillus, Fusarium, and Penicillium genera [12,13]. Previous research found that viruses could travel up to 50 km and Staphylococcae could travel up to 500 m [12]. While there are known risks, there are still gaps in research pertaining to the spread of pathogens from farm buildings and assessing the health risks to animals, residents, and farmers working in these environments.
Some common bacteria that cause illness including Campylobacter, Staphylococcus, and Salmonella are becoming increasingly antibiotic resistant. Staphylococcus aureus can cause skin and soft tissue infections, endocarditis, osteomyelitis, bacteremia, and lethal pneumonia. S. aureus has become increasingly resistant to antibiotics, especially methicillin-resistant S. aureus (MRSA), which is multi-drug resistant. Other drugs MRSA is resistant to include penicillins, cephalosporins, chloramphenicol, lincomycin, aminoglycosides, tetracyclines, macrolides, quinophthalones, sulfonamides, and rifampicin [14]. SEB, SEC, and SEA are genes found to produce enterotoxins causing foodborne illnesses [15]. Salmonella enterica causes foodborne infections and typhoid fever in humans and has developed resistance to multiple antibiotics, such as streptomycin, gentamicin, sulfadimethoxine, tetracycline, and the trimethoprim-sulfamethoxazole combination, negatively effecting food production and safety, especially in poultry [16]. A gene typically used for Salmonella identification invA is a major factor in virulence of Salmonella [17]. Campylobacter is the cause of common diarrhea and specifically, Campylobacter jejuni is the most common cause of bacterial gastroenteritis. Campylobacter is becoming increasingly resistant to erythromycin, clarithromycin, azithromycin, and fluoroquinolones such as ciprofloxacin [18,19].
In this study, researchers used active sampling with a Wetted Wall Cyclone (WWC) bioaerosol collector. The WWC collects and concentrates ambient particles into a small volume of collection liquid, which increases the concentration of the particles in the sample by a factor of 106 as compared to the ambient air. The WWC collector has been tested by the PIs in multiple settings including a laboratory flow cell where it effectively collected bioaerosols ranging in size from viruses (85 nm) to vegetative bacteria (up to 9.3 µm) [20]. Environmental sampling has been conducted in multiple indoor and outdoor locations for different time periods of hours to days. Hydrosols collected overnight (~50 mL) were concentrated to 100 µL using an InnovaPrep HSC-40. The WWC was chosen as the sampler due to its ability to preserve culturability and DNA integrity in the collected bacteria. In contrast to widely used impaction samplers for bioaerosol collection, the WWC maintains 100% culturability of Bacillus atrophaeus [aka B. globigii] spores [21]. King and McFarland (2012) were able to collect approximately 2 logs more of culturable Escherichia coli cells utilizing a WWC. This study also found that the DNA integrity was more similar to original stock suspensions of bacteria than other widely used bioaerosol collectors [20].
One method of isolation and identification of bacterial samples is Fatty Acid Methyl Ester (FAME) analysis. It has been commonly applied for bacteria using automated gas chromatography (GC) to hydrolyze fatty acids from phospholipids triacylglycerols, sterols, and any other lipids in the cell. The GC identifies the methyl esters formed to identify organisms [22,23].
This study aimed to characterize some of the resident population of microorganisms, including both pathogenic and non-pathogenic antibiotic resistant species, in Confined Animal Feeding Units (CAFUs) using the Wetted Wall Cyclone system (WWC). Two poultry CAFUs were chosen from the Texas A&M University (TAMU) poultry facility to be used in this study. The study lasted for five days (Monday–Friday). The collected samples were analyzed for bacterial content using microbial plating, real-time Polymerase Chain Reaction (PCR), and Fatty Acid Methyl Ester (FAME) analysis to establish a trend in concentration levels and identify the most frequently occurring bacteria. Ambient temperature and relative humidity were also monitored.
2. Materials and Methods
2.1. Sample Locations
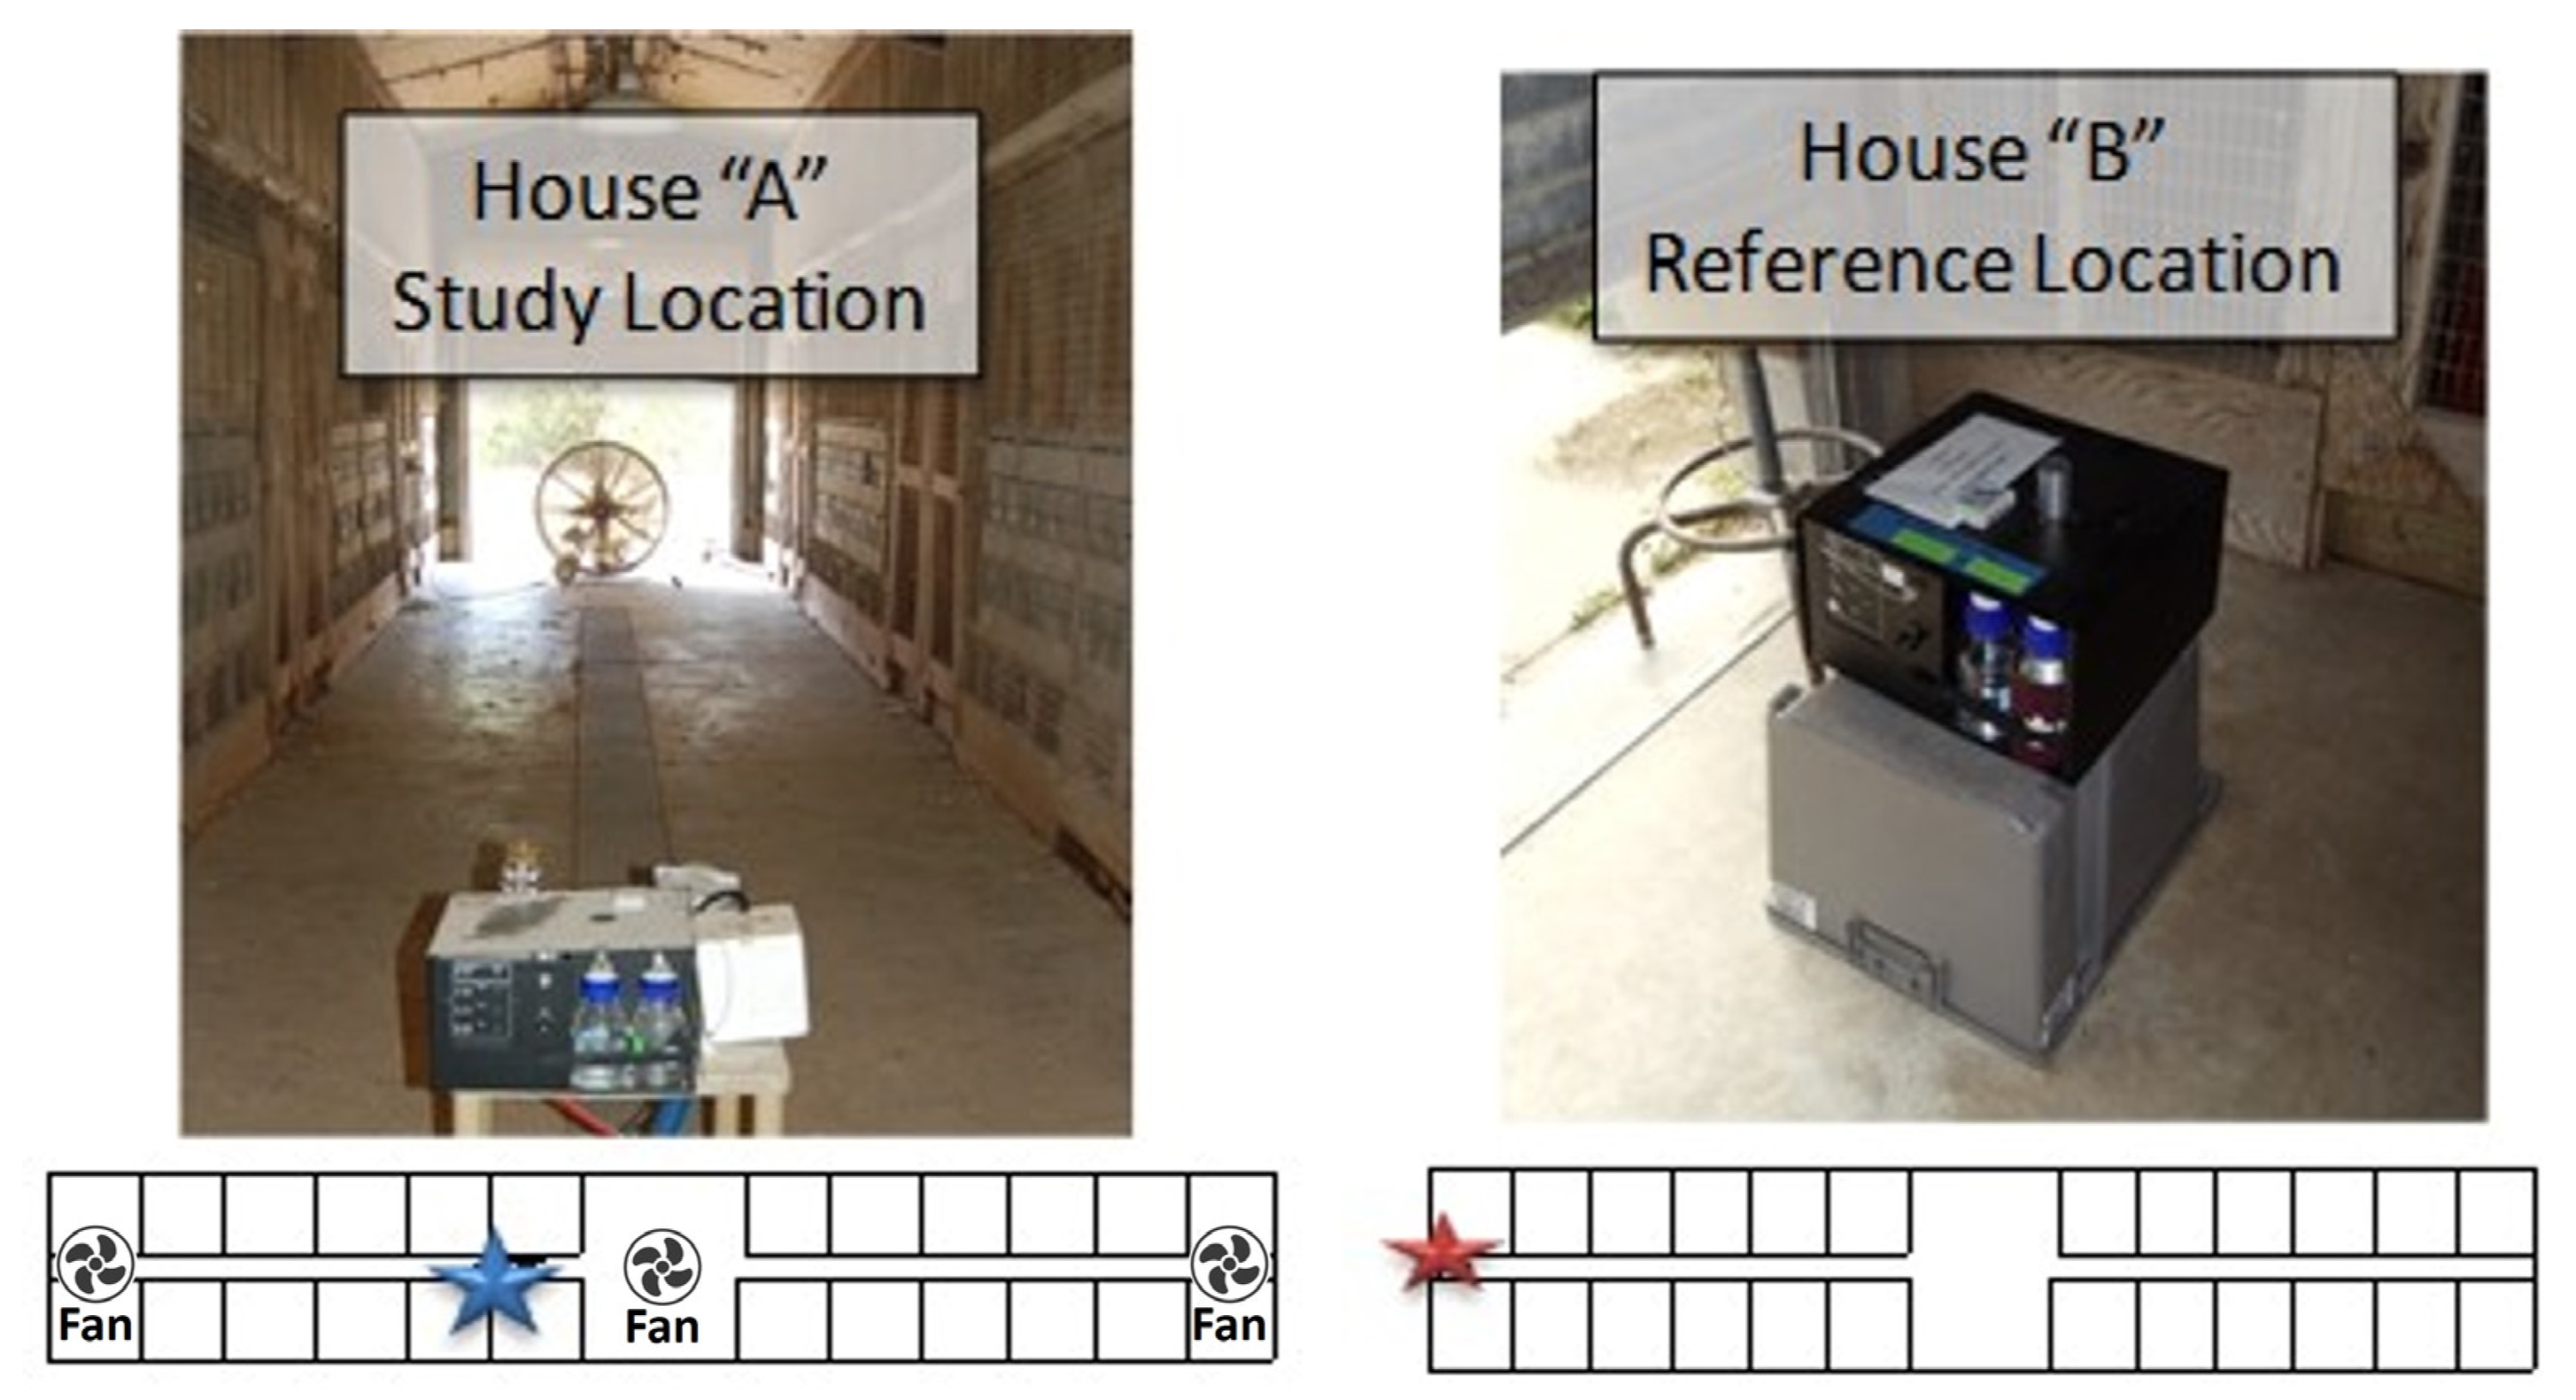
Two CAFU “houses” of similar age, maintenance, and physical condition were selected. The first “House A” was home to a flock of approximately 720 broiler chickens and roosters. The second “House B” was empty at the time of the study and served as a testing “Reference”. This was used as a reference because it had the same layout with litter in the pens and was open to ambient air. The only difference was the presence of chickens in House A allowing the study to determine how the presence of chickens affects the bioaerosol composition.
The houses both contained 24 pens, each 10 ft × 10 ft in size and were arranged equally on both sides of a central walkway. Each pen was open to the walkway and had a 10 ft × 3 ft opening to the outside environment. The central walkway has two large ceiling fans and three large portable drum fans (ULINE, 9000 CFM, 1/3 HP, Pleasant Prairie, WI, USA) at the two ends with one additional fan in the middle. The concrete floors were hosed once during the five-day testing period of 13–17 June (Figure 1).
The sampling location in House A was positioned a few feet from the main entrance of the central walkways. The Reference Sampler in House B was positioned in the open doorway with access to the indoor air as well as to ambient air (Figure 2) that would be most similar for both houses as the opening of House A is aligned with the collector in House B.
The sampling equipment used at the sampling location in House A consisted of a 100 L/min Wetted Wall Cyclone system [21]. As a collection liquid, 0.01% Tween-20 (VWR International, Radnor, PA, USA) was used at 200 µL/min inflow rate. The samples were collected in 50 mL Falcon tubes at 4 h intervals during the day and 16 h at night. As a Reference Sampler, 47 mm A/E Pall glass filters (Pall Corporation, Ann Arbor, MI, USA) were used at a flow rate of 100 L/min. The filters were immediately transported to the laboratory, where the collected material was resuspended in 5 mL of PBST (phosphate-buffered saline with 0.01% Triton, pH 7.4) (VWR International, Radnor, PA, USA).
The reference location in House B only had a 100 L/min Wetted Wall Cyclone system, which was operated in the same manner as at the study location in House A.
Samples were collected three times a day from both locations according to the following schedule: Morning samples were collected at 12:30 PM for a four-hour duration, Afternoon samples collected at 4:30 PM for a four-hour duration, and the Overnight sample were collected at 8:30 AM for a sixteen-hour duration. Continuous measurements of humidity and temperature were taken using HOBO Dataloggers (Onset, Bourne, MA, USA) during the collection of all bioaerosol samples, and the results were plotted to establish correlations between environmental conditions and bacterial concentrations.
All samples were transported directly to a biosafety level 2 (BSL2) laboratory for immediate analysis. The samples underwent three separate analysis methods: microbial plating, PCR, and FAME.
2.2. Plating and Analysis
Samples were amended with a supportive buffer, phosphate-buffered saline (PBS), before plating for appropriate dilutions. Researchers plated 100 µL of appropriate dilutions of the samples, which were plated on Tryptic Soy Agar (TSA) plates (Becton, Dickinson and Co., Sparks, MD, USA). The resulting colonies were counted and expressed as culturable colony forming units (CFU) after 18 h overnight incubation of the plates at 37 °C. There are limitations to culturability analysis using a bioaerosol collector because the only bacteria accounted for are those that are culturable. Only 1% of environmental bacteria collected in the environment maintain culturability [24], however recent studies indicate higher proportions across microbiome samples [25]. PCR was used to quantify the amount of bacteria in each sample whether culturable or non-culturable.
2.3. Quantitative Polymerase Chain Reaction (qPCR)
The PCR samples were also diluted and analyzed using universal 16S bacterial primers to quantify the total number of collected bacteria. The whole-cell quantitative PCR (qPCR) reaction mixture (10 µL total) contained the DNA template (3 µL of the collected samples), the forward and reverse primers (16S 1048 forward ‘5-GTGSTGCAYGGYTGTCGTCA’ and 1194 reverse ‘5-ACGTCRTCCMCACCTTCCTC’) (100 mM, 1 µL each), and Power SYBR Green PCR 2× Master Mix (5 µL, Life Technologies Ltd., Carlsbad, CA, USA) to amplify a 146 bp fragment [26]. Amplification and quantitation consisted of 15 min of denaturation at 95 °C, 40 cycles of annealing at 95 °C for 15 s, 60 °C for 60 s, and concluded with a holding temperature of 4 °C. For the standard curve, serial dilutions of fresh mid-log phase E. coli MG1655 bacteria (MG1655 (E. coli Genetic Resources at Yale CGSC, The Coli Genetic Stock Center, New Haven, NE, USA) with known colony forming units (CFUs) were used. Calculated total cell counts are expressed as Gene Copy Numbers (GCNs).
To quantify Campylobacter, the whole-cell quantitative PCR (qPCR) reaction mixture (10 µL total) contained the DNA template (3 µL of the collected samples), the forward and reverse primers (Cj oxidoreductase (oxred) forward 5′-CAA ATA AAG TTA GAG GTA GAA TGT and reverse 5′-GGA TAA GCA CTA GCT AGC TGA T) (100 mM, 1 µL each), and Power SYBR Green PCR 2× Master Mix (5 µL, Life Technologies Ltd.) to amplify a 160 bp fragment [27]. DNA was extracted from the samples using alkaline lysis [28].
To quantify Salmonella, the whole-cell quantitative PCR (qPCR) reaction mixture (10 µL total) contained the DNA template (3 µL of the collected samples), the forward and reverse primers (invA 139 forward ‘5-GTGAATTATCGCCACGTTCGGGCA A’ and invA 141 reverse ‘5TCATCGCACCGTCAAAGGAACC’) (100 mM, 1 µL each), and Power SYBR Green PCR 2× Master Mix (5 µL, Life Technologies Ltd.) to amplify a 284 bp fragment [29].
To quantify Staphylococcus, 3 targets were used, sea, seb and sec the whole-cell quantitative PCR (qPCR) reaction mixture (10 µL total) contained the DNA template (3 µL of the collected samples), the forward and reverse primers (sea forward ‘5- AAAGTGCCGATCAATTTATGGCTA’ and reverse ‘5- GTAATTAACCGAAGGTTCTGTAGA’) (100 mM, 1 µL each), and Power SYBR Green PCR 2× Master Mix (5 µL, Life Technologies Ltd.) to amplify a 219 bp fragment [30]. Secondly, the reaction mixture (10 µL total) contained the DNA template (3 µL of the collected samples), the forward and reverse primers (seb forward ‘5- TCGCATCAAACTGACAAACGA’ and reverse ‘5- CACTTTTTCTTTGTCGTAAGATAA’) (100 mM, 1 µL each), and Power SYBR Green PCR 2× Master Mix (5 µL, Life Technologies Ltd.) to amplify a 410 bp fragment [30]. Lastly, the reaction mixture (10 µL total) contained the DNA template (3 µL of the collected samples), the forward and reverse primers (sec forward ‘5- AACATTAGTGATAAAAAAGTGAAA’ and 1492 reverse ‘5- TTGTAAGTTCCCATTATCAAAGTG’) (100 mM, 1 µL each), and Power SYBR Green PCR 2× Master Mix (5 µL, Life Technologies Ltd.) to amplify a 234 bp fragment [30]. All primers were synthesized by Integrated DNA Technologies (IDTDNA Technologies, Coralville, IA, USA).
Amplification and quantitation consisted of 15 min of denaturation at 95 °C, 40 cycles of annealing at 95 °C for 15 s, 60 °C for 60 s, and concluded with a holding temperature of 4 °C. The primers specified were utilized for all bacteria (16S) and specific sequences to quantify species. The Cj oxred primer was used for Campylobacter, the invA primer was used to quantify Salmonella presence in samples and the sea, seb and sec primers were used to quantify Staphylococcus in samples.
2.4. Fatty Acid Methyl Ester (FAME) Analysis
Fatty acids were extracted from samples by adding methanol. The fatty acid methyl esters were then analyzed by high resolution fused-silica capillary gas chromatography. Lipids have a conserved formation in bacteria, but the fatty acid content will vary in different samples [31]. Samples were harvested while in the late log phase of growth after 24 h incubation on TSBA media (VWR International, Radnor, PA, USA). After harvesting samples, a saponification reagent (sodium hydroxide, methanol, and DI water) (VWR International, Radnor, PA, USA) was added and the hydrochloric acid for methylation. For extraction, methyl tert-butyl ether (MTBE) and hexane (VWR International, Radnor, PA, USA) were added, and finally saturated sodium chloride (VWR International, Radnor, PA, USA) was added to wash the sample. FAME analysis was conducted using the (Agilent, Santa Clara, CA, USA) H5890 series GC. The unit was operated at 28 °C to detect species [32].
2.5. Statistical Analysis
Statistical significance was calculated to compare House A and House B and compare House A samples collected by the WWC and Reference Sampler. Statistical analysis was completed by using various t-tests to determine statistical significance using RStudio (RStudio 2022.12.0 + 353, Posit, PBC, Boston, MA, USA). The first null hypothesis stated that the mean culturability of House A would equal the mean culturability of House B. The second null hypothesis stated that the mean culturability of House A collected using the WWC would equal the mean culturability of House A using the Reference Sampler.
3. Results
3.1. Bacterial CFU Counts
Based on the collected data, the concentrations of the aerosol bacteria within CAFU Study House A are highly dynamic on a daily/hourly level. Depending on the time and date of the collection, the samples show a range of 4000–60,000 CFU/m3 indoor bacterial concentrations. The raised levels presented mid-week were likely caused when workers hosed the floors of the facility (Figure 3, Figure 4 and Figure 5).
The reference samples collected at the entrance of the House B also contained high numbers of bioaerosols, albeit about a magnitude less bacteria compared to the indoor samples from Study House A (Figure 4). This is likely due to contamination from Study House A, where the drum fans and the open walls allowed the bioparticles to spread across the 20 m wide area that separates the two structures (Figure 1). There was a significant difference between the concentration of House A and House B aerosols and between House A samples collected using WWC as compared to the Reference Sampler using filters. The p-values were 0.01 and 0.003, respectively.
The results of FAME analysis identified the six different bacterial species showing significant fluctuations in the concentrations. The FAME analysis identified the six main isolates as Bacillus megaterium, Bacillus psychrosaccharolyticus, Staphylococcus hominis, Burkholderia cepacia GC subgroup B (Pseudomonas cepacia), Bacillus subtilis, and Micrococcus luteus. The highest concentration was found for the Bacillus type bacteria.
3.2. Bacterial DNA in Filter Samples
At the Study House A, a WWC system was collocated with a standard filter sampler and both systems were set to collect at the same flow rate of 100 L/min. However, the WWC samples yielded approximately an order of magnitude more amplifiable DNA to the PCR system. The contrast in PCR results could be indicative of the high level of viable cells offered by the WWC’s continuous flow operation versus the filter’s significantly lower yield of viable cells. These results are also very similar to the results gathered during the subterranean sampling where a filter sampler was also collocated with a WWC in a harsh environment. It is also important to note that the low performance of the filter may have been assisted by the harsh environment where the moist dust and organic particles collected on the filters could encase the bacteria and help maintain the viability (Figure 5).
Figure 5.
Comparison of the bacterial counts using whole cell qPCR (based on the 16S universal primers) between the WWC and glass fiber filter.
Figure 5.
Comparison of the bacterial counts using whole cell qPCR (based on the 16S universal primers) between the WWC and glass fiber filter.

It is important to note that the bacterial count data stated previously in this report are based on plate counts. The 16S Universal Primer based whole-cell qPCR data were not used because of outliers within the WWC dataset. The suspected cause of the outlier data is that the WWC samples required multiple dilution steps because they contained unexpectedly high concentrations of cells and dust. These additional dilution steps cumulatively added error to the analysis and reduced its accuracy. However, the general trend of the WWC’s PCR data is consistent with plating, and the filter-based PCR data are correlated with plating (Figure 6).
3.3. Identification of Pathogens
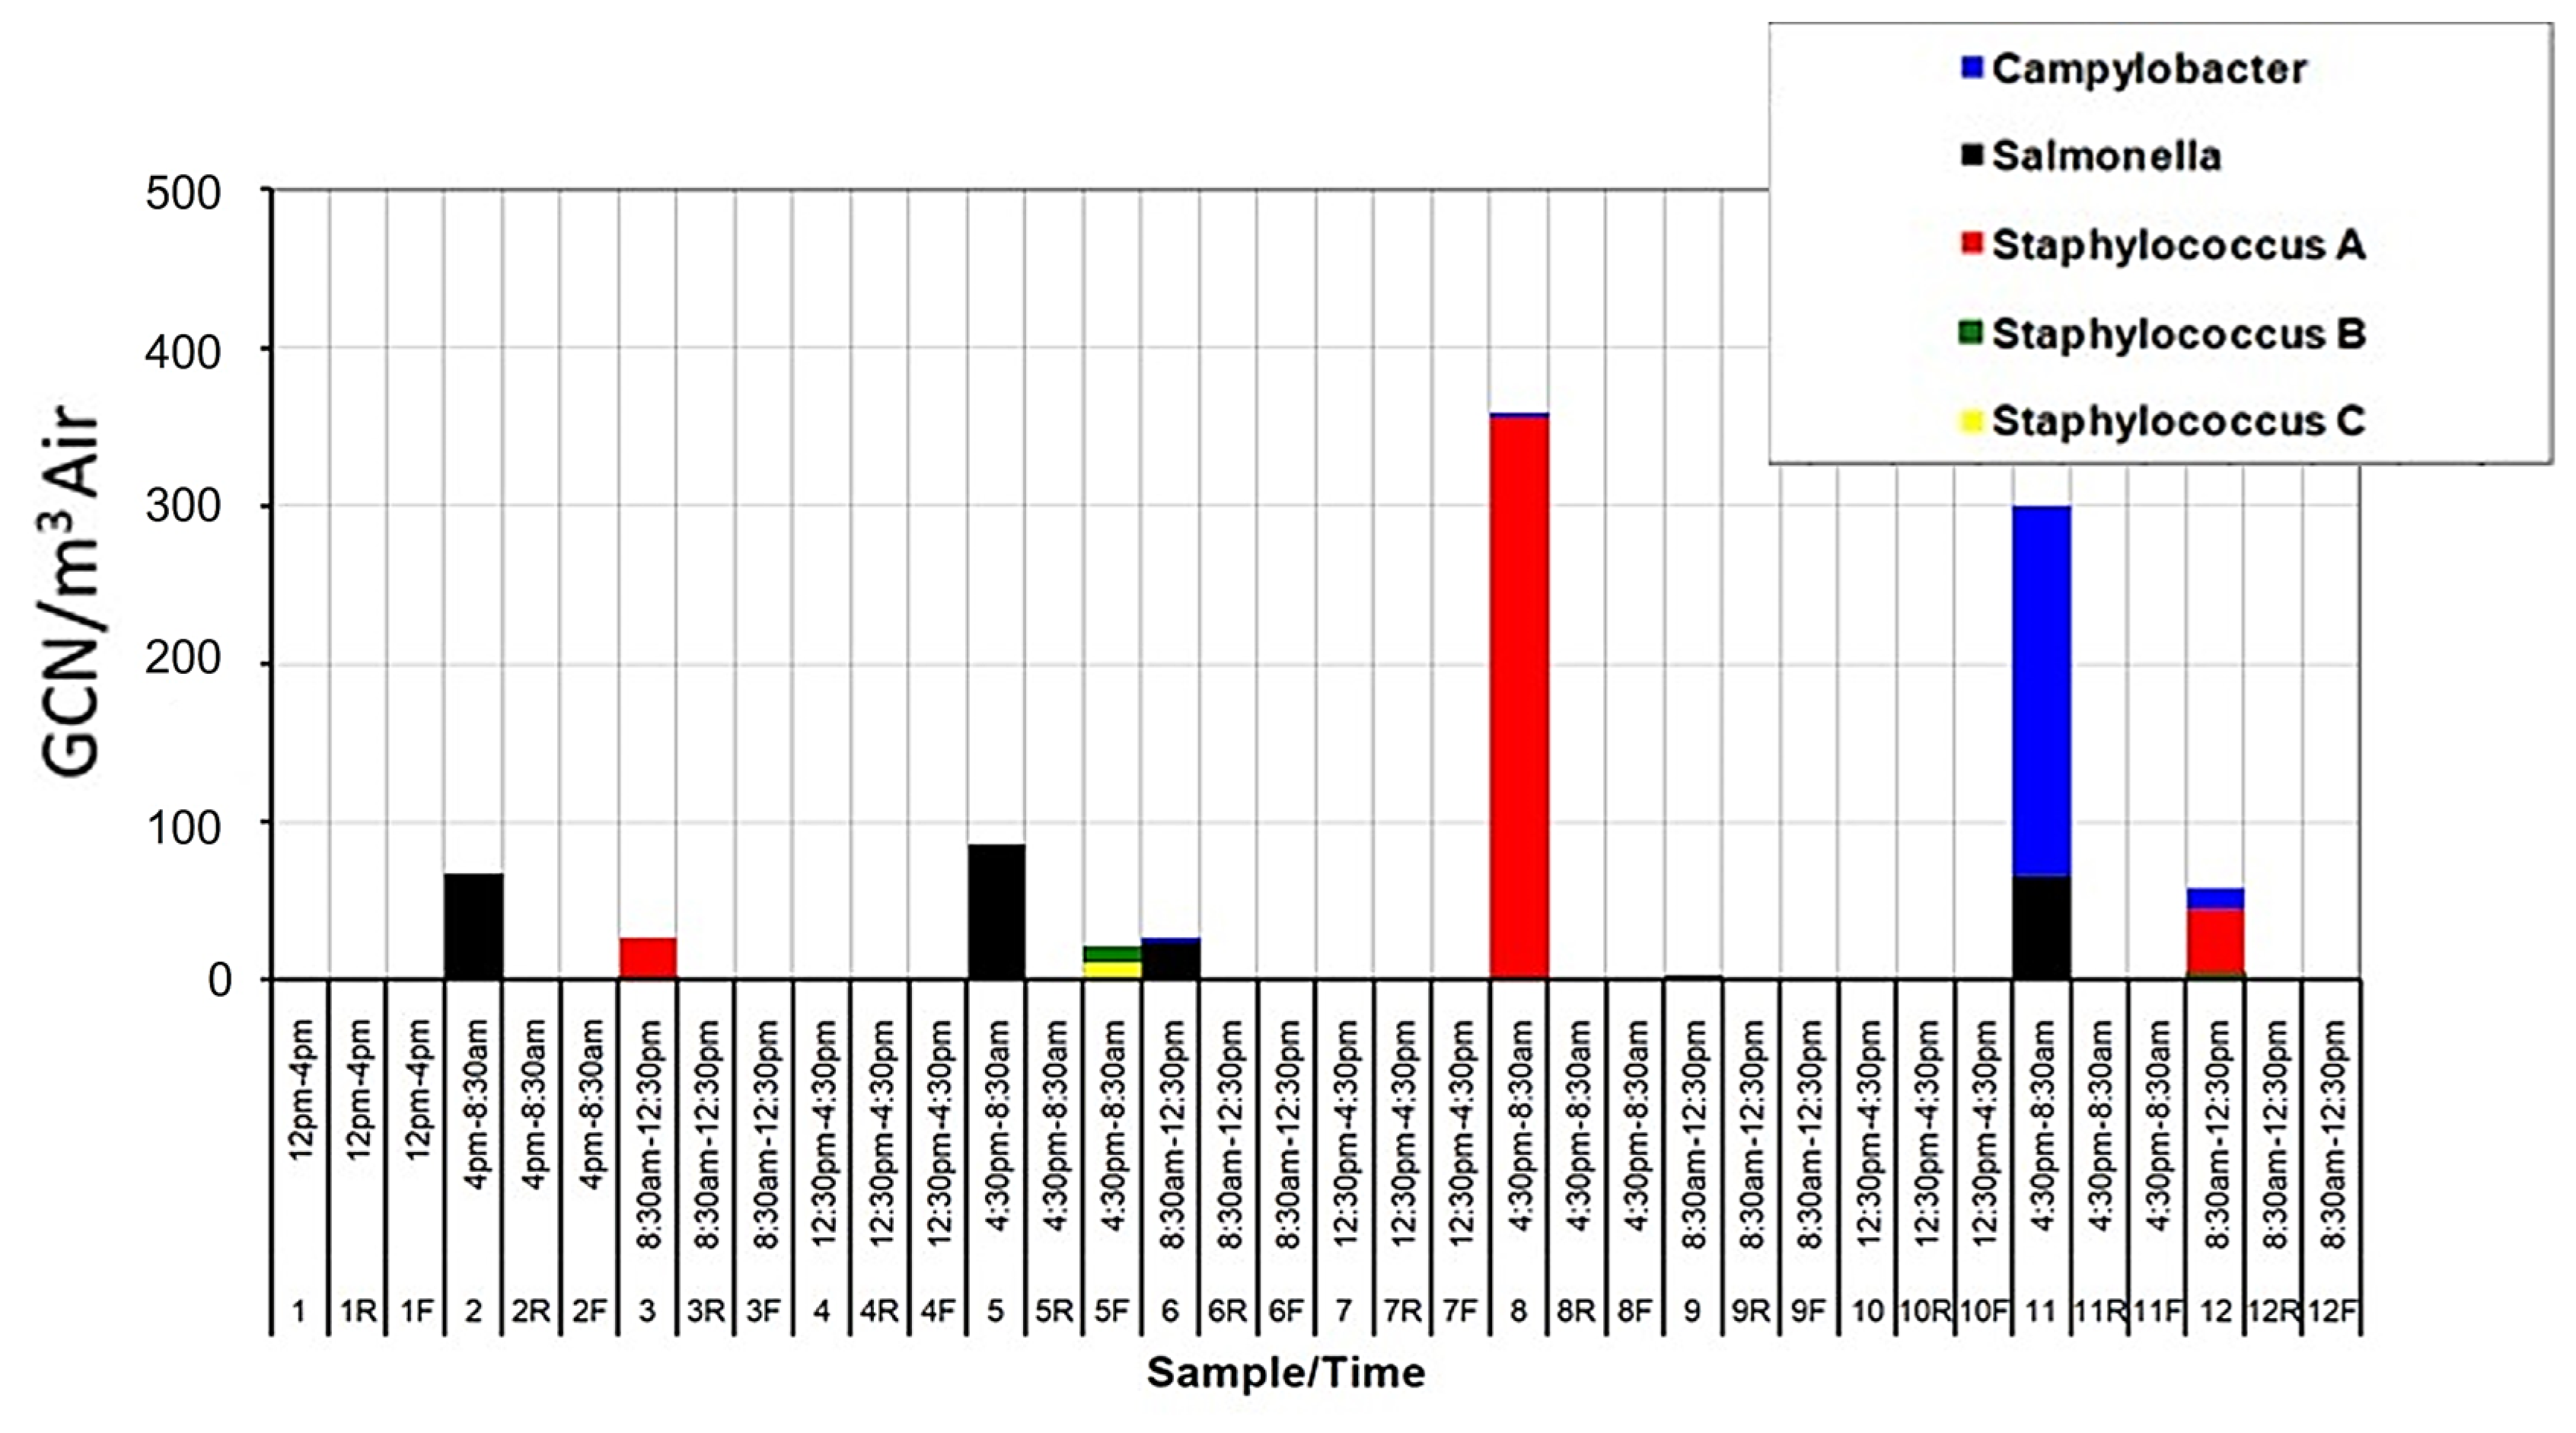
The results of the PCR analysis, which used primers specific for the pathogens Campylobacter jejuni, Salmonella enterica, and Staphylococcus aureus (sea, seb and sec sequences), indicated the presence of these organisms in significant concentrations (Figure 7). The highest bacterial concentrations (GCN/m3 air), including the potentially pathogenic strains, were found in the overnight samples. This could be due to keeping the animals in a confined space that allows pathogen shedding and spreading, or environmental factors more favorable to these organisms.
3.4. Bioaerosol Collection with the WWC in the CAFU Environment
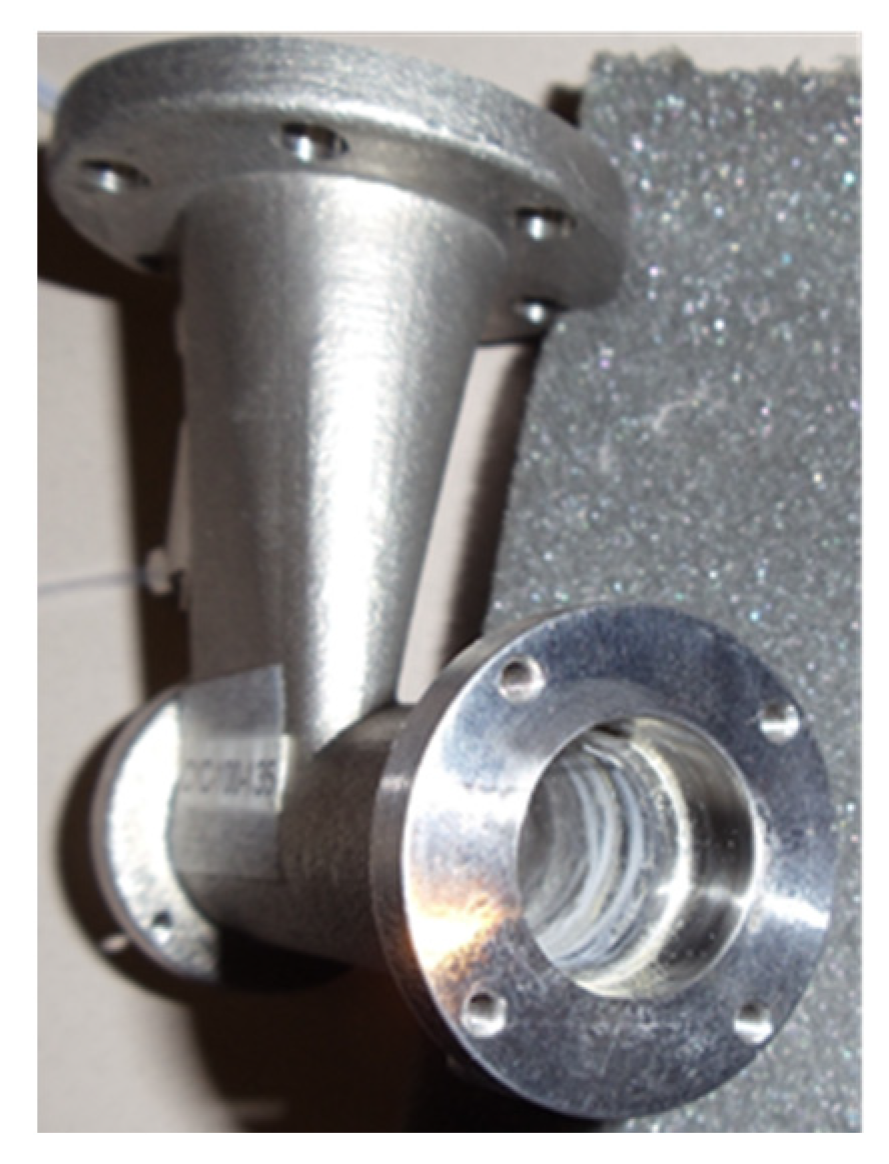
The WWC system that has previously been used to successfully collect bioaerosols in dusty environments sampled air continuously during the 5-day period without any signs of clogging, despite the high dust concentration that was also deposited on the inner walls of the stainless-steel cyclone (Figure 8).
Researchers have enabled the cyclones to handle larger amounts of dust by increasing the aspiration port diameters and replacing the liquid lines with wider tubes. The collectors have also been equipped with silencers to attenuate the blower noise that could affect the behavior of the flock, causing the upset animals to stir up more dust.
4. Discussion
The study yielded four key results: Firstly, the concentrations of microorganisms in the Confined Animal Feeding Units (CAFU), specifically in Study House A, exhibited a highly dynamic range, with levels ranging from as low as 4000 CFU/m3 to as high as 60,000 CFU/m3 when collected using the Wetted Wall Cyclone (WWC) system. Secondly, the WWC samples showed approximately an order of magnitude more bacterial DNA compared to the filter samples, indicating reduced bacterial DNA in the filter samples. Thirdly, the study detected significant concentrations of pathogens with known multi-drug resistance such as Salmonella, Staphylococcus, and Campylobacter in the poultry facility’s aerosol samples. This information is useful and can be applied to inform poultry facilities of efficient cleaning procedures, specifically decontaminating surfaces more often and in between shifts of workers to ensure that less pathogens, which are known to cause infection, become resuspended in the air. Lastly, the WWC system demonstrated effective functionality in the challenging sampling environment of the CAFU. This study will be built upon to sample upwind and downwind locations and analyze the difference in microbiomes.
Author Contributions
Conceptualization, M.D.K.; methodology, M.D.K.; software, M.D.K.; validation, M.D.K.; formal analysis, B.L.S. and M.D.K.; investigation, M.D.K.; resources, M.D.K.; data curation, M.D.K.; writing—original draft preparation, B.L.S. and M.D.K.; writing—review and editing, B.L.S.; visualization, M.D.K.; supervision, M.D.K.; project administration, M.D.K.; and funding acquisition, M.D.K. All authors have read and agreed to the published version of the manuscript.
Funding
This research was funded by the Hatch Program, USDA NIFA, grant number TEX09746.
Data Availability Statement
The data presented in this study are available from the corresponding author on request.
Acknowledgments
The authors thank Kevin Ong at the Texas Plant Disease Diagnostic Laboratory at Texas A&M University for the FAME analysis.
Conflicts of Interest
The authors declare no conflict of interest.
References
- Hsu, B.-M.; Chen, J.-S.; Hsu, G.-J.; Koner, S.; Nagarajan, V.; Tsai, H.-C. Role of Bioaerosols on the Short-Distance Transmission of Multidrug-Resistant Methicillin-Resistant Staphylococcus aureus (MRSA) in a Chicken Farm Environment. Antibiotics 2022, 11, 81. [Google Scholar] [CrossRef] [PubMed]
- Xu, X.; Zhou, W.; Xie, C.; Zhu, Y.; Tang, W.; Zhou, X.; Xiao, H. Airborne bacterial communities in the poultry farm and their relevance with environmental factors and antibiotic resistance genes. Sci. Total. Environ. 2022, 846, 157420. [Google Scholar] [CrossRef]
- Du, L.; Yang, L.; Yang, C.; Dominy, R.; Hu, C.; Du, H.; Li, Q.; Yu, C.; Xie, L.; Jiang, X. Investigation of bio-aerosol dispersion in a tunnel-ventilated poultry house. Comput. Electron. Agric. 2019, 167, 105043. [Google Scholar] [CrossRef]
- Sun, X.; Li, D.; Li, B.; Sun, S.; Yabo, S.D.; Geng, J.; Ma, L.; Qi, H. Exploring the disparity of inhalable bacterial communities and antibiotic resistance genes between hazy days and non-hazy days in a cold megacity in Northeast China. J. Hazard. Mater. 2020, 398, 122984. [Google Scholar] [CrossRef] [PubMed]
- Chen, G.; Ma, D.; Huang, Q.; Tang, W.; Wei, M.; Li, Y.; Jiang, L.; Zhu, H.; Yu, X.; Zheng, W.; et al. Aerosol Concentrations and Fungal Communities within Broiler Houses in Different Broiler Growth Stages in Summer. Front. Vet. Sci. 2021, 8, 775502. [Google Scholar] [CrossRef] [PubMed]
- Ramos, G.E.; Pak, H.; Gerlich, R.; Jantrania, A.; Smith, B.L.; King, M.D. Aerosol partitioning potential of bacteria presenting antimicrobial resistance from different stages of a small decentralized septic treatment system. Aerosol Sci. Technol. 2023, 57, 517–531. [Google Scholar] [CrossRef]
- Liu, H.; Zhang, X.; Zhang, H.; Yao, X.; Zhou, M.; Wang, J.; He, Z.; Zhang, H.; Lou, L.; Mao, W.; et al. Effect of air pollution on the total bacteria and pathogenic bacteria in different sizes of particulate matter. Environ. Pollut. 2018, 233, 483–493. [Google Scholar] [CrossRef] [PubMed]
- Nazaroff, W.W. Indoor bioaerosol dynamics. Indoor Air 2014, 26, 61–78. [Google Scholar] [CrossRef] [Green Version]
- Wei, D.-J.; Liu, W.-T.; Chin, H.-T.; Lin, C.-H.; Chen, I.-C.; Chang, Y.-T. An Investigation of Airborne Bioaerosols and Endotoxins Present in Indoor Traditional Wet Markets before and after Operation in Taiwan: A Case Study. Int. J. Environ. Res. Public Health 2021, 18, 2945. [Google Scholar] [CrossRef] [PubMed]
- Centers for Disease Control and Prevention. Information about Psittacosis for Employers and Employees at Poultry Slaughter Plants. Centers for Disease Control and Prevention. Available online: https://www.cdc.gov/pneumonia/atypical/psittacosis/surveillance-reporting/outbreaks/poultry-slaughter-plants-factsheet.html (accessed on 22 March 2022).
- Kasaeinasab, A.; Jahangiri, M.; Karimi, A.; Tabatabaei, H.R.; Safari, S. Respiratory Disorders Among Workers in Slaughterhouses. Saf. Health Work. 2017, 8, 84–88. [Google Scholar] [CrossRef] [PubMed] [Green Version]
- Hartung, J.; Schulz, J. Risks Caused by Bio-Aerosols in Poultry Houses. In Proceedings of the International Conference: Poultry in the 21st Century, Avian Influenza and Beyond, Bangkok, Thailand, 5–7 November 2007. [Google Scholar]
- Younis, F.; Salem, E. Respiratory health disorders associated with occupational exposure to bioaerosols among workers in poultry breeding farms. Environ. Sci. Pollut. Res. 2020, 27, 19869–19876. [Google Scholar] [CrossRef] [PubMed]
- Guo, Y.; Song, G.; Sun, M.; Wang, J.; Wang, Y. Prevalence and Therapies of Antibiotic-Resistance in Staphylococcus aureus. Front. Cell Infect. Microbiol. 2020, 10, 107. [Google Scholar] [CrossRef] [PubMed] [Green Version]
- Johler, S.; Sihto, H.-M.; Macori, G.; Stephan, R. Sequence Variability in Staphylococcal Enterotoxin Genes seb, sec, and sed. Toxins 2016, 8, 169. [Google Scholar] [CrossRef] [PubMed] [Green Version]
- Nair, D.V.T.; Venkitanarayanan, K.; Kollanoor Johny, A. Antibiotic-Resistant Salmonella in the Food Supply and the Potential Role of Antibiotic Alternatives for Control. Foods 2018, 7, 167. [Google Scholar] [CrossRef] [PubMed] [Green Version]
- Worrall, L.J.; Vuckovic, M.; Strynadka, N.C.J. Crystal structure of the C-terminal domain of the Salmonella type III secretion system export apparatus protein InvA. Protein Sci. 2010, 19, 1091–1096. [Google Scholar] [CrossRef] [Green Version]
- Portes, A.B.; Panzenhagen, P.; dos Santos, A.M.P.; Junior, C.A.C. Antibiotic Resistance in Campylobacter: A Systematic Review of South American Isolates. Antibiotics 2023, 12, 548. [Google Scholar] [CrossRef] [PubMed]
- Whitehouse, C.A.; Zhao, S.; Tate, H. Antimicrobial Resistance in Campylobacter Species: Mechanisms and Genomic Epidemiology. Adv. Appl. Microbiol. 2018, 103, 1–47. [Google Scholar] [CrossRef]
- McFarland, A.R.; Haglund, J.S.; King, M.D.; Hu, S.; Phull, M.S.; Moncla, B.W.; Seo, Y. Wetted Wall Cyclones for Bioaerosol Sampling. Aerosol Sci. Technol. 2010, 44, 241–252. [Google Scholar] [CrossRef]
- King, M.D.; McFarland, A.R. Bioaerosol Sampling with a Wetted Wall Cyclone: Cell Culturability and DNA Integrity of Escherichia coli Bacteria. Aerosol Sci. Technol. 2012, 46, 82–93. [Google Scholar] [CrossRef]
- Kirthi, P.S.; Kanchana, S.N.P. Isolation and Identification of Bacterial Strains with Fatty Acid Methyl Ester (FAME) Analysis. Asian J. Biol. Life Sci. 2021, 10, 197–201. [Google Scholar] [CrossRef]
- Sekora, N.S.; Lawrence, K.S.; Agudelo, P.; Van Santen, E.; McInroy, J.A. Using FAME analysis to compare, differentiate, and identify multiple nematode species. J. Nematol. 2009, 41, 163–173. [Google Scholar]
- Torsvik, V.; Øvreås, L. Microbial diversity and function in soil: From genes to ecosystems. Curr. Opin. Microbiol. 2002, 5, 240–245. [Google Scholar] [CrossRef] [PubMed]
- Martiny, A.C. High proportions of bacteria are culturable across major biomes. ISME J. 2019, 13, 2125–2128. [Google Scholar] [CrossRef] [PubMed]
- Maeda, H.; Fujimoto, C.; Haruki, Y.; Maeda, T.; Kokeguchi, S.; Petelin, M.; Arai, H.; Tanimoto, I.; Nishimura, F.; Takashiba, S. Quantitative real-time PCR using TaqMan and SYBR green for Actinobacillus actinomycetemcomitans, Porphyromonas gingivalis, Prevotella intermedia, tetQ gene and total bacteria. FEMS Immunol. Med. Microbiol. 2003, 39, 81–86. [Google Scholar] [CrossRef] [Green Version]
- Nayak, R.; Stewart, T.M.; Nawaz, M.S. PCR identification of Campylobacter coli and Campylobacter jejuni by partial sequencing of virulence genes. Mol. Cell Probes 2005, 19, 187–193. [Google Scholar] [CrossRef] [PubMed]
- Zhou, C.; Yang, Y.; Jong, A.Y. Mini-prep in ten minutes. Biotechniques 1990, 8, 172–173. [Google Scholar] [PubMed]
- Rahn, K.; De Grandis, S.A.; Clarke, R.C.; Galán, J.E.; Ginocchio, C.; Curtis, I.I.I.R.; Gyles, C.L. Amplification of an invA sequence of Salmonella typhimurium by polymerase chain reaction as a specific method of detection of Salmonella. Mol. Cell Probes 1992, 6, 271–279. [Google Scholar] [CrossRef] [PubMed]
- Chiang, Y.-C.; Chang, L.-T.; Lin, C.-W.; Yang, C.-Y.; Tsen, H.-Y. PCR primers for the detection of staphylococcal enterotoxins K, L, and M and survey of staphylococcal enterotoxin types in Staphylococcus aureus isolates from food poisoning cases in Taiwan. J. Food Prot. 2006, 69, 1072–1079. [Google Scholar] [CrossRef]
- Kennedy, A.C. Carbon Utilization and Fatty Acid Profiles for Characterization of Bacteria. In Methods of Soil Analysis. Part 2 Microbiological and Biochemical Properties; Weaver, R., Angle, J.S., Eds.; Soil Science Society of America: Madison, WI, USA, 1994; pp. 543–554. [Google Scholar]
- Sherlock. Microbial Identification System Version (6.2); MIDI, Inc.: Newark, DE, USA, 2012. [Google Scholar]
Figure 1.
The layout of the two poultry Houses “A” occupied; “B” unoccupied at the TAMU Operated Poultry CAFU Facility. The location of the sampling devices is indicated by a blue (House A) or red (House B) star; the location of the three standing floor fans in House A is indicated by symbols.
Figure 1.
The layout of the two poultry Houses “A” occupied; “B” unoccupied at the TAMU Operated Poultry CAFU Facility. The location of the sampling devices is indicated by a blue (House A) or red (House B) star; the location of the three standing floor fans in House A is indicated by symbols.

Figure 2.
Location of the two samplers within Houses “A” and “B”. The location of the sampling devices is indicated by a blue (House A) or red (House B) star; the location of the three standing floor fans in House A is indicated by symbols.
Figure 2.
Location of the two samplers within Houses “A” and “B”. The location of the sampling devices is indicated by a blue (House A) or red (House B) star; the location of the three standing floor fans in House A is indicated by symbols.

Figure 3.
Sampling results of Study House A showing a highly dynamic range of bacterial concentrations as well as an order of magnitude increase in bacterial concentration from the filter collection to the WWC sampling (location indicated by a blue star). The Morning sample was collected at 12:30 PM for a four-h duration, Afternoon sample was collected at 4:30 PM for a four-h duration, and the Overnight sample was collected at 8:30 AM for a sixteen-h duration.

Figure 4.
Sampling results of Reference House B showing a dynamic range of bacterial concentrations likely caused by contamination from House A, which is 20 m to the north. Sampling location is indicated by a red star. The Morning sample was collected at 12:30 PM for a four-h duration, Afternoon sample was collected at 4:30 PM for a four-h duration, and the Overnight sample was collected at 8:30 AM for a sixteen-h duration.

Figure 6.
Plating counts for WWC and filter versus the whole cell qPCR (based on the 16S universal primers). PCR data for WWC are erratic likely due to sample preparation steps required to process heavily loaded samples, yet the general trend of the WWC’s PCR data is consistent with plating, and the filter-based PCR data are strongly correlated with plating. The Morning sample was collected at 12:30 PM for a four-h duration, Afternoon sample was collected at 4:30 PM for a four-h duration, and the Overnight sample was collected at 8:30 AM for a sixteen-h duration.

Figure 7.
GCN/m3 results using microorganism-specific primers. These microorganisms were chosen for their pathogenic and opportunistic nature. Samples 1–12 indicate the WWC collections in House A, 1R–12R the WWC collections in House B and 1F–12F the filter collections in House A.
Figure 7.
GCN/m3 results using microorganism-specific primers. These microorganisms were chosen for their pathogenic and opportunistic nature. Samples 1–12 indicate the WWC collections in House A, 1R–12R the WWC collections in House B and 1F–12F the filter collections in House A.

Figure 8.
Dust accumulated inside the cyclone, behind the skimmer region. The dust particles deposited by the path of the swirling collection liquid.
Figure 8.
Dust accumulated inside the cyclone, behind the skimmer region. The dust particles deposited by the path of the swirling collection liquid.

Disclaimer/Publisher’s Note: The statements, opinions and data contained in all publications are solely those of the individual author(s) and contributor(s) and not of MDPI and/or the editor(s). MDPI and/or the editor(s) disclaim responsibility for any injury to people or property resulting from any ideas, methods, instructions or products referred to in the content. |
© 2023 by the authors. Licensee MDPI, Basel, Switzerland. This article is an open access article distributed under the terms and conditions of the Creative Commons Attribution (CC BY) license (https://creativecommons.org/licenses/by/4.0/).
Share and Cite
MDPI and ACS Style
Smith, B.L.; King, M.D. Sampling and Characterization of Bioaerosols in Poultry Houses. Microorganisms 2023, 11, 2068. https://0-doi-org.brum.beds.ac.uk/10.3390/microorganisms11082068
AMA Style
Smith BL, King MD. Sampling and Characterization of Bioaerosols in Poultry Houses. Microorganisms. 2023; 11(8):2068. https://0-doi-org.brum.beds.ac.uk/10.3390/microorganisms11082068
Chicago/Turabian StyleSmith, Brooke L., and Maria D. King. 2023. "Sampling and Characterization of Bioaerosols in Poultry Houses" Microorganisms 11, no. 8: 2068. https://0-doi-org.brum.beds.ac.uk/10.3390/microorganisms11082068
Note that from the first issue of 2016, this journal uses article numbers instead of page numbers. See further details here.