Article

Biochar Suppresses Bacterial Wilt of Tomato by Improving Soil Chemical Properties and Shifting Soil Microbial Community

1
College of Natural Resources and Environment, South China Agricultural University, Guangzhou 510642, China
2
Key Laboratory of Tropical Agricultural Environment in South China, Ministry of Agriculture, Guangzhou 510642, China
3
Tea Research Institute, Guangdong Academy of Agricultural Sciences, Guangzhou 510640, China
*
Author to whom correspondence should be addressed.
Submission received: 21 October 2019 / Revised: 22 November 2019 / Accepted: 7 December 2019 / Published: 10 December 2019
(This article belongs to the Special Issue Plant Microbial Interactions)

Abstract

:
The role of biochar amendments in enhancing plant disease resistance has been well documented, but its mechanism is not yet fully understood. In the present study, 2% biochar made from wheat straw was added to the soil of tomato infected by Ralstonia solanacearum to explore the interrelation among biochar, tomato bacterial wilt resistance, soil chemical properties, and soil microbial community and to decipher the disease suppression mechanisms from a soil microbial perspective. Biochar application significantly reduced the disease severity of bacterial wilt, increased soil total organic carbon, total nitrogen, C:N ratio, organic matter, available P, available K, pH, and electrical conductivity. Biochar treatment also increased soil acid phosphatase activity under the non-R.-solanacearum-inoculated condition. High-throughput sequencing of 16S rRNA revealed substantial differences in rhizosphere bacterial community structures between biochar-amended and nonamended treatments. Biochar did not influence soil microbial richness and diversity but significantly increased the relative abundance of Bacteroidetes and Proteobacteria in soil at the phylum level under R. solanacearum inoculation. Furthermore, biochar amendment harbored a higher abundance of Chitinophaga, Flavitalea, Adhaeribacter, Pontibacter, Pedobacter, and Ohtaekwangia at the genus level of Bacteroides and Pseudomonas at the genus level of Proteobacteria under R. solanacearum inoculation. Our findings suggest that a biochar-shifted soil bacterial community structure can favorably contribute to the resistance of tomato plants against bacterial wilt.

1. Introduction

Bacterial wilt, caused by Ralstonia solanacearum, is a bacterial soilborne disease that is commonly observed among Solanaceous crops [1]. This disease is likely to occur under high temperatures and humid conditions and can persist for a long time [2]. The traditional methods for controlling bacterial wilt mainly focus on resistant species, biological control, chemical control, and soil anaerobic disinfection [3,4,5]. However, these methods may have limited or negative effects on food safety and the environment. Therefore, more effective and ecofriendly approaches need to be developed to control this disease.
Biochar is a refractory and highly aromatized carbonaceous solid that is produced by the high-temperature slow pyrolysis (usually <700 °C) of biological residues in the absence of oxygen [6]. Biochar has several major constituents, including hydrogen and oxygen, and is especially rich in carbon (about 70–80%) [7]. Many studies have shown that biochar can improve soil fertility [8,9,10], affect the physical and chemical properties of soil [11,12], and increase the soil adsorption of heavy metal ions [13,14]. Biochar also plays an important role in enhancing the disease resistance of plants [15,16]. Previous studies found that biochar amendments could promote the systemic resistance of strawberry plants against Botrytis cinerea, Colletotrichum acutatum, and Podosphaera apahanis [17] as well as reduce foliar disease in tomatoes and green peppers caused by B. cinerea and Oidiopsis sicula [18]. Applying biochar could also alleviate the plant diseases caused by soilborne pathogens [19,20,21] and significantly reduce the incidence of Fusarium wilt in tomato [22], as well as bacterial wilt in both tomato [23] and tobacco [24].
Evidence shows that biochar suppresses pathogens mainly by promoting the systemic resistance of plants, improving soil and plant nutrition, regulating soil microflora, and adsorbing and detoxifying chemicals [17,25,26,27,28,29]. Some reports revealed that biochar control soilborne diseases by stimulating the growth of beneficial microorganisms [30,31]. However, the effects of biochar on plant disease may vary with different biochar feedstocks, application dose, soil type, and disease types [15,20,26]. The potential mechanisms of biochar in enhancing plant resistance from a microbial perspective are not fully understood [15].
Crop residues are one of the major source materials for producing biochar by pyrolysis. Our previous study revealed that wheat and peanut biochar has a significant role in enhancing tomato resistance against bacterial wilt, and wheat biochar showed better effects [32]. In this study, we further investigated the effects of wheat biochar application on soil chemical properties and enzymatic activity. Illumina MiSeq was performed to identify the impacts of biochar on soil microbial communities under R. solanacearum infection and to decipher the possible mechanisms of biochar-mediated bacterial wilt resistance of tomato.

2. Materials and Methods

2.1. Biochar and Soil Characteristics

Wheat biochar (produced by Shangqiu Sanli New Energy Co., Ltd., Shangqiu, China) was used in the present study. The characteristics of wheat biochar are as follows: pH 10.0, total C 47%, total N 1%, ash content 48%, available P 325 mg·kg−1, available K 3820 mg·kg−1, and C:N ratio 47.
The soil used in this study was sandy loam (Eutric Cambisol) collected from a field in Zhucun Village, Zengcheng City, Guangdong, China. The chemical properties of the soil are as follows: 16.3 g·kg−1 soil organic matter (SOM), 116 mg·kg−1 available N, 151 mg·kg−1 available P, 83 mg·kg−1 available K, 0.9 g·kg−1 total N, 1.3 g·kg−1 total P, 29 g·kg−1 total K, pH 5.9, and 9.8 C:N ratio.

2.2. Plant Growth and R. Solanacearum Culture

Tomato plants (cv. Taiwan red cherry, produced by Kefeng Seed Co., Ltd., Changchun, China) susceptible to R. solanacearum were used in the experiment. Tomato seeds were stored in a refrigerator at 4 °C and immersed in water at room temperature for 2 h before use. Afterwards, the seeds were surface sterilized in water at 50 °C for 15 min and were placed on moist filter paper in Petri dishes. After 2 days, the germinated seeds were transferred in nursery soil (disinfected at 150 °C for 4 h) in a growth chamber with 14 h light exposure (light intensity 200 μmol·m−2·s−1) at 30 °C/25 °C (day/night). After 2 weeks, the tomato plants were transplanted to polyethylene plastic pots (170 × 165 mm) filled with 2 kg of soil. Each pot had two tomato plants that were maintained at 28 °C in a greenhouse for 3 weeks until the end of the experiment.
A moderate pathogenic R. solanacearum strain RsH (race biovar 3, provided by the College of Horticulture, South China Agricultural University, Guangzhou 510642, China) was used in the experiment. R. solanacearum was cultured in LB media at 30 °C for 48 h, harvested from agar plates via sterile water flushing, and adjusted to OD600 = 0.06 (approximately 108 CFU mL−1) as a bacterial inoculum suspension [33]. At the sixth leaf stage of the tomato plants, 50 mL of bacterial inoculum suspension was poured into each pot over the soil surface.

2.3. Experiment Design

There were four treatments in the experiment, including CK (no biochar and no R. solanacearum inoculation), Rs (R. solanacearum inoculation without biochar amendment), BC (2% wheat straw biochar addition without R. solanacearum inoculation), and Rs + BC (2% wheat straw biochar addition and R. solanacearum inoculation). The experiment was arranged in a completely randomized design with three replications. The experiment was conducted twice with 10 plants for each biological replicate for disease severity analysis (representative data from a single experiment for analysis). When the sixth leaf of the tomato plant appeared, the roots of each tomato plant were lightly stabbed and inoculated with R. solanacearum by pouring 10 mL of the bacterial suspension into each pot. The roots of the non-inoculated tomato plants in CK were also stabbed with the same volume of deionized water as control.

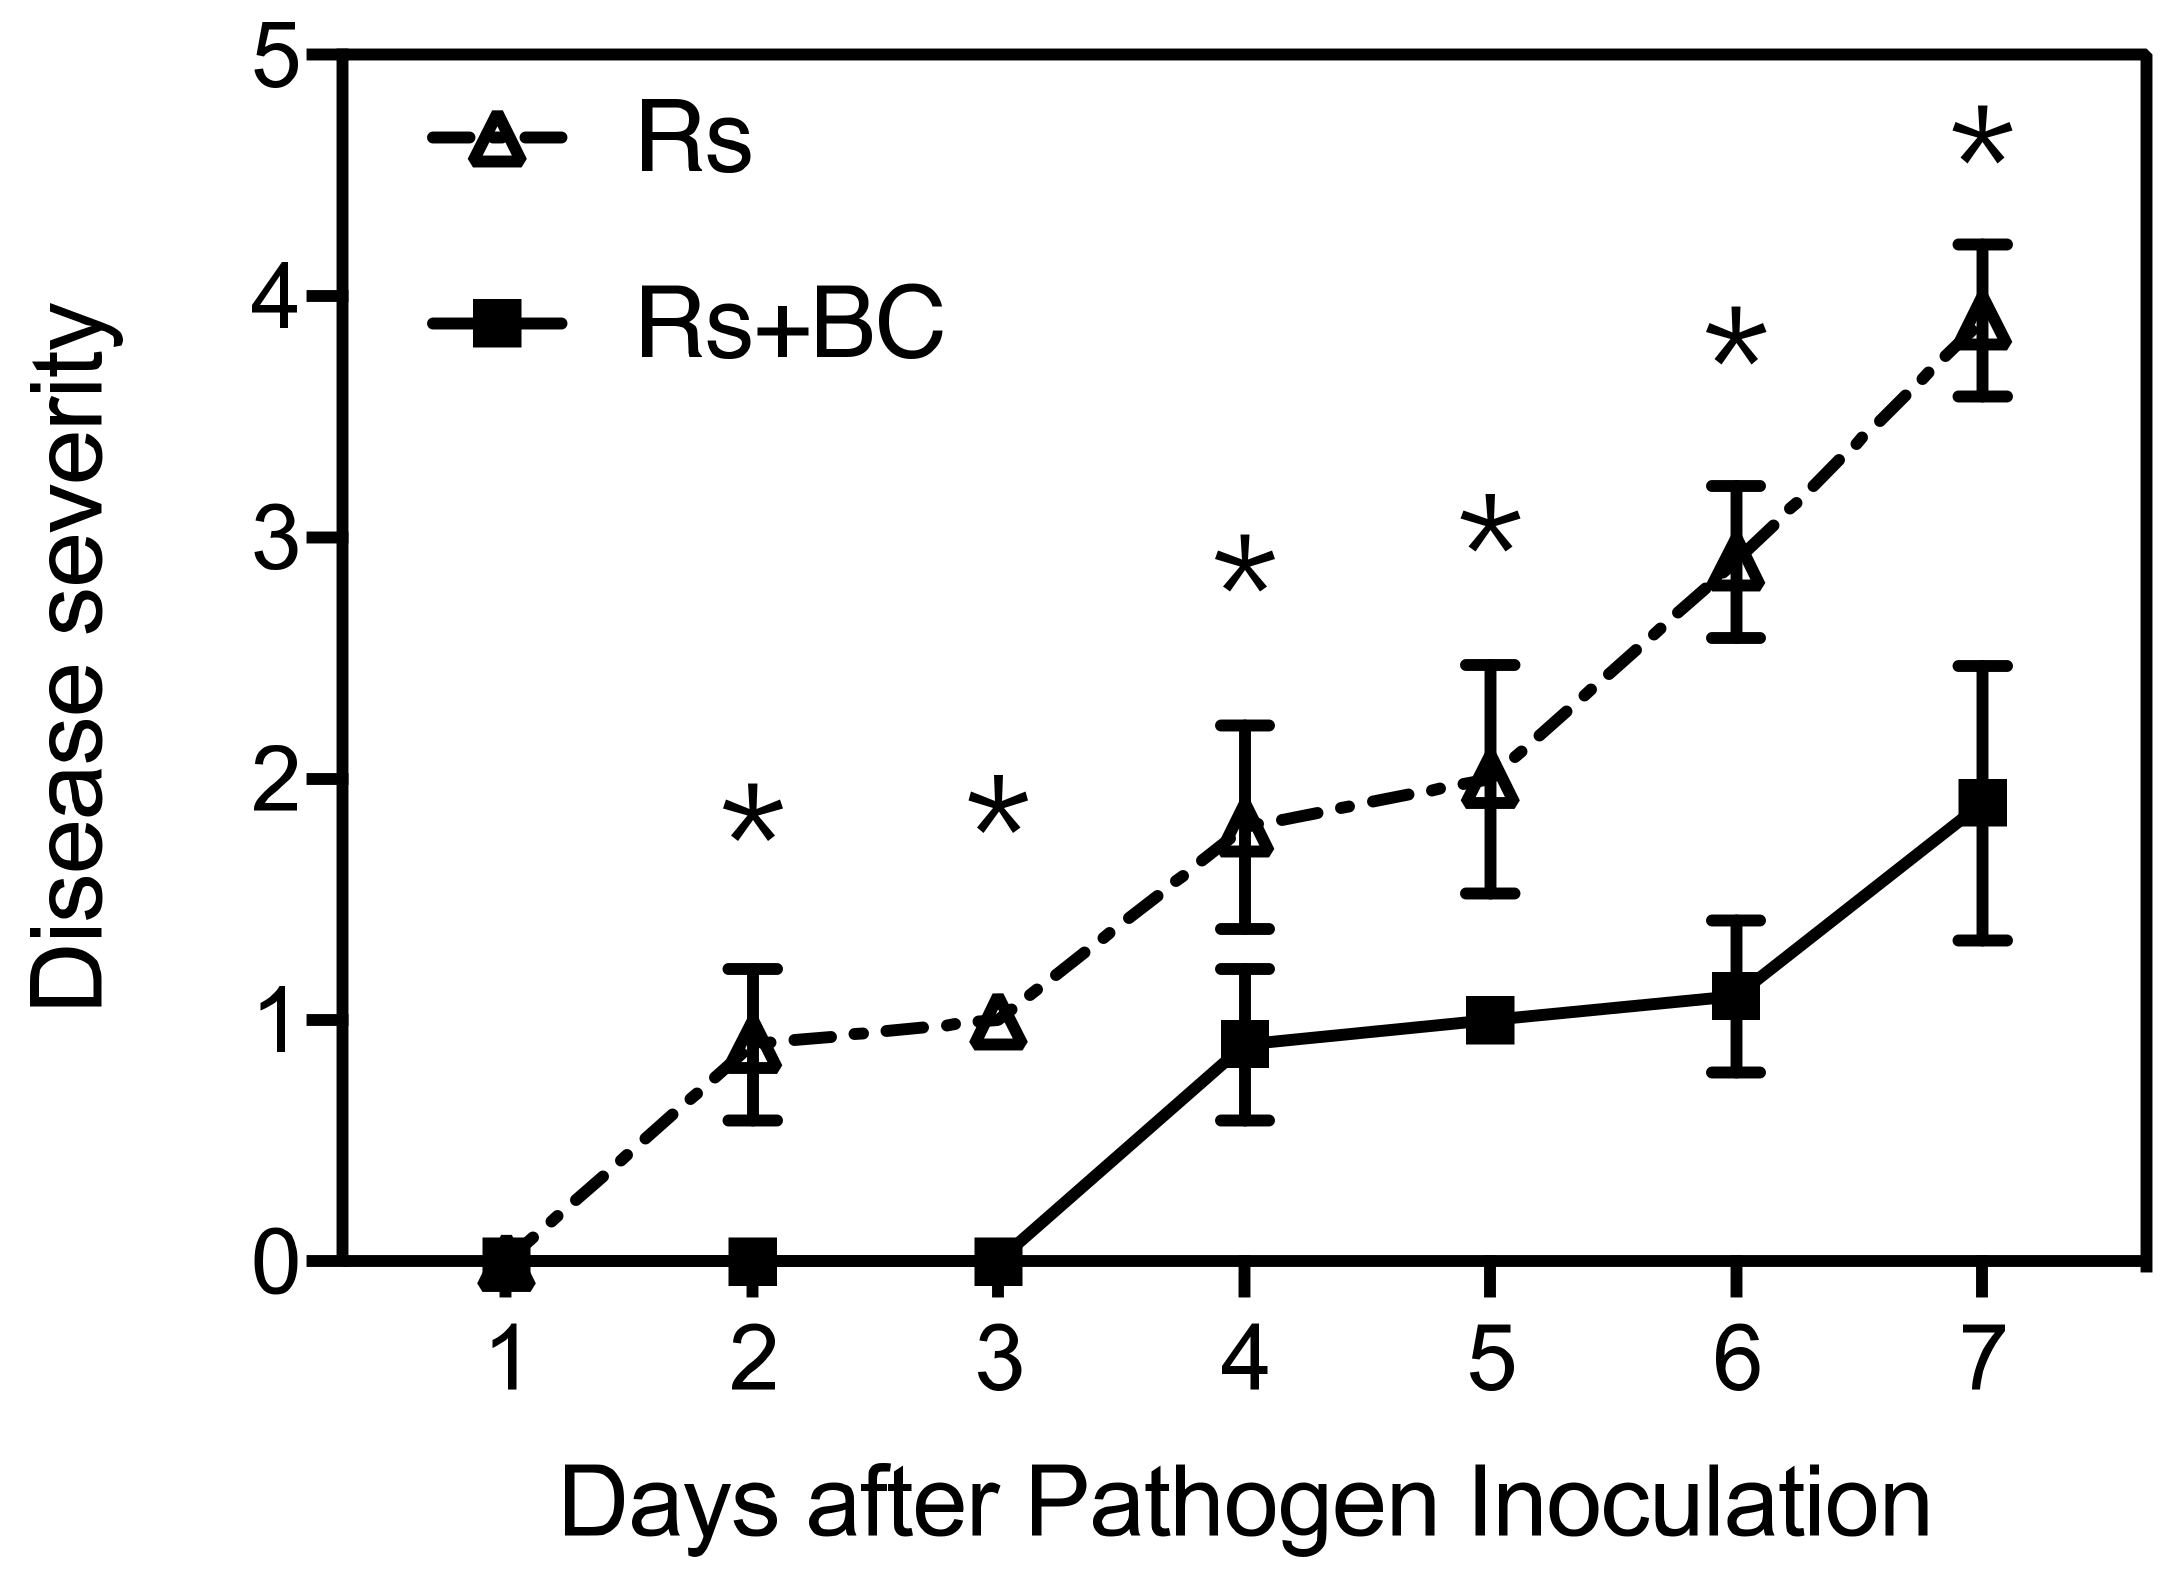
2.4. Disease Severity Survey

Before collecting soil samples, disease severity was determined for these two pathogen-inoculated treatments (Rs, Rs + BC) based on the methods described by Fang [34]: (0) no or slight illness of the plant; (1) wilting of less than 25% of the plant; (2) wilting of about 26–50% of the plant; (3) wilting of about 51–75% of the plant (systemic wilting); (4) wilting of about 75–100% of the plant (systemic wilting); (5) plant death.

2.5. Soil Sampling and Analysis

Soil samples of different treatments were collected from all pots in a replicate at the end of the experiment (7 days after the R. solanacearum inoculation). Bulk soil was collected from each pot in the same treatment and composited into one bag, then divided into two parts; one was air-dried for chemical analysis, and another was stored at 4 °C for assessment of soil enzymes. The rhizosphere soil samples of different treatments were collected and transported in ice chests to the laboratory immediately for DNA extraction for soil microbial community analysis.
Soil pH was measured by adding 25 mL of deionized water to 10 g of soil using a pH meter (PHB-3, SANXIN, Shanghai, China). EC (µS·cm−1) was determined with a microprocessor conductivity meter (DDS-307, YUEPING, Shanghai, China) by taking soil and distilled water (w/v) in a 1:5 ratio. Total organic carbon (TOC), total nitrogen (TN), and C:N ratio (C/N) were analyzed using an automated TOC analyzer (Vario TOC, Elementar, Langenselbold, Germany). Soil organic matter was analyzed by using a K2Cr2O7-H2SO4 solution with FeSO4 titration [35]. Alkali-hydrolyzable N was determined with 1.0 M NaOH extraction according to Lu [36] as the indicator of N availability. Available P was extracted by 0.5 M NaHCO3 solution following the method of Olsen [37]. Available K was extracted by 1 M NH4OAc (pH 7) solution and analyzed using an atomic absorption spectrophotometer (novAA350, Analytik Jena, Jena, Germany).
The method described by Zantua and Bremner [38] was used for urease activity measurement with urea solution as a substrate; determination of the ammonium released by urease activity when soil is incubated with tris (hydroxymethyl) aminomethane (THAM) buffer, urea solution, and toluene at 37 °C for 2 h; and assayed colorimetrically at 578 nm (TU-1901, PERSEE, Beijing, China). Acid phosphatase was determined according to the method described by Tabatabai and Bremner [39], which involves colorimetric estimation at 400 nm of the p-nitrophenol released by phosphatase activity when soil is incubated with buffered (pH 6.5) sodium p-nitrophenyl phosphate solution and toluene at 37 °C for 1 h (TU-1901, PERSEE, Beijing, China). Catalase activity was assessed by monitoring the decrease caused by H2O2 consumption and using its molar extinction coefficient (ε = 36 M−1 cm−1) in the absorbance at 240 nm (TU-1901, PERSEE, Beijing, China) following the Havir and McHale [40] method.

2.6. Soil DNA Extraction, PCR Amplification, and Illumina MiSeq Sequencing

Soil DNA was extracted from 0.5 g of fresh soil by using the FastDNA® Spin Kit for Soil (MP Biomedicals, Irvine, CA, USA) according to the manufacturer’s instructions. The extracted products were then stored at −20 °C. To exhibit few biases against different bacterial taxa, a set of bacterial primers—515F (5′-GTGCCAGCMGCCGCGGTAA-3′) and 806R (5′-GGACTACHVGGGTWTCTAAT-3′) [41]—were selected to amplify the hypervariable V4 regions of 16S rRNA. The length of the amplified fragment was approximately 256 bp. PCR reactions were performed in triplicate in a final volume of 30 μL mixture containing 0.75 units of Ex Taq DNA polymerase (TaKaRa, Dalian, China), 1 × Ex Taq loading buffer (TaKaRa, Dalian, China), 0.2 mM dNTP mix (TaKaRa, Dalian, China), 0.2 µM of each primer, and 100 ng template DNA. The PCR products were extracted from a 2% agarose gel, mixed in equimolar, and further purified by using a gel extraction kit. The PCR conditions were as follows: 3 min at 95 °C, followed by 35 cycles of 94 °C for 30 s, 1 min at 50 °C, 1 min at 72 °C, and 10 min at 72 °C.
The PCR products of the soil samples were sequenced based on Illumina MiSeq paired end (PE) 300 bp. The following data denoising procedure was performed: the quality of the original data was controlled by using a homemade Perl script for the denoising procedure. The sequence reads had an average quality score less than 20 and read length less than 200 bp, and ambiguous bases and long stretches of homopolymers (more than 7 bp) were removed from the dataset. After reversing the barcode sequence, the double-stranded sequence was spliced by using Mothur to obtain the complete 16S rRNA gene V4 region sequence. Based on the barcode sequence for each sample on its PCR primers (806R), sequences were clustered and assigned to operational taxonomic units (OTUs) using the QIIME implementation of cd-hit with a threshold of 97% pairwise identity [42]. Representative OTUs were subsequently classified using the Green Gene database [43]. The rarefaction curves were created based on the Shannon diversity index and Sobs to compare the relative levels of OTU richness across all soil samples. For alpha diversity, the Chao1 index and ACE were calculated to characterize the richness (i.e., the number) of phenotypes of microbial communities in the soil samples [44]. Shannon and Simpson indices were used to estimate the diversity of the microbial communities in each soil sample [45]. As shown in the OTU table, we used the Jest method to calculate the matrix of the two distances of the microbial community structure of the sample, and, based on this matrix, we performed a Principal Coordinates Analysis (PCoA) to explore the differences in these community structures across different treatments. The samples were analyzed by using the unweighted group mean method. Based on the abundance of species, the number of minimum sample reads was calculated by using the Jest method to calculate the distance matrix of samples, and sample clustering was performed by using the approximately maximum likelihood phylogenetic trees constructed by FastTree.

2.7. Statistical Analysis

All data were plotted and calculated using Excel 2013 and entered into the SPSS 17.0 (SPSS, Chicago, IL, USA) statistical software for the one-way ANOVA. Significant differences among treatments (p < 0.05) were determined by Tukey’s multiple range test and Student’s t-test. The sample distance matrix was calculated by the Jest method, and PCoAs were performed using Unifrac. Chao1, ACE, Simpson and Shannon’s index was performed with Mothur (version 1.22.2). The correlation of soil chemical properties and soil bacterial community was based on the Pearson correlation coefficients. Redundancy analysis was performed, and a Monte Carlo permutation test (499 permutations) was used to test the significance of the first and second axes. RDA was performed using CANOCO 5.0 software.

3. Results

3.1. Disease Severity of Bacterial Wilt

Wheat biochar application significantly reduced bacterial wilt severity and increased tomato resistance (Figure 1). Compared with non-biochar treatment (Rs), biochar treatment (Rs + BC) delayed disease development by 2 days, the level of disease severity was less than 2 (wilting of about 26–50% of the plant) through the whole pathogen infection process, and no dead plant was observed in biochar-treated plants. However, most plants wilted entirely at 7 days post inoculation in non-biochar treatment.

3.2. Effects of Biochar on Soil Chemical Properties

Biochar amendment significantly increased soil TOC, TN, C/N, SOM, pH, and electrical conductivity (EC), regardless of R. solanacearum (Table 1). TOC, TN, C/N, SOM, pH, and EC in biochar-treated soil were changed by 1.53-, 1.26-, 1.51-, 1.53-, 1.10-, and 3.45-fold, respectively, for non-R.-solanacearum inoculation (BC) compared with CK, and 1.44-, 1.13-, 1.45-, 1.46-, 1.10-, and 3.29-fold, respectively, for R. solanacearum inoculation (Rs + BC) compared with Rs.
Biochar amendment significantly increased soil available P and K regardless of R. solanacearum and increased available N under R. solanacearum inoculation (Table 2). Especially, biochar increased available P and K by 1.07- and 4.04-fold for non-R.-solanacearum inoculation (BC), respectively, compared with CK. Biochar also increased available soil N, P, and K by 1.41-, 1.06-, and 4.99-fold for R. solanacearum inoculation (Rs + BC), respectively, compared with Rs.

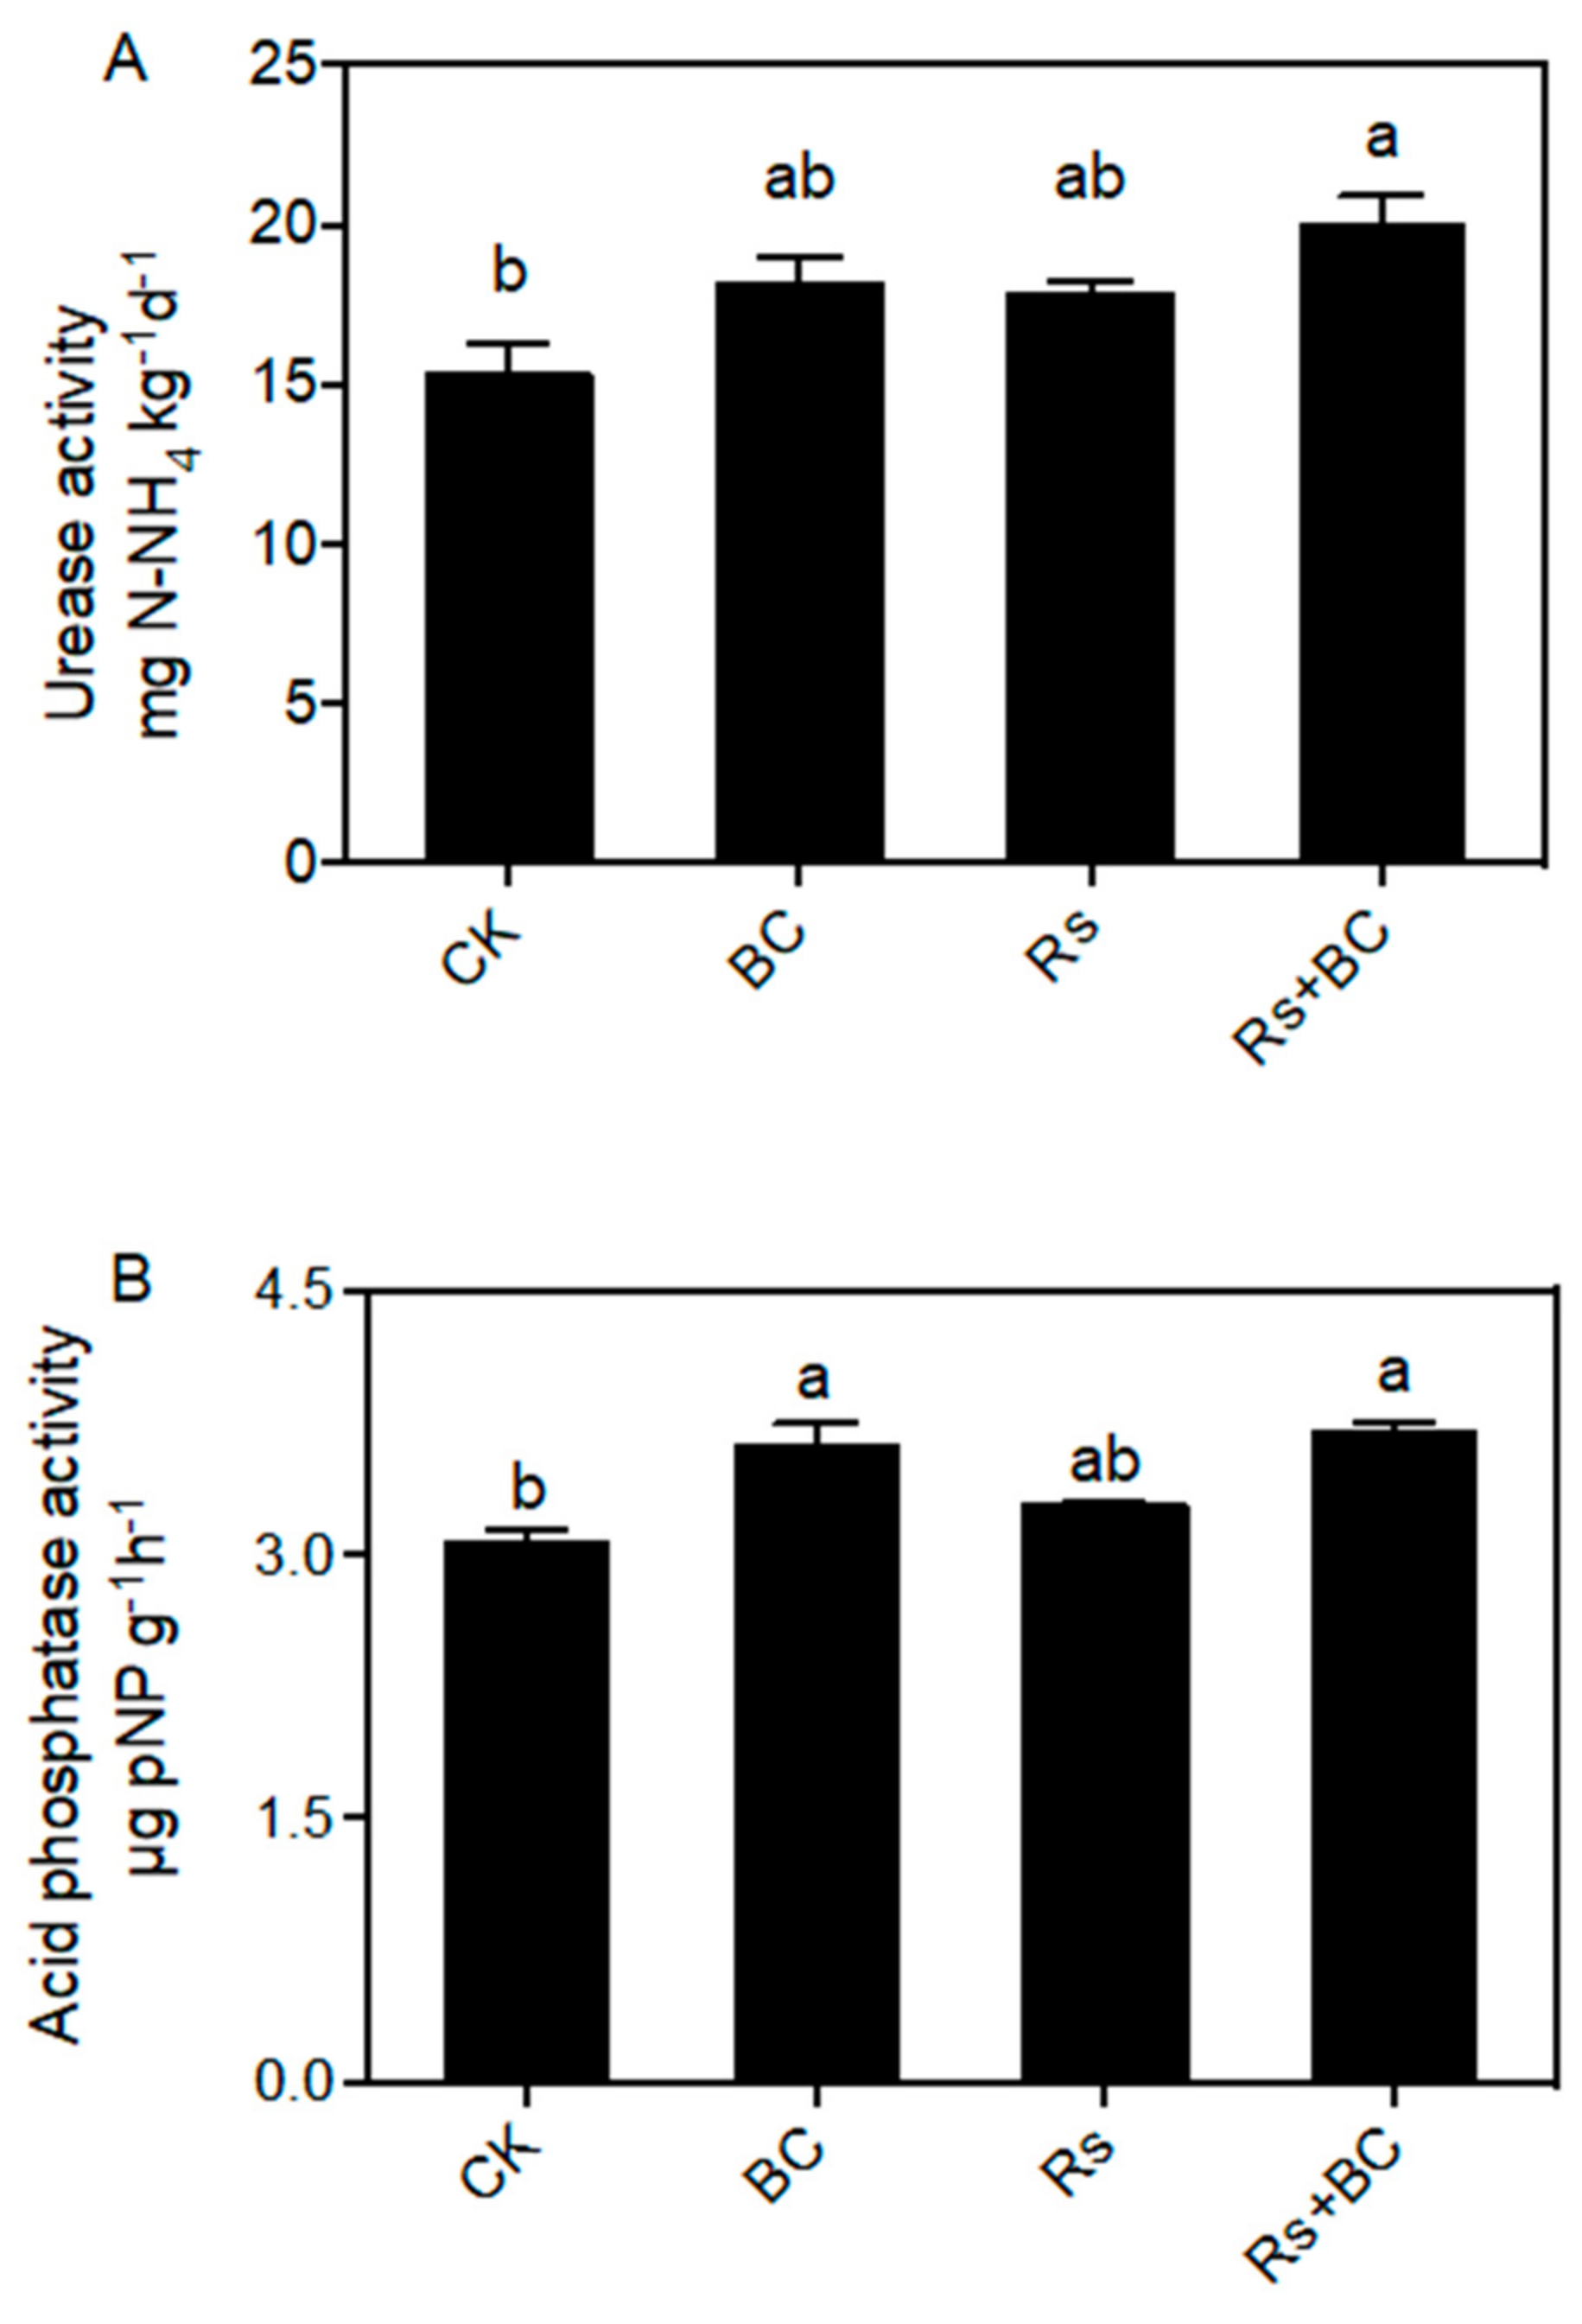
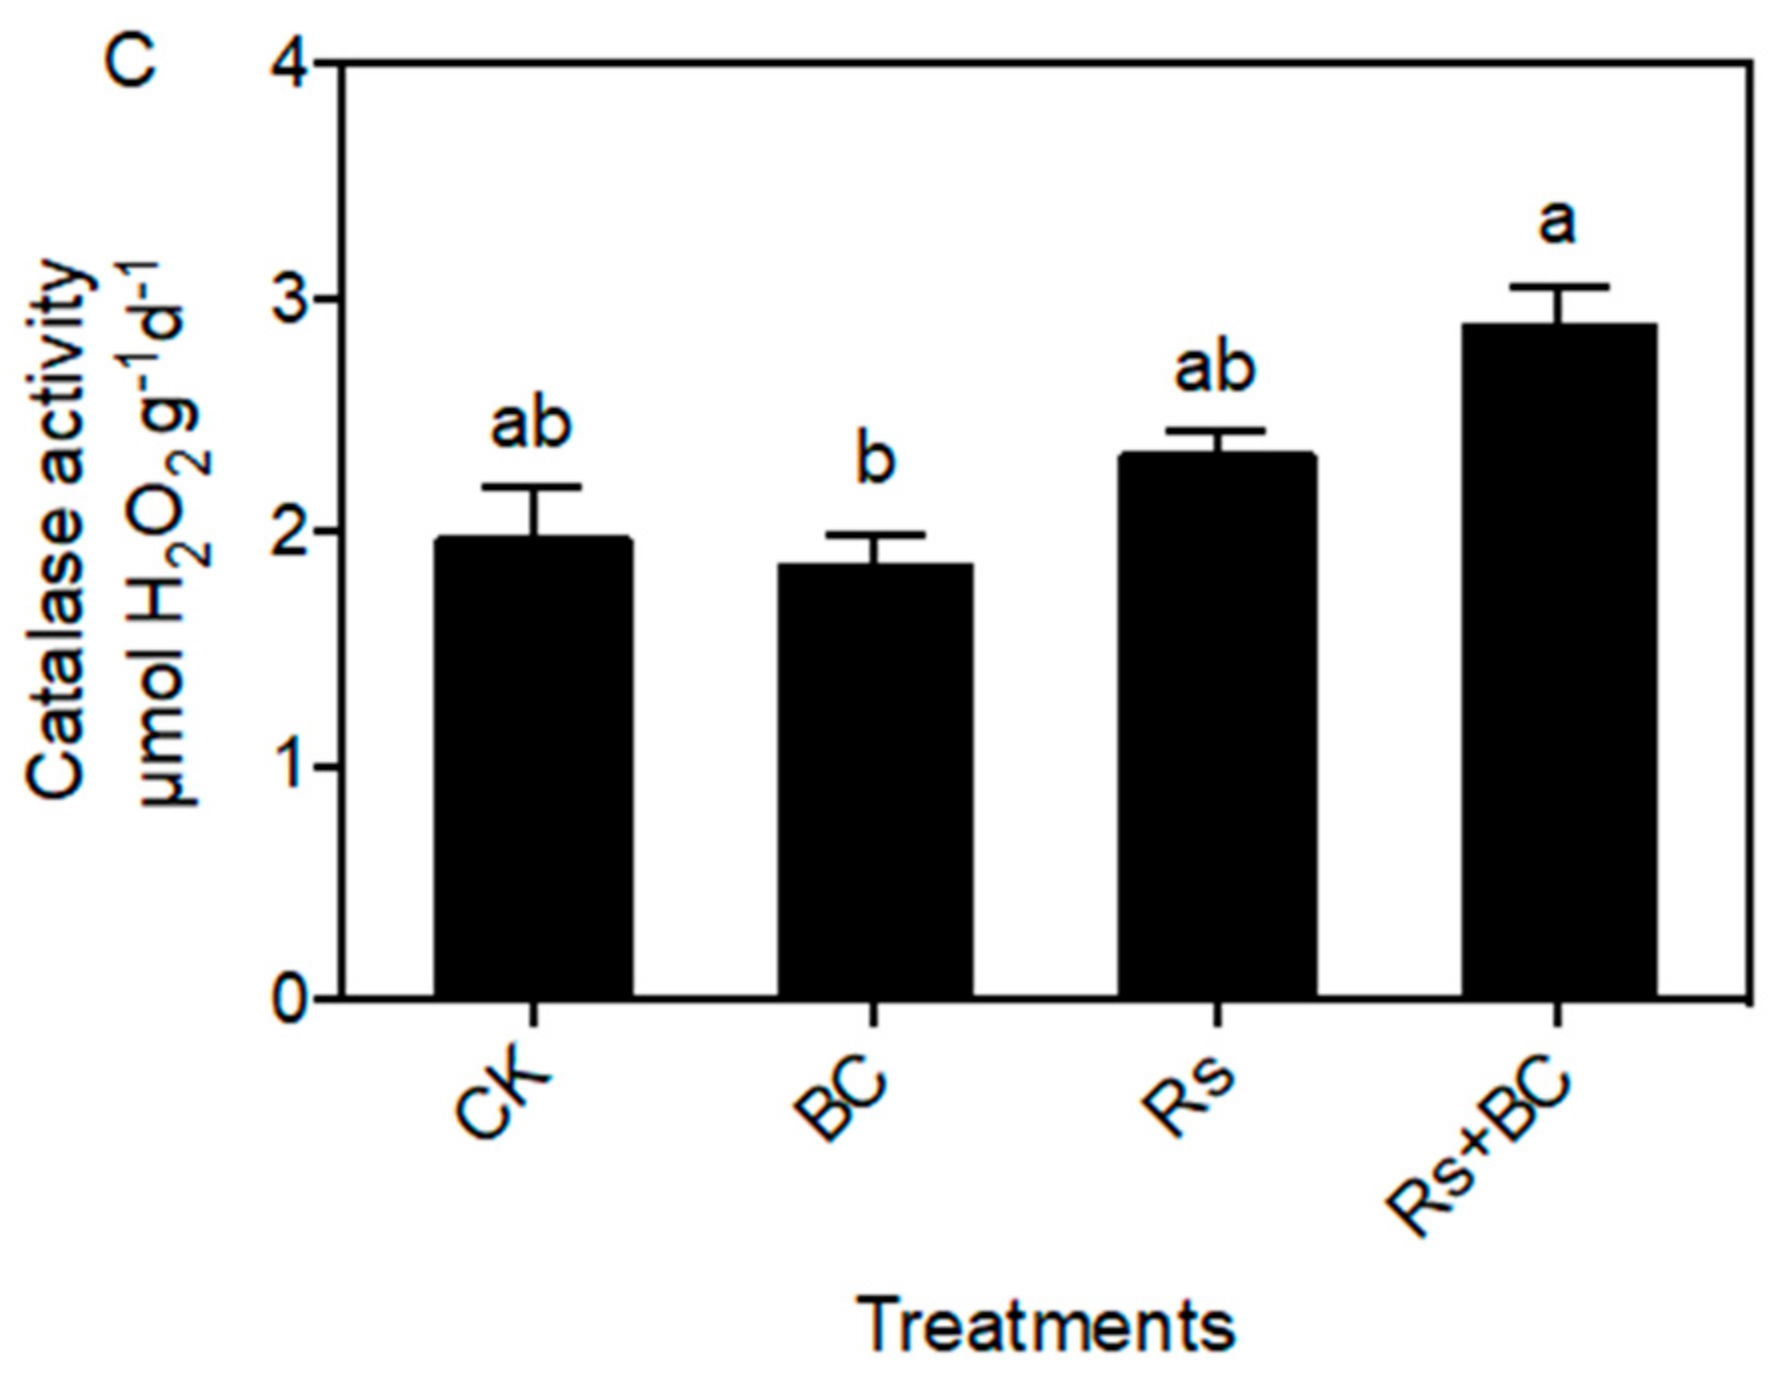
3.3. Effects of Biochar on Soil Enzyme Activities

Generally, biochar application increased the activity of soil urease, acid phosphatase, and catalase (Figure 2). Urease and acid phosphatase activities in biochar-treated soil were increased by 1.19- and 1.18-fold, respectively, for non-R.-solanacearum inoculation (BC) compared with CK. Urease, acid phosphatase, and catalase activities were increased by 1.12-, 1.13-, and 1.24-fold, respectively, for R. solanacearum inoculation (Rs + BC) compared with Rs.

3.4. Effects of Biochar Application on Soil Bacterial Taxonomic Richness

A total of 1,187,827 pairs of original sequences were obtained from the Illumina MiSeq PE 300 bp sequencing of the PCR products of soil samples. Quality control was performed, and the 3′ end of the reads showed a significant decrease in the base quality. After removing the singleton OTUs, 12,588 OTUs were obtained from the 12 soil samples (three replications for each treatment).
We randomly took 20,000 effective sequences in each soil sample and calculated the alpha diversity data of each sample (Table S1). The Chao index and ACE were used to estimate richness, while the Shannon and Sampson indices were calculated to evaluate functional diversity (Table 3). The results showed that biochar application did not influence the soil microbial diversity index, including the Shannon index, Simpson index, ACE, and Chao, regardless of R. solanacearum inoculation.

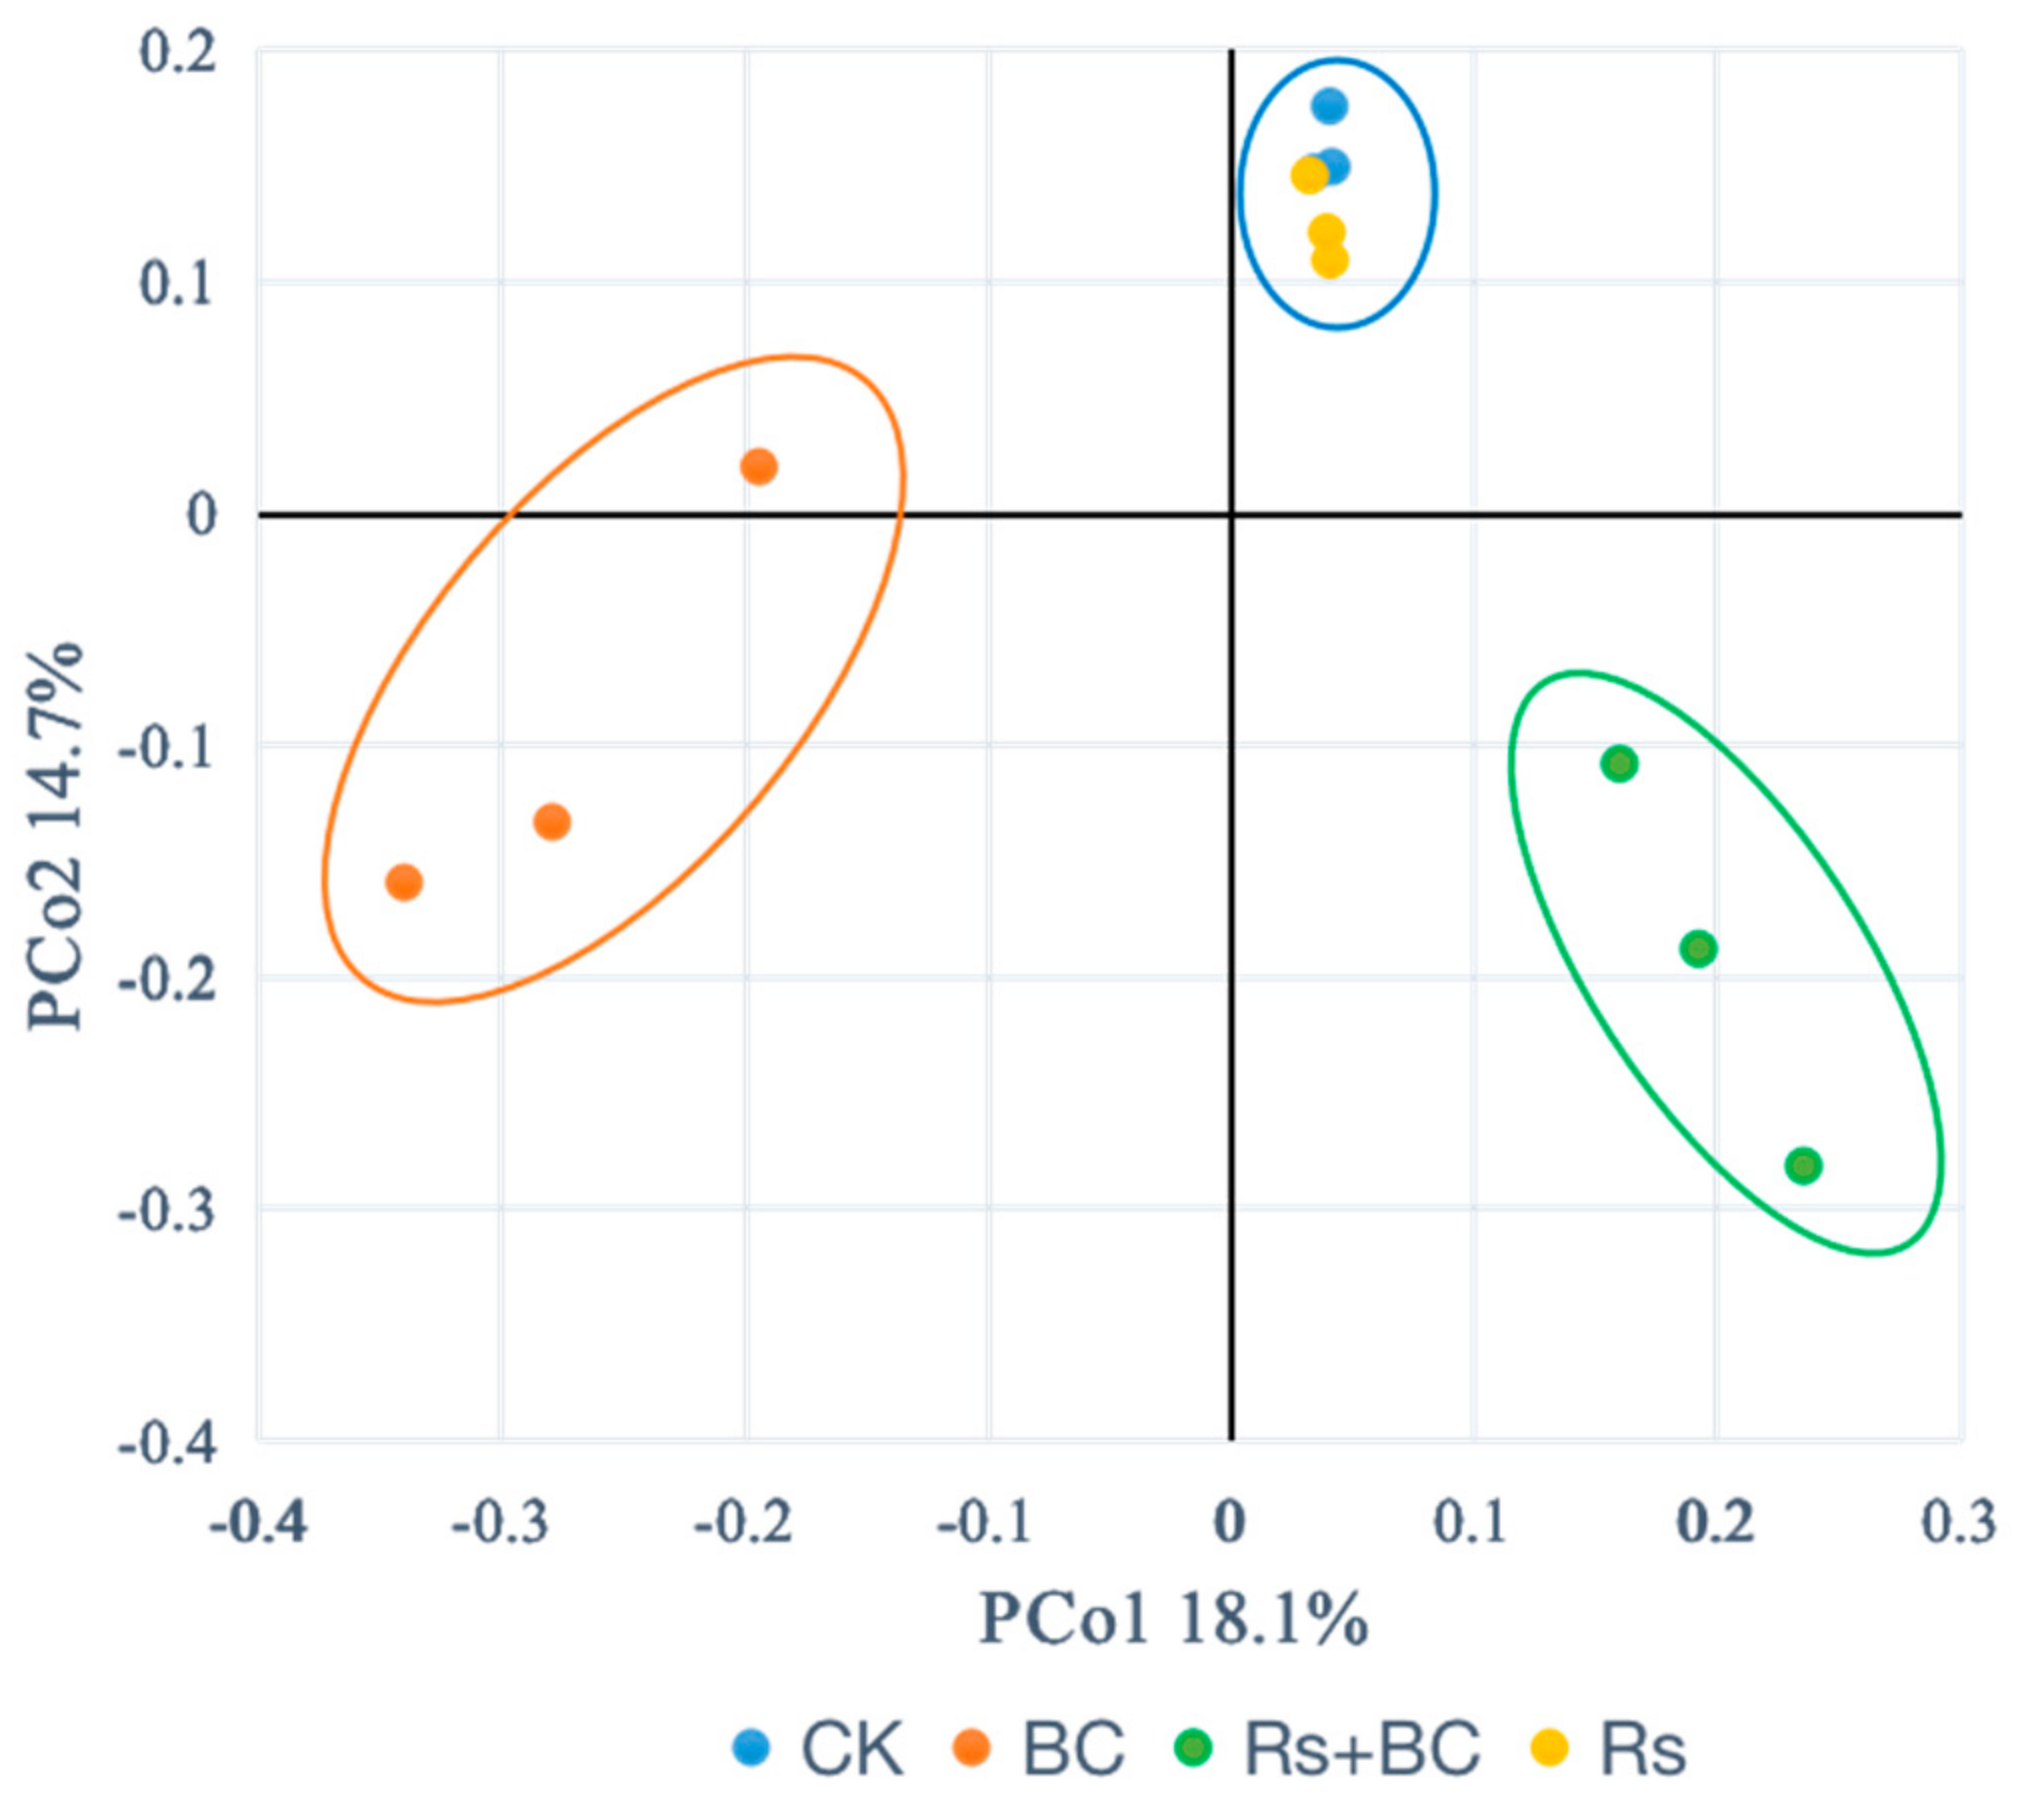
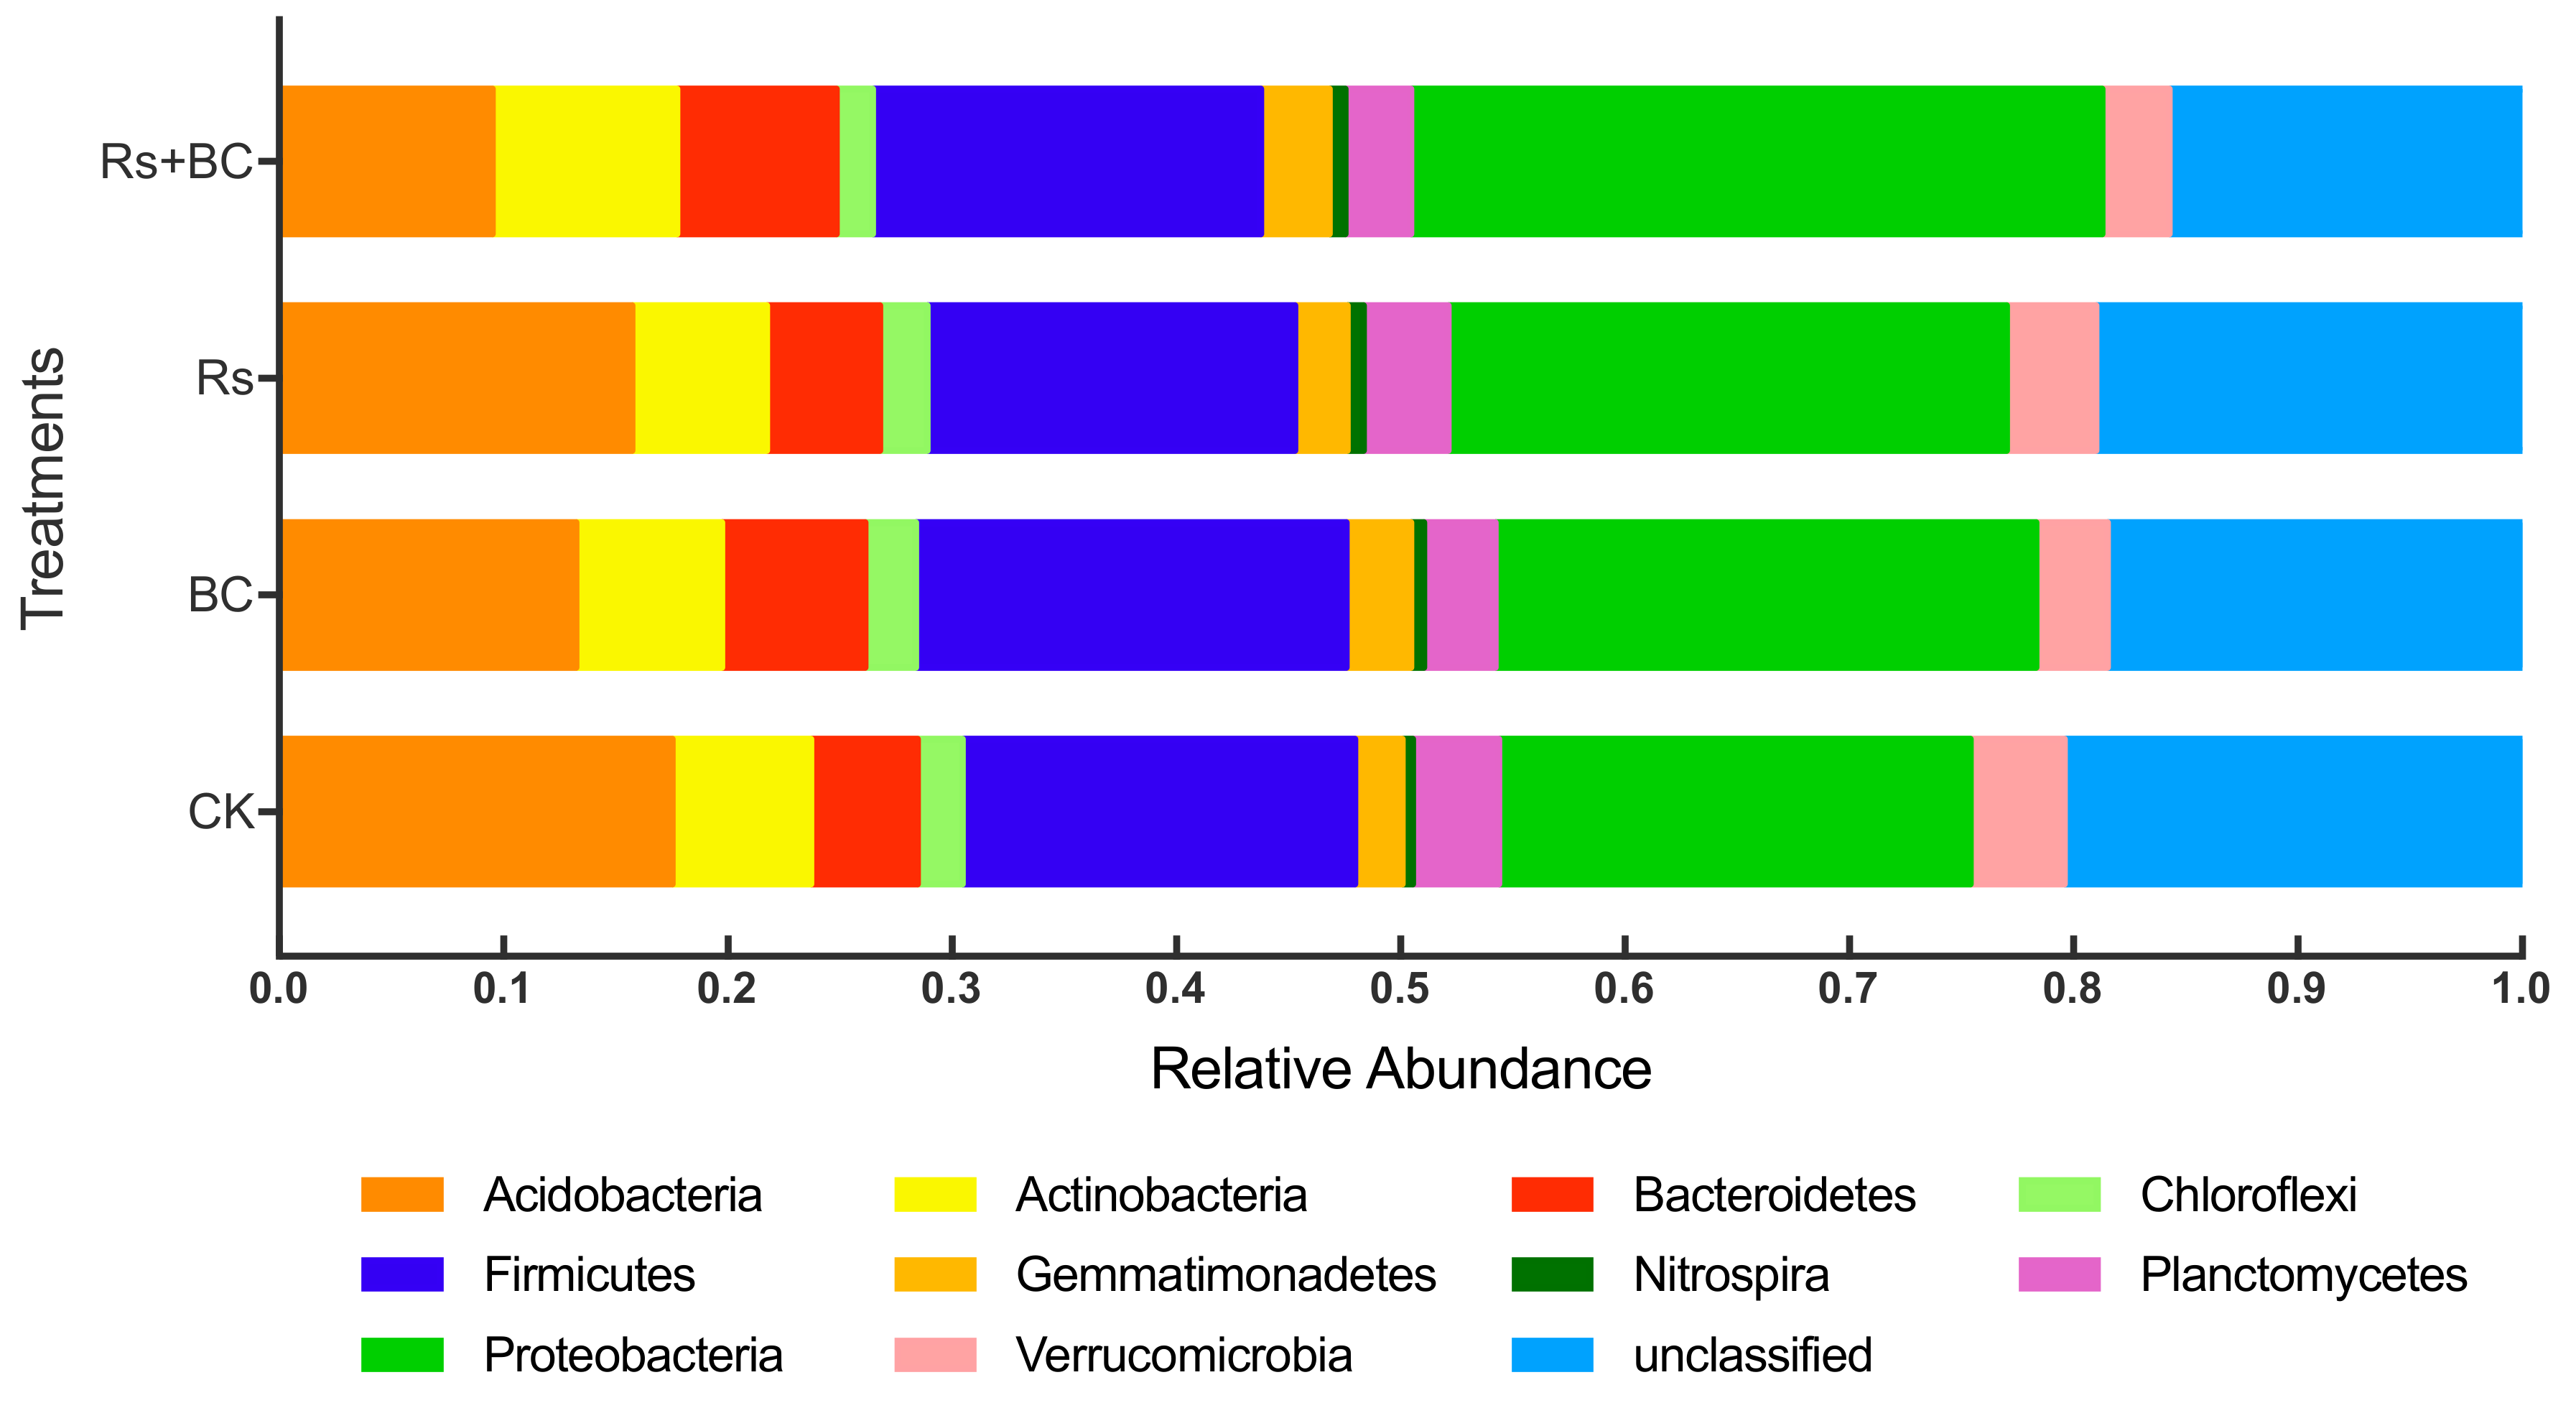
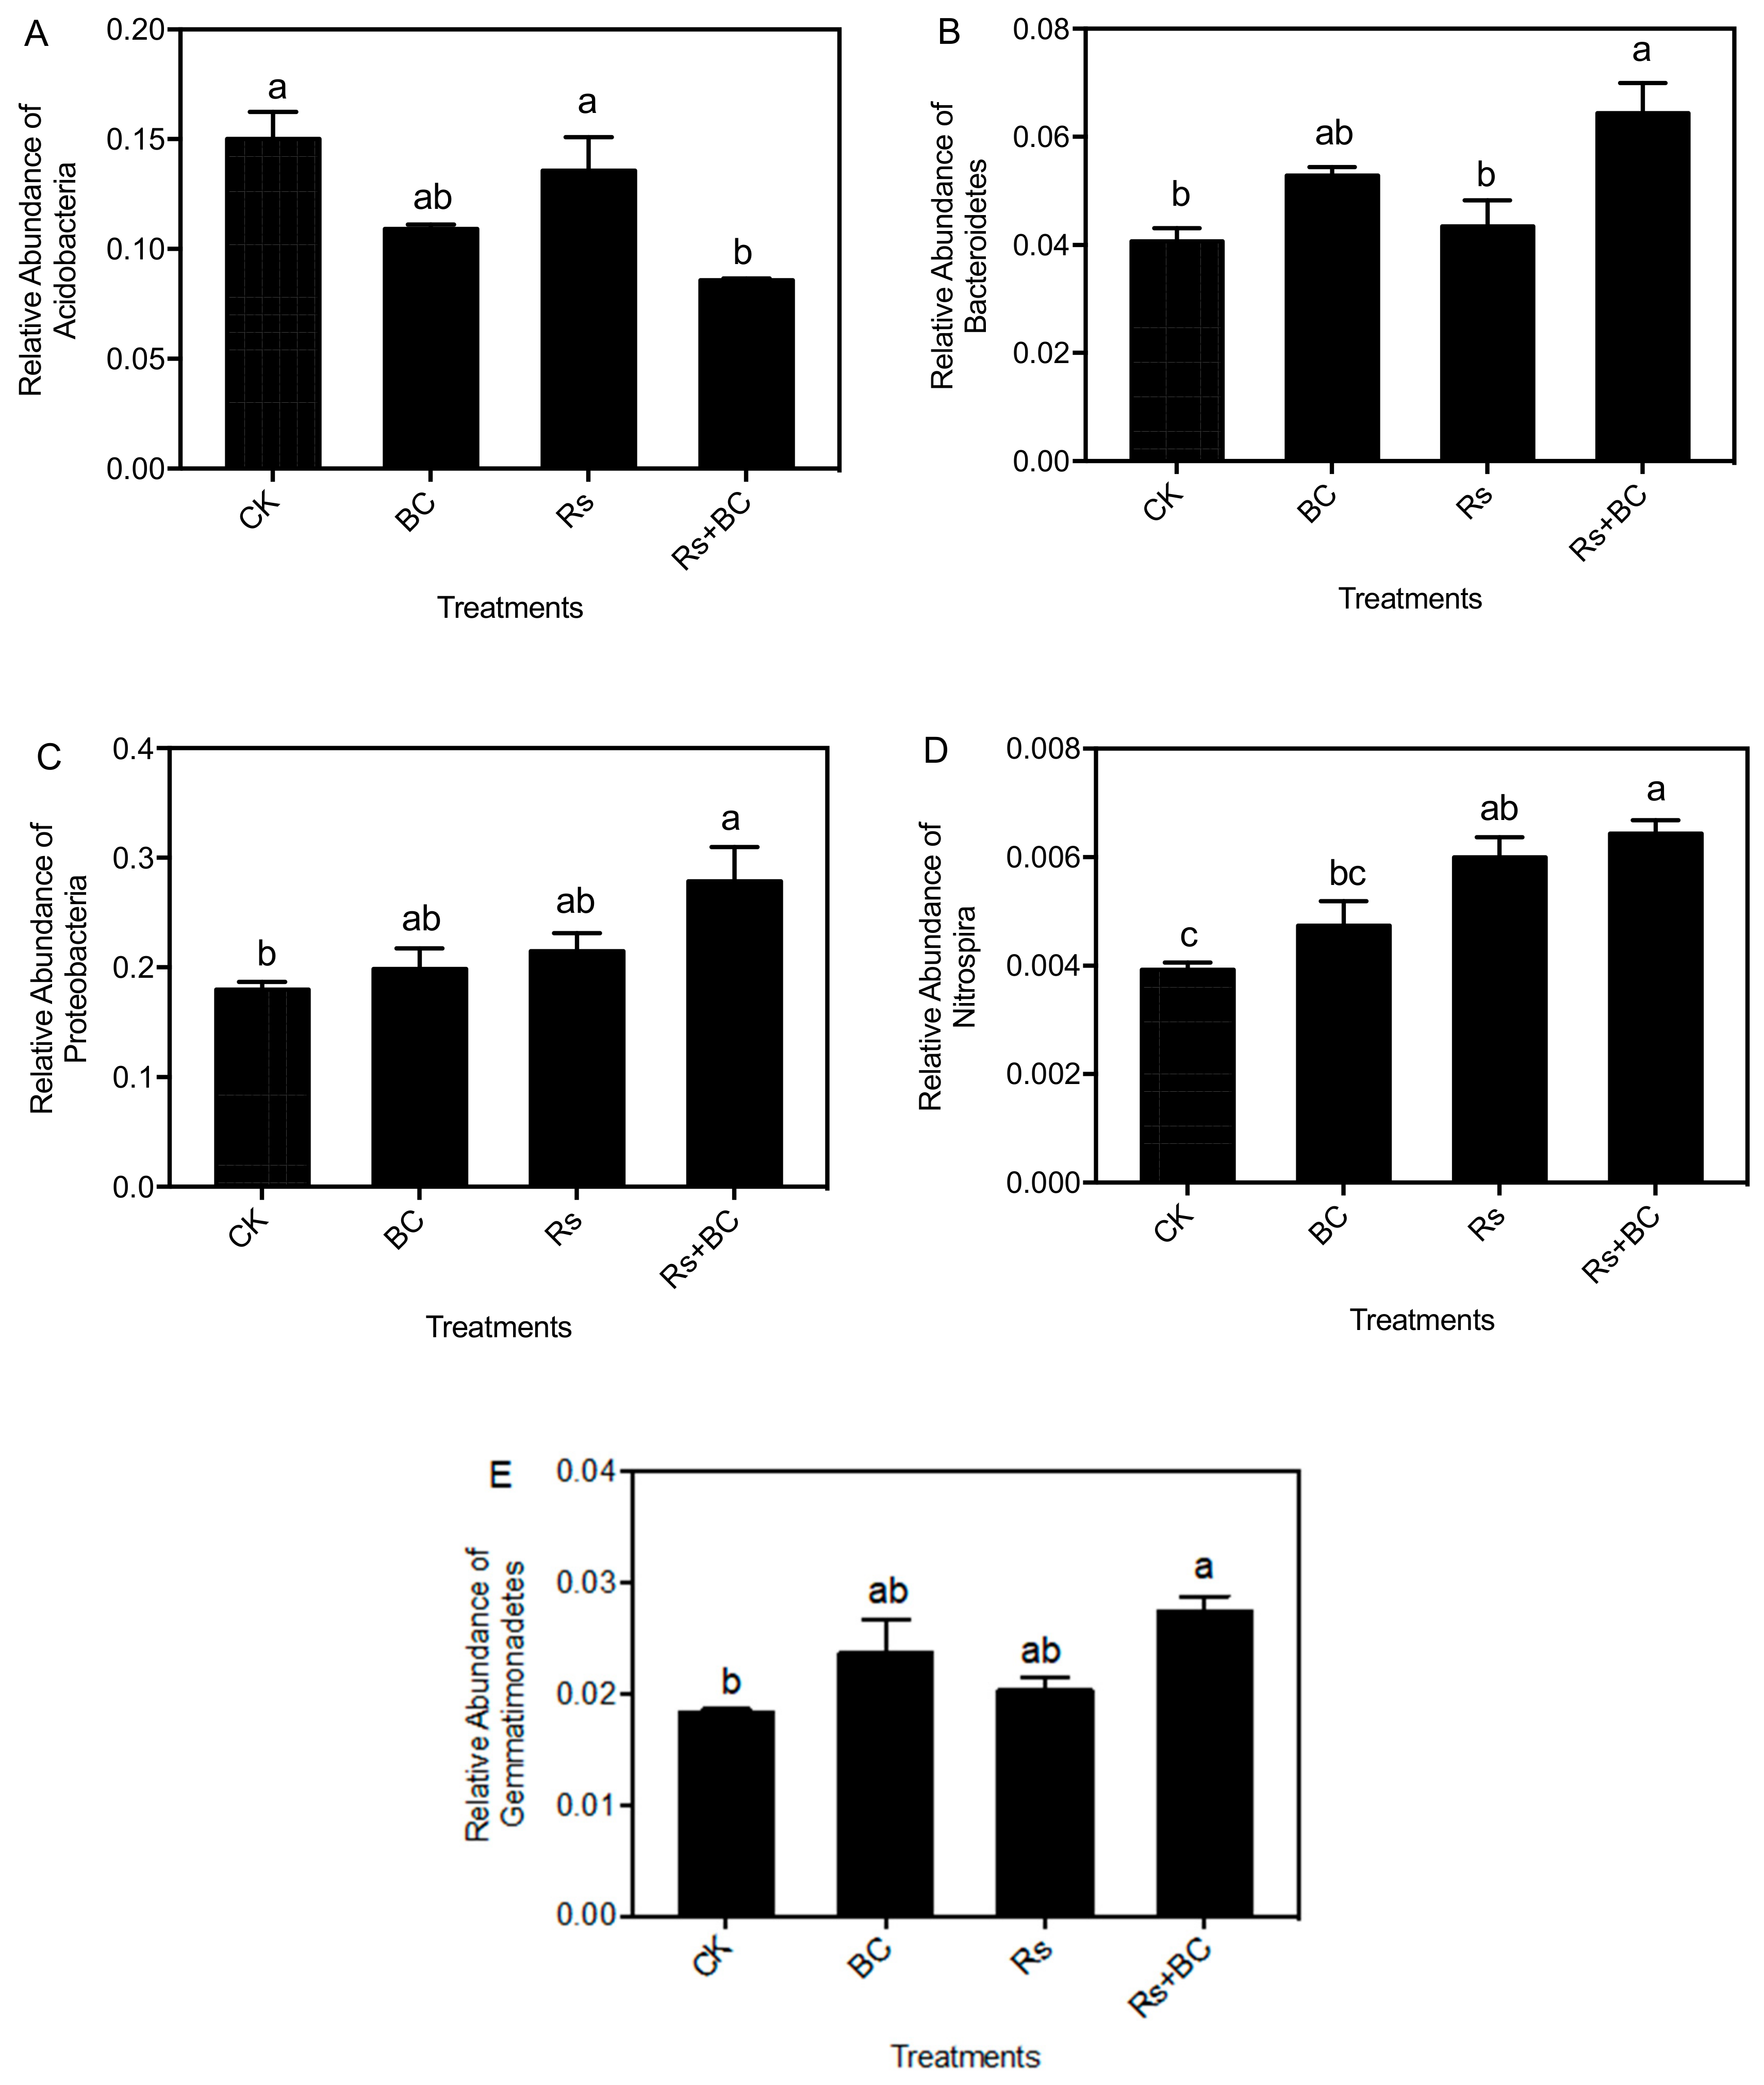
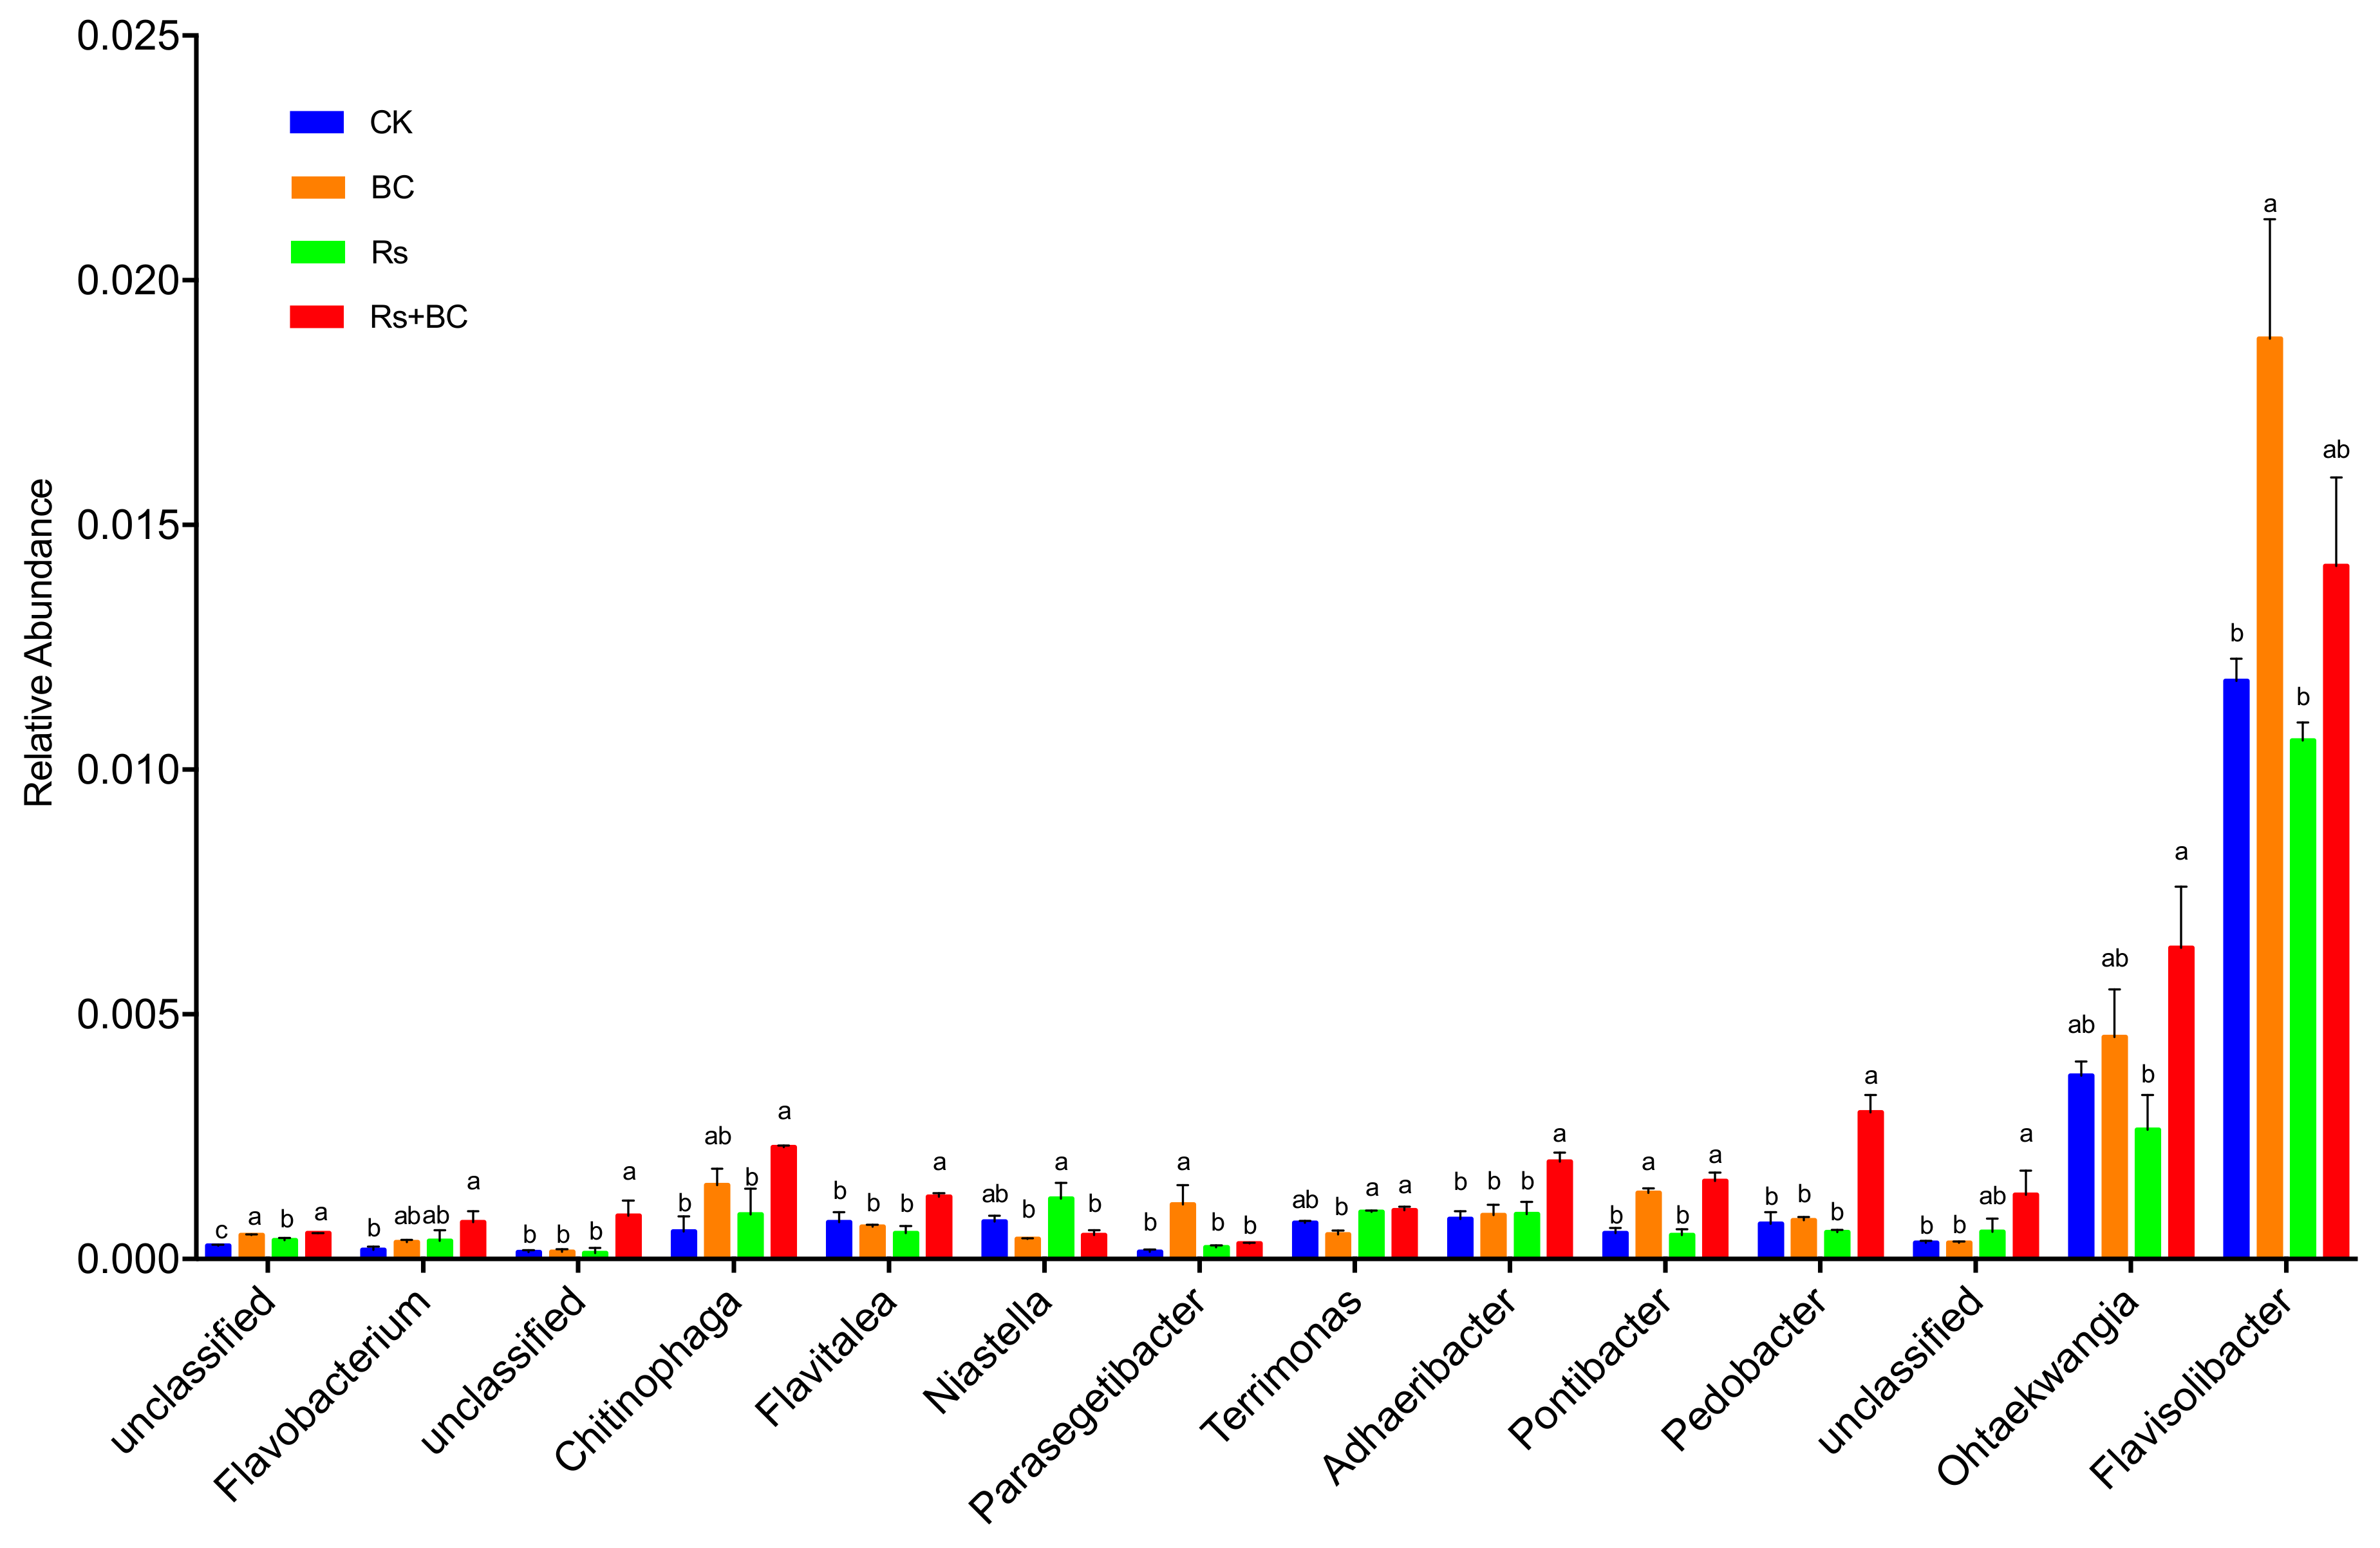
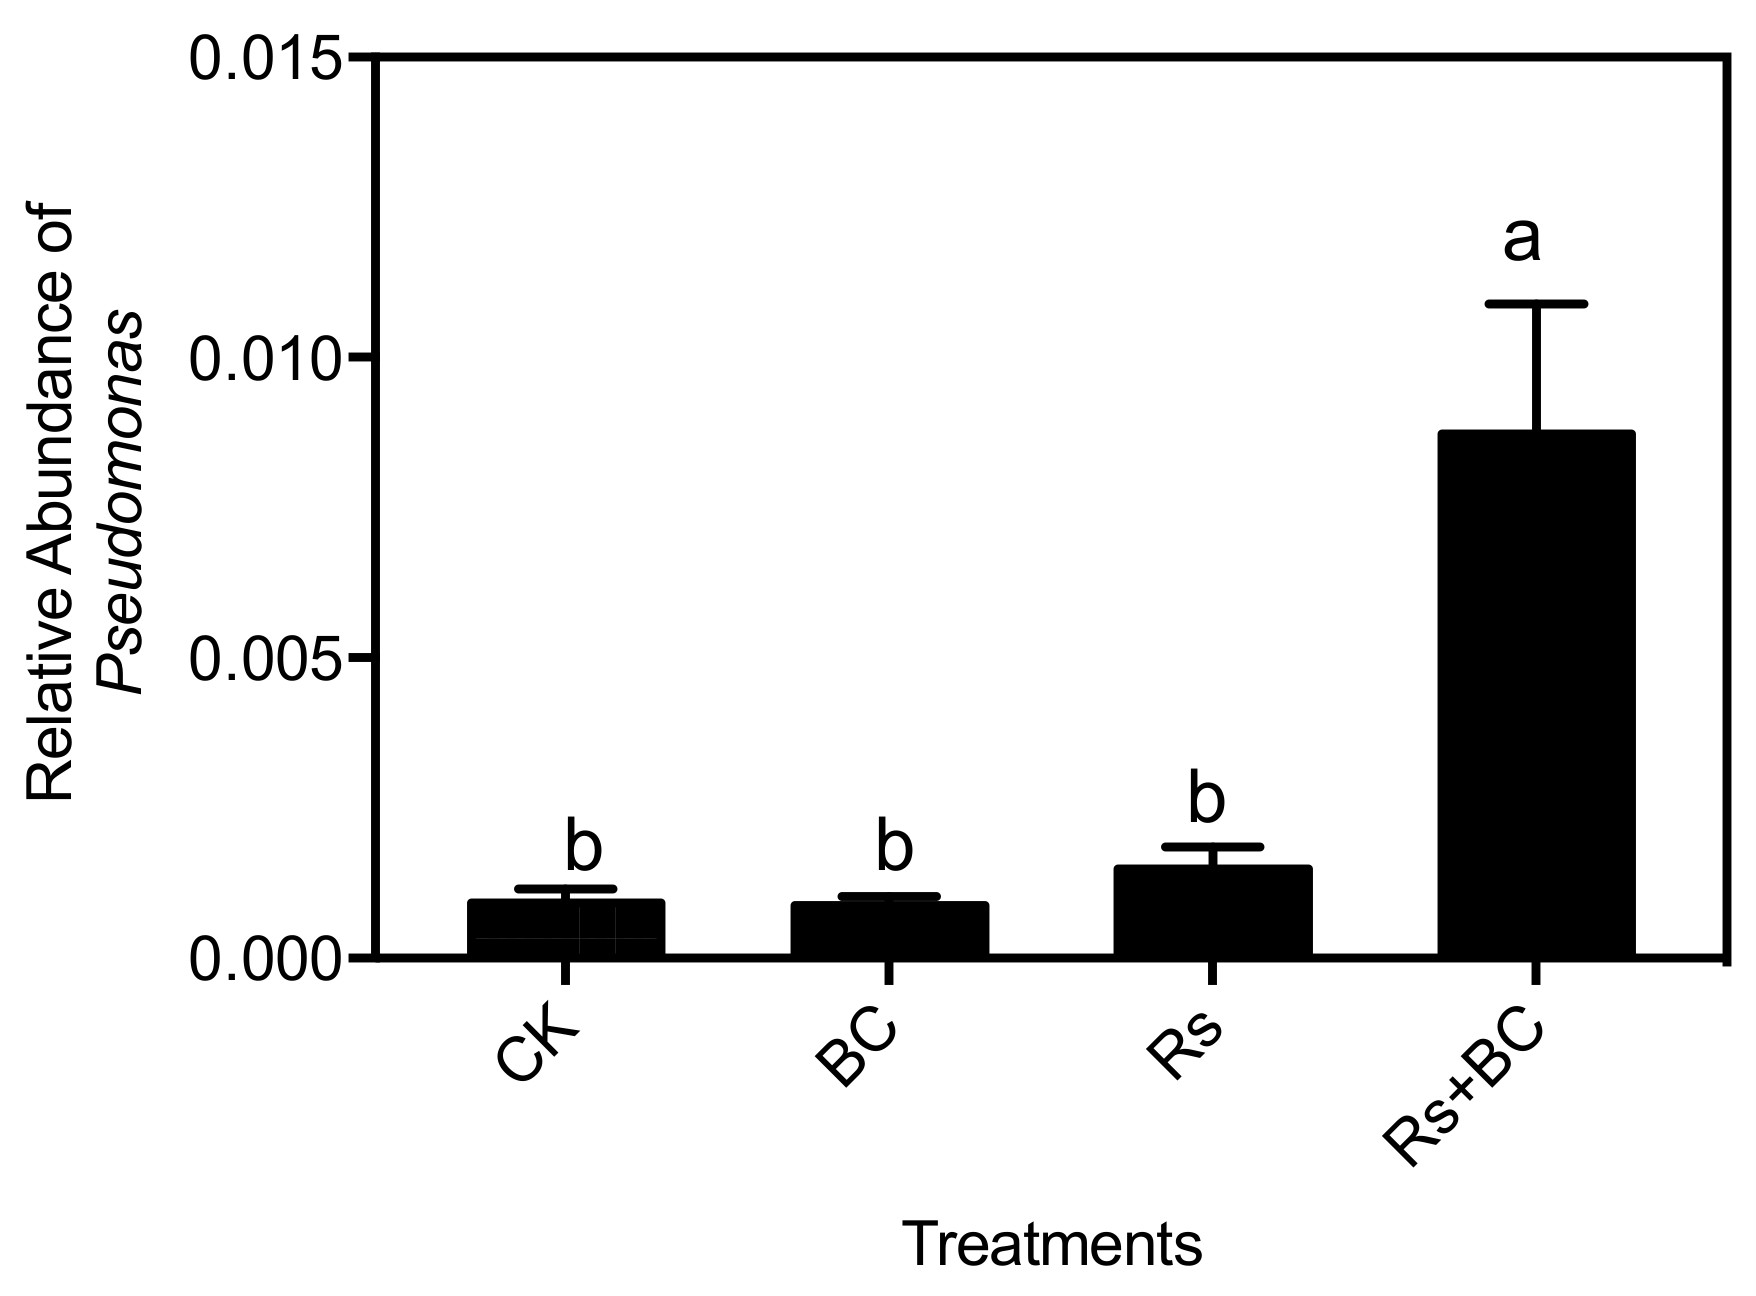
3.5. Effects of Biochar Application on Soil Bacterial Community Composition

Based on the basal quality control, a total of 12,588 bacterial sequence reads were obtained from 12 samples. The soil samples from different treatments showed that among the 12,588 OTUs, 8114 (64%) were accurate at the phylum level, while 7009 OUTs (55%) were accurate at the class level. Figure 3 presents the phylogenetic distances between the groups in the different treatments, showing the difference between bacterial communities. The samples from CK and Rs treatments were clustered together, which were far away from BC and Rs + BC treatments. The group with biochar treatment only was far away from the group with both biochar and R. solanacearum treatment, indicating that the samples had big differences in bacterial community structure. These findings suggest that the biochar amendment led to a shift in the bacterial community structure.
Detailed phylogenetic analyses grouped the rhizosphere-associated bacterial sequences across different treatments into 25 phyla (Table S2). The 11 most abundant phyla types are shown in Figure 4. Proteobacteria, Firmicutes, Acidobacteria, Actinobacteria, Bacteroidetes, Planctomycetes, Verrucomicrobia, Gemmatimonadetes, Chloroflexi, and Nitrospira were the dominant bacterial phyla, accounting for more than 80% of the bacterial sequences. The relative abundances of Acidobacteria, Bacteroidetes, Proteobacteria, Nitrospira, and Gemmatimonadetes at the phyla level were significantly altered under different treatments (Figure 5). Biochar treatment (Rs + BC) significantly increased the relative abundance of Bacteroidetes compared with no-biochar treatment (Rs) under R. solanacearum, but relative abundances of Acidobacteria indicated the opposite. Biochar treatment (Rs + BC) improved the relative abundances of Proteobacteria, Nitrospira, and Gemmatimonadetes compared with treatment Rs, and the differences were significant compared with CK.
Bacteroidetes was especially enriched in soil with biochar application under R. solanacearum inoculation and further analyses were carried out at the genus level (Figure 6). The biochar treatment (Rs + BC) significantly influenced the dominant genus groups and significantly increased the relative abundance of Chitinophaga, Flavitalea, Adhaeribacter, Pontibacter, Pedobacter, Ohtaekwangia, and an unclassified genus compared with no biochar treatment (Rs) under R. solanacearum inoculation. Biochar amendment only (BC) significantly increased the relative abundance of Parasegetibacter, Pontibacter, and Flavisolibacter compared with CK and Rs treatments.
Proteobacteria was the most abundant phylum in all treatments (Figure 4) and further analyses were carried out at the genus level (Table S3). Under R. solanacearum, biochar application significantly increased the relative abundance of Pseudomonas (Figure 7).

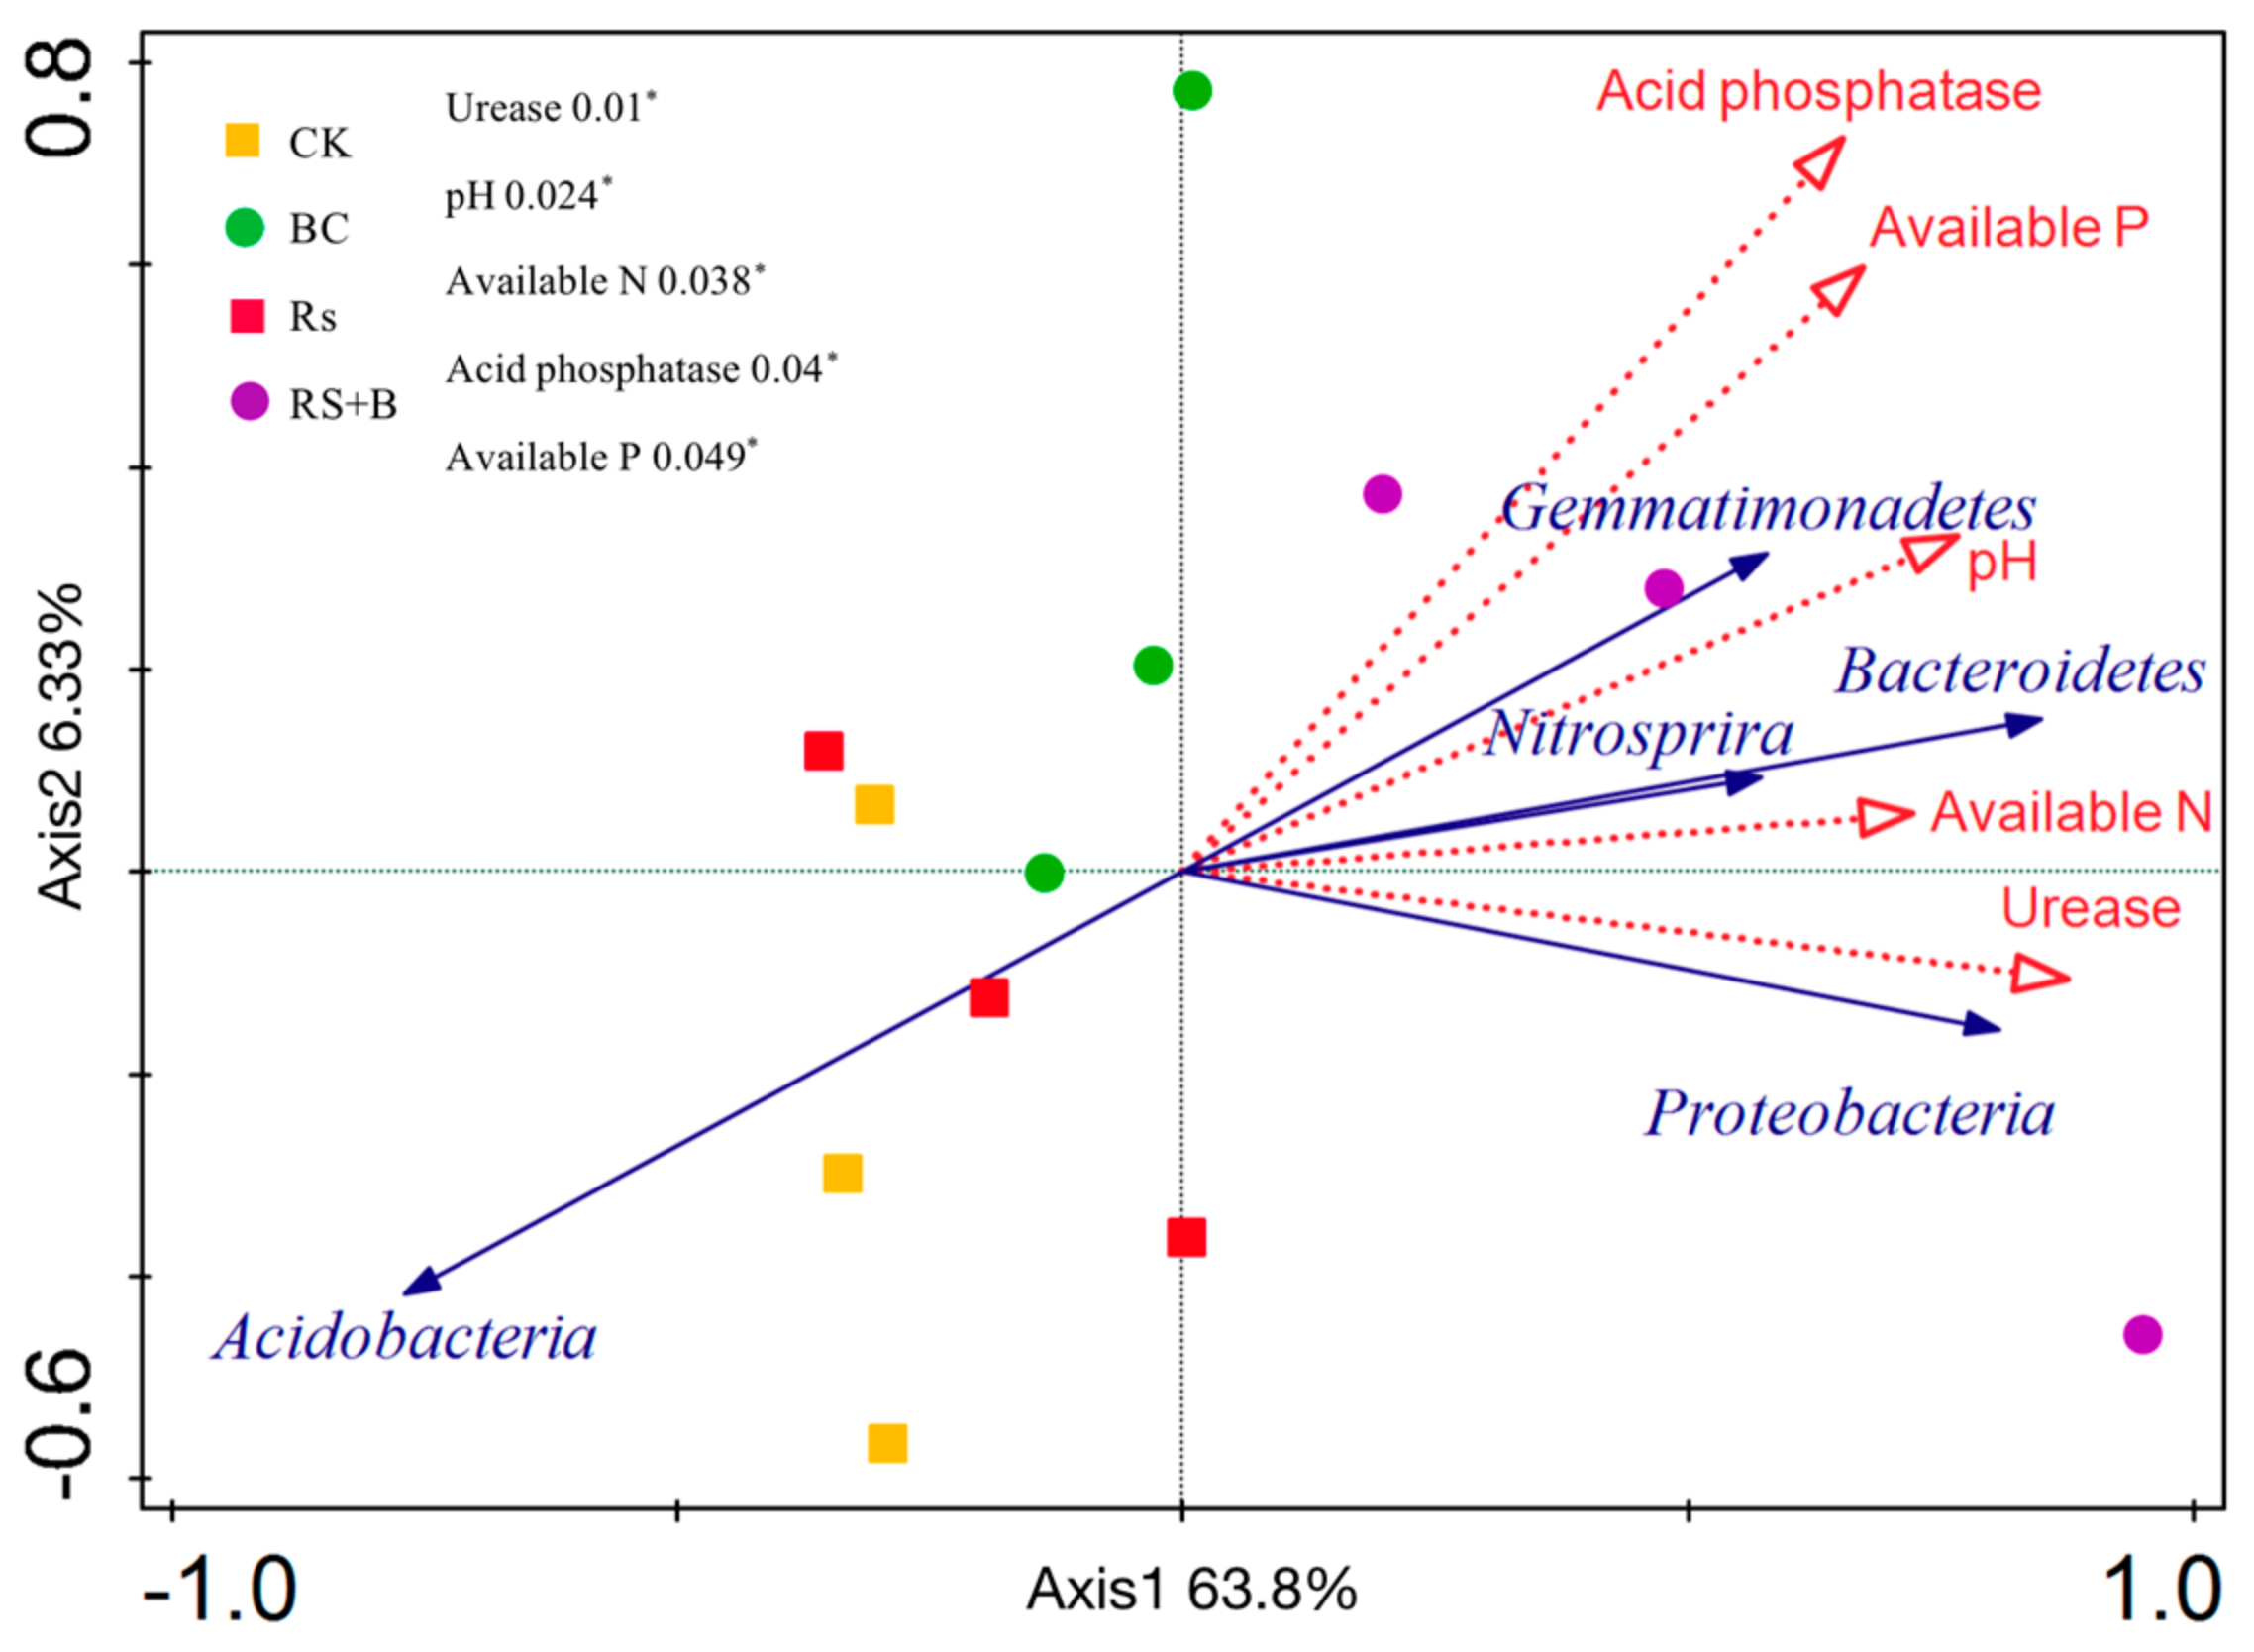
3.6. The Relationship between Soil Properties and Rhizosphere Bacterial Community

Redundancy analysis revealed that variation in bacterial community composition was significantly correlated with specific soil properties (Figure 8 and Table S4). Bacteroidetes, Proteobacteria, Nitrospira, and Gemmatimonadetes were positively correlated with soil urease and acid phosphatase activities, pH, and available N and P. Acidobacteria presented contrasting behavior that was negatively correlated with soil urease and acid phosphatase activities, pH, and available N and P. The redundancy analysis and the further permutations test revealed that urease activity and pH are the key predictors of bacterial community structure. Soil available N, acid phosphatase activity, and available P also had a good relationship with bacterial community structure. Soil urease activity was the factor that had greatest influence on Proteobacteria, while soil available N had a dominant impact on Bacteroidetes.

4. Discussion

Biochar can enhance the resistance of plants against different diseases [17,18,46]. In the present study, wheat biochar amendment significantly reduced the disease severity of bacterial wilt caused by R. solanacearum, thereby confirming our previous findings that biochar can be used as an amendment to control bacterial wilt [32]. The mechanisms of biochar-mediated plant resistance against plant diseases may stem from several mechanisms, such as detoxifying the chemical agents, stimulating the nutrient uptake of plants, improving soil properties, influencing soil microbial communities, and inducing plant resistance [15,24,26]. Several studies have also reported that biochar can improve the physical and chemical properties of soil and, consequently, promote soil health [26,47,48,49]. Specifically, biochar addition increased the porosity, pH, cation exchange capacity, organic carbon, and available nutrients of soil but reduced its bulk density [24,50,51]. Our findings revealed that wheat biochar amendment resulted in higher levels of soil TOC, TN, C/N, SOM, pH, EC, and available P and K, regardless of pathogen inoculation (Table 1; Table 2), which is similar to the results of Wang et al. [52], who found that rice husk biochar promoted plant growth by improving the soil environment. Changes in soil pH from biochar amendment might be due to the strong basicity of biochar, and our results showed that soil pH has a positive relationship with total organic C; total N; and available N, P, and K (Table S4). Moreover, the increase of available N, P, and K may influence the soil microbes and enzymatic activity, thus playing a vital role in the improvement of soil fertility [53].
Soil enzymes play an important role in the maintenance of soil health and nutrient cycling, which can be biological indicators of soil quality [52,53,54]. Wang et al. [52] demonstrated that soil invertase, urease, proteinase, neutral phosphatase, catalase, and polyphenol oxidase activities were enhanced by biochar application in apple replant soil. Another study by Ghani et al. [54] showed similar results. Our results showed that soil urease and acid phosphatase activities were enhanced with biochar amendment (Figure 2), and these two enzymes had a positive relationship with soil chemical properties such as available P and K (Table S4). The increase of soil enzyme activity may enhance the viability of soil microbes and can accelerate nutrient and C cycling in the soil that is beneficial to plant health.
The composition and diversity of soil microbial communities are associated with soil quality and plant health [55,56]. Biochar application may also change the soil community structure and subsequently result in the antagonism, competition, or parasitism of microorganisms and pathogens in the soil to reduce the amount of pathogenic bacteria [26]. Our previous study explored that wheat and groundnut biochar-mediated bacterial wilt resistance were associated with the increase in soil bacteria and actinomycete densities and the reduction in soil fungi/bacteria and fungi/actinomycetes ratios [32]. Alpha diversity analysis of microbial communities revealed no significant differences in bacteria richness and diversity among different treatments (Table 3), which is consistent with the findings of Rutigliano et al. [57] and Luo et al. [58]. However, other studies showed that biochar application increases the overall diversity of soil bacteria communities [24,30,59,60]. Khodadad et al. [61] found that those soils treated with oak- and grass-derived biochar demonstrated losses in their microbial diversity. Several biochar properties, including pyrolysis temperature, adsorption ability, nutrient content, pH, water holding capacity, and hormone-like compounds, may also be related to the influence of this variation [15,20,27,28]. These above contradictory results indicate the complexity of the soil microbial process influenced by soil amendments.
Our analysis of microbial beta diversity revealed a different pattern among treatments (Figure 3). Biochar application significantly influenced the composition of the soil bacterial community (Figure 4) and reduced the relative abundance of Acidobacteria. The relative abundance of Acidobacteria was largely driven by soil pH at a continental scale, and low pH values could be more suitable for Acidobacteria [62]. Consistent with those of Kolton et al. [27] and Xu et al. [63], our findings revealed that the relative abundance of Bacteroidetes in biochar-treated soil under R. solanacearum infection (Rs + BC) significantly increased compared with the no biochar treatments (Figure 5). Bacteroidetes are generally specialized in the degradation of organic matter, promote plant growth, and increase their resistance to environmental stress [64,65]. Our results also indicated that the relative abundances of Chitinophaga, Flavitalea, Adhaeribacter, Pontibacter, Pedobacter, and Ohtaekwangia at the genus level, which are bioremediators of hydrocarbons [49], were significantly increased by biochar amendment (Figure 6). The changes in these genera may be related to plant resistance, but further studies must be conducted to explore the relationship between these genera and R. solanacearum. In the present study, biochar amendment significantly increased the relative abundance of Pseudomonas under the condition of R. solanacearum inoculation (Figure 7). Pseudomonas spp. are known for their ability to improve plant growth, suppress pathogens, and induce the systemic resistance of many plant species against diseases and pests [30,66,67]. Biochar has also been previously described as an agent for promoting plant growth or biocontrol. Mendes et al. [68] found that Pseudomonas microorganisms can resist the diseases caused by R. solanacearum, whereas other studies have used Pseudomonas spp. to biologically control R. solanacearum [69,70]. In sum, the addition of biochar may provide a suitable environment for promoting the growth of Pseudomonas, increasing the relative abundance of Pseudomonadaceae (thereby inhibiting the growth of R. solanacearum), and reducing the incidence of tomato bacterial wilt. A strong link was also observed among the biochar-induced changes in soil microbial environments, the suppression of soilborne diseases, and plant performance [30].
In conclusion, wheat biochar amendment significantly reduced the disease severity of bacterial wilt and increased tomato resistance. The addition of biochar increased soil pH and EC and improved soil nutrient status and enzymatic activity, while soil fertility and soil enzyme activity had a positive relationship with the abundance of the soil microbial community (Figure 8). Biochar addition did not influence soil bacterial microbial community diversity but significantly influenced the relative abundance of the soil microbial community at the phylum and genus levels, suggesting that biochar shifting the soil bacterial community structure contributed to pathogen resistance.

Supplementary Materials

The supplementary materials are available online at https://0-www-mdpi-com.brum.beds.ac.uk/2076-2607/7/12/676/s1.

Author Contributions

K.C., conceptualization, project administration, supervision, funding acquisition, and writing—review and editing; Y.G. and Y.L., methodology, software, validation, investigation, formal analysis, resources, and data curation; Y.G., writing—original draft preparation and writing—review and editing; W.L., data curation; J.T., data curation and writing—review and editing.

Funding

This research was funded by grants from the National Natural Science Foundation of China (31870420 and 31370456) and the Natural Science Foundation of Guangdong Province (2017A030313177 and S2012010010331).

Acknowledgments

We thank Abdul Hafeez for his English words and grammar check of the manuscript.

Conflicts of Interest

The authors declare no conflict of interest. The funders had no role in the design of the study; in the collection, analyses, or interpretation of data; in the writing of the manuscript, and in the decision to publish the results.

References

  1. Wicker, E.; Grassart, L.; Coranson-Beaudu, R.; Mian, D.; Guilbaud, C.; Fegan, M.; Prior, P. Ralstonia solanacearum strains from Martinique (French West Indies) exhibiting a new pathogenic potential. Appl. Environ. Microb. 2007, 71, 6790–6801. [Google Scholar] [CrossRef] [PubMed] [Green Version]
  2. Pradhanang, P.M.; Momol, M.T.; Olson, S.M.; Jones, J. Effects of plant essential oils on Ralstonia solanacearum population density and bacterial wilt incidence in tomato. Plant Dis. 2003, 87, 423–427. [Google Scholar] [CrossRef] [PubMed] [Green Version]
  3. Trigalet, A.; Trigalet, D. Invasiveness in tomato plant of Tn5-induced avirulent mutants of Pseudomonas solanacearun. Physiol. Mol. Plant Pathol. 1986, 28, 423–430. [Google Scholar] [CrossRef]
  4. Trigalet, A.; Trigalet-Demery, D. Use of avirulent mutants of Pseudomonas solanacearum for the biological control of bacterial wilt of tomato plants. Physiol. Mol. Plant Pathol. 1990, 36, 27–38. [Google Scholar] [CrossRef]
  5. Yuliar; Nion, Y.A.; Toyota, K.K. Recent trends in control methods for bacterial wilt diseases caused by Ralstonia solanacearum. Microbes Environ. 2015, 30, 1–11. [Google Scholar] [CrossRef] [PubMed] [Green Version]
  6. Roberts, K.G.; Gloy, B.A.; Joseph, S.; Scott, N.R.; Lehmann, J. Life cycle assessment of biochar systems: Estimating the energetic, economic, and climate change potential. Environ. Sci. Technol. 2009, 4, 827–833. [Google Scholar] [CrossRef] [PubMed]
  7. Golber, E.D. Black Carbon in the Environment: Properties and Distribution; John & Wiley: New York, NY, USA, 1985. [Google Scholar]
  8. Glaser, B.; Haumaier, L.; Guggenberger, G.; Zech, W. The ‘Terra Preta’ phenomenon: A model for sustainable agriculture in the humid tropics. Naturwissenschaften 2001, 88, 37–41. [Google Scholar] [CrossRef]
  9. Zhang, W.L.; Li, G.H.; Gao, W.D. Effect of biomass charcoal on soil character and crop yield. Chin. Agric. Sci. Bull. 2009, 25, 153–157. [Google Scholar]
  10. Liang, B.; Lehmann, J.; Solomon, D.; Kinyangi, J.; Grossman, J.; O’Neill, B.O.; Skjemstad, J.O.; Thies, J.; Luizão, F.J.; Petersen, J.; et al. Black carbon increases cation exchange capacity in soils. Soil Sci. Soc. Am. J. 2006, 70, 1719–1730. [Google Scholar] [CrossRef] [Green Version]
  11. Kasozi, G.N.; Zimmerman, A.R.; Nkedi-Kizza, P.; Gao, B. Catechol and humic acid sorption onto a range of laboratory-produced black carbons (biochars). Environ. Sci. Technol. 2010, 44, 6189–6195. [Google Scholar] [CrossRef]
  12. Shi, M.; Lin, C.H.; Huang, Z.Q.; Si, H.P.; Lin, K.Y. The influence of bio-char inputting on the adsorption of phenanthrene by soils and by maize seedlings. J. Agro-Environ. Sci. 2011, 30, 912–916. [Google Scholar]
  13. Novak, J.M.; Busscher, W.J.; Laird, D.L.; Ahmedna, M.; Watts, D.W.; Niandou, M.A. Impact of biochar amendment on fertility of a southeastern coastal plain soil. Soil Sci. 2009, 174, 105–112. [Google Scholar] [CrossRef] [Green Version]
  14. Uchimiya, M.; Klasson, K.T.; Wartelle, L.H.; Lima, I.M. Influence of soil properties on heavy metal sequestration by biochar amendment: 1. Copper sorption isotherms and the release of cations. Chemosphere 2011, 82, 1431–1437. [Google Scholar] [CrossRef] [PubMed]
  15. Elad, Y.; Cytryn, E.; Harel, Y.M.; Lew, B.; Graber, E.R. The biochar effect: Plant resistance to biotic stresses. Phytopathol. Mediterr. 2011, 50, 335–349. [Google Scholar]
  16. Schmidt, H.P.; Kammann, C.; Niggli, C.; Evangelou, M.W.; Mackie, K.A.; Abiven, S. Biochar and biochar-compost as soil amendments to a vineyard soil: Influences on plant growth, nutrient uptake, plant health and grape quality. Agri. Ecosyst. Environ. 2014, 191, 117–121. [Google Scholar] [CrossRef]
  17. Harel, Y.M.; Elad, Y.; Rav-David, D.; Borenstein, M.; Shulchani, R.; Lew, B.; Graber, E.R. Biochar mediates systemic response of strawberry to foliar fungal pathogens. Plant Soil. 2012, 357, 245–257. [Google Scholar] [CrossRef]
  18. Elad, Y.; David, D.R.; Harel, Y.M.; Borenshtein, M.; Kalifa, H.B.; Silber, A.; Graber, E.R. Induction of systemic resistance in plants by biochar, a soil-applied carbon sequestering agent. Phytopathology 2010, 100, 913–921. [Google Scholar] [CrossRef] [Green Version]
  19. Elmer, W.H.; Pignatello, J.J. Effect of biochar amendments on mycorrhizal associations and Fusarium crown and root rot of asparagus in replant soils. Plant Dis. 2011, 95, 960–966. [Google Scholar] [CrossRef] [Green Version]
  20. Graber, E.R.; Frenkel, O.; Jaiswal, A.K.; Elad, Y. How may biochar influence severity of diseases caused by soilborne pathogens? Carbon Manag. 2014, 5, 169–183. [Google Scholar] [CrossRef]
  21. Bonanomi, G.; Ippolito, F.; Scala, F. A” black” future for plantpathology? Biochar as a new soil amendment for controlling plant diseases. J. Plant Pathol. 2015, 97, 223–234. [Google Scholar]
  22. Akhter, A.; Hage-Ahmed, K.; Soja, G.; Steinkellner, S. Compost and biochar alter mycorrhization, tomato root exudation, and development of Fusarium oxysporum f. sp. lycopersici. Front. Plant Sci. 2015, 6, 529. [Google Scholar] [CrossRef] [PubMed] [Green Version]
  23. Nerome, M.; Toyota, K.; Islam, T.; Nishijima, T.; Matsuoka, T.; Sato, K.; Yamaguchi, Y. Suppression of bacterial wilt of tomato by incorporation of municipal biowaste charcoal into soil. Soil Microorg. (Japan) 2005, 59, 0912–2184. [Google Scholar]
  24. Zhang, C.; Lin, Y.; Tian, X.; XU, Q.; Chen, Z.H.; Lin, W. Tobacco bacterial wilt suppression with biochar soil addition associates to improved soil physiochemical properties and increased rhizosphere bacteria abundance. Appl. Soil Ecol. 2017, 112, 90–96. [Google Scholar] [CrossRef]
  25. Noguera, D.; Rondón, M.; Laossi, K.R.; Hoyos, V.; Lavelle, P.; Carvalho, M.H.C.; Barot, S. Contrasted effect of biochar and earthworms on rice growth and resource allocation in different soils. Soil Biol. Biochem. 2010, 42, 1017–1027. [Google Scholar] [CrossRef] [Green Version]
  26. Lehmann, J.; Rillig, M.C.; Thies, J.; Masiello, C.A.; Hockaday, W.C.; Crowley, D. Biochar effects on soil biota—a review. Soil Biol. Biochem. 2011, 43, 1812–1836. [Google Scholar] [CrossRef]
  27. Kolton, M.; Harel, Y.M.; Pasternak, Z.; Graber, E.R.; Elad, Y.; Cytryn, E. Impact of biochar application to soil on the root-associated bacterial community structure of fully developed greenhouse pepper plants. Appl. Environ. Microbiol. 2011, 77, 4924–4930. [Google Scholar] [CrossRef] [Green Version]
  28. Mehari, Z.H.; Elad, Y.; Rav-David, D.; Graber, E.R.; Harel, Y.M. Induced systemic resistance in tomato (Solanum lycopersicum) against Botrytis cinerea by biochar amendment involves jasmonic acid signaling. Plant Soil. 2015, 395, 31–44. [Google Scholar] [CrossRef]
  29. Kolton, M.; Graber, E.R.; Tsehansky, L.; Elad, Y.; Cytryn, E. Biochar-stimulated plant performance is strongly linked to microbial diversity and metabolic potential in the rhizosphere. New Phytol. 2017, 213, 1393–1404. [Google Scholar] [CrossRef]
  30. Jaiswal, A.K.; Elad, Y.; Paudel, I.; Graber, E.R.; Cytryn, E.; Frenkel, O. Linking the belowground microbial composition, diversity and activity to soilborne disease suppression and growth promotion of tomato amended with biochar. Sci. Rep. 2017, 7. [Google Scholar] [CrossRef]
  31. Rogovska, N.; Laird, D.; Leandro, L.; Aller, D. Biochar effect on severity of soybean root disease caused by Fusarium virguliforme. Plant Soil. 2017, 413, 111–126. [Google Scholar] [CrossRef]
  32. Lu, Y.; Rao, S.; Huang, F.; Cai, Y.X.; Cai, K.Z. Effects of biochar amendment on tomato bacterial wilt resistance, soil microbial amount and activity. Int. J. Agron. 2016, 3, 1–10. [Google Scholar] [CrossRef] [Green Version]
  33. Elie, D.; Wydra, K. Interaction between silicon amendment, bacterial wilt development and phenotype of Ralstonia solanacearum in tomato genotypes. Physiol. Mol. Plant Pathol. 2004, 64, 233–243. [Google Scholar]
  34. Fang, Z. Research Methods of Plant Pathology; China Agriculture Press: Beijing, China, 1998. [Google Scholar]
  35. Wang, S.; Tian, H.; Liu, J.; Pan, S. Pattern and change of soil organic carbon storage in China: 1960s–1980s. Tellus B Chem. Phys. Meteorol. 2003, 55, 416–427. [Google Scholar]
  36. Lu, R.K. Analysis Method of Soil Agricultural Chemistry; China Agricultural Science and Technology Press: Beijing, China, 2000. [Google Scholar]
  37. Olsen, S.R. Estimation of Available Phosphorus in Soils by Extraction with Sodium Bicarbonate; United States Department of Agriculture: Washington, DC, USA, 1954.
  38. Zantua, M.I.; Bremner, J.M. Stability of urease in soils. Soil Biol. Biochem. 1977, 9, 135–140. [Google Scholar] [CrossRef]
  39. Tabatabai, M.A.; Bremner, J.M. Use of p-nitrophenyl phosphate for assay of soil phosphatase activity. Soil Biol. Biochem. 1969, 1, 301–307. [Google Scholar] [CrossRef]
  40. Havir, E.; Mchale, N.A. Biochemical and developmental characterization of multiple forms of catalases in tobacco leaves. Plant Physiol. 1987, 84, 450–455. [Google Scholar] [CrossRef] [Green Version]
  41. Berg, J.; Brandt, K.K.; Al-Soud, W.A.; Holm, P.E.; Hansen, L.H.; Sørensen, S.J.; Nybroe, O. Selection for Cu-tolerant bacterial communities with altered composition, but unaltered richness, via long-term Cu exposure. Appl. Environ. Microbiol. 2012, 78, 7438–7446. [Google Scholar] [CrossRef] [Green Version]
  42. Edgar, R.C. Search and clustering orders of magnitude faster than BLAST. Bioinformatics 2010, 26, 2460–2461. [Google Scholar] [CrossRef] [Green Version]
  43. Wang, Q.; Garrity, G.M.; Tiedje, J.M.; Cole, J.R. Naïve Bayesian classifier for rapid assignment of rRNA sequences into the new bacterial taxonomy. Appl. Environ. Microb. 2007, 73, 5261–5267. [Google Scholar] [CrossRef] [Green Version]
  44. Spellerberg, I.F.; Fedor, P.J. A tribute to Claude Shannon (1916–2001) and a plea for more rigorous use of species richness, species diversity and the ‘Shannon–Wiener’ Index. Global Ecol. Biogeogr. 2003, 12, 177–179. [Google Scholar] [CrossRef] [Green Version]
  45. Chao, A. Nonparametric estimation of the number of classes in a population. Scand. J. Stat. 1984, 11, 265–270. [Google Scholar]
  46. Jaiswal, A.K.; Elad, Y.; Graber, E.R.; Frenkel, O. Rhizoctonia solani suppression and plant growth promotion in cucumber as affected by biochar pyrolysis temperature, feedstock and concentration. Soil Bio. Biochem. 2014, 69, 110–118. [Google Scholar] [CrossRef]
  47. Korolev, N.; David, D.R.; Elad, Y. The role of phytohormones in basal resistance and Trichoderma-induced systemic resistance to Botrytis cinerea in Arabidopsis thaliana. BioControl 2008, 53, 667–683. [Google Scholar] [CrossRef]
  48. Atkinson, C.J.; Fitzgerald, J.D.; Hipps, N.A. Potential mechanisms for achieving agricultural benefits from biochar application to temperate Soils: A review. Plant Soil 2010, 337, 1–18. [Google Scholar] [CrossRef]
  49. Gregory, S.J.; Anderson, C.W.; Camps-Arbestain, M.; Biggs, P.J.; Ganley, A.R.; O’Sullivan, J.M.; McManus, M.T. Biochar in co-contaminated soil manipulates arsenic solubility and microbiological community structure, and promotes organochlorine degradation. PLoS ONE 2015, 10, e0125393. [Google Scholar] [CrossRef]
  50. Githinji, L. Effect of biochar application rate on soil physical and hydraulic properties of a sandy loam. Arch. Agron. Soil Sci. 2014, 60, 457–470. [Google Scholar] [CrossRef]
  51. Schulz, H.; Dunst, G.; Glaser, B. No effect level of co-composted biochar on plant growth and soil properties in a greenhouse experiment. Agronomy 2014, 4, 34–51. [Google Scholar] [CrossRef] [Green Version]
  52. Wang, Y.; Ma, Z.; Wang, X.; Sun, Q.R.; Dong, H.Q.; Wang, G.S.; Chen, X.S.; Yin, C.M.; Han, Z.H.; Mao, Z.Q. Effects of biochar on the growth of apple seedlings, soil enzyme activities and fungal communities in replant disease soil. Sci. Hortic. 2019, 256, 108641. [Google Scholar] [CrossRef]
  53. Alkorta, I.; Aizpurua, A.; Riga, P.; Albizu, I.; Amézaga, I.; Garbisu, C. Soil enzyme activities as biological indicators of soil health. Rev. Environ. Health 2003, 18, 65–73. [Google Scholar] [CrossRef]
  54. Ghani, M.I.; Ali, A.; Atif, M.J.; Ali, M.; Amin, B.; Anees, M.; Khurshid, H.; Cheng, H.Z. Changes in the soil microbiome in eggplant monoculture revealed by high-throughput Illumina MiSeq Sequencing as influenced by raw garlic stalk amendment. Int. J. Mol. Sci. 2019, 20, 2125. [Google Scholar] [CrossRef] [Green Version]
  55. Raaijmakers, J.M.; Mazzola, M. Soil immune responses. Science 2016, 352, 1392–1393. [Google Scholar] [CrossRef] [PubMed]
  56. Wu, K.; Su, L.; Fang, Z.Y.; Yuan, S.F.; Wang, L.L.; Shen, B.; Shen, Q.R. Competitive use of root. exudates by Bacillus amyloliquefaciens with Ralstonia solanacearum decreases the pathogenic population density and effectively controls tomato bacterial wilt. Sci. Hortic. 2017, 218, 132–138. [Google Scholar] [CrossRef]
  57. Rutigliano, F.A.; Romano, M.; Marzaioli, R.; Baglivo, I.; Baronti, S.; Miglietta, F.; Castaldi, S. Effect of biochar addition on soil microbial community in a wheat crop. Eur. J. Soil Biol. 2011, 60, 9–15. [Google Scholar] [CrossRef]
  58. Luo, Y.; Durenkamp, M.; Nobili, M.D.; Lin, Q.; Devonshire, B.J.; Brookes, P.C. Microbial biomass growth following incorporation of biochars produced at 350 °C or 700 °C, in a silty-clay loam soil of high and low pH. Soil Biol. Biochem. 2013, 57, 513–523. [Google Scholar] [CrossRef]
  59. Hu, L.; Cao, L.; Zhang, R. Bacterial and fungal taxon changes in soil microbial community composition induced by short-term biochar amendment in red oxidized loam soil. World J. Microb. Biot. 2014, 30, 1085–1092. [Google Scholar] [CrossRef]
  60. Xu, H.J.; Wang, X.H.; Li, H.; Yao, H.Y.; Su, J.Q.; Zhu, Y.G. Biochar impacts soil microbial community composition and nitrogen cycling in an acidic soil planted with rape. Environ. Sci. Technol. 2014, 48, 9391–9399. [Google Scholar] [CrossRef]
  61. Khodadad, C.L.; Zimmerman, A.R.; Green, S.J.; Uthandi, S.; Foster, J.S. Taxa-specific changes in soil microbial community composition induced by pyrogn-c carbon amendments. Soil Biol. Biochem. 2011, 43, 385–392. [Google Scholar] [CrossRef]
  62. Lauber, C.L.; Hamady, M.; Knight, R.; Fierer, N. Pyrosequencing-based assessment of soil pH as a predictor of soil bacterial community structure at the continental scale. Appl. Environ. Microbiol. 2009, 75, 5111–5120. [Google Scholar] [CrossRef] [Green Version]
  63. Xu, N.; Tan, G.C.; Wang, H.Y.; Gai, X.P. Effect of biochar additions to soil on nitrogen leaching, microbial biomass and bacterial community structure. Eur. J. Soil Biol. 2016, 74, 1–8. [Google Scholar] [CrossRef]
  64. Naumoff, D.G.; Dedysh, S.N. Lateral gene transfer between the Bacteroidetes and Acidobacteria: The case of ɑ-L-Rhamnosidases. FEBS Lett. 2012, 586, 3843–3851. [Google Scholar] [CrossRef] [Green Version]
  65. Qin, S.; Xing, K.; Jiang, J.H.; Xu, L.H.; Li, W.J. Biodiversity, bioactive natural products and biotechnological potential of plant associated endophytic actinobacteria. Appl. Microbiol. Biot. 2011, 89, 457–473. [Google Scholar] [CrossRef]
  66. Haas, D.; Defago, G. Biological control of soil-borne pathogens by fluorescent pseudomonads. Nat. Rev. Microbiol. 2005, 3, 307–319. [Google Scholar] [CrossRef]
  67. Bakker, P.A.; Pieterse, C.M.; Loon, L.C. Induced systemic resistance by fluorescent Pseudomonas spp. Phytopathology 2007, 97, 239–243. [Google Scholar] [CrossRef] [Green Version]
  68. Mendes, R.; Kruijt, M.; de Bruijn, I.; Dekkers, E.; Voor, M.; Schneider, J.H.; Piceno, Y.M.; DeSantis, T.Z.; Andersen, G.L.; Bakker, P.A.; et al. Deciphering the rhizosphere microbiome for disease-suppressive bacteria. Science 2011, 332, 1097–1100. [Google Scholar] [CrossRef]
  69. Ramesh, R.; Joshi, A.A.; Ghanekar, M.P. Pseudomonads: Major antagonistic endophytic bacteria to suppress bacterial wilt pathogen, Ralstonia solanacearum in the eggplant (Solanum melongena L.). World J. Microb. Biot. 2009, 25, 47–55. [Google Scholar] [CrossRef]
  70. Berendsen, R.L.; Pieterse, C.M.; Bakker, P.A. The rhizosphere microbiome and plant health. Trends Plant Sci. 2012, 17, 478–486. [Google Scholar] [CrossRef]
Figure 1. Effects of biochar on the disease severity of tomato bacterial wilt. Rs, Ralstonia solanacearum inoculation without biochar amendment; Rs + BC, biochar amendment and R. solanacearum inoculation. Disease severity was rated daily for 7 days using a disease severity scale, in which 0: no wilted leaves; 1: 1–25% leaves wilted; 2: 26–50% leaves wilted; 3: 51–75% leaves wilted, 4: >75% leaves wilted; and 5: plant death. The experiment was repeated twice with 10 plants for each biological replicate, * indicate significant difference between the two treatments (* p < 0.05, Student’s t-test).
Microorganisms 07 00676 g001
Figure 2. Effects of biochar and R. solanacearum inoculation on soil enzyme activities of Urease (A), Acid phosphatase (B) and Catalase (C). CK, no biochar and no R. solanacearum inoculation; Rs, R. solanacearum inoculation without biochar amendment; BC, biochar addition without R. solanacearum inoculation; Rs + BC, biochar amendment and R. solanacearum inoculation. Bars represent standard error. Columns with different letters indicate significant differences among treatments (p < 0.05).
Microorganisms 07 00676 g002aMicroorganisms 07 00676 g002b
Figure 3. Phylogenetic distances of rhizosphere soil samples determined via Principal Coordinates Analysis (PCoA). CK, no biochar and no R. solanacearum inoculation; Rs, R. solanacearum inoculation without biochar amendment; BC, biochar addition without R. solanacearum inoculation; Rs + BC, biochar amendment and R. solanacearum inoculation.
Microorganisms 07 00676 g003
Figure 4. Effects of biochar and R. solanacearum inoculation on taxonomic distribution of operational taxonomic units (OTUs) (97% identity) at the bacteria phylum level of the rhizosphere soil (top 11). CK, no biochar and no R. solanacearum inoculation; Rs, R. solanacearum inoculation without biochar amendment; BC, biochar addition without R. solanacearum inoculation; Rs + BC, biochar amendment and R. solanacearum inoculation. The total sum of 16S rRNA gene sequence counts of OTUs among subsamples within plots and among replicate plots within each treatment was used to generate the relative abundance data for the figure.
Microorganisms 07 00676 g004
Figure 5. Relative abundance of Acidobacteria (A), Bacteroidetes (B), Proteobacteria (C), Nitrospira (D), and Gemmatimonadetes (E) of the rhizosphere soil. CK, no biochar and no R. solanacearum inoculation; Rs, R. solanacearum inoculation without biochar amendment; BC, biochar addition without R. solanacearum inoculation; Rs + BC, biochar amendment and R. solanacearum inoculation. Bars above the histogram represent the standard error of three replicates. Columns with different letters indicate significant differences among treatments (p < 0.05).
Microorganisms 07 00676 g005
Figure 6. Relative abundance of Bacteroidetes in the rhizosphere soil amended with biochar and R. solanacearum inoculation. CK, no biochar and no R. solanacearum inoculation; Rs, R. solanacearum inoculation without biochar amendment; BC, biochar addition without R. solanacearum inoculation; Rs + BC, biochar amendment and R. solanacearum inoculation. Columns with different letters indicate different among treatments (p < 0.05).
Microorganisms 07 00676 g006
Figure 7. Relative abundance of Pseudomonas in rhizosphere soil amended with biochar and R. solanacearum inoculation. CK, no biochar and no R. solanacearum inoculation; Rs, R. solanacearum inoculation without biochar amendment; BC, biochar addition without R. solanacearum inoculation; Rs + BC, biochar amendment and R. solanacearum inoculation. Bars above the histogram represent the standard error of three replicates. Columns with different letters indicate significant differences among treatments (p < 0.05).
Microorganisms 07 00676 g007
Figure 8. Redundancy analysis between soil properties and soil microbial community with biochar and R. solanacearum inoculation. CK, no biochar and no R. solanacearum inoculation; Rs, R. solanacearum inoculation without biochar amendment; BC, biochar addition without R. solanacearum inoculation; Rs + BC, biochar amendment and R. solanacearum inoculation. The soil properties were fitted to the plots using a permutations test (p-values).
Microorganisms 07 00676 g008
Table 1. Effects of biochar and R. solanacearum on soil total organic carbon (TOC), total nitrogen (TN), C:N ratio (C/N), soil organic matter (SOM), pH, and electrical conductivity (EC).
TreatmentTOC g·kg−1TN g·kg−1C/NSOM g·kg−1pHEC µS·cm−1
CK7.3 ± 0.05 b0.85 ± 0.025 b7.16 ± 0.34 b12.4 ± 0.08 b5.9 ± 0.20 b111.3 ± 19.7 b
BC11.2 ± 0.56 a1.07 ± 0.005 a10.80 ± 0.4 a19.0 ± 0.95 a6.5 ± 0.05 a,b384.0 ± 32.0 a
Rs6.6 ± 0.12 b0.83 ± 0.030 b7.05 ± 0.52 b11.1 ± 0.20 b6.1 ± 0.10 a,b115.5 ± 9.5 b
Rs + BC9.5 ± 0.28 a0.94 ± 0.025 a10.20 ± 0.41 a16.2 ± 0.48 a6.7 ± 0.05 a380.0 ± 21.4 a
Different letters indicate significant differences between means within columns at p < 0.05.
Table 2. Effects of biochar and R. solanacearum on soil available N, P, and K.
TreatmentAvailable N mg·kg−1Available P mg·kg−1Available K mg·kg−1
CK420.0 ± 7.50 b128.8 ± 0.38 b162.8 ± 0.01 b
BC393.8 ± 6.25 b,c137.3 ± 0.56 a661.1 ± 0.08 a
Rs367.5 ± 5.05 c131.7 ± 0.85 b147.6 ± 0.04 b
Rs + BC520.0 ± 10.55 a139.8 ± 1.06 a736.8 ± 0.10 a
Different letters indicate significant differences between means within columns at p < 0.05.
Table 3. Effects of biochar and R. solanacearum inoculation on soil microbial diversity.
TreatmentShannon IndexSimpson IndexACEChao
CK6.51 ± 0.10 a0.99 ± 0.002 a6854 ± 517 a5590 ± 94 a
BC6.41 ± 0.12 a0.98 ± 0.002 a8805 ± 2561 a6674 ± 1401 a
Rs6.64 ± 0.06 a0.99 ± 0.001 a8370 ± 232 a6348 ± 179 a
Rs + BC6.61 ± 0.13 a0.99 ± 0.003 a9623 ± 1370 a6999 ± 794 a
Different letters in the same column indicate significant differences among treatments (p < 0.05)

