Article

Global Gene Responses of Resistant and Susceptible Sugarcane Cultivars to Acidovorax avenae subsp. avenae Identified Using Comparative Transcriptome Analysis

National Engineering Research Center for Sugarcane, Fujian Agriculture and Forestry University, Fuzhou 350002, Fujian, China
*
Author to whom correspondence should be addressed.
Submission received: 20 November 2019 / Revised: 13 December 2019 / Accepted: 14 December 2019 / Published: 19 December 2019
(This article belongs to the Special Issue Plant Microbial Interactions)

Abstract

:
Red stripe disease in sugarcane caused by Acidovorax avenae subsp. avenae (Aaa) is related to serious global losses in yield. However, the underlying molecular mechanisms associated with responses of sugarcane plants to infection by this pathogen remain largely unknown. Here, we used Illumina RNA-sequencing (RNA-seq) to perform large-scale transcriptome sequencing of two sugarcane cultivars to contrast gene expression patterns of plants between Aaa and mock inoculations, and identify key genes and pathways involved in sugarcane defense responses to Aaa infection. At 0–72 hours post-inoculation (hpi) of the red stripe disease-resistant cultivar ROC22, a total of 18,689 genes were differentially expressed between Aaa-inoculated and mock-inoculated samples. Of these, 8498 and 10,196 genes were up- and downregulated, respectively. In MT11-610, which is susceptible to red stripe disease, 15,782 genes were differentially expressed between Aaa-inoculated and mock-inoculated samples and 8807 and 6984 genes were up- and downregulated, respectively. The genes that were differentially expressed following Aaa inoculation were mainly involved in photosynthesis and carbon metabolism, phenylpropanoid biosynthesis, plant hormone signal transduction, and plant–pathogen interaction pathways. Further, qRT-PCR and RNA-seq used for additional validation of 12 differentially expressed genes (DEGs) showed that eight genes in particular were highly expressed in ROC22. These eight genes participated in the biosynthesis of lignin and coumarin, as well as signal transduction by salicylic acid, jasmonic acid, ethylene, and mitogen-activated protein kinase (MAPK), suggesting that they play essential roles in sugarcane resistance to Aaa. Collectively, our results characterized the sugarcane transcriptome during early infection with Aaa, thereby providing insights into the molecular mechanisms responsible for bacterial tolerance.

1. Introduction

Sugarcane accounts for 80% of sugar production worldwide, and also provides cellulosic biomass for grazing livestock and biofuel production [1]. Modern sugarcane cultivars (2n = 100–130) originate from the nobilization process, which involves interspecific hybridization between Saccharum officinarum (also known as noble cane, 2n = 80) and S. spontaneum (2n = 40–128) and further backcrossing to S. officinarum [2]. The high sugar content of these hybrids originates from S. officinarum whereas other traits such as hardiness, disease resistance, and ratooning can be attributed to S. spontaneum [3,4]. Modern sugarcane varieties have a narrow genetic base due to their common origins from some cultivars that were produced in the early 1900s, and this lack of genetic diversity has hindered attempts to increase sugarcane production and resistance to diverse abiotic and biotic stresses [5,6]. As a vegetatively propagated crop, sugarcane has become increasingly vulnerable to certain viral pathogens and other non-fungal pathogens [7], resulting in varietal degeneration in sugarcane, as evidenced by a loss of vigor in sugarcane cultivars [8]. Yield losses in sugarcane due to biotic stresses can be up to 10–15% worldwide [9].
In addition to the three main bacterial diseases of sugarcane, namely ratoon stunting caused by Leifsonia xyli subsp. xyli (Lxx), leaf scald caused by Xanthomonas albilineans, and gumming caused by X. vasicola pv. vasculorum [10], red stripe disease is another important bacterial disease caused by the bacterium Acidovorax avenae subsp. avenae (Aaa) [11]. Red stripe disease is present in more than 50 countries, including China [11,12]. The discovery of this disease and its causal agents were tracked to the 1920s in Hawaii [13]. The causal agent of red stripe disease was formerly referred to as Pseudomonas rubrilineans [13] but was later updated to Aaa under the genus Acidovorax of the family Comamonadaceae [14]. In recent years, Aaa was also successfully isolated from diseased sugarcane plants in Argentina [15] and China [11,16]. Two types of disease symptoms, leaf stripe and top rot, appear or co-exist in sugarcane affected by Aaa. The leaf stripe symptoms manifest as uniformly long and narrow dark-red stripes across the longitudinal axis of the leaf whereas top rot is associated with rotting at the top of the plant [13]. An outbreak of red stripe disease recently occurred in Argentina and caused a 30% loss in yield [15]. In China, sugarcane red stripe disease has been found in many provinces since the 1980s and recent field surveys have revealed that this disease has an incidence of up to 80% in highly susceptible sugarcane cultivars [11,16]. Thus, strategies for the biological prevention and increased resistance of sugarcane are urgently needed. However, we have limited insight into the molecular and pathogenic mechanisms of Aaa in sugarcane.
Next generation high-throughput sequencing (RNA sequencing) has been widely used for transcriptome studies of plants under biotic and abiotic stresses, and have helped to increase our understanding of the underlying genes and gene regulatory networks mediated by different stresses [1,17]. This RNA sequencing (RNA-seq) technology has been applied to examine how sugarcane responds to diverse pathogens infections, such as Sorghum mosaic virus (SrMV) and Sugarcane streak mosaic virus (SCSMV) associated with mosaic disease [18,19], Sporisorium scitamineum that causes smut [20,21], Fusarium verticillioides that causes pokkah boeng [22], and three main pathogenic bacteria, Lxx [23,24], X. albilineans [25], and Aaa [26]. These studies provided a basis for understanding the molecular mechanisms of sugarcane–pathogen interactions, but sugarcane plants have an array of different defense mechanisms against various invading pathogens.
Until now, only one investigation of sugarcane responses to Aaa infection has been conducted. This study used transcriptome analysis of limited samples, namely, two biological replicates of mock- and Aaa-infected plants at one time point [26]. Identification of additional differentially expressed genes (DEGs) and related defense pathways that are triggered in response to Aaa infection of sugarcane is needed. In this study, we used Illumina RNA-seq technology to carry out a comparative transcriptome analysis of two resistant and susceptible sugarcane cultivars inoculated with Aaa at four time points. Our results provide new insights for understanding the molecular defense mechanisms involved in sugarcane response to Aaa infection.

2. Materials and Methods

2.1. Plant Growth, Bacteria Inoculation and Leaf Tissue Sampling

Two sugarcane cultivars, ROC22 (resistant to red stipe) and MT11-610 (susceptible to red stipe), supplied by the Taiwan Sugar Corporation (Taiwan, China) and Fujian Academy of Agricultural Sciences (Zhangzhou, China), respectively, were used. Buds from the two cultivars were germinated and cultured in a growth chamber at 28 °C and 60% humidity under 16/8 h light/dark photoperiod until the plants were approximately 15–20 cm tall (3–5 leaf stage). Eighteen plants of each cultivar were injected with a bacterial suspension (108 CFU/mL) of Aaa SC-026 following the protocol described by Li et al. [11]. Another ten plants from each cultivar were injected with only sterile selective nutrient broth (NB) medium (10.0 g/L peptone, 3.0 g/L beef extract, and 5.0 g/L sodium chloride) and used as controls. Leaf samples from the two cultivars were collected for RNA-seq at four time points: 0 h (R0_CK and S0_CK), 24 h (R24_Aaa and S24_Aaa), 48 h (R48_Aaa and S48_Aaa), and 72 h (R72_Aaa and S72_Aaa) post-inoculation (hpi). At each sampling time point, inoculated leaf tissues from six plants (three replicates) of each treatment were sampled and immediately snap-frozen in liquid nitrogen and stored at −80 °C until RNA and DNA extraction. A total of 24 samples were used for Illumina RNA-seq deep sequencing and were also used for the quantitative detection of bacterial populations in each sample.

2.2. RNA-Sequencing and de novo Transcriptome Assembly

After the quality and quantity of extracted total leaf RNA was determined, 1.5 μg RNA from each sample was used as input material for RNA-seq. The library preparations were sequenced on an Illumina NovaSeq 6000 platform at Novogene Bioinformatics Institute (Beijing, China) and 150-bp paired-end reads (PE 150) were generated. Prior to generating the clean reads, the raw reads were used to remove reads containing adapters, poly-N, and low-quality reads. Meanwhile, the Q20, Q30, GC-content and sequence duplication level of the clean reads were calculated. These high clean reads were used for de novo transcriptome assembly by Trinity (v2012-10-05) [27] with the min_kmer_cov set to 2 by default. Default values were used for all other parameters. After transcriptome assembly, each unigene was annotated using the nucleotide database Nt (NCBI nucleotide sequences) and the protein databases Nr (NCBI non-redundant protein sequences), Pfam (Protein family) and Swiss-Prot (a manually annotated and reviewed protein sequence database), and assigned to functional categories in the KOG/COG (clusters of orthologous groups of proteins/eukaryotic ortholog groups), GO (gene ontology) and KEGG (Kyoto encyclopedia of genes and genomes) databases using BLASTx with an E value cutoff of 10−5. The Illumina sequencing data for sugarcane infected with Aaa were deposited in the NCBI Short Read Archive (SRA) database as BioProject accession number PRJNA579959.

2.3. Differential Expression Analysis

Gene expression levels were estimated by RSEM for each sample using default parameters [28]. Briefly, clean data were mapped back onto the assembled transcriptome and the read count for each gene was then obtained from the mapping results. The abundance of each assembled transcript was evaluated using fragments per kilobase per million reads (FPKM) [29]. For genes with more than one alternative transcript, the longest transcript was selected for FPKM calculation. Differential expression analysis between sample pairs was performed using the DESeq2 package [30]. The parameters of |log2(fold change)|>1.5 and p-value < 0.005 were set as the threshold for significantly differential expression. GO enrichment analysis of DEGs was conducted using the GOseq R package Wallenius non-central hyper-geometric distribution [31]. GO terms demonstrating significant enrichment were those with a p-value < 0.005. KEGG enrichment analysis of DEGs was carried out using KOBAS 2.0 with p-value < 0.05 [32,33].

2.4. Real-Time Quantitative PCR Assay

To validate the credibility of DEGs screened by RNA-Seq, 12 candidate genes comprising 9 and 3 up- and downregulated genes, respectively, were validated by quantitative real-time PCR (qRT-PCR). Based on the 12 DEGs sequences from the cDNA library, specific primers were designed for qRT-PCR assays using primer premier 5.0 software (Table S1). The glyceraldehyde-3-phosphate dehydrogenase (GAPDH) was used as an internal control. The first-strand cDNA was synthesized with a First Strand cDNA Synthesis Kit (Takara, Dalian, China) with the templates for 24 RNA samples that were from the above-mentioned RNA-seq experiments. Further, qPCR assays were carried out using SYBR Premix Ex TaqII (Takara, Dalian, China) on a QuantStudio® Real-Time PCR system (Applied Biosystems, Foster City, USA). The reactions included 10 μL TB GreenTM Premix EX Taq II, 1 μL cDNA, 0.4 μL forward primer (10 mM), 0.4 μL reverse primer (10 mM), 0.4 μL ROX Reference Dye II and 7.8 μL nuclease-free water. The qPCR reactions involved denaturation at 95 °C for 30 s, followed by 40 cycles of 5 s at 95 °C, and 34 s at 60 °C. The qRT-PCR data were analyzed using the 2−ΔΔCt quantitative method to determine differences in gene expression [34]. Three biological replicates and three technological replicates were used for each sample.

3. Results

3.1. Transcriptome Sequencing and Assembly

To globally investigate genes involved in sugarcane response to Aaa infection, 24 cDNA libraries were sequenced (Table S2). Between 55,408,650 and 62,218,354 raw reads were obtained for the Aaa susceptible ROC22 cultivar and between 58,224,389 and 65,758,625 raw reads were obtained for the Aaa resistant MT11-610 cultivar. These raw reads were filtered to yield 59,959,395, 61,259,067, 54,282,803, 57,434,943, 57,284,497, 64,485,665, 57,875,395, and 61,269,024 clean reads for R0_CK, R24_Aaa, R48_Aaa, R72_Aaa, S0_CK, S24_Aaa, S48_Aaa, and S72_Aaa, respectively. The GC content, Q30 and mapping percentage of the eight libraries was more than 55%, 90%, and 65%, respectively. The de novo sequence assembly of transcripts from RNA-seq reads showed that 579,561 transcripts were generated with an average length of 789 bp and an N50 of 1144 bp, whereas 507,558 unigenes were obtained with an average length of 860 bp and an N50 of 1200 bp (Table 1). The transcript and unigene lengths were between 201 bp and 15,496 bp. The length distribution of nucleotides ranged from 200 to 500 bp, accounting for 48.0% and 41.2% of the total transcripts and unigenes, respectively (Table 1).

3.2. Gene Annotation of Assembled Unigenes

All of the assembled high-quality unigenes were annotated by searching against seven public databases. Significant annotation matches were found for 264,027 (52.0%) in the Nr database, 352,564 (69.5%) in the Nt database, 149,669 (29.5%) in the Swiss-Prot database, 199,556 (39.3%) in the GO database and 173,258 (34.1%) in the Pfam database. Overall, 394,186 (77.7%) unigenes were successfully annotated in at least one of the seven databases, whereas 25,350 (5.0%) unigenes appeared in all seven databases (Figure S1A). Most of the annotated sequences corresponding to known nucleotide sequences of plant species in the NR database were matched with Sorghum bicolor (49.5%), Zea mays (24.8%), other species (10.0%), Setaria italic (9.7%), Oryza sativa (3.6%), and Saccharum hybrids (2.4%) (Figure S1B).

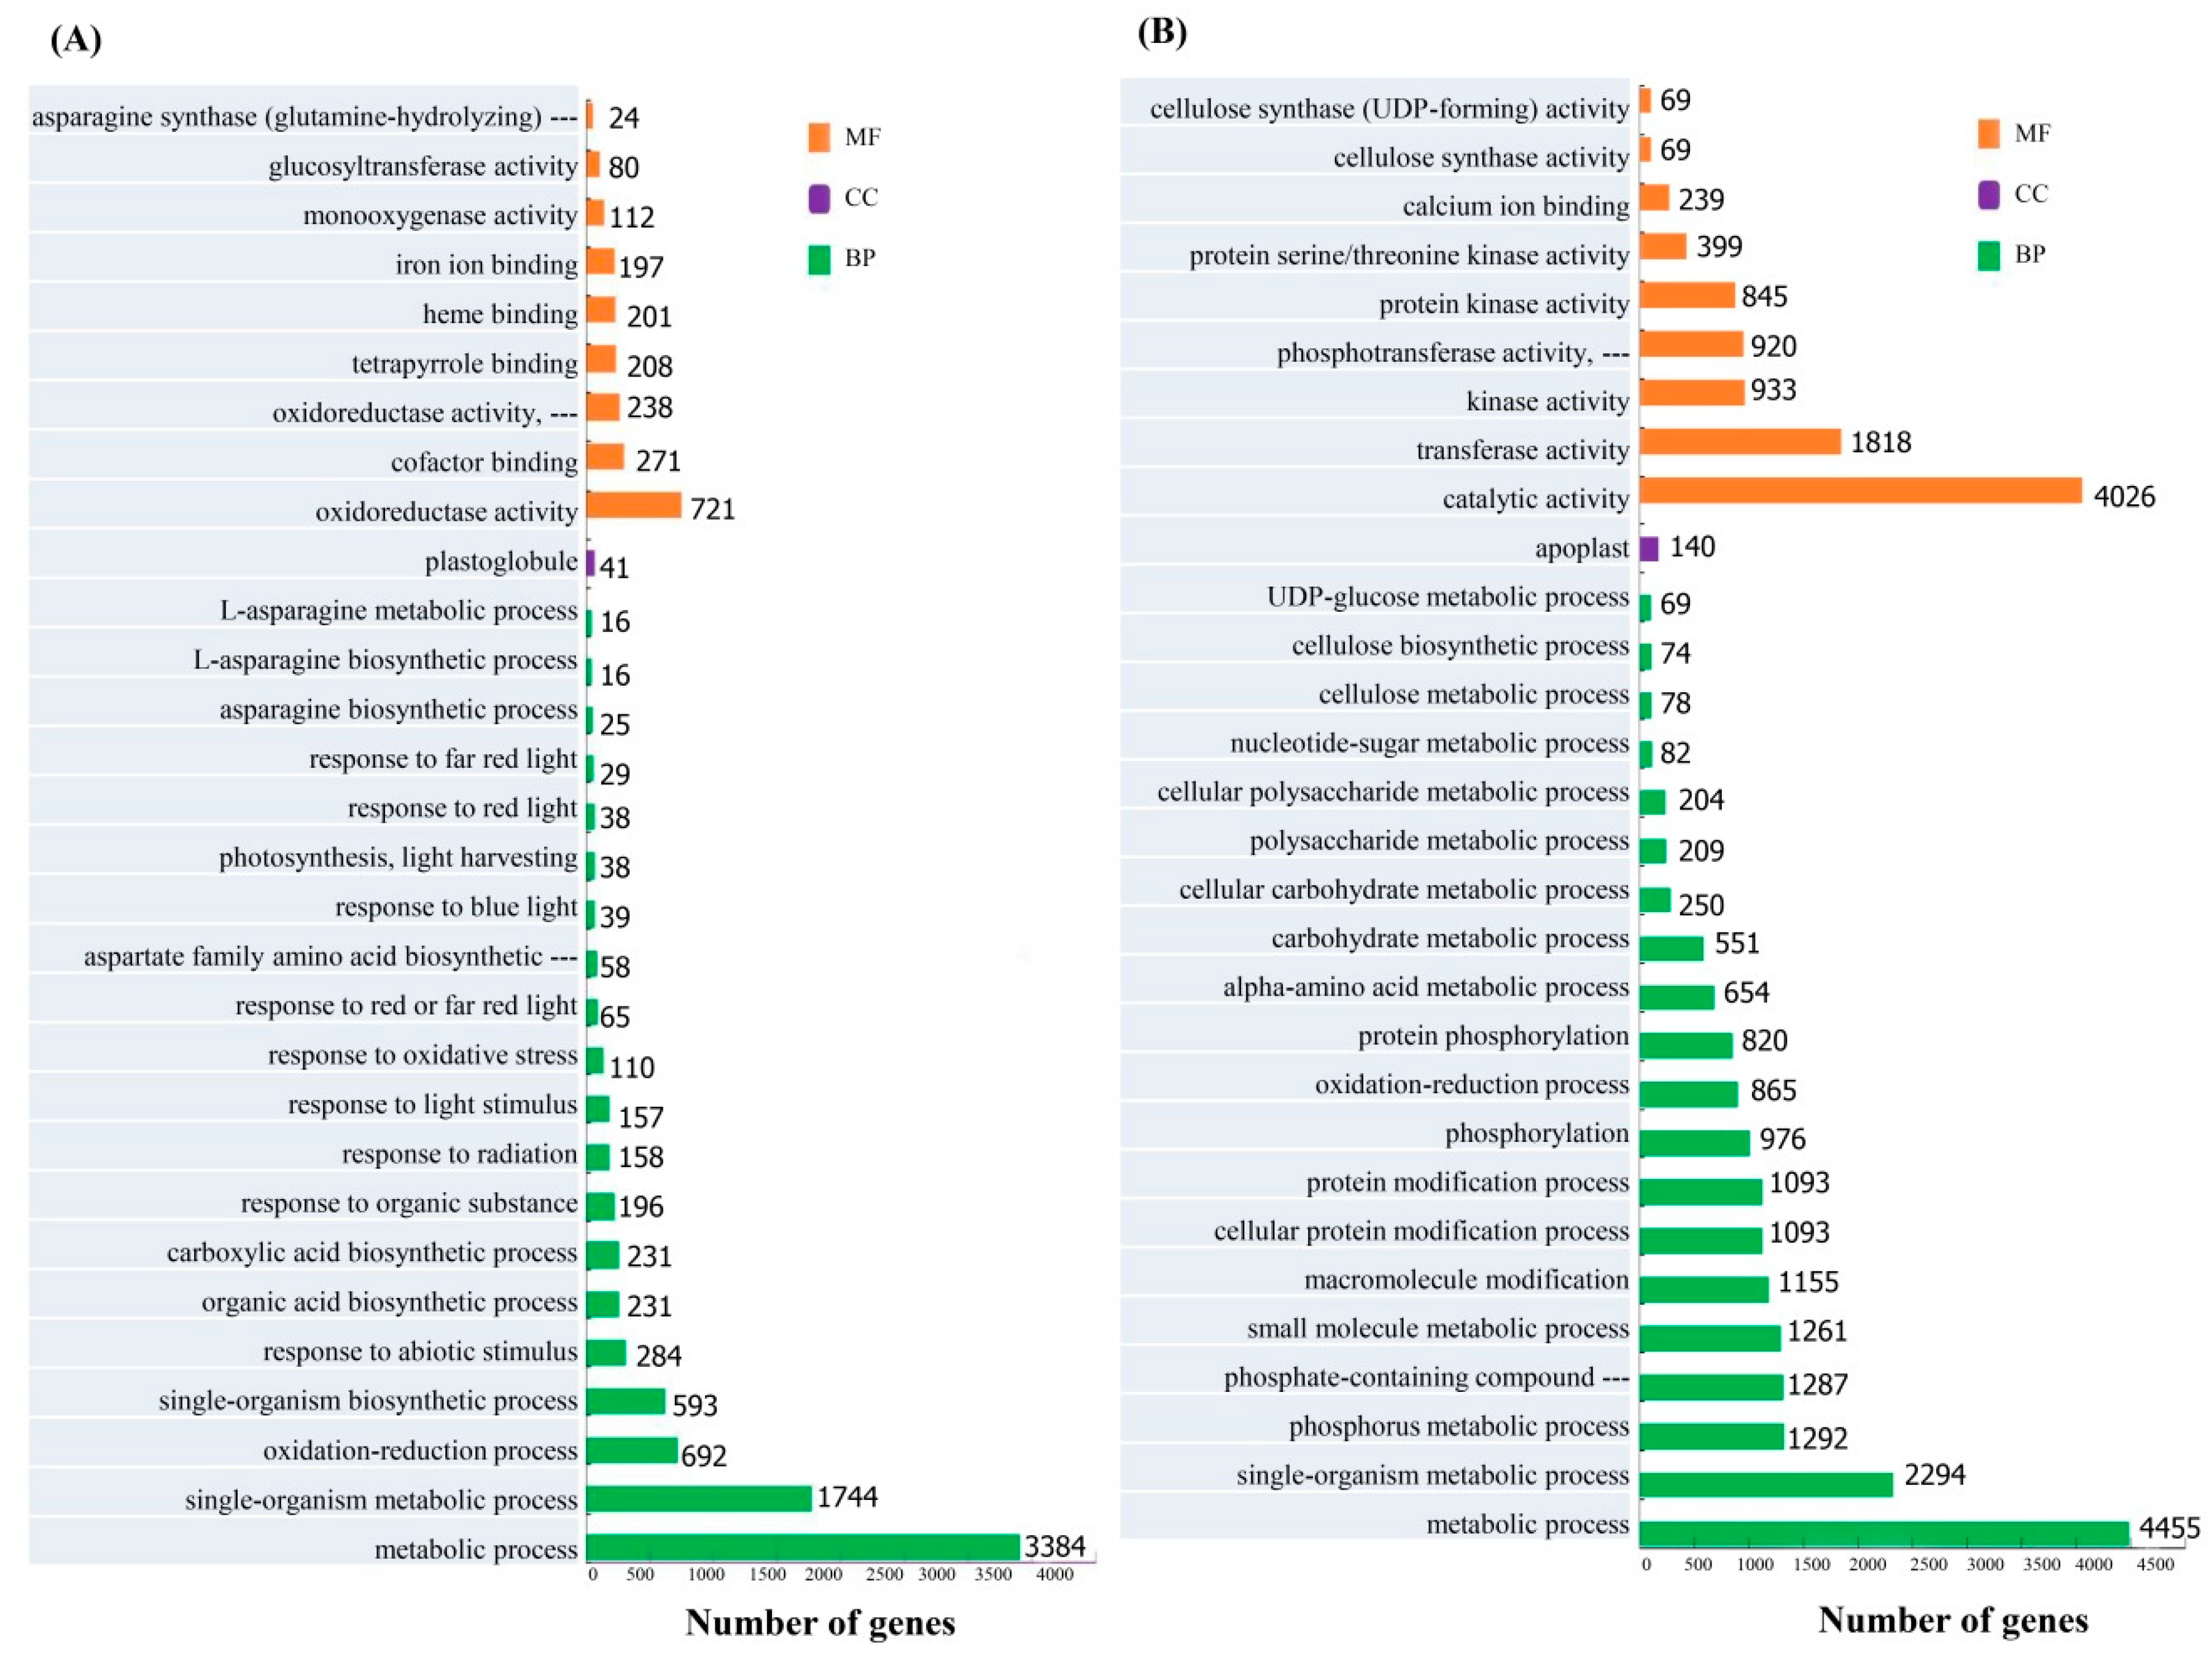
3.3. GO and KEGG Functional Classification of Unigenes

GO analysis revealed that 199,556 (39.3%) unigenes could be assigned into 58 functional categories in three main ontologies (Table S3). The top three largest GO terms in biological process were: 113,258 (21.7%) unigenes in cellular process (GO:0009987), 105,498 (20.2%) in metabolic process (GO:0008152), and 84,700 (16.2%) in single-organism process (GO:0044699). In total, 58,510 unigenes were annotated in 131 KEGG pathways using KOBAS v.2.0 software (Table S4). In the top three largest KEGG pathways, the most unigenes (2795, 4.8%) were annotated by plant-pathogen interactions (ko04626), followed by those for carbon metabolism (ko01200) (2741, 4.7%) and those for amino acid biosynthesis (ko01230) (2276, 3.9%). Other main pathways identified included starch and sucrose metabolism (ko00500), phenylpropanoid biosynthesis (ko00940), and plant hormone signal transduction (ko04075).

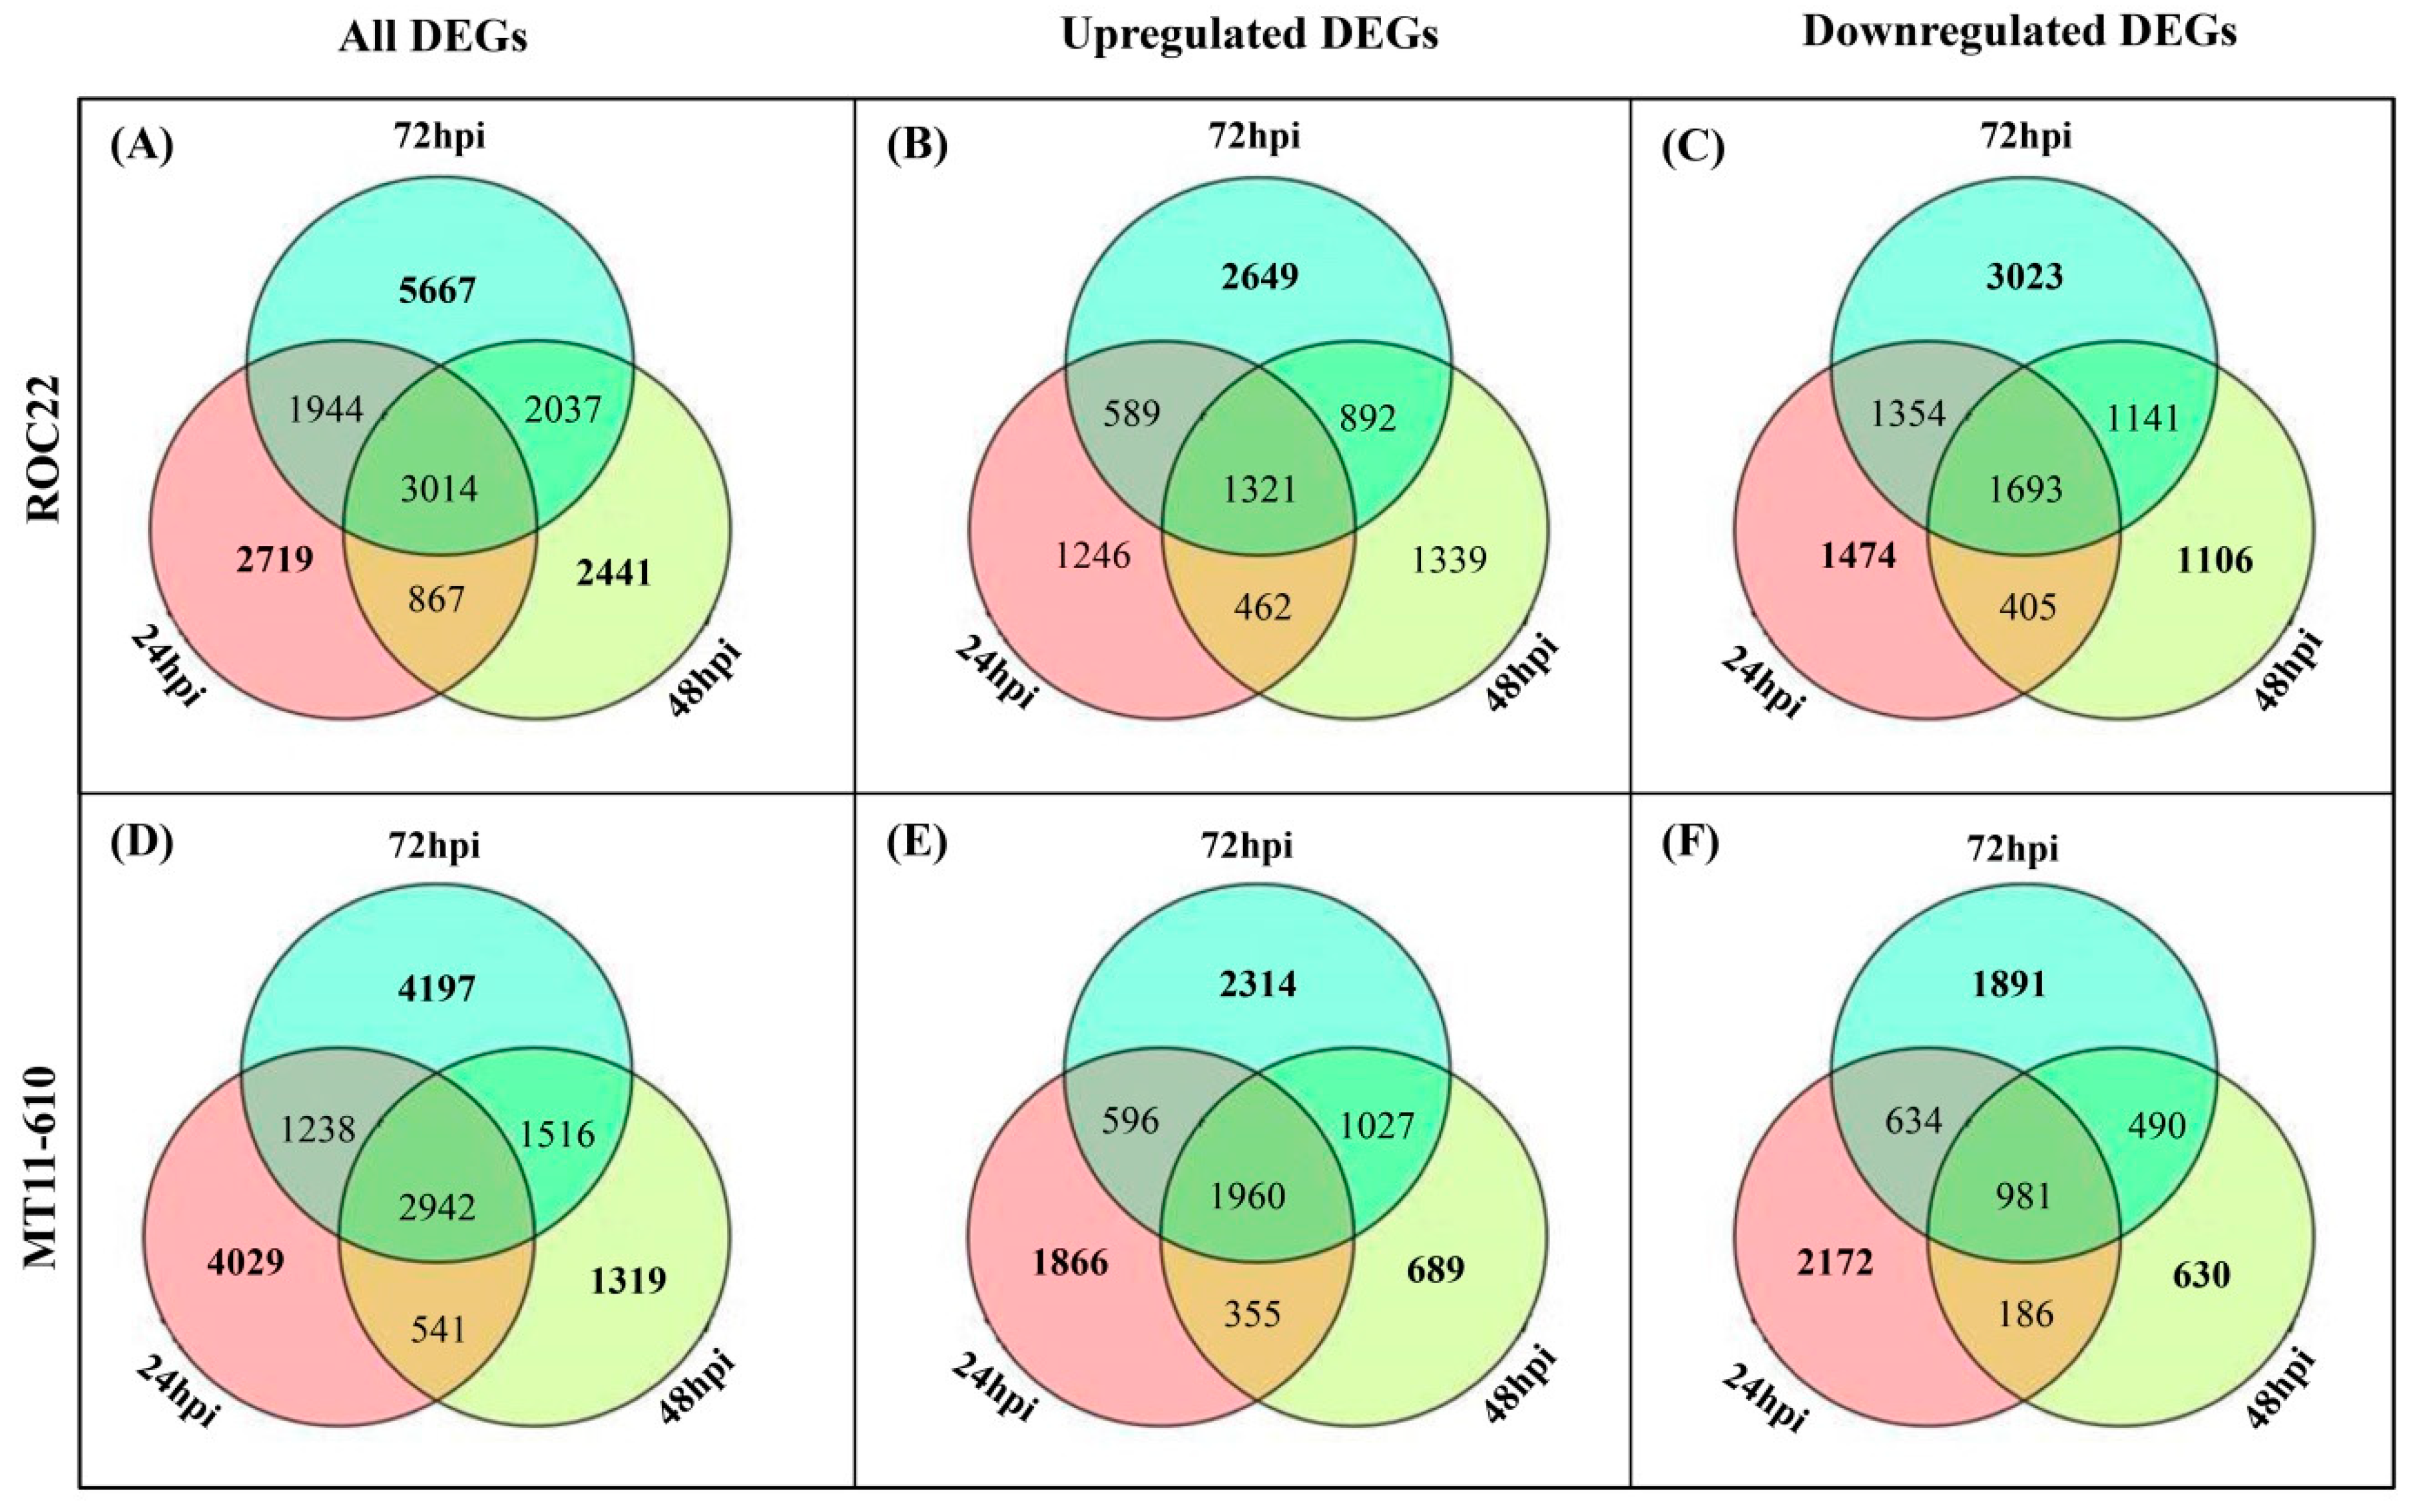
3.4. Identification and Functional Annotation of DEGs

A total of 29,887 DEGs were identified, of which 18,689 were present in the resistant cultivar ROC22 (R_Aaa vs R0_CK), and 15,782 were in the susceptible cultivar MT11-610 (S_Aaa vs S0_CK) (Figure 1). Furthermore, 8498 upregulated and 10,196 downregulated DEGs were found in ROC22, while MT11-610 had 8807 upregulated and 6984 downregulated DEGs. During the 24–72 hpi period, the number of regulated DEGs in ROC22 (2719) was lower than that for MT11-610 (4029) at 24 dpi, whereas the number of regulated DEGs in ROC22 (5667 and 2441) was higher compared to the number of DEGs in MT11-610 (4197 and 1319) at 48 dpi and 72 dpi, respectively (Figure 1). Notably, more upregulated DEGs were present in ROC22 at 48–72 hpi, compared with those for MT11-610 (Figure 1).
For the resistant cultivar ROC22, GO functional analysis revealed that 5464 and 6953 DEGs were up- and downregulated, respectively. Upregulated or downregulated DEGs were significantly enriched in two common GO categories, metabolic process and single-organism metabolic processes (Figure 2). The next most frequently enriched terms in upregulated and downregulated DEGs were oxidoreductase activity and catalytic activity, respectively. On the other hand, for the susceptible cultivar MT11-610, 5673 DEGs were upregulated and 4751 DEGs were downregulated. The top three GO categories for MT11-610 upregulated DEGs were respectively annotated as catalytic activity, single-organism metabolic process, and oxidation-reduction process (Figure S2A). For MT11-610 downregulated DEGs, the top three GO categories were respectively annotated as catalytic activity, carbohydrate metabolic process, and hydrolase activity (acting on glycosyl bonds) (Figure S2B).
KEGG analysis revealed that 3818 DEGs were significantly enriched in 67 pathways (Table S5). Of these pathways, 15 and 24 were present only in ROC22 and MT11-610, respectively, while 28 pathways occurred in both cultivars. The top ten KEGG pathways having the largest number of DEGs are listed in Table 2. Among these pathways, photosynthesis-antenna proteins and phenylpropanoid biosynthesis had 168 and 162 upregulated DEGs, respectively, for both cultivars. Meanwhile, 134 upregulated DEGs were enriched in ribosomes only in ROC22, and 102 upregulated DEGs were enriched in starch and sucrose metabolism only in MT11-610 (Table 2; Table S5). On the other hand, 186 downregulated DEGs were enriched in phenylpropanoid biosynthesis in both cultivars, whereas 145 and 80 downregulated DEGs involved in plant–pathogen interaction and plant hormone signal transduction, respectively, were seen only for ROC22, and 58 downregulated DEGs involved in starch and sucrose metabolism were seen only in MT11-610 (Table 2; Table S5).

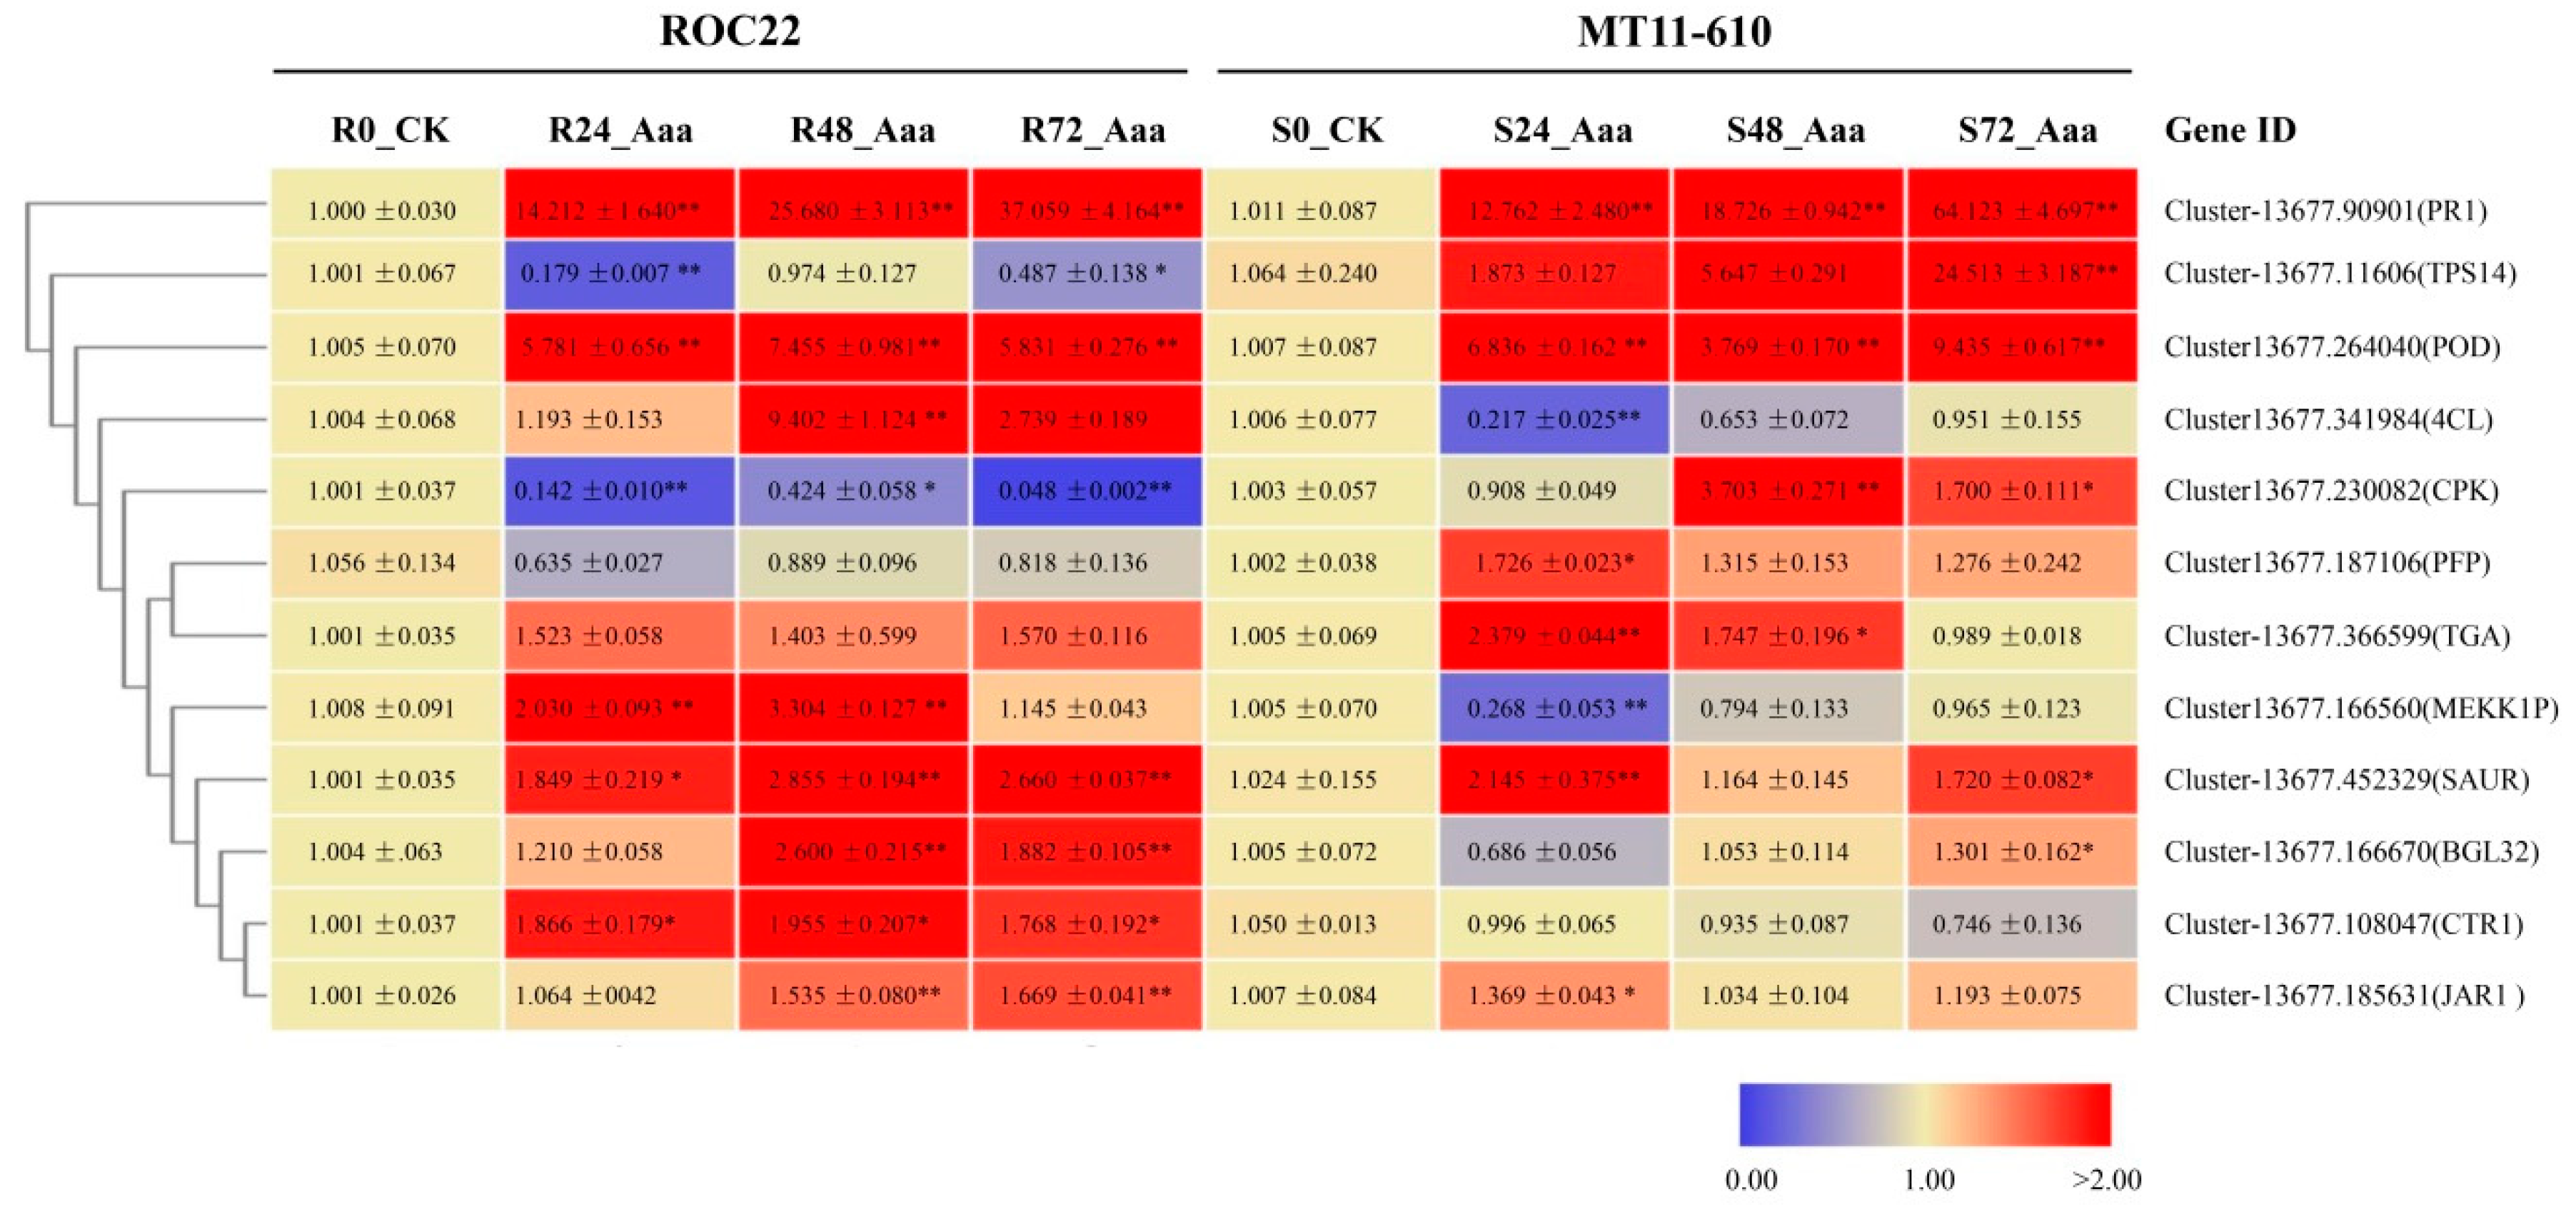
3.5. Validation of DEGs by Real-Time qRT-PCR Analysis

To validate the RNA-seq data, we randomly selected 12 DEGs for qRT-PCR analysis in both cultivars in response to Aaa infection. The 12 DEGs were involved in plant-pathogen interaction, plant hormone signal transduction, phenylpropanoid biosynthesis, monoterpenoid biosynthesis, and the pentose phosphate pathway. Transcriptional levels of two genes by RNA-seq (SAUR and PR1) were strongly upregulated in both cultivars, and seven genes (MEKK1P, 4CL, POD, BGL32, JAR1, CTR1, and TGA) were highly expressed only in ROC22 (Table 3). Notably, the expression of two genes (TPS14 and PFP) was highly upregulated in MT11-610 but depressed in ROC22. Overall, similar patterns of gene expression were observed between the qRT-PCR and RNA-seq-generated data. A significant positive correlation was observed between the two datasets, as indicated by a Pearson’s correlation coefficient r = 0.30438 (p = 0.0104; Figure 3).

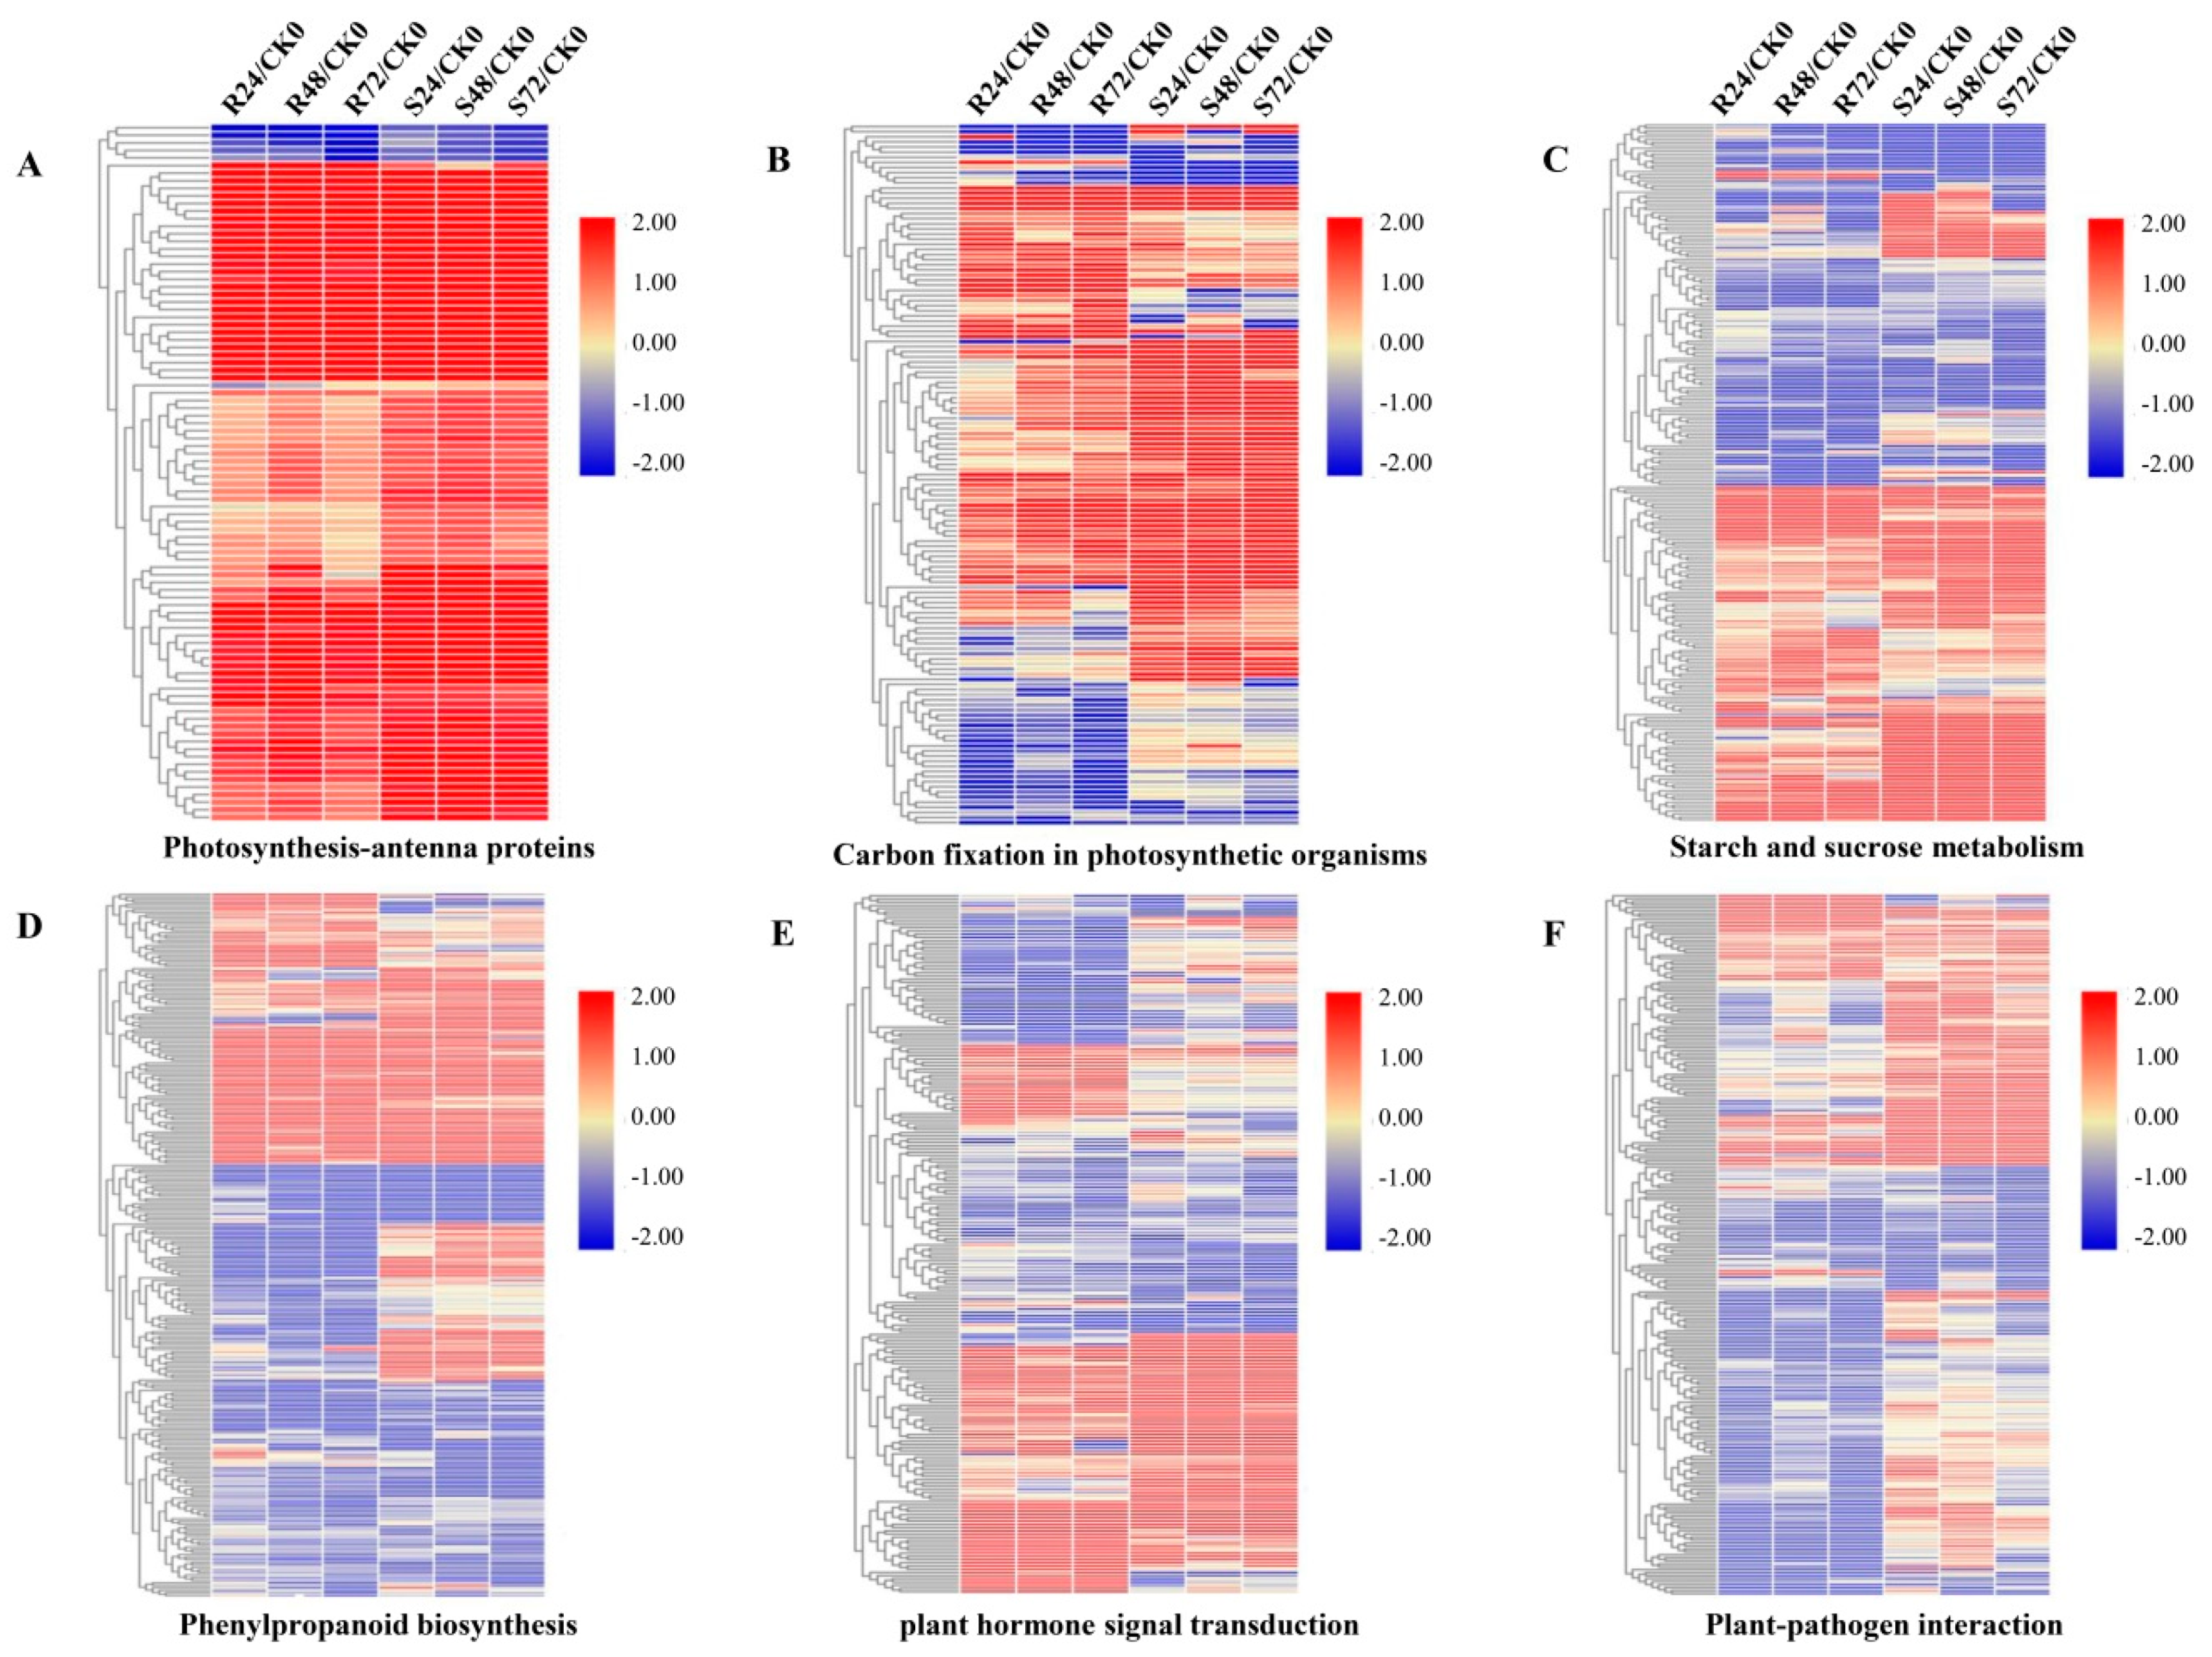
3.6. DEGs in Photosynthesis and Carbon Metabolism Pathways

A number of DEGs related to photosynthesis and carbon metabolism pathways were differentially regulated in response to Aaa attacks (Figure S3; Table S6). Among these, 87 of 92 DEGs related to light-harvesting complex I chlorophyll a/b binding proteins 1-4 (LHCA1-4) and light-harvesting complex II chlorophyll a/b binding proteins 1-7 (LHCB1-7) in photosynthesis-antenna proteins (Ko00196) were significantly upregulated (Figure 4A; Table S6). Most DEGs enriched in carbon fixation in the photosynthetic organism pathway (ko00710) were significantly upregulated. However, only about half the DEGs for the carbon dioxide fixation (Calvin cycle) phase were upregulated, including DEGs for three key enzymes in this phase: ribulose-bisphosphate carboxylase small chain (rbcS, EC4.1.1.39), phosphoglycerate kinase (PGK, EC2.7.2.3), and glyceraldehyde 3-phosphate dehydrogenase (GAPDH, EC1.2.1.12). Three DEGs for phosphoribulokinase (PRK, EC2.7.1.19) were downregulated (Figure 4B; Table S6). Notably, the majority of DEGs (56/83) for the C4-dicarboxylic acid cycle were highly upregulated in both cultivars (Figure 4B; Table S6). These DEGs encoded key enzymes in this phase, such as phosphoenolpyruvate carboxylase (PEPC, EC4.1.1.31), malate dehydrogenase (oxaloacetate-decarboxylating) (NADP+) (maeB, EC1.1.1.40), and pyruvate orthophosphate dikinase (PPDK, EC2.7.9.1). Unexpectedly, five of seven DEGs encoding malate dehydrogenase (NADP+) (MDH, EC1.1.1.82), one of the key enzymes in the C4-dicarboxylic acid cycle, were significantly downregulated in both cultivars.
On the other hand, different genes involved in starch and sucrose metabolism pathways (ko00500) presented differential expression patterns (Figure 4C; Table S6). Of the key enzymes involved in sucrose metabolism, most DEGs related to sucrose synthase (SS, EC2.4.1.13), hexokinase (EC2.7.1.1), and fructokinase (EC2.7.1.4) were upregulated in both cultivars, whereas most DEGs related to sucrose-phosphate synthase (SPS, EC2.4.1.14) and beta-fructofuranosidase (sacA, EC3.2.1.26) were upregulated only in MT11-610. On the other hand, of four key genes involved in starch metabolism, the gene (Cluster-13677.257821) for UTP-glucose-1-phosphate uridylyltransferase (UGP2, EC2.7.7.9) was upregulated in MT11-610 but downregulated in ROC22. The gene for 1,4-alpha-glucan branching enzyme (glgB, EC2.4.1.18) was downregulated, particularly in MT11-610, which showed the upregulation of genes for starch synthase (glgA, EC2.4.1.21), whereas two genes encoding starch phosphorylase (glgP, EC2.4.1.1) were downregulated in both cultivars.

3.7. DEGs in Phenylpropanoid Biosynthesis

A total of 275 DEGs were involved in phenylpropanoid biosynthesis, another notable pathway in response of sugarcane to Aaa infection (Figure S4; Table S7). Of the 275 DEGs in this pathway, 85 and 117 DEGs were up- and downregulated, respectively, in both cultivars, while other DEGs were regulated depending on the cultivar genotype. Three key enzymes in phenylpropanoid biosynthesis were phenylalanine ammonia-lyase (PAL, EC4.3.1.24) or phenylalanine/tyrosine ammonia-lyase (PTAL, EC4.3.1.25), trans-cinnamate 4-monooxygenase [CYP73A, EC1.14.14.91 (formerly EC1.14.13.11)] and 4-coumarate-CoA ligase (4CL, EC6.2.1.12). Of 21 DEGs encoding PAL, six were downregulated in both cultivars; 15 genes were downregulated in ROC22 and 15 were upregulated in MT70-611. Three DEGs for PTAL were downregulated, whereas two DEGs for CYP73A were upregulated in the two cultivars. Of 12 DEGs encoding 4CL, five genes were upregulated, but the expression of three was depressed in both cultivars; another four genes were regulated according to cultivar genotype (Figure 4D; Table S7). Markedly significant upregulation of a gene (Cluster-13677.341984) encoding 4CL was verified by both qRT-PCR and RNA-seq (Figure 3; Table 3). About 44% (32/73) of DEGs encoding beta-glucosidase (EC3.2.1.21) that is associated with coumarin biosynthesis were increased in ROC22. Highly increased expression of a gene (Cluster-13677.166670) for beta-glucosidase (BGL32) was identified by both qRT-PCR and RNA-seq (Figure 3; Table 3). In addition, approximately 36.2% (38/105) of DEGs encoding peroxidase (EC1.11.1.7), the catalytic enzyme in final step of lignin biosynthesis, were upregulated in both cultivars, of which one gene (Cluster-13677.264040) was upregulated as indicated by qRT-PCR and RNA-seq assays (Figure 3; Table 3).

3.8. DEGs in Plant Hormone Signal Transduction Pathways

A total of 218 DEGs were significantly enriched in eight plant hormone signal transduction pathways, including those involving salicylic acid (SA), jasmonic acid (JA), ethylene (ET), abscisic acid (ABA), gibberellic acid (GA), cytokinin, auxin, and brassinosteroids (Figure S5; Table S8). Overall, about 36% (79/218) of DEGs involved in these pathways were upregulated, whereas expressions of 39% (84/218) of DEGs were depressed in both cultivars (Figure 4E; Table S8). In the SA signal transduction pathway, all five genes for the regulatory protein NPR1 (nonexpressor of pathogenesis-related genes 1) were downregulated and 4/10 genes for transcription factor TGA were upregulated in ROC22; Meanwhile, 8/9 genes for pathogenesis-related protein 1 (PR1) were upregulated in both cultivars. Our qRT-PCR data also revealed that the transcriptional level of a gene (Cluster-13677.366599) encoding TGA dramatically increased by 1.40–1.57-fold in ROC22 at 24–72 dpi (Figure 3). Additionally, the expression of a gene (Cluster-13677.90901) encoding PR1 was significantly increased by 14.2–37.1 and 12.8–64.1 folds in ROC22 and MT11-610, respectively (Figure 3). In the JA signal transduction pathway, one gene for jasmonic acid-amino synthetase (JAR1) was upregulated, but four genes for transcription factor (MYC2) were downregulated in both cultivars. In the ET signal transduction pathway, 20 DEGs were annotated and encoded six components, namely, ethylene receptor (ETR/ERS), serine/threonine-protein kinase (CTR1), ethylene-insensitive protein 2 (EIN2), ethylene-insensitive protein 3 (EIN3), EIN3-binding F-box protein (EBF1/2) and ethylene-responsive transcription factor 1 (ERF1). Five of seven genes for CTR1 were upregulated in both cultivars, of which the Cluster-13677.108047 gene was significantly induced with an increase of 3.70–4.90 and 1.78–1.96 folds in ROC22 based on RNA-seq and qRT-PCR data, respectively (Figure 3; Table 3).
In the ABA signal transduction pathway, 47 DEGs were significantly enriched and involved in the ABA receptor PYR/PYL family (PYL) in addition to protein phosphatase 2C (PP2C), serine/threonine-protein kinase SRK2 (SnRK2), and ABA responsive element binding factor (ABF). Of these 47 DEGs, about 15 genes were upregulated, whereas 32 were downregulated, particularly PP2C and SnRK2, in ROC22. Similarly, most (13/18) DEGs were downregulated in ROC22 for the cytokinin signal transduction pathway, which includes Arabidopsis histidine kinase 2/3/4 (cytokinin receptor, CRE), histidine-containing phosphotransfer protein (AHP), two-component response regulator ARR-B family (ARR-B), and the two-component response regulator ARR-A family (ARR-A). In the auxin signal transduction pathway, 70 DEGs were significantly enriched in the LAX auxin influx carrier (AUX1 LAX family), auxin-responsive protein IAA (AUX/IAA), auxin response factor (ARF), auxin responsive GH3 gene family (GH3), and SAUR family protein (SAUR). Of these genes, 50% (35/70) were upregulated in ROC22, whereas 14 of 16 genes encoding GH3 were upregulated in both cultivars. Notably, the expression of Cluster-13677.452329 gene encoding SAUR was significantly enhanced by 4.34–5.26 and 1.85–2.86 folds, as evidenced by RNA-seq and qRT-PCR data, respectively (Figure 3; Table 3). In the GA signal transduction pathway, 18 DEGs were enriched. Of these, one gene encoding gibberellin receptor (GID1) and DELLA protein were downregulated, whereas one gene for phytochrome-interacting factor 3 (PIF3) and 14 genes for phytochrome-interacting factor 4 (PIF4) were highly expressed in both cultivars. In the brassinosteroid signal transduction pathway, most DEGs were downregulated in both cultivars, but especially in MT11-610.

3.9. DEGs in Plant-Pathogen Interaction Pathways

Overall, 235 DEGs were enriched in diverse plant-pathogen interaction pathways, including Ca2+-dependent signal transduction pathways and the mitogen-activated protein kinase (MAPK) signal transduction pathway, as well as those involved in activation of molecular chaperones (Figure S6; Table S9). Of these 235 DEGs, 61 were upregulated and 174 were downregulated in ROC22; conversely, 146 DEGs were highly expressed and 89 DEGs were depressed in MT11-610 (Figure 4F; Table S9). Expression of over 50% of genes for cyclic nucleotide gated channel (CNGC), eukaryotic calcium-binding protein (CML), calcium-dependent protein kinase (CPK), and WRKY transcription factor 33 (WRKY33) was depressed in ROC22, but these genes were highly expressed in MT11-610. Furthermore, qRT-PCR data verified that the transcriptional level of a gene (Cluster-13677.230082) encoding CPK was increased by 1.7- and 3.7-fold in MT70-6111 at 48 and 72 hpi, respectively, and was strongly decreased in ROC22 (Figure 3). In addition, 3/6 genes encoding mitogen-activated protein kinase kinase kinase 1, plant (MEKK1P) were significantly upregulated based on the RNA-seq data, while qRT-PCR data showed that transcripts of Cluster-13677.166560 gene for MEKK1P were enhanced by 1.1–3.3 folds at 24–72 hpi in two cultivars (Figure 3). Notably, 13 of 14 genes for molecular chaperone HtpG (HSP90A) were highly expressed, but 14 of 18 genes for respiratory burst oxidase (Rboh) were significantly depressed at 24–72 hpi in both cultivars.

4. Discussion

4.1. Overview of Gene Transcription in Sugarcane during Aaa Infection

Sugarcane is subject to a diverse range of causal pathogens including Aaa [11,12,13]. In this study, we performed a RNA-seq-based comparative transcriptome analysis to assess expression changes in sugarcane genes in response to Aaa infection. The RNA-seq data showed that 29,887 genes were differentially expressed upon Aaa infection and most changes appeared in the resistant cultivar ROC22, particularly within 72 hpi, suggesting that more defense-responsive genes were activated in this resistant cultivar relative to the susceptible cultivar MT11-610. A KEGG analysis showed that the majority of DEGs in sugarcane that responded to Aaa infection through transcriptional activation are involved in metabolic processes, single-organism metabolic processes, and oxidation-reduction processes in both resistant and susceptible cultivars. Induction of many genes involved in photosynthesis and carbon metabolism, plant-pathogen interaction, plant hormone signal transduction, and phenylpropanoid biosynthesis was also observed. These metabolic process and defense-responsive pathways were also previously reported to be involved in responses of sugarcane to infection by diverse pathogens, further suggesting that these responses are largely conserved in sugarcane exposed to biotic stress [25,26,35].

4.2. Regulation of Genes Related to Photosynthesis and Carbon Metabolism Pathways upon Aaa Infection

In the initial steps of photosynthesis, light energy is captured and converted into chemical energy and a large part of this light is absorbed by light-harvesting complexes (LHCs) that are peripherally associated with photosynthesis I (PSI) and photosynthesis II (PSII) [36,37]. In general, biotic stresses downregulate expression of genes related to photosynthesis [38]. Unexpectedly, our data revealed that genes involved in photosynthesis-antenna proteins (ko00196) were instead significantly upregulated, suggesting that expression of these proteins involved in the first step of photosynthesis may allow efficient light-driven electron transport to provide a defense strategy during early stages of Aaa infection. Meanwhile, a study by Santa Brigida et al. [26] demonstrated that expression of genes for ferredoxin [2Fe-2S] and ferredoxin-DNADP+ reductase, which are the final receptors for electrons in light-dependent reactions, were upregulated in response to Aaa attacks. Another study by Sun et al. [39] also showed that genes related to photosynthesis-antenna proteins are upregulated during infection of Cucumis sativus by Cucurbit chlorotic yellows virus.
On the other hand, we observed that approximately 50% of DEGs participating in carboxylation/Calvin-cycle reaction are upregulated, but genes encoding PRK (one of two characteristic enzymes in the Calvin cycle reaction) were downregulated, suggesting that Aaa infection represses carbon fixation since plant cells need more energy to fight against pathogen attacks or require defense mechanisms to overcome disease stress. Recently, Bi et al. reported that N. benthamiana plants with silencing of phosphoribulokinases (NbPRKs) were more resistant to Rice stripe virus (RSV), whereas transgenic plants overexpressing NbPRK1 were more susceptible to RSV infection [40]. Furthermore, plant resistance was enhanced by silencing of either the small subunit of N. benthamiana rubisco (NbRbCS) or phosphoglycerate kinase (NbPGK) [40]. Except for DEGs encoding malate dehydrogenase (NADP+) (EC1.1.1.82), most DEGs related to PEPC (EC4.1.1.31), maeB (EC1.1.1.40) and PPDK (EC2.7.9.1) that play important roles in the C4-dicarboxylic acid cycle were upregulated in the C4 sugarcane crop, indicating that this crop may concentrate more CO2 in bundle-sheath cells via a mechanism involving a “CO2 pump” to promote the carboxylation reaction of rbcS and reduce photorespiration [41]. Notably, rbcS, PEPC, and PPDK are considered to be key enzymes for carbon fixation in sugarcane [42].
At the cellular level, sucrose is a key carbon source for plant growth, development, and defense [26,43]. Furthermore, sucrose is the main source of carbon and acts as an energy sink for sugarcane tissues [42,44]. SPS (EC3.1.3.24), SS (EC2.4.1.13) and invertase (INV, EC3.2.1.26) are key enzymes in sucrose metabolism [43]. Our findings showed that expression of genes encoding SS, hexokinase and fructokinase was upregulated, but genes encoding SPS and INV were downregulated, particularly in ROC22 (resistant to red stipe), suggesting that this resistant cultivar may accumulate more sucrose by reducing sucrose decomposition following Aaa infection. In contrast, most genes related to these key sucrose metabolism enzymes were upregulated in MT11-610 (susceptible to red stipe), indicating that this susceptible cultivar may accumulate more sucrose by enhancing sucrose synthesis after Aaa infection in order to meet energy demands of plant and/or bacterial growth. Indeed, pathogens often hijack host cells for a source of sugar [43,45]. Similarly, the invertase gene (cwINV2) was found to be upregulated in the SP70-1143 cultivar after inoculation with Aaa [26]. We also found that the expression of genes for starch synthase (EC2.4.1.21) was strongly upregulated, but genes for starch phosphorylase (EC2.4.1.1) were downregulated in both cultivars, suggesting that accumulation of starch in sugarcane has an important role during defense responses against Aaa. However, expression of starch synthase involved in starch biosynthesis was downregulated in leaves from SP70-1143 cultivar seedlings at 7 dpi with Aaa [26], which was in contrast to our findings in this study. This difference could be attributed to variations between these sugarcane cultivars.

4.3. Regulation of Genes Involved in Phenylpropanoid Biosynthesis Pathways Exposed to Aaa Infection

A number of compounds containing a phenylalanine/tyrosine skeleton are directly or indirectly generated by the phenylpropanoid biosynthesis pathway, which plays various physiological functions in plants including phytoalexin-mediated defenses against herbivores and pathogens [46,47]. Of the first three enzymatic reactions with PAL, C4H (belonging to the CYP73A subfamily of the cytochrome P450-dependent monooxygenase superfamily) and 4CL, which is involved in the general phenylpropanoid pathway, are key enzymes that contribute to production of different phenylpropanoid precursors [47]. The expression of 4CL is altered in response to biotic stresses, reflecting its significant role in counteracting various biotic stresses [47]. Furthermore, peroxidase functions in the last step of lignin biosynthesis [48]. Lignin is an important structural component of the vascular secondary cell wall in plants, and provides not only mechanical strength and vascular integrity, but also plays important roles in conferring tolerance against abiotic and biotic stresses [49,50,51].
In this study we observed that expression of genes encoding PAL/PTAL was depressed in ROC22, but two genes for C4H as well as most genes for 4CL were upregulated in both resistant and susceptible cultivars. Furthermore, our RNA-seq and qRT-PCR data revealed that two genes (Cluster-13677.341984 and Cluster-13677.264040) encoding 4CL and peroxidase, respectively, were strongly upregulated in both cultivars. These findings suggested that increased expression of genes involved in lignin synthesis would be a common defense strategy employed by sugarcane in response to Aaa infection. A similar study by Su et al. revealed that expression of seven proteins (including 4CL) that are required in the lignin biosynthetic pathway was induced in sugarcane during S. scitamineum attack [35]. We also observed that transcriptional levels of a gene (Cluster-13677.166670) encoding beta-glucosidase were markedly increased based on both RNA-seq and qRT-PCR data, indicating that this gene may play a positive role in responses to Aaa attack. Notably, beta-glucosidase has broad functions in plants, such as recycling of cell-wall oligosaccharides, general defense, phytohormone signaling, secondary metabolism and scent release. This multi-functional role may be important for coordinating responses to diverse stresses [52].

4.4. Regulation of Genes in Plant Hormone Signal Transduction Pathways Play Important Roles in Response to Aaa Infection

Plant hormones play an essential role as signaling molecules in defense and immune responses by regulating hormone metabolic and signal transduction pathways, as well as through their ability to manipulate pathogen effectors [53]. Moreover, plant hormones act interdependently, through complex antagonistic or synergistic interactions [53,54]. Different hormone signaling pathways that activate and/or suppress defense during plant-pathogen interactions may function in sugarcane, as evidenced by different DEGs that play positive or negative roles in eight hormone signal transduction pathways. In this study, half of the DEGs in the eight hormone-related pathways were highly expressed in the resistant cultivar ROC22, but half were depressed in the susceptible cultivar MT11-610. Generally, SA and its derivative, methyl salicylate (MeSA), is typically identified as the signal(s) that are responsible for activating both local resistance and systemic acquired resistance (SAR) to biotrophic pathogens [53,55]. Our data showed that TGA and PR1 genes, two crucial components of SA signal transduction pathways, were highly expressed particularly in ROC22, suggesting these components can promote sugarcane resistance to Aaa.
Many studies have demonstrated that JA and methyl-jasmonate (MeJA) signaling molecules act as positive regulators of plant immunity against necrotrophic pathogens but are negative regulators in response to biotrophic pathogens [53,56,57]. We showed that a gene encoding JAR1 that enzymatically synthesizes (+)-7-iso-jasmonoyl-l-isoleucine (JA-Ile, an endogenous bioactive JA) by mediating isoleucine conjugation to JA was highly expressed upon Aaa infection, whereas expression of JA-regulated basic helix-loop-helix transcription factors (MYC2) was significantly depressed in both cultivars. These findings indicated that sugarcane infected by Aaa may display enhanced amounts of JA-Ile activity by promoting JAR1 activity and then depressing MYC2 activity, thereby inhibiting JA-dependent gene expression.
ET is a dual-function protein that is an important component of plant immune responses to pathogens [58]. CTR1 is a negative regulator of ET signaling [53] and its inhibition suppresses expression of downstream genes and transcription factors, thereby resulting in inactivation of ET-regulated genes [59]. In the present study, the levels of gene transcripts encoding CTR1 were strongly increased, whereas those for genes encoding EIN2, EIN3, and ERF1 were decreased in both cultivars, suggesting that the ET signal transduction pathway plays negative roles in response to Aaa infection. Also, Ntambo et al. revealed that this pathway was essential in sugarcane against X. albilineans [25]
For auxin signal transduction pathways, we found that expression of genes for GH3 and a gene (Cluster-13677.452329) for SAUR was significantly upregulated in sugarcane, similar to a previous study upon sugarcane in response to X. albilineans infection [25]. Plants infected successfully by biotrophic pathogens show significant increases in IAA concentration and thereby upregulation of GH3 [60,61]. Sugarcane exposed to S. scitamineum induced upregulation of auxin responsive proteins such as Aux/IAA, SAUR, and auxin-induced β-glucosidase [62]. Regarding GA hormone signal transduction pathway, it is important to note that two genes encoding DELLA and GID1 were highly expressed, whereas TF genes (PIF3 and PIF4) were downregulated, evidencing that degradation of DELLA proteins that act as negative regulators of GA responses during GA signaling ultimately relieves the negative regulation of the GA pathway to activate TFs that promote GA responses [63,64]. The dual roles of ABA in plants in response to resistance to biotrophic and necrotrophic pathogens depend on the environmental conditions during experiments [62]. Results in the present study suggest that the ABA signal transduction pathway plays an active role in sugarcane resistance to Aaa, as validated by the upregulation of PYR (a receptor complex of ABA) and downregulation of PP2C during Aaa infection. On the other hand, our data suggested that cytokinins involved in the regulation of plant defense responses against Aaa may depress expression of the components of this signal transduction pathway. Siemens et al. [65] reported that the expression of genes involved in cytokinin homeostasis (e.g., cytokinin synthases and cytokinin oxidases/dehydrogenases) was strongly downregulated in Arabidopsis during infection with Plasmodiophora brassicae and transgenic plants overexpressing cytokinin oxidase/dehydrogenase genes showed resistance against this pathogen. Collectively, plant hormones interdependently regulate complex signaling networks and are involved in crosstalk in plant immunity, thus an integrated understanding of phytohormone-mediated plant defense responses could inform the design of effective strategies for engineering crops that have disease resistance [62,63,66].

4.5. Regulation of Genes in Ca2+-Dependent and MAPK Signal Pathways in Response to Aaa Infection

Ca2+ is an important secondary messenger in signal transduction in plant cells [67]. In Ca2+ signaling, Ca2+ flux across membranes is promoted through the activity of several families of Ca2+-permeable channels, such as CNGCs. Plant cytoplasmic Ca2+ is sensed by different Ca2+ sensor proteins (e.g., CaMs, CMLs, CBLs, CDPKs), which further induce expression of downstream genes (e.g., transcription factors, NADPH oxidases genes) and mediate responses to abiotic and biotic stresses through reactive oxygen species (ROS) and/or nitrogen monoxide (NO) production [67,68]. CDPKs are involved not only in Ca2+- and ROS-mediated initiation of stress signaling, but also in hormone-regulated systemic signal propagation during pathogen infection [68,69]. On the other hand, the MAPK cascade generally has three components, a MAPK, a MAPKK (MAPK kinase) and a MAPKKK (MAPKK kinase), which play essential roles in plant growth and development as well as responses to abiotic and biotic stresses [67,68].
Our finding revealed that expression of most genes for CNGC, CML, CPK, and Rboh was particularly depressed in the resistant cultivar ROC22, whereas genes for MEKK1P (belongs to MAPKKK gene family) were highly expressed, suggested that sugarcane plants initiate defense responses during Aaa infection through genes induced by MAPK and the hypersensitive response (HR) mediated by HSP90, rather than through Ca2+ signaling, ROS or NO production. Indeed, Su et al. showed that Ca2+ signaling and ROS/NO pathways are not essential to smut resistance in sugarcane [35]. However, Santa Brigida et al. proposed that ROS production resulted from the strong induction of Rboh genes as part of an oxidative stress response against Aaa [26]. The different results concerning the role of ROS production in response to Aaa attack between these two independent studies could be attributed to differences in the environmental conditions used, such as different cultivars and sampling times.

5. Conclusions

The present study demonstrated that sugarcane responds to Aaa infection through transcriptional activation of various genes, leading to significant changes in the levels of transcripts for genes involved in photosynthesis and carbon metabolism, phenylpropanoid biosynthesis, plant hormone signal transduction, and plant-pathogen interaction pathways. Although several gene responses and their related pathways were consistent with those reported in previous studies, our findings identified several important genes involved in the biosynthesis of lignin and coumarin, together with salicylic acid, jasmonic acid, ethylene and auxin signal transduction, and Ca2+-dependent as well as MAPK signal transduction pathways that had important positive roles in promoting the resistance of sugarcane to this pathogen. Our finding will provide a basis for the development of improved strategies to increase the resistance of modern sugarcane cultivars to Aaa.

Supplementary Materials

The following are available online at https://0-www-mdpi-com.brum.beds.ac.uk/2076-2607/8/1/10/s1, Figure S1: Summary of annotation from public databases (A) and species distribution of the top BLAST hits (B) for assembled high-quality unigenes. NR, NCBI non-redundant protein database; Nt, NCBI nucleotide sequences; KO, KEGG (Kyoto Encyclopedia of Genes and Genome) Ortholog; SwissProt, a manually annotated and reviewed protein sequence database; Pfam, protein family; KOG, euKaryotic Ortholog Groups; GO, Gene Ontology; Figure S2: Gene Ontology (GO) annotation of differentially expressed genes (DEGs) in the Aaa-susceptible cultivar MT11-610. Up- (A) and downregulated (B) DEGs were annotated in three categories: biological process (BP), cellular component (CC), and molecular function (MF); Figure S3: Schematic diagram of relationships between differentially expressed genes (DEGs) enriched in photosynthesis and carbon metabolism pathways as identified by KEGG analysis. All genes encoding catalytic enzymes revealed by RNA-sequencing data are highlighted by a yellow box; Figure S4: Schematic diagram of relationships between differentially expressed genes (DEGs) involved in the phenylpropanoid biosynthesis pathway as identified by KEGG analysis. All genes encoding genes/transcription factors revealed by RNA-sequencing data are highlighted by a gray box and those genes that were also validated by qRT-PCR are highlighted by a green box; Figure S5: Schematic diagram of relationships between differentially expressed genes (DEGs) enriched in plant hormone signal transduction pathways as identified by KEGG analysis. All genes encoding genes/transcription factors revealed by RNA-sequencing data are highlighted by a gray box and those genes that were also validated by qRT-PCR are highlighted by a green box. Those that showed no change by either RNA-sequencing or qRT-PCR assay are enclosed by white boxes; Figure S6: Schematic diagram of relationships between differentially expressed genes (DEGs) enriched in plant-pathogen interaction pathways as identified by KEGG analysis. All genes encoding genes/transcription factors revealed by RNA-sequencing data are highlighted by a gray box and those genes that were also validated by qRT-PCR are highlighted by a green box. Those that showed no change by either RNA-sequencing or qRT-PCR assay are enclosed by white boxes; Table S1: Primers used for qRT-PCR of the 12 randomly selected differentially expressed genes (DEGs); Table S2: Overview of RNA-sequencing reads derived from 24 libraries for Aaa (Acidovorax avenae subsp. avenae)- and mock-infected samples from resistant (ROC22) and susceptible (MT11-610) cultivars; Table S3: Gene Ontology (GO) annotation of all unigenes identified in the two sugarcane cultivars, ROC22 and MT11-610; Table S4: Kyoto Encyclopedia of Genes and Genomes (KEGG) annotation of all unigenes identified in the two sugarcane cultivars, ROC22 and MT11-610; Table S5: Differentially expressed genes (DEGs) enriched in each KEGG pathway in resistant (ROC22) and susceptible (MT11-610) sugarcane cultivars; Table S6: Transcript levels (log2Fold Change) determined by RNA sequencing for differentially expressed genes (DEGs) in ROC22 and MT11-610 enriched in three KEGG pathways: photosynthesis-antenna proteins (ko00196), carbon fixation in photosynthetic organisms (ko00710), and starch and sucrose metabolism (ko00500); Table S7: RNA sequencing results for transcript levels (log2Fold Change) of differentially expressed genes (DEGs) enriched in the KEGG phenylpropanoid biosynthesis pathway (ko00940); Table S8: RNA sequencing results for transcript levels (log2Fold Change) for differentially expressed genes (DEGs) in ROC22 and MT11-610 enriched in the KEGG plant hormone signal transduction pathway (ko04075); Table S9: RNA sequencing results for transcript levels (log2Fold Change) of differentially expressed genes (DEGs) in ROC22 and MT11-610 enriched in the KEGG plant-pathogen interaction pathway (ko04626).

Author Contributions

N.C. performed most of the experiments and data analyses, and prepared the draft manuscript. J.-R.Z. participated in partial experiments. H.-Y.F., M.-T.H., and H.-L.Z. helped with material preparation. S.-J.G. conceived and supervised the project, and finalized the manuscript. All authors read and approved the final manuscript. All authors have read and agreed to the published version of the manuscript.

Funding

This study was funded by the earmarked fund for the China Agricultural Research System (grant no. CARS-170302) and by the Director’s Fund of National Engineering Research Center for Sugarcane, FAFU, China (grant no. KJG16005M).

Conflicts of Interest

The authors declare no conflict of interest.

References

  1. Ali, A.; Khan, M.; Sharif, R.; Mujtaba, M.; Gao, S.J. Sugarcane omics: An update on the current status of research and crop improvement. Plants 2019, 8, 344. [Google Scholar] [CrossRef] [PubMed] [Green Version]
  2. Zhou, M. Sugarcane (S. officinarum x S. spontaneum). In Genetic Improvement of Tropical Crops; Campos, H., Caligari, P.D.S., Eds.; Springer International Publishing AG: Cham, Switzerland, 2017; pp. 291–308. [Google Scholar]
  3. Olivier, G.; Gaetan, D.; Rudie, A.; Jane, G.; Bernard, P.; Karen, A.; Jerry, J.; Guillaume, M.; Carine, C.; Catherine, H. A mosaic monoploid reference sequence for the highly complex genome of sugarcane. Nat. Commun. 2018, 9, 2638. [Google Scholar]
  4. Zhang, J.; Zhang, X.; Tang, H.; Zhang, Q.; Hua, X.; Ma, X.; Zhu, F.; Jones, T.; Zhu, X.; Bowers, J. Allele-defined genome of the autopolyploid sugarcane Saccharum spontaneum L. Nat Genet. 2018, 50, 1565–1573. [Google Scholar] [CrossRef] [PubMed] [Green Version]
  5. Ali, A.; Wang, J.-D.; Pan, Y.-B.; Deng, Z.-H.; Chen, Z.-W.; Chen, R.-K.; Gao, S.-J. Molecular identification and genetic diversity analysis of Chinese sugarcane (Saccharum spp. hybrids) varieties using SSR markers. Trop. Plant Biol. 2017, 10, 194–203. [Google Scholar] [CrossRef]
  6. Ali, A.; Pan, Y.-B.; Wang, Q.-N.; Wang, J.-D.; Chen, J.-L.; Gao, S.-J. Genetic diversity and population structure analysis of Saccharum and Erianthus genera using microsatellite (SSR) markers. Sci. Rep. 2019, 9, 395. [Google Scholar] [CrossRef] [Green Version]
  7. Rott, P.; Kaye, C.; Naranjo, M.; Shine, J.M.; Sood, S.; Comstock, J.C.; Raid, R.N. Controlling sugarcane diseases in Florida: A challenge in constant evolution. Proc. Int. Soc. Sugar Cane Technol. 2016, 29, 595–600. [Google Scholar]
  8. Bagyalakshmi, K.; Viswanathan, R.; Ravichandran, V. Impact of the viruses associated with mosaic and yellow leaf disease on varietal degeneration in sugarcane. Phytoparasitica 2019, 47, 591–604. [Google Scholar] [CrossRef]
  9. Barnabas, L.; Ramadass, A.; Amalraj, R.S.; Palaniyandi, M.; Rasappa, V. Sugarcane proteomics: An update on current status, challenges, and future prospects. Proteomics 2015, 15, 1658–1670. [Google Scholar] [CrossRef]
  10. Royer, M.; Pieretti, I.; Cociancich, S.; Rott, P. Recent progress in understanding three major bacterial diseases of sugarcane: Gumming, leaf scald and ratoon stunting. In Achieving Sustainable Cultivation of Sugarcane, Breeding, Pests and Diseases, 2nd ed.; Rott, P., Ed.; Burleigh Dodds Science Publishing: Cambridge, UK, 2018; Volume 2, pp. 311–336. [Google Scholar]
  11. Li, X.Y.; Sun, H.D.; Rott, P.; Wang, J.D.; Huang, M.T.; Zhang, Q.Q.; Gao, S.J. Molecular identification and prevalence of Acidovorax avenae subsp. avenae causing red stripe of sugarcane in China. Plant Pathol. 2018, 67, 929–937. [Google Scholar]
  12. Rott, P.; Davis, M.J. Leaf scald. In A Guide to Sugarcane Diseases, 2nd ed.; Rott, P., Bailey, R.A., Comstock, J.C., Croft, B.J., Saumtally, A.S., Eds.; CIRAD/ISSCT: Montpellier, France, 2000; pp. 58–62. [Google Scholar]
  13. Martin, J.; Wismer, C.; Ryan, C. Red stripe. In Disease of Sugarcane Major Diseases, 2nd ed.; Ricaud, C., Egan, B.T., Gillaspie, A.G., Jr., Hughes, C.G., Eds.; Elsevier Science Publishers: Amsterdam, The Netherlands, 1989; pp. 81–95. [Google Scholar]
  14. Willems, A.; Goor, M.; Thielemans, S.; Gillis, M.; Kersters, K.; De Ley, J. Transfer of several phytopathogenic Pseudomonas species to Acidovorax as Acidovorax avenae subsp. avenae subsp. nov., comb. nov., Acidovorax avenae subsp. citrulli, Acidovorax avenae subsp. cattleyae, and Acidovorax konjaci. Int. J. Syst. Evol. Microbiol. 1992, 42, 107–119. [Google Scholar] [CrossRef] [Green Version]
  15. Fontana, P.D.; Rago, A.M.; Fontana, C.A.; Vignolo, G.M.; Cocconcelli, P.S.; Mariotti, J.A. Isolation and genetic characterization of Acidovorax avenae from red stripe infected sugarcane in Northwestern Argentina. Eur. J. Plant Pathol. 2013, 137, 525–534. [Google Scholar] [CrossRef]
  16. Shan, H.; Li, W.; Huang, Y.; Wang, X.; Zhang, R.; Luo, Z.; Yin, J. First detection of sugarcane red stripe caused by Acidovorax avenae subsp. avenae in Yuanjiang, Yunnan, China. Trop. Plant Pathol. 2017, 42, 137–141. [Google Scholar] [CrossRef]
  17. Mutz, K.-O.; Heilkenbrinker, A.; Lönne, M.; Walter, J.-G.; Stahl, F. Transcriptome analysis using next-generation sequencing. Curr. Opin. Biotechnol. 2013, 24, 22–30. [Google Scholar] [CrossRef] [PubMed]
  18. Luo, Q.; Ahmad, K.; Fu, H.Y.; Wang, J.D.; Chen, R.K.; Gao, S.J. Genetic diversity and population structure of Sorghum mosaic virus infecting Saccharum spp. hybrids. Ann. Appl. Biol. 2016, 169, 398–407. [Google Scholar] [CrossRef]
  19. Dong, M.; Cheng, G.; Peng, L.; Xu, Q.; Yang, Y.; Xu, J. Transcriptome analysis of sugarcane response to the infection by Sugarcane steak mosaic virus (SCSMV). Trop. Plant Biol. 2017, 10, 45–55. [Google Scholar] [CrossRef]
  20. Huang, N.; Ling, H.; Su, Y.; Liu, F.; Xu, L.; Su, W.; Wu, Q.; Guo, J.; Gao, S.; Que, Y. Transcriptional analysis identifies major pathways as response components to Sporisorium scitamineum stress in sugarcane. Gene 2018, 678, 207–218. [Google Scholar] [CrossRef]
  21. McNeil, M.D.; Bhuiyan, S.A.; Berkman, P.J.; Croft, B.J.; Aitken, K.S. Analysis of the resistance mechanisms in sugarcane during Sporisorium scitamineum infection using RNA-seq and microscopy. PLoS ONE 2018, 13, e0197840. [Google Scholar] [CrossRef] [Green Version]
  22. Wang, Z.; Li, Y.; Li, C.; Song, X.; Lei, J.; Gao, Y.; Liang, Q. Comparative transcriptome profiling of resistant and susceptible sugarcane genotypes in response to the airborne pathogen Fusarium verticillioides. Mol. Biol. Rep. 2019, 46, 3777–3789. [Google Scholar] [CrossRef]
  23. Cia, M.C.; De Carvalho, G.; Azevedo, R.A.; Monteiro-Vitorello, C.B.; Souza, G.M.; Nishiyama-Junior, M.Y.; Lembke, C.G.; Antunes De Faria, R.S.D.C.; Marques, J.P.R.; Melotto, M. Novel insights into the early stages of ratoon stunting disease of sugarcane inferred from transcript and protein analysis. Phytopathology 2018, 108, 1455–1466. [Google Scholar] [CrossRef] [Green Version]
  24. Fu, Y.H.; Wei, J.J.; Pan, Y.B.; Zhou, X.; He, E.Q.; Liu, R.; Huang, H.; Lu, J.J.; Liu, F.Z. Comparative analysis reveals changes in transcriptomes of sugarcane upon infection by Leifsonia xyli subsp. xyli. J. Phytopathol. 2019, 167, 633–644. [Google Scholar] [CrossRef]
  25. Ntambo, M.S.; Meng, J.Y.; Rott, P.C.; Henry, R.J.; Zhang, H.-L.; Gao, S.J. Comparative transcriptome profiling of resistant and susceptible sugarcane cultivars in response to infection by Xanthomonas albilineans. Int. J. Mol. Sci. 2019, 20, 6138. [Google Scholar] [CrossRef] [PubMed] [Green Version]
  26. Santa Brigida, A.B.; Rojas, C.A.; Grativol, C.; De Armas, E.M.; Entenza, J.O.; Thiebaut, F.; Lima, M.D.F.; Farrinelli, L.; Hemerly, A.S.; Lifschitz, S. Sugarcane transcriptome analysis in response to infection caused by Acidovorax avenae subsp. avenae. PLoS ONE 2016, 11, e0166473. [Google Scholar] [CrossRef] [PubMed]
  27. Grabherr, M.G.; Haas, B.J.; Yassour, M.; Levin, J.Z.; Thompson, D.A.; Amit, I.; Adiconis, X.; Fan, L.; Raychowdhury, R.; Zeng, Q. Full-length transcriptome assembly from RNA-Seq data without a reference genome. Nat. Biotechnol. 2011, 29, 644–652. [Google Scholar] [CrossRef] [PubMed] [Green Version]
  28. Li, B.; Dewey, C.N. RSEM: Accurate transcript quantification from RNA-Seq data with or without a reference genome. BMC Bioinform. 2011, 12, 323. [Google Scholar] [CrossRef] [Green Version]
  29. Trapnell, C.; Williams, B.A.; Pertea, G.; Mortazavi, A.; Kwan, G.; Van Baren, M.J.; Salzberg, S.L.; Wold, B.J.; Pachter, L. Transcript assembly and quantification by RNA-Seq reveals unannotated transcripts and isoform switching during cell differentiation. Nat. Biotechnol. 2010, 28, 511–515. [Google Scholar] [CrossRef] [Green Version]
  30. Love, M.I.; Huber, W.; Anders, S. Moderated estimation of fold change and dispersion for RNA-seq data with DESeq2. Genome Biol. 2014, 15, 550. [Google Scholar] [CrossRef] [Green Version]
  31. Young, M.D.; Wakefield, M.J.; Smyth, G.K.; Oshlack, A. Gene ontology analysis for RNA-seq: Accounting for selection bias. Genome Biol. 2010, 11, R14. [Google Scholar] [CrossRef] [Green Version]
  32. Mao, X.; Cai, T.; Olyarchuk, J.G.; Wei, L. Automated genome annotation and pathway identification using the KEGG Orthology (KO) as a controlled vocabulary. Bioinformatics 2005, 21, 3787–3793. [Google Scholar] [CrossRef]
  33. Kanehisa, M.; Araki, M.; Goto, S.; Hattori, M.; Hirakawa, M.; Itoh, M.; Katayama, T.; Kawashima, S.; Okuda, S.; Tokimatsu, T. KEGG for linking genomes to life and the environment. Nucleic Acids Res. 2007, 36, D480–D484. [Google Scholar] [CrossRef]
  34. Livak, K.J.; Schmittgen, T.D. Analysis of relative gene expression data using real-time quantitative PCR and the 2−ΔΔCT method. Methods 2001, 25, 402–408. [Google Scholar] [CrossRef]
  35. Su, Y.; Xu, L.; Wang, Z.; Peng, Q.; Yang, Y.; Chen, Y.; Que, Y. Comparative proteomics reveals that central metabolism changes are associated with resistance against Sporisorium scitamineum in sugarcane. BMC Genom. 2016, 17, 800. [Google Scholar] [CrossRef] [PubMed] [Green Version]
  36. Van Amerongen, H.; Van Grondelle, R. Understanding the energy transfer function of LHCII, the major light-harvesting complex of green plants. J. Phys. Chem. B 2001, 105, 604–617. [Google Scholar] [CrossRef]
  37. Galka, P.; Santabarbara, S.; Khuong, T.T.H.; Degand, H.; Morsomme, P.; Jennings, R.C.; Boekema, E.J.; Caffarri, S. Functional analyses of the plant photosystem I–light-harvesting complex II supercomplex reveal that light-harvesting complex II loosely bound to photosystem II is a very efficient antenna for photosystem I in state II. Plant Cell 2012, 24, 2963–2978. [Google Scholar] [CrossRef] [PubMed] [Green Version]
  38. Bilgin, D.D.; Zavala, J.A.; Zhu, J.; Clough, S.J.; Ort, D.R.; DeLucia, E.H. Biotic stress globally downregulates photosynthesis genes. Plant Cell Environ. 2010, 33, 1597–1613. [Google Scholar] [CrossRef] [PubMed] [Green Version]
  39. Sun, X.; Wang, Z.; Gu, Q.; Li, H.; Han, W.; Shi, Y. Transcriptome analysis of Cucumis sativus infected by Cucurbit chlorotic yellows virus. Virol. J. 2017, 14, 18. [Google Scholar] [CrossRef] [Green Version]
  40. Bi, J.A.; Yang, Y.; Chen, B.; Zhao, J.; Chen, Z.; Song, B.; Chen, J.; Yan, F. Retardation of the Calvin cycle contributes to the reduced CO2 assimilation ability of rice stripe virus-infected N. benthamiana and suppresses viral infection. Front. Microbiol. 2019, 10, 568. [Google Scholar] [CrossRef] [Green Version]
  41. Schulze, S.; Mallmann, J.; Burscheidt, J.; Koczor, M.; Streubel, M.; Bauwe, H.; Gowik, U.; Westhoff, P. Evolution of C4 photosynthesis in the genus Flaveria: Establishment of a photorespiratory CO2 pump. Plant Cell 2013, 25, 2522–2535. [Google Scholar] [CrossRef] [Green Version]
  42. Wang, J.; Zhao, T.; Yang, B.; Zhang, S. Sucrose metabolism and regulation in sugarcane. J. Plant Physiol. Pathol. 2017, 5, 2. [Google Scholar] [CrossRef] [Green Version]
  43. Sosso, D.; Van Der Linde, K.; Bezrutczyk, M.; Schuler, D.; Schneider, K.; Kämper, J.; Walbot, V. Sugar partitioning between Ustilago maydis and its host Zea mays L during infection. Plant Physiol. 2019, 179, 1373–1385. [Google Scholar] [CrossRef]
  44. Grof, C.P.; Campbell, J.A. Sugarcane sucrose metabolism: Scope for molecular manipulation. Funct. Plant Biol. 2001, 28, 1–12. [Google Scholar] [CrossRef]
  45. Ruan, Y.-L. Sucrose metabolism: Gateway to diverse carbon use and sugar signaling. Annu. Rev. Plant Biol. 2014, 65, 33–67. [Google Scholar] [CrossRef] [PubMed]
  46. Deng, Y.; Lu, S. Biosynthesis and regulation of phenylpropanoids in plants. Crit. Rev. Plant Sci. 2017, 36, 257–290. [Google Scholar] [CrossRef]
  47. Lavhale, S.G.; Kalunke, R.M.; Giri, A.P. Structural, functional and evolutionary diversity of 4-coumarate-CoA ligase in plants. Planta 2018, 248, 1063–1078. [Google Scholar] [CrossRef] [PubMed]
  48. Boerjan, W.; Ralph, J.; Baucher, M. Lignin biosynthesis. Annu. Rev. Plant Biol. 2003, 54, 519–546. [Google Scholar] [CrossRef] [PubMed]
  49. Nguyen, T.-N.; Son, S.; Jordan, M.C.; Levin, D.B.; Ayele, B.T. Lignin biosynthesis in wheat (Triticum aestivum L.): Its response to waterlogging and association with hormonal levels. BMC Plant Biol. 2016, 16, 28. [Google Scholar] [CrossRef] [PubMed] [Green Version]
  50. Zúñiga, E.; Luque, J.; Martos, S. Lignin biosynthesis as a key mechanism to repress Polystigma amygdalinum, the causal agent of the red leaf blotch disease in almond. J. Plant Physiol. 2019, 236, 96–104. [Google Scholar] [CrossRef]
  51. Yuan, W.; Jiang, T.; Du, K.; Chen, H.; Cao, Y.; Xie, J.; Li, M.; Carr, J.P.; Wu, B.; Fan, Z. Maize phenylalanine ammonia-lyases contribute to resistance to Sugarcane mosaic virus infection, most likely through positive regulation of salicylic acid accumulation. Mol. Plant Pathol. 2019, 20, 1365–1378. [Google Scholar] [CrossRef] [Green Version]
  52. Cairns, J.R.K.; Mahong, B.; Baiya, S.; Jeon, J.-S. β-Glucosidases: Multitasking, moonlighting or simply misunderstood? Plant Sci. 2015, 241, 246–259. [Google Scholar] [CrossRef]
  53. Shigenaga, A.M.; Argueso, C.T. No hormone to rule them all: Interactions of plant hormones during the responses of plants to pathogens. Semin. Cell Dev. Biol. 2016, 56, 174–189. [Google Scholar] [CrossRef]
  54. Vlot, A.C.; Dempsey, D.M.A.; Klessig, D.F. Salicylic acid, a multifaceted hormone to combat disease. Annu. Rev. Phytopathol. 2009, 47, 177–206. [Google Scholar] [CrossRef] [Green Version]
  55. Delaney, T.P.; Uknes, S.; Vernooij, B.; Friedrich, L.; Weymann, K.; Negrotto, D.; Gaffney, T.; Gut-Rella, M.; Kessmann, H.; Ward, E. A central role of salicylic acid in plant disease resistance. Science 1994, 266, 1247–1250. [Google Scholar] [CrossRef] [PubMed] [Green Version]
  56. Thomma, B.P.; Eggermont, K.; Penninckx, I.A.; Mauch-Mani, B.; Vogelsang, R.; Cammue, B.P.; Broekaert, W.F. Separate jasmonate-dependent and salicylate-dependent defense-response pathways in Arabidopsis are essential for resistance to distinct microbial pathogens. Proc. Natl. Acad. Sci. USA 1998, 95, 15107–15111. [Google Scholar] [CrossRef] [PubMed] [Green Version]
  57. Seo, H.S.; Song, J.T.; Cheong, J.-J.; Lee, Y.-H.; Lee, Y.-W.; Hwang, I.; Lee, J.S.; Do Choi, Y. Jasmonic acid carboxyl methyltransferase: A key enzyme for jasmonate-regulated plant responses. Proc. Natl. Acad. Sci. USA 2001, 98, 4788–4793. [Google Scholar] [CrossRef] [PubMed] [Green Version]
  58. Broekaert, W.F.; Delauré, S.L.; De Bolle, M.F.; Cammue, B.P. The role of ethylene in host-pathogen interactions. Annu. Rev. Phytopathol. 2006, 44, 393–416. [Google Scholar] [CrossRef] [PubMed]
  59. Merchante, C.; Alonso, J.M.; Stepanova, A.N. Ethylene signaling: Simple ligand, complex regulation. Curr. Opin. Plant Biol. 2013, 16, 554–560. [Google Scholar] [CrossRef] [PubMed]
  60. Zhang, Z.; Li, Q.; Li, Z.; Staswick, P.E.; Wang, M.; Zhu, Y.; He, Z. Dual regulation role of GH3.5 in salicylic acid and auxin signaling during Arabidopsis-Pseudomonas syringae interaction. Plant Physiol. 2007, 145, 450–464. [Google Scholar] [CrossRef] [Green Version]
  61. González-Lamothe, R.; El Oirdi, M.; Brisson, N.; Bouarab, K. The conjugated auxin indole-3-acetic acid–aspartic acid promotes plant disease development. Plant Cell 2012, 24, 762–777. [Google Scholar] [CrossRef]
  62. Schaker, P.D.; Palhares, A.C.; Taniguti, L.M.; Peters, L.P.; Creste, S.; Aitken, K.S.; Van Sluys, M.-A.; Kitajima, J.P.; Vieira, M.L.; Monteiro-Vitorello, C.B. RNAseq transcriptional profiling following whip development in sugarcane smut disease. PLoS ONE 2016, 11, e0162237. [Google Scholar] [CrossRef]
  63. Bari, R.; Jones, J.D. Role of plant hormones in plant defence responses. Plant Mol. Biol. 2009, 69, 473–488. [Google Scholar] [CrossRef]
  64. Davière, J.-M.; Achard, P. Gibberellin signaling in plants. Development 2013, 140, 1147–1151. [Google Scholar] [CrossRef] [Green Version]
  65. Siemens, J.; Keller, I.; Sarx, J.; Kunz, S.; Schuller, A.; Nagel, W.; Schmülling, T.; Parniske, M.; Ludwig-Müller, J. Transcriptome analysis of Arabidopsis clubroots indicate a key role for cytokinins in disease development. Mol. Plant Microbe Interact. 2006, 19, 480–494. [Google Scholar] [CrossRef] [PubMed] [Green Version]
  66. Rodriguez, P.A.; Rothballer, M.; Chowdhury, S.P.; Nussbaumer, T.; Gutjahr, C.; Falter-Braun, P. Systems biology of plant microbiome interactions. Mol. Plant 2019, 12, 804–821. [Google Scholar] [CrossRef] [PubMed] [Green Version]
  67. Kudla, J.; Becker, D.; Grill, E.; Hedrich, R.; Hippler, M.; Kummer, U.; Parniske, M.; Romeis, T.; Schumacher, K. Advances and current challenges in calcium signaling. New Phytol. 2018, 218, 414–431. [Google Scholar] [CrossRef] [PubMed]
  68. Hilker, M.; Schmülling, T. Stress priming, memory, and signalling in plants. Plant Cell Environ. 2019, 42, 753–761. [Google Scholar] [CrossRef] [PubMed]
  69. Dubiella, U.; Seybold, H.; Durian, G.; Komander, E.; Lassig, R.; Witte, C.-P.; Schulze, W.X.; Romeis, T. Calcium-dependent protein kinase/NADPH oxidase activation circuit is required for rapid defense signal propagation. Proc. Natl. Acad. Sci. USA 2013, 110, 8744–8749. [Google Scholar] [CrossRef] [Green Version]
Figure 1. Venn diagram of all differentially expressed genes (DEGs) at 24–72 hpi defined by |log2(fold change)| > 1.5 and p-value < 0.005. All DEGs and up- and downregulated DEGs in (AC) ROC22 (resistant to red stripe) and (DF) MT11-610 (susceptible to red stripe) are shown.
Microorganisms 08 00010 g001
Figure 2. Gene Ontology (GO) annotation of differentially expressed genes (DEGs) in the Aaa-resistant cultivar ROC22. Up- (A) and downregulated (B) DEGs were annotated in three categories including biological process (BP), cellular component (CC), and molecular function (MF).
Microorganisms 08 00010 g002
Figure 3. Heatmap depicting relative expression profiling of 12 candidate genes based on qRT-PCR (2−ΔΔCT) data. Samples were collected from ROC22 (resistant to red stripe) and MT11-610 (susceptible to red stripe) leaves at 0, 24, 48, and 72 h post-inoculation (hpi) with Acidovorax avenae subsp. avenae (Aaa). All data were normalized to the expression level of glyceraldehyde-3-phosphate dehydrogenase gene (GAPDH). Each column represents the mean ± standard error for three biological replicates. Significant changes in relative expression levels at each time point as compared to CK are marked with an asterisk (* p < 0.05; ** p < 0.01). Red and blue indicate up- and downregulation, respectively.
Microorganisms 08 00010 g003
Figure 4. Hierarchical clustering of expression changes, log2(fold change), of differentially expressed genes (DEGs) involved in six main KEGG pathways in ROC22 (resistant to red stripe) and MT11-610 (susceptible to red stripe) at 0, 24, 48, and 72 h post-inoculation (hpi) with Acidovorax avenae subsp. avenae (Aaa). (A) photosynthesis-antenna proteins; (B) carbon fixation in photosynthetic organisms; (C) starch and sucrose metabolism; (D) phenylpropanoid biosynthesis pathway enriched by KEGG analysis; (E) plant hormone signal transduction and (F) plant–pathogen interaction pathways. R24/CK0, R24_Aaa vs. R0_CK;_R48/CK0, R48_Aaa vs. R0_CK; R72/CK0, R72_Aaa vs. R0_CK; S24/CK0, S24_Aaa vs. S0_CK;_S48/CK0, S48_Aaa vs. S0_CK; S72/CK0, S72_Aaa vs. S0_CK. Red and blue indicate up- and downregulation, respectively.
Microorganisms 08 00010 g004
Table 1. Summary of sequencing data and de novo sequence assembly of sugarcane transcriptome under Acidovorax avenae subsp. avenae infection.
Characteristics of Transcripts/UnigenesNumber of TranscriptsNumber of Unigenes
200–500 bp278,011 (48.0%)208,883 (41.2%)
500 bp–1 kbp157,879 (27.2%)155,399 (30.6%)
1–2 kbp104,396 (18.0%)104,024 (20.5%)
>2 kbp39,275 (6.8%)39,252 (7.7%)
Total number transcripts/unigenes579,561 (100%)507,558 (100%)
Minimal length (bp)201201
Median length (bp)524601
Maximal length (bp)15,49615,496
Mean length (bp)789860
N50 (bp) a11441200
N90 (bp) b344395
Total number of nucleotides457,476,577436,705,780
a The N50 value is defined as the contig length where half the assembly is represented by contigs of this size or longer. b N90 value is defined as the contig length where 90% of the assembly is represented by contigs of this size or longer.
Table 2. The top ten KEGG pathways having the largest number of differentially expressed genes (DEGs) in ROC22 (resistant to red stripe) and MT11-610 (susceptible to red stripe) sugarcane cultivars.
No.Pathway IDPathway NameCount (3818)Percent (%)
1ko00940Phenylpropanoid biosynthesis3489.1
2ko00196Photosynthesis-antenna proteins1684.4
3ko00500Starch and sucrose metabolism1604.2
4ko04075Plant hormone signal transduction1534.0
5ko04626Plant-pathogen interaction1453.8
6ko00520Amino sugar and nucleotide sugar metabolism1403.7
7ko03010Ribosome1343.5
8ko00460Cyanoamino acid metabolism1313.4
9ko00710Carbon fixation in photosynthetic organisms1243.2
10ko00250Alanine, aspartate and glutamate metabolism1153.0
Table 3. Transcriptional expression of 12 randomly selected differentially expressed genes (DEGs) in ROC22 (resistant to red stripe) and MT11-610 (susceptible to red stripe) sugarcane cultivars based on RNA-seq data.
No.Gene IDGene Annotation bKEGG OrthologyROC22 aMT11610 a
24 hpi48 hpi72 hpi24 hpi48 hpi72 hpi
1Cluster-13677.166560MEKK1PK13414(Plant-pathogen interaction)2.743.473.07−0.070.130.26
2Cluster-13677.90901PR1K13449(Plant hormone signal transduction)5.135.856.532.722.472.86
3Cluster-13677.3419844CLK01904(Phenylpropanoid biosynthesis)1.942.852.22−0.520.56−0.26
4Cluster-13677.264040PODK00430(Phenylpropanoid biosynthesis)3.343.042.480.790.880.74
5Cluster-13677.166670BGL32K01188(Phenylpropanoid biosynthesis)1.972.602.750.030.391.20
6Cluster-13677.452329SAURK14488(Plant hormone signal transduction)4.344.765.261.017.453.39
7Cluster-13677.185631JAR1K14506(Plant hormone signal transduction)1.601.741.760.510.830.89
8Cluster-13677.108047CTR1K14510(Plant hormone signal transduction)3.704.904.44−0.410.85−0.34
9Cluster-13677.366599TGAK14431 (Plant hormone signal transduction)6.756.388.010.270.390.04
10Cluster-13677.230082CPKK13412(Plant-pathogen interaction)−7.103−4.81−7.87−0.021.44−1.55
11Cluster-13677.11606TPS14K15086(Monoterpenoid biosynthesis)0.12−1.21−0.324.636.927.09
12Cluster-13677.187106PFPK00895(Pentose phosphate pathway)−1.64−4.01−2.447.477.617.89
a The transcriptional expression levels of RNA-seq shown as log2(fold change). b MEKK1P, mitogen-activated protein kinase kinase kinase 1, plant; PR1, pathogenesis-related protein 1; 4CL, 4-coumarate-CoA ligase; POD(EC1.11.1.7), peroxidase; BGL32(EC3.2.1.21), beta-glucosidase; SAUR, SAUR family protein; JAR1, jasmonic acid-amino synthetase; CTR1, serine/threonine-protein kinase CTR1; TGA, transcription factor TGA; CPK, calcium-dependent protein kinase; TPS14, (3S)-linalool synthase; PFP(EC2.7.1.90), Pyrophosphate: fructose-6-phosphate 1-phosphotransferase (PFP).

