Article

Implementation of Multispectral Imaging (MSI) for Microbiological Quality Assessment of Poultry Products

by
Evgenia D. Spyrelli
1,
Agapi I. Doulgeraki
2,
Anthoula A. Argyri
2,
Chrysoula C. Tassou
2,
Efstathios Z. Panagou
1 and
George-John E. Nychas
1,*
1
Laboratory of Microbiology and Biotechnology of Foods, Department of Food Science and Human Nutrition, School of Food and Nutritional Sciences, Agricultural University of Athens, Iera odos 75, 11855 Athens, Greece
2
Institute of Technology of Agricultural Products, Hellenic Agricultural Organization “Demeter”, Sof. Venizelou 1, Lycovrissi, 14123 Attica, Greece
*
Author to whom correspondence should be addressed.
Submission received: 16 March 2020 / Revised: 31 March 2020 / Accepted: 9 April 2020 / Published: 11 April 2020
(This article belongs to the Special Issue Food Spoilage Microorganisms: Ecology and Control)

Abstract

:
The aim of this study was to investigate on an industrial scale the potential of multispectral imaging (MSI) in the assessment of the quality of different poultry products. Therefore, samples of chicken breast fillets, thigh fillets, marinated souvlaki and burger were subjected to MSI analysis during production together with microbiological analysis for the enumeration of Total Viable Counts (TVC) and Pseudomonas spp. Partial Least Squares Regression (PLS-R) models were developed based on the spectral data acquired to predict the “time from slaughter” parameter for each product type. Results showed that PLS-R models could predict effectively the time from slaughter in all products, while the food matrix and variations within and between batches were identified as significant factors affecting the performance of the models. The chicken thigh model showed the lowest RMSE value (0.160) and an acceptable correlation coefficient (r = 0.859), followed by the chicken burger model where RMSE and r values were 0.285 and 0.778, respectively. Additionally, for the chicken breast fillet model the calculated r and RMSE values were 0.886 and 0.383 respectively, whereas for chicken marinated souvlaki, the respective values were 0.934 and 0.348. Further improvement of the provided models is recommended in order to develop efficient models estimating time from slaughter.

Graphical Abstract

1. Introduction

In the last decade, meat consumption has rapidly increased while demand for high-quality meat is expected to continue augmenting as the world population rises. Chicken meat products account for 37% of global meat production due to their low-fat content, affordable price and exclusion of beef and/or pork meat for religious purposes [1]. However, raw poultry products are susceptible to deterioration (short shelf life) and to unpleasant organoleptic attributes during spoilage [2,3]. These facts in tandem with consumers’ demand for fresh meat has led to the development of alternative approaches, such as Process Analytical Technology (PAT), that are considered efficient in predicting quality and freshness in meat products during production [4,5].
PAT is a promising approach for the assessment of products’ quality and it is currently implemented not only in the pharmaceutical industry [6] but also in the food industry [7,8]. The main concept of PAT is the combination of multivariate data derived through real-time (in-, on-, at- line) analytical methods to multivariate data analysis for continuous feedback and information build-up [9]. As analytical techniques of PAT are considered among others spectroscopic methods such as vibrational spectroscopy (FT-IR, NIR, Raman) [10,11,12], hyperspectral and multispectral imaging [13,14,15] and biomimetic sensors (e-nose, e-tongue) [16,17]. Moreover, this innovative approach coupled to microbiological analysis, quality factors and machine learning tools, can permit the understanding of the process, the identification of Critical Control Points (CCPs) and finally the application of a knowledge base to control the process [18,19,20].
According to PAT approach, a potential analysis and sensor have to be able to estimate successfully and rapidly the critical control parameter of interest without the destruction of the product [7]. These requirements are fulfilled in the case of multispectral imaging [21] that combines an optical technique (visible and NIR region) to computer vision in an attempt to obtain spectral and spatial data for the metabolites on the surface of the examined sample. The main advantage over hyperspectral analysis is the fast image acquisition and the usage of simple algorithms for image processing (ROI region) and decision-making [13,22].
In recent years, many researchers have recommended this nondestructive method and several machine learning algorithms for the rapid assessment of meat quality [4,23,24]. Specifically, for poultry products qualitative models were constructed for the classification of intact chicken breast fillets based on three quality grades using hyperspectral analysis [25]. Quantitative and/or qualitative models in the region of visible and near-infrared (400–1700 nm), were able to detect the bacterial population (TVC, Pseudomonas spp. and Enterobacteriaceae) during spoilage of chicken meat [26,27,28,29]. Other studies involving multispectral imaging were associated with the adulteration of minced beef with chicken meat [30], the presence of fecal contaminants in a poultry line [31,32,33], defects [33,34,35] and tumors on the surface of chicken breasts [36,37].
So far there are limited studies on the implementation of spectroscopic methods during processing at meat industries [38] and the majority is focused on the determination of fat and fatty acids in pork and chicken breast fillets with near-infrared sensors [39,40,41,42]. Hence, the aim of this research was to investigate the potential of multispectral imaging, applied in a poultry processing industry, to determine the time from slaughter of four different poultry products and develop PLS-R models assessing the time from slaughter directly from spectral data.

2. Materials and Methods

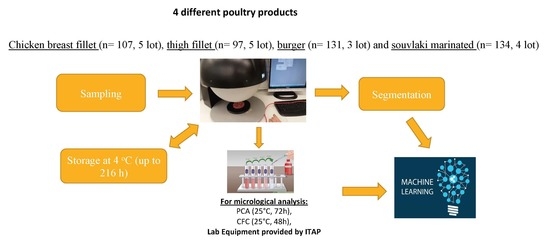
2.1. Experimental Design

Multispectral Imaging (MSI) was performed at-line in a Greek poultry industry on four different poultry products: (a) chicken breast fillets (n = 104, batches = 5), (b) chicken thigh fillets (n = 97, batches = 5), (c) chicken burger (n = 131, batches = 3), and (d) marinated chicken souvlaki (n = 144, batches = 4). At regular intervals, samples from each batch were analyzed microbiologically for the enumeration of Total Viable Counts (TVC) and Pseudomonas spp. in parallel with MSI spectral data acquisition. In addition, samples from each product were stored at 4 °C for 216 h (9 days), since this time period is defined by the industry as the shelf-life of the product. In parallel to the spectral acquisition, the microbiological analysis was performed simultaneously with the other batches.
Sample origins were extensive farming facilities where animals (Gallus domesticus: Ross strain) were fed from the company with a customized diet. Feeding consisted of grain, wheat, maize, soya bean oil and meat and premix for broilers (vitamin and mineral supplement). Chickens were slaughtered after 3 months of age and production was conducted according to the regulations of the EU 823/2004, 824/2004, 834/2004 and 543/2008.

2.2. Microbiological Analysis

From each sample, 10 g was added aseptically to 90 mL of sterile quarter strength Ringer’s solution (Lab M Limited, Lancashire, United Kingdom) in a stomacher bag (Seward Medical, London, UK) and homogenized in a stomacher device (Lab Blender 400, Seward Medical, London, UK) for 60 s at room temperature. For the enumeration of Total Viable Counts (TVC) and the dominant spoilage microorganism Pseudomonas spp., serial decimal dilutions were prepared in the same diluent and spread on the following media: a) tryptic glucose yeast agar (Plate Count Agar, Biolife, Milan, Italy) for TVC incubated at 25 °C for 72 h, and b) Pseudomonas Agar Base with selective supplement cephalothin-fucidin-cetrimide (LabM Limited, Lancashire, UK) for Pseudomonas spp., incubated at 25 °C for 48 h. After incubation, colonies were enumerated and microbial counts were logarithmically transformed (log CFU/g). Poultry samples with TVC counts exceeding 7.0 log CFU/g were considered spoiled as reported elsewhere [43,44,45].

2.3. Spectra Acquisition

MSI analysis was performed using a Videometer-Lab instrument (Videometer A/S, Videometer, 2019, Herlev, Denmark) which was installed in close proximity to the production line (at-line measurement) with the possibility of sample conditioning [46]. Videometer-Lab captures surface reflectance of samples in 18 different wavelengths (405–970 nm), namely: 405, 435, 450, 470, 505, 525, 570, 590, 630, 645, 660, 700, 850, 870, 890, 910, 940 and 970 nm. Surface reflectance is recorded by a standard monochrome charged coupled device chip (CCD). The object of interest is placed at the center of an Ulbricht sphere, which has a matte white coating inside and light-emitting diodes (LEDs) with narrow-band spectral radiation positioned side by side at spheres rim. The purpose of the coating is to ensure a diffused and spatially homogenous reflectance of the sample. During instrument performance, the diodes are turned on successively leading to a monochrome image with 32-bit floating-point accuracy for each wavelength. The final outcome of MSI analysis is a data cube of spatial and spectral data for each sample of size m × n × 18 (where m × n is the image size in pixels) [47,48].
A critical point before MSI application is the assurance that the range of LEDs intensity is stable while phenomena such as shadows and object’s disfiguration are avoided [23,49]. Therefore, a light set up procedure in which the acquisition captured at zero time of the experiment (auto light) is recalled and light-emitting diodes (LEDs) intensities are stabilized. Subsequently, geometric and radiometric calibration is undertaken in the Region of Interest (ROI) area with the aim of prototype target.
In order to exclude non-informative areas such as petri dish surface, fat, connective tissue etc., a pre-process step is required. The segmentation of ROI on the sample from no relevant areas and the implementation of Canonical Discriminant Analysis (CDA) areas is conducted via Videometer-Lab version 2.12.39 (Videometer A/S, Herlev, Denmark). Also known as Fisher (Fisher’s discriminant analysis), CDA separates pixels to different classes, based on ROI, through the following Equation (1) [50,51]:
R   ( a ) = a T   s a a T N a
where Σs is the distribution between classes and ΣN is the distribution within a class.

2.4. Data Pre-Processing and Model Development

For the development of models estimating the time from slaughter, Partial Least Squares Regression (PLS-R) [52,53] was chosen, where spectral data were the independent variables (n = 36) and time from slaughter (ts) was the dependent variable. Time from slaughter is considered as the time elapsed from slaughter until the MSI measurement. For each poultry model, a two-stage model development approach was followed: (a) calibration and full cross-validation (using leave one out cross-validation) for model optimization and (b) external validation with samples from different batches. More specifically, for chicken breast fillets, calibration was performed using a dataset from three independent batches (n = 82) and external validation was undertaken with two other batches (n = 22). Similarly, the PLS-R model for chicken thigh fillets was constructed using a training dataset from three batches (n = 67), whereas two other batches (n = 30) were used to assess the prediction performance of the model. Concerning the chicken burger, two batches (n = 87) were used in model training and one batch (n = 44) in prediction. Finally, for marinated chicken souvlaki, the dataset consisted of two batches (n = 91) for training and two different batches (n = 43) for external validation.
Prior to analysis, spectral data for each type of poultry product were pre-processed by different transformation techniques in an attempt to reduce random or systematic variations [22,54]. Reducing the total volume of data results in effective multispectral imaging systems and image acquisition with relatively low spatial resolutions in a few important wavelengths [13]. Standard Normal Variate transformation (SNV) Equation (2) was applied in the case of chicken thigh and burger in order to avoid collinear and “noisy” data areas [55]. In contrast, spectral data from chicken breast and marinated souvlaki were pre-processed with baseline offset treatment [56,57] Equation (3). Regarding time from slaughter (y variable), a logarithmic transformation was considered necessary due to large differences in the intensities of the raw data [58]. Data pre-treatment, model development and validation were implemented using the Unscrambler© v.9.7 software (CAMO Software AS, Oslo, Norway).
s I SNV = S I mean ( S ) stdev ( S )
where S refers to pixel-wise spectra, Si is the “old” information contained in a specific wavelength and SiSNV is the “new-transformed” information contained in a specific wavelength [22].
S(x) = x − min (x)
where S denotes pixel-wise spectra for one sample, x is information contained at a specific wavelength, and min(x) is the minimum variable in the x dataset.

3. Results

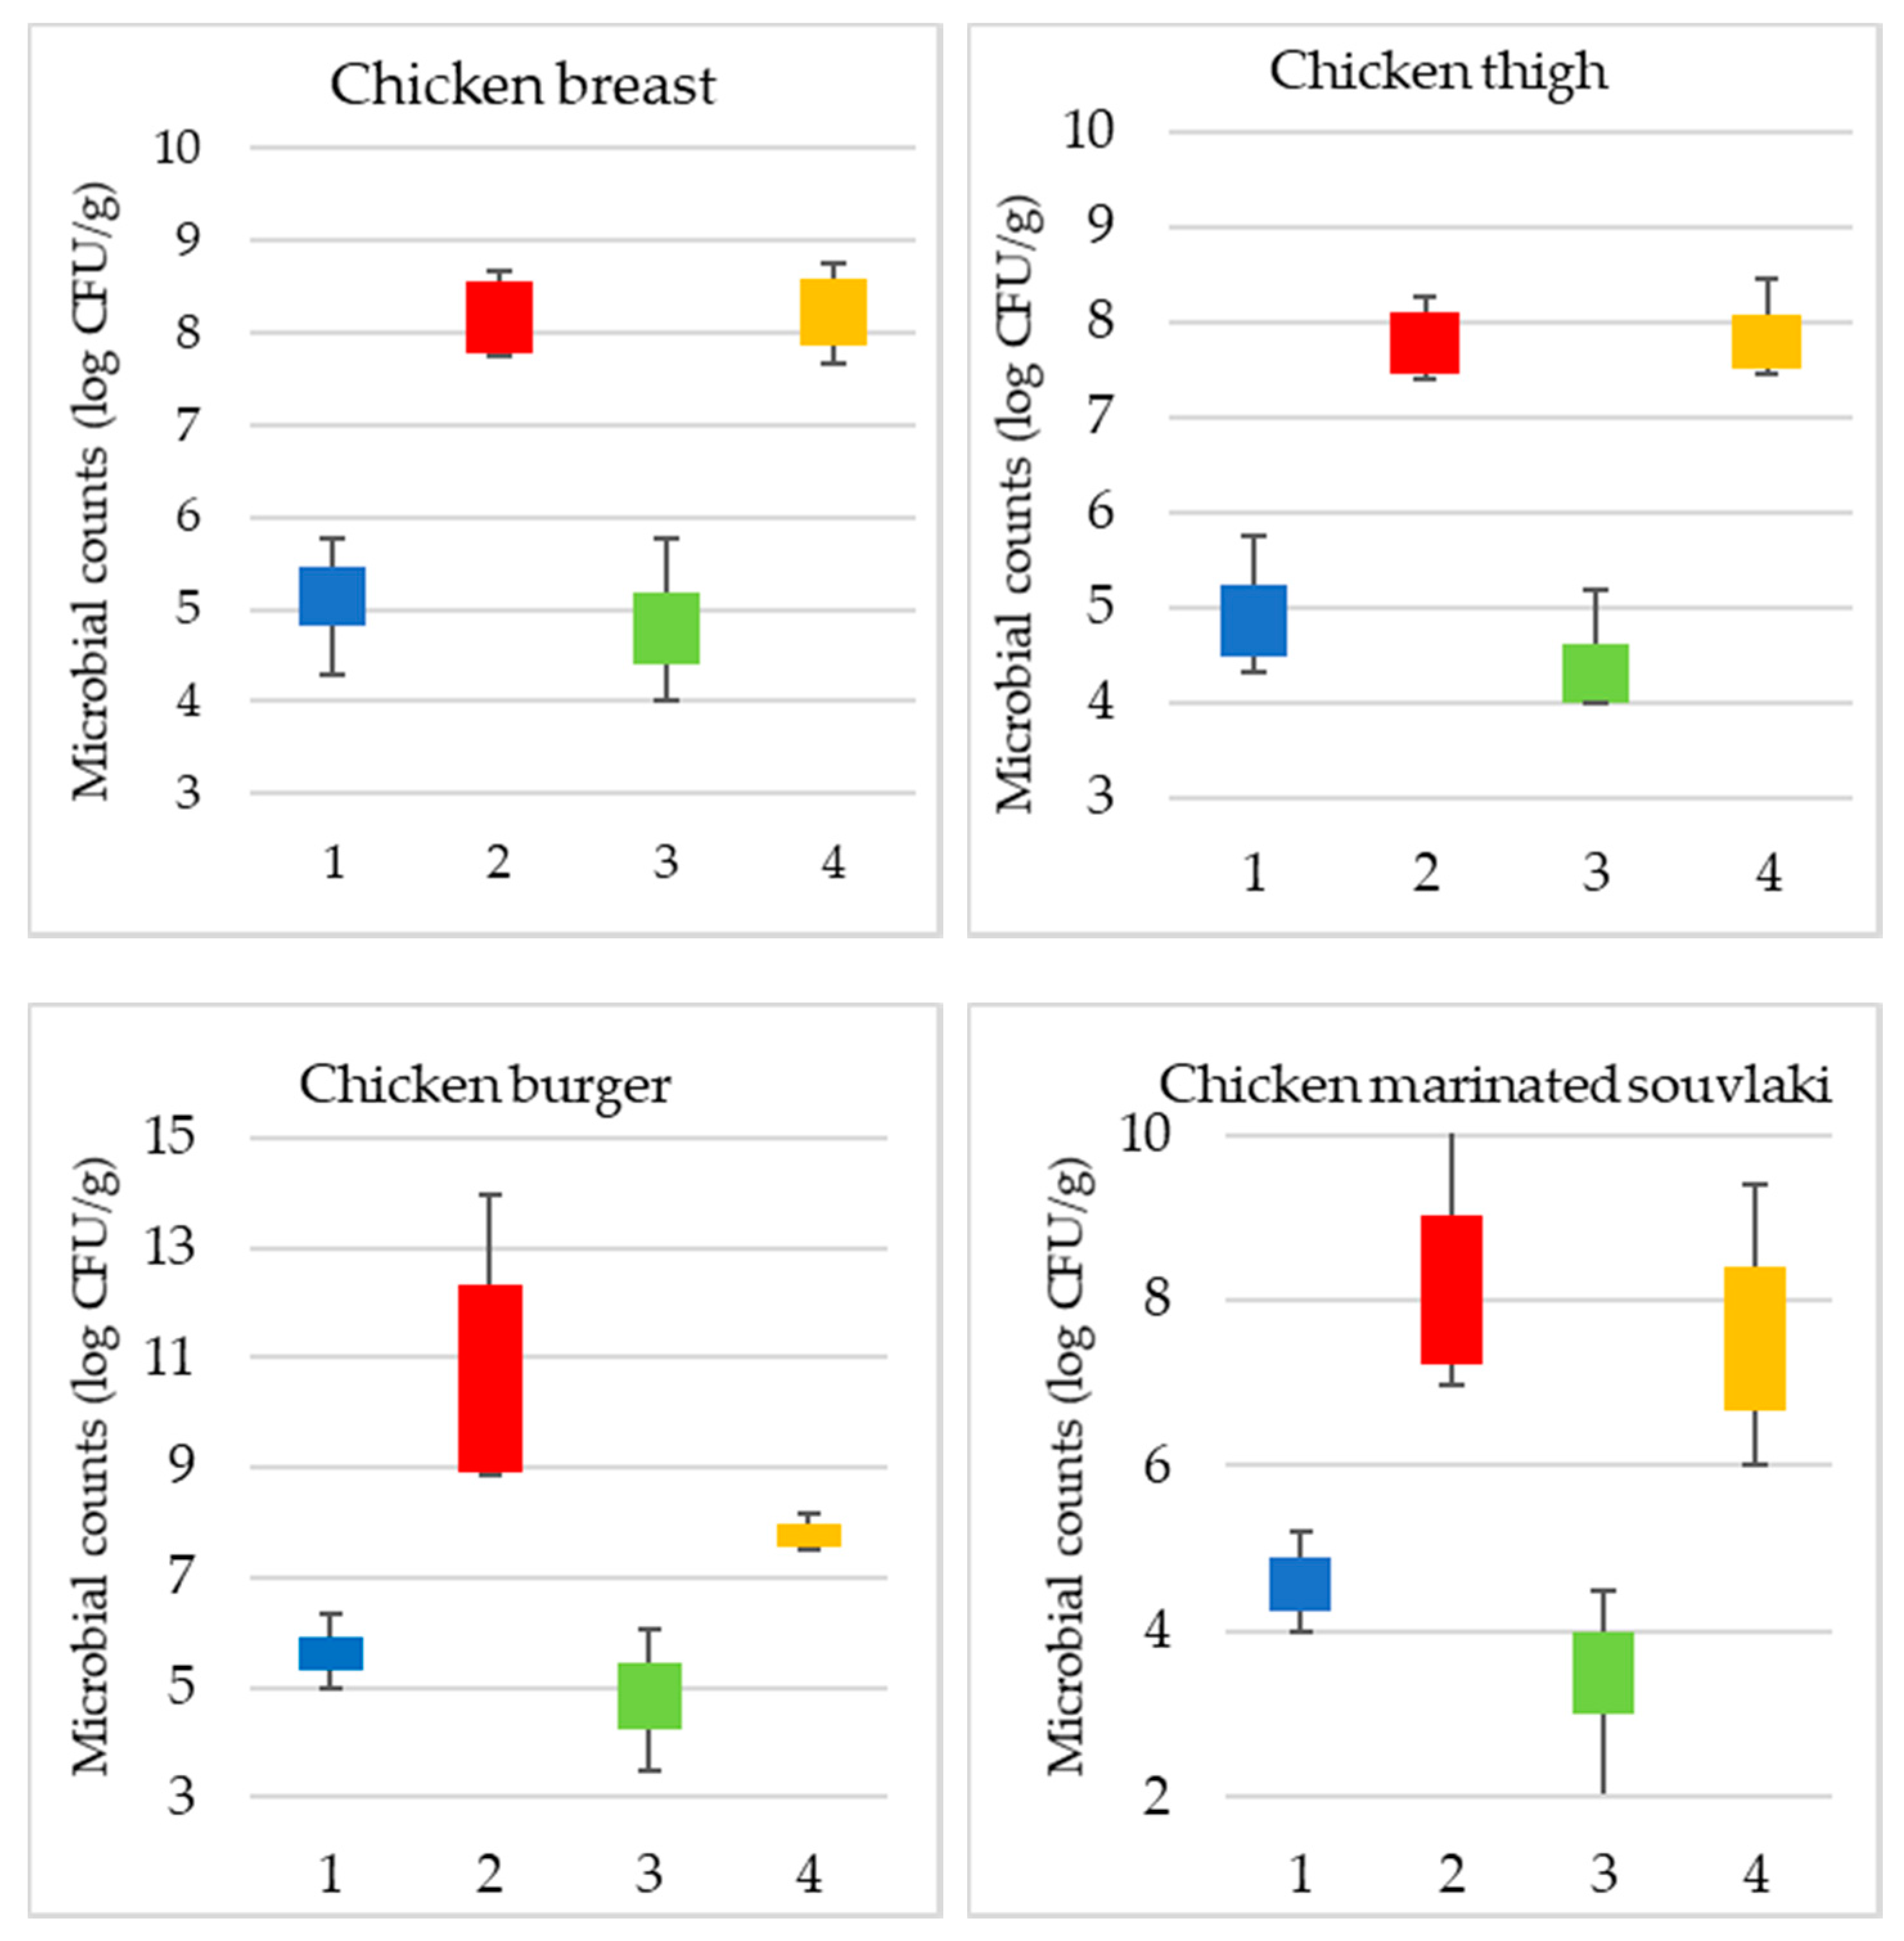
3.1. Microbiological Analysis

Τhe range of the microbial population of TVC and Pseudomonas spp. for the different batches of poultry products and storage time is illustrated in Figure 1. Additionally, the spread of TVC counts for fresh and spoiled samples is provided for each product case. More specifically, for chicken breast fillets, the initial number of TVC and Pseudomonas spp. was 5.2 (±0.6) and 4.9 (±0.82) log CFU/g respectively, whereas in spoiled samples the respective values were 8.4 (±0.46) and 8.3 (±0.47) log CFU/g. Additionally, for chicken thigh fillets, samples were considered fresh with TVC and Pseudomonas spp. counts at 5 (±0.83) and 4.5 (±0.98) log CFU/g. Spoiled chicken thigh samples had TVC and Pseudomonas spp. values at 7.9 (±0.50) and 7.8 (±0.49) log CFU/g, respectively.
For chicken burger samples, TVC and Pseudomonas spp. counts in fresh samples were 5.5 (±0.36) and 4.8 (±0.75) log CFU/g, respectively, while in spoiled samples the respective counts were 10.7 (±1.9) and 7.8 (±0.25) log CFU/g. Finally, marinated chicken souvlaki fresh samples had TVC and Pseudomonas spp. counts at 4.6 (±0.50) and 3.6 (±0.71) log CFU/g, respectively. In contrast, TVC and Pseudomonas spp. values for spoiled samples were 7.9 (±0.95) and 7.5 (±1.00) log CFU/g, respectively.
Results from storage experiments at 4 °C showed that chicken breast fillets were determined as spoiled beyond 168 h of storage (TVC > 7 log CFU/g) with TVC value at 7.76 log CFU/g and Pseudomonas spp. counts at 7.6 log CFU/g. For chicken thigh fillets, samples were characterized as fresh until 120 h when TVC and Pseudomonas spp. counts were 7.5 log CFU/g and 7.5 log CFU/g, respectively. TVC and Pseudomonas spp. counts were 8.8 log CFU/g and 7.7 log CFU/g in spoiled chicken burger samples (storage time 216 h). Moreover, chicken marinated souvlaki was defined as spoiled after 168 h of storage in which TVC were 7.3 log CFU/g and Pseudomonas spp. counts were 6.8 log CFU/g.

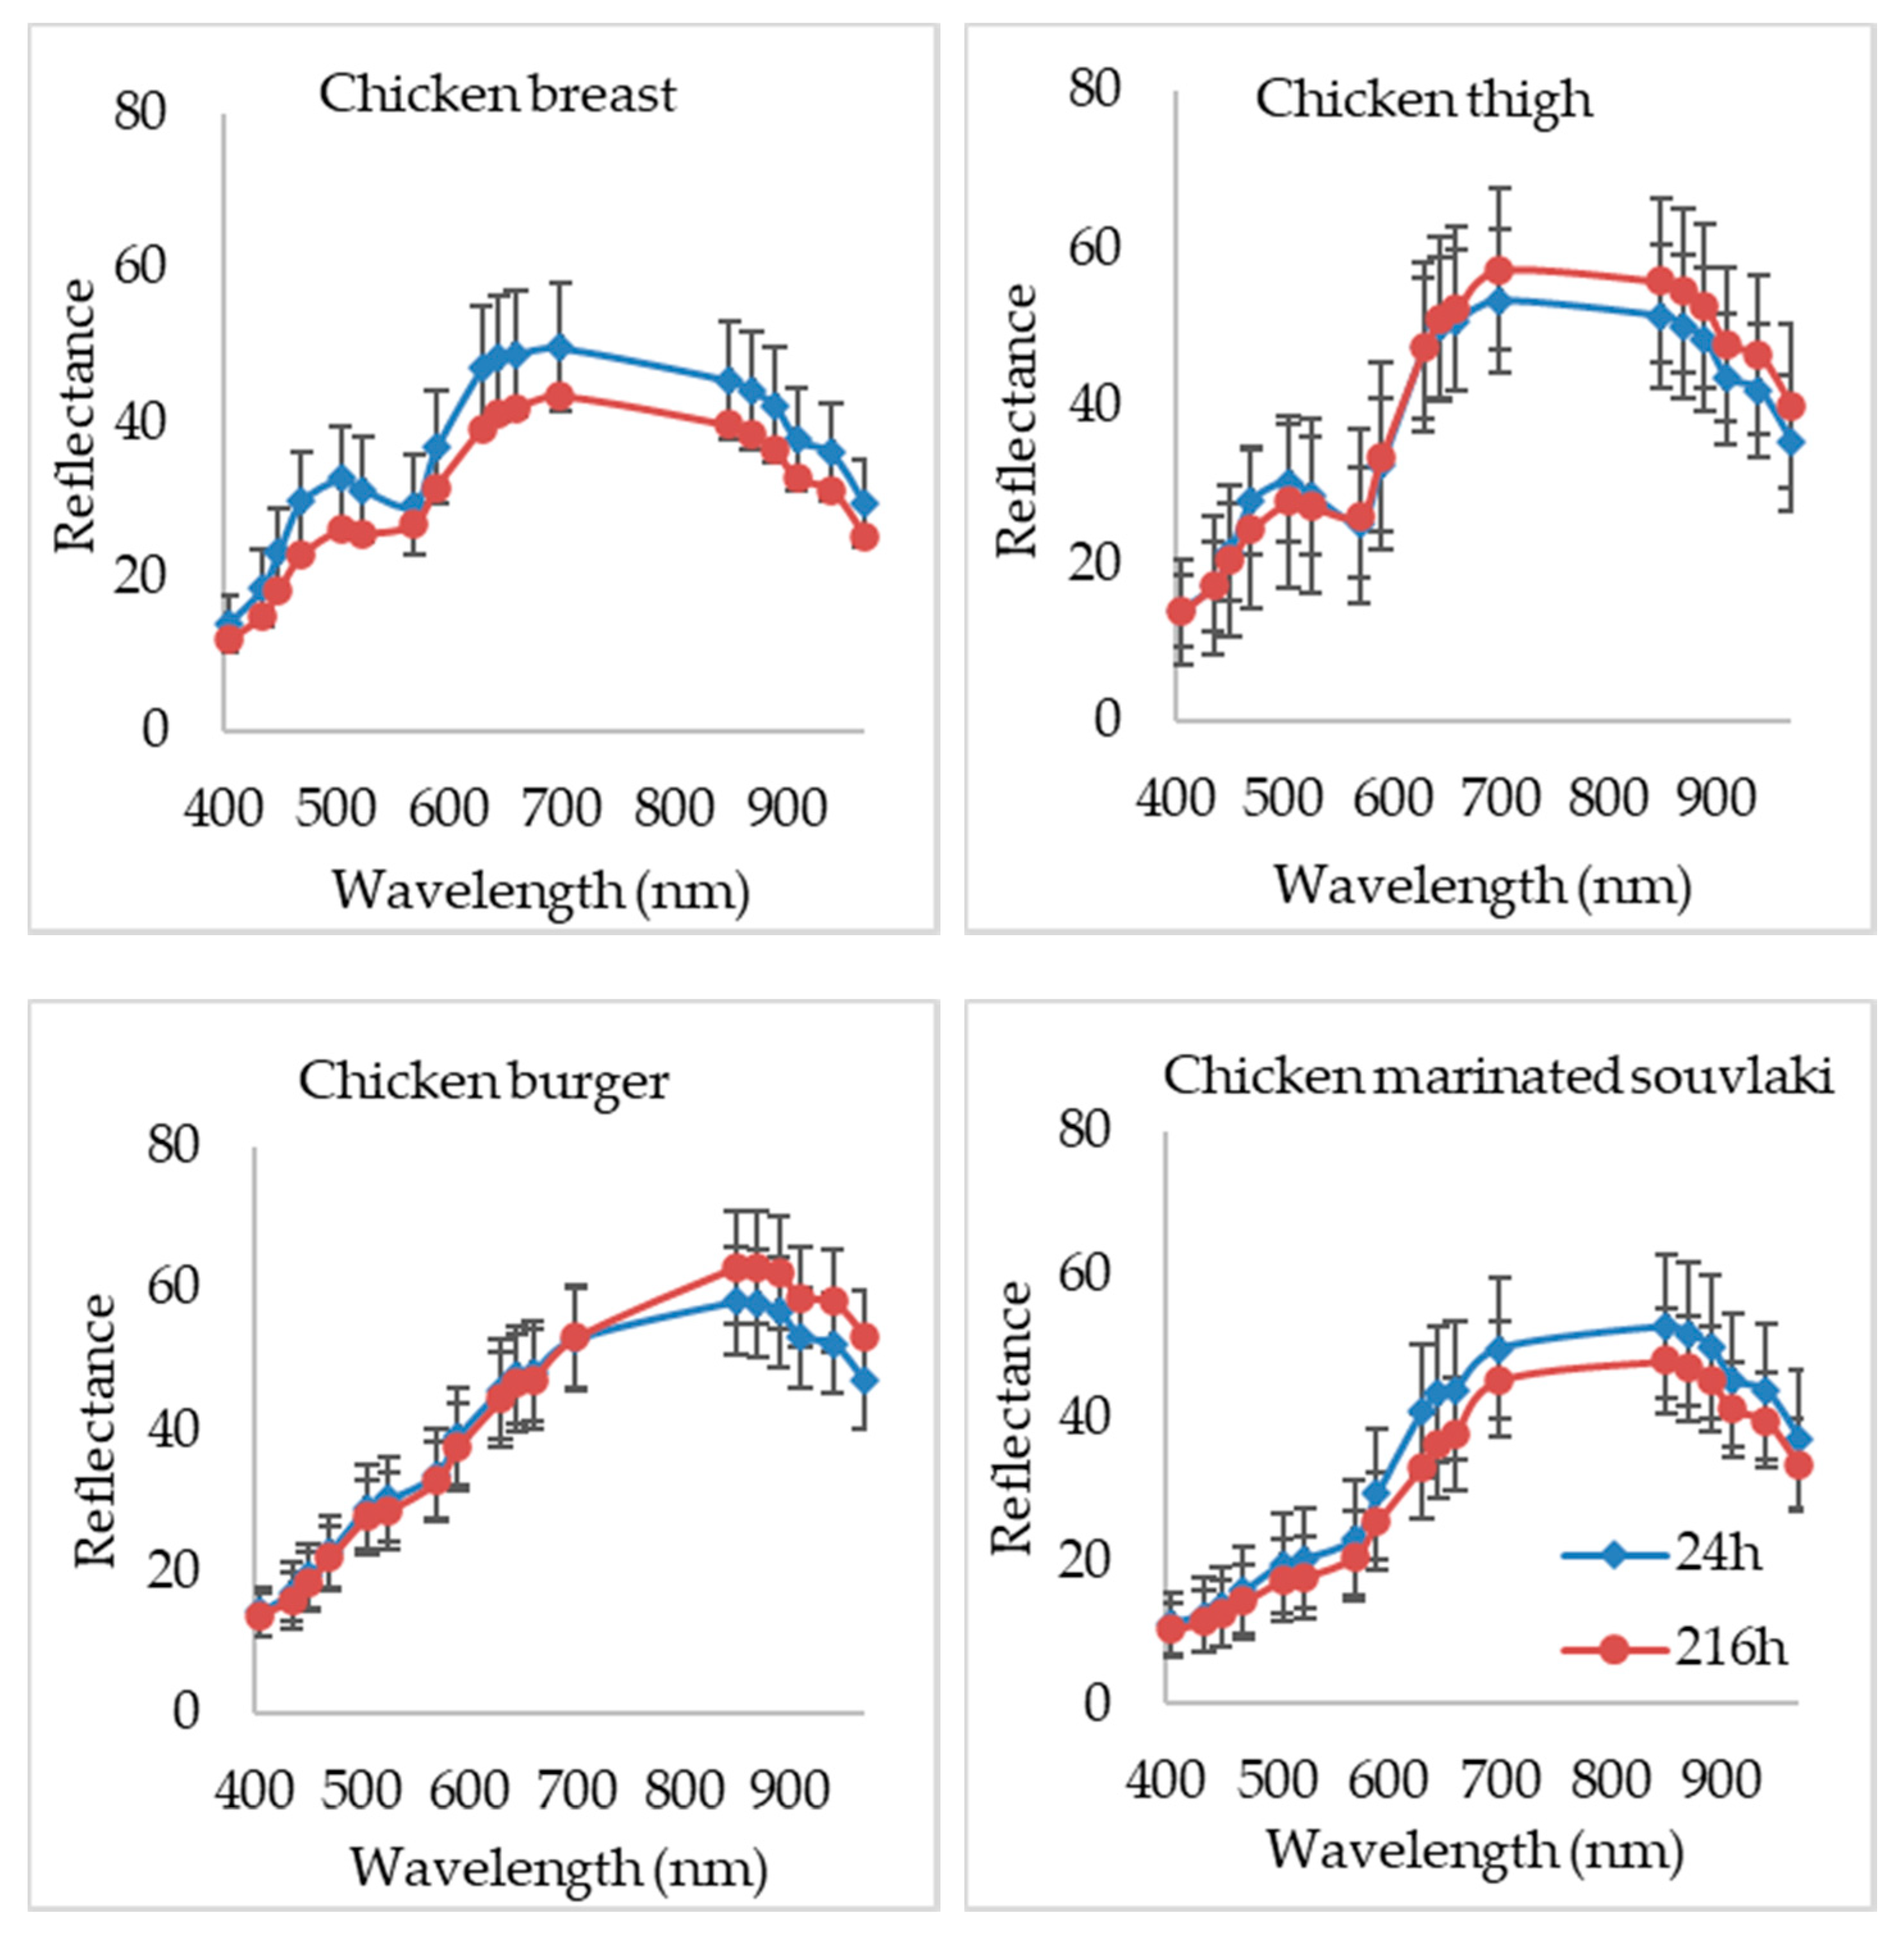
3.2. Spectral Measurements

For the development of PLS-R models, each wavelength contributed differently to each category of poultry product, despite the fact that all these products have the same basic ingredient (i.e., poultry meat). This is demonstrated in Figure 2 where differences could be observed in the spectra between each type of product during storage at 4 °C, based mostly on their nutrition composition difference [59,60].
The same figure (Figure 2) confirms also the ability of this spectroscopic method to detect and/or separate spoiled from fresh samples for each of the four products. For instance, in the case of chicken breast, wavelengths with variations in reflectance for fresh and spoiled samples were located in the areas of 470–570 nm and 590–970 nm, respectively. Wavelength range from 660 to 970 nm seemed to affect the estimation of spoilage for chicken thigh. Similarly, for marinated chicken souvlaki wavelengths above 570 nm deviated between fresh and spoiled samples, whereas for the chicken burger 850–970 nm were noticed as different.

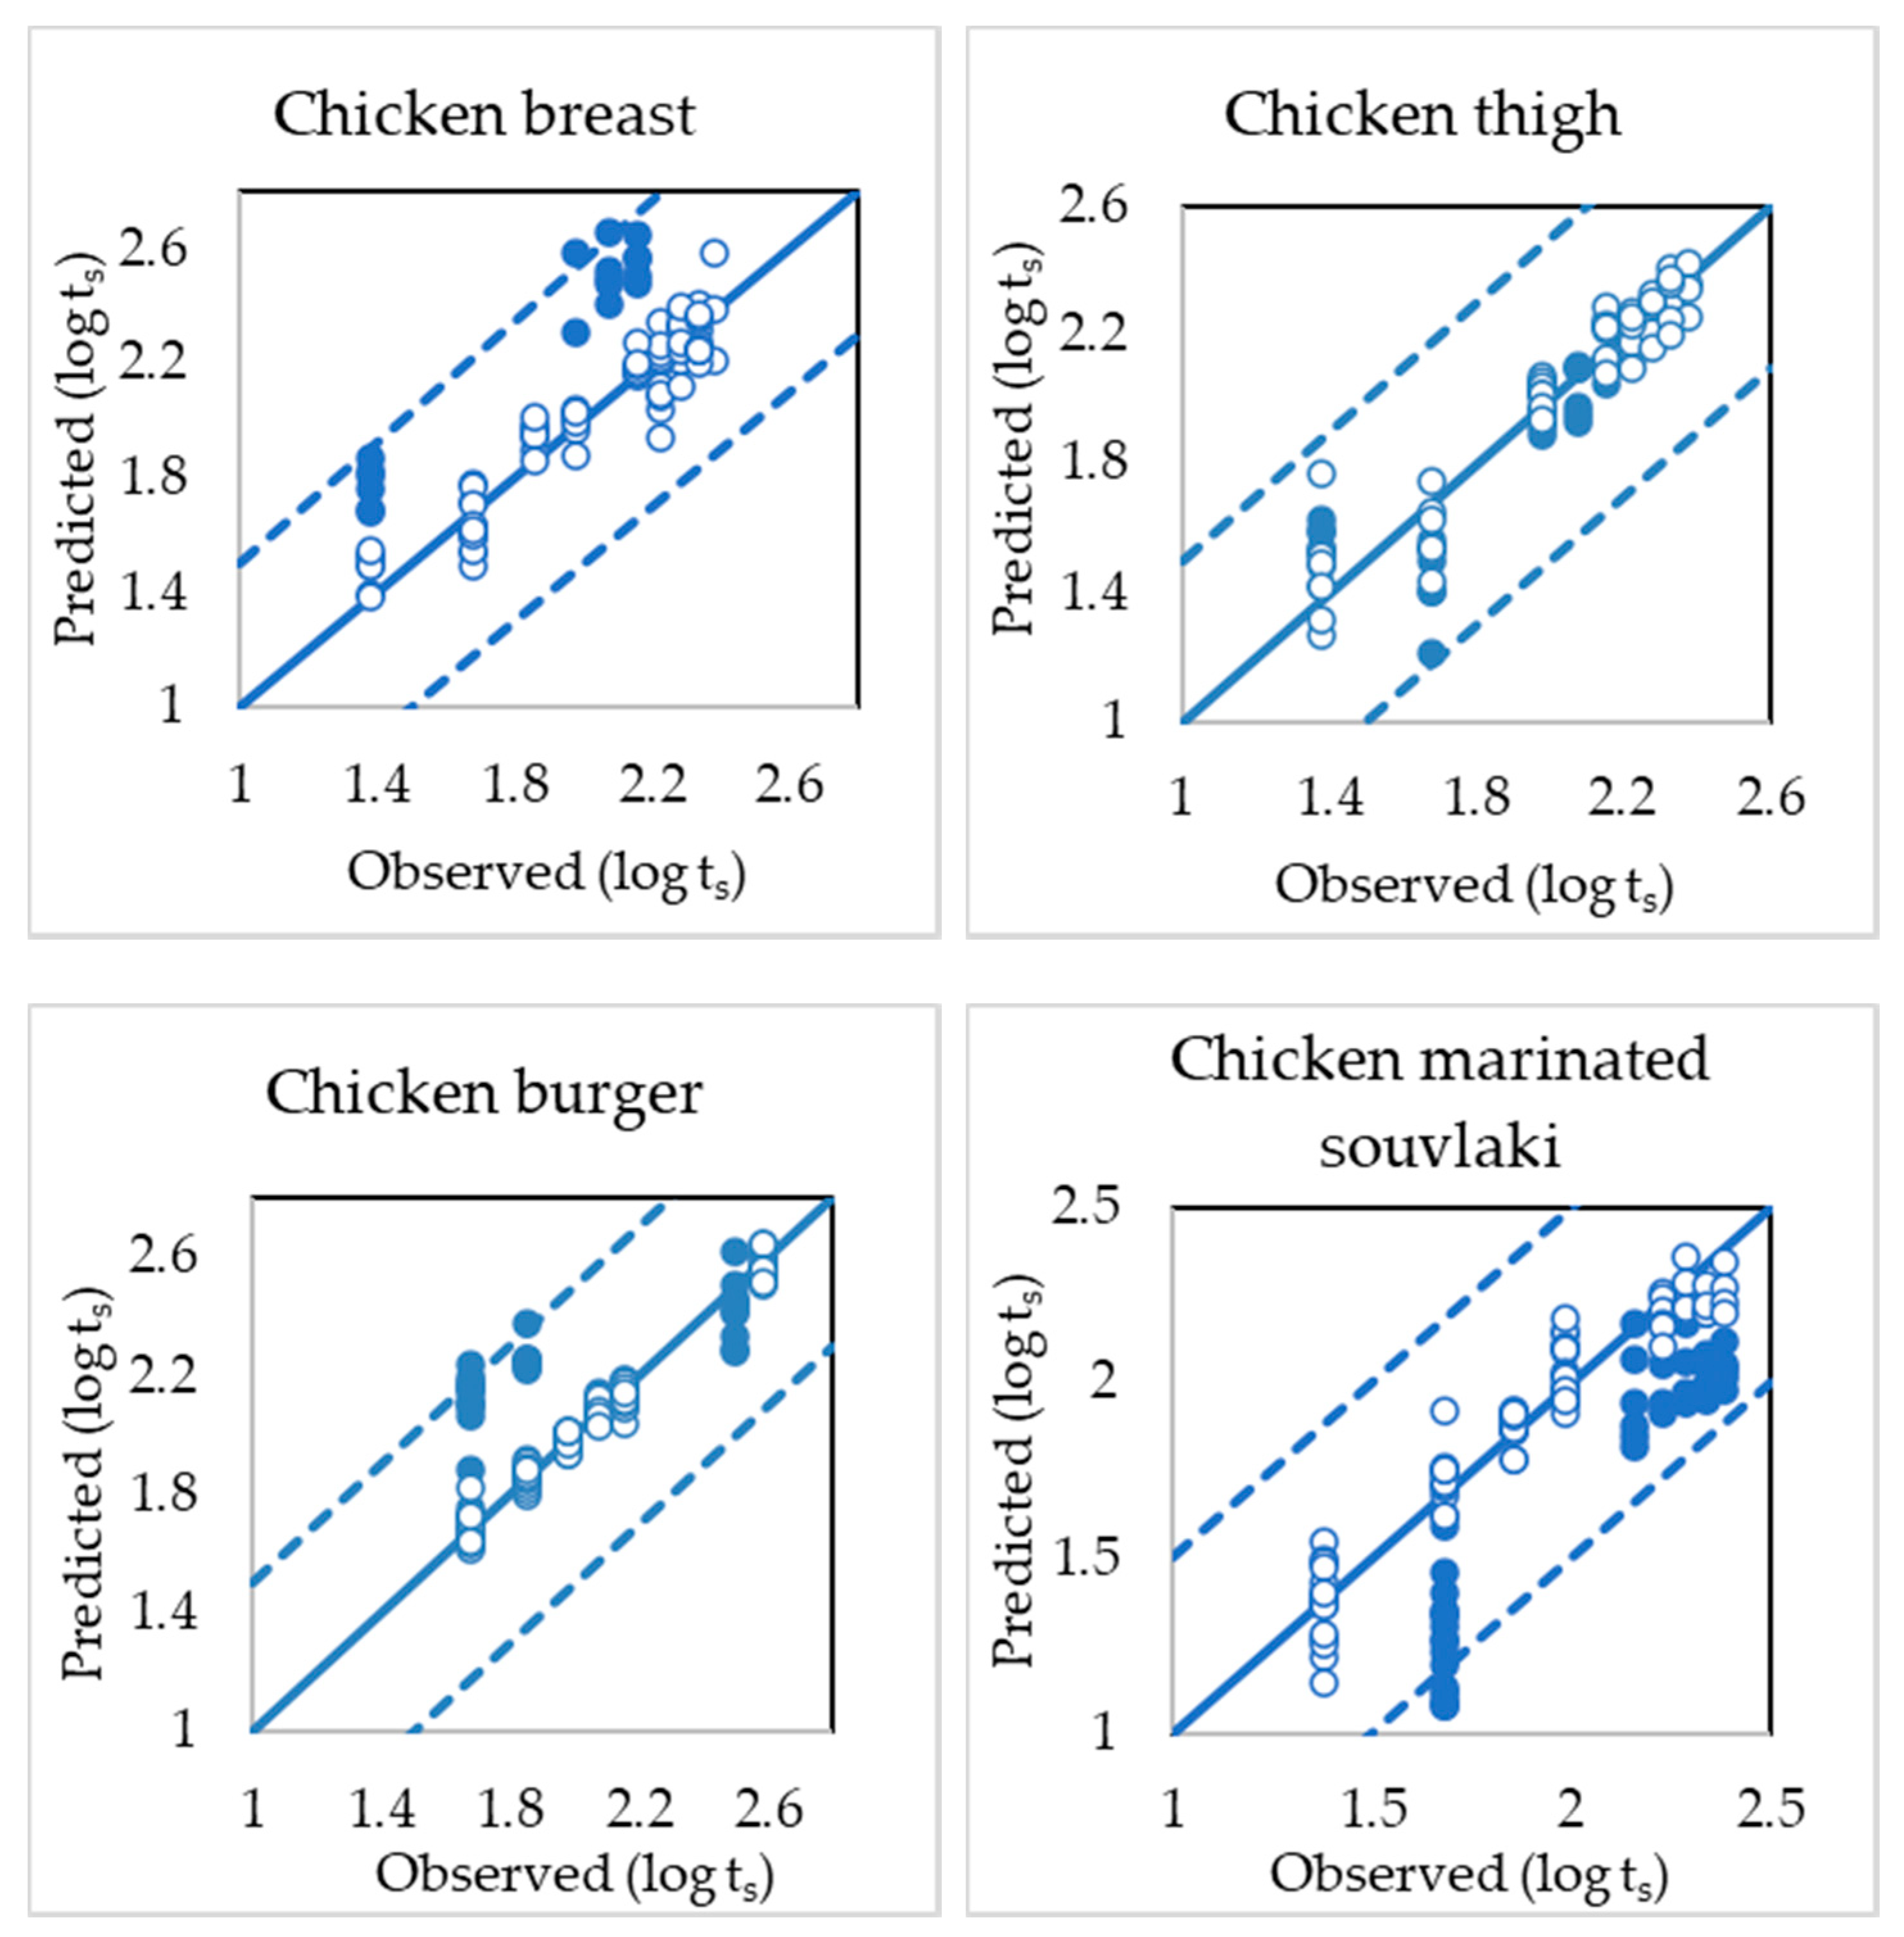
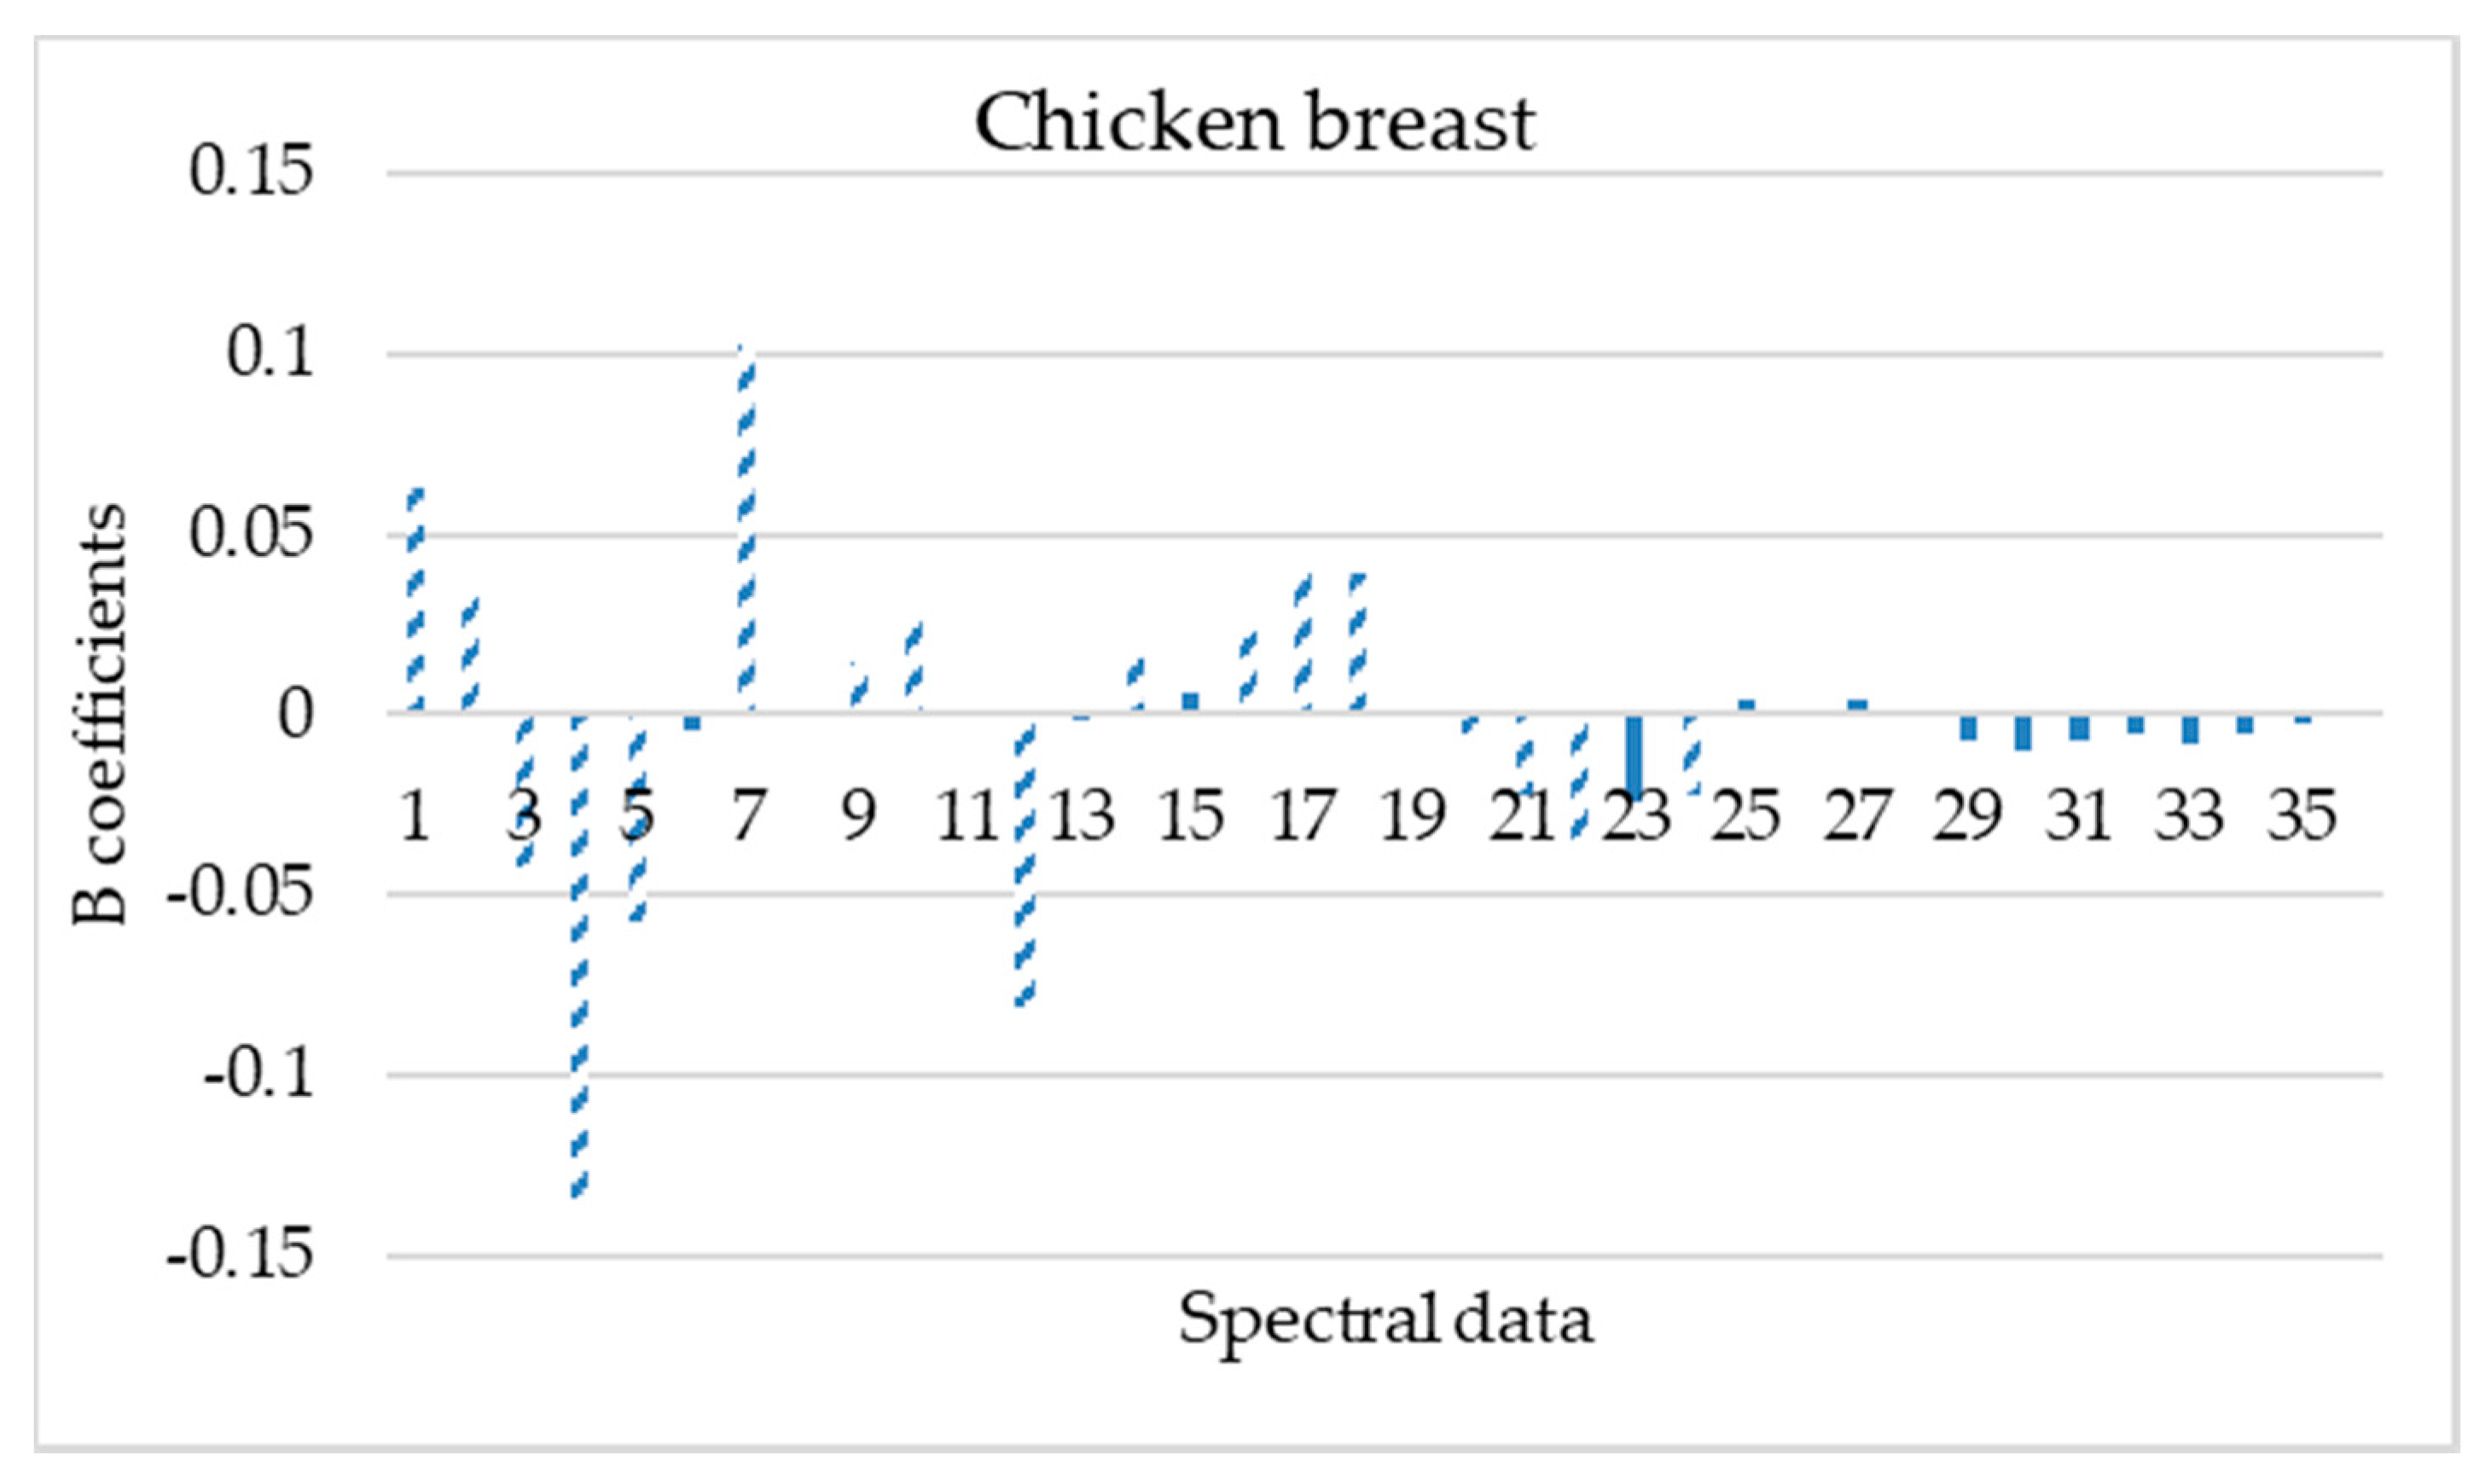
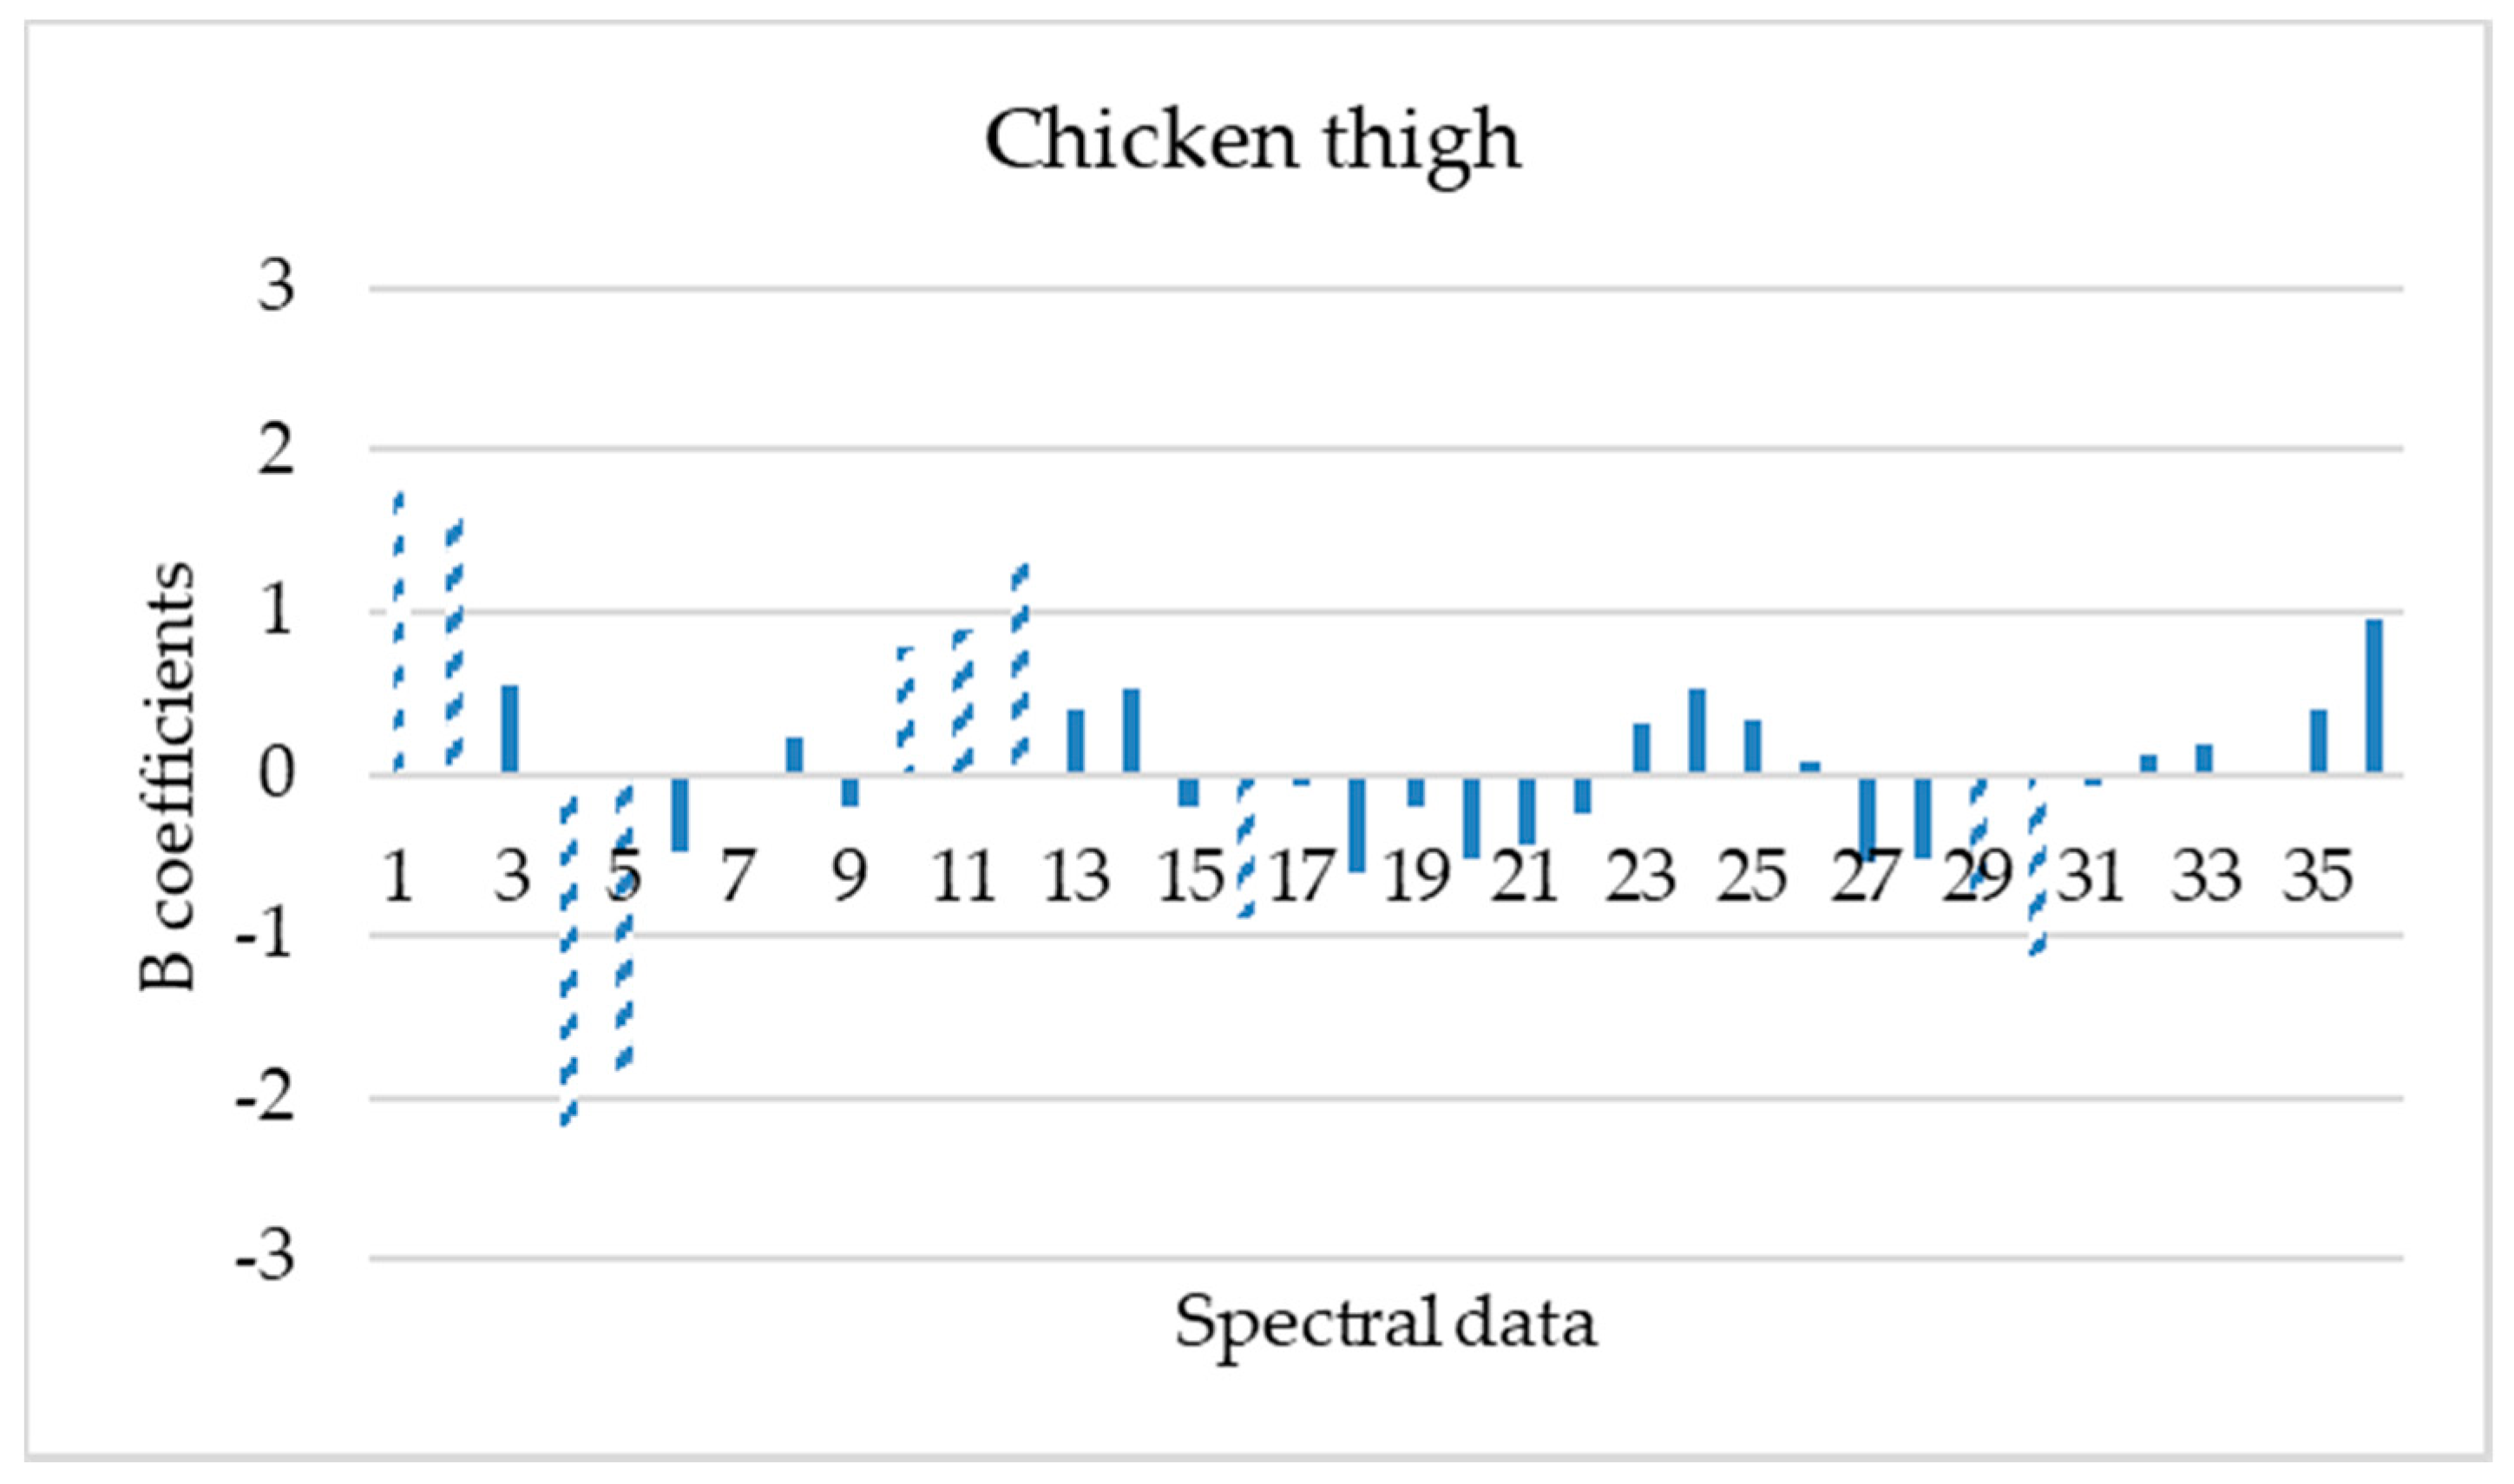
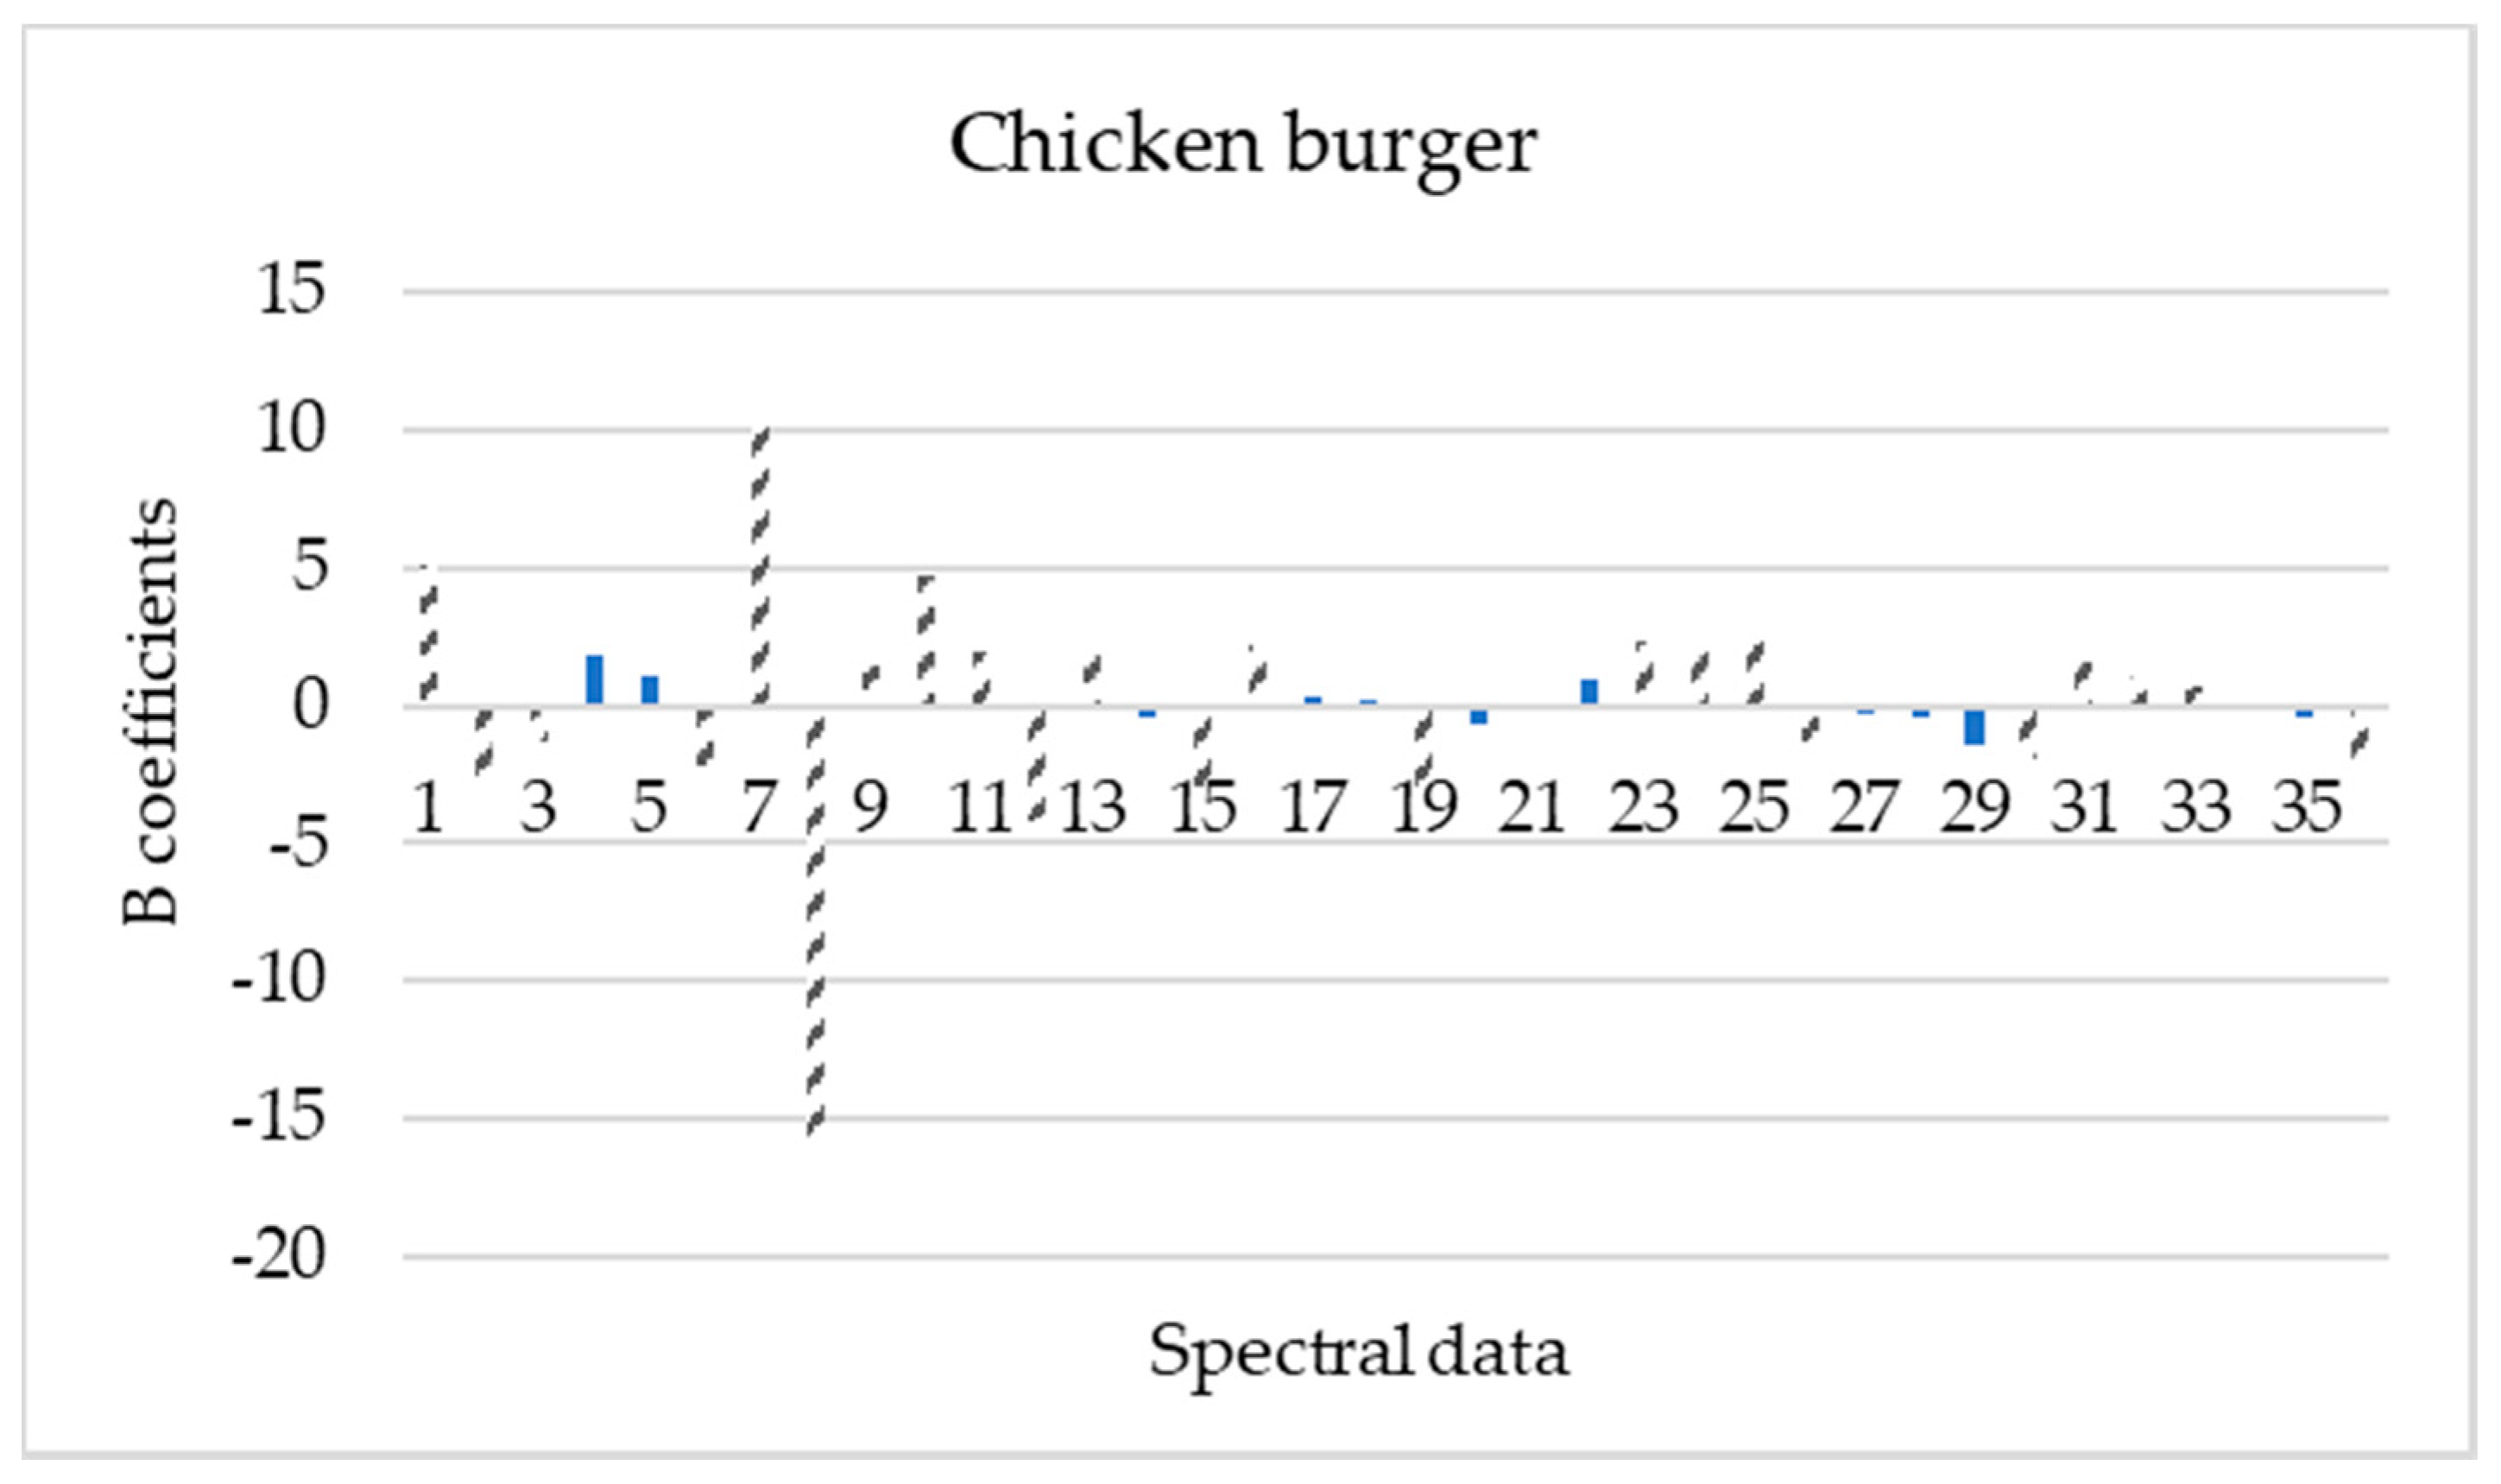
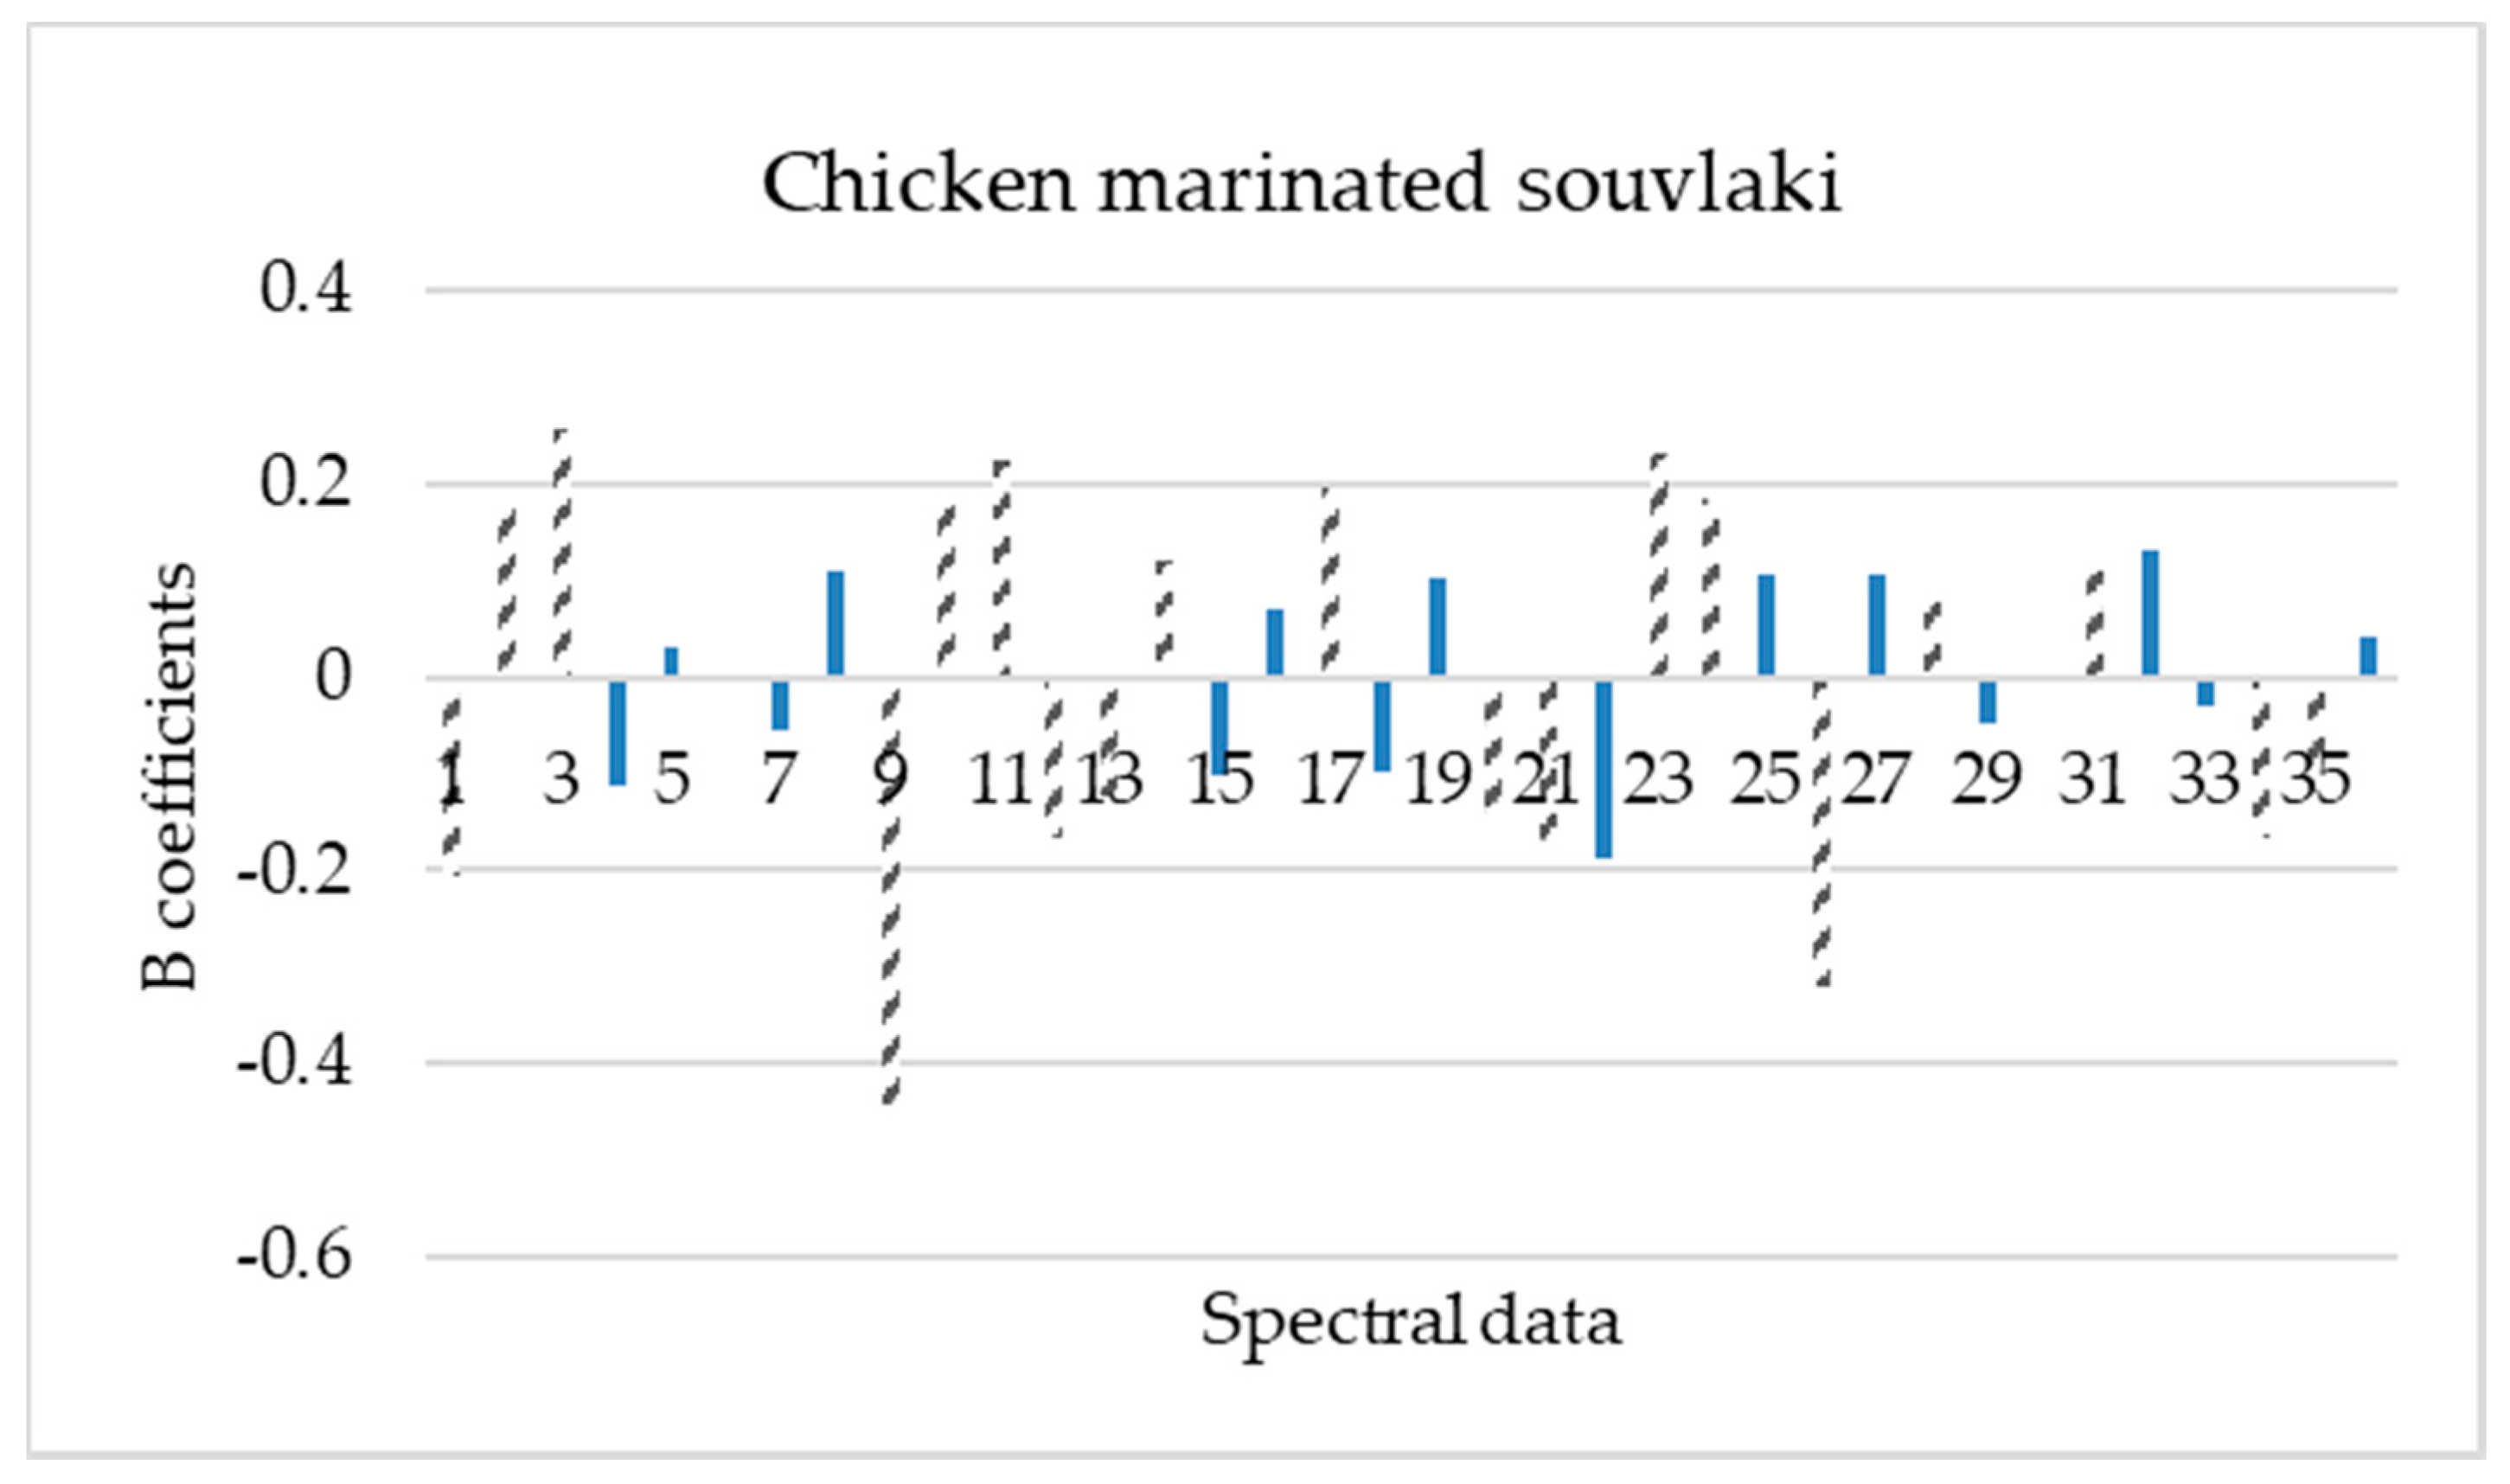
3.3. PLS-R Model Performance

RLS-R models assessing the time from slaughter showed satisfactory performance for each category of poultry product as inferred both graphically (Figure 3) and computationally based on performance indices such as slope, offset, correlation coefficient (r) and root mean squared error (RMSE) (Table 1).
For chicken breast fillets, time from slaughter was estimated quite accurately despite the variations between batches, with rp and RMSEp values for the prediction dataset of 0.886 and 0.383, respectively. Differences between batches and ingredients (spices, herbs and sauce) used in marinated chicken souvlaki did not affect the prediction performance of the PLS-R model, with rp and RMSEp values of 0.934 and 0.348, respectively. Even though chicken thigh muscle has a more complex texture, with a higher percentage of fat and connective fat tissue [61,62], no differences were observed between batches and subsequently, external validation was performed satisfactorily with rp and RMSEp values of 0.859 and 0.160, respectively. Similarly, the presence of vegetables (peppers, onions and herbs) and spices in the homogeneous mixture of chicken burgers was not an obstacle for the external validation, where rp and RMSEp values were 0.778 and 0.285, respectively. The above-mentioned RMSE values of prediction indicate satisfactory accuracy of the models used to assess the observed data [27,63].
The important wavelengths (mean values and standard deviations) reflecting the characteristics of spectral data for each poultry product were obtained based on the beta regression coefficients (Figure 4, Figure 5, Figure 6 and Figure 7).
Based on these beta regression coefficients, equations were constructed for the assessment of time from slaughter for each product (Equations (4)–(7)).
Yts,chicken breast = 2.016 + 0.063 Xmean,405 nm + 0.033 Xmean,435 nm − 0.042 Xmean,450 nm − 0.134 Xmean,470 nm − 0.057 Xmean,505 nm + 0.103 Xmean,570 nm + 0.015 Xmean,630 nm + 0.027 Xmean,645 nm − 0.081 Xmean,700 nm + 0.012 Xmean,870 nm + 0.023 Xmean,910 nm + 0.040 Xmean,940 nm + 0.039 Xmean, 970 nm − 0.022 XSD,450 nm − 3.505 XSD,470 nm − 2.462 XSD,505 nm − 0.023 XSD,525 nm
Yts,chicken thigh = −1.287 + 1.823 Xmean,405 nm + 1.596 Xmean, 435 nm − 2.277 Xmean, 470 nm − 1.835 Xmean,505 nm + 0.774 Xmean,645 nm + 0.901 Xmean, 660 nm + 1.407 Xmean, 700 nm − 0.888 Xmean, 910 nm − 0.754 XSD, 660 nm − 1.135 XSD, 700 nm
Yts,chicken burger = 3.042 + 5.092 Xmean,405 nm − 2.948 Xmean,435 nm − 1.332 Xmean,450 nm − 2.205 Xmean,525 nm + 10.153 Xmean,570 nm − 15.754 Xmean,590 nm+ 1.397 Xmean,630 nm + 4.716 Xmean,645 nm + 1.982 Xmean,660 nm − 4.230 Xmean,700 nm + 2.344 Xmean,850 nm − 2.989 Xmean,890 nm + 2.237 Xmean,910 nm- 3.283 XSD,405 nm +2.382 XSD,505 nm + 2.161 XSD,525 nm + 2.304 XSD,570 nm − 1.799 XSD,590 nm −1.402 XSD,660 nm − 1.874 XSD,700 nm +1.558 XSD,850 nm + 1.112 XSD,870 nm −2.188 XSD,970 nm
Yts,chicken marinated souvlaki = 3.071 − 0.205 Xmean,405 nm + 0.180 Xmean,435 nm + 0.255 Xmean,450 nm − 0.442 Xmean,630 nm + 0.189 Xmean,645 nm + 0.223 Xmean,660 nm − 0.168 Xmean,700 nm − 0.122 Xmean,850 nm + 0.119 Xmean,870 nm + 0.196 Xmean,940 nm − 0.150 XSD,435 nm − 0.185 XSD,450 nm + 0.232 XSD,505 nm + 0.184 XSD,525 nm − 0.319 XSD,590 nm + 0.091 XSD,645 nm + 0.131 XSD,870 nm − 0.165 XSD,910 nm − 9.849 XSD,940 nm

4. Discussion

Microbiological analysis demonstrated variations between batches for each category of poultry product even though the examined samples were obtained by the same farming conditions, slaughter process and production. For chicken breast and thigh samples, differences occurred at the initial microbial load (TVC and Pseudomonas spp.) based mostly on animal strain and fat content [62]. Furthermore, in the case of processed poultry products, the presence of additional ingredients such as vegetables and herbs seemed to influence the initial and final load of microorganisms.
MSI acquisition showed variations in reflectance at many wavelengths between the four poultry products due to their differences in the food matrix (chicken breast and chicken thigh) and the supplementary ingredients used in the production process of different chicken products (i.e., burger and marinated souvlaki). Moreover, spectra figures for fresh and spoiled samples (Figure 2) provided by MSI application indicated reflectance differences at several wavelengths, which are firmly linked to biochemical alterations and metabolic compounds produced by the spoilage microbiota on the surface of meat and poultry products. More specifically, reflectance at 570–700 nm is related to respiratory pigments such as myoglobin (570 nm), oxymyoglobin (590 nm) and metmyoglobin (630 nm) [23,24,59]. In the NIR region, absorption bands at 910 nm are linked to denaturation of proteins [60,64] while at 750 and 970 nm, O-H second overtones are related to the moisture content in the samples [26,38,53]. In addition, absorption bands observed in the NIR region (928 and 940 nm) are correlated to the presence of fatty acids and fat within the sample matrix [14,60,65].
PLS-R models predicted satisfactorily the time from slaughter for each poultry product (Table 1) where the chicken thigh model showed the lowest value of RMSE followed by the chicken burger model. RMSE and r values of prediction were in the range of 0.160–0.348 and 0.778–0.943 respectively, for all PLS-R models. Model performance was gradually deteriorated from the calibration to the prediction stage. As illustrated in Figure 3, batches used in external validation differed from the calibration dataset in all products and especially in the case of the chicken breast. These findings indicate the importance of performing validation with independent datasets (batches at different time points) and to include as much variability as possible in the developed model [64,66,67]. Additionally, the developed model addressed for at-line implementation must be validated by an independent dataset in order to construct an accurate and robust model [24,52]. Despite this variation in batches, both calibration and prediction datasets in Figure 3 are situated within the limit area of ±1.6 log ts resulting in acceptable PLS-R models. For chicken marinated souvlaki and burger models, variations between batches and higher RMSE values could be explained due to different types of ingredients such as spices, chopped vegetables and marinade employed in the production process.
Beta regression coefficients revealed the influence of each wavelength on the assessment of time from slaughter for each poultry product. According to Figure 4, Figure 5, Figure 6 and Figure 7, wavelengths with high positive or negative values have an important contribution to the model and convey useful information. The comparison of these findings with the raw spectra shown in Figure 2 confirms the significant role of reflectance bands in the range 570–700 nm and 700–970 nm for the development of PLS-R models [38,68]. As mentioned above, absorption bands at NIR region of 910 nm seemed to be associated with proteins, which are in abundance in chicken meat, especially in chicken breast [61]. The influence of muscle pigments and water content on the classification of chicken breast fillets was also highlighted by Yang et al., where samples were successfully classified in different quality grades [25].
In conclusion, the performance of the developed PLS-R models showed an efficient prediction of the time from slaughter (ts) for each poultry product. The food matrix (muscle type, spices and marinade) had a great impact on the prediction of time from slaughter with marinated chicken souvlaki and chicken thigh models showing satisfactory performance. The prediction was also influenced by the variations between batches. Furthermore, the selection of different datasets (batches) as external validation assures the efficient prediction of models. Additional measurements and continuous information feedback could ameliorate the existing models and result in a more successful prediction of time from slaughter.

Author Contributions

Conceptualization, G.-J.E.N.; methodology, E.D.S, E.Z.P. and G.-J.E.N.; software, E.D.S.; validation, E.Z.P., A.I.D. and A.A.A.; formal analysis, E.D.S.; investigation, E.D.S.; resources, C.C.T. and G.-J.E.N.; data curation, E.D.S.; writing—original draft preparation, E.D.S.; writing—review and editing, E.Z.P. and G.-J.E.N.; visualization, E.Z.P., A.A.A., A.I.D. and C.C.T.; supervision, C.C.T., E.Z.P. and G.-J.E.N.; project administration, G.-J.E.N.; funding acquisition, G-J.E.N. All authors have read and agreed to the published version of the manuscript.

Funding

This research has been co-financed by the European Regional Development Fund of the European Union and Greek national funds through the Operational Program Competitiveness, Entrepreneurship and Innovation, under the call RESEARCH-CREATE-INNOVATE (project code: T1EDK-04344, “A Model Smart Quality Assurance and Safety System for Fresh Poultry Products-QAPP”).

Conflicts of Interest

The authors declare no conflict of interest. The funders had no role in the design of the study; in the collection, analyses, or interpretation of data; in the writing of the manuscript, or in the decision to publish the results.

References

  1. FAO. Gateway to Poultry Production and Products. Available online: http://www.fao.org/poultry-production-products/products-processing/en/ (accessed on 15 March 2020).
  2. Baston, O.; Barna, O. Raw chicken leg and breast sensory evaluation. J. Food Sci. Technol. 2010, 11, 25–30. [Google Scholar]
  3. Dawson, P.L.; Chaves, B.D.; Northcutt, J.K.; Han, I.Y. Quality and shelf life of fresh chicken breasts subjected to crust freezing with and without skin. J. Food Qual. 2013, 36, 361–368. [Google Scholar] [CrossRef]
  4. Nychas, G.J.E.; Panagou, E.Z.; Mohareb, F. Novel approaches for food safety management and communication. Curr. Opin. Food Sci. 2016, 12, 13–20. [Google Scholar] [CrossRef] [Green Version]
  5. Kamruzzaman, M.; Makino, Y.; Oshita, S. Non-invasive analytical technology for the detection of contamination, adulteration, and authenticity of meat, poultry, and fish: A review. Anal. Chim. Acta 2015, 853, 19–29. [Google Scholar] [CrossRef]
  6. Chen, Q.; Cai, J.; Wan, X.; Zhao, J. Application of linear/non-linear classification algorithms in discrimination of pork storage time using Fourier transform near infrared (FT-NIR) spectroscopy. LWT-Food Sci. Technol. 2011, 44, 2053–2058. [Google Scholar] [CrossRef]
  7. van den Berg, F.; Lyndgaard, C.B.; Sørensen, K.M.; Engelsen, S.B. Process analytical technology in the food industry. Trends Food Sci. Technol. 2013, 31, 27–35. [Google Scholar] [CrossRef]
  8. Cullen, P.J.; O’Donnell, C.P.; Fagan, C.C. Process Analytical Technology for the Food Industry, 1st ed.; Springer: New York, NY, USA, 2014; pp. 1–5. [Google Scholar] [CrossRef]
  9. Grassi, S.; Alamprese, C. Advances in NIR spectroscopy applied to process analytical technology in food industries. Curr. Opin. Food Sci. 2018, 22, 17–21. [Google Scholar] [CrossRef]
  10. Teena, M.; Manickavasagan, A.; Mothershaw, A.; El Hadi, S.; Jayas, D.S. Potential of machine vision techniques for detecting fecal and microbial contamination of food products: A review. Food Bioprocess Tech. 2013, 6, 1621–1634. [Google Scholar] [CrossRef]
  11. Alamprese, C.; Amigo, J.M.; Casiraghi, E.; Engelsen, S.B. Identification and quantification of turkey meat adulteration in fresh, frozen-thawed and cooked minced beef by FT-NIR spectroscopy and chemometrics. Meat Sci. 2016, 121, 175–181. [Google Scholar] [CrossRef]
  12. Cai, J.; Chen, Q.; Wan, X.; Zhao, J. Determination of total volatile basic nitrogen (TVB-N) content and Warner–Bratzler shear force (WBSF) in pork using Fourier transform near infrared (FT-NIR) spectroscopy. Food Chem. 2011, 126, 1354–1360. [Google Scholar] [CrossRef]
  13. Qin, J.; Chao, K.; Kim, M.S.; Lu, R.; Burks, T.F. Hyperspectral and multispectral imaging for evaluating food safety and quality. J. Food Eng. 2013, 118, 157–171. [Google Scholar] [CrossRef]
  14. Liu, D.; Sun, D.W.; Zeng, X.A. Recent advances in wavelength selection techniques for hyperspectral image processing in the food industry. Food Bioproc. Tech. 2014, 7, 307–323. [Google Scholar] [CrossRef]
  15. Xiong, Z.; Xie, A.; Sun, D.W.; Zeng, X.A.; Liu, D. Applications of hyperspectral imaging in chicken meat safety and quality detection and evaluation: A review. Crit. Rev. Food Sci. Nutr. 2015, 55, 1287–1301. [Google Scholar] [CrossRef]
  16. Ghasemi-Varnamkhasti, M.; Mohtasebi, S.S.; Siadat, M. Biomimetic-based odor and taste sensing systems to food quality and safety characterization: An overview on basic principles and recent achievements. J. Food Eng. 2010, 100, 377–387. [Google Scholar] [CrossRef]
  17. Huffman, B.; Mazrouei, R.; Bevelheimer, J.; Shavezipur, M. Three-Dimensional Biomimetic Biosensors for Food Safety Applications. In Proceedings of the ASME 2017 International Design Engineering Technical Conferences and Computers and Information in Engineering Conference, American Society of Mechanical Engineers Digital Collection, Cleveland, OH, USA, 6–9 August 2017. [Google Scholar] [CrossRef]
  18. Vasconcelos, H.; Saraiva, C.; de Almeida, J.M. Evaluation of the spoilage of raw chicken breast fillets using Fourier transform infrared spectroscopy in tandem with chemometrics. Food Bioproc. Tech. 2014, 7, 2330–2341. [Google Scholar] [CrossRef]
  19. Estelles-Lopez, L.; Ropodi, A.; Pavlidis, D.; Fotopoulou, J.; Gkousari, C.; Peyrodie, A.; Panagou, E.Z.; Nychas, G.-J.E.; Mohareb, F. An automated ranking platform for machine learning regression models for meat spoilage prediction using multi-spectral imaging and metabolic profiling. Food Res. Int. 2017, 99, 206–215. [Google Scholar] [CrossRef] [Green Version]
  20. Tsakanikas, P.; Fengou, L.C.; Manthou, E.; Lianou, A.; Panagou, E.Z.; Nychas, G.J.E. A unified spectra analysis workflow for the assessment of microbial contamination of ready-to-eat green salads: Comparative study and application of non-invasive sensors. Comput. Electron. Agric. 2018, 155, 212–219. [Google Scholar] [CrossRef] [Green Version]
  21. Feng, C.H.; Makino, Y.; Oshita, S.; Martín, J.F.G. Hyperspectral imaging and multispectral imaging as the novel techniques for detecting defects in raw and processed meat products: Current state-of-the-art research advances. Food Control 2018, 84, 165–176. [Google Scholar] [CrossRef]
  22. Tsakanikas, P.; Pavlidis, D.; Panagou, E.; Nychas, G.J. Exploiting multispectral imaging for non-invasive contamination assessment and mapping of meat samples. Talanta 2016, 161, 606–614. [Google Scholar] [CrossRef]
  23. Panagou, E.Z.; Papadopoulou, O.; Carstensen, J.M.; Nychas, G.J.E. Potential of multispectral imaging technology for rapid and non-destructive determination of the microbiological quality of beef filets during aerobic storage. Int. J. Food Microbiol. 2014, 174, 1–11. [Google Scholar] [CrossRef]
  24. Pu, H.; Kamruzzaman, M.; Sun, D.W. Selection of feature wavelengths for developing multispectral imaging systems for quality, safety and authenticity of muscle foods-a review. Trends Food Sci. Technol. 2015, 45, 86–104. [Google Scholar] [CrossRef]
  25. Yang, Y.; Zhuang, H.; Yoon, S.C.; Wang, W.; Jiang, H.; Jia, B. Rapid classification of intact chicken breast fillets by predicting principal component score of quality traits with visible/near-infrared spectroscopy. Food Chem. 2018, 244, 184–189. [Google Scholar] [CrossRef] [PubMed]
  26. Feng, Y.Z.; Sun, D.W. Determination of total viable count (TVC) in chicken breast fillets by near-infrared hyperspectral imaging and spectroscopic transforms. Talanta 2013, 105, 244–249. [Google Scholar] [CrossRef]
  27. Feng, Y.Z.; El Masry, G.; Sun, D.W.; Scannell, A.G.; Walsh, D.; Morcy, N. Near-infrared hyperspectral imaging and partial least squares regression for rapid and reagentless determination of Enterobacteriaceae on chicken fillets. Food Chem. 2013, 138, 1829–1836. [Google Scholar] [CrossRef] [PubMed]
  28. Feng, Y.Z.; Sun, D.W. Near-infrared hyperspectral imaging in tandem with partial least squares regression and genetic algorithm for non-destructive determination and visualization of Pseudomonas loads in chicken fillets. Talanta 2013, 109, 74–83. [Google Scholar] [CrossRef]
  29. Ye, X.; Iino, K.; Zhang, S. Monitoring of bacterial contamination on chicken meat surface using a novel narrowband spectral index derived from hyperspectral imagery data. Meat Sci. 2016, 122, 25–31. [Google Scholar] [CrossRef]
  30. Kamruzzaman, M.; Makino, Y.; Oshita, S. Rapid and non-destructive detection of chicken adulteration in minced beef using visible near-infrared hyperspectral imaging and machine learning. J. Food Eng. 2016, 170, 8–15. [Google Scholar] [CrossRef]
  31. Yang, C.C.; Chao, K.; Chen, Y.R.; Early, H.L. Systemically diseased chicken identification using multispectral images and region of interest analysis. Comput. Electron. Agric. 2005, 49, 255–271. [Google Scholar] [CrossRef]
  32. Cho, B.K.; Chen, Y.R.; Kim, M.S. Multispectral detection of organic residues on poultry processing plant equipment based on hyperspectral reflectance imaging technique. Comput. Electron. Agric. 2007, 57, 177–189. [Google Scholar] [CrossRef]
  33. Park, B.; Lawrence, K.C.; Windham, W.R.; Smith, D.P. Performance of hyperspectral imaging system for poultry surface fecal contaminant detection. J. Food Eng. 2006, 75, 340–348. [Google Scholar] [CrossRef]
  34. Yang, C.C.; Chao, K.; Chen, Y.R.; Kim, M.S.; Early, H.L. Simple multispectral image analysis for systemically diseased chicken identification. Trans ASABE 2006, 49, 245–257. [Google Scholar] [CrossRef] [Green Version]
  35. Chao, K.; Yang, C.C.; Chen, Y.R.; Kim, M.S.; Chan, D.E. Hyperspectral-multispectral line-scan imaging system for automated poultry carcass inspection applications for food safety. Poult. Sci. 2007, 86, 2450–2460. [Google Scholar] [CrossRef] [PubMed]
  36. Barni, M.; Cappellini, V.; Mecocci, A. Colour-based detection of defects on chicken meat. Image Vision Comput. 1997, 15, 549–556. [Google Scholar] [CrossRef]
  37. Nakariyakul, S.; Casasent, D.P. Fast feature selection algorithm for poultry skin tumor detection in hyperspectral data. J. Food Eng. 2009, 94, 358–365. [Google Scholar] [CrossRef]
  38. Dixit, Y.; Casado-Gavalda, M.P.; Cama-Moncunill, R.; Cama-Moncunill, X.; Markiewicz-Keszycka, M.; Cullen, P.J.; Sullivan, C. Developments and challenges in online NIR spectroscopy for meat processing. Compr. Rev. Food Sci. Food Saf. 2017, 16, 1172–1187. [Google Scholar] [CrossRef]
  39. i Furnols, M.F.; Gispert, M. Comparison of different devices for predicting the lean meat percentage of pig carcasses. Meat Sci. 2009, 83, 443–446. [Google Scholar] [CrossRef] [Green Version]
  40. De Marchi, M.; Riovanto, R.; Penasa, M.; Cassandro, M. At-line prediction of fatty acid profile in chicken breast using near infrared reflectance spectroscopy. Meat Sci. 2012, 90, 653–657. [Google Scholar] [CrossRef]
  41. Sørensen, K.M.; Petersen, H.; Engelsen, S.B. An on-line near-infrared (NIR) transmission method for determining depth profiles of fatty acid composition and iodine value in porcine adipose fat tissue. Appl. Spectrosc. 2012, 66, 218–226. [Google Scholar] [CrossRef]
  42. Prieto, N.; Dugan, M.E.R.; Juárez, M.; López-Campos, Ó.; Zijlstra, R.T.; Aalhus, J.L. Using portable near-infrared spectroscopy to predict pig subcutaneous fat composition and iodine value. Can. J. Anim. Sci. 2017, 98, 221–229. [Google Scholar] [CrossRef]
  43. Raab, V.; Bruckner, S.; Beierle, E.; Kampmann, Y.; Petersen, B.; Kreyenschmidt, J. Generic model for the prediction of remaining shelf life in support of cold chain management in pork and poultry supply chains. J. Chain Netw. Sci. 2008, 8, 59–73. [Google Scholar] [CrossRef]
  44. Souza, V.G.; Pires, J.R.; Vieira, É.T.; Coelhoso, I.M.; Duarte, M.P.; Fernando, A.L. Shelf life assessment of fresh poultry meat packaged in novel bionanocomposite of chitosan/montmorillonite incorporated with ginger essential oil. Coatings 2018, 8, 177. [Google Scholar] [CrossRef] [Green Version]
  45. Baltic, T.; Ciric, J.; Lazic, I.B.; Pelic, D.L.; Mitrovic, R.; Djordjevic, V.; Parunovic, N. Packaging as a tool to improve the shelf life of poultry meat. In Proceedings of the 60th International Meat Industry Conference MEATCON2019, Kopaonik, Serbia, 22–25 September 2019; IOP Publishing: Bristol, UK, 2019; Volume 333, p. 012044. [Google Scholar] [CrossRef]
  46. Porep, J.U.; Kammerer, D.R.; Carle, R. On-line application of near infrared (NIR) spectroscopy in food production. Trends Food Sci. Technol. 2015, 46, 211–230. [Google Scholar] [CrossRef]
  47. Dissing, B.S.; Papadopoulou, O.S.; Tassou, C.; Ersbøll, B.K.; Carstensen, J.M.; Panagou, E.Z.; Nychas, G.J. Using multispectral imaging for spoilage detection of pork meat. Food Bioproc. Tech. 2013, 6, 2268–2279. [Google Scholar] [CrossRef]
  48. Tsakanikas, P.; Pavlidis, D.; Nychas, G.J. High throughput multispectral image processing with applications in food science. PLoS ONE 2015, 10, e0140122. [Google Scholar] [CrossRef] [PubMed]
  49. Daugaard, S.B.; Adler-Nissen, J.; Carstensen, J.M. New vision technology for multidimensional quality monitoring of continuous frying of meat. Food Control 2010, 21, 626–632. [Google Scholar] [CrossRef]
  50. Duda, R.O.; Hart, P.E.; Stork, D.G. Pattern Classification, 2nd ed.; Wiley-Interscience: New York, NY, USA, 2000; ISBN 978-0-468 471-05669-0. [Google Scholar]
  51. Carstensen, J.M.; Hansen, J.F. An Apparatus and a Method of Recording an Image of an Object. Patent Family EP1051660 Patent 17, 198, 15 November 2003. [Google Scholar]
  52. Wold, S.; Sjöström, M.; Eriksson, L. PLS-regression: A basic tool of chemometrics. Chemometr. Intell. Lab. Syst. 2001, 58, 109–130. [Google Scholar] [CrossRef]
  53. Xiaobo, Z.; Jiewen, Z.; Povey, M.J.; Holmes, M.; Hanpin, M. Variables selection methods in near-infrared spectroscopy. Anal. Chim. Acta 2010, 667, 14–32. [Google Scholar] [CrossRef]
  54. Brereton, R.G.; Lloyd, G.R. Partial least squares discriminant analysis: Taking the magic away. J. Chemom. 2014, 28, 213–225. [Google Scholar] [CrossRef]
  55. Bi, Y.; Yuan, K.; Xiao, W.; Wu, J.; Shi, C.; Xia, J.; Chu, G.; Zhang, G.; Zhou, G. A local pre-processing method for near-infrared spectra, combined with spectral segmentation and standard normal variate transformation. Anal. Chim. Acta 2016, 909, 30–40. [Google Scholar] [CrossRef]
  56. Engel, J.; Gerretzen, J.; Szymańska, E.; Jansen, J.J.; Downey, G.; Blanchet, L.; Buydens, L.M. Breaking with trends in pre- processing? Trends Anal. Chem. 2013, 50, 96–106. [Google Scholar] [CrossRef]
  57. Rinnan, A.; Berg, F.; Engelsen, B. Review of the most common pre-processing techniques for near-infrared spectra. Trends Anal. Chem. 2009, 28, 1201–1222. [Google Scholar] [CrossRef]
  58. Berrueta, L.A.; Alonso-Salces, R.M.; Héberger, K. Supervised pattern recognition in food analysis. J. Chromatogr. A 2007, 1158, 196–214. [Google Scholar] [CrossRef] [PubMed]
  59. Cozzolino, D.; Murray, I. Identification of animal meat muscles by visible and near infrared reflectance spectroscopy. LWT-Food Sci. Technol. 2004, 37, 447–452. [Google Scholar] [CrossRef]
  60. Kamruzzaman, M.; Sun, D.W.; El Masry, G.; Allen, P. Fast detection and visualization of minced lamb meat adulteration using NIR hyperspectral imaging and multivariate image analysis. Talanta 2013, 103, 130–136. [Google Scholar] [CrossRef] [PubMed]
  61. Lin, C.Y.; Lin, L.C.; Hsu, J.C. Effect of caponization on muscle composition, shear value, ATP related compounds and taste appraisal in Taiwan country chicken cockerels. Asian-Australas. J. Anim. Sci. 2011, 24, 1026–1030. [Google Scholar] [CrossRef]
  62. Amorim, A.; Rodrigues, S.; Pereira, E.; Valentim, R.; Teixeira, A. Effect of caponisation on physicochemical and sensory characteristics of chickens. Animal 2016, 10, 978–986. [Google Scholar] [CrossRef] [Green Version]
  63. Sant’Ana, A.S.; Franco, B.D.; Schaffner, D.W. Modeling the growth rate and lag time of different strains of Salmonella enterica and Listeria monocytogenes in ready-to-eat lettuce. Food Microbiol. 2012, 30, 267–273. [Google Scholar] [CrossRef]
  64. Ropodi, A.I.; Panagou, E.Z.; Nychas, G.J.E. Rapid detection of frozen-then-thawed minced beef using multispectral imaging and Fourier transform infrared spectroscopy. Meat Sci. 2018, 135, 142–147. [Google Scholar] [CrossRef]
  65. Alomar, D.; Gallo, C.; Castaneda, M.; Fuchslocher, R. Chemical and discriminant analysis of bovine meat by near infrared reflectance spectroscopy (NIRS). Meat Sci. 2003, 63, 441–450. [Google Scholar] [CrossRef]
  66. Boulesteix, A.L.; Strimmer, K. Partial least squares: A versatile tool for the analysis of high-dimensional genomic data. Brief. Bioinform. 2006, 8, 32–44. [Google Scholar] [CrossRef] [PubMed] [Green Version]
  67. Ropodi, A.I.; Panagou, E.Z.; Nychas, G.J. Data mining derived from food analyses using non-invasive/non-destructive analytical techniques; determination of food authenticity, quality & safety in tandem with computer science disciplines. Trends Food Sci. Tech. 2016, 50, 11–25. [Google Scholar] [CrossRef]
  68. Park, B.; Lawrence, K.C.; Windham, W.R.; Chen, Y.R.; Chao, K. Discriminant analysis of dual-wavelength spectral images for classifying poultry carcasses. Comput. Electron. Agric. 2002, 33, 219–231. [Google Scholar] [CrossRef] [Green Version]
Figure 1. Boxplots for microbial counts (log CFU/g) of TVC (1: blue, 2: red) and Pseudomonas spp. (3: green, 4: orange) in fresh (1: blue, 3: green) and spoiled (2: red, 4: orange) samples of each product.
Microorganisms 08 00552 g001
Figure 2. Spectra from MSI analysis (405–970 nm) for each poultry product at 24 h (blue line) and 216 h (red line) of storage at 4 °C.
Microorganisms 08 00552 g002
Figure 3. Comparison of observed (open symbols) and predicted (solid symbols) values of time from slaughter (log ts) after the development of the PLS-R model. Solid line depicts the line of equity (y = x) and dashed lines are ± 1.6 log ts (i.e., 48 h after slaughter).
Microorganisms 08 00552 g003
Figure 4. Spectral data (mean and standard deviation) influence (b coefficients) on PLS-R model construction for chicken breast samples. Dashed bars represent data that influenced more the model (1,19: 405 nm; 2, 20: 435 nm; 3, 21: 450 nm; 4, 22: 470 nm; 5, 23: 505 nm; 6, 24: 525 nm; 7, 25: 570 nm; 8, 26: 590 nm; 9, 27: 630 nm; 10, 28: 645 nm; 11, 29: 660 nm; 12, 30: 700 nm; 13, 31: 850 nm; 14, 32: 870 nm; 15, 33: 890 nm; 16, 34: 910 nm; 17, 35: 940 nm and 18, 36: 970 nm).
Microorganisms 08 00552 g004
Figure 5. Spectral data (mean and standard deviation) influence (b coefficients) to PLS-R model construction for chicken thigh samples. Dashed bars represent data that influenced more the model (1, 19: 405 nm; 2, 20: 435 nm; 3, 21: 450 nm; 4, 22: 470 nm; 5, 23: 505 nm; 6, 24: 525 nm; 7, 25: 570 nm; 8, 26: 590 nm; 9, 27: 630 nm; 10, 28: 645 nm; 11, 29: 660 nm; 12, 30: 700 nm; 13, 31: 850 nm; 14, 32: 870 nm; 15, 33: 890 nm; 16, 34: 910 nm; 17, 35: 940 nm and 18, 36: 970 nm).
Microorganisms 08 00552 g005
Figure 6. Spectral data (mean and standard deviation) influence (b coefficients) to PLS-R model construction for chicken burger samples. Dashed bars represent data that influenced more the model (1, 19: 405 nm; 2, 20: 435 nm; 3, 21: 450 nm; 4, 22: 470 nm; 5, 23: 505 nm; 6, 24: 525 nm; 7, 25: 570 nm; 8, 26: 590 nm; 9, 27: 630 nm; 10, 28: 645 nm; 11, 29: 660 nm; 12, 30: 700 nm; 13, 31: 850 nm; 14, 32: 870 nm; 15, 33: 890 nm; 16, 34: 910 nm; 17, 35: 940 nm and 18, 36: 970 nm).
Microorganisms 08 00552 g006
Figure 7. Spectral data (mean and standard deviation) influence (b coefficients) to PLS-R model construction for chicken marinated souvlaki samples. Dashed bars represent data that influenced more the model (1, 19: 405 nm; 2, 20: 435 nm; 3, 21: 450 nm; 4, 22: 470 nm; 5, 23: 505 nm; 6, 24: 525 nm; 7, 25: 570 nm; 8, 26: 590 nm; 9, 27: 630 nm; 10, 28: 645 nm; 11, 29: 660 nm; 12, 30: 700 nm; 13, 31: 850 nm; 14, 32: 870 nm; 15, 33: 890 nm; 16, 34: 910 nm; 17, 35: 940 nm and 18, 36: 970 nm).
Microorganisms 08 00552 g007
Table 1. Performance indices (slope, offset, r and RMSE) for PLS-R model development and validation for each poultry product.
Poultry ProductStage of ModellingNo of SamplesSlopeOffsetr (Correlation Coefficient)RMSE
Chicken BreastCalibration820.9330.1380.9660.076
FCV 1820.9160.1730.9530.091
Prediction221.1500.0550.8860.383
Chicken ThighCalibration670.9530.0970.9760.065
FCV670.9330.1360.9570.088
Prediction300.8540.2430.8590.160
Chicken BurgerCalibration870.9820.0350.9910.033
FCV870.9680.0630.9870.040
Prediction440.5131.1720.7780.285
Chicken Marinated SouvlakiCalibration910.9620.0730.9810.067
FCV910.9540.0920.9640.093
Prediction431.1830.6500.9340.348
1 FCV: Full cross-validation.

