Automation of Infectious Focus Assay for Determination of Filovirus Titers and Direct Comparison to Plaque and TCID50 Assays

 ,
, 
Abstract
:1. Introduction
2. Materials and Methods
2.1. Virus and Cell Preparation
2.2. Overlay Preparation
2.3. NRAO Assay Infection with Filovirus
2.4. CVMO Assay
2.5. TCID50 Assay
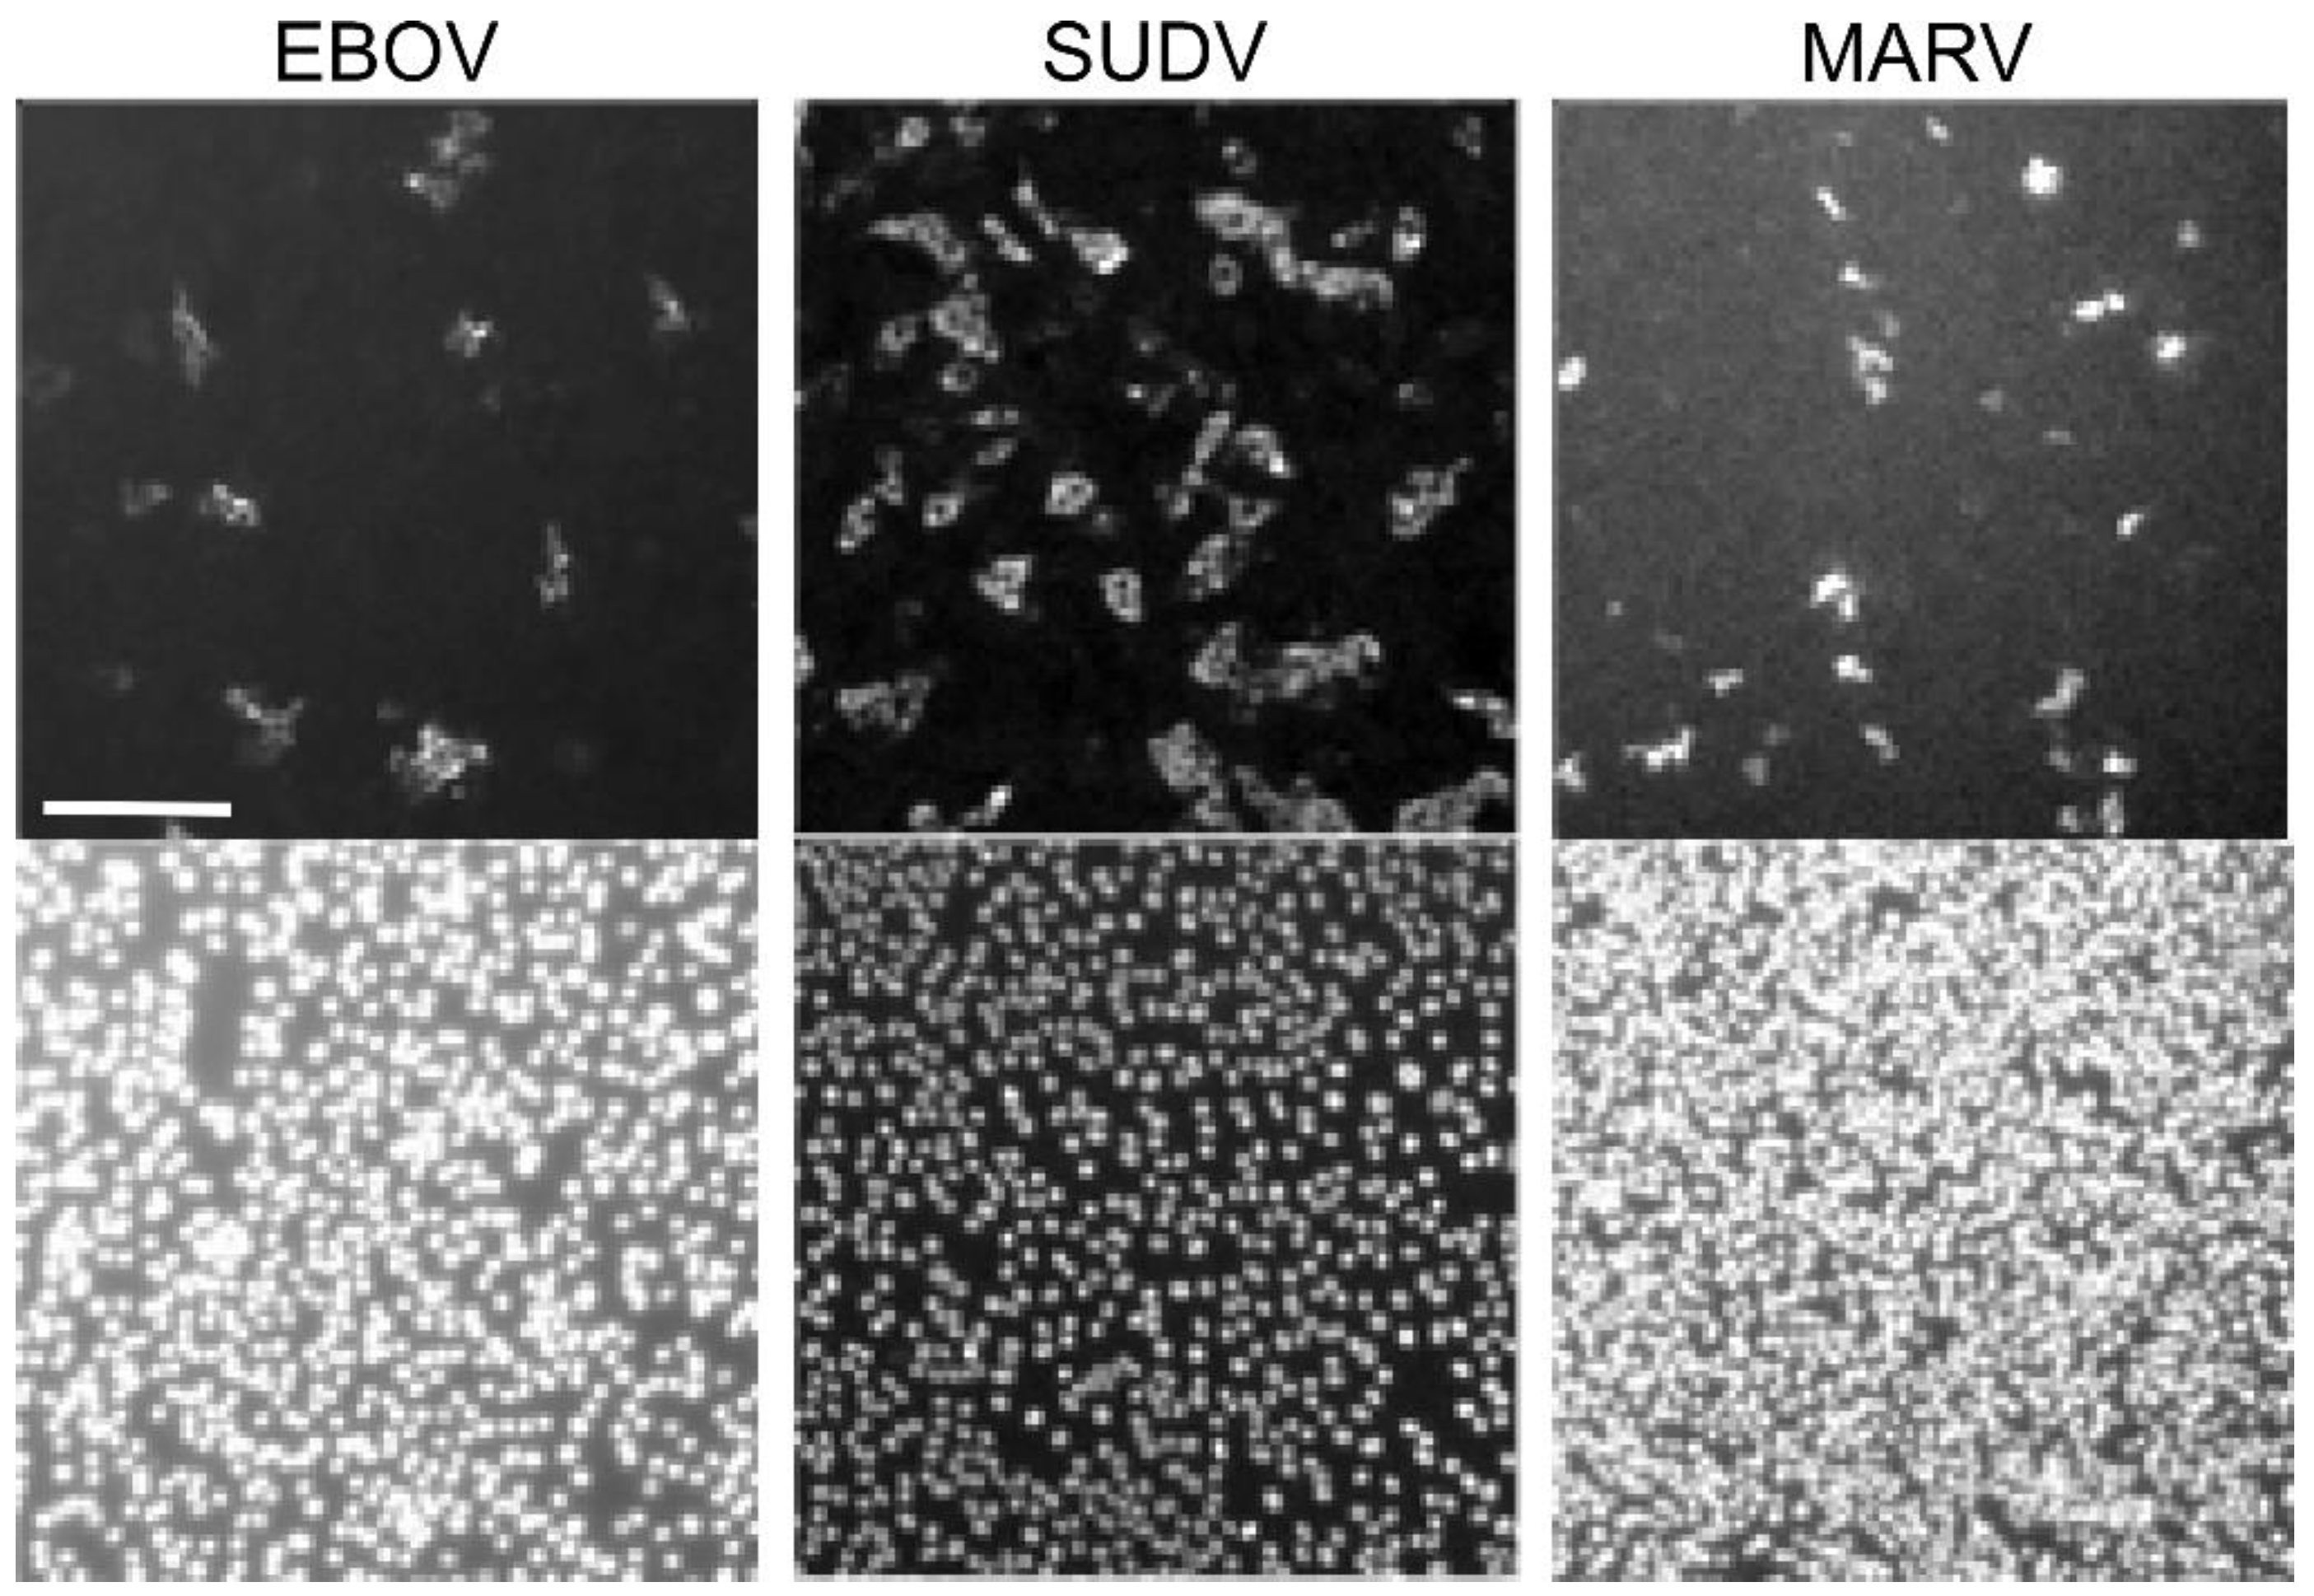
2.6. FFU Assay
2.7. Statistics Analysis
3. Results
Application of Automated Image Processing for Calculating Virus Titer Using FFU Assay
4. Discussion
Supplementary Materials
Author Contributions
Funding
Data Availability Statement
Acknowledgments
Conflicts of Interest
References
- Shurtleff, A.; Biggins, J.; Keeney, A.; Zumbrun, E.; Bloomfield, H.; Kuehne, A.; Audet, J.; Alfson, K.; Griffiths, A.; Olinger, G.; et al. Standardization of the Filovirus Plaque Assay for Use in Preclinical Studies. Viruses 2012, 4, 3511–3530. [Google Scholar] [CrossRef] [PubMed] [Green Version]
- Dulbecco, R. Production of Plaques in Monolayer Tissue Cultures by Single Particles of an Animal Virus. Proc. Natl. Acad. Sci. USA 1952, 38, 747. [Google Scholar] [CrossRef] [PubMed] [Green Version]
- Carpenter, A.E.; Jones, T.R.; Lamprecht, M.R.; Clarke, C.; Kang, I.H.; Friman, O.; Guertin, D.A.; Chang, J.H.; Lindquist, R.A.; Moffat, J.; et al. CellProfiler: Image analysis software for identifying and quantifying cell phenotypes. Genome Biol. 2006, 7, R100. [Google Scholar] [CrossRef] [PubMed] [Green Version]
- Kamentsky, L.; Jones, T.R.; Fraser, A.; Bray, M.-A.; Logan, D.J.; Madden, K.L.; Ljosa, V.; Rueden, C.; Eliceiri, K.W.; Carpenter, A.E. Improved structure, function and compatibility for CellProfiler: Modular high-throughput image analysis software. Bioinformatics 2011, 27, 1179–1180. [Google Scholar] [CrossRef] [PubMed] [Green Version]
- Reed, L.J.; Muench, H. A simple method of estimating fifty per cent endpoints12. Am. J. Epidemiol. 1938, 27, 493–497. [Google Scholar] [CrossRef]
- R Core Team. R: A Language and Environment for Statistical Computing; R Foundation for Statistical Computing: Vienna, Austria, 2013; ISBN 3-900051-07-01. [Google Scholar]
- Panchal, R.G.; Kota, K.P.; Spurgers, K.B.; Ruthel, G.; Tran, J.P.; Boltz, R.C.D.; Bavari, S. Development of High-Content Imaging Assays for Lethal Viral Pathogens. J. Biomol. Screen. 2010, 15, 755–765. [Google Scholar] [CrossRef] [PubMed] [Green Version]
- Schneider, C.A.; Rasband, W.S.; Eliceiri, K.W. NIH Image to ImageJ: 25 years of image analysis. Nat. Methods 2012, 9, 671–675. [Google Scholar] [CrossRef] [PubMed]
- Batra, J.; Hultquist, J.F.; Liu, D.; Shtanko, O.; Von Dollen, J.; Satkamp, L.; Jang, G.M.; Luthra, P.; Schwarz, T.M.; Small, G.I.; et al. Protein Interaction Mapping Identifies RBBP6 as a Negative Regulator of Ebola Virus Replication. Cell 2018, 175, 1917–1930.e13. [Google Scholar] [CrossRef] [PubMed] [Green Version]
- Leung, D.W.; Borek, D.; Luthra, P.; Binning, J.M.; Anantpadma, M.; Liu, G.; Harvey, I.B.; Su, Z.; Endlich-Frazier, A.; Pan, J.; et al. An Intrinsically Disordered Peptide from Ebola Virus VP35 Controls Viral RNA Synthesis by Modulating Nucleoprotein-RNA Interactions. Cell Rep. 2015, 11, 376–389. [Google Scholar] [CrossRef] [PubMed] [Green Version]
- Smither, S.J.; Lear-Rooney, C.; Biggins, J.; Pettitt, J.; Lever, M.S.; Olinger, G.G. Comparison of the plaque assay and 50% tissue culture infectious dose assay as methods for measuring filovirus infectivity. J. Virol. Methods 2013, 193, 565–571. [Google Scholar] [CrossRef] [PubMed]
- Shurtleff, A.; Bloomfield, H.; Mort, S.; Orr, S.; Audet, B.; Whitaker, T.; Richards, M.; Bavari, S. Validation of the Filovirus Plaque Assay for Use in Preclinical Studies. Viruses 2016, 8, 113. [Google Scholar] [CrossRef] [PubMed] [Green Version]
- Ackermann-Gäumann, R.; Siegrist, D.; Züst, R.; Signer, J.; Lenz, N.; Engler, O. Standardized focus assay protocol for biosafety level four viruses. J. Virol. Methods 2019, 264, 51–54. [Google Scholar] [CrossRef] [PubMed]


| Parameter | NRAO | CVMO | TCID50 | FFU |
|---|---|---|---|---|
| Plate Format | 6 Well | 6 Well | 96 well | 384 well (Can be done in other formats including 96 well) |
| Volume of inoculum | 100 µL | 100 µL | 20 µL | 25 µL (384 well) 20 µL (96 well) |
| Challenge Incubation | 1 h | 1 h | 10 days | 2 days |
| Overlay/staining solution | Primary: 1:1 mixture of buffered EMEM and Agarose Secondary: 1:1 mixture of buffered EMEM containing Neutral Red (stain) and Agarose | 1:5 mixture of buffered DMEM and MethylcelluloseStained with crystal violet | Stained with crystal violet | Immunofluorescent staining using virus-specific antibody |
| Time to complete | 8 days | 8–10 days | 8–10 days | 3 days |
| Read out method | Plaque count, manual | Plaque count, manual | Gross cell death within replicates, manual | Automated image analysis |
| Titer Calculation | Plaque count in well of lowest dilution, dilution, total volume in well | Plaque count in well of lowest dilution, dilution, total volume in well | Reed–Muench calculation | Number of infection foci stained with fluorescent antibody in lowest dilution, dilution, total volume in well |
| Estimated Hands-on Time, Hours (For 40 Test Points) | 10 | 10 | 8 | 5 |
| Virus | Assay Compared | Log-Fold Difference |
|---|---|---|
| EBOV | NRAO vs. CVMO | −0.380 |
| NRAO vs. TCID50 | −0.053 | |
| NRAO vs. FFU | −1.097 | |
| CVMO vs. TCID50 | 0.326 | |
| CVMO vs. FFU | −0.718 | |
| TCID50 vs. FFU | −1.044 | |
| SUDV | NRAO vs. CVMO | −0.245 |
| NRAO vs. TCID50 | 0.873 | |
| NRAO vs. FFU | −1.498 | |
| CVMO vs. TCID50 | 1.118 | |
| CVMO vs. FFU | −1.253 | |
| TCID50 vs. FFU | −2.371 | |
| MARV | NRAO vs. CVMO | −0.023 |
| NRAO vs. TCID50 | 0.405 | |
| NRAO vs. FFU | −1.206 | |
| CVMO vs. TCID50 | 0.427 | |
| CVMO vs. FFU | −1.184 | |
| TCID50 vs. FFU | −1.611 |
| Assay | Test 1 | Test 2 | Test 3 |
|---|---|---|---|
| NRAO | |||
| Technician A | 21.22 | 22.75 | 34.35 |
| Technician B | 40.18 | 6.84 | 10.26 |
| CVMO | |||
| Technician A | 12.67 | 10.24 | 2.55 |
| Technician B | 8.64 | 10.66 | 18.13 |
| TCID50 | |||
| Technician A | 47.53 | 39.62 | 28.70 |
| Technician B | 34.50 | 41.74 | 60.86 |
| FFU | |||
| Technician A | 14.45 | 4.08 | 7.17 |
| Technician B | 4.59 | 14.78 | 12.58 |
Publisher’s Note: MDPI stays neutral with regard to jurisdictional claims in published maps and institutional affiliations. |
© 2021 by the authors. Licensee MDPI, Basel, Switzerland. This article is an open access article distributed under the terms and conditions of the Creative Commons Attribution (CC BY) license (http://creativecommons.org/licenses/by/4.0/).
Share and Cite
Keiser, P.T.; Anantpadma, M.; Staples, H.; Carrion, R.; Davey, R.A. Automation of Infectious Focus Assay for Determination of Filovirus Titers and Direct Comparison to Plaque and TCID50 Assays. Microorganisms 2021, 9, 156. https://0-doi-org.brum.beds.ac.uk/10.3390/microorganisms9010156
Keiser PT, Anantpadma M, Staples H, Carrion R, Davey RA. Automation of Infectious Focus Assay for Determination of Filovirus Titers and Direct Comparison to Plaque and TCID50 Assays. Microorganisms. 2021; 9(1):156. https://0-doi-org.brum.beds.ac.uk/10.3390/microorganisms9010156
Chicago/Turabian StyleKeiser, Patrick T., Manu Anantpadma, Hilary Staples, Ricardo Carrion, and Robert A. Davey. 2021. "Automation of Infectious Focus Assay for Determination of Filovirus Titers and Direct Comparison to Plaque and TCID50 Assays" Microorganisms 9, no. 1: 156. https://0-doi-org.brum.beds.ac.uk/10.3390/microorganisms9010156