Article

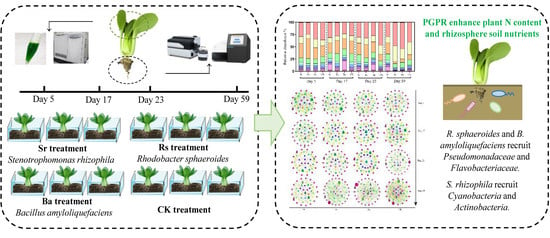
Unraveling Mechanisms and Impact of Microbial Recruitment on Oilseed Rape (Brassica napus L.) and the Rhizosphere Mediated by Plant Growth-Promoting Rhizobacteria

1
School of Life Sciences, University of Science and Technology of China, Hefei 230026, China
2
CAS Key Laboratory of Environmental Biotechnology, Research Center for Eco-Environmental Sciences, Chinese Academy of Sciences, Beijing 100085, China
3
College of Resources and Environment, University of Chinese Academy of Sciences, Beijing 100049, China
4
CSIRO Mineral Resources, Kensington, WA 6151, Australia
*
Author to whom correspondence should be addressed.
Submission received: 12 December 2020 / Revised: 31 December 2020 / Accepted: 6 January 2021 / Published: 12 January 2021

Abstract

:
Plant growth-promoting rhizobacteria (PGPR) are noticeably applied to enhance plant nutrient acquisition and improve plant growth and health. However, limited information is available on the compositional dynamics of rhizobacteria communities with PGPR inoculation. In this study, we investigated the effects of three PGPR strains, Stenotrophomonas rhizophila, Rhodobacter sphaeroides, and Bacillus amyloliquefaciens on the ecophysiological properties of Oilseed rape (Brassica napus L.), rhizosphere, and bulk soil; moreover, we assessed rhizobacterial community composition using high-throughput Illumina sequencing of 16S rRNA genes. Inoculation with S. rhizophila, R. sphaeroides, and B. amyloliquefaciens, significantly increased the plant total N (TN) (p < 0.01) content. R. sphaeroides and B. amyloliquefaciens selectively enhanced the growth of Pseudomonadacea and Flavobacteriaceae, whereas S. rhizophila could recruit diazotrophic rhizobacteria, members of Cyanobacteria and Actinobacteria, whose abundance was positively correlated with inoculation, and improved the transformation of organic nitrogen into inorganic nitrogen through the promotion of ammonification. Initial colonization by PGPR in the rhizosphere affected the rhizobacterial community composition throughout the plant life cycle. Network analysis indicated that PGPR had species-dependent effects on niche competition in the rhizosphere. These results provide a better understanding of PGPR-plant-rhizobacteria interactions, which is necessary to develop the application of PGPR.

Graphical Abstract

1. Introduction

The rhizosphere is one of the most complex Critical Zone (CZ) ecosystems in which plant growth-promoting rhizobacteria (PGPR) plays an indispensable role [1], as these organisms can promote plant growth or health, either directly or indirectly [2], through a wide variety of mechanisms including biological nitrogen fixation [3], phosphate solubilization [4], siderophore production [5], production of 1-aminocyclopropane-1-carboxylate deaminase (ACC) [6], phytohormone production [7], quorum sensing (QS) [1], induction of systemic resistance [8], and interference with pathogen toxin production [9]. PGPR inoculated into the rhizosphere could interact with the beneficial bacteria already present and shape the bacterial community composition, promote beneficial plant-microbe symbioses, and enhance plant growth [10] and plant pathogen defense [11].
The use of soil PGPR and their associated beneficial effects has the potential to improve plant growth and quality characteristics. Bacillus amyloliquefaciens is widely found in soils and is a common PGPR [12]. B. amyloliquefaciens can suppress Fusarium disease by manipulating rhizosphere microbial community composition and stimulating potentially beneficial taxa [13]. It has also been reported that treatment with B. amyloliquefaciens could markedly improve the plant growth and resist plant viral disease by changing rhizosphere microbial community structure and enhancing plant systemic resistance [14]. B. amyloliquefaciens has been shown to be capable of pathogen suppression including root colonization by the wilt pathogen Ralstonia solanacearum QL-RFP [12], anthracnose disease in chili [15], and Pectobacterium carotovorum subsp. carotovorum (Pcc), the cause of soft rot in Chinese cabbage [16]. Wu [10] found that B. amyloliquefaciens had the dual effects of promoting plant growth and reducing N2O emissions by changing the rhizosphere microbial community structure. These studies indicate the complex interactions that exist between PGPR strains and the native rhizosphere microbial community.
Phototrophic microorganisms are one type of PGPR, which can promote plant growth [17]. Rhodobacter sphaeroides represents one of the best-studied photosynthetic organisms [18] which can produce carotenoids [19], coenzyme Q10 [20], and superoxide dismutase [21]. R. sphaeroides is widely distributed in a variety of soil environments [22] and, within the rhizosphere, it is capable of soil restoration [23]. R. sphaeroides can increase ascorbic acid content in tomato fruit, promote root growth, increase leaf number, chlorophyll, carotenoid content, and average crop weight [24,25]. Moreover, Kensuke Kondo [26] found that R. sphaeroides application in sterile soil showed different effects on spinach growth, compared to its application in unsterilized soil, therefore the effect of R. sphaeroides application may due to interactions with other soil microorganisms.
Moreover, Stenotrophomonas rhizophila is another model of PGPR, especially under salt stress conditions [27,28,29]. S. rhizophila was first isolated from the rhizosphere of oilseed rape, and its detailed biochemical properties were described by Wolf et al. [30]. It can promote sweet pepper and tomato growth in gnotobiotic systems [31] and isolates of this species are known to produce volatile antifungal compounds [32]. Egamberdieva, et al. [33] found S. rhizophila and Bradyrhizobium built beneficial associations in the rhizosphere, acting synergistically to promote plant growth and nutrient uptake. Schmidt [31] used single-strand conformation polymorphism (SSCP) of 16S rRNA and ITS genes to assess the potential of S. rhizophila to inhibit plant pathogens. However, the detection of SSCP was limited, and the dynamic structural changes in the rhizosphere community after the addition of S. rhizophila were not revealed.
Previous studies on the PGPR mentioned above describe how they can manipulate the composition of the rhizosphere bacteria community. Taxa affected by PGPR have been found to be beneficial for plant growth and resistance to biotic and abiotic stresses. Understanding the interaction among different microbial species in the rhizosphere and their responses to PGPR is essential.
For the present study, we choose B. amyloliquefaciens, R. sphaeroides, and S. rhizophila as the three experimental PGPR strains. We collected rhizosphere soil from oilseed rape plants under three different PGPR treatments and at four growth stages. By determining the properties of plants and soil and monitoring the rhizosphere microbial community, we aimed to address the following issues: (i) the growth-promoting effect(s) of different microbial species; and (ii) how the assembly dynamics of plant rhizobacteria communities are affected by the inoculated PGPR. This study may improve the understanding of rhizobacteria in sustainable plant-growth promotion technologies, and the role of PGPR in biogeochemical processes of the Critical Zone.

2. Materials and Methods

2.1. PGPR Inoculants and Plants

Stenotrophomonas rhizophila DSM 14405T (stored in ATCC), Rhodobacter sphaeroides EBL0706 (stored in CGMCC), and Bacillus amyloliquefaciens FZB42 (stored in CGMCC) cultures were grown aerobically at 30 °C and 150 rpm in LB Media for 20 h, 24 h, and 29 h respectively, until their density reached 2.0~3.0 × 10⁸ CFU mL−1. The bacterial cultures were pelleted by centrifugation and washed twice with sterile water and suspended in sterile water to prepare PGPR inocula respectively.
The cultivar of oilseed rape used in this study was Jingguan (Brassica campestris L. cv. Jingguan). Seeds were soaked in 2% NaClO for 10 min, then thoroughly rinsed with sterile water three times, and stored at 4 °C for vernalization in the dark. After 48 h, seeds were placed into an illuminated incubator (20 °C, 12 h/12 h day/night) for seven days.

2.2. Greenhouse Pot Experiment

Four treatments were set up: Sr (S. rhizophila), Rs (R. sphaeroides), Ba (B. amyloliquefaciens), and CK (control check) treatment located at Gudaoxifeng organic farm, in Beijing, China (N 40°4′25.10″, E 116°12′38.41″), each treatment was replicated three times, twelve pots (41 cm length, 27 cm width, 16 cm height) were filled with the homogenized soil in the greenhouse. The amount of soil per pot was approximately 14,169.6 g (Figure S1a). The three PGPR treatments Sr, Ba, and Rs received each 1 × 10⁷ cfu/g of their respective organisms, the CK treatment only received sterile water. After bacteria were well mixed with the soil, plant seedlings were transferred to the pots, forty plants per pot. The plant growth process took 59 days, at 4 °C~30 °C, from 17 November 2018 to 14 January 2019.

2.3. Plant Physicochemical Parameters

On day 59 of plant growth, ten individual plants per pot in each treatment were collected and placed into sterile zip-lock bags and transported on ice to the laboratory. The content of chlorophyll, soluble starch, soluble protein, and Vitamin C was determined in the youngest fully opened leaf of the plants. Chlorophyll was quantified by SPAD-502 plus meter (Minolta Camera Co., Osaka, Japan) [34]. Soluble starch concentrations were determined using the Anthrone assay [35]. Soluble protein was extracted and quantified using the Bradford assay [36]. Vitamin C was determined using the FRASC assay [37]. The remaining above-ground biomass was harvested, oven-dried at 60 °C for two days, and weighed [34]. The total C (TC), total N (TN), and total S (TS) of plants were measured using an elemental analyzer (Vario EL III, Elementair, Hanau, German) [10].

2.4. Rhizosphere and Bulk Soil Collection and Physicochemical Parameters

At day 5 (second leaf), day 17 (fourth leaf), day 23 (sixth leaf), and day 59 (tenth leaf) during plant growth, five bulk soil cores were taken at random from the topsoil layer (1–10 cm) and pooled as one bulk soil sample, then transferred into sterile 50 mL tubes. Five individual plants per pot in each treatment were dug out with their surrounding soil and transferred into sterile zip-lock bags. Tubes and bags were transported on ice to the laboratory. Bulk soil was shaken off the roots [38], which were then cut from the plant and thoroughly washed three times with sterile PBS buffer by extensive shaking. These washes were filtered through 0.22 µm pore size membranes and substances remaining on the membrane after filtration were considered as the rhizosphere soil. Membranes and attached particles were transferred to 2 mL tubes (Figure S1b). Fresh bulk and half of the rhizosphere soil were analyzed for their physicochemical properties; the remaining rhizosphere soil was flash-frozen in liquid nitrogen and stored at −40 °C until DNA extraction.
The physical and chemical properties of the day 59 bulk and rhizosphere soil samples were determined in sextuplicate per treatment, all soil samples were passed through a 2-mm mesh. Soil pH was determined in samples with soil to water ratio of 1:2.5 (w/v) using a pH-meter (LE438, METTLER TOLEDO, Greifensee, Switzerland). The nitrate (NO3) and ammonium (NH4+) content of the soil was extracted by 2 M KCl with soil to solution ratio of 1:10 (w/v) and measured using a Continuous Flow Analyzer (SAN++, Skalar, Breda, Holland). The TC, TN, and TS of soil were measured using an elemental analyzer (Vario EL III, Elementair, Hanau, German). Content of Ca, Mg, Fe, Mn, Al, K, and P in soil were determined by inductively coupled plasma spectrometer (ICPE-9820, Shimadzu, Kyotao, Japan).

2.5. Evaluation of Plant Growth Promotion Characteristics

Analyses of the plant growth-promoting capabilities of the three strains in this study focused on nitrogen fixation, phosphorus solubilization, indoleacetic acid (IAA) detection, siderophore production, ACC deaminase activity, and biofilm synthesis. Burks Medium was used to test the nitrogen fixation and Pikovskaya’s Broth medium was used to determine the phosphate-solubilizing capacity [39]. The colorimetric Salkowski assay was used to measure IAA [40] production. Blue agar chrome azurol S (CAS) assay [41] detected the production of siderophores. ACC deaminase activity was determined as reported by Hansen and Moller [35]. Biofilm production was determined by crystal violet staining [42].

2.6. DNA Extraction and 16S rRNA Sequencing

The DNA of rhizosphere soil was extracted using the DNeasy PowerSoil Kit (QIAGEN, Hilden, Germany), according to the manufacturer’s protocol. Six parallel samples were extracted from each treatment at four time points (day 5, 17, 23, and 59). DNA quality and concentration were measured on Nanodrop 2000 (Thermo Scientific, Waltham, MA, USA).
V3-V4 region of the bacterial 16S rRNA gene was amplified using the primer pair 338F (5′-ACTCCTACGGGAGGCAGCAG-3′) and 806R (5′-GGACTACHVGGGTWTCTAAT-3′). Each sample was amplified in a 20 μL reaction volume containing 2.5 units FastPfu Polymerase, 4 μL 5× FastPfu buffer, 2.5 mM dNTPs, 0.2 μL BSA (all TransGen, Beijing, China), 0.5 µM forward primer and reverse primer. PCR was performed using the following PCR program: 95 °C for 3 min, 27 cycles of 95 °C for 30 s, 55 °C for 30 s, 72 °C for 45 s, followed by 72 °C for 10 min. PCR quality was assessed by visualizing the amplicon on a 2% TAE agarose gel. Sequencing was carried out utilizing the Illumina MiSeq platform (Illumina, Inc., San Diego, CA, USA) at Shanghai Majorbio Biotechnology Co. Ltd (China).
Paired-end reads were assigned to the samples based on their unique barcodes, after which the barcode and primer were trimmed. Paired-end reads were merged using FLASH (V1.2.11, https://0-ccb-jhu-edu.brum.beds.ac.uk/software/FLASH/index.shtml) [43]. Quality filtering was performed to obtain high-quality clean sequences [44] by QIIME (V1.9.1, http://qiime.org/install/index.html) [45]. Chimera sequences were detected [46] using UCHIME (http://www.drive5.com/usearch/) [47]. Subsequently, all the retained sequences were analyzed by UPARSE (V7.0.1090, http://www.drive5.com/uparse/) [47]. The operational taxonomic units (OTUs) were created based on a 97% similarity. The RDP Classifier (V2.11, https://sourceforge.net/projects/rdp-classifier/) [48] and Silva Database (https://www.arb-silva.de/) [49] were used to assign taxonomy of representative sequences. To account for differences in sequencing depth, all samples were resampled to the lowest number of sequences (37,871) among all samples. Alpha and beta diversity were calculated using Mothur (V1.30.2, https://www.mothur.org/wiki/Download_mothur) and QIIME (V1.9.1) respectively. R (V 2.15.3) software was used. All the raw sequences in this study were deposited in the NCBI Sequence Read Archive, with the accession number PRJNA622875.

2.7. The Quantification PCR of the PGPR and N Cycling Functional Genes in the Rhizosphere

To detect PGPR colonization and quantify functional genes ureC, nifH, and nxrA in the rhizosphere, six plasmid standards containing target regions for each inoculants strain were constructed for qPCR which was done following the previously described protocols [50,51,52,53,54]. The specific gene sequences were amplified from extracted DNA with primers listed in Table 1. In the case of S. rhizophila, a sequence unique to this organism [55] was selected for the quantification target gene. The amplified products were run on a 1% agarose gel to confirm the specificity of the amplification, and then the gel was cut and fragment purified by the TIANgel Midi Purification Kit following the manufacturer’s protocol (TIANGEN, Beijing, China). The purified PCR products were sequenced and cloned into the pGEM-T Easy Vector (Promega, Madison, WI, USA), and then transformed into the Escherichia coli DH5α competent cells (TIANGEN, Beijing, China). The plasmids were then extracted by the TIANprep Mini Plasmid Kit (TIANGEN, Beijing, China) and concentrations determined by a Nanodrop 2000 (Thermo Fisher, Waltham, MA, USA) system. The plasmids used as standards for quantitative analysis were extracted from the correct clones of target genes, with confirmation by sequencing (Ruibio, Beijing, China). Copy numbers of target genes were calculated directly from the concentrations of extracted plasmid DNA. Standard curves were generated using triplicate 10 fold serial dilutions of known copy numbers of plasmid DNA.
The S. rhizophila qPCR reaction mixture contained 12.5 μL 2X TB GreenPremix Ex Taq (TaKaRa, Shiga, Japan), 0.2 μM forward and reverse primer, 2 μL template DNA, adjusted to a total 25 uL with sterile water. Thermal cycling consisted of an initial denaturation at 95 °C for 30 s, followed by 40 cycles of 95 °C for 5 s, 58 °C for 10 s, and 72 °C for 10 s. All qPCR was conducted by CFX96 Real-Time PCR Detection System (Bio-Rad, Hercules, CA, USA).

2.8. Network Construction with RMT-Based Approach and Topological Analysis

To elucidate rhizobacterial interactions in the presence of PGPR and assess changes in bacterial community assembly, molecular ecological networks were constructed based on the random matrix theory (RMT) method [56] in the molecular ecological network analysis pipeline (MENA, http://ieg4.rccc.ou.edu/mena/main.cgi) following the process as described in a previous study [56]. Bacterial OTUs of six samples per treatment were kept without log-transformation prior to carrying out the Spearman rank correlation matrix (r value). The networks were visualized using Cytoscape (V3.7.2).

2.9. Data Analysis

Data obtained from each treatment were statistically analyzed by one–way analysis of variance (ANOVA) and the means were compared using the post–hoc Tukey’s HSD test for multiple comparisons test for mean separation. Differences at p < 0.05 were considered as significant. The analyses were performed using the IBM SPSS 25 software.

3. Results

3.1. PGPR Promote Plant Growth and Enhance the Nutrient Availability in the Rhizosphere

All three PGPR inoculants significantly increased TN content in the plant (Table 2). The Stenotrophomonas rhizophila and Bacillus amyloliquefaciens treatments significantly increased the soluble protein content in the plant, whereas the Rhodobacter sphaeroides treatment caused a significant decrease of TC compared to the CK treatment.
Sr treatment significantly increased the concentrations of Al (5.45%), K (10.00%), P (24.37%), NH4+ (473.70%), and NO3 (62.77%) in rhizosphere soil, as compared to the bulk soil (Table 3). Rs treatment significantly increased the concentrations of K (7.08%), NH4+ (250.95%), and TC (28.17%) in rhizosphere soil compared with bulk soil (Table 3). Ba treatment significantly increased NH4+ (142.64%) content but decreased the concentrations of Ca (14.06%), Mg (34.20%), Fe (14.11%), Mn (12.08%), Al (4.72%), and NO3 (38.21%). The content of TS in rhizosphere soil significantly decreased compared with bulk soil in all PGPR treatments. There was no statistical difference between rhizosphere and bulk soil of the CK treatment, except for the increase of NH4+ (476.96%) content.
Therefore, the addition of PGPR enhanced the differences in physical and chemical properties between rhizosphere and bulk soil, increasing the nutrient availability of rhizosphere soil.
Comparison of rhizosphere chemical properties of PGPR and CK treatment showed that the addition of S. rhizophila and R. sphaeroides significantly increased P concentration, 24.05% and 38.64% greater than CK treatment respectively. While the Sr treatment significantly decreased the Ca (7.47%) and Mg (16.18%) content and Rs treatment significantly decreased NH4+ (49.79%) and NO3 (26.02%) content. Ba treatment significantly decreased the concentrations of Ca (185.38%), Mg (168.55%), Fe (189.84%), Mn (187.74%), NH4+ (143.47%), and NO3 (157.93%). Thus, the application of PGPR changed the rhizosphere soil physicochemical characteristics.

3.2. Identification of PGPR Promoting Abilities

Results of the growth-promoting capabilities of the three PGPR strains are shown in Table S1. B. amyloliquefaciens showed ACC deaminase activity and the ability to fix nitrogen. B. amyloliquefaciens and S. rhizophila were both able to dissolve phosphorus and produce biofilms. Siderophore production was observed in S. rhizophila and R. sphaeroides.

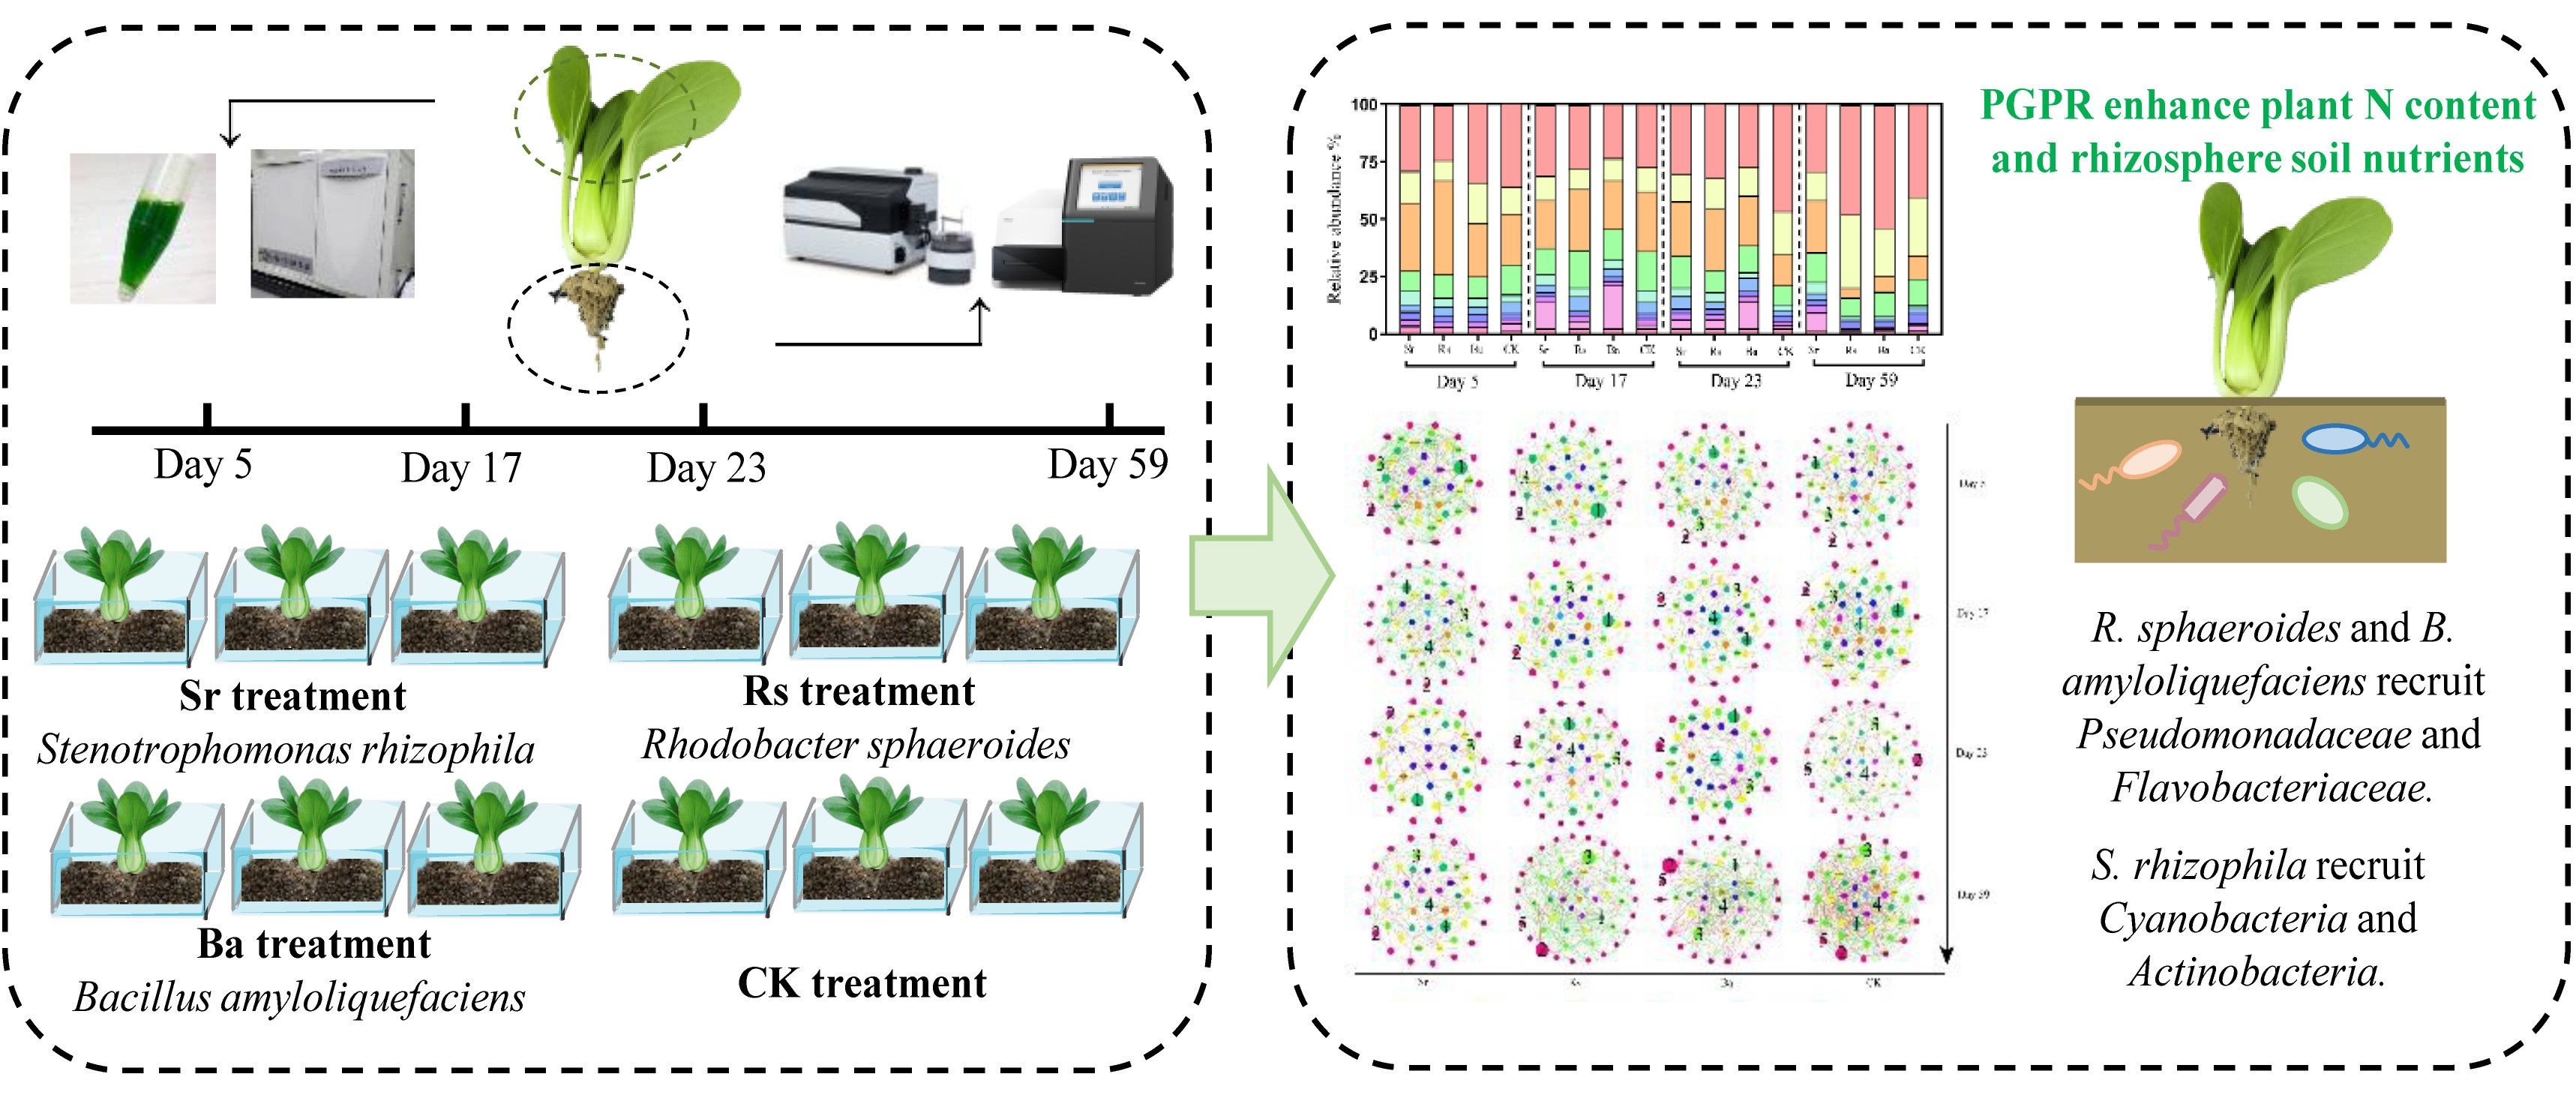
3.3. Low, Persistent Colonization of PGPR Strains in the Rhizosphere

In order to trace the colonization of the three PGPR inoculants in the rhizosphere, quantitative PCR was implemented. R. sphaeroides and B. amyloliquefaciens multiplied and accumulated in the rhizosphere soil of plants during the initial stage of plant growth, and reach their abundance peak at approximately ten days (Figure 1a), after which their abundance gradually decreased. On day 59, the copy number per gram of rhizosphere soil for these organisms was 9.13 × 10⁶ and 3.76 × 10⁵, respectively. The abundance of S. rhizophila in rhizosphere soil fluctuated strongly and displayed a decreasing tendency during the initial stage of plant growth. The copy number in the rhizosphere soil was 4.9 × 10⁶ g−1 on day 5, which was approximately half of the initial Sr dosage, the highest abundance was 7.3 × 10⁶ g−1 during the interim stage, then the abundance reached a relatively stable plateau period with an abundance of 3.4 × 10⁶ g−1 on day 23. On day 59, the copy number of S. rhizophila in the rhizosphere soil was 3.0 × 10⁶ g−1. In brief, the abundances of the three PGPR inoculants did not remain stable during the five-week period after inoculation. qPCR results indicated that B. amyloliquefaciens and R. sphaeroides had stronger rhizosphere colonization abilities than S. rhizophila, but none of the strains could sustain colonization of the rhizosphere.

3.4. S. rhizophila Increased the Ammonification in the Rhizosphere

To understand the effects of PGPR inoculants on N cycling of rhizosphere microbial communities, functional genes associated with N cycling, ammonification (ureC), N2 fixation (nifH), and nitrification (nxrA) [57] were quantified. The abundance of ureC gene showed a gentle upward trend with the growth of the plant in Rs, Ba, and CK treatments (Figure 2 and Figure S2a). Compared with CK, the abundance of ureC began to increase significantly at the beginning of inoculation, the ureC gene increased 136.72% (p < 0.01), 281.33% (p < 0.001), and 173.62% times (p < 0.001) in Sr treatment on days 5, 17, and 23, respectively (Figure S2). This indicated that the application of S. rhizophila increased the ammonification in rhizosphere soil. The abundance of the nifH gene (Figure S2b) showed an overall upward trend in all treatments and on days 5, 17, and 23 the nifH gene abundance was the highest in Sr treatment, with 9.62 × 10¹¹ g−1, 1.58 × 10¹² g−1, and 2.28 × 10¹² g−1 copies respectively, but there was no significant difference among them. The abundance of the nxrA gene showed a slowly increasing trend with plant growth and there was no significant difference between the treatments.

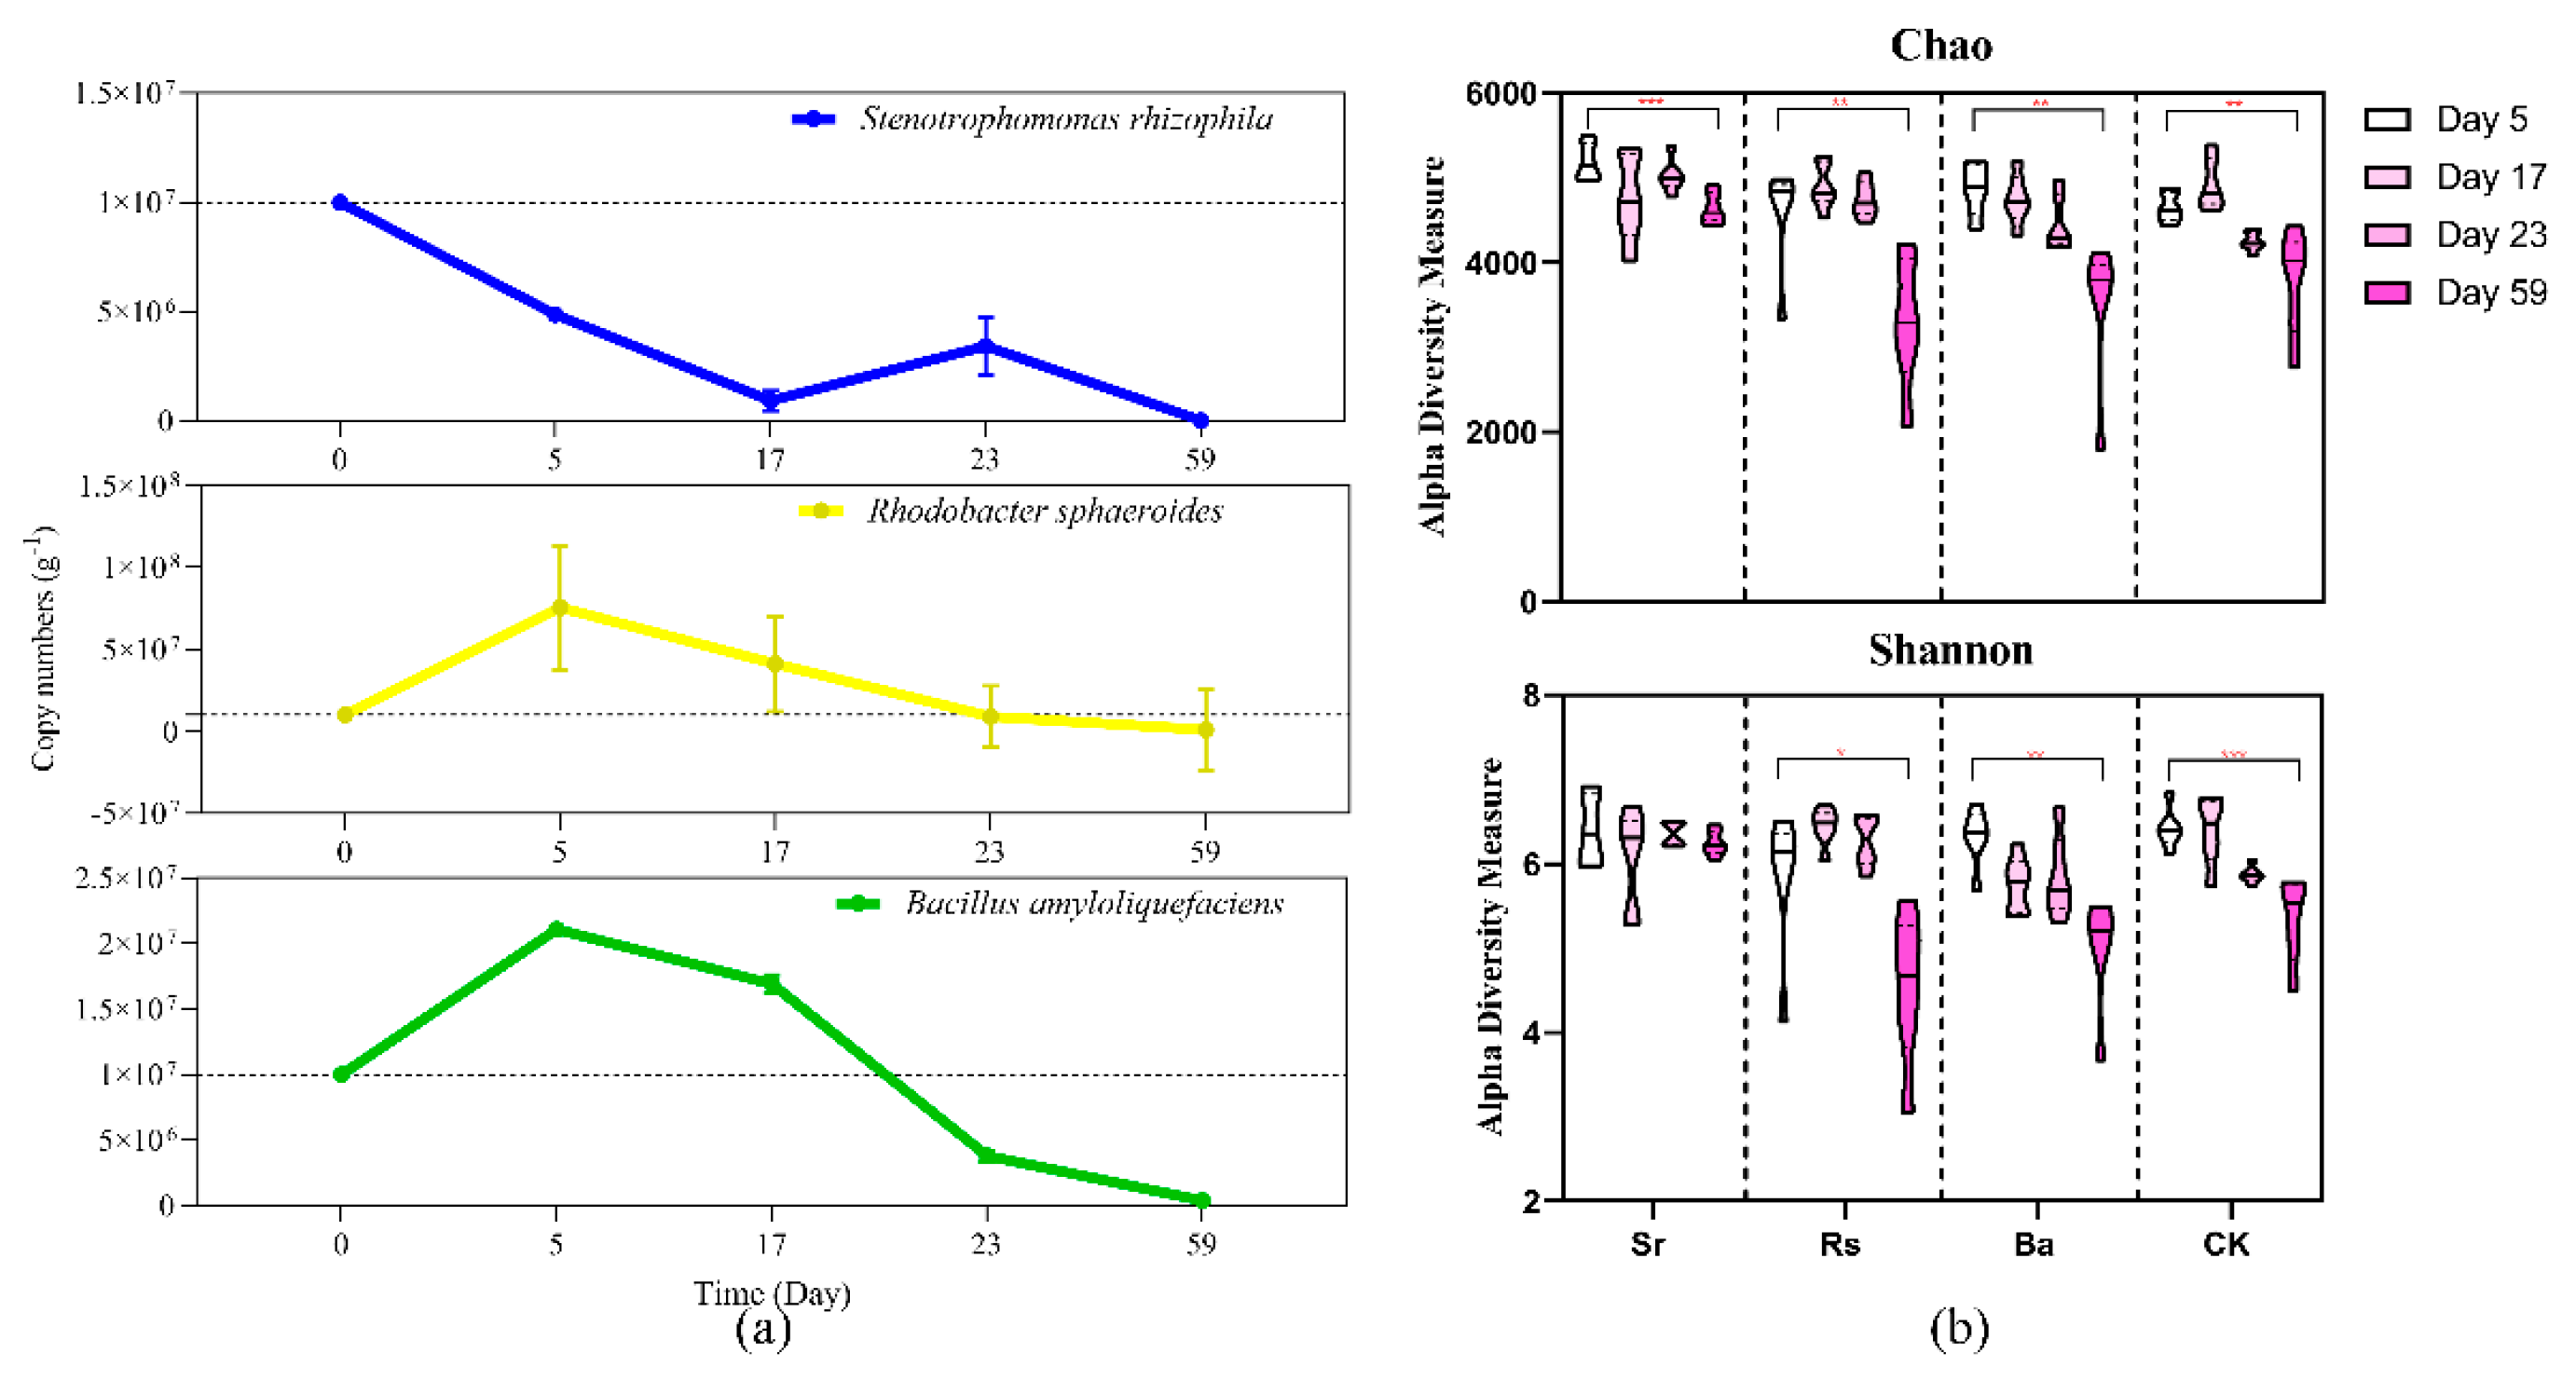
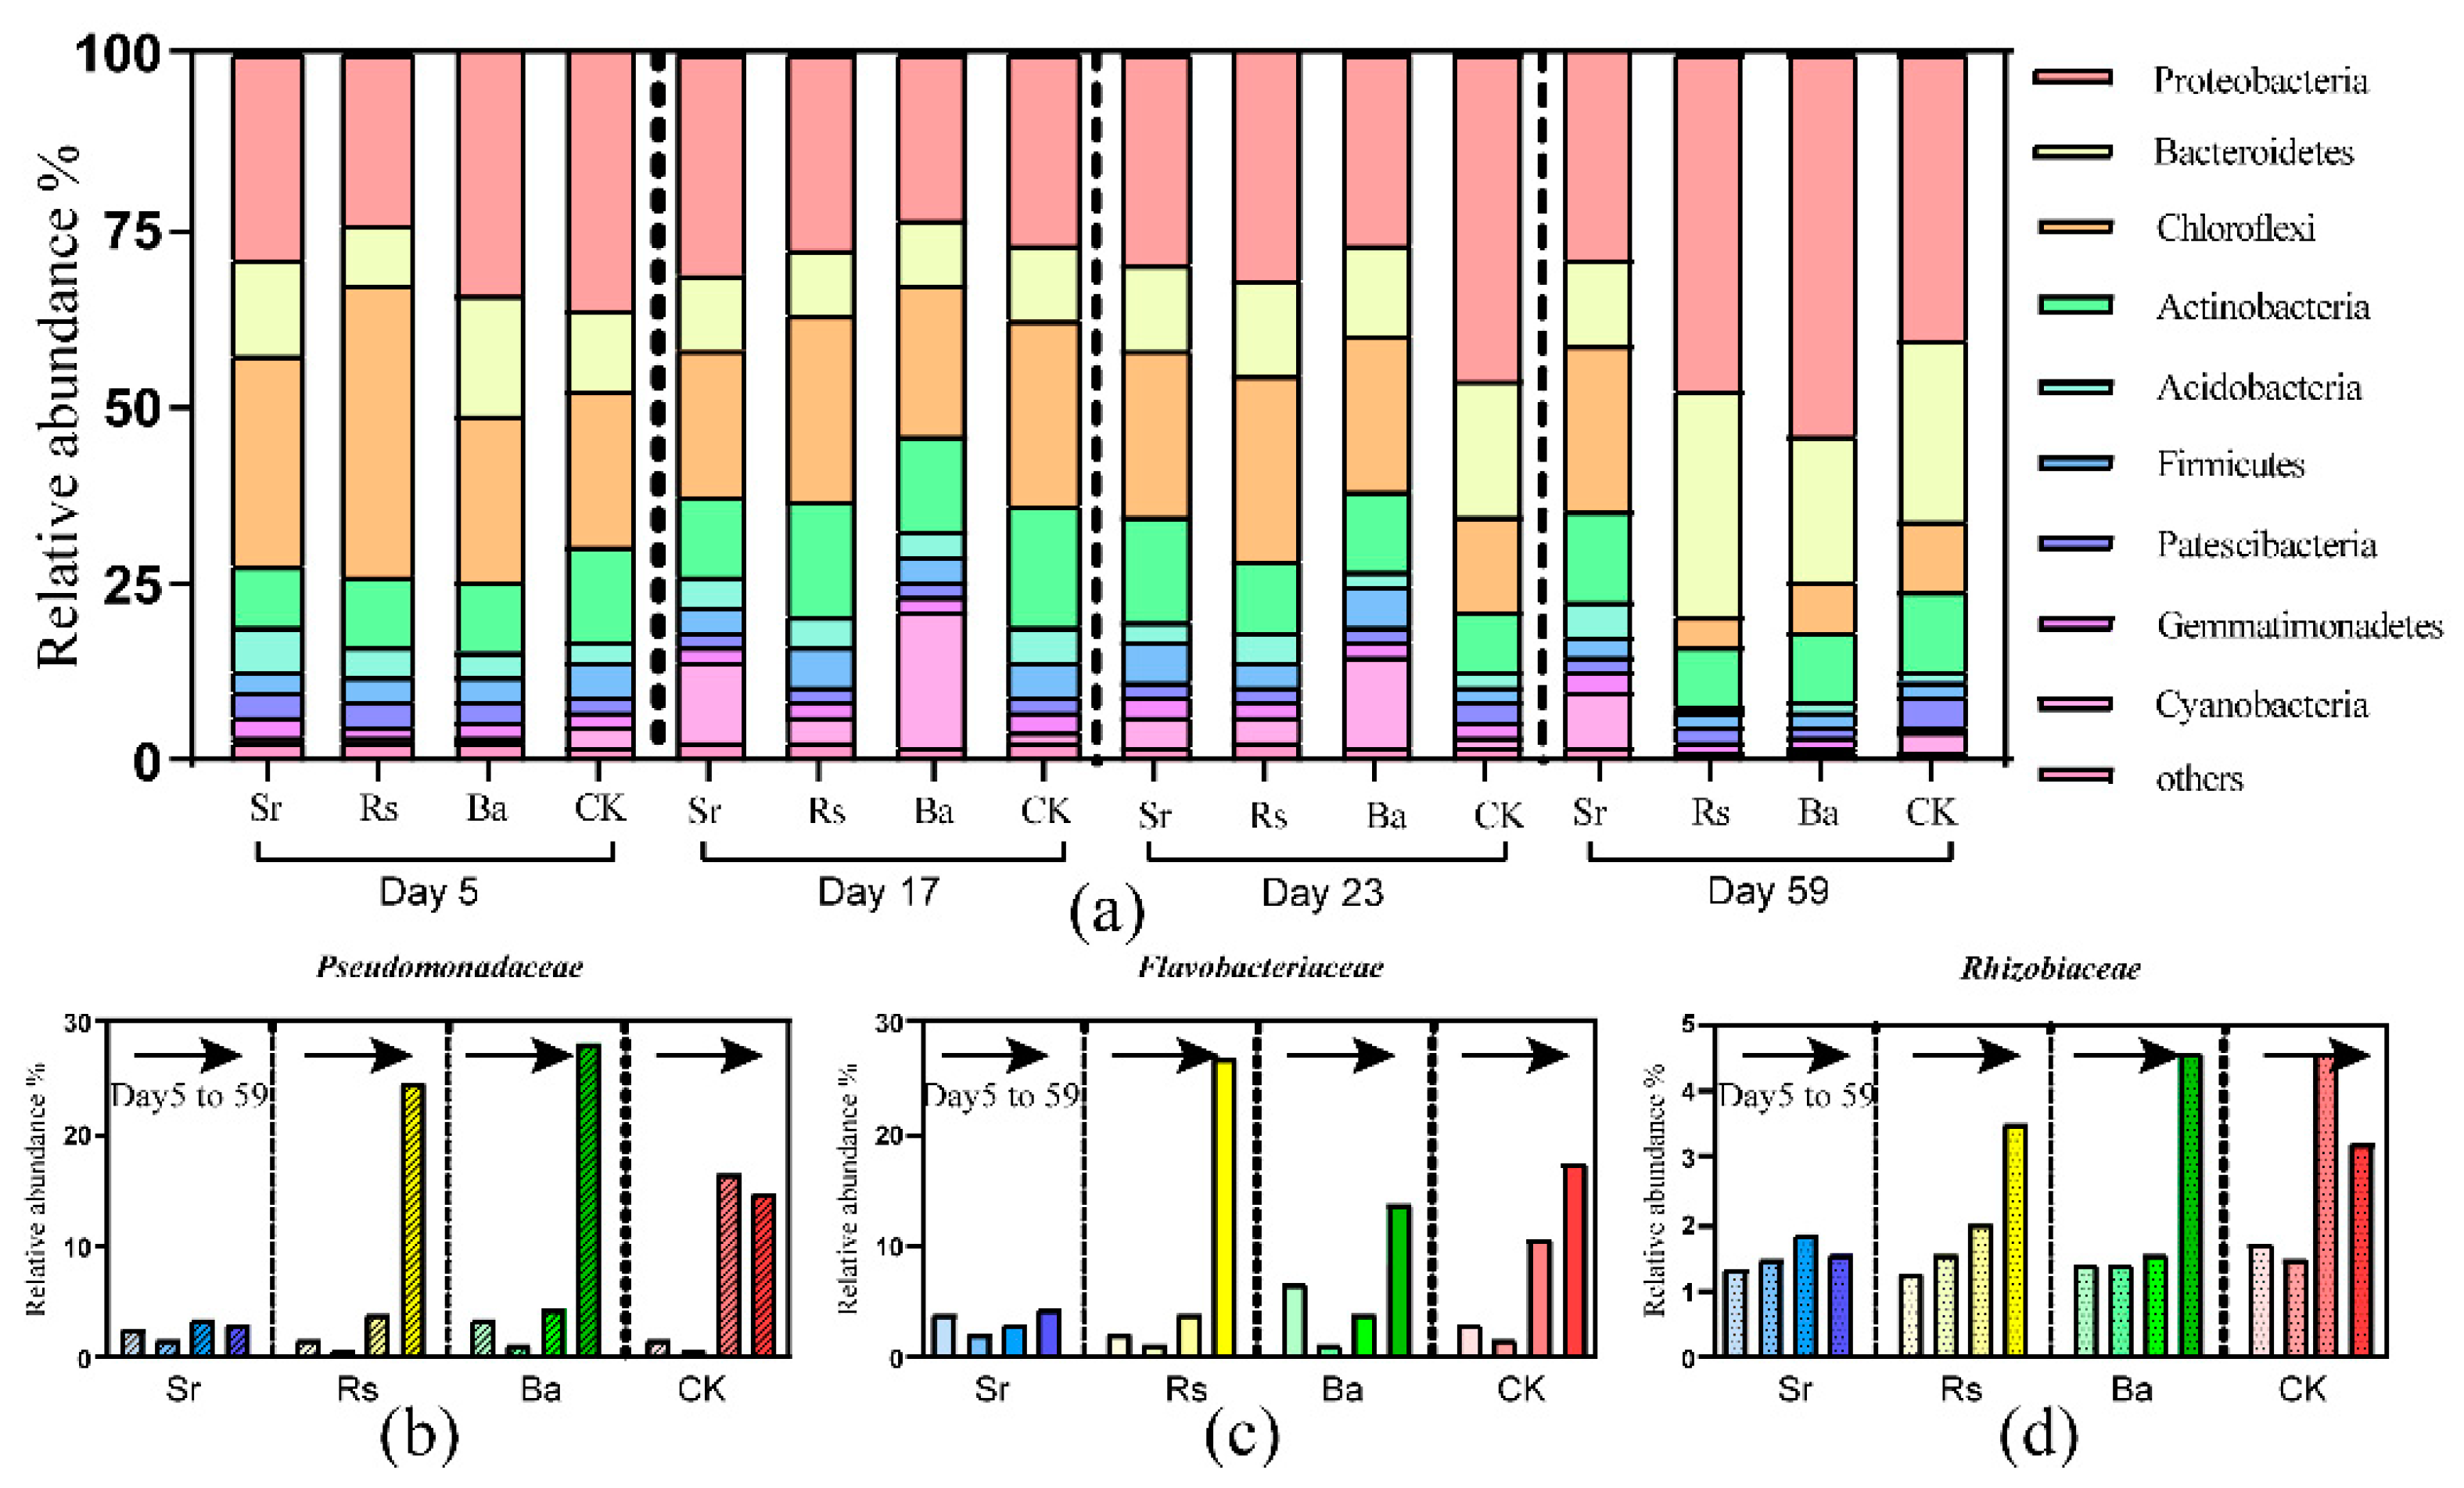
3.5. Rhizobacterial Community Assembly Is Driven by Plant Growth Stage and PGPR

Illumina sequencing generated a total of 5,277,380 sequences that could be classified into 11147 OTUs belonging to 47 phyla and 121 classes after the removal of ambiguous, short, and low-quality reads and singleton OTUs. Microbial richness and diversity were estimated by the Chao and Shannon indices (Figure 1b). Species richness indices indicated an unsteady reduction in the number of rhizosphere OTUs during plant growth. In all samples analyzed, the species richness was significantly reduced on day 59 as compared with day 5 (Student’s t-test). Similarly, bacterial community diversity was reduced during plant growth except in the Sr treatment (Student’s t-test). In particular, the student’s t-test for Chao and Shannon indices showed that on day 59 (Figure S3), the OTUs richness and diversity of the Sr treatment were significantly higher than those in the other three treatments.
The majority of the bacterial sequences observed in the rhizospheres of the four treatments during plant growth belonged to the phyla Proteobacteria (23.66%~53.86%), Bacteroidetes (8.74%~31.68%), Actinobacteria (8.22%~16.85%), Acidobacteria (5.12%~9.64%), Chloroflexi (4.45%~40.8%), Firmicutes (1.53%~6.16%), Gemmatimonadetes (0.95%~2.84%), and Cyanobacteria (0.32%~18.67%). Proteobacteria and Bacteroidetes largely dominated the rhizosphere bacterial community dynamics (Figure 3a). During CK treatment plant growth, the rhizosphere was significantly enriched in Bacteroidetes, while the relative abundances of Chloroflexi, Firmicutes, Acidobacteria, and Gemmatimonadetes decreased (Figure S4). The addition of B. amyloliquefaciens significantly increased the relative abundance of Proteobacteria, while the addition of R. sphaeroides significantly increased the proportion of Proteobacteria and Bacteroidetes. The inoculation of S. rhizophila primarily increased the relative abundance of Actinobacteria and Cyanobacteria during plant growth (Figure S4). Wilcoxon rank-sum test also revealed that compared to the CK treatment, the relative abundances of Proteobacteria were significantly increased in Ba and Rs treatments during the final stage of plant growth (day 59). Sr treatment significantly increased the relative abundance of Acidobacteria, Gemmatimonadetes, and Cyanobacteria while decreasing the relative abundance of Bacteroidetes on day 59 (Figure S5). At the family level, the relative abundances of Flavobacteriaceae (Figure 3c) and Pseudomonadacea (Figure 3b) were significantly higher in the Rs treatment compared to CK treatment, meanwhile, the relative abundances of Pseudomonadacea and Rhizobiaceae (Figure 3d) were significantly higher in Ba treatment compared to CK treatment on day 59. The inoculation of S. rhizophila reduced the abundances of Flavobacteriaceae, Pseudomonadacea, and Rhizobiaceae compared to CK treatment, however, S. rhizophila augmented many Chloroflexi species (Figure S6).
Non-metric multidimensional scaling (NMDS) analysis showed that the shifts in rhizosphere soil bacterial community composition increased with time (Figure 4a); and that the bacterial community was obviously different in each of the four treatments on day 59. Most significantly, NMDS analysis showed a clear separation between Sr treatment and the other three treatments on day 59. These results showed that samples from different treatments were separated from each other and that community structures were altered during plant growth.
Bipartite association networks were used to visualize the associations between OTUs in the four treatments (Figure 4b). The quantity of OTUs specific to each treatment changed significantly over the four stages. On day 5, the number of OTUs unique to each treatment group was relatively balanced, however by day 59, OTU numbers unique to each treatment group changed dramatically. Among the top 200 species in abundance, at OTU taxonomic level, the number of unique OTUs in the Sr treatment increased from 30 (day 5) to 133 (day 59), a large proportion of which belonged to Proteobacteria (40), Chloroflexi (29), Actinobacteria (22), Bacteroidetes (16), and Acidobacteria (15). The number of OTUs unique to the Ba, Rs, and CK treatments had decreased by the final stage (day 59) compared with the initial number (day 5). In particular, the Rs treatment had only three unique OTUs during the final stage.

3.6. Dynamic Rhizobacteria Interactions during Plant Growth

Phylogenetic molecular ecological networks (pMEN) were constructed to identify the interactions within bacterial communities during plant growth with PGPR inoculants. In regard to network topological indices, higher average connectivity (avgK) indicates a more complex network [58], average clustering coefficient (avgCC) measures the extent of module structure present in a network [59], and a smaller average geodesic distance (GD) means all the nodes in the network are closer. A modularity index value of >0.4 suggested that the networks had a typical module structure [60]. Thus, rhizosphere communities underwent dynamic changes during plant growth, with the Sr treatment network soil showing more complexity than the other treatments on days 5 and 23; the CK treatment was more tightly linked than the PGPR treatments on day 17; and rhizosphere species were linked in a more complex manner in the Ba treatment on day 59. All networks showed high modularity, which is beneficial for increasing the stability of interaction networks and helping microbial communities resist environmental changes [61] (Table S2). Total node number, average connectivity (avgK), average clustering coefficient (avgCC), and average geodesic distance (GD) indicated species interactions involved in the three PGPR treatments changed in a dissimilar manner. The pMENs were used to visualize the interactions among nodes at the genus level (Figure 5). The relative abundance of Chloroflexi in the networks was relatively high in the early stages and decreased over time. On day 17, Cyanobacteria appeared in the networks. In the final stage, Pseudomonas and Flavobacterium accounted for a greater proportion of links than Chloroflexi and were responsible for the two of the largest proportions of links in the Rs (7.83%, 9.22%), Ba (6.61%, 6.61%), and CK (6.79%, 6.73%) networks on day 59 respectively. In contrast, the Sr treatment network had lower node proportions of Pseudomonas and Flavobacterium on day 59 as compared with the other three networks. Pseudomonas and Flavobacterium showed positive interactions in all treatments.
To further distinguish keystone species in the interaction networks, all nodes were divided into four categories (peripherals, connectors, module hubs, and network hubs) according to the Zi (within-module connectivity) and Pi values (among-module connectivity) in ZP-plot (Figure S7). The majority of nodes could be classified into peripherals with most of their links within their modules, accounting for 98.50~100% of nodes. Module hubs represent nodes highly connected within their own modules that could be regarded as central species within each unit. The sixty-four nodes identified as module hubs and were mainly from Proteobacteria, Chloroflexi, Actinobacteria, Acidobacteria, Bacteroidetes, and Gemmatimonadetes. Connectors represented nodes that were highly linked to other modules acting as bridges. The twenty-two nodes identified as connectors mainly included Proteobacteria, Chloroflexi, Actinobacteria, and Firmicutes (Table S2).

4. Discussion

The beneficial effects of PGPR on plant growth are well documented [62,63]. However, the role of PGPR is not solely implemented through the direct effect of a single bacterial strain, but by the molecular dialogue established among multiple soil microorganisms and the plant [64]. Our research was based on a fifty-nine-day greenhouse experiment in which agricultural management schemes (e.g., watering regime and climatic conditions) were the same for all treatments (Sr, Rs, Ba, and CK). Fifty-nine days was considered a suitable time span [10] to ascertain the combined effects of PGPR on plant performance. We assessed the physicochemical parameters of both plant soil, conducted PGPR colonization tests, and quantified N cycling genes, and utilized the information of 16S rRNA genes to analyze the rhizobacteria diversity, composition, and molecular ecological networks.

4.1. Plant Growth Stages Determine Rhizobacterial Community Composition

In general, except for the Sr treatment, the abundance of Proteobacteria and Bacteroidetes were significantly enriched in the rhizosphere soil compared to the early samples (day 5), while, in contrast, the relative abundances of Chloroflexi, Acidobacteria, Firmicutes, and Gemmatimonadetes in the rhizosphere were reduced compared to the initial stage (Figure 3a). The dynamic changes in bacterial abundances of CK treatment altered gradually over time. This proved that plant growth established the rhizosphere community [65]. An increased abundance of Proteobacteria and Bacteroidetes has been described in previous studies [66,67]. Members of the Proteobacteria are rhizosphere colonizers and fast-growing r-strategists, which respond positively to the rhizosphere [68]. Bacteroidetes are also fast-growing, capable of quick organic matter decomposition, and often increase in abundance after planting [69]. On the contrary, Chloroflexi, Firmicutes, Acidobacteria, and Gemmatimonadetes decreased in relative abundance in the rhizosphere as the plants grew (Figure S4).
The decrease in the relative abundances of Chloroflexi, Actinobacteria, and Firmicutes in the rhizosphere could be due to competition with fast-growing Proteobacteria and Bacteroidetes, or other microbes, for resources or from microbe-microbe inhibition.
Previous research has confirmed that plants are able to control the composition of their rhizosphere microbiome [70] to select for specific microbial functions [71] and to support, restrict, or terminate microbial growth and activity [1]. Meanwhile, bacteria adapt to the rhizosphere by making strategic adjustments through motility, chemotaxis, quorum sensing [1], lipopolysaccharide synthesis [72], increased biofilm formation, or altering substrate utilization profiles [73], reshaping the bacterial communities [1]. Hiltner [74] proposed that rhizosphere microbial communities impact plant nutrition and health [75] and that, conversely, these communities may be affected by the stage of plant growth [76]. Based on the analysis of CK treatment plant rhizosphere communities during the four stages, our results provide support for previous studies, where the stage of plant growth was determined to be an important determinant of rhizosphere microbial composition [76,77].

4.2. R. sphaeroides and B. amyloliquefaciens Increase the Selective Enrichment of Beneficial Bacteria in the Plant Rhizosphere

In regard to Rs and Ba treatments, the enrichment of Proteobacteria and Bacteroidetes in the rhizosphere was strengthened by the application of R. sphaeroides and B. amyloliquefaciens. Rs treatment significantly increased the relative abundance of Pseudomonadaceae (Proteobacteria) and Flavobacteriaceae (Bacteroidetes), and Ba treatment significantly increased the relative abundance of Pseudomonadaceae and Rhizobiaceae (classified as Proteobacteria).
Network analysis further confirmed Pseudomonas and Flavobacterium played crucial roles in bacterial interactions during the final stage of Rs and Ba treatments (Figure 5). There is evidence that interactions among bacteria play an important role in community dynamics or assembly [78]. Additionally, the bacterial community assembly rules reflecting ecological interaction in the rhizosphere, such as cooperation, competition, and niche partitioning [79], were fully demonstrated by the networks, providing a reference for how PGPR affects the rhizosphere bacterial community. The networks presented dissimilar dynamic changes during the four stages, Rs and Ba treatments had a tighter and more complex network of rhizobacteria, whereas Sr treatment showed higher modularity during the final stage (Table S2). The rhizosphere microbiome extends the capacity of plants to adapt to environmental changes, and the establishment of particular microbiome members in the rhizosphere can be regarded as niche colonization [1]. Specific conditions of organic soil, such as high organic matter content or the presence of anoxic habitats under waterlogged conditions [80], may provide additional niches for anaerobic bacteria [81] or facultative anaerobes (e.g., Chloroflexi). This could explain the high abundance of Chloroflexi throughout the experiment and its early occupation of an important ecological niche. Subsequently, Chloroflexi species were at a disadvantage during niche competition in Rs, Ba, and CK treatments, but had the dominant position in Sr treatment. Cyanobacteria were supplanted in niche competition by other species in Rs and Ba treatment. Moreover, positive connections existed within genera Pseudomonas, Flavobacterium, and Rhizobium. Pseudomonas are known to promote plant growth and enhance crop yield [82]; act as bio-control agents [83]; and recognize and send quorum sensing QS molecules [84], which play a fundamental role in shaping the rhizosphere microbial community as well as influencing plant development [1]. Pseudomonas and Rhizobium are among the most powerful phosphate solubilizers in soil [85]; and due to their nitrogen fixation capabilities, Rhizobium also maintains soil fertility, enhancing crop yields [86]. Additionally, Flavobacterium can produce plant hormone of the auxin class, IAA [87], and alter other rhizosphere enzyme activities [88].
We showed that the application of R. sphaeroides and B. amyloliquefaciens manipulated rhizobacterial communities to greatly enhance selective enrichment (e.g., Pseudomonadaceae and Flavobacteriaceae). Simultaneously, pMENs reveal the intense niche competition and succession of rhizobacteria in the Rs and Ba treatments.

4.3. The Difference of S. rhizophila Application to the Rhizobacterial Community

Interestingly, the inoculation of S. rhizophila affected alpha-diversity and rhizobacterial microbiome dynamics differently. Reduced bacterial community richness and diversity has been reported for the rhizosphere of several other plant species [81,89], which was consistent with the results of Rs, Ba, and CK treatments (Figure 1b). It is believed that the decrease in OTU richness in the rhizosphere can be attributed to a homogenizing effect of rhizosphere processes that reduce niche dimensions [81]. Alternatively, a reduction in community diversity could result from altered species abundance distributions over time [90]. However, there was no statistical decrease in the diversity of Sr treatment. Moreover, the bipartite association network (Figure 4b) also demonstrated that the Sr treatment had higher bacterial community diversity during the final stage of plant growth. Overall, the application of S. rhizophila prevented the decline of rhizosphere species diversity over time.
Proteobacteria and Chloroflexi were core phyla in the Sr treatment rhizosphere microbiome throughout plant growth (Figure 3a). S. rhizophila remarkably increased the relative abundance of Acidobacteria, Cyanobacteria, and Gemmatimonadetes and reduced Bacteroidetes abundance as compared to CK treatment during the final stage (Figure S5). Sr treatment enriched Actinobacteria over time (Figure S4), and similar assembly change had previously been observed in the sanqi rhizosphere [91]. Moreover, Chloroflexi has been observed in the rhizosphere of many plants, including maize [89], soybean [92], and rice [77].
Chloroflexi are widely distributed in terrestrial and aquatic ecosystems [93] and many of their members take part in the nitrogen cycle either through nitrogen fixation [94] or nitrite oxidation [95]. Cyanobacteria are widely distributed in various environments and considered as plant growth promoters in maize [96] and wheat [97] rhizosphere systems. Like Cholorflexi, Cyanobacteria are able to fix nitrogen [98], they are also able to increase the availability of phosphorous and release auxins which promote plant growth [99], identifying them as a green option for sustainable agriculture [100]. Their ecological niche indicates a potentially important role in nitrogen fixation agroecosystems [101].
Furthermore, Cyanobacteria can produce H2 as a by-product of nitrogen fixation [102]. They also produce glycolate (a by-product of photorespiration under conditions of O2 supersaturation) during the daytime [103] and produce acetate and propionate during the nighttime (under anoxic conditions) [104]. There has been evidence that phototrophic Chloroflexi perform both photomixotrophy, when metabolic intermediates and electron donors, such as H2 are available during the daytime [102], mixotrophy, simultaneously incorporate both acetate and glycolate (Figure S8). Therefore, Cyanobacteria participate in the metabolic activities of Chloroflexi by mutualism. We speculate that Chloroflexi may be linked with the nutrient supplying capability of soil and plant growth promotion and that this group deserves more exploration in future studies.
Acidobacteria, believed to be K-strategists that would respond slowly to environmental perturbation [105], whose abundance is negatively correlated with nutrient availability [106], increased during the final stage of plant growth. We believe this increase in Acidobacteria abundance was due to the reduced soil organic matter and soil resources as plants grew during the final stage. Some members of Actinobacteria are also capable of nitrogen-fixation [107], biocontrol [108], enhancing nutrient availability, and regulating plant metabolism [109]. Actinobacteria may also be involved in the degradation of organic matter in the anoxic zones of paddy fields [110]. Additionally, some Gemmatimonadetes, which are abundant but poorly characterized bacteria in soil, have been identified to possess the capacity for nitrite to nitric oxide reduction [111].
Previously, Schmidt [31] showed that one of the S. rhizophila plant growth promotion strategies was to shape the fungal rhizosphere community. Our results suggest that another tactic is to reshape the rhizobacteria community by recruiting beneficial diazotrophic bacteria such as members of the Cyanobacteria and Actinobacteria.

4.4. PGPR Promote Plant Growth and Enhance Soil Nutrient Availability by Shaping the Rhizobacterial Community

Quantification PCR was performed to assess rhizosphere colonization and N cycling functional genes quantification, in the process, we established an accurate S. rhizophila species-specific qPCR system. The trends of the three PGPR’s colonizing abilities (Figure 1a) were in accordance with previous results [112], in that even if PGPR inoculants colonize during the initial plant growth stage, their persistence over time is not guaranteed. Notably, our study indicates that even if PGPR are present even at low levels during the final plant stage, they can still affect the rhizosphere community structure. Therefore, the addition of PGPR in the initial stage of plant growth could affect the rhizobacteria community over the course of a plant’s entire life.
Plant growth and productivity depend on the availability of nutrients at the soil-root interface [113]. The biogeochemical cycle of the entire N pool is very important to the level of soil fertility, and the N cycle is primarily regulated by microbial processes [114]. The role of PGPR inoculants with an impact on N utilization by plants has been widely described [115]. In our study, the abundance of ammonification gene ureC was increased in Sr treatment. This suggested that effective transformation of organic nitrogen into NH4+ by rhizobacteria, which was enriched by the inoculation of S. rhizophila, may contribute to higher N use efficiency in the plant. But ammonification may cause the loss of NH3 and N2O emissions [116], which deserves our attention. R. sphaeroides and B. amyloliquefaciens enhanced the selective enrichment of Pseudomonadaceae and Flavobacteriaceae in the rhizosphere soil to varying degrees; while S. rhizophila recruited diazotrophic Cyanobacteria and Actionbateria species increase in the amounts of TN in the plant significantly. Nitrogen is an imperative element for the proper growth and development of plants by playing a vital role in the biochemical and physiological functions of plants, including the generation of amino acids for proteins [117]. The addition of S. rhizophila and B. amyloliquefaciens significantly increased the content of soluble protein, which is an important indicator for detecting the plant enzyme activity and total metabolism [118]. Thus, we suggest that the three PGPR strains increased bioavailable N directly to the plant, and in turn could decrease the reliance on synthetic fertilizers for agriculture.
Moreover, the addition of PGPR resulted in pronounced changes in rhizosphere nutrient composition compared to bulk soil. The Sr treatment significantly increased the content of Al, K, P, and NO3, while the Rs treatment observably increased the K and TC content in rhizosphere soil. However, the Ba treatment significantly decreased the Ca, Mg, Fe, Mn, Al, and NO3 concentrations, possibly due to B. amyloliquefaciens enhanced nutrients absorption by plant root. Thus, different PGPR inoculants have different degrees of effectiveness in altering soil nutrients.
These results, derived from a model plant, could be used to improve sustainable productivity in agriculture but will require extensive research in other crops. Meanwhile, if there is a comparison of available element concentrations with bulk and rhizosphere soil, to show the absorption of nutrients directly, it will further our understanding of how PGPR plays a pivotal role in shaping the microbiome and conduct soil nutrients transformation.

5. Conclusions

The inoculation of PGPR increased the TN and soluble protein content in the plant and altered nutrient availability in the rhizosphere soil. Together, the stage of plant growth and PGPR drove rhizobacterial community composition. Based on quantitative PCR and the bacterial community structure analysis with four stages, it was demonstrated that, although the PGPR cannot colonize the rhizosphere in a persistent manner, the effect of PGPR on the rhizobacterial community was long-lasting. Our results reveal that different PGPR inoculants may lead to the different assemblages of rhizobacterial communities and rhizobacterial interactions during the process of plant growth: R. sphaeroides and B. amyloliquefaciens assist the plant to selectively enrich for beneficial bacteria to a greater degree by increasing the relative abundance of Pseudomonadacea and Flavobacteriaceae. S. rhizophila attracted diazotrophic members of Cyanobacteria and Actinobacteria, and stimulated ammonification. Simultaneously, we established a qPCR system for S. rhizophila and detected plant growth-promoting characteristics of R. sphaeroides for the first time. In summary, the three PGPR strains in this study promote plant growth and participate in biogeochemical processes by affecting the composition of the rhizobacterial community.

6. Patents

Application of Stenotrophomonas rhizophila in improving the rhizosphere soil and promoting plant growth. Application number 202010323710.3.

Supplementary Materials

The following are available online at https://0-www-mdpi-com.brum.beds.ac.uk/2076-2607/9/1/161/s1, Figure S1: (a) Diagram and photographs (before planting and plant growth final stage) of PGPR treatments in the greenhouse; (b) Fractionation protocol. For each biological replicate (n = 3), five individual plants were dug out from the pots and samples were fractionated into bulk soil and rhizosphere soil.; Figure S2: Quantitative curve trends from day 5 to day 59 of ureC (a), nifH (b), and nxrA (c); Figure S3: Alpha-diversity of the four treatments on Day 59. Student’s t-test, p values (* p < 0.05; ** p < 0.01, *** p < 0.001); Figure S4: Differences in the relative abundance of the top ten rhizobacterial phyla among treatments over the course of the experiment as based on Wilcoxon rank-sum test. Extended error bar plots denote statistically significant features along with the p values (* p < 0.05; ** p < 0.01, *** p < 0.001), effect sizes, and confidence intervals (95%); Figure S5: Differences in the relative abundance of the top nine rhizobacterial phyla among treatments on day 59 of growth experiment as based on Wilcoxon rank-sum test. Extended error bar plots denote statistically significant features along with the p values (* p < 0.05; ** p < 0.01, *** p < 0.001), effect sizes, and confidence intervals (95%); Figure S6: Differences in the relative abundance of the top nine rhizobacterial families among treatments on day 59 of growth experiment as based on Wilcoxon rank-sum test. Extended error bar plots denote statistically significant features along with the p values (* p < 0.05; ** p < 0.01, *** p < 0.001), effect sizes, and confidence intervals (95%); Figure S7: Distribution of Zi and Pi values of all nodes with four treatments during the four plant growth stages; Figure S8: Diagram of mutualism relationship between Chloroflexi and Cyanobacteria. (The image of Chloroflexi is from Lab Microbial Systems Ecology, Department of Microbiology, TUM, Germany; the image of Cyanobacteria is from Eye of Science/Science Photo Library.) The peripheral curves in each graph represent the error (SD). Table S1: Beneficial characteristics of the PGPR; Table S2: Topological properties of pMENs and random networks obtained among the rhizosphere of the four treatments during four plant growth stages, and their ZP-plot quantities.

Author Contributions

Conceptualization, X.Z. and J.G.; methodology, X.Z., Z.B. and G.Z.; software, Y.L., X.L. and X.D.; formal analysis, Y.L. and J.G.; investigation, Y.L., J.G. and S.W.; resources, Z.B. and S.W.; writing—original draft preparation, Y.L.; writing—review and editing, J.G., T.B. and X.Z.; visualization, Y.L., X.D., N.W. and H.F.; project administration, X.Z. and J.G.; funding acquisition, X.Z. All authors have read and agreed to the published version of the manuscript.

Funding

This research was funded by the National Natural Science Foundation of China, grant number 31670507, the CAS International Partnership Program, grant number 121311KYSB20200017, and the National Key Research and Development Program of China, grant number 2016YFC0500401 and 2017YFC0505803-01.

Institutional Review Board Statement

Not applicable.

Informed Consent Statement

Not applicable.

Data Availability Statement

The data presented in this study are openly available in the NCBI Sequence Read Archive, the accession number PRJNA622875.

Acknowledgments

Authors would like to thank the Division of Public Instrument Analysis of Research Center for Eco-Environmental Sciences for technical supporting.

Conflicts of Interest

The authors declare no conflict of interest. The funders had no role in the design of the study; in the collection, analyses, or interpretation of data; in the writing of the manuscript, or in the decision to publish the results.

References

  1. Venturi, V.; Keel, C. Signaling in the Rhizosphere. Trends Plant Sci. 2016, 21, 187–198. [Google Scholar] [CrossRef] [PubMed]
  2. Verbon, E.H.; Liberman, L.M. Beneficial Microbes Affect Endogenous Mechanisms Controlling Root Development. Trends Plant Sci. 2016, 21, 218–229. [Google Scholar] [CrossRef] [PubMed] [Green Version]
  3. Malik, K.; Bilal, R.; Mehnaz, S.; Rasul, G.; Mirza, M.; Ali, S. Association of nitrogen-fixing, plant-growth-promoting rhizobacteria (PGPR) with kallar grass and rice. In Opportunities for Biological Nitrogen Fixation in Rice and Other Non-Legumes; Springer: Cham, Switzerland, 1997; pp. 37–44. [Google Scholar]
  4. Jog, R.; Pandya, M.; Nareshkumar, G.; Rajkumar, S. Mechanism of phosphate solubilization and antifungal activity of Streptomyces spp. isolated from wheat roots and rhizosphere and their application in improving plant growth. Microbiology 2014, 160, 778–788. [Google Scholar] [CrossRef] [PubMed] [Green Version]
  5. Kloepper, J.W.; Leong, J.; Teintze, M.; Schroth, M.N. Enhanced plant growth by siderophores produced by plant growth-promoting rhizobacteria. Nature 1980, 286, 885–886. [Google Scholar] [CrossRef]
  6. Bal, H.B.; Nayak, L.; Das, S.; Adhya, T.K. Isolation of ACC deaminase producing PGPR from rice rhizosphere and evaluating their plant growth promoting activity under salt stress. Plant Soil 2013, 366, 93–105. [Google Scholar] [CrossRef]
  7. Cassán, F.; Vanderleyden, J.; Spaepen, S. Physiological and agronomical aspects of phytohormone production by model plant-growth-promoting rhizobacteria (PGPR) belonging to the genus Azospirillum. J. Plant Growth Regul. 2014, 33, 440–459. [Google Scholar] [CrossRef]
  8. Ramamoorthy, V.; Viswanathan, R.; Raguchander, T.; Prakasam, V.; Samiyappan, R. Induction of systemic resistance by plant growth promoting rhizobacteria in crop plants against pests and diseases. Crop Prot. 2001, 20, 1–11. [Google Scholar] [CrossRef]
  9. Bhattacharyya, P.N.; Jha, D.K. Plant growth-promoting rhizobacteria (PGPR): Emergence in agriculture. World J. Microbiol. Biotechnol. 2012, 28, 1327–1350. [Google Scholar] [CrossRef]
  10. Wu, S.; Zhuang, G.; Bai, Z.; Cen, Y.; Xu, S.; Sun, H.; Han, X.; Zhuang, X. Mitigation of nitrous oxide emissions from acidic soils by Bacillus amyloliquefaciens, a plant growth-promoting bacterium. Glob. Chang. Biol. 2018, 24, 2352–2365. [Google Scholar] [CrossRef]
  11. Deng, Y.; Liu, X.; Wu, J.; Lee, J.; Chen, S.; Cheng, Y.; Zhang, C.; Zhang, L.H. The host plant metabolite glucose is the precursor of diffusible signal factor (DSF) family signals in Xanthomonas campestris. Appl. Environ. Microbiol. 2015, 81, 2861–2868. [Google Scholar] [CrossRef] [Green Version]
  12. Tan, S.Y.; Gu, Y.; Yang, C.L.; Dong, Y.; Mei, X.L.; Shen, Q.R.; Xu, Y.C. Bacillus amyloliquefaciens T-5 may prevent Ralstonia solanacearum infection through competitive exclusion. Biol. Fertil. Soils 2016, 52, 341–351. [Google Scholar] [CrossRef]
  13. Shen, Z.; Ruan, Y.; Chao, X.; Zhang, J.; Li, R.; Shen, Q. Rhizosphere microbial community manipulated by 2 years of consecutive biofertilizer application associated with banana Fusarium wilt disease suppression. Biol. Fertil. Soils 2015, 51, 553–562. [Google Scholar] [CrossRef]
  14. Guo, Q.; Li, Y.; Lou, Y.; Shi, M.; Jiang, Y.; Zhou, J.; Sun, Y.; Xue, Q.; Lai, H. Bacillus amyloliquefaciens Ba13 induces plant systemic resistance and improves rhizosphere microecology against tomato yellow leaf curl virus disease. Appl. Soil Ecol. 2019, 137, 154–166. [Google Scholar] [CrossRef]
  15. Gowtham, H.; Murali, M.; Singh, S.B.; Lakshmeesha, T.; Murthy, K.N.; Amruthesh, K.; Niranjana, S. Plant growth promoting rhizobacteria-Bacillus amyloliquefaciens improves plant growth and induces resistance in chilli against anthracnose disease. Biol. Control 2018, 126, 209–217. [Google Scholar] [CrossRef]
  16. Cui, W.; He, P.; Munir, S.; He, P.; He, Y.; Li, X.; Yang, L.; Wang, B.; Wu, Y.; He, P. Biocontrol of soft rot of Chinese cabbage using an endophytic bacterial strain. Front. Microbiol. 2019, 10, 1471. [Google Scholar] [CrossRef] [Green Version]
  17. Sakarika, M.; Spanoghe, J.; Sui, Y.; Wambacq, E.; Grunert, O.; Haesaert, G.; Spiller, M.; Vlaeminck, S.E. Purple non-sulphur bacteria and plant production: Benefits for fertilization, stress resistance and the environment. Microb. Biotechnol. 2019. [Google Scholar] [CrossRef] [Green Version]
  18. Imam, S.; Noguera, D.R.; Donohue, T.J. Global insights into energetic and metabolic networks in Rhodobacter sphaeroides. BMC Syst. Biol. 2013, 7. [Google Scholar] [CrossRef] [Green Version]
  19. Liu, S.L.; Zhang, G.M.; Li, X.K.; Wu, P.; Zhang, J. Enhancement of Rhodobacter sphaeroides growth and carotenoid production through biostimulation. J. Environ. Sci. 2015, 33, 21–28. [Google Scholar] [CrossRef]
  20. Kien, N.B.; Kong, I.S.; Lee, M.G.; Kim, J.K. Coenzyme Q(10) production in a 150-l reactor by a mutant strain of Rhodobacter sphaeroides. J. Ind. Microbiol. Biotechnol. 2010, 37, 521–529. [Google Scholar] [CrossRef]
  21. Kho, D.H.; Yoo, S.B.; Kim, J.S.; Kim, E.J.; Lee, J.K. Characterization of Cu- and Zn-containing superoxide dismutase of Rhodobacter sphaeroides. Fems Microbiol. Lett. 2004, 234, 261–267. [Google Scholar] [CrossRef]
  22. Holguin, G.; Vazquez, P.; Bashan, Y. The role of sediment microorganisms in the productivity, conservation, and rehabilitation of mangrove ecosystems: An overview. Biol. Fertil. Soils 2001, 33, 265–278. [Google Scholar] [CrossRef]
  23. Wu, P.; Zhang, Y.; Chen, Z.B.; Wang, Y.L.; Zhu, F.F.; Cao, B.; Wu, Y.; Li, N. The organophosphorus pesticides in soil was degradated by Rhodobacter sphaeroides after wastewater treatment. Biochem. Eng. J. 2019, 141, 247–251. [Google Scholar] [CrossRef]
  24. Koku, H.; Eroğlu, İ.; Gündüz, U.; Yücel, M.; Türker, L. Aspects of the metabolism of hydrogen production by Rhodobacter sphaeroides. Int. J. Hydrog. Energy 2002, 27, 1315–1329. [Google Scholar] [CrossRef]
  25. Kondo, K.; Nishihara, E.; Nakata, N. Effect of the Purple Non-Sulfur Bacterium (Rhodobacter sphaeroides) on the Fruit Quality of Tomato. In Proceedings of the XXVII International Horticultural Congress-IHC2006: International Symposium on Advances in Environmental Control, Automation 761, Seoul, Korea, 30 September 2007; pp. 581–587. [Google Scholar]
  26. Kensuke Kondo, N.N.a.E.N. Effect of Purple Non-sulfur Bacterium (Rhodobacter sphaeroides) Application on the Growth and Quality of Spinach and Komatsuna. Jpn. Soc. Agric. Technol. Manag. 2008, 14, 198–203. [Google Scholar]
  27. Hagemann, M.; Ribbeck-Busch, K.; Klaehn, S.; Hasse, D.; Steinbruch, R.; Berg, G. The plant-associated bacterium Stenotrophomonas rhizophila expresses a new enzyme for the synthesis of the compatible solute glucosylglycerol. J. Bacteriol. 2008, 190, 5898–5906. [Google Scholar] [CrossRef] [Green Version]
  28. Egamberdieva, D.; Kucharova, Z.; Davranov, K.; Berg, G.; Makarova, N.; Azarova, T.; Chebotar, V.; Tikhonovich, I.; Kamilova, F.; Validov, S.Z.; et al. Bacteria able to control foot and root rot and to promote growth of cucumber in salinated soils. Biol. Fertil. Soils 2011, 47, 197–205. [Google Scholar] [CrossRef]
  29. Alavi, P.; Starcher, M.R.; Zachow, C.; Muller, H.; Berg, G. Root-microbe systems: The effect and mode of interaction of Stress Protecting Agent (SPA) Stenotrophomonas rhizophila DSM14405(T). Front. Plant Sci. 2013, 4. [Google Scholar] [CrossRef] [Green Version]
  30. Wolf, A.; Fritze, A.; Hagemann, M.; Berg, G. Stenotrophomonas rhizophila sp nov., a novel plant-associated bacterium with antifungal properties. Int. J. Syst. Evol. Microbiol. 2002, 52, 1937–1944. [Google Scholar] [CrossRef]
  31. Schmidt, C.S.; Alavi, M.; Cardinale, M.; Müller, H.; Berg, G. Stenotrophomonas rhizophila DSM14405 T promotes plant growth probably by altering fungal communities in the rhizosphere. Biol. Fertil. Soils 2012, 48, 947–960. [Google Scholar] [CrossRef]
  32. Kai, M.; Effmert, U.; Berg, G.; Piechulla, B. Volatiles of bacterial antagonists inhibit mycelial growth of the plant pathogen Rhizoctonia solani. Arch. Microbiol. 2007, 187, 351–360. [Google Scholar] [CrossRef]
  33. Egamberdieva, D.; Jabborova, D.; Berg, G. Synergistic interactions between Bradyrhizobium japonicum and the endophyte Stenotrophomonas rhizophila and their effects on growth, and nodulation of soybean under salt stress. Plant Soil 2016, 405, 35–45. [Google Scholar] [CrossRef]
  34. Hu, L.; Robert, C.A.M.; Cadot, S.; Zhang, X.; Ye, M.; Li, B.; Manzo, D.; Chervet, N.; Steinger, T.; van der Heijden, M.G.A.; et al. Root exudate metabolites drive plant-soil feedbacks on growth and defense by shaping the rhizosphere microbiota. Nat. Commun. 2018, 9, 2738. [Google Scholar] [CrossRef] [PubMed] [Green Version]
  35. Hansen, J.; Moller, I. Percolation of Starch and Soluble Carbohydrates from Plant-Tissue for Quantitative-Determination with Anthrone. Anal. Biochem. 1975, 68, 87–94. [Google Scholar] [CrossRef]
  36. Van Dam, N.M.; Horn, M.; Mares, M.; Baldwin, I.T. Ontogeny constrains systemic protease inhibitor response in Nicotiana attenuata. J. Chem. Ecol. 2001, 27, 547–568. [Google Scholar] [CrossRef]
  37. Szeto, Y.T.; Tomlinson, B.; Benzie, I.F.F. Total antioxidant and ascorbic acid content of fresh fruits and vegetables: Implications for dietary planning and food preservation. Br. J. Nutr. 2002, 87, 55–59. [Google Scholar] [CrossRef] [Green Version]
  38. Bulgarelli, D.; Rott, M.; Schlaeppi, K.; van Themaat, E.V.L.; Ahmadinejad, N.; Assenza, F.; Rauf, P.; Huettel, B.; Reinhardt, R.; Schmelzer, E.; et al. Revealing structure and assembly cues for Arabidopsis root-inhabiting bacterial microbiota. Nature 2012, 488, 91–95. [Google Scholar] [CrossRef]
  39. Chakraborty, P.; Tribedi, P. Functional diversity performs a key role in the isolation of nitrogen-fixing and phosphate-solubilizing bacteria from soil. Folia Microbiol. 2019, 64, 461–470. [Google Scholar] [CrossRef]
  40. Glickmann, E.; Dessaux, Y. A Critical-Examination of the Specificity of the Salkowski Reagent for Indolic Compounds Produced by Phytopathogenic Bacteria. Appl. Environ. Microbiol. 1995, 61, 793–796. [Google Scholar] [CrossRef] [Green Version]
  41. Brian, C.; Louden, D.H.; Aaron, M.L. Use of Blue Agar CAS Assay for Siderophore Detection. J. Microbiol. Blol. Educ. 2011, 12, 51–53. [Google Scholar]
  42. O’Toole, G.A. Microtiter dish biofilm formation assay. JoVE (J. Vis. Exp.) 2011, 47, e2437. [Google Scholar] [CrossRef]
  43. Magoč, T.; Salzberg, S.L. FLASH: Fast length adjustment of short reads to improve genome assemblies. Bioinformatics 2011, 27, 2957–2963. [Google Scholar] [CrossRef] [PubMed]
  44. Bokulich, N.A.; Subramanian, S.; Faith, J.J.; Gevers, D.; Gordon, J.I.; Knight, R.; Mills, D.A.; Caporaso, J.G. Quality-filtering vastly improves diversity estimates from Illumina amplicon sequencing. Nat. Methods 2013, 10, 57–59. [Google Scholar] [CrossRef] [PubMed]
  45. Caporaso, J.G.; Kuczynski, J.; Stombaugh, J.; Bittinger, K.; Bushman, F.D.; Costello, E.K.; Fierer, N.; Pena, A.G.; Goodrich, J.K.; Gordon, J.I. QIIME allows analysis of high-throughput community sequencing data. Nat. Methods 2010, 7, 335. [Google Scholar] [CrossRef] [Green Version]
  46. Haas, B.J.; Gevers, D.; Earl, A.M.; Feldgarden, M.; Ward, D.V.; Giannoukos, G.; Ciulla, D.; Tabbaa, D.; Highlander, S.K.; Sodergren, E. Chimeric 16S rRNA sequence formation and detection in Sanger and 454-pyrosequenced PCR amplicons. Genome Res. 2011, 21, 494–504. [Google Scholar] [CrossRef] [Green Version]
  47. Edgar, R.C.; Haas, B.J.; Clemente, J.C.; Quince, C.; Knight, R. UCHIME improves sensitivity and speed of chimera detection. Bioinformatics 2011, 27, 2194–2200. [Google Scholar] [CrossRef] [Green Version]
  48. Wang, Q.; Garrity, G.M.; Tiedje, J.M.; Cole, J.R. Naive Bayesian classifier for rapid assignment of rRNA sequences into the new bacterial taxonomy. Appl. Environ. Microbiol. 2007, 73, 5261–5267. [Google Scholar] [CrossRef] [Green Version]
  49. Quast, C.; Pruesse, E.; Yilmaz, P.; Gerken, J.; Schweer, T.; Yarza, P.; Peplies, J.; Glöckner, F.O. The SILVA ribosomal RNA gene database project: Improved data processing and web-based tools. Nucleic Acids Res. 2012, 41, D590–D596. [Google Scholar] [CrossRef]
  50. Yong, X.; Zhang, R.; Zhang, N.; Chen, Y.; Huang, X.; Zhao, J.; Shen, Q. Development of a specific real-time PCR assay targeting the poly-gamma-glutamic acid synthesis gene, pgsB, for the quantification of Bacillus amyloliquefaciens in solid-state fermentation. Bioresour. Technol. 2013, 129, 477–484. [Google Scholar] [CrossRef]
  51. Guan, D.; Li, J.; Shen, D.; Cao, F.; Li, L.; Jiang, X. Identification and Quantification of Photosynthetic Bacteria by PCR Method. Chin. J. Appl. Environ. Biol. 2008, 14, 699–704. [Google Scholar] [CrossRef]
  52. Attard, E.; Poly, F.; Commeaux, C.; Laurent, F.; Terada, A.; Smets, B.F.; Recous, S.; Le Roux, X. Shifts between Nitrospira- and Nitrobacter-like nitrite oxidizers underlie the response of soil potential nitrite oxidation to changes in tillage practices. Environ. Microbiol. 2010, 12, 315–326. [Google Scholar] [CrossRef]
  53. Rosch, C.; Mergel, A.; Bothe, H. Biodiversity of denitrifying and dinitrogen-fixing bacteria in an acid forest soil. Appl. Environ. Microbiol. 2002, 68, 3818–3829. [Google Scholar] [CrossRef] [PubMed] [Green Version]
  54. Koper, T.E.; El-Sheikh, A.F.; Norton, J.M.; Klotz, M.G. Urease-encoding genes in ammonia-oxidizing bacteria. Appl. Environ. Microbiol. 2004, 70, 2342–2348. [Google Scholar] [CrossRef] [Green Version]
  55. Alavi, P.; Starcher, M.R.; Thallinger, G.G.; Zachow, C.; Mueller, H.; Berg, G. Stenotrophomonas comparative genomics reveals genes and functions that differentiate beneficial and pathogenic bacteria. BMC Genom. 2014, 15. [Google Scholar] [CrossRef] [PubMed] [Green Version]
  56. Deng, Y.; Jiang, Y.H.; Yang, Y.F.; He, Z.L.; Luo, F.; Zhou, J.Z. Molecular ecological network analyses. BMC Bioinform. 2012, 13. [Google Scholar] [CrossRef] [PubMed] [Green Version]
  57. Wang, Z.; Lu, G.; Yuan, M.; Yu, H.; Wang, S.; Li, X.; Deng, Y. Elevated temperature overrides the effects of N amendment in Tibetan grassland on soil microbiome. Soil Biol. Biochem. 2019, 136. [Google Scholar] [CrossRef]
  58. West, D.B. Introduction to Graph Theory; Prentice hall: Upper Saddle River, NJ, USA, 2001; Volume 2. [Google Scholar]
  59. Watts, D.J.; Strogatz, S.H. Collective dynamics of ‘small-world’ networks. Nature 1998, 393, 440. [Google Scholar] [CrossRef] [PubMed]
  60. Newman, M.E. Modularity and community structure in networks. Proc. Natl. Acad. Sci. USA 2006, 103, 8577–8582. [Google Scholar] [CrossRef] [Green Version]
  61. Krause, A.E.; Frank, K.A.; Mason, D.M.; Ulanowicz, R.E.; Taylor, W.W. Compartments revealed in food-web structure. Nature 2003, 426, 282–285. [Google Scholar] [CrossRef]
  62. Hayat, R.; Ali, S.; Amara, U.; Khalid, R.; Ahmed, I. Soil beneficial bacteria and their role in plant growth promotion: A review. Ann. Microbiol. 2010, 60, 579–598. [Google Scholar] [CrossRef]
  63. Di Salvo, L.P.; Cellucci, G.C.; Carlino, M.E.; de Salamone, I.E.G. Plant growth-promoting rhizobacteria inoculation and nitrogen fertilization increase maize (Zea mays L.) grain yield and modified rhizosphere microbial communities. Appl. Soil Ecol. 2018, 126, 113–120. [Google Scholar] [CrossRef]
  64. Goswami, D.; Thakker, J.N.; Dhandhukia, P.C. Portraying mechanics of plant growth promoting rhizobacteria (PGPR): A review. Cogent Food Agric. 2016, 2, 1127500. [Google Scholar] [CrossRef]
  65. Lundberg, D.S.; Teixeira, P.J. Root-exuded coumarin shapes the root microbiome. Proc. Natl. Acad. Sci. USA 2018, 115, 5629–5631. [Google Scholar] [CrossRef] [PubMed] [Green Version]
  66. DeAngelis, K.M.; Brodie, E.L.; DeSantis, T.Z.; Andersen, G.L.; Lindow, S.E.; Firestone, M.K. Selective progressive response of soil microbial community to wild oat roots. ISME J. 2009, 3, 168–178. [Google Scholar] [CrossRef] [PubMed] [Green Version]
  67. Shi, S.; Richardson, A.E.; O’Callaghan, M.; DeAngelis, K.M.; Jones, E.E.; Stewart, A.; Firestone, M.K.; Condron, L.M. Effects of selected root exudate components on soil bacterial communities. FEMS Microbiol. Ecol. 2011, 77, 600–610. [Google Scholar] [CrossRef] [Green Version]
  68. Goldfarb, K.C.; Karaoz, U.; Hanson, C.A.; Santee, C.A.; Bradford, M.A.; Treseder, K.K.; Wallenstein, M.D.; Brodie, E.L. Differential growth responses of soil bacterial taxa to carbon substrates of varying chemical recalcitrance. Front. Microbiol. 2011, 2, 94. [Google Scholar] [CrossRef] [Green Version]
  69. Hou, J.; Liu, W.; Wang, B.; Wang, Q.; Luo, Y.; Franks, A.E. PGPR enhanced phytoremediation of petroleum contaminated soil and rhizosphere microbial community response. Chemosphere 2015, 138, 592–598. [Google Scholar] [CrossRef]
  70. Bulgarelli, D.; Schlaeppi, K.; Spaepen, S.; Van Themaat, E.V.L.; Schulze-Lefert, P. Structure and functions of the bacterial microbiota of plants. Ann. Rev. Plant. Biol. 2013, 64, 807–838. [Google Scholar] [CrossRef] [Green Version]
  71. Bulgarelli, D.; Garrido-Oter, R.; Münch, P.C.; Weiman, A.; Dröge, J.; Pan, Y.; McHardy, A.C.; Schulze-Lefert, P. Structure and function of the bacterial root microbiota in wild and domesticated barley. Cell Host Microbe 2015, 17, 392–403. [Google Scholar] [CrossRef] [Green Version]
  72. Müller, D.B.; Vogel, C.; Bai, Y.; Vorholt, J.A. The plant microbiota: Systems-level insights and perspectives. Annu. Rev. Genet. 2016, 50, 211–234. [Google Scholar] [CrossRef] [Green Version]
  73. Zhalnina, K.; Louie, K.B.; Hao, Z.; Mansoori, N.; da Rocha, U.N.; Shi, S.; Cho, H.; Karaoz, U.; Loqué, D.; Bowen, B.P. Dynamic root exudate chemistry and microbial substrate preferences drive patterns in rhizosphere microbial community assembly. Nat. Microbiol. 2018, 3, 470–480. [Google Scholar] [CrossRef] [Green Version]
  74. Hiltner, L. Über neuere erfahrungen und probleme auf dem debiete der bo denbakteriologie und unter besonderer berucksichtigung der grundund und brache. Zbl. Bakteriol. 1904, 2, 14–25. [Google Scholar]
  75. Hartmann, A.; Rothballer, M.; Schmid, M. Lorenz Hiltner, a pioneer in rhizosphere microbial ecology and soil bacteriology research. Plant Soil 2008, 312, 7–14. [Google Scholar] [CrossRef]
  76. Hiltner, L. Pflanzenschutz Nach Monaten Geordnet; Eine Anleitung für Landwirte, Gärtner, Obstbaumzüchter &c.; Eugen Ulmer: Stuttgart, Germany, 1909. [Google Scholar] [CrossRef] [Green Version]
  77. Edwards, J.A.; Santos-Medellín, C.M.; Liechty, Z.S.; Nguyen, B.; Lurie, E.; Eason, S.; Phillips, G.; Sundaresan, V. Compositional shifts in root-associated bacterial and archaeal microbiota track the plant life cycle in field-grown rice. PLoS Biol. 2018, 16, e2003862. [Google Scholar] [CrossRef] [PubMed] [Green Version]
  78. Niu, B.; Paulson, J.N.; Zheng, X.; Kolter, R. Simplified and representative bacterial community of maize roots. Proc. Natl. Acad. Sci. USA 2017, 114, E2450–E2459. [Google Scholar] [CrossRef] [Green Version]
  79. Layeghifard, M.; Hwang, D.M.; Guttman, D.S. Disentangling interactions in the microbiome: A network perspective. Trends Microbiol. 2017, 25, 217–228. [Google Scholar] [CrossRef]
  80. Buol, S.W.; Southard, R.J.; Graham, R.C.; McDaniel, P.A. Soil Genesis and Classification; John Wiley & Sons: Hoboken, NJ, USA, 2011. [Google Scholar]
  81. Vieira, S.; Sikorski, J.; Dietz, S.; Herz, K.; Schrumpf, M.; Bruelheide, H.; Scheel, D.; Friedrich, M.W.; Overmann, J. Drivers of the composition of active rhizosphere bacterial communities in temperate grasslands. ISME J. 2020, 14, 463–475. [Google Scholar] [CrossRef] [Green Version]
  82. Prasad, A.A.; Babu, S. Compatibility of Azospirillum brasilense and Pseudomonas fluorescens in growth promotion of groundnut (Arachis hypogea L.). An. Acad. Bras. Ciênc. 2017, 89, 1027–1040. [Google Scholar] [CrossRef] [Green Version]
  83. Borges, A.; Abreu, A.C.; Dias, C.; Saavedra, M.J.; Borges, F.; Simões, M. New perspectives on the use of phytochemicals as an emergent strategy to control bacterial infections including biofilms. Molecules 2016, 21, 877. [Google Scholar] [CrossRef]
  84. Khan, Z.; Roman, D.; Kintz, T.; delas Alas, M.; Yap, R.; Doty, S. Degradation, phytoprotection and phytoremediation of phenanthrene by endophyte Pseudomonas putida, PD1. Environ. Sci. Technol. 2014, 48, 12221–12228. [Google Scholar] [CrossRef]
  85. Rodríguez, H.; Fraga, R. Phosphate solubilizing bacteria and their role in plant growth promotion. Biotechnol. Adv. 1999, 17, 319–339. [Google Scholar] [CrossRef]
  86. Arora, N.K.; Verma, M.; Mishra, J. Rhizobial bioformulations: Past, present and future. In Rhizotrophs: Plant Growth Promotion to Bioremediation; Springer: Cham, Switzerland, 2017; pp. 69–99. [Google Scholar]
  87. Soltani, A.-A.; Khavazi, K.; Asadi-Rahmani, H.; Omidvari, M.; Dahaji, P.A.; Mirhoseyni, H. Plant growth promoting characteristics in some Flavobacterium spp. isolated from soils of Iran. J. Agric. Sci. 2010, 2, 106. [Google Scholar] [CrossRef] [Green Version]
  88. Mawdsley, J.L.; Burns, R.G. Inoculation of plants with a Flavobacterium species results in altered rhizosphere enzyme activities. Soil Biol. Biochem. 1994, 26, 871–882. [Google Scholar] [CrossRef]
  89. Peiffer, J.A.; Spor, A.; Koren, O.; Jin, Z.; Tringe, S.G.; Dangl, J.L.; Buckler, E.S.; Ley, R.E. Diversity and heritability of the maize rhizosphere microbiome under field conditions. Proc. Natl. Acad. Sci. USA 2013, 110, 6548–6553. [Google Scholar] [CrossRef] [PubMed] [Green Version]
  90. Shi, S.; Nuccio, E.; Herman, D.J.; Rijkers, R.; Estera, K.; Li, J.; da Rocha, U.N.; He, Z.; Pett-Ridge, J.; Brodie, E.L. Successional trajectories of rhizosphere bacterial communities over consecutive seasons. mBio 2015, 6. [Google Scholar] [CrossRef] [PubMed] [Green Version]
  91. Zhu, S.; Fen, L.; Guo, C.; Wang, T.L.; Zhang, J.; Deng, L.; Luo, K.; Xiang, L.Y.; Huang, H.; Mei, X. Negative plant-soil feedback driven by re-assemblage of the rhizosphere microbiome with the growth of Panax notoginseng. Front. Microbiol. 2019, 10, 1597. [Google Scholar]
  92. Mendes, L.W.; Kuramae, E.E.; Navarrete, A.A.; Van Veen, J.A.; Tsai, S.M. Taxonomical and functional microbial community selection in soybean rhizosphere. ISME J. 2014, 8, 1577–1587. [Google Scholar] [CrossRef]
  93. Fierer, N.; Lauber, C.L.; Ramirez, K.S.; Zaneveld, J.; Bradford, M.A.; Knight, R. Comparative metagenomic, phylogenetic and physiological analyses of soil microbial communities across nitrogen gradients. ISME J. 2012, 6, 1007–1017. [Google Scholar] [CrossRef] [Green Version]
  94. Madigan, M.T. Microbiology of nitrogen fixation by anoxygenic photosynthetic bacteria. In Anoxygenic Photosynthetic Bacteria; Springer: Cham, Switzerland, 1995; pp. 915–928. [Google Scholar]
  95. Sorokin, D.Y.; Lücker, S.; Vejmelkova, D.; Kostrikina, N.A.; Kleerebezem, R.; Rijpstra, W.I.C.; Damsté, J.S.S.; Le Paslier, D.; Muyzer, G.; Wagner, M. Nitrification expanded: Discovery, physiology and genomics of a nitrite-oxidizing bacterium from the phylum Chloroflexi. ISME J. 2012, 6, 2245–2256. [Google Scholar] [CrossRef] [Green Version]
  96. Prasanna, R.; Bidyarani, N.; Babu, S.; Hossain, F.; Shivay, Y.S.; Nain, L. Cyanobacterial inoculation elicits plant defense response and enhanced Zn mobilization in maize hybrids. Cogent Food Agric. 2015, 1, 998507. [Google Scholar] [CrossRef]
  97. Karthikeyan, N.; Prasanna, R.; Nain, L.; Kaushik, B.D. Evaluating the potential of plant growth promoting cyanobacteria as inoculants for wheat. Eur. J. Soil Biol. 2007, 43, 23–30. [Google Scholar] [CrossRef]
  98. Rai, A.N.; Bergman, B.; Rasmussen, U. Cyanobacteria in Symbiosis; Springer: Cham, Switzerland, 2002. [Google Scholar]
  99. Sharma, N.K.; Rai, A.K.; Stal, L.J. Cyanobacteria: An. Economic Perspective; John Wiley & Sons: Hoboken, NJ, USA, 2013. [Google Scholar]
  100. Prasanna, R.; Sood, A.; Rath, S.; Singh, P.K. Cyanobacteria as a green option for sustainable agriculture. In Cyanobacteria: An Economic Perspective; Wiley Online Library: London, UK, 2014; pp. 145–166. [Google Scholar]
  101. Rossi, F.; Li, H.; Liu, Y.; De Philippis, R. Cyanobacterial inoculation (cyanobacterisation): Perspectives for the development of a standardized multifunctional technology for soil fertilization and desertification reversal. Earth Sci. Rev. 2017, 171, 28–43. [Google Scholar] [CrossRef]
  102. Klatt, C.G.; Liu, Z.F.; Ludwig, M.; Kuhl, M.; Jensen, S.I.; Bryant, D.A.; Ward, D.M. Temporal metatranscriptomic patterning in phototrophic Chloroflexi inhabiting a microbial mat in a geothermal spring. ISME J. 2013, 7, 1775–1789. [Google Scholar] [CrossRef] [PubMed] [Green Version]
  103. Bateson, M.M.; Ward, D.M. Photoexcretion and fate of glycolate in a hot spring cyanobacterial mat. Appl. Environ. Microbiol. 1988, 54, 1738–1743. [Google Scholar] [CrossRef] [PubMed] [Green Version]
  104. Anderson, K.L.; Tayne, T.A.; Ward, D.M. Formation and fate of fermentation products in hot spring cyanobacterial mats. Appl. Environ. Microbiol. 1987, 53, 2343–2352. [Google Scholar] [CrossRef] [Green Version]
  105. Fierer, N.; Bradford, M.A.; Jackson, R.B. Toward an ecological classification of soil bacteria. Ecology 2007, 88, 1354–1364. [Google Scholar] [CrossRef]
  106. Lu, L.; Xing, D.; Ren, Z.J. Microbial community structure accompanied with electricity production in a constructed wetland plant microbial fuel cell. Bioresour. Technol. 2015, 195, 115–121. [Google Scholar] [CrossRef]
  107. Sellstedt, A.; Richau, K.H. Aspects of nitrogen-fixing Actinobacteria, in particular free-living and symbiotic Frankia. FEMS Microbiol. Lett. 2013, 342, 179–186. [Google Scholar] [CrossRef] [Green Version]
  108. Strap, J.L. Actinobacteria–plant interactions: A boon to agriculture. In Bacteria in Agrobiology: Plant Growth Responses; Springer: Cham, Switzerland, 2011; pp. 285–307. [Google Scholar]
  109. Hamedi, J.; Mohammadipanah, F. Biotechnological application and taxonomical distribution of plant growth promoting actinobacteria. J. Ind. Microbiol. Biotechnol. 2015, 42, 157–171. [Google Scholar] [CrossRef]
  110. Ahn, J.-H.; Song, J.; Kim, B.-Y.; Kim, M.-S.; Joa, J.-H.; Weon, H.-Y. Characterization of the bacterial and archaeal communities in rice field soils subjected to long-term fertilization practices. J. Microbiol. 2012, 50, 754–765. [Google Scholar] [CrossRef]
  111. Diamond, S.; Andeer, P.F.; Li, Z.; Crits-Christoph, A.; Burstein, D.; Anantharaman, K.; Lane, K.R.; Thomas, B.C.; Pan, C.; Northen, T.R. Mediterranean grassland soil C–N compound turnover is dependent on rainfall and depth, and is mediated by genomically divergent microorganisms. Nat. Microbiol. 2019, 4, 1356–1367. [Google Scholar] [CrossRef] [Green Version]
  112. Finkel, O.M.; Castrillo, G.; Paredes, S.H.; González, I.S.; Dangl, J.L. Understanding and exploiting plant beneficial microbes. Curr. Opin. Plant. Biol. 2017, 38, 155–163. [Google Scholar] [CrossRef] [PubMed]
  113. Pii, Y.; Mimmo, T.; Tomasi, N.; Terzano, R.; Cesco, S.; Crecchio, C. Microbial interactions in the rhizosphere: Beneficial influences of plant growth-promoting rhizobacteria on nutrient acquisition process. A review. Biol. Fertil. Soils 2015, 51, 403–415. [Google Scholar] [CrossRef]
  114. Kuypers, M.M.M.; Marchant, H.K.; Kartal, B. The microbial nitrogen-cycling network. Nat. Rev. Microbiol 2018, 16, 263–276. [Google Scholar] [CrossRef] [PubMed]
  115. Huang, P.; Xu, J.; Kloepper, J.W. Plant-microbe-soil fertility interaction impacts performance of a Bacillus-containing bioproduct on bell pepper. J. Basic Microbiol. 2020, 60, 27–36. [Google Scholar] [CrossRef] [PubMed]
  116. Fisher, K.A.; Yarwood, S.A.; James, B.R. Soil urease activity and bacterial ureC gene copy numbers: Effect of pH. Geoderma 2017, 285, 1–8. [Google Scholar] [CrossRef]
  117. Leghari, S.J.; Wahocho, N.A.; Laghari, G.M.; HafeezLaghari, A.; MustafaBhabhan, G.; HussainTalpur, K.; Bhutto, T.A.; Wahocho, S.A.; Lashari, A.A. Role of nitrogen for plant growth and development: A review. Adv. Environ. Biol. 2016, 10, 209–219. [Google Scholar]
  118. Hesheng, L. Principles and Techniques of Plant. In Physiological and Biochemical Experiments; Higher Education Press: Beijing, China, 2000. [Google Scholar]
Figure 1. (a) Quantitative curve trends of PGPR strains from day 5 to day 59, the peripheral curve represents the error (SD) line; (b) Chao and Shannon index of alpha diversity for four treatments during four stages. Significant levels: ns; * p < 0.05; ** p < 0.01, *** p < 0.001.
Microorganisms 09 00161 g001
Figure 2. Differences in the abundance of gene ureC among treatments as based on Tukey’s HSD test, p values (** p < 0.01, *** p < 0.001)
Microorganisms 09 00161 g002
Figure 3. (a) Taxonomic comparison with relative abundance at the phylum level under the four treatments during four plant growth stages; (b) Change in the relative abundance of Pseudomonadaceae under the four treatments during four plant growth stages; (c) Change in the relative abundance of Flavobacteriaceae under the four treatments during four plant growth stages; (d) Change in the relative abundance of Rhizobiaceae under the four treatments during four plant growth stages.
Microorganisms 09 00161 g003
Figure 4. (a) Non-metric multidimensional scaling (NMDS) analysis of bacterial community structure under four treatments during four plant growth stages. Ellipses in the plots denote 95% confidence intervals for the centroids of different treatments. NMDS analysis is shown along two primary dimension-reduced axes. Axes were determined by non-metric multidimensional scaling and are presented in Bray-Curtis dissimilarity units. Colors indicate the treatment; (b) Bipartite association network, the large nodes represent different treatment groups, the small nodes represent unique OTUs belong to each treatment, the color represents the OTUs shown in the legend and the small gray nodes represent the common OTUs.
Microorganisms 09 00161 g004
Figure 5. Networks at the genus level. The size of each node is proportional to the abundance of the genus it represents. Node color corresponds to phylum-level taxonomic classification. Edge color represents positive (green) and negative (red) interactions. Genera classified as (1) Chloroflexi; (2) Pseudomonas; (3) Flavobacterium; (4) Cyanobacteria; and (5) Rhizobium.
Microorganisms 09 00161 g005
Table 1. Quantification PCR primers of the PGPR.
SpeciesPrimer SequenceOriginPCR ProductReference
S. rhizophilaTCTCAACCTGGGTACCGTAATArpfX87-bpThis study
AGATGTCCAGGCAACAGTTC
R. sphaeroidesGCCTCGGCCAAGACCAACCgyr B250-bp[51]
GCTCGCCGGTGATGAAGATGGG
B. amyloliquefaciensTGGCGCCATGAGAATCCTpgs B66-bp[50]
GCAAAGCCGTTTACGAAATGA
_CAGACCGACGTGTGCGAAAGnxrA320-bp[52]
TCCACAAGGAACGGAAGGTC
_AAAGGYGGWATCGGYAARTCCACCACnifH457-bp[53]
TTGTTSGCSGCRTACATSGCCATCAT
_TGGGCCTTAAAATHCAYGARGAYTGGGuerC327-bp[54]
GGTGGTGGCACACCATNANCATRTC
Table 2. Data and comparison of physicochemical parameters of plants from the four treatments.
PlantsStatistics §
SrRsBaCKSr vs. CKRs vs. CKBa vs. CK
Chlorophyll #42.78 ± 1.1439.59 ± 0.8745.66 ± 1.2742.29 ± 0.96nsnsns
Biomass (g) 1.17 ± 0.071.35 ± 0.111.35 ± 0.071.08 ± 0.09nsnsns
Soluble starch (mg.g−1) 11.22 ± 0.329.89 ± 0.2812.32 ± 0.1510.18 ± 0.95nsnsns
Soluble protein (mg.g−1) 24.25 ± 0.3022.59 ± 0.5426.47 ± 0.1721.92 ± 0.42 Microorganisms 09 00161 i001 *ns Microorganisms 09 00161 i001 **
Vitamin C (mg.g−1) 0.43 ± 0.020.42 ± 0.030.43 ± 0.020.47 ± 0.02nsnsns
TC (g.kg−1) 301.51 ± 0.80271.67 ± 3.59300.65 ± 0.65306.78 ± 1.55ns*** Microorganisms 09 00161 i002ns
TN (g.kg−1) 53.30 ± 1.5964.11 ± 0.5666.93 ± 3.0247.86 ± 0.13 Microorganisms 09 00161 i001 ** Microorganisms 09 00161 i001 *** Microorganisms 09 00161 i001 ***
TS (g.kg−1) 9.68 ± 0.1010.40 ± 0.1010.95 ± 0.2510.79 ± 0.35nsnsns
# Values are mean ± SE; n = 30. Values are mean ± SE; n = 3. § HSD test. Significant levels: ns: p > 0.05; * p < 0.05; ** p < 0.01; *** p < 0.001. Microorganisms 09 00161 i001 represents increase, Microorganisms 09 00161 i002 represents decrease.
Table 3. Comparison of bulk and rhizosphere soil chemical and physical properties from the four treatments on day 59.
SrRsBaCKStatistics §
RhizosphereBulk SoilRhizosphereBulk SoilRhizosphereBulk SoilRhizosphereBulk SoilSr Rhizosphere vs. BulkRs Rhizosphere vs. BulkBa Rhizosphere vs. BulkCK Rhizosphere vs. BulkSr vs. CK rhizosphereRs vs. CK rhizosphereBa vs. CK rhizosphere
pH 7.71 ± 0.137.50 ± 0.097.67 ± 0.137.52 ± 0.057.55 ± 0.107.30 ± 0.157.49 ± 0.037.45 ± 0.03nsnsnsnsnsnsns
Ca
(mg.g−1)
2923.44 ± 17.422775.27 ± 34.633020.09 ± 55.993031.11 ± 41.292697.36 ± 30.483138.69 ± 48.923159.29 ± 37.363218.87 ± 20.09nsns*** Microorganisms 09 00161 i002ns* Microorganisms 09 00161 i002ns*** Microorganisms 09 00161 i002
Mg (mg.g−1) 684.41 ± 20.36589.71 ± 23.29828.84 ± 38.11909.06 ± 12.27559.76 ± 23.44850.69 ± 28.21816.57 ± 29.05855.39 ± 10.84nsns*** Microorganisms 09 00161 i002ns** Microorganisms 09 00161 i002ns*** Microorganisms 09 00161 i002
Fe
(mg.g−1)
2251.47 ± 16.432312.01 ± 17.512419.31 ± 58.832422.01 ± 33.972124.92 ± 38.912473.94 ± 33.772365.15 ± 24.42473.95 ± 8.06nsns*** Microorganisms 09 00161 i002nsnsns*** Microorganisms 09 00161 i002
Mn (mg.g−1) 59.44 ± 0.3160.16 ± 0.2864.72 ± 2.7562.36 ± 0.6755.32 ± 1.0262.92 ± 0.3763.05 ± 0.9665.15 ± 1.22nsns** Microorganisms 09 00161 i002nsnsns** Microorganisms 09 00161 i002
Al
(mg.g−1)
1021.41 ± 10.44968.59 ± 5.581032.47 ± 9.911028.72 ± 7.6999.21 ± 7.971048.67 ± 6.381018.19 ± 7.391035.32 ± 3.6 Microorganisms 09 00161 i001 ***ns** Microorganisms 09 00161 i002nsnsnsns
K (mg.g−1) 1784.97 ± 17.71622.75 ± 15.681917.26 ± 41.161790.56 ± 21.411728.42 ± 49.491838.31 ± 19.791839.89 ± 18.981878.54 ± 13.7 Microorganisms 09 00161 i001 ** Microorganisms 09 00161 i001 *nsnsnsnsns
P (mg.g−1) 250.85 ± 3.93201.7 ± 6.12280.34 ± 17.47242.94 ± 7.69211.48 ± 10.01188.09 ± 9.17202.21 ± 6.57168.02 ± 1.7 Microorganisms 09 00161 i001 **nsnsns Microorganisms 09 00161 i001 * Microorganisms 09 00161 i001 ***ns
NH4+ (mg.kg−1) 20.94 ± 2.633.65 ± 0.0812.95 ± 1.523.69 ± 0.3611.21 ± 1.224.62 ± 0.1225.79 ± 1.084.47 ± 0.1 Microorganisms 09 00161 i001 *** Microorganisms 09 00161 i001 *** Microorganisms 09 00161 i001 * Microorganisms 09 00161 i001 ***ns* Microorganisms 09 00161 i002** Microorganisms 09 00161 i002
NO3 (mg.kg−1) 146.92 ± 3.3790.26 ± 2.48115.48 ± 7.99107.74 ± 16.5890.43 ± 6.00146.34 ± 13.17156.09 ± 4.99149.84 ± 3.37 Microorganisms 09 00161 i001 **ns** Microorganisms 09 00161 i002nsns** Microorganisms 09 00161 i002* Microorganisms 09 00161 i002
TC
(g.kg−1)
21.51 ± 0.8220.42 ± 0.328.53 ± 2.922.26 ± 0.3320.99 ± 0.5320.8 ± 0.2723.85 ± 0.4619.73 ± 0.54ns Microorganisms 09 00161 i001 **nsnsnsnsns
TN
(g.kg−1)
1.45 ± 0.091.35 ± 0.042 ± 0.221.6 ± 0.071.43 ± 0.071.48 ± 0.061.51 ± 0.140.98 ± 0.15nsnsnsnsnsnsns
TS (g.kg−1) 0.33 ± 0.020.52 ± 0.020.41 ± 0.050.57 ± 0.020.32 ± 0.020.44 ± 0.030.33 ± 0.020.41 ± 0.03*** Microorganisms 09 00161 i002** Microorganisms 09 00161 i002* Microorganisms 09 00161 i002nsnsnsns
Values are mean ± SE; n = 6. § HSD test. Significant levels: ns: p > 0.05; * p < 0.05; ** p < 0.01; *** p < 0.001. Microorganisms 09 00161 i001 represents increase, Microorganisms 09 00161 i002 represents decrease.
Publisher’s Note: MDPI stays neutral with regard to jurisdictional claims in published maps and institutional affiliations.

