Article

Multi-Omics Reveals the Inhibition of Lactiplantibacillus plantarum CCFM8724 in Streptococcus mutans-Candida albicans Mixed-Species Biofilms

1
State Key Laboratory of Food Science and Technology, Jiangnan University, Wuxi 214122, China
2
School of Food Science and Technology, Jiangnan University, Wuxi 214122, China
3
(Yangzhou) Institute of Food Biotechnology, Jiangnan University, Yangzhou 225004, China
4
National Engineering Research Center for Functional Food, Jiangnan University, Wuxi 214122, China
*
Author to whom correspondence should be addressed.
These authors contributed equally to this work.
Submission received: 27 October 2021 / Revised: 12 November 2021 / Accepted: 13 November 2021 / Published: 16 November 2021

Abstract

:
Lactiplantibacillus plantarum CCFM8724 is a probiotic with the potential to prevent dental caries in vitro and in vivo. To explore the effects of this probiotic at inhibiting Streptococcus mutans-Candida albicans mixed-species biofilm and preventing dental caries, multi-omics, including metabolomics and transcriptomics, was used to investigate the regulation of small-molecule metabolism during biofilm formation and the gene expression in the mixed-species biofilm. Metabolomic analysis revealed that some carbohydrates related to biofilm formation, such as sucrose, was detected at lower levels due to the treatment with the L. plantarum supernatant. Some sugar alcohols, such as xylitol and sorbitol, were detected at higher levels, which may have inhibited the growth of S. mutans. In transcriptomic analysis, the expression of the virulence genes of C. albicans, such as those that code agglutinin-like sequence (Als) proteins, was affected. In addition, metabolomics coupled with a Kyoto Encyclopedia of Genes and Genomes (KEGG) pathway analysis and RNA-seq revealed that the L. plantarum supernatant had an active role in sugar metabolism during the formation of the S. mutans-C. albicans mixed-species biofilm, and the L. plantarum supernatant was also related to carbohydrate utilization, glucan biosynthesis, and mycelium formation. Hence, L. plantarum CCFM8724 decreased the mixed-species biofilm mass from the perspective of gene expression and metabolic reprogramming. Our results provide a rationale for evaluating L. plantarum CCFM8724 as a potential oral probiotic for inhibiting cariogenic pathogen biofilm formation and improving dental caries.

1. Introduction

Dental caries, which is one of the most prevalent oral bacterial infectious diseases, represent a significant public health problem, not only in adults, but also in children [1]. Streptococcus mutans and Candida albicans have been detected in large amounts in oral plaque biofilms in children with early childhood caries (ECC), being considered to be directly related to ECC [2]. S. mutans is a key contributor to pathogenic dental biofilms, which can convert dietary sucrose into dextrans and acid [3]. C. albicans can robustly interact with S. mutans and has a significant impact on the virulence of dental plaque biofilms [4]. Common mechanical measures, such as tooth-brushing and mouth-washing, are effective in removing dental plaque biofilms; however, many children are not willing to brush their teeth. Probiotics and probiotic products, such as Lactobacillus salivarius [5] and L. paracasei NTU 101 fermented skim soy milk [6], can be used to remove biofilms in children. A major concern regarding the use of probiotics is the difficulty in maintaining their viability during shelf life. It seems that using the cell-free supernatants of probiotics can solve this problem.
At present, there is experimental evidence of the inhibition of dental plaque biofilms by Lactobacillus spp. L. salivarius inhibits S. mutans and C. albicans double-species caries biofilms by decreasing the amount of caries pathogenic species and reducing the biofilm mass in vitro [5]. Another study indicated that after taking a probiotic drink containing L. casei strain Shirota for 28 days, the abundance of Veillonella and Kingella increased significantly, while the abundance of some other bacteria related to caries was decreased in the oral cavity of young adults, as shown by the 16S rRNA sequencing results [7]. Different probiotic strains may prevent caries via different mechanisms, including the inhibition of cariogenic bacteria growth [8] and pathogenesis, exopolysaccharide (EPS) production reduction [9], quorum sensing inhibition [10], and reduction of the expression of key metabolic and virulence genes [11]. In our previous studies [12,13], we evaluated the anti-biofilm effects of L. plantarum CCFM8724 by reducing the dual-species biofilm mass and decreasing the caries score in dental caries rat models. However, how the L. plantarum CCFM8724 cell-free supernatant affects this cariogenic S. mutans and C. albicans mixed-species biofilm environment and how it affects the biofilm metabolome and transcriptome remains unclear.
To explore the mechanism of extracellular probiotic metabolites of L. plantarum CCFM8724 inhibiting dual-species biofilms, we employed a combination strategy using untargeted metabolomics and transcriptomics, revealing the distinct metabolism and gene expression characteristics that are important for S. mutans and C. albicans mixed-species biofilm formation. This work reveals the mechanism of microbe–microbe interaction and provides promising baseline information for the potential use of this probiotic.

2. Materials and Methods

2.1. Chemicals and Materials

Methanol (high-performance liquid chromatography (HPLC) grade) and acetonitrile (HPLC grade) used for metabolite extraction were purchased from Merck KGaA (Darmstadt, Germany). Pyridine, N-methyl-N-(tri-methylsilyl) trifluoroacetamide with 1% trimethylchlorosilane (MSTFA + 1% TMCS) and methoxyamine hydrochloride (MeOX) used for metabolite derivatization were obtained from Sigma-Aldrich (St. Louis, MO, USA).

2.2. Bacterial Strains and Growth Conditions

L. plantarum CCFM8724 was cultured in MRS broth (DifcoTM, Detroit, MI, USA) under anaerobic conditions at 37 °C for 24 h. The supernatant was collected by centrifugation at 6000× g at 4 °C for 10 min and filtered through a 0.22 μm sterile membrane, then stored at 4 °C before use. S. mutans ATCC 25175 and C. albicans ATCC18804 were purchased from the China General Microbiological Culture Collection Center (CGMCC, Beijing, China). S. mutans was inoculated in tryptic soy broth (TSB, DifcoTM, Detroit, MI, USA) and C. albicans was cultured by yeast extract peptone dextrose medium (YPD, DifcoTM, Detroit, MI, USA) under aerobic conditions at 37 °C. When generating the dual-species biofilm, 5% sucrose was added to the medium.

2.3. Sample Preparation for Metabolomics and Transcriptomics Analysis

For each replicate, 75 μL of S. mutans culture suspension and equal C. albicans culture suspension were added into each well of a 96-well microtiter plate. The number of S. mutans and C. albicans per well was 107 and 106 CFU mL−1, respectively. A total of 50 μL of Lactobacillus supernatant was added at the same time. The same volume of MRS broth instead of supernatant was used as control. Biofilms were formed in a 96-well microtiter plate for 24 h at 37 °C. Then, the contents of each well were removed and washed twice with phosphate buffer saline (PBS) to remove the planktonic cells. Next, the biofilm was scraped by using 200 μL non-enzyme pipette tips and finally pooled together to collect approximately 50 mg of biofilm mass for metabolite extraction and RNA-seq analysis [14]. After quick freezing in liquid nitrogen, the frozen cells were stored at −80 °C for further use. Metabolomics samples from each group had 6 replicates. Transcriptomics samples from each group had 2 replicates.

2.4. Untargeted Metabolomics by Gas Chromatography–Mass Spectrometry

The frozen sample was added with 0.4 mL ice-cold extraction solvent (acetonitrile:methanol:water) = 2:2:1(v/v/v). A total of 20 μL of ethyl undecanoate (C21:0) (0.3 μmol/sample) and 100 μL of magnetic beads were added into each sample before extraction. The C21:0 was used as an internal standard. The mixture was homogenized in a ball mill for 45 sec at 65 Hz and stopped for 15 s [15]. The homogenisation cycle was performed ten times. The mixture was then centrifuged at 12,000× g for 15 min at 4 °C. The supernatant of the extracts was dried in a vacuum centrifuge (RC1022, Thermos, Waltham, MA, USA) and resuspended in MeOX-pyridine and MSTFA with 1% TMCS for derivatization. For each group, six parallel experiments were completed [16].
GC–MS (Gas chromatography–mass spectrometry) analysis was performed on a Thermo trace 1310 gas chromatograph coupled to an Thermo TSQ8000_evo quadrupole mass selective detector equipped with an RTX-5MS capillary column (0.25 mm diameter, 0.25 μm film thickness). The detection and metabolite identification using metabolomics were performed as the methods described by Lu [16]. Briefly, the derivatized extract (1 μL) was injected into the GC–MS system in split mode (split ratio 10). The initial GC oven temperature rose from 50 °C to 230 °C at 5 °C/min, then to 320 °C at a rate of 90 °C/min and held for 5 min. The MS was operated in a scan range of 33 to 600 m/z. The transfer line and ion source temperatures were 280 °C and 300 °C, respectively. The electron impact mode was operated at 70 eV.
The obtained data of GC–MS were analysed as followed. ABF converter 4.0 was used to convert “raw” format files into “abf” format. The MSDIAL3.48 equipped with the FiehnLib database was used for raw peaks exaction, retention time adjustment, peak alignment, deconvolution analysis, and peak identification as reported in a previous study [17]. Statistical analysis and pathway enrichment analysis were performed using MetaboAnalyst 5.0 online software (https://www.metaboanalyst.ca/, accessed on 13 October 2021).

2.5. RNA Extraction and Illumine Sequencing

Total RNAs were isolated from frozen biofilms using TRIzol (Thermo Fisher Scientific, Shanghai, China) and the DNA-free kit (Ambion (Thermo Fisher Scientific), Shanghai, China). Purity and concentration of RNAs were checked using the NanoPhotometer® spectrophotometer (IMPLEN, Westlake Village, CA, USA), and Qubit® RNA assay kit in Qubit® 2.0 Flurometer (Life Technologies, Carlsbad, CA, USA). Library preparation for strand-specific transcriptome sequencing and RNA-seq were performed by Novogene (Tianjin, China). Briefly, the library of each sample was generated by 1 μg of RNA and then sequenced using the Illumina Hiseq platform (125 bp/150 bp paired-end reads). Raw data were processed by custom Perl scripts to obtain the clean data. The clean reads were mapped to the S. mutans reference genome (https://0-www-ncbi-nlm-nih-gov.brum.beds.ac.uk/genome/?term=ATCC+25175 accessed on 13 October 2021) and C. albicans reference genome (accessed on 13 October 2021, https://0-www-ncbi-nlm-nih-gov.brum.beds.ac.uk/genome/?term=Candida+albicans) using the Hisat2 software program with default parameters. On the basis of the clean data, the edgeR package was adopted to identify differentially expressed genes (DEGs) using the following criteria: adjusted p value < 0.05 and log2FC > 1. DEGs were subjected to a Kyoto Encyclopedia of Genes and Genomes (KEGG) pathway analysis [18]. Each group had 2 replicates.

2.6. DNA Extraction and RT-qPCR

DNA was extracted from the biofilm according to the protocol in FastDNA SPIN Kit for Soil 50T (MP Biomedicals, California, USA). Quantitative real-time PCR (qPCR) was performed according to the protocol provided by iTaq™ Universal SYBR®Green Supermix (Bio-Rad Laboratories, Inc., Shanghai, China), in a CFX ConnectTM real-time system (Bio-Rad Laboratories, Inc.). From the real-time PCR data, Cq values were obtained to calculate each organism abundances. RT-qPCR primers are listed in Table S1.

2.7. Comparative Genomics and Enzyme Analysis

The OrthoMCL software program was used for the homologous gene analysis. Open reading frames in the genome were predicted to obtain the amino acid sequence of enzymes based on the Clusters of Orthologous Groups of protein (COGs) and KEGG databases. The HMMER3.1 software program was used to predict from amino acid sequences aligned to the Carbohydrate active enzymes database (CAZy).

2.8. MultiStatistical Analysis and Visualization

R studio 4.0.1 with the R-packages ggplot2 and ggsci was used to visualize the results. The differences in this research between groups were determined by a t-test. In the metabonomic analysis, a p value < 0.05 indicated statistical significance. In pathway enrichment, a false discovery rate (FDR) analysis was performed to adjust the p value to q value. A q value < 0.05 indicated statistical significance.

3. Results

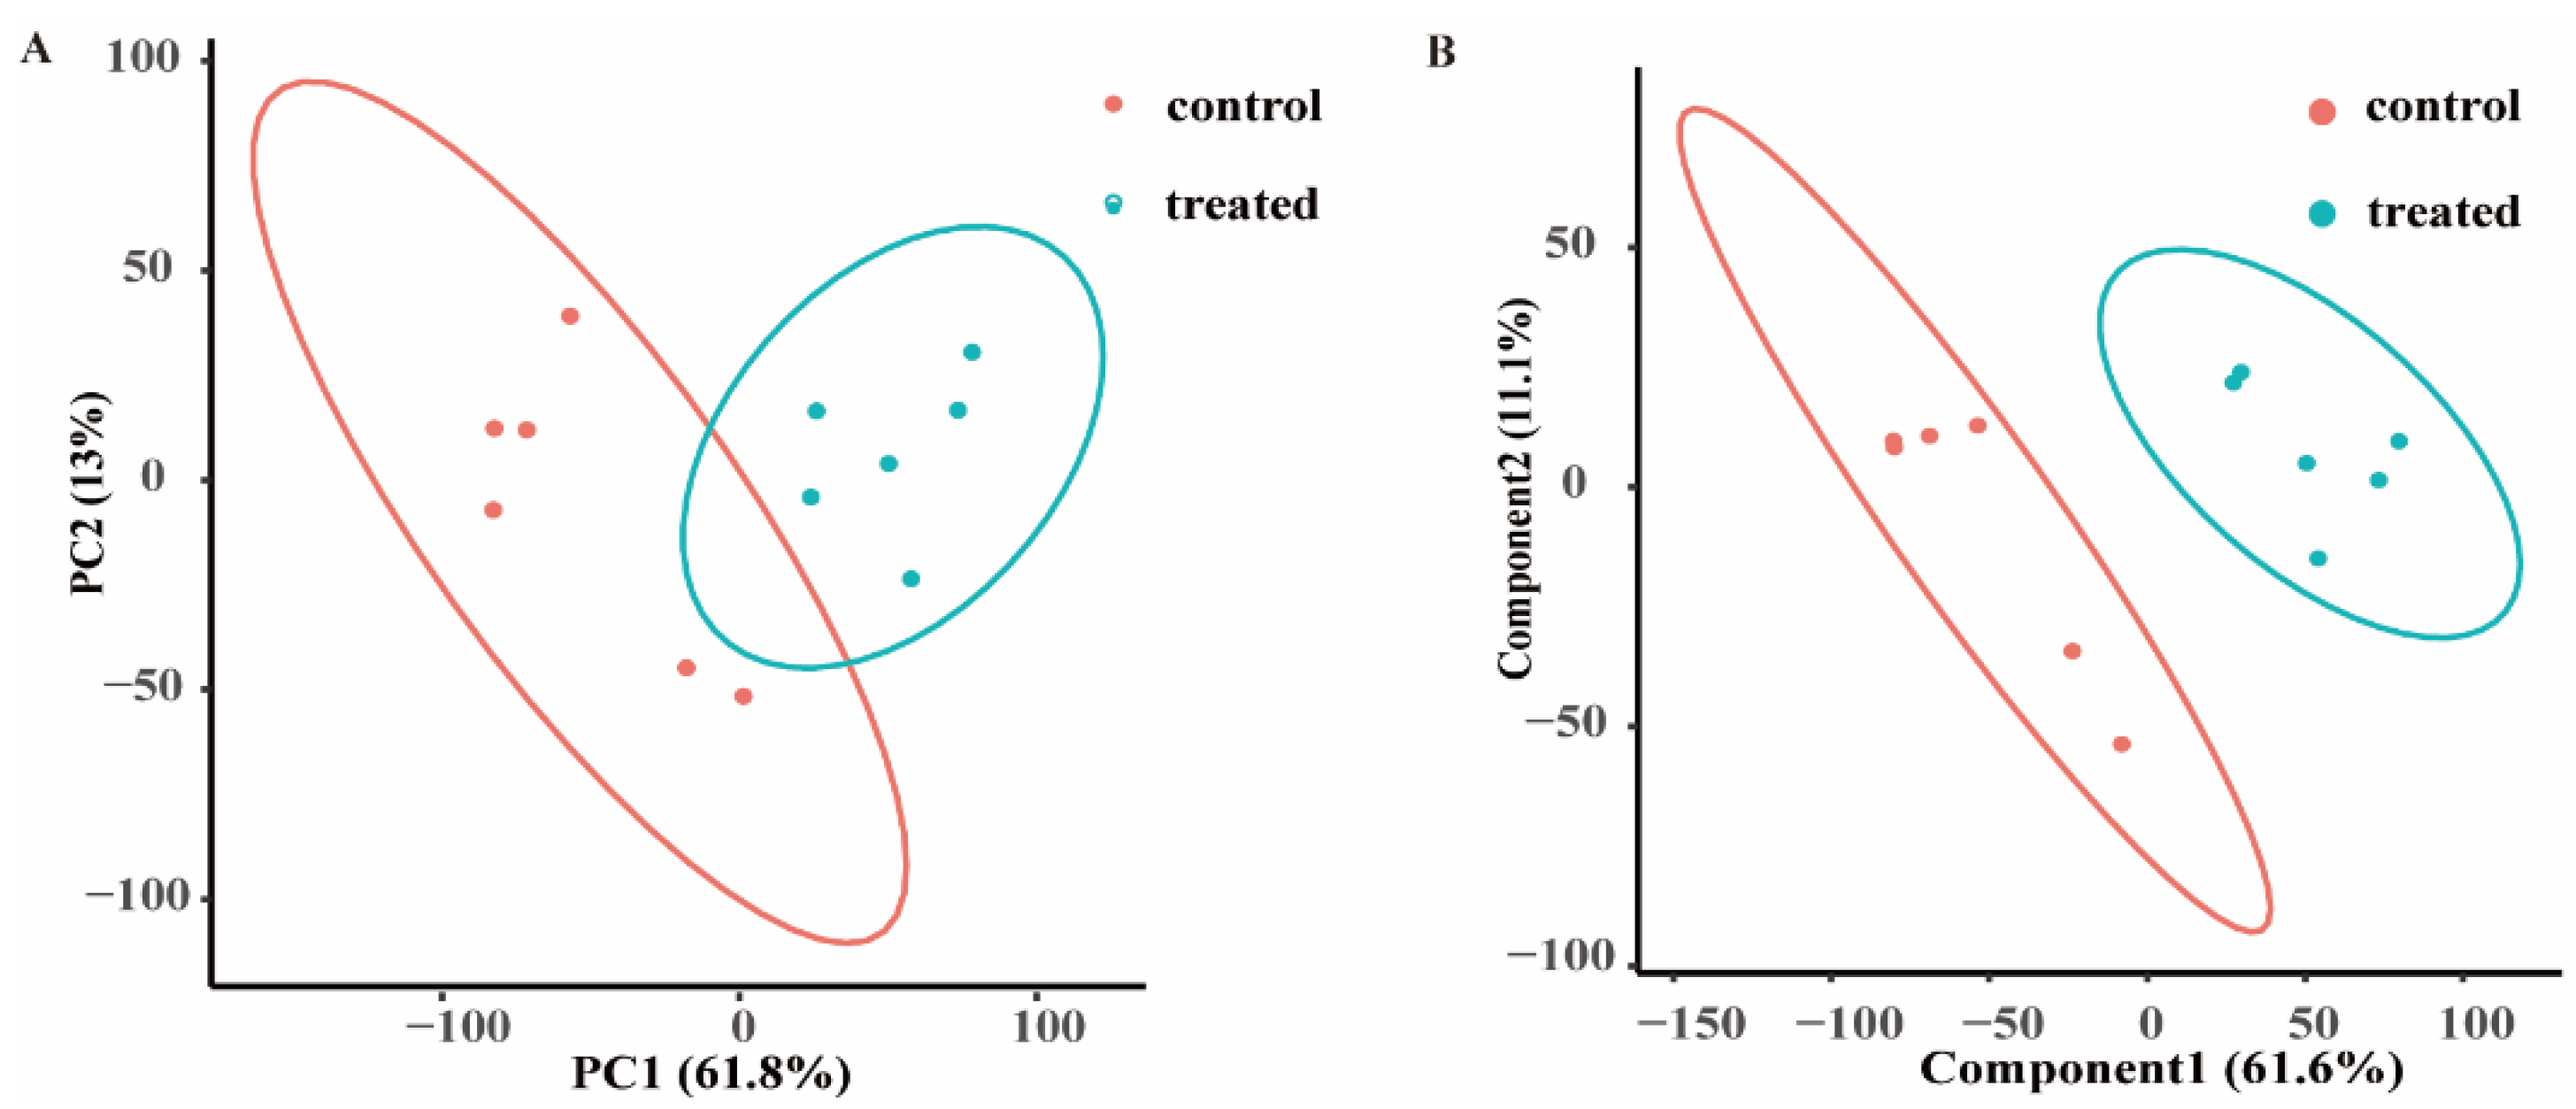
3.1. Analysis of Untargeted Metabolomic PCA and PLS-DA Data

Untargeted metabolomics is an omics method in systems biology, via which the changes in all small-molecule metabolites between groups, which can reflect the different biological processes in cells, are analysed [14]. Metabolites with high-quality peak signals were collected to obtain reliable metabolome data (Table S2). Mixed-species biofilms were treated with L. plantarum supernatant or MRS broth and were subjected to untargeted metabolomics to determine the effect of small molecules in L. plantarum in the biofilm formation. We first used principal component analysis (PCA) to visualize the metabolomic similarities of the samples in a group and the differences in samples between groups. PCA can project complex GC–MS data into a lower dimensional space, and the biofilm samples marked with different colours were projected onto a two-dimensional space (principal components 1 and 2 (PC1 and PC2)), and clustered separately. PC1 and PC2 were responsible for 61.8% and 13% of the variation, respectively, indicating that the two groups could be distinguished based on their metabolic compounds (Figure 1A).
Similar to PCA, partial least squares discriminant analysis (PLS-DA) is a supervised extension of PCA that can clearly separate different groups of data [14]. The score plot (Figure 1B) that resulted from the PLS-DA overview of the biofilm metabolome data revealed that intracellular small-molecule metabolism was significantly changed by the treatment with L. plantarum.

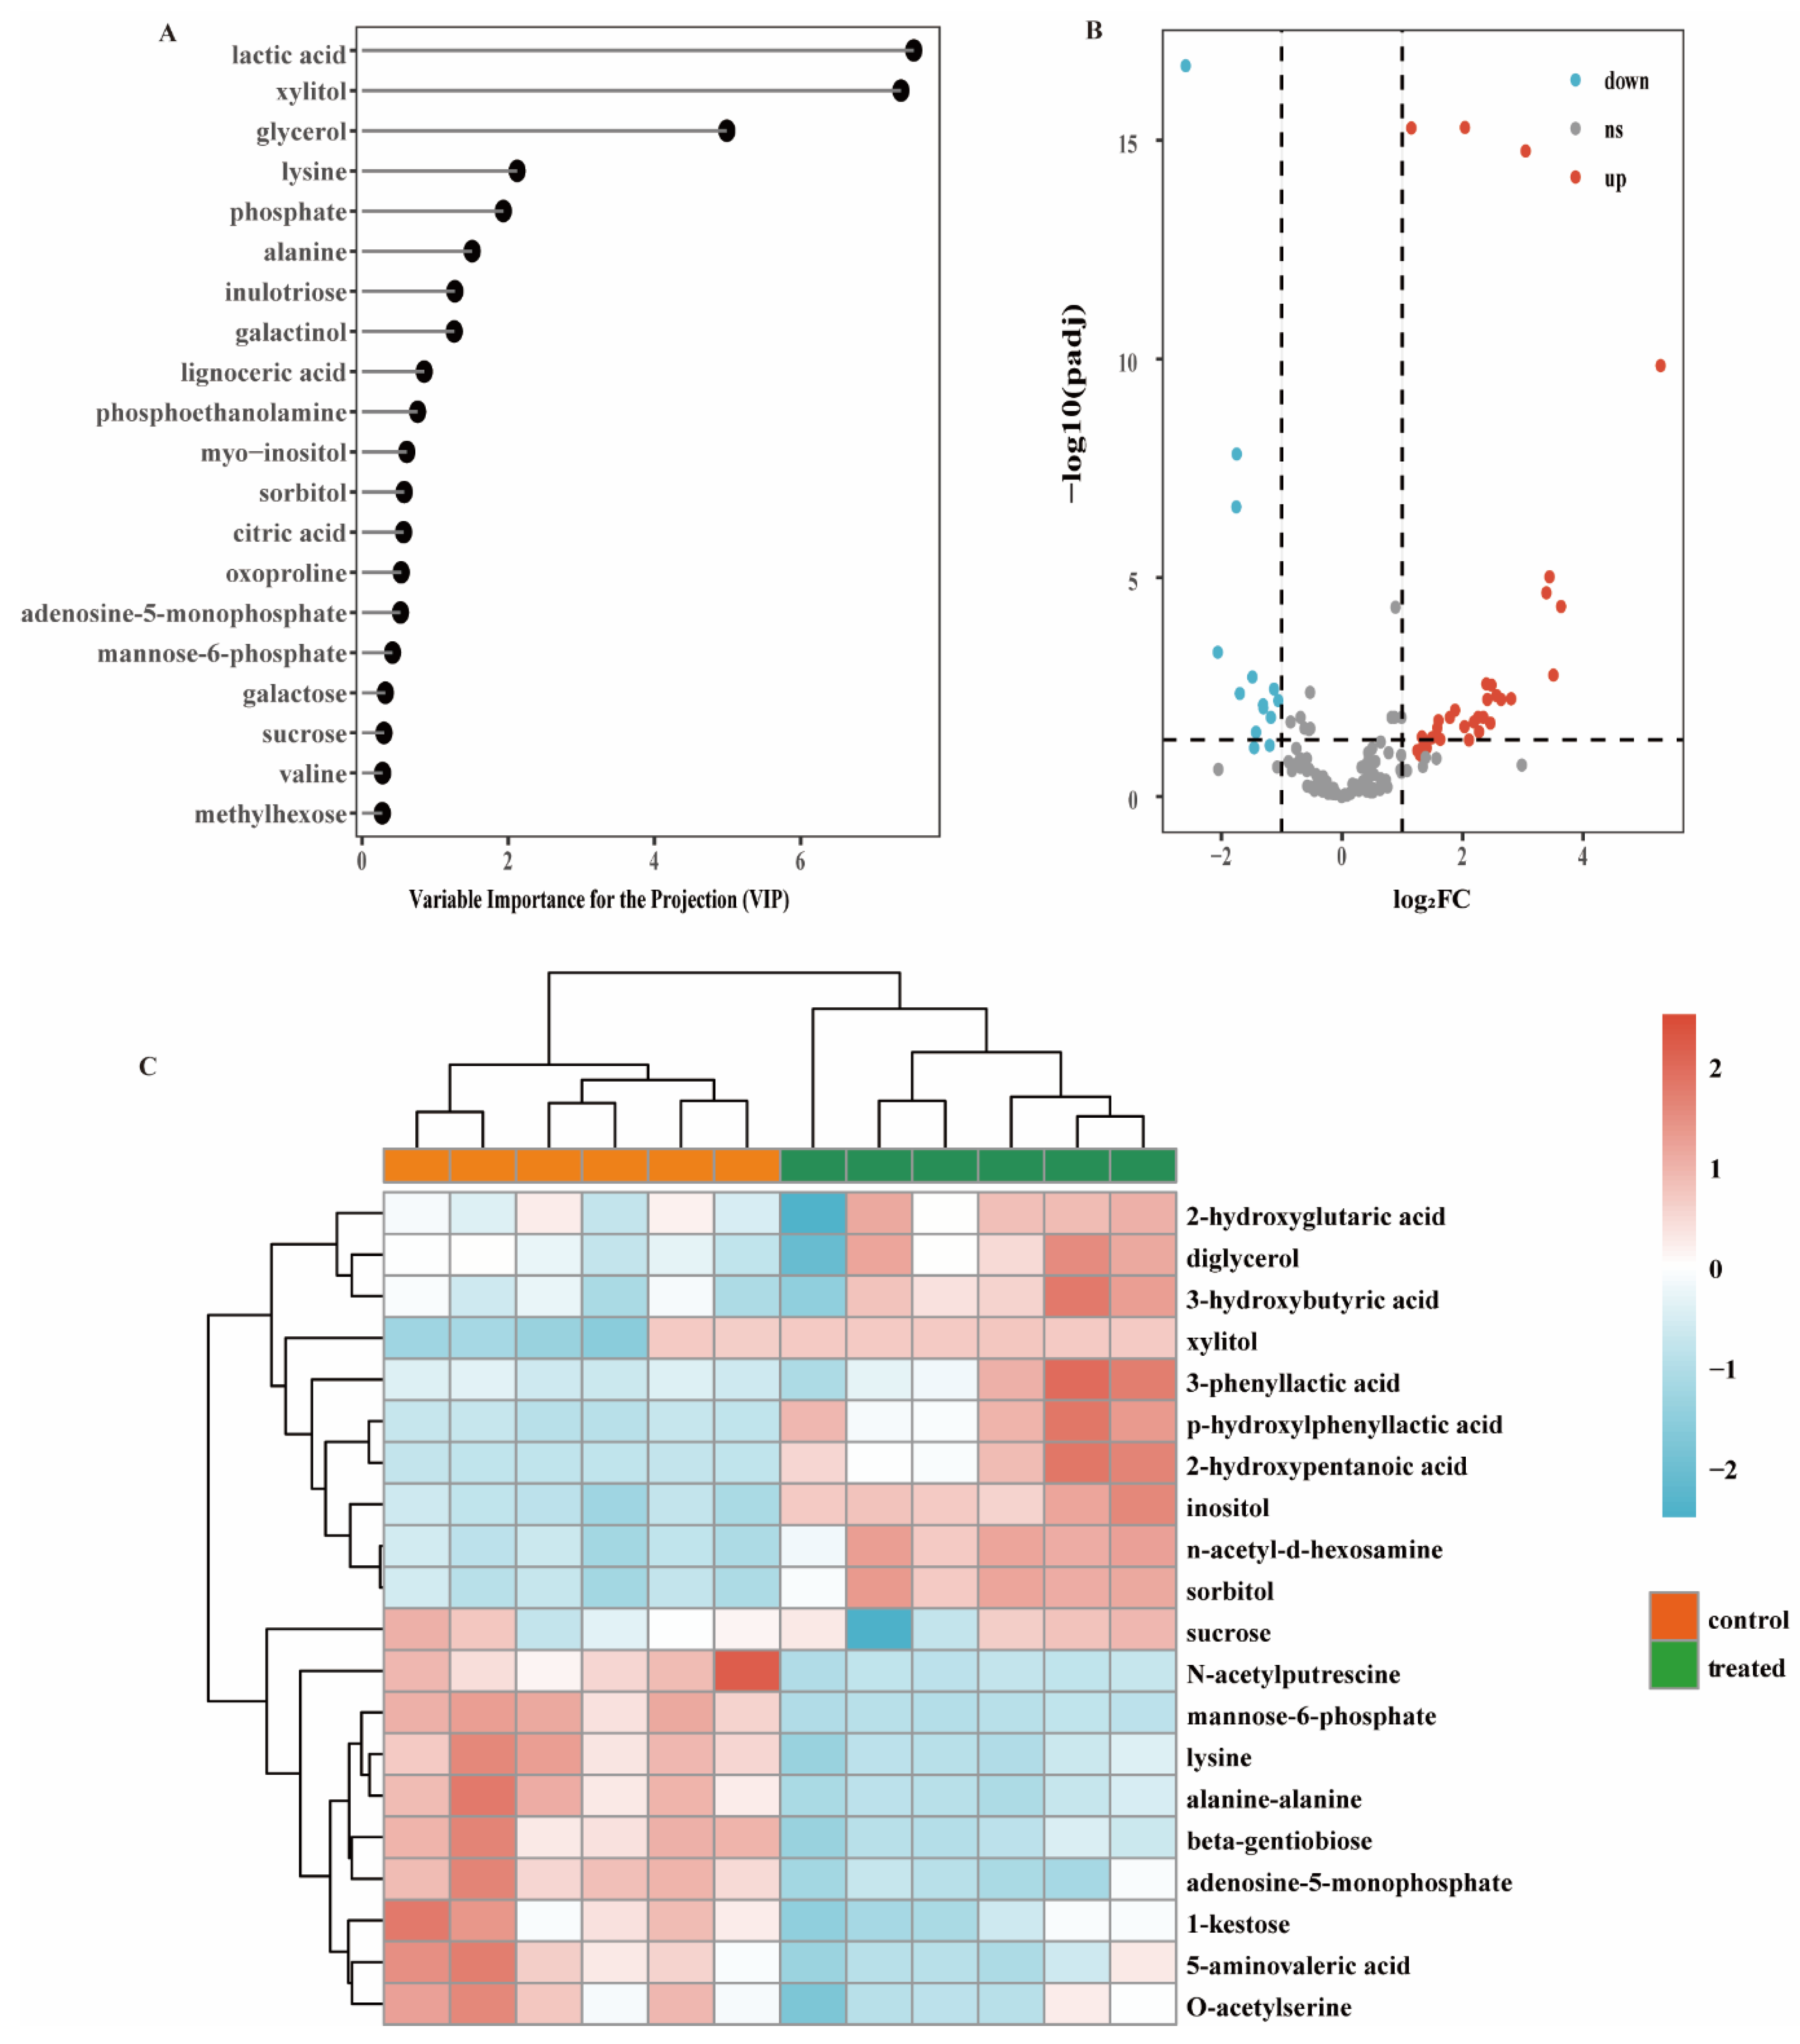
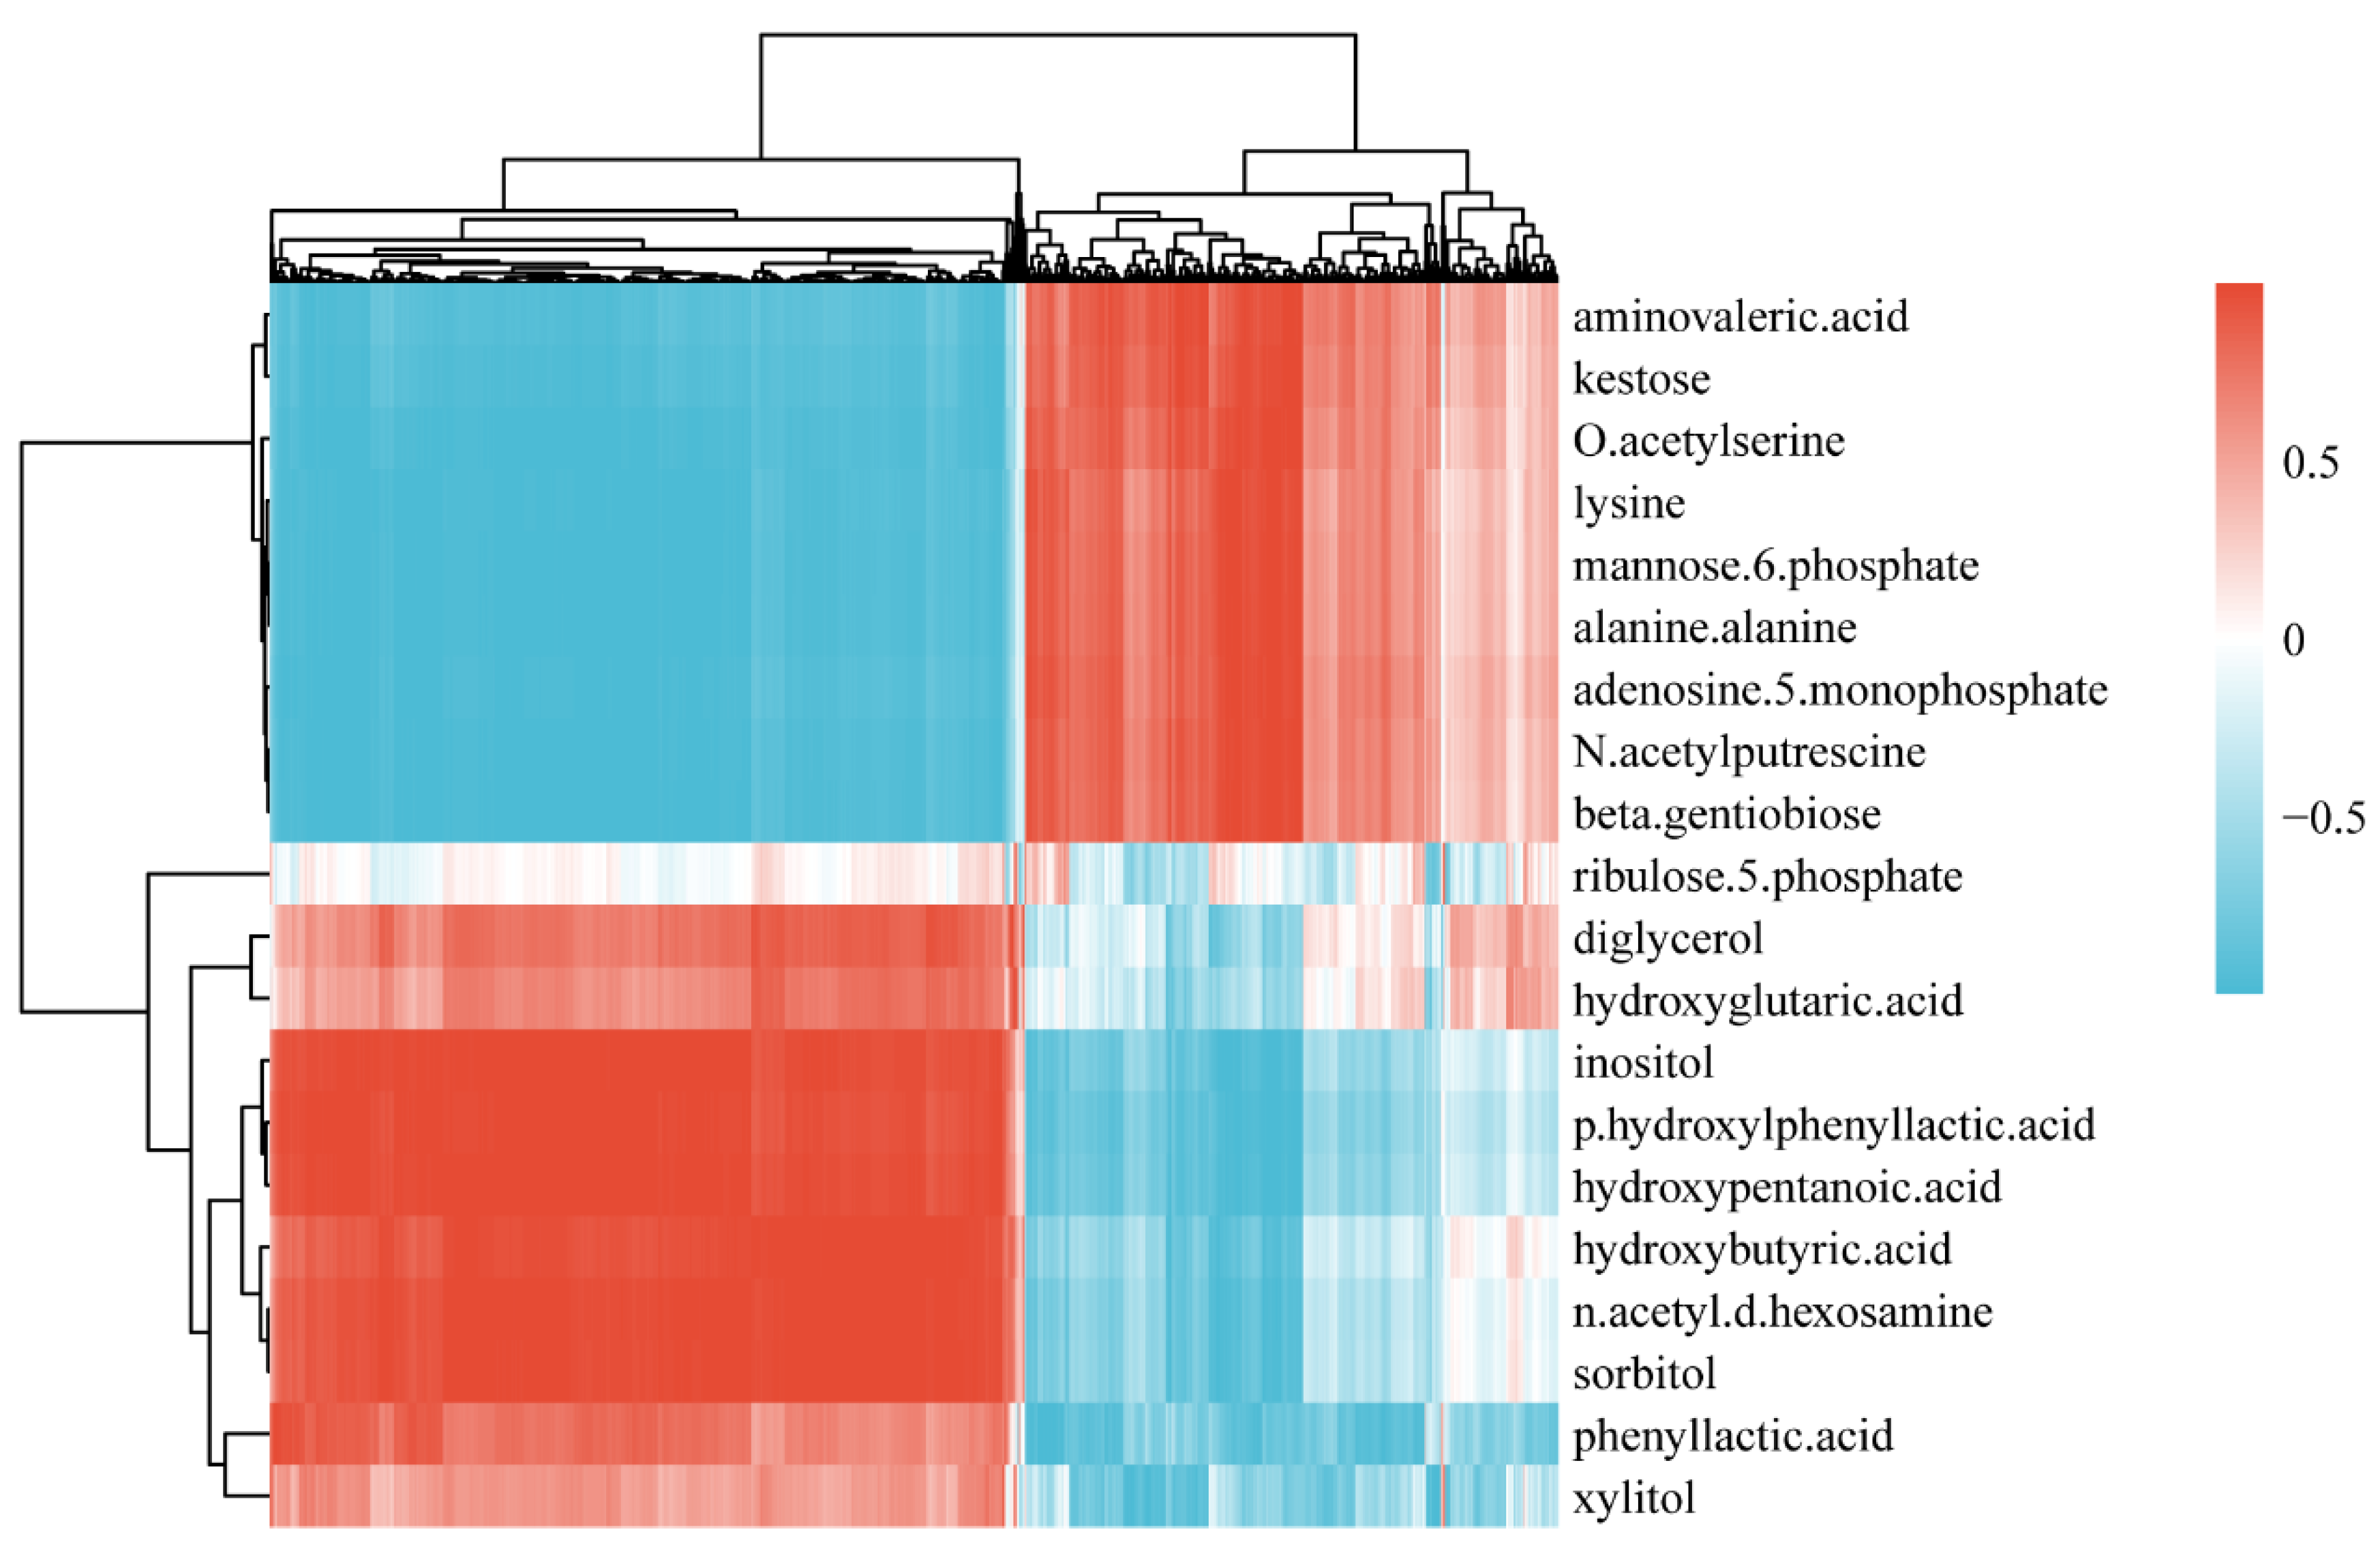
3.2. Differential Metabolites via Biofilm Profiling Analysis

Collectively, the data analysis of the biofilm metabolites yielded 216 metabolites. In the PLS-DA models, metabolites with a variable importance for the projection (VIP) value greater than 1 made a significant contribution to the separation between the control and treatment groups [19]. The VIP plots (Figure 2A) demonstrated that some of the identified metabolites contributed to class separation.
The DEseq statistical method was used to identify the significant differences between groups. Overall, 45 metabolites were identified (p < 0.05, log2(fold change (FC)) > 1). As shown in Figure 2B, 14 metabolites were downregulated (blue dots, p < 0.05, log2FC ≤ −1), 31 metabolites were upregulated (red dots, p < 0.05, log2FC ≥ 1), and the others were non-differentially expressed (grey dots, p > 0.05 or −1 < log2FC < 1). To display the differences in the metabolite content and the similarities in mixed-species biofilms, only the significantly changed metabolites (top 20) were selected to construct a heatmap (Figure 2C). Some sugars, such as sucrose, mannose-6-phosphate, and 1-kestose are potential metabolites resulting from the formation of S. mutans-C. albicans mixed-species biofilm. Some organic acids, such as 3-phenyllactic acid and p-hydroxylphenyllactic acid, were upregulated.

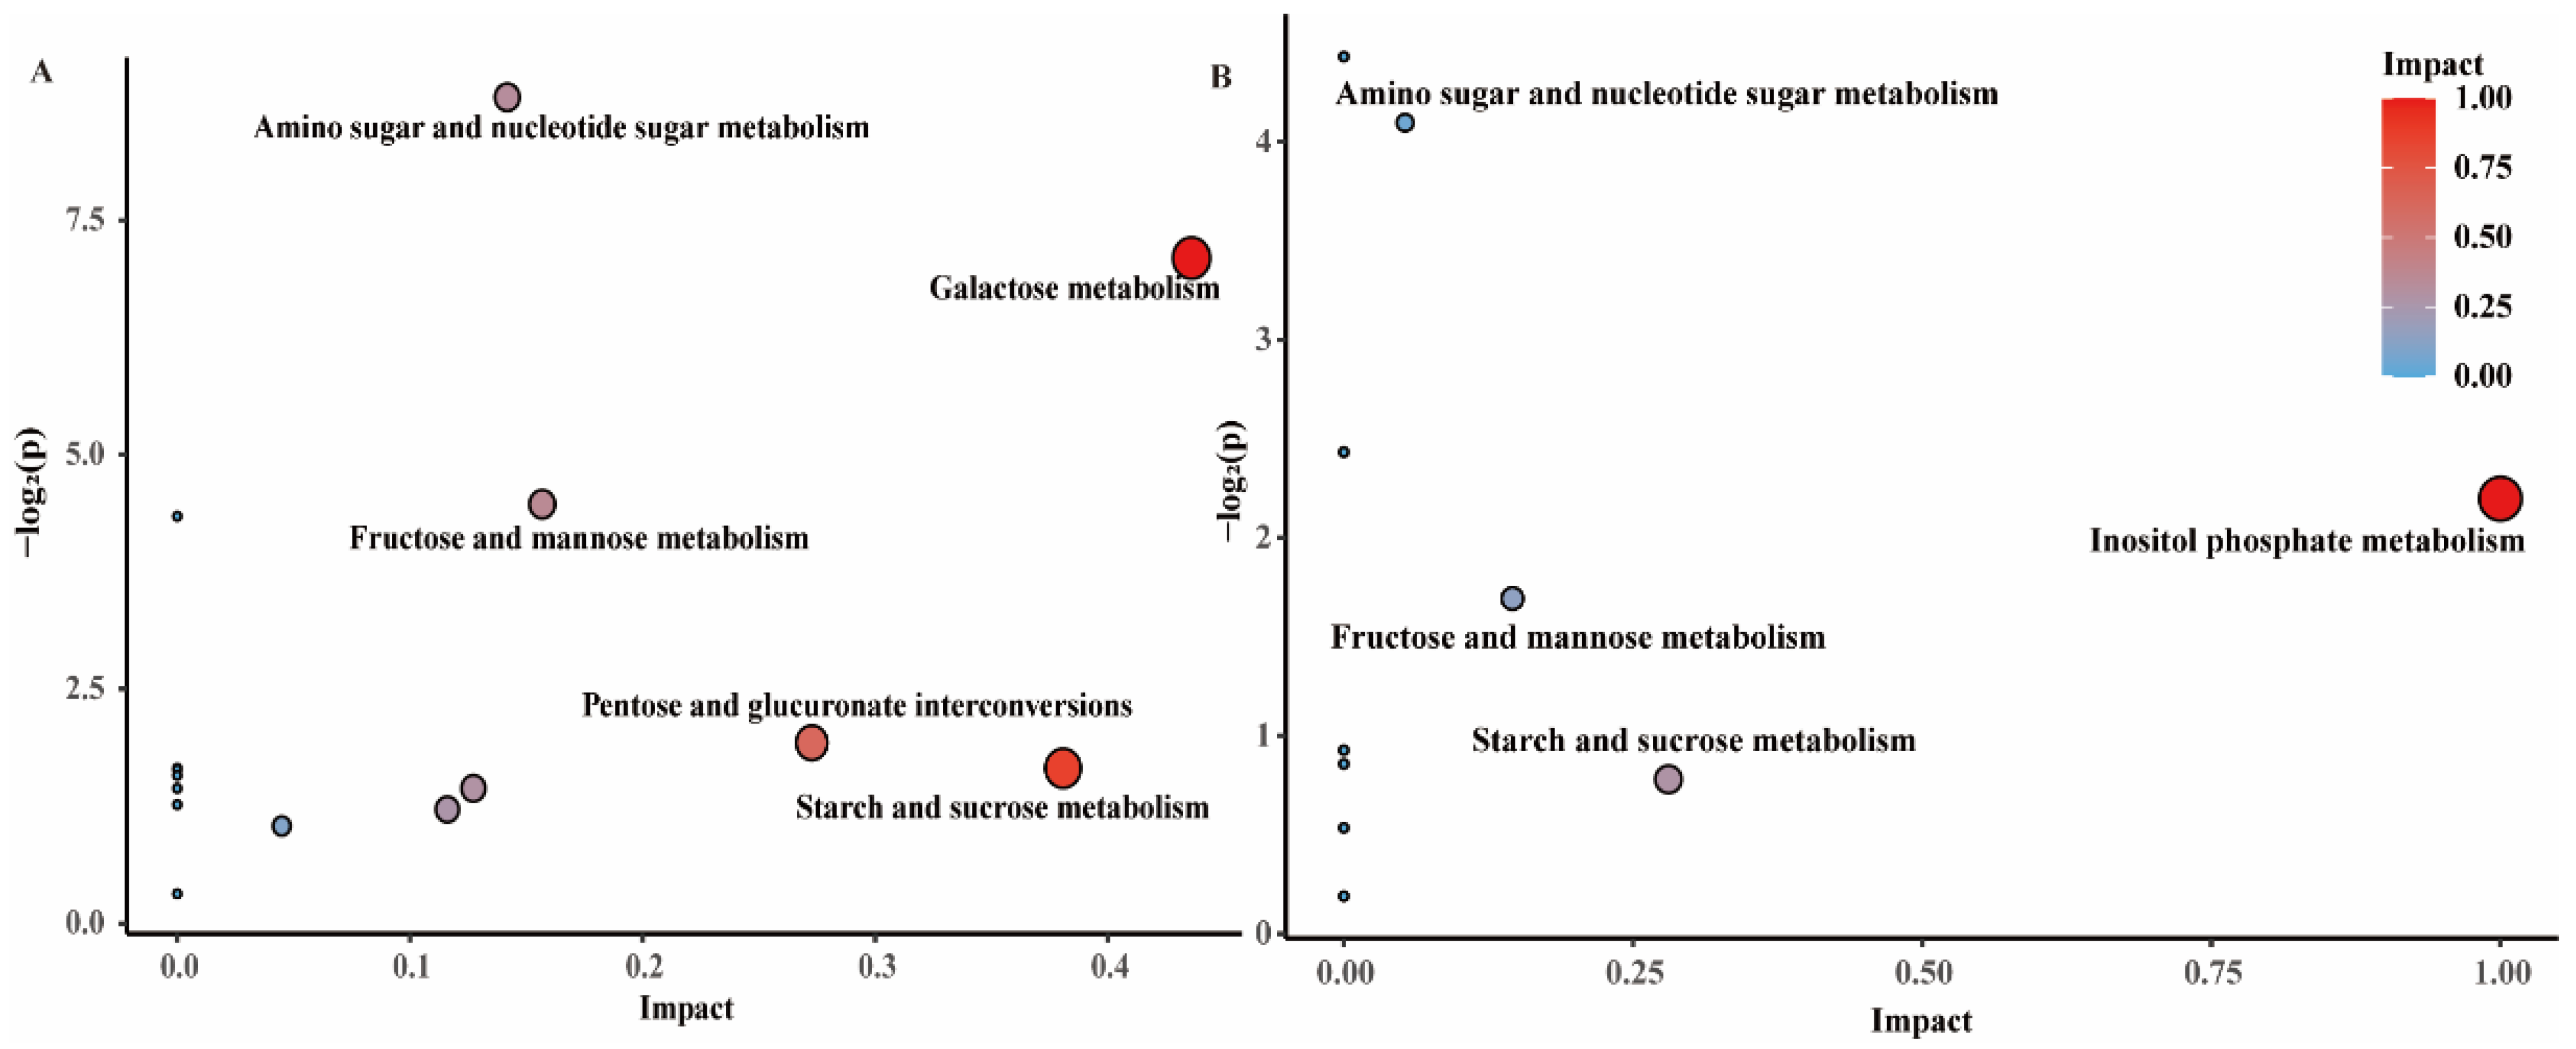
3.3. Metabolic Pathways

To further explore the detailed metabolic pathways in which a dual-species biofilm is affected by the L. plantarum supernatant, a KEGG pathway impact analysis was performed based on the differential metabolites. The KEGG results, including the pathway enrichment analysis (PEA) and pathway topology analysis (PTA) results, were analysed (Tables S3 and S4). The PTA results from the KEGG are shown on the x-axis. The larger the circle size, the higher the centrality of the metabolite involved in the corresponding pathway is. The enrichment analysis (PEA) KEGG results are presented on the y-axis. The closer the circle gets to red, the more significant the change in the compound is [20]. Five major KEGG pathways significantly impacted were detected in C. albicans, which were amino sugar and nucleotide sugar metabolism, galactose metabolism, fructose and mannose metabolism, pentose and glucuronate interconversions, and starch and sucrose metabolism, as shown in Figure 3A. In addition, four major metabolic pathways were affected in S. mutans: inositol phosphate metabolism, fructose and mannose metabolism, starch and sucrose metabolism, and amino sugar and nucleotide sugar metabolism (Figure 3B).

3.4. Global Changes at the Transcriptome Level

To investigate how the L. plantarum supernatant affects the cell metabolism of S. mutans and C. albicans, the mRNA profiles of the treatment and control groups were analysed using RNA-seq. A total of 32.98 Gb of data were acquired, including 223,211,718 raw reads and 219,913,474 clean reads. The error rate of single-base location sequencing in all four samples was 0.03%. The Q20 and Q30 percentages were higher than 97% and 93%, respectively, indicating the high quality of the data. However, S. mutans did not reach a high sequencing depth (Table 1), probably because of the inhibition of probiotics. Therefore, only the transcriptome data of C. albicans were analysed.
To verify the reliability of the RNA-seq data, absolute quantitative RT-PCR was applied to detect the abundance of S. mutans and C. albicans in mixed-species biofilms in the treatment and control groups. Standard curves were obtained for S. mutans and C. albicans and are shown in Figure S1A,B. The number of colonies of S. mutans treated with the L. plantarum supernatant was reduced by more than 3 logs, while the number of C. albicans colonies was in a similar range compared with that of the control (Table 2), and this result was similar to the results obtained using RNA-seq.

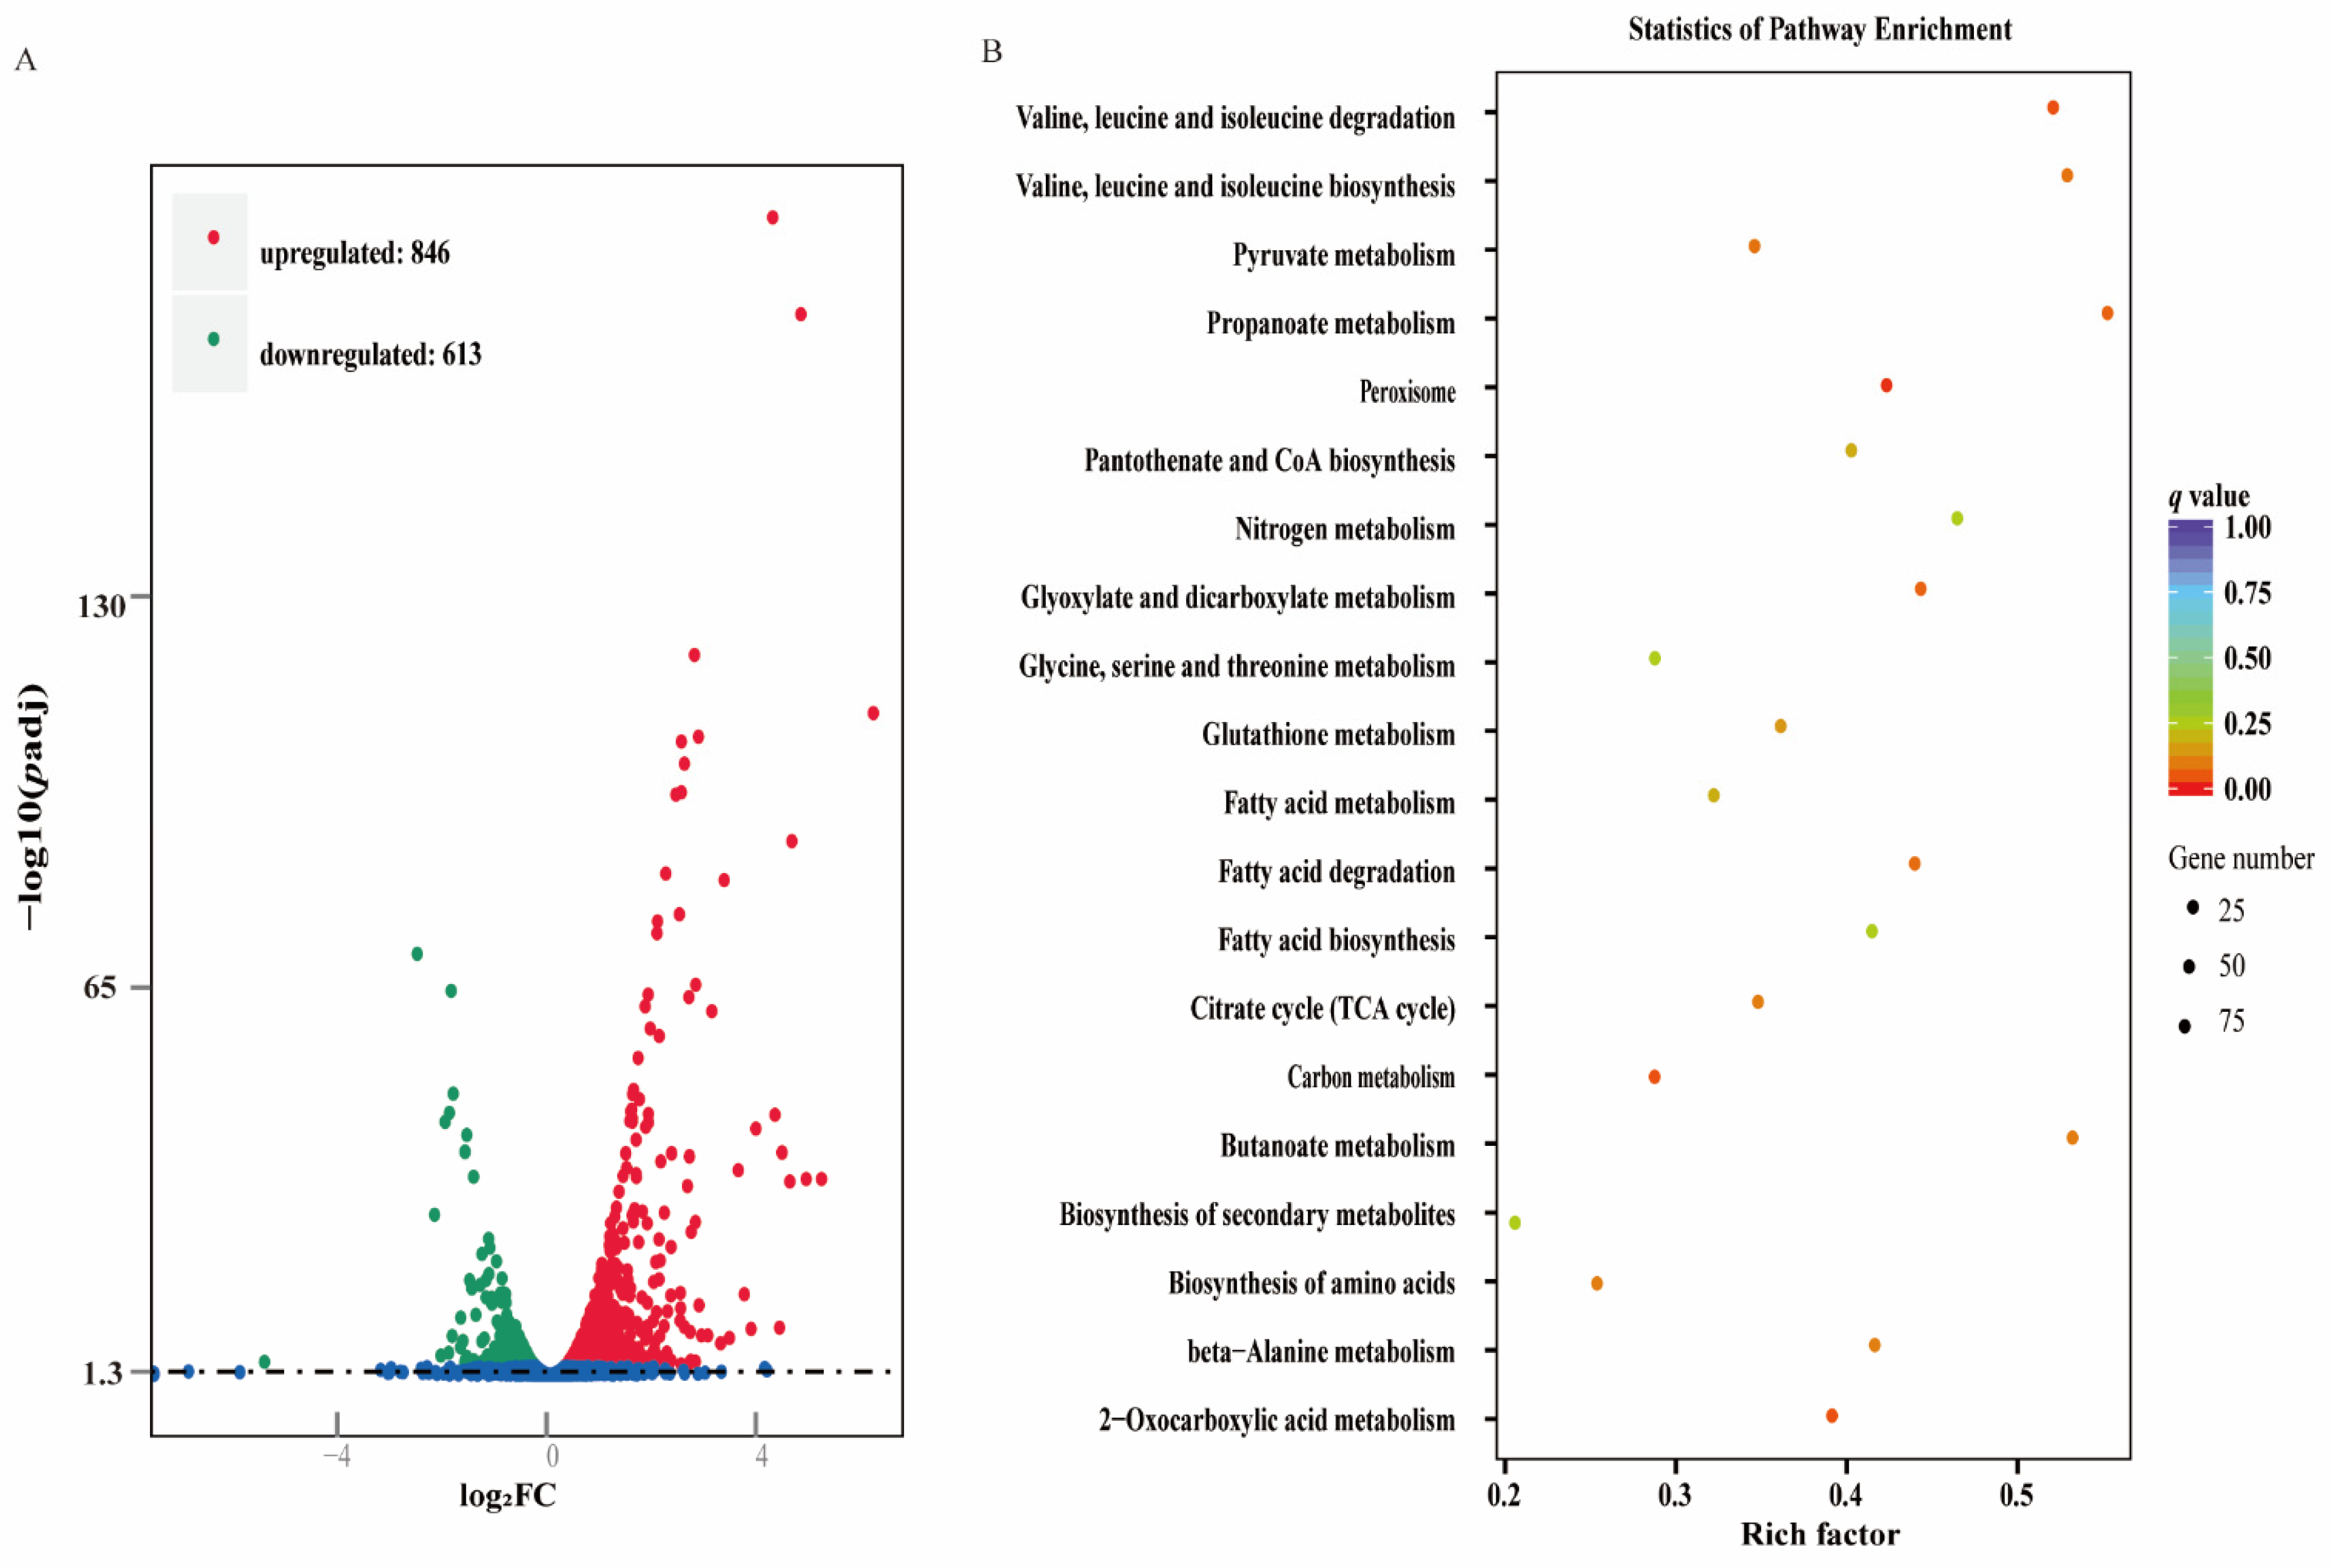
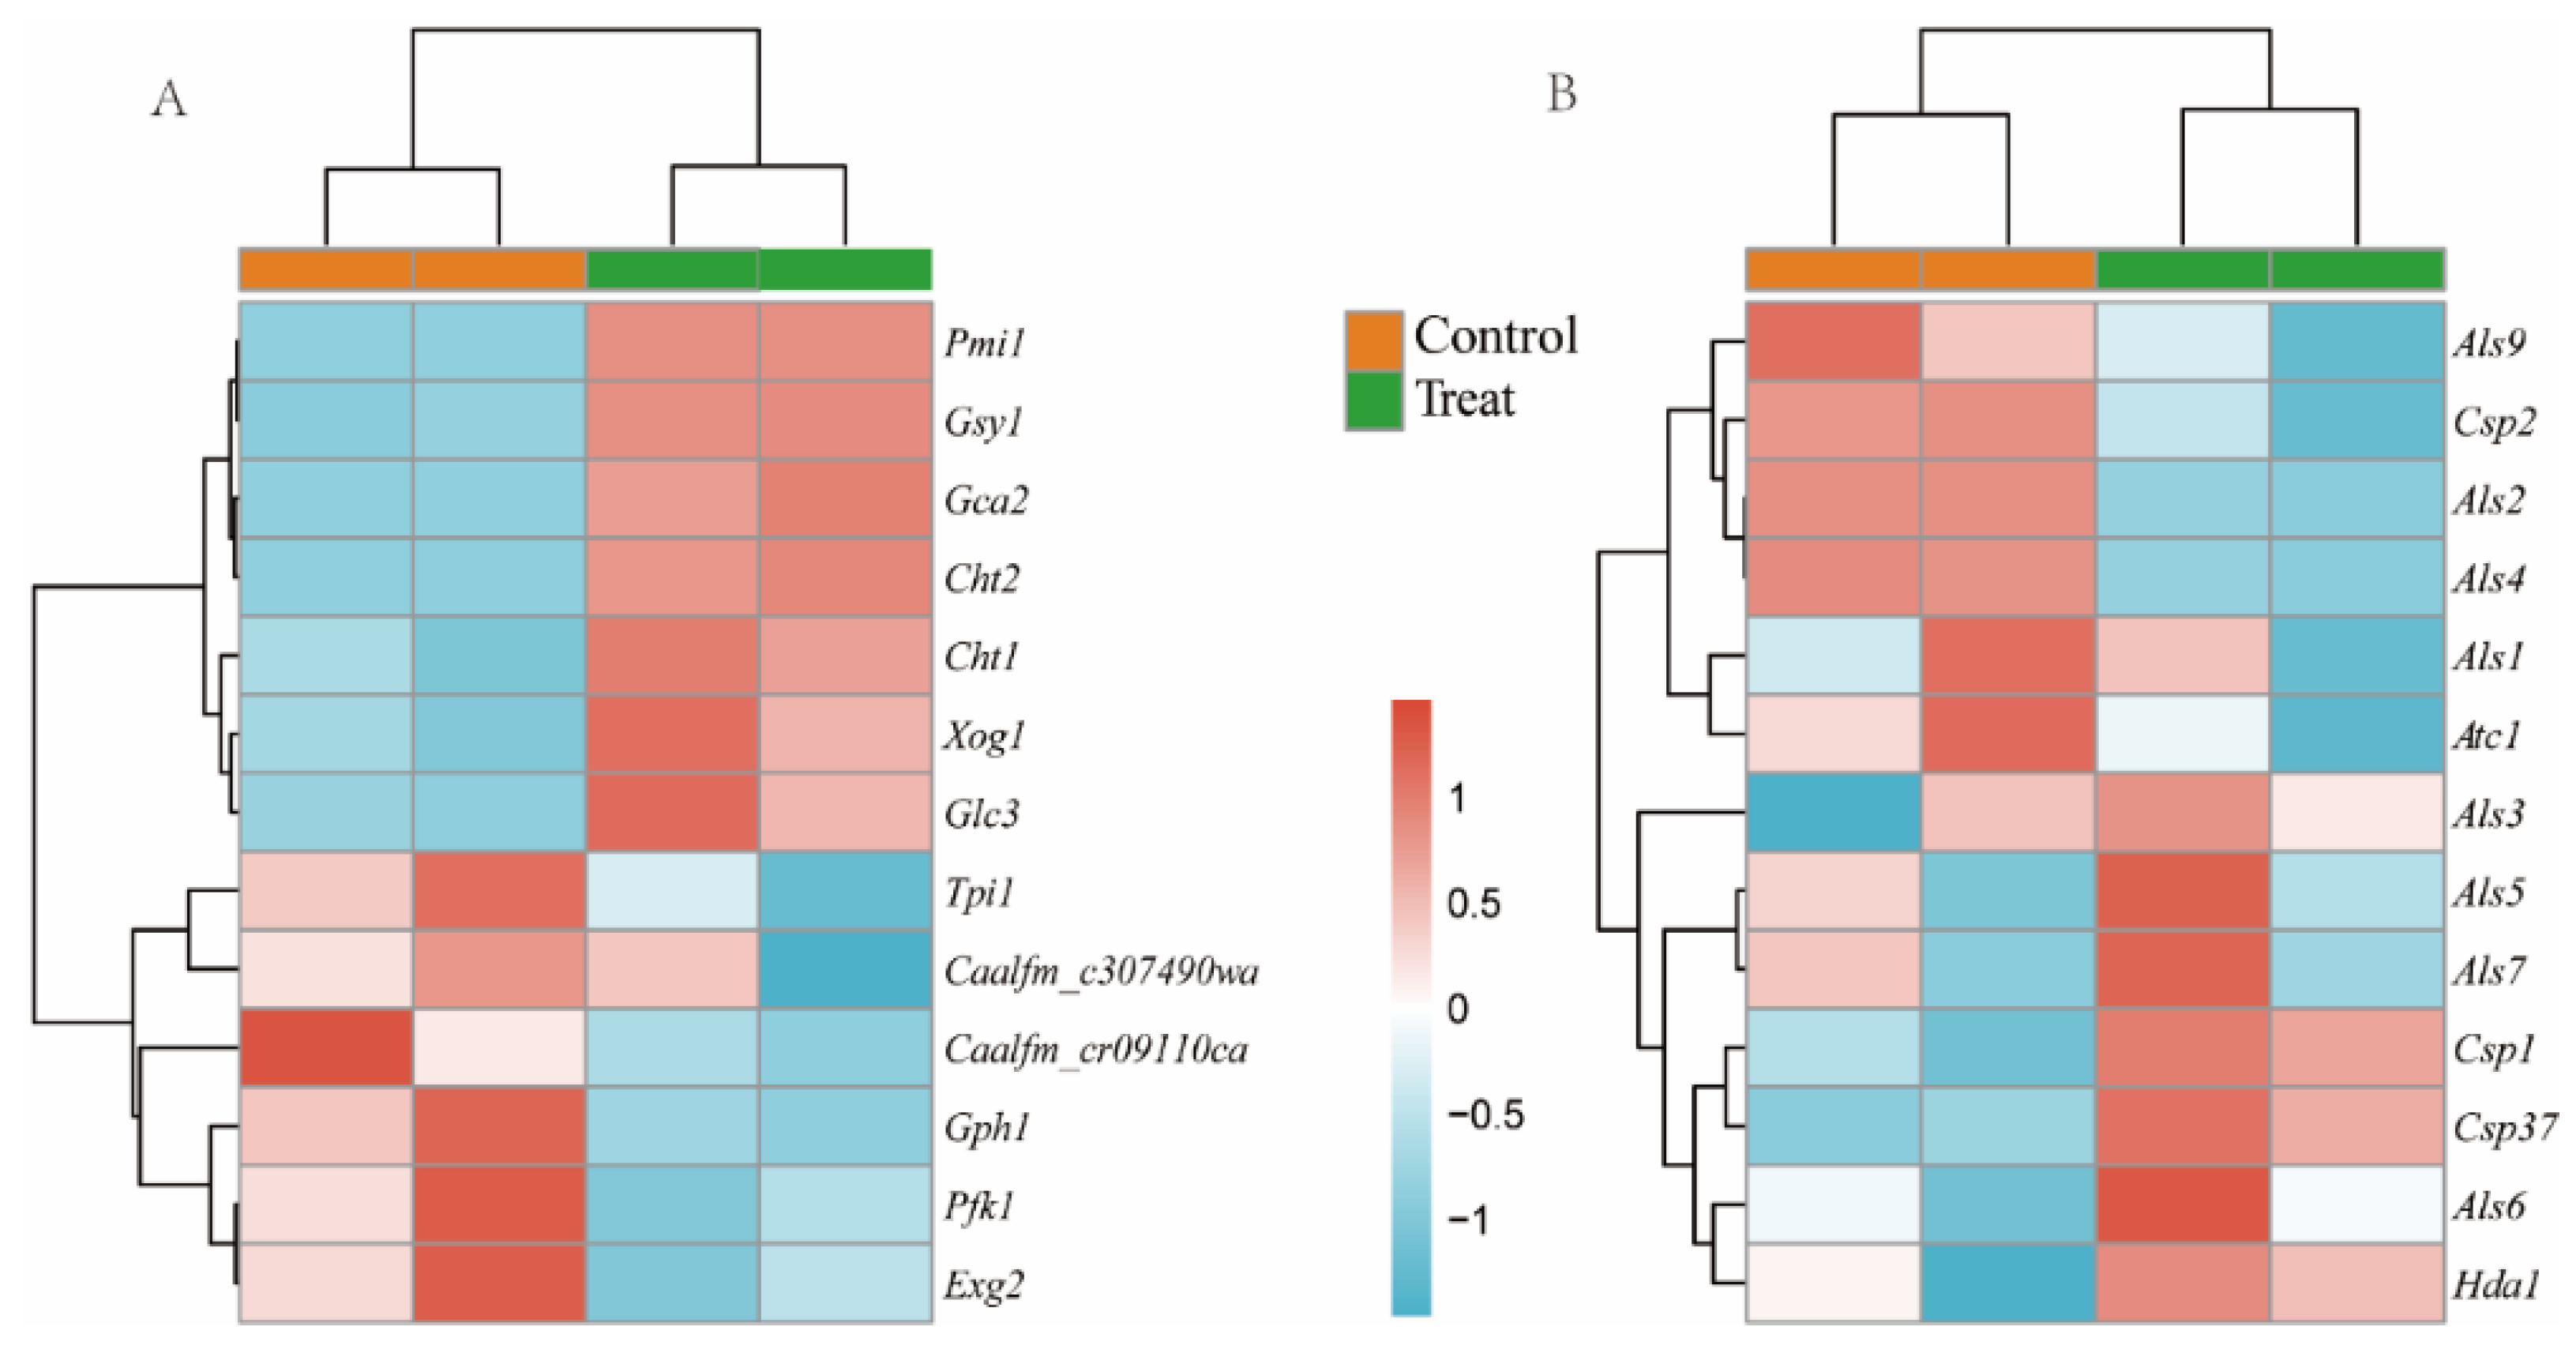
3.5. Differentially Expressed Genes (DEGs) between the Biofilms of the Treated and Control Groups

RNA sequencing technology was used to reveal the inhibitory mechanism of the L. plantarum supernatant on the biofilms consisting of S. mutans and C. albicans. The volcanic maps show the overall distribution of the differentially expressed genes between the two groups. A total of 1459 important DEGs, 613 downregulated genes, and 846 upregulated genes were identified in the experimental group (Figure 4A and Table S5). Next, we performed KEGG signalling pathway enrichment analyses. Compared with the control group, 1459 DEGs were enriched in 97 pathways in C. albicans after treatment with the L. plantarum supernatant. The 20 most abundant pathways are shown in Figure 4B. The size of the dots represents the number of genes. The closer the q value is to 0, the greater the extent of enrichment.
As shown in Figure 3A, the carbohydrate metabolism pathways, including starch and sucrose metabolism, galactose metabolism, amino sugar and nucleotide sugar metabolism, and fructose and mannose metabolism, were related to some genes. Therefore, we rearranged the 13 DEGs of the carbohydrate metabolism pathway in C. albicans (Figure 5A). The expression of some genes related to carbohydrate metabolism changed significantly with the addition of L. plantarum. In addition, the gene expression of hyphae in C. albicans is closely related to virulence [21]. Therefore, we rearranged another 13 DEGs related with hyphae formation in Figure 5B. The expression of genes associated with the filamentous growth of fungi, such as some genes of the Als gene family, was downregulated.

3.6. Integrated Metabolome and Transcriptome Analysis

To clearly reveal the bacterial–fungal interactions in the dual-species biofilm, we combined transcriptomics and metabolomics. We performed a Pearson’s correlation coefficient analysis based on the metabolome and transcriptome profiles. Based on a Pearson correlation coefficient > 0.9, the screening results showed that some metabolites were significantly correlated with the DEGs, as shown in Figure 6. The important DEGs related to the metabolites of C. albicans in the mixed-species biofilm are listed in Table 3. Most of the DEGs related to sugar metabolites in C. albicans showed a negative correlation, while most of the DEGs related to sugar alcohol and organic acid showed a positive correlation. Mannose-6-phosphate and kestose were related to 131 and 158 DEGs, respectively.

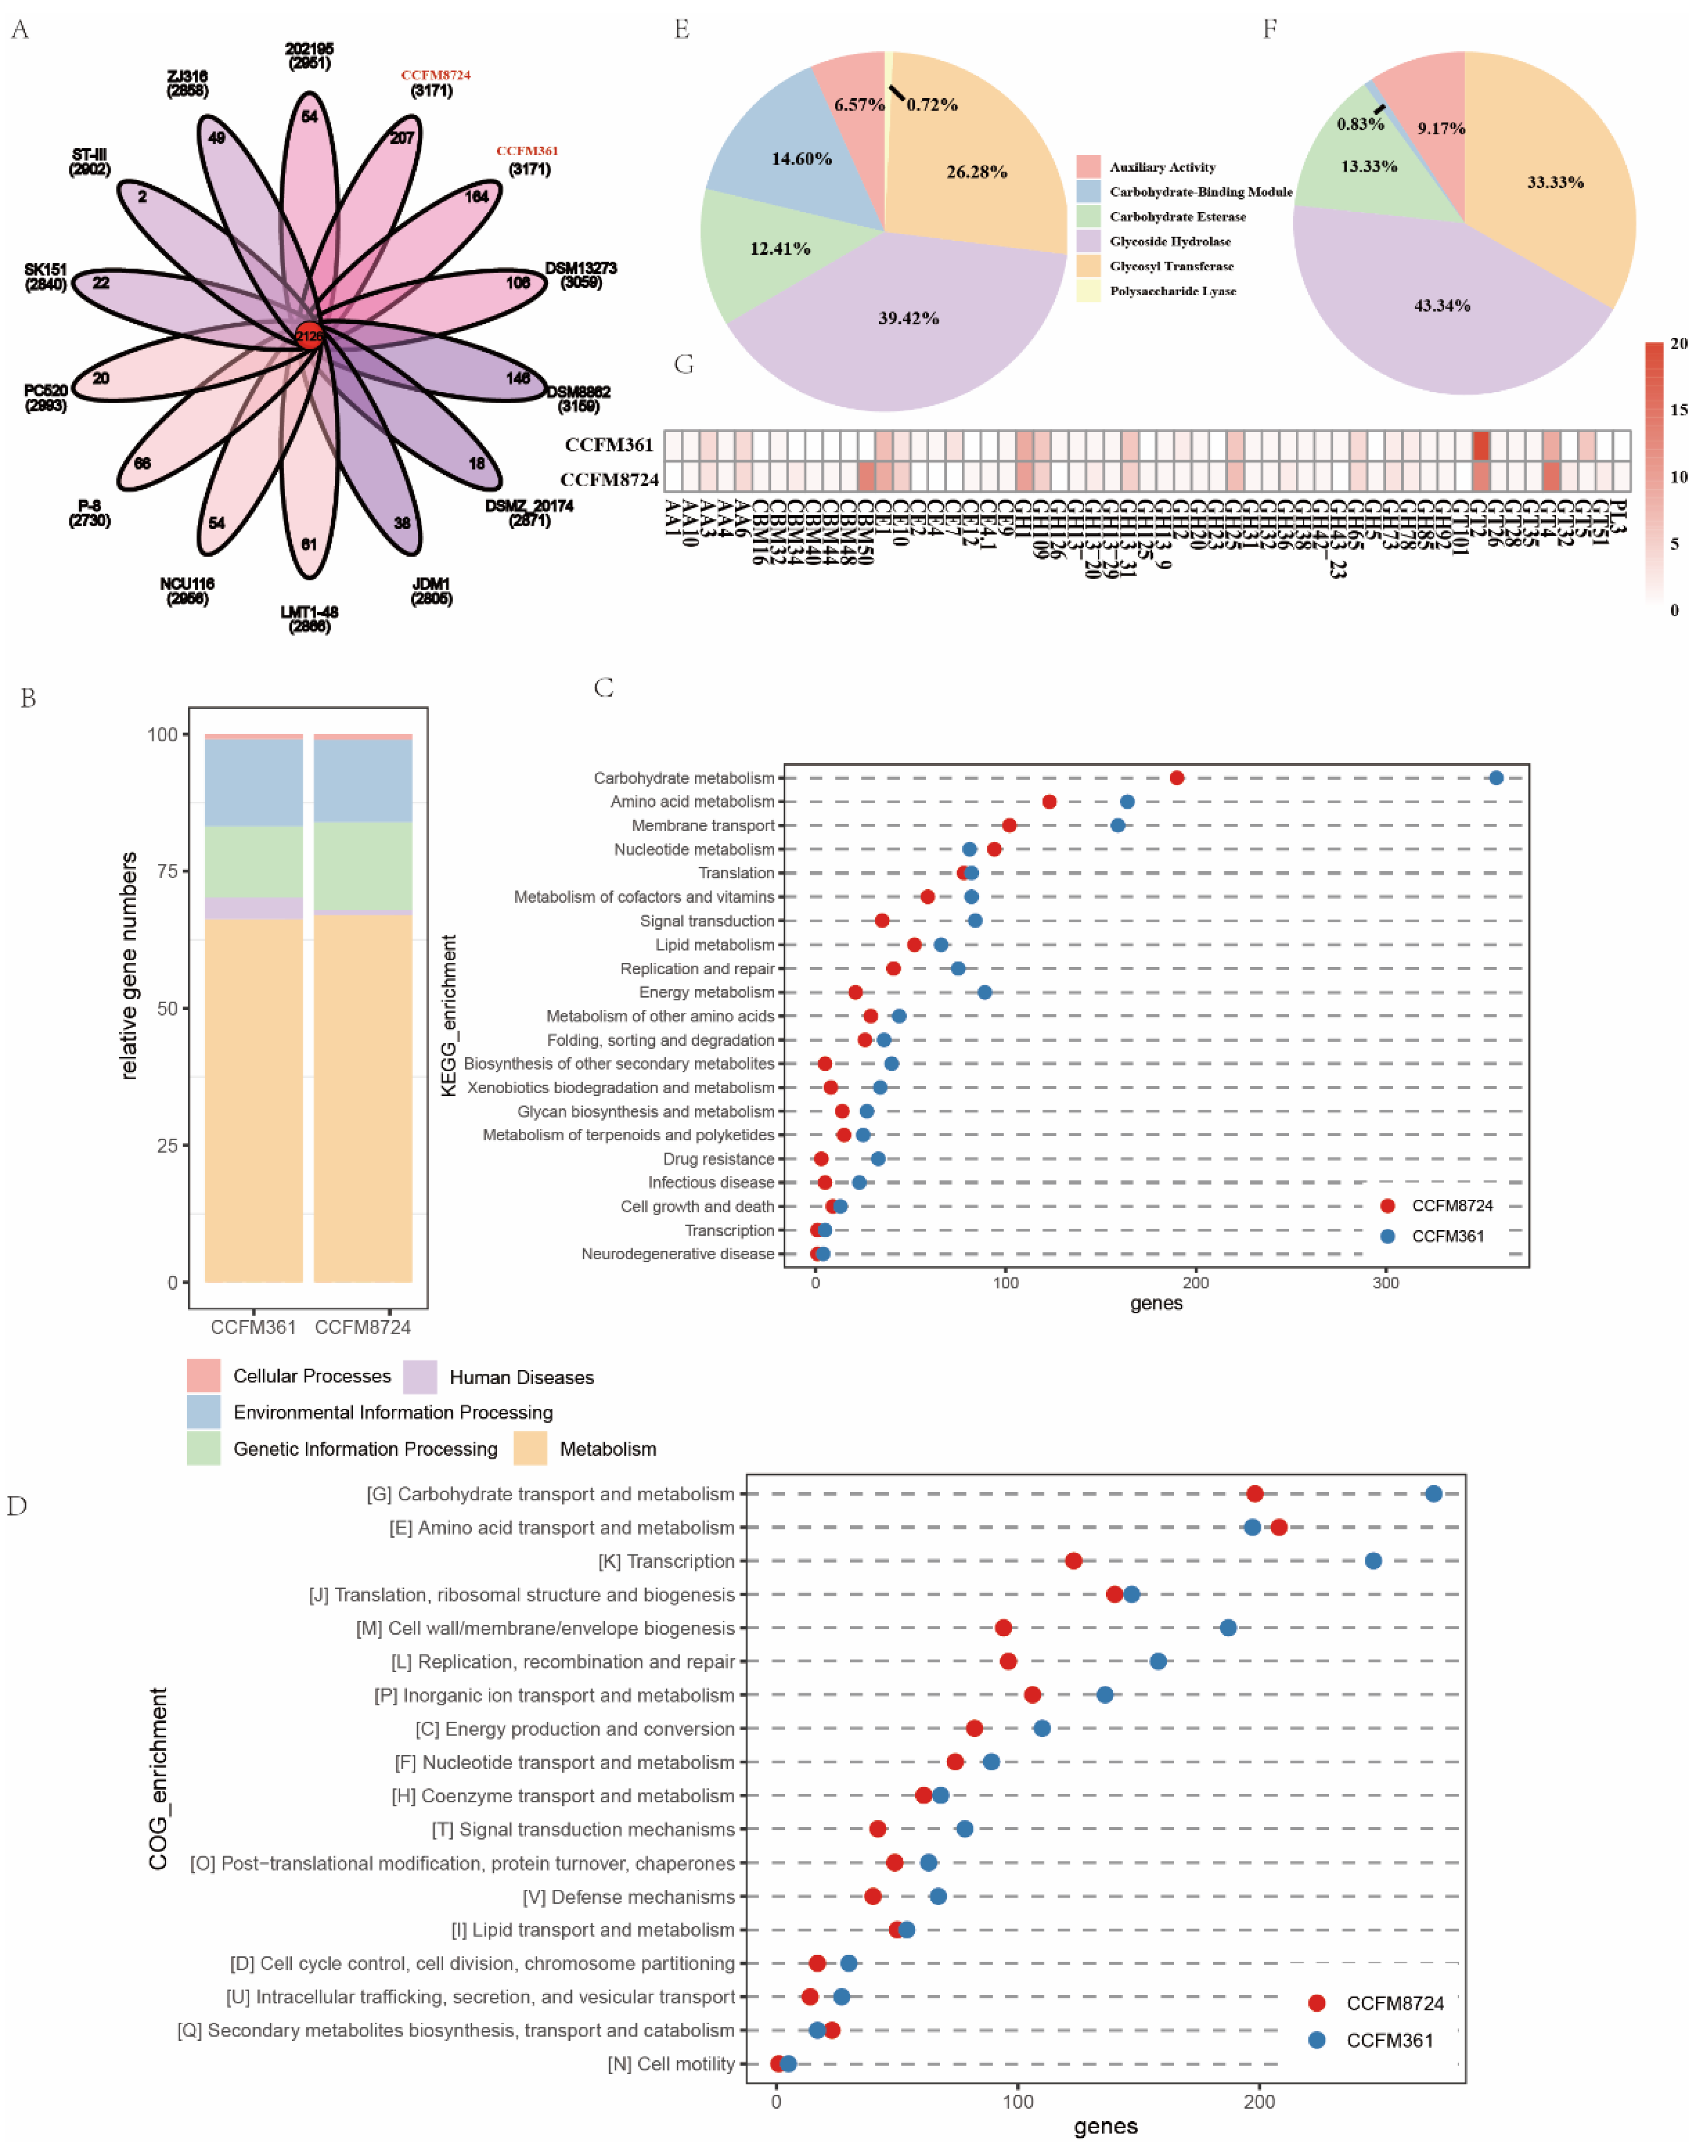
3.7. Genomics Analysis of L. plantarum CCFM8724

To reveal at the molecular level why L. plantarum CCFM8724 can inhibit double-species biofilm and change the metabolic and transcriptomic level, we performed a genomics analysis of L. plantarum CCFM8724, taking L. plantarum CCFM361 as the control strain, from the same subspecies, without the effect on inhibiting double-species biofilm [13]. Through a homologous gene analysis with the reported complete Lactobacillus genome, L. plantarum CCFM8724 and CCFM361 shared 2126 core genes. L. plantarum CCFM8724 had 207 unique core genes, and CCFM361 had 164 unique core genes (Figure 7A). The gene function was annotated using the COG and KEGG databases (Figure 7B–D). Genes related to carbohydrate metabolism showed the greatest count difference between the two strains (Figure 7B–D). Thus, enzymes involved in carbohydrate utilization were further analysed. Putative protein-coding sequences were predicted and annotated using the CAZy database. L. plantarum CCFM8724 had more genes encoding carbohydrate binding modules (CBMs) and polysaccharide lyases (PLs), but fewer genes encoding carbohydrate esterases (CEs), glycoside hydrolases (GHs), auxiliary activity (AA), and glycosyltransferases (GTs) (Figure 7E,F). The number of genes encoding the enzymes involved in carbohydrate utilization is shown in Figure 7G.

4. Discussion

In our previous studies [12,13], the inhibition of S. mutans-C. albicans mixed-species biofilms was observed when the L. plantarum supernatant was added. In this study, we employed multi-omics to reveal the distinct metabolic reprogramming and gene expression during S. mutans-C. albicans dual-species biofilm formation with the addition of the L. plantarum supernatant.
Metabolic data revealed that most of the impacted metabolites were involved in the carbohydrate metabolism (Figure 2A). Sucrose, a positively changed metabolite, was shown to be the most cariogenic of all carbohydrates [22]. After L. plantarum supernatant treatment, the intracellular remaining sucrose increased. Sucrose can be utilized to generate extracellular polymeric substances (EPS) to help cells form biofilms [23]. A diet rich in sucrose enhances the levels of S. mutans in dental biofilms, especially in the presence of C. albicans in a caries rat model [24]. Sucrose degradation products can also be easily used by C. albicans, thus promoting its growth [25]. Importantly, S. mutans has multiple pathways that use sucrose, such as cutting the α-1,2-linked bond of sucrose to generate organic acids and converting sucrose into extracellular polymer glucan via several glycosyltransferase enzymes (Gtfs) [26]. The biofilm is partly composed of extracellular polymer glucan. The mannose-related compound phosphorylated mannose-6-phosphate was detected at a higher level in the control group (Figure 2C). Mannose-6-phosphate was related to 131 DEGs (Table 3). Similar to sucrose, mannose is also associated with EPS formation, and one of the components of EPS, called Pel, governs biofilm formation and is composed of mannose [27].
In contrast, the xylitol and sorbitol levels were higher in the treatment group than in the control group (Figure 2C). Burt et al. [28] reported that xylitol-sweetened gum was not only noncariogenic, but also had an anticariogenic effect. Chi [29] also found that xylitol-sweetened milk significantly decreased the S. mutans abundance compared to sucrose-sweetened milk. Moreover, it is clear that sorbitol can reduce the acid production of S. mutans in vitro, inhibit acid production in dental plaque in vivo, and prevent dental caries [30]. These results also indicate that the xylitol and sorbitol produced by L. plantarum may be the antimicrobial material basis, which requires further studies.
The mixed-species biofilms cultured in MRS broth were able to generate organic acids, such as 5-aminovaleric acid (Figure 2C). The organic acids produced by S. mutans can quickly lower the environmental pH, while S. mutans is also tolerant to low pH [31]. Cornejo et al. [32] performed population genetic analyses on the core genome of S. mutans and identified 73 unique core genes, most of which are related to carbohydrate metabolism and acid resistance. However, some organic acids, such as 3-phenyllactic acid and p-hydroxylphenyllactic acid, were detected at higher levels in the treated group (Figure 2C). In addition, lactic acid had the highest contribution for distinguishing the control and treatment groups (Figure 2A). It has been reported that the organic acids and fatty acids produced by Lactobacillus, such as lactic acid, acetic acid, and capric acid, have good bacteriostatic effects on Escherichia coli [33]. We found that 3-phenyllactic acid and p-hydroxylphenyllactic acid can be generated from L. plantarum [34]; therefore, the organic acids produced by L. plantarum may inhibit the growth of S. mutans. Coincidently, the reads corresponding to S. mutans were not detected in the RNA-seq analysis, indicating that S. mutans was inhibited in the mixed-species biofilm after the treatment with the L. plantarum supernatant. To confirm this inhibition, absolute quantitative RT-PCR was used to detect the number of colonies of S. mutans and C. albicans in the mixed-species biofilm (Table 3). The number of C. albicans colonies was in a similar range as that of the control group, while the number of S. mutans colonies was decreased significantly, and this result was similar to the RNA-seq results.
The combination of transcriptomics and metabolomics can clearly reveal the bacterial–fungal interactions in mixed-species biofilms. The DEGs in the treatment and control groups resulting from the transcriptomic analysis of C. albicans are shown in Figure 4A. A large number of unigenes in C. albicans were classified into various KEGG metabolic pathways (Figure 4B). The KEGG pathways “TCA cycle”, “carbon metabolism,” and “pyruvate metabolism” were significantly enriched, compared to untargeted metabolomics. As shown in Figure 5A, we found 13 DEGs of the carbohydrate metabolism pathway. Among these genes, Pfk1 participated in both fructose and mannose metabolism and galactose metabolism, and its expression levels were significantly reduced compared to those in the control group. Meanwhile, some of the gene expression levels were increased, suggesting that C. albicans requires a more vigorous carbohydrate metabolism to meet its growth needs without the crossbreeding with S. mutans [25]. In addition, the genes Exg2 and Tpl1 were not only associated with the carbohydrate metabolism pathway, but also with the cell wall components, such as mannosan and glucan, which were downregulated.
Contrarily, we observed that the genes related to the filamentous growth of fungi, including Als1, Als2, Als4, and Als9, were downregulated, as expected. Our findings were in agreement with those of James et al., who reported a similar gene expression trend in C. albicans under the treatment with a combination of L. plantarum, L. helveticus, and Streptococcus salivariuin [35]. A family of cell surface proteins called agglutinin-like sequence (Als) proteins is associated with cell adhesion and biofilm formation [36]. The results showed that the L. plantarum supernatant inhibited the adhesion ability of C. albicans. Furthermore, the genes associated with the cell wall components (Csp2 and Atc1) were downregulated.
Apart from the genes mentioned above, other important genes related to the metabolites of C. albicans in mixed-species biofilms are listed in Figure 6 and Table 3. Adenosine-5-monophosphate was detected at a low level after the treatment with the L. plantarum supernatant and was related to 140 DEGs. Adenosine-5-monophosphate, an organic compound consisting of adenine, ribose, and phosphoric acid, is a component of the extracellular DNA (eDNA). eDNA is an important biofilm component that was recently discovered. A study by Lucio [37] indicated that eDNA can be found in some species present in biofilms, such as Pseudomonas aeruginosa, S. intermedius, and S. mutans.
Finally, we demonstrated that the ability of carbohydrate utilization is the major genomic difference between two L. plantarum strains (L. plantarum CCFM8724 and CCFM361) in Figure 7B–D. This helps to explain why intracellular carbohydrate metabolism of dual-species biofilm (Figure 2) in the treated group is the most variable. As shown in Figure 7E, F, the GH family, the highest proportion of the two strains, is a critical enzyme group accounting for the bacterial adaptation capacity to the host’s environment, through hydrolysing the dietary and host-produced carbohydrates [38]. In addition, L. plantarum CCFM8724 has a higher CBM level, which can combine with GH family to degrade chitin or peptidoglycan to inhibit the pathogen growth, especially the CBM50 (Figure 7G). It can be inferred from the results of the genomic analysis that L. plantarum CCFM8724 had unique carbohydrate utilization ability to yield some bioactive compounds, and in turn, to yield its beneficial effect in the oral environment through either inhibiting the biofilm formation or interacting with oral microbes. However, we also acknowledge the limitation that the specific compounds remain unclear, which deserves further study.

5. Conclusions

In conclusion, the multi-omics analyses provide new insights, showing the inhibition of the L. plantarum CCFM 8724 supernatant; in the metabolomics analysis, because the carbohydrate metabolism was deeply influenced, the crossbreeding of C. albicans and S. mutans was changed. In the transcriptomic analysis, the expression of virulence genes, such as those that code Als (agglutinin-like sequence) proteins, was affected. Our results strongly confirm that L. plantarum CCFM8724 can decrease the biofilm mass, regardless of the gene expression or metabolic reprogramming; therefore, it has the potential to act as a therapeutic agent for the prevention and treatment of caries.

Supplementary Materials

The following are available online at https://0-www-mdpi-com.brum.beds.ac.uk/article/10.3390/microorganisms9112368/s1, Figure S1: Standard curve of S. mutans by RT-Q-PCR, Figure S2: Standard curve of C. albicans by RT-qPCR, Table S1: Oligonucleotide primer pairs used for qPCR, Table S2: Differentially expressed metabolites between treat group and control group. Table S3: KEGG pathway impact analysis of differentially expressed metabolites in S. mutans. Table S4: KEGG pathway impact analysis of differentially expressed metabolites in C. albicans. Table S5: Differentially expressed genes of C. albicans between control group and treated group.

Author Contributions

Q.Z.; Contributed to conception, design, analysis, critically revised the manuscript. J.L.; Contributed to conception, design, data acquisition, analysis and interpretation, drafted and critically revised the manuscript. W.L.; Contributed to conception, data acquisition, and critically revised the manuscript. J.Z., W.C. and H.Z.; Contributed to conception and critically revised the manuscript. All authors have read and agreed to the published version of the manuscript.

Funding

This work was supported by the National Natural Science Foundation of China (No. 32072197, 32021005), National First-class Discipline Program of Food Science and Technology (JUFSTR20180102), and Collaborative Innovation Center of Food Safety and Quality Control in Jiangsu Province.

Institutional Review Board Statement

Not applicable.

Informed Consent Statement

Not applicable.

Data Availability Statement

Data used to support the findings of this study are available from the corresponding author upon request.

Conflicts of Interest

The authors declare no conflict of interest.

References

  1. Mitrakul, K.; Srisatjaluk, R.; Srisukh, V.; Lomarat, P.; Vongsawan, K.; Kosanwat, T. Cymbopogon Citratus (Lemongrass Oil) Oral Sprays as Inhibitors of Mutans Streptococci Biofilm Formation. J. Clin. Diagn. Res. 2018, 12, 6–12. [Google Scholar] [CrossRef]
  2. Xiao, J.; Moon, Y.; Li, L.; Rustchenko, E.; Wakabayashi, H.; Zhao, X.; Feng, C.; Gill, S.R.; McLaren, S.; Malmstrom, H.; et al. Candida albicans Carriage in Children with Severe Early Childhood Caries (S-ECC) and Maternal Relatedness. PLoS ONE 2016, 11, e0164242. [Google Scholar] [CrossRef] [Green Version]
  3. Cugini, C.; Shanmugam, M.; Landge, N.; Ramasubbu, N. The Role of Exopolysaccharides in Oral Biofilms. J. Dent. Res. 2019, 98, 739–745. [Google Scholar] [CrossRef] [PubMed]
  4. Du, Q.; Ren, B.; He, J.; Peng, X.; Guo, Q.; Zheng, L.; Li, J.; Dai, H.; Chen, V.; Zhang, L.; et al. Candida albicans promotes tooth decay by inducing oral microbial dysbiosis. ISME J. 2021, 15, 894–908. [Google Scholar] [CrossRef]
  5. Krzyściak, W.; Kościelniak, D.; Papież, M.; Vyhouskaya, P.; Zagórska-Świeży, K.; Kołodziej, I.; Bystrowska, B.; Jurczak, A. Effect of a Lactobacillus Salivarius Probiotic on a Double-Species Streptococcus mutans and Candida albicans Caries Biofilm. Nutrients 2017, 9, 1242. [Google Scholar] [CrossRef] [PubMed] [Green Version]
  6. Lin, T.-H.; Pan, T.-M. Inhibitory effect of Lactobacillus paracasei subsp. paracasei NTU 101 on rat dental caries. J. Funct. Foods 2014, 10, 223–231. [Google Scholar] [CrossRef]
  7. Hu, X.; Huang, Z.; Zhang, Y.; Hong, Y.; Zheng, Y. Effects of a probiotic drink containing Lactobacillus casei strain Shirota on dental plaque microbiota. J. Int. Med. Res. 2019, 47, 3190–3202. [Google Scholar] [CrossRef] [Green Version]
  8. Meto, A.; Colombari, B.; Odorici, A.; Giva, L.B.; Pericolini, E.; Regina, A.L. Antibacterial Effects of MicroRepair® BIOMA-Based Toothpaste and Chewing Gum on Orthodontic Elastics Contaminated In Vitro with Saliva from Healthy Donors: A Pilot Study. Appl. Sci. 2020, 10, 6721. [Google Scholar] [CrossRef]
  9. Chen, L.; Ren, Z.; Zhou, X.; Zeng, J.; Zou, J.; Li, Y. Inhibition of Streptococcus mutans biofilm formation, extracellular polysaccharide production, and virulence by an oxazole derivative. Appl. Microbiol. Biotechnol. 2016, 100, 857–867. [Google Scholar] [CrossRef]
  10. Abinaya, M.; Gayathri, M. Inhibition of biofilm formation, quorum sensing activity and molecular docking study of isolated 3, 5, 7-Trihydroxyflavone from Alstonia scholaris leaf against P.aeruginosa. Bioorganic Chem. 2019, 87, 291–301. [Google Scholar] [CrossRef]
  11. Srivastava, N.; Ellepola, K.; Venkiteswaran, N.; Chai, L.Y.A.; Ohshima, T.; Seneviratne, C.J. Lactobacillus Plantarum 108 Inhibits Streptococcus mutans and Candida albicans Mixed-Species Biofilm Formation. Antibiotics 2020, 9, 478. [Google Scholar] [CrossRef]
  12. Qin, S.; Xu, W.; Zhang, Q.; Zhao, J.; Zhang, H.; Chen, W. Inhibitory effect of Lactobacillus plantarum CCFM8724 on caries-causing dual biofilms. Food Ferment. Ind. 2020, 46, 127–132. [Google Scholar] [CrossRef]
  13. Zhang, Q.; Qin, S.; Xu, X.; Zhao, J.; Zhang, H.; Liu, Z.; Chen, W. Inhibitory Effect of Lactobacillus plantarum CCFM8724 towards Streptococcus mutans- and Candida albicans-Induced Caries in Rats. Oxidative Med. Cell. Longev. 2020, 2020, 1–10. [Google Scholar] [CrossRef] [PubMed]
  14. Sadiq, F.A.; Yan, B.; Zhao, J.; Zhang, H.; Chen, W. Untargeted metabolomics reveals metabolic state of Bifidobacterium bifidum in the biofilm and planktonic states. LWT 2019, 118, 108772. [Google Scholar] [CrossRef]
  15. Zhao, N.; Zhang, C.; Yang, Q.; Guo, Z.; Yang, B.; Lu, W.; Li, D.; Tian, F.; Liu, X.; Zhang, H.; et al. Selection of Taste Markers Related to Lactic Acid Bacteria Microflora Metabolism for Chinese Traditional Paocai: A Gas Chromatography–Mass Spectrometry-Based Metabolomics Approach. J. Agric. Food Chem. 2016, 64, 2415–2422. [Google Scholar] [CrossRef]
  16. Lu, H.; Chen, H.; Tang, X.; Yang, Q.; Zhang, H.; Chen, Y.Q.; Chen, W. Evaluation of metabolome sample preparation and extraction methodologies for oleaginous filamentous fungi Mortierella alpina. Metabolomics 2019, 15, 50. [Google Scholar] [CrossRef] [PubMed]
  17. Ji, J.; Wang, Q.; Wu, H.; Xia, S.; Guo, H.; Blaženović, I.; Zhang, Y.; Sun, X. Insights into cellular metabolic pathways of the combined toxicity responses of Caco-2 cells exposed to deoxynivalenol, zearalenone and Aflatoxin B1. Food Chem. Toxicol. 2019, 126, 106–112. [Google Scholar] [CrossRef]
  18. Zhou, T.; Luo, X.; Yu, C.; Zhang, C.; Zhang, L.; Song, Y.-B.; Dong, M.; Shen, C. Transcriptome analyses provide insights into the expression pattern and sequence similarity of several taxol biosynthesis-related genes in three Taxus species. BMC Plant Biol. 2019, 19, 33. [Google Scholar] [CrossRef] [Green Version]
  19. Cui, F.-X.; Zhang, R.-M.; Liu, H.-Q.; Wang, Y.-F.; Li, H. Metabolic responses to Lactobacillus plantarum contamination or bacteriophage treatment in Saccharomyces cerevisiae using a GC–MS-based metabolomics approach. World J. Microbiol. Biotechnol. 2015, 31, 2003–2013. [Google Scholar] [CrossRef] [PubMed]
  20. Tian, S.; Wang, C.; Li, Y.; Bao, X.; Zhang, Y.; Tang, T. The Impact of SlyA on Cell Metabolism of Salmonella typhimurium: A Joint Study of Transcriptomics and Metabolomics. J. Proteome Res. 2021, 20, 184–190. [Google Scholar] [CrossRef] [PubMed]
  21. Buu, L.; Lee, F.S.; Chen, Y. Temperature and Glucose Level Are Important for Hypha Development and Saps Expression in Candida albicans and the Sap6 Is an Important Virulent Factor in Co-culture of C. albicans and THP-1 Human Mononuclear Cells. In Molecular Biology of the Cell; Amer Soc Cell Biology: Bethesda, MD, USA, 2006; Volume 17. [Google Scholar]
  22. Leme, A.P.; Koo, H.; Bellato, C.M.; Bedi, G.; Cury, J.A. The Role of Sucrose in Cariogenic Dental Biofilm Formation—New Insight. J. Dent. Res. 2006, 85, 878–887. [Google Scholar] [CrossRef]
  23. Cai, J.-N.; Jung, J.-E.; Lee, M.-H.; Choi, H.-M.; Jeon, J.-G. Sucrose challenges to Streptococcus mutans biofilms and the curve fitting for the biofilm changes. FEMS Microbiol. Ecol. 2018, 94, 29788432. [Google Scholar] [CrossRef] [Green Version]
  24. Falsetta, M.L.; Klein, M.; Colonne, P.M.; Scott-Anne, K.; Gregoire, S.; Pai, C.-H.; Gonzalez-Begne, M.; Watson, G.; Krysan, D.; Bowen, W.H.; et al. Symbiotic Relationship between Streptococcus mutans and Candida albicans Synergizes Virulence of Plaque BiofilmsIn Vivo. Infect. Immun. 2014, 82, 1968–1981. [Google Scholar] [CrossRef] [PubMed] [Green Version]
  25. Ellepola, K.; Truong, T.; Liu, Y.; Lin, Q.; Lim, T.K.; Lee, Y.M.; Cao, T.; Koo, H.; Seneviratne, C.J. Multi-omics Analyses Reveal Synergistic Carbohydrate Metabolism in Streptococcus mutans-Candida albicans Mixed-Species Biofilms. Infect. Immun. 2019, 87, e00339-19. [Google Scholar] [CrossRef] [PubMed] [Green Version]
  26. Bowen, W.; Koo, H. Biology of Streptococcus mutans-Derived Glucosyltransferases: Role in Extracellular Matrix Formation of Cariogenic Biofilms. Caries Res. 2011, 45, 69–86. [Google Scholar] [CrossRef] [PubMed]
  27. Roy, R.; Tiwari, M.; Donelli, G.; Tiwari, V. Strategies for combating bacterial biofilms: A focus on anti-biofilm agents and their mechanisms of action. Virulence 2018, 9, 522–554. [Google Scholar] [CrossRef]
  28. Burt, B.A. The use of sorbitol- and xylitol-sweetened chewing gum in caries control. J. Am. Dent. Assoc. 2006, 137, 190–196. [Google Scholar] [CrossRef] [Green Version]
  29. Chi, D.L.; Zegarra, G.; Huerta, E.C.V.; Castillo, J.L.; Milgrom, P.; Roberts, M.C.; Matta, A.C.; Merino, A.P.; Mancl, L. Milk Sweetened with Xylitol: A Proof-of-Principle Caries Prevention Randomized Clinical Trial. J. Dent. Child. 2016, 83, 152–160. [Google Scholar]
  30. Takahashi-Abbe, S.; Abbe, K.; Takahashi, N.; Tamazawa, Y.; Yamada, T. Inhibitory effect of sorbitol on sugar metabolism of Streptococcus mutans in vitro and on acid production in dental plaque in vivo. Oral Microbiol. Immunol. 2001, 16, 94–99. [Google Scholar] [CrossRef] [PubMed]
  31. Lemos, J.A.; Palmer, S.R.; Zeng, L.; Wen, Z.T.; Kajfasz, J.K.; Freires, I.A.; Abranches, J.; Brady, L.J. The Biology of Streptococcus mutans. Microbiol. Spectr. 2019, 7, 7. [Google Scholar] [CrossRef]
  32. Cornejo, O.E.; Lefébure, T.; Bitar, P.D.P.; Lang, P.; Richards, V.; Eilertson, K.; Do, T.; Beighton, D.; Zeng, L.; Ahn, S.-J.; et al. Evolutionary and Population Genomics of the Cavity Causing Bacteria Streptococcus mutans. Mol. Biol. Evol. 2013, 30, 881–893. [Google Scholar] [CrossRef] [PubMed] [Green Version]
  33. Lu, C.; Mao, Y.; Guo, H.; Zhao, Y.; Deng, Y. Analysis and identification of main antibacterial metabolites secreted by Lactobacillus plantarum DY6. Microbiol. China 2019, 46, 2258–2271. [Google Scholar] [CrossRef]
  34. Li, J.; Zhang, Q.; Guo, M.; Zhao, J. Identification of metabolites secreted by Lactobacillus plantarum CCFM8724 on inhibiting dual-species biofilm. Microbiol. China 2021. [Google Scholar] [CrossRef]
  35. James, K.M.; Macdonald, K.W.; Chanyi, R.M.; Cadieux, P.A.; Burton, J. Inhibition of Candida albicans biofilm formation and modulation of gene expression by probiotic cells and supernatant. J. Med. Microbiol. 2016, 65, 328–336. [Google Scholar] [CrossRef] [PubMed]
  36. Dehullu, J.; Valotteau, C.; Herman-Bausier, P.; Garcia-Sherman, M.; Mittelviefhaus, M.; Vorholt, J.A.; Lipke, P.N.; Dufrêne, Y.F. Fluidic Force Microscopy Demonstrates That Homophilic Adhesion by Candida albicans Als Proteins Is Mediated by Amyloid Bonds between Cells. Nano Lett. 2019, 19, 3846–3853. [Google Scholar] [CrossRef] [PubMed]
  37. Montanaro, L.; Poggi, A.; Visai, L.; Ravaioli, S.; Campoccia, D.; Speziale, P.; Arciola, C.R. Extracellular DNA in Biofilms. Int. J. Artif. Organs 2011, 34, 824–831. [Google Scholar] [CrossRef] [PubMed]
  38. Tian, P.; Bastiaanssen, T.F.S.; Song, L.; Jiang, B.; Zhang, X.; Zhao, J.; Zhang, H.; Chen, W.; Cryan, J.F.; Wang, G. Unraveling the Microbial Mechanisms Underlying the Psychobiotic Potential of a Bifidobacterium breve Strain. Mol. Nutr. Food Res. 2021, 65, 2000704. [Google Scholar] [CrossRef]
Figure 1. The metabolites in treated group compared to those in control group. (A) Principal component analysis (PCA) score plot of metabolite profiles from the treated and control groups. (B) Partial least squares discriminant analysis (PLS-DA) score plot of metabolite profiles from the treated and control groups. Each point represents an independent biological replicate. The red dots indicate the control group, the blue dots indicate the treated group.
Microorganisms 09 02368 g001
Figure 2. Significantly changed metabolites between groups. (A) Variable importance for the projection (VIP) score calculated by PLS-DA. (B) Volcano plot of the metabolites from the treated and control biofilms. The blue dots indicate the downregulated metabolites, the red dots indicate the upregulated metabolites, and the grey dots indicate the non-differentially expressed metabolites. (C) Heatmap of top 20 significantly changed metabolites. Cluster 1 and cluster 2 represent the two clusters of control and treated group, respectively. The six columns for each cluster represent independent metabolomics replicates.
Microorganisms 09 02368 g002
Figure 3. Pathway enrichment analysis (PEA) and pathway topology analysis (PTA) results. (A) Pathway enriched in C. albicans. (B) Pathway enriched in S. mutans.
Microorganisms 09 02368 g003
Figure 4. (A) Volcano map of differentially expressed genes (DEGs) for treated vs. control. Different colours (red, green, and blue) represent upregulated, downregulated, and no significant changes, respectively. (B) The most abundant KEGG pathways for differentially expressed genes.
Microorganisms 09 02368 g004
Figure 5. Heatmap for gene expression in C. albicans. (A) Genes related to carbohydrate metabolism. (B) Genes related to hyphae formation.
Microorganisms 09 02368 g005
Figure 6. The heatmap of the correlation between differentially expressed genes (DEGs) and metabolites in C. albicans.
Microorganisms 09 02368 g006
Figure 7. Comparative genome analysis of L. plantarum CCFM8724 and CCFM361. (A) Venn plot of shared and unique core genes distribution among L. plantarum strains. (B) The level I of Kyoto Encyclopedia of Genes and Genomes (KEGG) pathway enrichment analysis. (C) The level II of KEGG pathway enrichment analysis. (D) Enrichment analysis of Clusters of Orthologous Groups of protein (COGs) functional categories. (E) Genome-wide comparative distribution of carbohydrate-active enzymes (CAZy) in L. plantarum CCFM8724. (F) Genome-wide comparative distribution of CAZy in L. plantarum CCFM361. (G) Identification and quantification of gene count coding for different CAZy families of two strains. AA, auxiliary activity; CBM, carbohydrate-binding module; CE, carbohydrate esterase; GH, glycoside hydrolase; GT, glycosyltransferase; PL, polysaccharides.
Microorganisms 09 02368 g007
Table 1. RNA-seq in mixed-species biofilms.
Sample NameC1C2T1T2
Total reads (C. albicans)5,5819,26454,481,92856,579,97653,032,306
Total mapped (C. albicans)36,144,061 (64.75%)35,817,034 (65.74%)48,178,839 (85.15%)44,747,300 (84.38%)
Total reads (S. mutans)55,506,49654,041,98856,174,37652,584,766
Total mapped (S. mutans)13,877,006 (25%)12,460,931 (23.06%)18,215 (0.03%)45,311 (0.08%)
Table 2. The number of organisms detected by quantitative real-time PCR (qPCR).
OrganismsCqCells
CTCT
S. mutans15.18 a24.36 b109 a106 b
C. albicans16.15 a16.22 a1010 a1010 a
Note: The equations of linear regressions of DNA copies vs. cycle quantification are characterized by their slope, y-axis intersection and the R2 values in Figures S1 and S2. Cells numbers were theoretical values based on the copies of DNA. a and b represent the difference in the cells in each row.
Table 3. Some representative metabolites and significantly correlated differentially expressed genes (DEGs) of C. albicans between groups.
CompoundsCorrelated DEGs
Mannose-6-phosphate131
Kestose158
Lysine127
Adenosine-5-monophosphate140
Publisher’s Note: MDPI stays neutral with regard to jurisdictional claims in published maps and institutional affiliations.

