Article

Taxonomic and Functional Characteristics of the Gill and Gastrointestinal Microbiota and Its Correlation with Intestinal Metabolites in NEW GIFT Strain of Farmed Adult Nile Tilapia (Oreochromis niloticus)

1
State Key Laboratory of Freshwater Ecology and Biotechnology, Institute of Hydrobiology, Chinese Academy of Sciences, Wuhan 430072, China
2
College of Life Sciences, University of Chinese Academy of Sciences, Beijing 100049, China
3
Key Laboratory of Aquaculture Disease Control, Ministry of Agriculture, Wuhan 430072, China
*
Author to whom correspondence should be addressed.
Submission received: 1 February 2021 / Revised: 14 March 2021 / Accepted: 16 March 2021 / Published: 17 March 2021
(This article belongs to the Special Issue Gut Microbiome of Farm Animals in Health and Disease)

Abstract

:
The gill and gastrointestinal tract are primary entry routes for pathogens. The symbiotic microbiota are essential to the health, nutrition and disease of fish. Though the intestinal microbiota of Nile tilapia (Oreochromis niloticus) has been extensively studied, information on the mucosa-associated microbiota of this species, especially the gill and gastrointestinal mucosa-associated microbiota, is lacking. This study aimed to characterize the gill and gastrointestinal mucosa- and digesta-associated microbiota, as well as the intestinal metabolite profiles in the New Genetically Improved Farmed Tilapia (NEW GIFT) strain of farmed adult Nile tilapia by high-throughput sequencing and gas chromatography/mass spectrometry metabolomics. The diversity, structure, composition, and predicted function of gastrointestinal microbiota were significantly different across gastrointestinal regions and sample types (Welch t-test; p < 0.05). By comparing the mucosa- and digesta-associated microbiota, linear discriminant analysis (LDA) effect size (LEfSe) analysis revealed that Pelomonas, Ralstonia pickettii, Comamonadaceae, and Staphylococcus were significantly enriched in the mucosa-associated microbiota, whereas many bacterial taxa were significantly enriched in the digesta-associated microbiota, including Chitinophagaceae, Cetobacterium, Candidatus Competibacter, Methyloparacoccus, and chloroplast (LDA score > 3.5). Furthermore, Undibacterium, Escherichia-Shigella, Paeniclostridium, and Cetobacterium were dominant in the intestinal contents and mucosae, whereas Sphingomonas aquatilis and Roseomonas gilardii were commonly found in the gill and stomach mucosae. The Phylogenetic Investigation of Communities by Reconstruction of Unobserved States (PICRUSt2) analysis revealed that the predictive function of digesta-associated microbiota significantly differed from that of mucosa-associated microbiota (R = 0.8152, p = 0.0001). In addition, our results showed a significant interdependence between specific intestinal microbes and metabolites. Notably, the relative abundance values of several potentially beneficial microbes, including Undibacterium, Crenothrix, and Cetobacterium, were positively correlated with most intestinal metabolites, whereas the relative abundance values of some potential opportunistic pathogens, including Acinetobacter, Mycobacterium, Escherichia-Shigella, Paeniclostridium, Aeromonas, and Clostridium sensu stricto 1, were negatively correlated with most intestinal metabolites. This study revealed the characteristics of gill and gastrointestinal mucosa-associated and digesta-associated microbiota of farmed Nile tilapia and identified a close correlation between intestinal microbes and metabolites. The results serve as a basis for the effective application of targeted probiotics or prebiotics in the diet to regulate the nutrition and health of farmed tilapia.

1. Introduction

The microbiota of fish, like other vertebrates, play critical roles in host health and metabolism [1]. Fish microbiota include resident communities (autochthonous or associated with mucosa) and transient communities (allochthonous or associated with digesta) [2]. Most infections start at or affect the fish mucosal epithelia. The three major infection routes in fish are the gills, the skin, and the gastrointestinal tract [3], which are the first points of contact for pathogens. The mucosal surfaces of these organs represent an important barrier that supports and regulates a wide variety of microbial communities [2]. These diverse and balanced mucosa-associated microbial communities are essential for fish health [4], but the mechanism underlying their interactions with the host remains unclear.
Characterizing the microbiota in healthy fish is an essential first step to elucidating the impacts of microbial manipulation in aquaculture systems. The evaluation of the bacterial community attached to the gills, which is the respiratory organ, has a long history [5]. However, except for several recent studies [6,7,8,9,10], this topic has received little attention. The gastrointestinal tract is a complex ecosystem that harbors diverse microbial communities that can increase digestion efficiency and the use of nutrients, boost the immune system, and prevent the attachment and proliferation of opportunistic pathogens [11]. The establishment of balanced gastrointestinal microbiota is important in fish health and digestive function [11]. However, information regarding the functional roles that these microbes play in host metabolism is limited.
The New Genetically Improved Farmed Tilapia (NEW GIFT) strain of Nile tilapia is the most commonly farmed tilapia in China and Southeast Asia [12]. The great impact and success of NEW GIFT is evident in developing countries, in which it has helped improve food and income security [12]. However, intensive aquaculture of tilapia has caused various disease problems, especially bacterial diseases [13], which has ultimately led to considerable mortality and consequent economic losses. Recently, insights into the farmed fish microbiome have opened up tantalizing new prospects for optimizing health and productivity in aquaculture systems, such as an increase in the application of probiotics [14]. Host-associated probiotics have a greater chance of competing with resident microorganisms, thus more effectively colonizing the host [15]. Therefore, the use of host-associated probiotics for disease prevention has become a consensus in aquaculture [15], and related studies have been conducted in tilapia [16,17,18]. To better screen host-associated probiotics, the gill and gastrointestinal mucosa-specific microbiota of farmed tilapia need to be further studied.
To date, knowledge of the fish normal microbiome has mostly focused on the characteristics of microbial diversity, and little information on the functional capacity of the fish microbiome is available [19]. In the present study, we used 16S rRNA gene high-throughput sequencing and non-targeted gas chromatography/mass spectrometry (GC/MS) metabolomics technology to characterize the taxonomic diversity and functional potential of a farmed tilapia microbiome.
The objectives of this study were as follows: (1) to characterize the structure and diversity of the gill and gastrointestinal digesta- and mucosa-associated microbiota in the NEW GIFT strain of farmed adult Nile tilapia, (2) to compare the predicted function of symbiotic microbiota at different sites in NEW GIFT Nile tilapia, and (3) to explore the correlation between intestinal microbiota and metabolites in NEW GIFT Nile tilapia under commercial aquaculture conditions. Results provide basic support for the nutritional health and disease prevention of farmed tilapia in aquaculture.

2. Materials and Methods

2.1. Sample Collection and Preparation

Nile tilapia (NEW GIFT strain of Oreochromis niloticus) was sourced from the same batch of artificially incubated seeds and raised in flow-through aquaculture systems at Yingshan County, Huanggang City, Hubei Province, China. The experimental water was from a warm spring in the local mountain, and the water quality was fresh and unpolluted. After oxygenation and purification treatment in the aeration tank, all water quality parameters were within the normal range for tilapia. The water temperature was kept at about 28.5 °C, which was within the optimal temperature range for tilapia farming [20,21]. The fish were fed with the commercial diet at a daily rate of 3% body weight during the farming stage. The feed was provided by Huai’an TianShen Feed Co., Ltd., China (crude protein ≥ 30.0%, crude fat ≥ 4.5%, crude fiber ≥ 9.0%, crude ash ≥ 12.0%, total phosphorus ≥ 0.8%, sodium chloride 0.4–4.0%, lysine ≥ 1.7%, and moisture ≤ 12.5%). No disease symptoms were observed in the fish for 3 months before and after sampling.
Twelve adult tilapias with nearly same size (mean weight, 0.24 ± 0.02 kg) were randomly sampled from four ponds (three fish from each pond) on 20 October 2016. The four ponds had very similar characteristics, including fish density, weight, and the exact same date of introduction of juveniles. The sampled fish were anesthetized using an MS-222 (Sigma, Darmstadt, Germany) solution and then washed with 70% ethanol to reduce contamination before dissection. Under sterile conditions, the gill filaments in the middle of branchial arch were collected and washed thrice in sterile 0.9% saline. Then, the stomach and distal intestines (hindgut) were removed from the abdominal cavity, and their contents were collected. Thereafter, the stomachs and distal intestinal segments were washed using sterile 0.9% saline to remove any leftover contents. The stomach mucosae were scraped with sterile scissors into sterile centrifuge tubes. The intestinal segments and gill filaments were cut into pieces with sterile scissors. To obtain a sufficient bacterial DNA concentration and minimize individual differences [22,23], the gill filaments (G), stomach contents (S), stomach mucosae (W), intestinal contents (C), and intestinal mucosae (M) of three fish from the same pond were pooled and homogenized as one sample (four replications per sample type). The gill filaments, stomach mucosae, and intestinal mucosae were collectively regarded as the mucosa samples. The stomach and intestinal contents were collectively regarded as the digesta samples. All samples were snap frozen in liquid nitrogen and kept frozen at −80 °C.

2.2. DNA Extraction, PCR Amplification, and Miseq Sequencing

Total genomic DNA was extracted from the pooled samples using the QIAamp® DNA Stool Mini Kit (Qiagen, Hilden, Germany) according to the manufacturer’s instructions. The purity and concentration of the extracted DNA were checked using a NanoDrop 2000 spectrophotometer (Thermo Fisher Scientific, Waltham, MA, USA). The extracted DNA was diluted to 10 ng μL−1 and stored at −80 °C for downstream research. The primers 515F (5’-GTGCCAGCMGCCGCGGTAA-3’) and 909R (5’-CCCCGYCAATTCMTTTRAGT-3’) with a 12 nt unique barcode at 5′-end of 515F were used to amplify the V4–V5 hypervariable region of the 16S rRNA gene [24]. The PCR amplification was conducted in duplicate with a PCR mixture (25 μL) that contained 1 × PCR buffer, 1.5 mM MgCl2, each deoxynucleoside triphosphate at 0.4 μM, each primer at 1.0 μM, and 0.5 U of Ex Taq (TaKaRa, Dalian, China) and 10 ng DNA template. The PCR amplification program included an initial denaturation at 94 °C for 3 min, followed by 30 cycles of 94 °C for 40 s, 56 °C for 60 s, 72 °C for 60 s, and a final extension at 72 °C for 10 min.
After PCR amplification, the PCR products were purified using a DNA Gel Extraction Kit (Sangon Biotech, Shanghai, China) and pooled with equimolar quantity. The TruSeq® DNA PCR-Free Sample Preparation Kit was used to construct the library according to manufacturer’s instructions. After quantification by Qubit and qPCR, amplicon libraries were sequenced using the Illumina Miseq platform at the Environmental Genome Platform of Chengdu Institute of Biology, Chinese Academy of Sciences.

2.3. Extraction and Detection of Metabolites

Metabolite extraction and detection from the intestinal content samples were performed according to previous studies [25] with some modifications. Fresh intestinal content samples at 100 mg were ground using liquid nitrogen and transferred into 5 mL centrifuge tubes. Then, 500 μL of ddH2O (4 °C) were added and vortexed for 60 s, followed by 1000 μL of methanol (pre-cooled at −20 °C), 60 μL of 2-chloro-L-phenylalanine (0.2 mg/mL stock in methanol), and 60 μL of heptadecanoic acid (0.2 mg/mL stock in methanol) as the internal quantitative standard and vortex for 30 s. The tubes were placed into an ultrasound machine at room temperature for 10 min and then stewed for 30 min on ice. The tubes were centrifuged for 10 min at 12,000 rpm (4 °C), and 1.2 mL of the supernatant was transferred into a new centrifuge tube. Samples were blow-dried by vacuum concentration. A methoxyamine pyridine solution (60 μL of 15 mg/mL) was then added. The solution was vortexed for 30 s and reacted for 120 min at 37 °C. Then, 60 μL of a BSTFA reagent (containing 1% TMCS) were added into the mixture and reacted for 90 min at 37 °C. The mixture was centrifuged for 10 min at 12,000 rpm (4 °C), and the supernatant was transferred to an inspection bottle. For the quality control (QC) samples, 20 µL from each prepared sample extract was mixed. These QC samples were used to monitor deviations of the analytical results from these pool mixtures and to compare them to the errors caused by the analytical instrument itself. Finally, the rest of the samples were used for GC-MS test detection.
After the above reactions, samples were determined for metabolites using an Agilent 7890A GC system coupled to an Agilent 5975C inert XL EI/CI mass spectrometric detector (MSD) system (Agilent Technologies, Santa Clara, CA, USA). Gas chromatography was performed on a HP-5MS capillary column (5% phenyl/95% methylpolysiloxane 30 m × 250 μm i.d., 0.25 μm film thickness, Agilent J & W Scientific, Folsom, CA, USA) to separate the derivatives at a constant flow of 1 mL/min helium. Then, 1 µL of the sample was injected in split mode in a 20:1 split ratio by the auto-sampler. The injection temperature was 280 °C. The interface set to 150 °C, and the ion source was adjusted to 230 °C. The programs of temperature-rise were followed by an initial temperature of 60 °C for 2 min at 10 °C/min rate up to 300 °C and maintained at 300 °C for 5 min. Mass spectrometry was determined by full-scan method within the range of 35–750 (m/z).

2.4. Metabolite Profiling Analysis

Raw gas chromatography/mass spectrometry (GC/MS) data were converted into the netCDF (network Common Data Form) format (namely XCMS input file format) via an Agilent MSD ChemStation workstation [26]. The XCMS (www.bioconductor.org; 8 June 2017) package in the R software (v3.1.3) was used to conduct peak identification, filtration, and alignment. The data matrixes, including the mass to charge ratio (m/z), retention time, and intensity, were obtained. The annotation of metabolites using the Automatic Mass Spectral Deconvolution and Identification System (AMIDS) was searched against commercially available databases, such as National Institute of Standards and Technology (NIST) and Wiley Registry Metabolomics Database. The alkane retention indices provided by the Golm Metabolome Database (GMD) (http://gmd.mpimp-golm.mpg.de/; 8 June 2017) were used for the further qualitative characterization of substances. Most substances were further confirmed by the standard. The data were derived to Microsoft Excel (Microsoft, Redmond, WA, USA). Finally, the data were normalized to the internal standard for further statistical analyses.

2.5. Sequencing Data Processing

The paired-end reads from the raw DNA fragments were merged by FLASH software and quality-filtered by Trimmomatic with the following data decontamination methods and parameters. (1) The 300 bp reads were truncated at any site receiving an average quality score <20 over a 50 bp sliding window, and then the truncated reads that were shorter than 50 bp were discarded. Reads containing N-bases were also removed. (2) The pair-end reads were merged into a sequence according to their overlap relationship, and the minimum overlap length was 10 bp. (3) The maximum mismatch ratio allowed in the overlap area of the merged sequence was 0.2. (4) Samples were distinguished and the direction of the sequence was corrected based on the barcode and primer sequences at both ends of the sequence. The number of mismatches allowed in the barcode was 0, and the maximum number of mismatched primers was 2. Operational taxonomic units (OTUs) were clustered with a 97% similarity cut-off using UPARSE (version 7.0 http://drive5.com/uparse/; accessed on 27 August 2020), and chimeric sequences were identified and removed using UCHIME. The taxonomy of each OTU representative sequence was analyzed by an RDP classifier (http://rdp.cme.msu.edu/; accessed on 27 August 2020) against the Bacterial Silva 16S rRNA database (SILVA SSU 138).

2.6. Bioinformatics and Statistical Analyses

Sequences from each sample were randomly resampled to 4098 reads based on the minimum number of valid sequences in the samples to eliminate the effect of sequencing depth on subsequent analyses. Alpha-diversity was estimated with the richness indices of the observed richness (OTUs) and Chao, the diversity indices of Shannon and Simpson, and Good’s coverage (coverage). Beta-diversity was analyzed with principal coordinates analysis (PCoA) and analysis of similarity (ANOSIM) based on the Bray-Curtis metric. The linear discriminant analysis (LDA) effect size (LEfSe) is an algorithm used for the high-dimensional biomarker discovery and explanation that identify genomic features characterizing the differences under two or more biological conditions [27]. In the present study, an LEfSe analysis was performed to identify microbial biomarkers and functional differences with the alpha parameter of 0.05 and an LDA threshold value of 3.5. Differences between two independent groups were evaluated using the Welch’s t-test (Past, version 3.15) [28]. The p-value was corrected using the Bonferroni method.
The Phylogenetic Investigation of Communities by Reconstruction of Unobserved States (PICRUSt) is widely used to predict microbial functions and metabolic pathways [29]. PICRUSt2 predictions based on several gene family databases, including the Kyoto Encyclopedia of Genes and Genomes (KEGG) orthologs and Enzyme Commission numbers, were supported by default [30]. In the present study, the functional profiles of the bacterial communities were predicted using the PICRUSt2 from the KEGG pathways. The accuracy of the functional predictions was assessed through the computation of the Nearest Sequenced Taxon Index (NSTI) and decreased with increasing NSTI value [29]. The statistical analysis of the microbial function was performed using the Statistical Analysis of Metagenomics Profiles [31]. Data were expressed as mean ± standard deviation (n = 4), and the significance level of the difference was set at 0.05 or 0.01.

3. Results

3.1. Diversity and Structure of the Bacterial Communities

After the quality filtering process, 262,861 valid reads (ranging from 4098 to 31,832 per sample) were obtained from all 20 samples. Then, after random resampling, the reserved sequences were clustered into a total of 487 OTUs. The Good’s coverage ranged from 98.58% to 99.78% (99.43 ± 0.40%; Table S1). The rarefaction curves tended to the plateau level, and the Shannon curves were stable (Figure S1A,B). These results indicated that the majority of the microbial diversity present in the samples was detected.
Statistical analysis showed that no significant differences (Welch t-test; p > 0.05) were found in the richness and diversity of the bacterial communities among the three types of mucosa samples (G, M, and W), as evaluated with the richness estimators of OTUs and Chao 1 and with the diversity indices of Shannon and Simpson (Figure 1A–D; Table S1). Notably, the richness and diversity indices showed that the bacterial communities of the mucosa samples had significantly lower richness and diversity values than those of the digesta samples (C and S) (Figure 1A–D; Table S1). Furthermore, the bacterial communities of the stomach contents were significantly richer and more diverse than those of the intestinal contents (Figure 1A–D; Table S1).
Multivariate statistical analyses were conducted to compare the integral structure of the bacterial communities in different sites. ANOSIM revealed significant differences (p = 0.034) in the bacterial community structures between any two gastrointestinal sites (Table S2). The PCoA plot visualized the ANOSIM results, which showed distinct separations of the bacterial communities among four gastrointestinal sites (Figure 2A). Overall, the two principal coordinates obtained from the PCoA explained 59.56% of the variations among all samples. Interestingly, no significant difference (R = −0.0417, p = 0.497) was observed in the bacterial communities between the gill and stomach mucosae (Table S2 and Figure 2A). The hierarchical clustering tree on OTU level disclosed that the bacterial communities in the intestinal content samples clustered into one branch first and then clustered with the stomach content samples, whereas the gills and stomach mucosa samples clustered together into another branch (Figure 2B).

3.2. Taxonomic Composition of the Bacterial Communities

The phylogenetic classification of sequences from all samples was assigned to 27 bacterial phyla, 64 classes, 132 orders, 184 families, 258 genera, and 487 OTUs (Table S1). At the phylum level, Proteobacteria was the most abundant phylum in all sites, accounting for 33.00%–95.35% of the total classified sequences (Figure 3A). Actinobacteria and Firmicutes were the second major phyla in the gill mucosae, intestinal contents, and stomach mucosae. The stomach contents had Bacteroidota and Cyanobacteria, whereas the intestinal mucosae had Firmicutes, Fusobacteria, and Deinococcota. In addition, by comparing the mucosa samples with the digesta samples, we found that Proteobacteria was significantly enriched (p < 0.05) in the mucosa samples, whereas Bacteroidota, Cyanobacteria, Verrucomicrobia, and Chloroflexi were significantly enriched (p < 0.05) in the digesta samples (Table S3). Notably, the relative abundance values of Firmicutes present in the intestinal content samples were significantly higher than those in the stomach content samples (Welch t-test; p < 0.05).
At the genus level, the bacterial communities in the gill and stomach mucosae were dominated by Sphingomonas and Ralstonia, followed by unclassified Comamonadaceae, Pelomonas, Methylobacterium-Methylorubrum, Amnibacterium, and Roseomonas (Figure 3B). The genera Undibacterium, Escherichia-Shigella, Paeniclostridium, and Cetobacterium were predominant in all intestinal samples, including intestinal contents and mucosae (Figure 3B). The stomach contents had the maximum number of bacterial taxa, in which the dominant taxa included no-rank Chitinophagaceae, no-rank chloroplast, unclassified Comamonadaceae, and no-rank Verrucomicrobiae, followed by unclassified Rhodocyclaceae and Cetobacterium (Figure 3B).

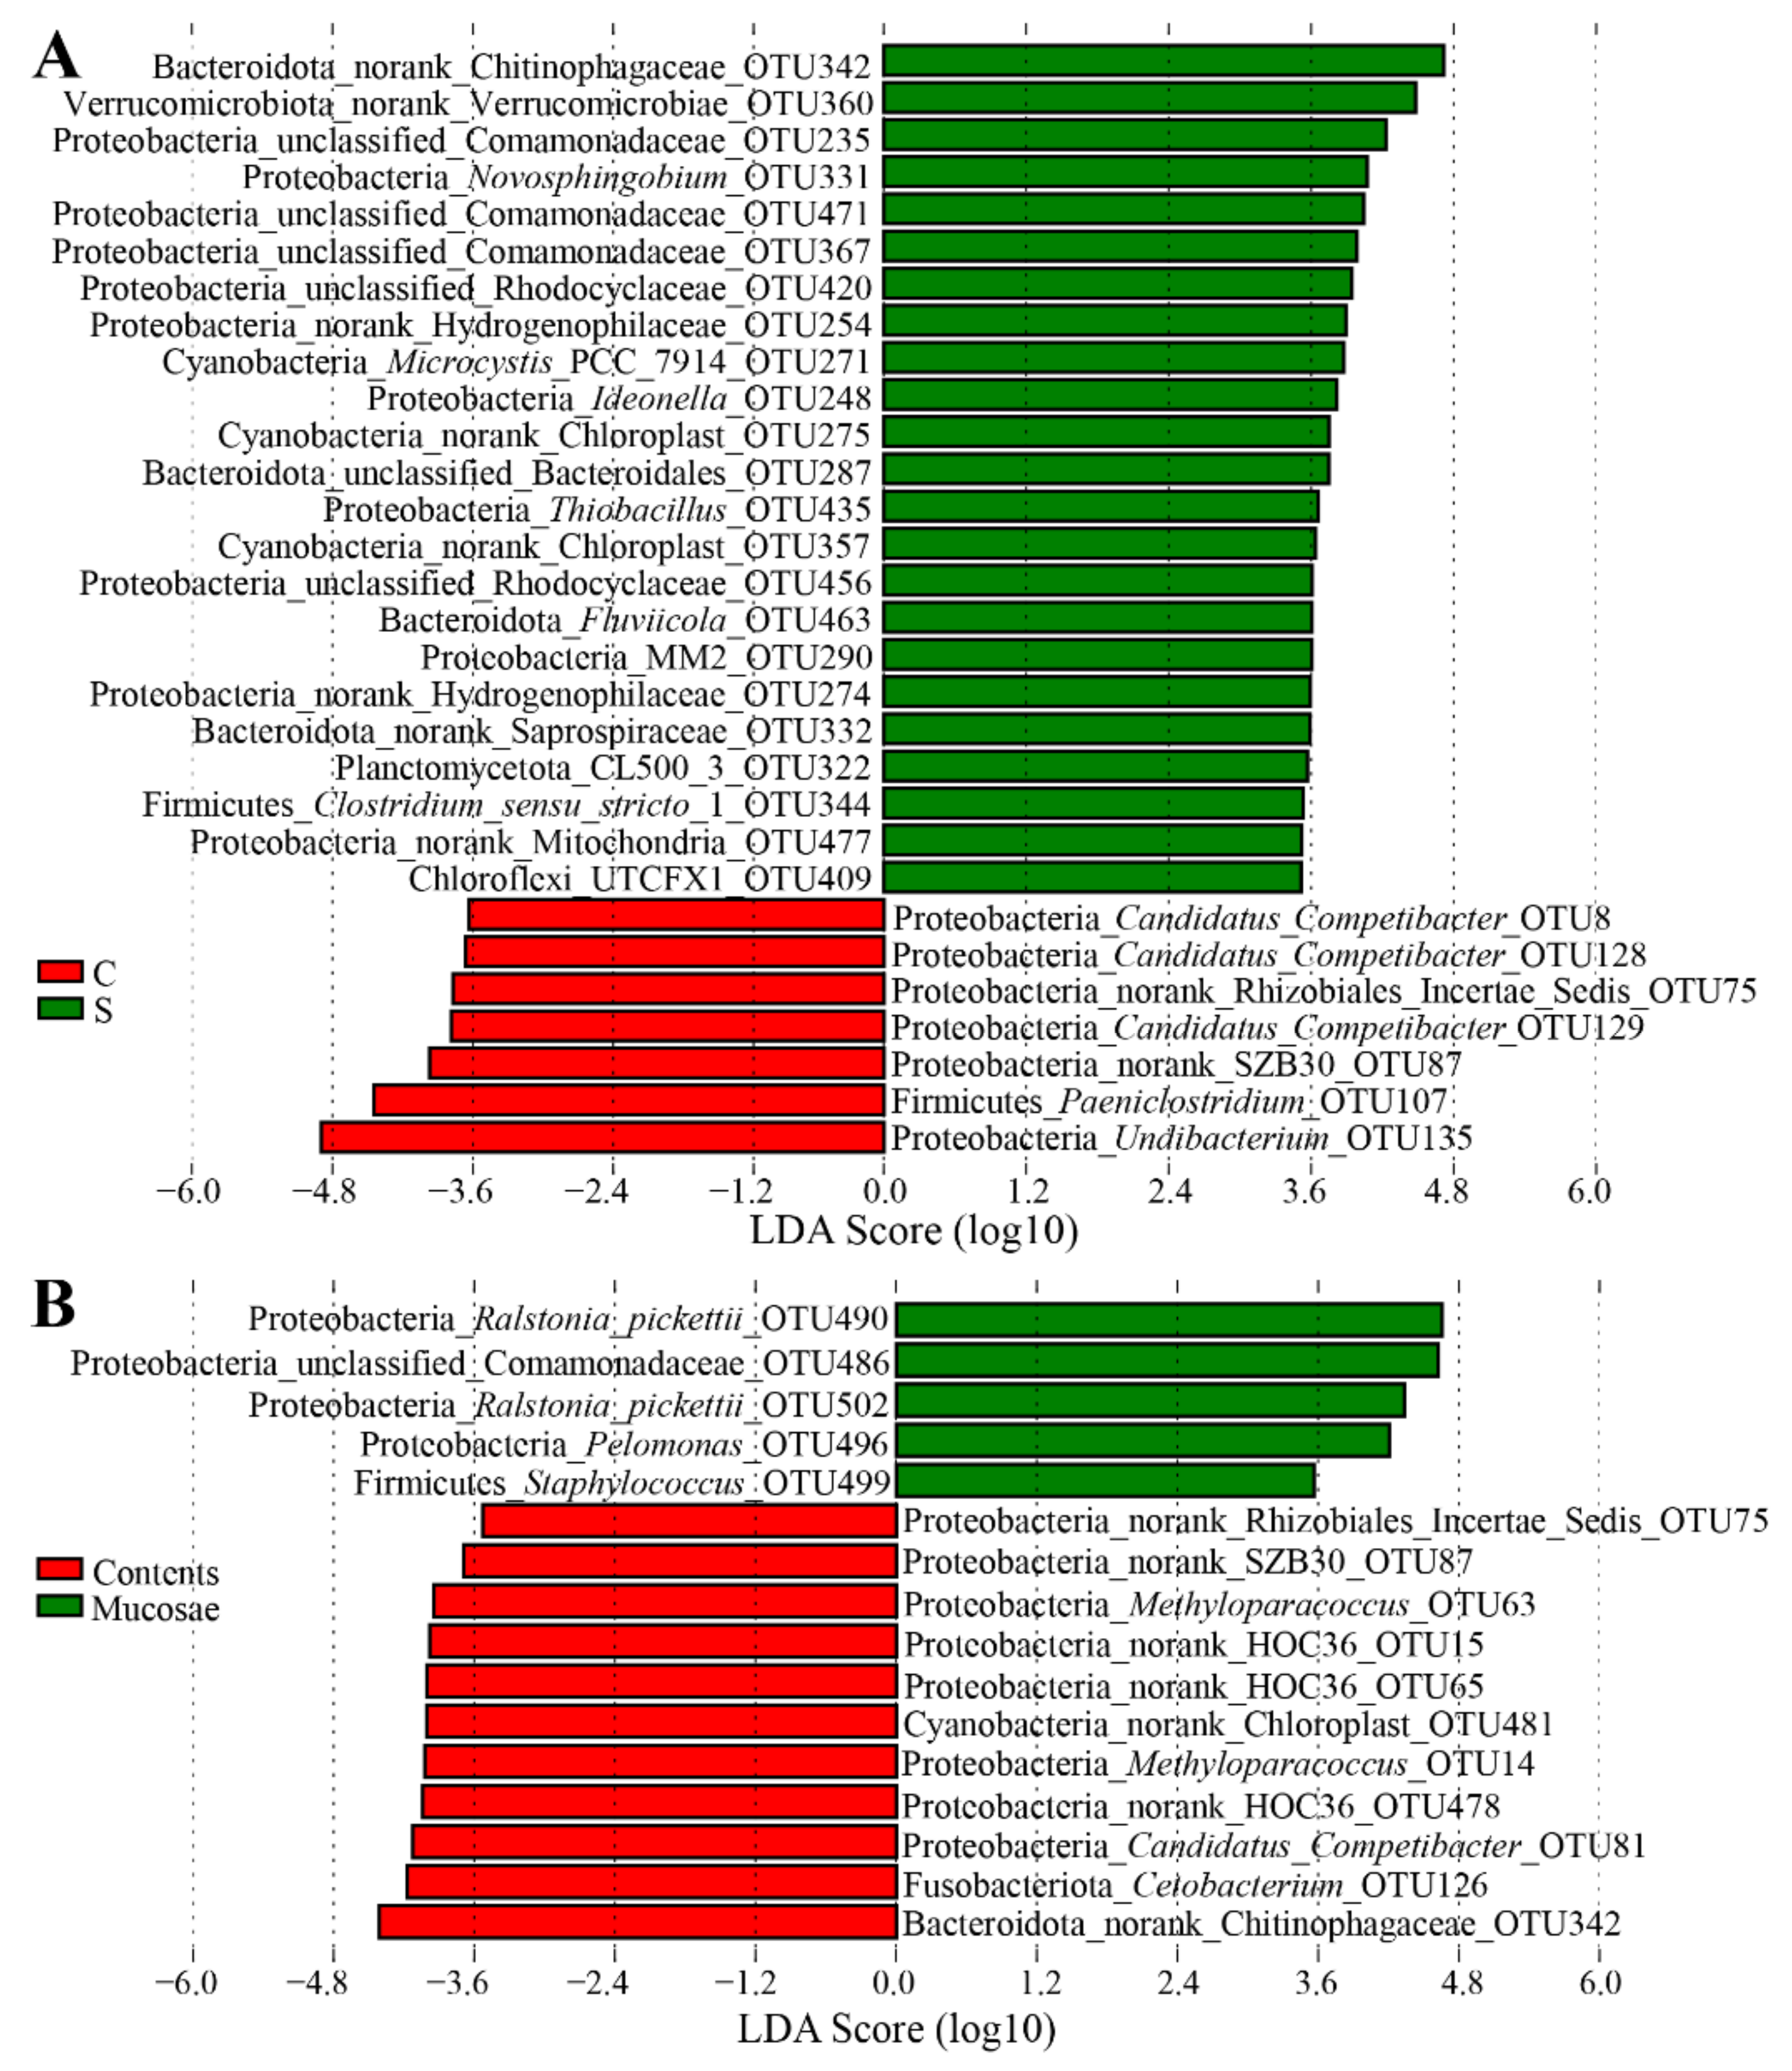
3.3. Differences of the Bacterial Communities at Different Sites

The co-occurrence network analysis on the OTU level (relative abundance ≥ 0.5%) differentiated the microbiota among the five sites. The bacterial communities in the gill and stomach mucosae were separate from those in the intestinal contents, mucosae, and stomach contents. Most dominant OTUs in the bacterial communities between the gill and stomach mucosae were shared, suggesting that these two sites had similar core species, including Sphingomonas aquatilis, Ralstonia pickettii, and Roseomonas gilardii, as well as unclassified species belonging to Comamonadaceae, Methylobacterium-Methylorubrum, Pelomonas, Amnibacterium, and Staphylococcus (Figure S2 and Table S4). The core species in the stomach contents belonged to Chitinophagaceae, Verrucomicrobiae, chloroplast, Comamonadaceae, Novosphingobium, and Cetobacterium. Though the intestinal contents and mucosae had distinct core species, some shared bacterial species were found between these two sites, including bacterial species belonging to Undibacterium, Escherichia-Shigella, and Paeniclostridium (Figure S2 and Table S4).
We further confirmed the presence of different OTUs in different sites by LEfSe. LEfSe identified 35 discriminative features (LDA score > 3.5) between the stomach contents and mucosae, in which 28 OTUs was significantly enriched in the stomach contents, including the most dominant Chitinophagaceae sp. OTU342, Verrucomicrobiae sp. OTU360, Comamonadaceae sp. OTU235, chloroplast sp. OTU481, Novosphingobium OTU331, and Cetobacterium OTU126 (Figure 4A). Conversely, only seven OTUs were significantly enriched in the stomach mucosae, as follows: Sphingomonas aquatilis OTU498 and OTU488, Methylobacterium-Methylorubrum OTU491, R. gilardii OTU497, Amnibacterium OTU161 and OTU484, and Staphylococcus OTU499 (Figure 4A). Regarding the intestinal content samples, Escherichia-Shigella OTU206 and Undibacterium OTU173 were significantly enriched in the intestinal mucosae, whereas some OTUs were significantly enriched in the intestinal contents, including several OTUs from Gammaproteobacteria and Candidatus Competibacter, Cetobacterium OTU126, Rhizobiales Incertae Sedis sp. OTU75, Arenicellaceae sp. OTU10, and Sarcina OTU76 (Figure 4B). By comparing two types of digesta samples, we found that seven OTUs belonging to Undibacterium, Paeniclostridium, SZB30 (an order affiliated to Gammaproteobacteria), Candidatus Competibacter, and Rhizobiales Incertae Sedis were significantly enriched in the intestinal content samples, whereas 23 dominant OTUs were significantly enriched in the stomach content samples, including OTUs belonging to Chitinophagaceae, Verrucomicrobiae, Comamonadaceae, Novosphingobium, and chloroplast (Figure 5A). By comparing the mucosa samples with the digesta samples, we found that five OTUs belonging to Pelomonas, R. pickettii, Comamonadaceae, and Staphylococcus were significantly enriched in the mucosa samples, whereas eleven OTUs were significantly enriched in the digesta samples, including OTUs belonging to Chitinophagaceae, Rhizobiales Incertae Sedis, chloroplast, HOC36, Cetobacterium, SZB30, Methyloparacoccus, and Candidatus Competibacter (Figure 5B).
The gill mucosae were characterized by a preponderance of Comamonadaceae sp. OTU486, R. pickettii OTU490, S. aquatilis OTU488, and unclassified bacteria OTU160 (Figure S3). The stomach contents were characterized by a preponderance of chloroplast sp. OTU481 and Cyanobium PCC 6307 OTU374 from Cyanobacteria, as well as Clostridium sensu stricto 1 OTU344, whereas the stomach mucosae were characterized by a preponderance of R. pickettii OTU502 and Staphylococcus OTU499 (Figure S3). The intestinal contents were characterized by a preponderance of HOC36 sp. OTU65, OTU15, and OTU478; SZB30 sp. OTU87 and OTU148; and Cetobacterium OTU126 and Sarcina OTU147; meanwhile, the intestinal mucosae were characterized by a preponderance of Escherichia-Shigella OTU206 and Aeromonas OTU199 (Figure S3).

3.4. Intestinal Metabolite Profile and Its Correlation with Intestinal Microbiota

In this study, 95 different metabolites were detected in the intestinal contents, including amino acids, lipids, carbohydrates, nucleotides, and vitamins, by means of GC/MS analysis. The metabolite profiles are presented in Figure S4. The metabolite profiles of intestinal contents were dominated by phosphoric acid and leucine, followed by isoleucine, lactic acid, glutamic acid, and glycerol. Spearman correlation heatmaps showed significant correlations (p < 0.05) between the intestinal bacterial genera and metabolites (Figure 6A,B and Figure 7A,B). Mycobacterium and Desulfomonile were negatively correlated with changes in ornithine, glycine, alanine, proline, 9,12-(Z,Z)-octadecadienoic, glycerol, methyl-inositol, succinic acid, 3-hydroxypyridine, and adenine. Alsobacter, Acinetobacter, Cyanobium PCC-6307, and Turicibacter were negatively correlated with changes in 2-hydroxyglutaric acid, homoserine, 2-oxoisocaproic acid, glucose, uridine, inosine, and pantothenic acid, but they were positively correlated with changes in rhamnose. Escherichia-Shigella and Paeniclostridium were negatively correlated with changes in malonic acid, 2-ketoglutaric acid, hexadecanoic acid, phosphoric acid, 1-monooctadecanoylglycerol, monomethylphosphate, 9-(Z)-hexadecenoic acid, tetradecanoic acid, cholesterol, erythronic acid, maltose, mannose, xylose, xylitol, threonic acid, ribose, ribitol, uracil, nicotinic acid, 1,3-di-tert-butylbenzene, 2,4,6-tri-tert-butylbenzenethiol, and benzoic acid. Aeromonas were negatively correlated with changes in pyroglutamic acid, 4-hydroxyproline, 1-monohexadecanoylglycerol, myo-inositol, myo-inositol-1-phosphate, glycerol-3-phosphate, fumaric acid, 9,12,15-(Z,Z,Z)-octadecatrienoic acid, eicosanoic acid, glyceric acid-3-phosphate, glycolic acid, malic acid, glucose-6-phosphate, fructose-6-phosphate, sorbitol-6-phosphate, sucrose, and threitol. Syntrophus were negatively correlated with changes in N-acetylglutamic acid, 4-aminobutyric acid, octadecanoic acid, and arachidonic acid but positively correlated with changes in cysteine, aspartic acid, and methionine. Sarcina and Pirellula were positively correlated with changes in beta-alanine but negatively correlated with changes in 2-amino-butyric acid. Undibacterium was positively correlated with changes in ornithine, glycine, alanine, proline, 9,12-(Z,Z)-octadecadienoic acid, glycerol, methyl-inositol, succinic acid, 3-hydroxypyridine, and adenine. Crenothrix and Cetobacterium were positively correlated with changes in urea, glyceric acid, citric acid, fructose, pyruvic acid, mannitol, glucaric acid, and gluconic acid, but they were negatively correlated with changes in ribonic acid. Clostridium sensu stricto 1 was negatively correlated with changes in docosahexaenoic acid. Romboutsia, Methylocaldum, Desulfobacca, and Methylocystis was negatively correlated with changes in lactic acid (Figure 6A,B and Figure 7A,B). The findings revealed a significant interdependence between intestinal metabolites and microorganisms.

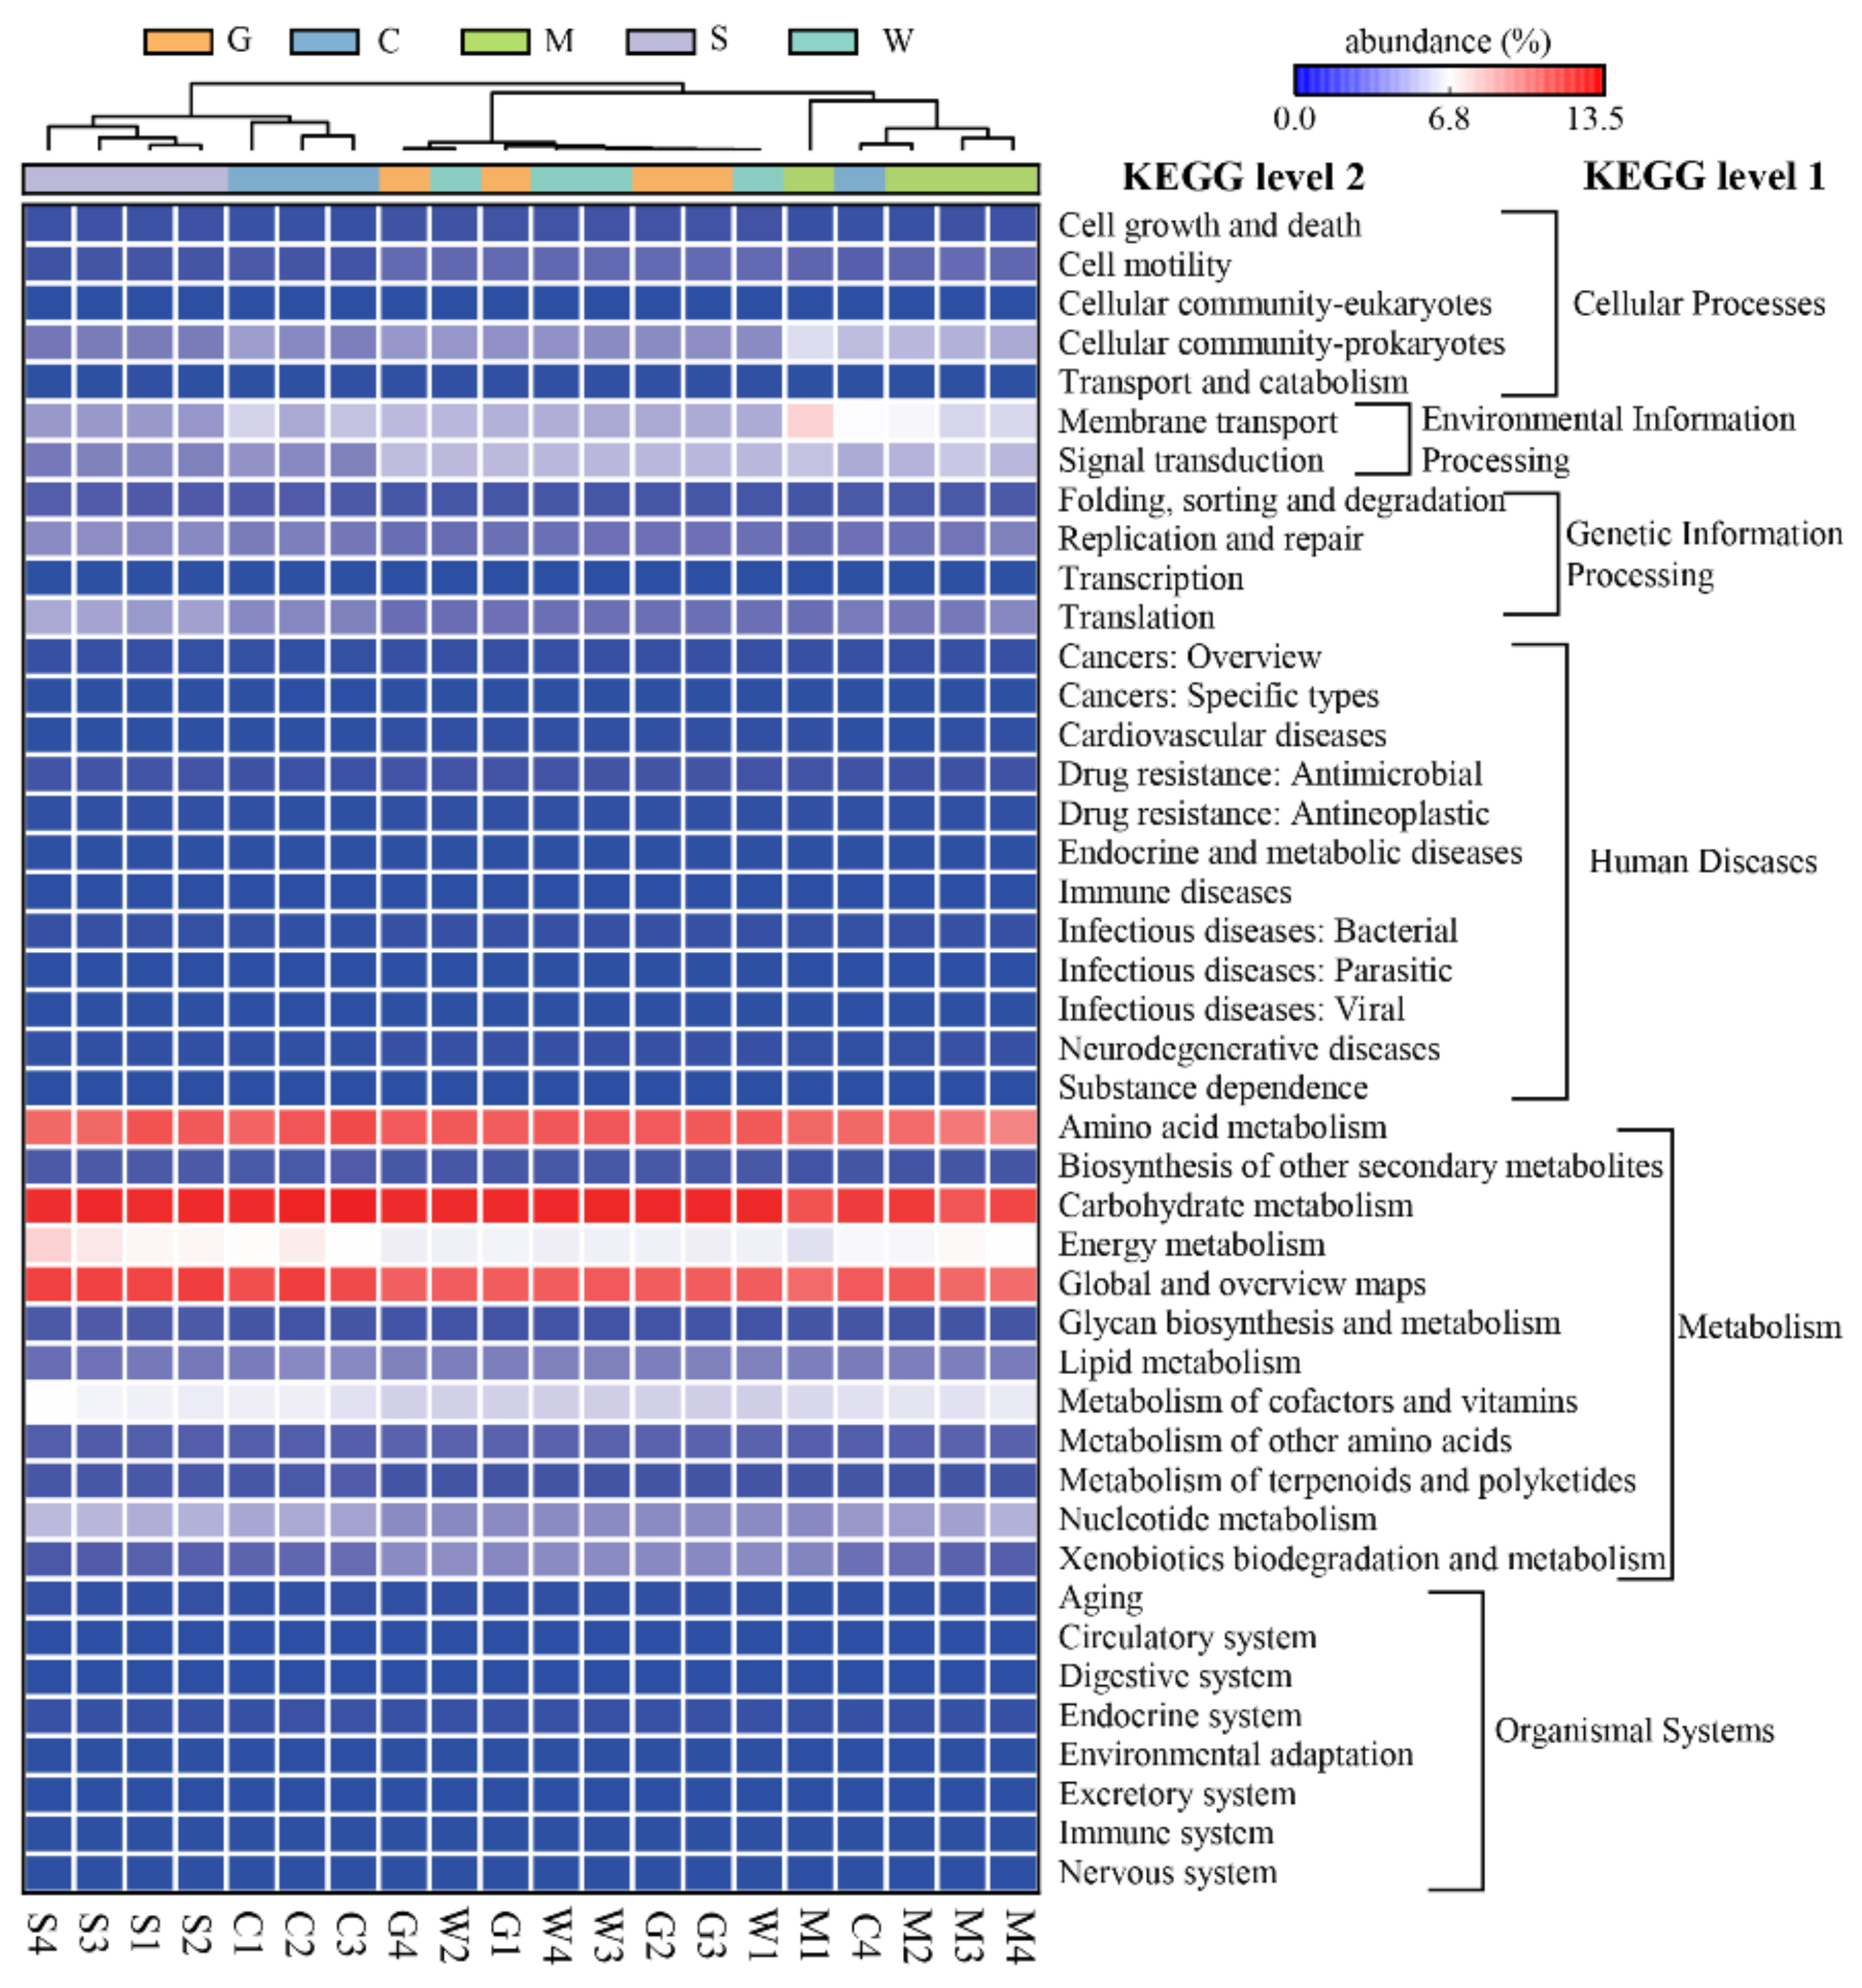
3.5. Functional Prediction of the Bacterial Communities

PICRUSt2 analysis was conducted to predict the microbial functions of the bacterial microbiota. The mucosa samples had significantly lower (Welch t-test; p < 0.05) NSTI values than the digesta samples (Table S5). The accuracy of the PICRUSt2 in predicting the microbial function of fish mucosae was significantly higher than that of fish digesta. For comparison, Human Microbiome Project samples had the lowest NSTI values (0.03 ± 0.02), whereas the hypersaline mat microbiome samples had the highest NSTI values (0.23 ± 0.07) [29]. Thus, the PICRUSt2 had a high accuracy in predicting the microbial function of fish mucosa samples. ANOSIM revealed that that no significant difference (p > 0.05) was found between gill and stomach mucosae, but significant differences (p < 0.05) were found in the predictive function of the bacterial communities between any two sites (Table S2).
Based on the KEGG pathways, the bacterial communities in all the samples were enriched with functional categories related to metabolism (65.64%), environmental information processing (9.71%), genetic information processing (8.90%), and cellular processes (8.08%) (Figure 8). At KEGG level 2, a large proportion of microbial functions belonged to carbohydrate metabolism, global and overview maps, amino acid metabolism, energy metabolism, metabolism of cofactors and vitamins, membrane transport, and signal transduction (Figure 8). The functional clustering analysis based on average neighbor (unweighted pair-group method with arithmetic means (UPGMA)) showed that the gill and stomach mucosa samples clustered together into one branch and then clustered with the intestinal mucosa samples, whereas the digesta samples, including the stomach and intestinal contents clustered together into another branch except for one sample (Figure 8). Further ANOSIM revealed significant differences (R = 0.8152, p = 0.0001) in the microbial functions between the mucosa and digesta samples. The PCA plot disclosed that the microbial functions in the mucosa samples were separated from those in the digesta samples, which were primarily separated by the PC1 axis, accounting for 59.5% of the variation (Figure S5). By comparing the mucosa samples with the digesta samples, some microbial functions were found to be significantly enriched in the digesta samples, including global and overview maps, nucleotide metabolism, metabolism of cofactors and vitamins, metabolism of terpenoids and polyketides, translation, folding, sorting and degradation, transcription, and the immune system (Figure 9). Conversely, the predictive functions related to the metabolism of other amino acids, xenobiotics biodegradation and metabolism, signal transduction, cell motility, the circulatory system, environmental adaptation, and human diseases were significantly enriched in the mucosa samples (Figure 9).

4. Discussion

The complex microbiota of fish have received much attention due to their important role in fish health [19]. However, the characteristics of the bacterial communities in the NEW GIFT strain of farmed Nile tilapia, especially the mucosa-associated microbiota, remains scarce. Here, we first characterized the composition and function of the bacterial microbiota in the gill contents, gastrointestinal contents, and mucosae, and we explored the correlation between intestinal microbiota and metabolites in NEW GIFT Nile tilapia under commercial aquaculture conditions. A recent study explored the distribution of the intestinal microbiota in Nile tilapia from two lakes [32], but the wild tilapia was not the new tilapia strain we studied and was not farmed under commercial aquaculture conditions. The functional differences of the bacterial communities at different sites of tilapia were not clearly elucidated, and the correlation between specific intestinal microbes and metabolites was undetermined. Our results provided new insights into the symbiotic microbiota of NEW GIFT Nile tilapia and highlighted the correlation between intestinal microbes and metabolites. Furthermore, understanding the correlation between specific microbes and intestinal metabolites can provide new ideas to improve the health and productivity of this commercially valuable fish species.
To date, the distinct distribution of the microbial communities in different gastrointestinal segments has already been reported in various aquatic animals, including shrimp [33], Atlantic salmon [34], Siberian sturgeon [35], and finless porpoise [36]. Obvious differences exist in the microbial composition and structure of different tissues (skin, gill, and intestine) and digesta (feces) of fish [37]. In this study, the microbiota structures of four gastrointestinal sites were clearly separated, as shown in previous studies on wild tilapia [32] and other animals [33,34,35,36]. Such significant differences in microbial structure led to significant differences in microbial function, which could be attributed to the functional heterogeneity of the gastrointestinal tract, because the stomach is the main site of diet fermentation and the hindgut plays an important role in nutrient absorption [38]. No significant differences were found in the bacterial community structure and composition between the stomach and gill mucosae, which might have been due to the similarity of mucosal niches between these two sites [10]. In addition, three mucosa sites had no significant differences in terms of microbial diversity and displayed a lower microbial diversity compared with the digesta. Our results were consistent with those in previous studies, in that no significant differences in microbial diversity were found at different fish gastrointestinal mucosa sites [34,39]. Moreover, results from other studies showed that several fish had significantly lower richness and diversity for the gastrointestinal mucosa-associated microbiota compared with the digesta-associated microbiota [34,40], which was consistent with our results. The mucosal epithelial cells of fish can secrete immune factors that interact with the mucosal symbiotic microbiota, thereby shaping and restricting the colonization of the microbes [41]. Thus, only a fraction of the bacteria in the intestinal digesta have the characteristics necessary for colonizing the mucosa of fish [41]. This finding might be important to explain the low mucosal microbial diversity. However, a recent study revealed that no significant difference was found in the alpha and beta diversities of the bacterial communities between the intestinal content and intestinal mucosae of wild tilapia in lakes [32]. This divergence was likely due to differences in the lake’s natural water and farmed water environments, as well as fish food sources. Regarding the digesta, the stomach contents displayed a significantly higher microbial diversity compared with the intestinal contents, which was consistent with previous studies on wild tilapia [32], finless porpoises [36], and Rhabdophis subminiatus [39]. An explanation may be ascribed to feeding behavior, in which the diet has a high microbial diversity due to its exposure to the water environment containing diverse microorganisms [42], thus resulting in a high microbial diversity in the stomach digesta. Different gastrointestinal regions have distinct physicochemical conditions such as the pH value, redox potential, oxygen concentration, and availability of nutrients [43]. Therefore, many microorganisms in the stomach contents, especially aerobic microbes, cannot survive after entering the intestine, thereby significantly decreasing the microbial diversity of intestinal contents.
The present study was carried out to increase our knowledge of the bacterial microbiota in the gill and gastrointestinal tract of farmed Nile tilapia. The predominant phylum belonged to Proteobacteria in the gill and gastrointestinal tract of tilapia, which was consistent with current consensus of high levels of Proteobacteria in fish [19]. Furthermore, the relative abundance of Proteobacteria in the mucosa samples was significantly higher than that in the digesta samples. The dominant Proteobacteria may play a vital role in the mucosa’s microbial barrier. Moreover, the Proteobacteria phylum contains a variety of opportunistic pathogens, and their existence may contribute to the stimulation of the development of immune system and to the maintenance of normal immune function [2]. As important sites of microbial symbiosis, the gill and stomach have received less attention compared to the intestine. The present results showed that the gill microbiota were dominated by Proteobacteria, followed by Actinobacteria and Firmicutes, and the findings were generally consistent with results from previous studies on other fish species [7,9]. These bacterial phyla were ubiquitous in the gills of fish. Bacteroidetes reportedly participates in carbohydrate transport and protein metabolism, which are significant for digesting diet [44]. Both Cyanobacteria and Chloroflexi can produce energy through photosynthesis [45]. Verrucomicrobia plays a critical role in polysaccharide degradation [46]. In this study, compared with the mucosa samples, the relative abundance values of Bacteroidota, Cyanobacteria, Verrucomicrobia, and Chloroflexi were significantly enriched in the digesta samples, especially in the stomach contents. This divergence might imply that these microbes were derived from the environment (such as feed and water) but cannot colonize the mucosae in great quantities due to the control of the components of the host immune system [3]. Notably, the relative abundance of Firmicutes present in the intestinal content samples was significantly higher than in the stomach content samples. Microbes within the Firmicutes phylum can produce short-chain fatty acids that can provide nutrition for the intestinal mucosal cells [47]. The enrichment of Firmicutes in the intestine contributes to the maintenance of the normal function of the intestinal mucosa and the regulation of the intestinal microecological environment [43,47]. The relative abundance of Actinobacteria in the intestinal contents was much higher than that in other sites. Actinobacteria can produce various potent antibiotics that can inhibit the growth of the intestinal pathogenic bacteria [48]. Therefore, the enrichment of Actinobacteria might be beneficial to intestinal health.
The gill and stomach mucosae shared the core bacterial genera, including Sphingomonas, Ralstonia, unclassified Comamonadaceae, and Pelomonas, all of which were aerobic microorganisms [49,50,51,52]. This finding suggested that both the gill and stomach mucosae had high oxygen levels, which was consistent with adequate exposure to the environment at the two sites [10]. However, further study is required to explain the similarity between the gill and stomach mucosal microbiota observed in the present study. Sphingomonas is a Gram-negative bacterium whose cell membrane is composed of sphingolipids [51]. Sphingomonas can tightly adhere to cell monolayers and interact with epithelial cells [51]. Human or mammalian T cells can recognize Sphingomonas and induce an immune response [53]. Methylobacterium may be an important genus that can protect the host against pathogens in fish skin [54]. R. gilardii has been recognized as an opportunistic pathogen that can lead to infections, especially in immunocompromised humans [55]. Therefore, the enrichment of S. aquatilis, Methylobacterium, and R. gilardii in the gill and stomach mucosae might play vital roles in stimulating host mucosal immunity and antagonizing pathogen colonization. The relative abundance values of R. pickettii, Pelomonas (affiliated with Comamonadaceae), and Staphylococcus in the mucosa samples were significantly higher than those in the digesta samples. It was generally consistent with recent results on Nile tilapia, which showed that Ralstonia and Pelomonas were the core microbes in the gut and that their relative abundance values in the mucosae were higher than those in the digesta [32]. Ralstonia, Pelomonas, and Staphylococcus were common bacterial genera of human mucosa-attached microbiome [56,57]. Ralstonia was a dominant gut mucosal microbe in cultured sea bass Dicentrarchus labrax [58]. It has been reported that R. picketti can produce various enzymes, including toluene monooxylase [59], lipase [60], and depolymerase [61]. Pelomonas is reportedly involved in various metabolic pathways [62]. Species of Staphylococcus can utilize important cellular metabolites of fatty acids [63]. Therefore, the three microbes might play an important metabolic role in the mucosal niches of the host.
Regarding the intestinal content samples, the genera Undibacterium and Escherichia-Shigella were dominant in the intestinal mucosae, and their relative abundance values were significantly higher than those in the intestinal contents. Undibacterium is a genus of typically aquatic bacteria and has been found in various sources of freshwater environments [64,65]. Additionally, Undibacterium has been described in the intestinal microbiota of shrimp, zebrafish, and bats [66,67,68]. Several species affiliated with the genus Undibacterium reportedly produce various fatty acids and polar lipids [64,65]. Thus, the dominant Undibacterium in tilapia intestines might be involved in lipid metabolism. This inference was confirmed by our results on intestinal metabolites, i.e., Undibacterium was positively correlated with 9,12-(Z,Z)-octadecadienoic acid, glycerol, and methyl-inositol. Escherichia-Shigella is a common opportunistic pathogen in the gastrointestinal tract of fish [18]. Dietary changes resulted in the decrease of Escherichia-Shigella in the gut mucosa of the bullfrog, accompanied by a profound reduction of growth performance and immune function [69]. Though some species within Aeromonas genus are potential pathogens, Aeromonas have been found in the intestinal mucosa of healthy fish [11,40]. Our results showed that the genus Aeromonas was significantly more abundant in the intestinal mucosa than in other sites, which was consistent with previous results [40]. Aeromonas can produce xylanase and cellulase [11]. Escherichia-Shigella and Aeromonas were significantly enriched in the intestinal mucosae than those in other sites. The genus Romboutsia is characterized by the predominance of producing straight-chain saturated and unsaturated fatty acids [70]. Species of the genus Romboutsia are reportedly adapted to the environment in the small intestines [71]. Thus, Romboutsia in the hindgut might be involved in the biosynthesis of straight-chain fatty acids. These mucosa-attached microbes might play a vital role in the maintenance of the normal physiological functions of host mucosae, including mucosal immunity and metabolism.
Comparing two types of digesta, Chitinophagaceae, Verrucomicrobiae, Comamonadaceae, and chloroplast were significantly enriched in the stomach contents, whereas Undibacterium, Paeniclostridium and Candidatus Competibacter were significantly enriched in the intestinal contents. Most of the dominant taxa in the stomach contents were aerobes or facultative anaerobes, including OTUs belonging to Chitinophagaceae, Verrucomicrobiae, and Comamonadaceae [72,73,74]. Paeniclostridium was the third most abundant genus in the intestinal content samples, which was the dominant microbe in the intestinal tract of bats [66]. The genus Cetobacterium was abundant in the intestinal content samples, which was consistent with the results of previous studies on tilapia [14,75]. Notably, compared with the gastrointestinal mucosae, Cetobacterium was significantly enriched in the gastrointestinal contents. Cetobacterium is widely distributed in the intestinal tract of freshwater fish [76]. It can produce vitamin B12 and promote carbohydrate metabolism [76,77]. Since vitamin B12 is a modulator of intestinal microbial ecology [78], the abundance of Cetobacterium in the intestinal tract might suggests that studied tilapias had healthy intestinal microbiota. Additionally, species within the genus Cetobacterium can promote the decomposition of consumed organic debris, phytoplankton, or zooplankton [79]. Therefore, the enrichment of Cetobacterium in the gastrointestinal contents might contribute to tilapia’s digestive function. Together with the abovementioned differences in the structure and diversity, all these microbial divergences revealed the niche differentiation at the organ scale of tilapia’s microbiota [37].
Diet is among the main factors affecting the structure and composition of the intestinal microbiota of genetically improved farmed tilapia [80]. To date, many nutritional factors reportedly affect the structure of host intestinal microbiota, including amino acid [81], fat [82], fructose, and glucose [83]. Though the effects of these nutritional factors on the structure of fish intestinal microbiota have received widespread attention [1], the correlation between specific intestinal microbes and metabolites remains largely unknown. Nutrient is a double-edged sword for the fish’s gut microbiome. Some nutrients can shape healthy gut microbiota, but others may cause an imbalance of gut microbiota [1]. Thus, identifying the interactions between key nutrients and specific microbes may be important for the success of predictive intervention effects. Short-chain fatty acids (SCFAs) are reportedly key bacterial metabolites [47]. SCFAs were not found in the intestinal contents of tilapia, which was consistent with previous results [84]. Lactic acid was the predominant metabolite in the intestinal contents of tilapia, which was consistent with previous results [84]. Lactic acid is an intermediate of glycolysis and can regulate immune response and intestinal mucosal tissue regeneration [85]. Lactic acid was reportedly negatively correlated with the relative abundance values of Romboutsia, Methylocaldum, Desulfobacca, and Methylocystis. The lower relative abundance of Romboutsia in the intestinal contents compared with the intestinal mucosae might be related to the high concentration of lactic acid in the intestinal contents. The gut is essential for absorbing glucose, and inadequate absorption of glucose ultimately affects fish growth [84]. Glucose showed a significantly negative correlation with the relative abundance values of Alsobacter, Acinetobacter, Cyanobium PCC-6307, and Turicibacter, thereby suggesting that these four microbes might have a negative effect on the glucose metabolism in the gut of tilapias. The Spearman correlation heatmap indicated that some metabolites were significantly and positively correlated with the relative abundance values of certain genera but negatively correlated with the relative abundance values of other genera. This phenomenon showed that the metabolites produced by the former might have an inhibitory effect on the latter, suggesting that intestinal metabolites might drive the structure of the bacterial community and regulate the population competition in a direct or indirect way [86].
There are many possibilities in different directions for the correlation between intestinal microorganisms and metabolites. For instance, the relative abundance of Syntrophus was negatively correlated with N-acetylglutamic acid, 4-aminobutyric acid, octadecanoic acid, and arachidonic acid but positively correlated with cysteine, aspartic acid, and methionine. Some metabolites were not significantly correlated with microorganisms because enzymes that produced these metabolites were encoded in organisms [18]. Interestingly, the relative abundance values of some potentially beneficial bacteria, including Undibacterium, Crenothrix, and Cetobacterium were positively correlated with most intestinal metabolites. The genera Undibacterium and Cetobacterium may be involved in the intestinal metabolism, as described above. Crenothrix may be involved in methane oxidation and contribute to methane removal in the gut [87]. These results suggested that these potentially beneficial microbes might play important roles in promoting nutrient digestion and metabolism in the gut. We also observed that the relative abundance values of Mycobacterium, Desulfomonile, Escherichia-Shigella, Paeniclostridium, Aeromonas, Clostridium sensu stricto 1, Alsobacter, Acinetobacter, Cyanobium PCC-6307, and Turicibacter were negatively correlated with most intestinal metabolites. Most of these genera were potential opportunistic pathogens, such as Acinetobacter, Mycobacterium, Escherichia-Shigella, Paeniclostridium, Aeromonas, and Clostridium sensu stricto 1 [66]. Therefore, we hypothesized that an increased proportion of potentially beneficial microbes might contribute to an improvement of intestinal metabolic function, whereas an increased proportion of opportunistic pathogens might impair intestinal metabolic function. The dietary supplementation of probiotics or prebiotics can reshape the gut microbiota of fish [88]. Our experiment revealed the close correlation between specific intestinal microbes and metabolites, which might contribute to screening targeted probiotics or prebiotics and adding them to the feed to regulate the digestion and metabolism of nutrients in the intestinal tract. However, this study did not reveal a causal relationship between metabolites and gut microbiota.
The combination of numerous intestinal microbes in the intestinal contents with the corresponding metabolites provided favorable data support for the evaluation of the function of intestinal microbiota [86]. Our results showed that intestinal metabolites were related to the metabolism of carbohydrates, amino acids, lipids, cofactors, and vitamins, which was generally consistent with the dominant metabolic pathways in the predicted function of the intestinal microbiota. In addition, approximately 66% of the predictive function in the gastrointestinal microbiota was related to metabolic pathways, especially carbohydrate and amino acid metabolisms, which supported the previous consensus that the fish gut microbiota may play important roles in host nutrient metabolism [1]. Such results showed the presence of consistency between the composition or function of intestinal microbiota and intestinal metabolites. Notably, the predictive function of digesta-associated microbiota was significantly different from that of the mucosa-associated microbiota. Compared with the mucosa-associated microbiota, four metabolic pathways—especially global and overview maps—were significantly enriched in the digesta-associated microbiota. This finding suggested that digesta-associated microbiota play a more important role in nutrient metabolism than mucosa-associated microbiota. On the contrary, the pathway for xenobiotics biodegradation and metabolism in the mucosa-associated microbiota was significantly more abundant than those in the digesta-associated microbiota. This might suggest that the mucosa-associated microbiota have a strong capacity for degrading exogenous pollutants or toxic substances, thus protecting mucosal tissues from exogenous damage. Microbial functional differences at different sites of tilapia were revealed, thereby further elucidating the unique function of symbiotic microbiota at different sites. However, the PICRUSt2 remains limited in identifying consistent, differentially abundant functions [30]. Therefore, further metagenomic studies should be conducted to identify the unique function of symbiotic microbiota at different sites.

5. Conclusions

This study is the first to comprehensively characterize the taxonomic and functional profiles of the gill and gastrointestinal microbiota in the NEW GIFT strain of adult farmed Nile tilapia. It was found that the microbial diversity, structure, and predictive function were significantly different across gastrointestinal regions and sample types. Pelomonas, R. pickettii, Comamonadaceae, and Staphylococcus were significantly enriched in the mucosa samples, whereas many bacterial taxa were significantly enriched in the digesta samples, including Chitinophagaceae, Cetobacterium, Candidatus Competibacter, HOC36, Methyloparacoccus, and chloroplast. Additionally, Undibacterium, Escherichia-Shigella, Paeniclostridium, and Cetobacterium were prevalent in the intestinal content and mucosa, whereas S. aquatilis and R. gilardii were commonly found in the gill and stomach mucosae. Interestingly, the relative abundance values of several potentially beneficial microbes were positively correlated with most intestinal metabolites, whereas the relative abundance values of some potential opportunistic pathogens were negatively correlated with most intestinal metabolites. However, the potential function of these related microorganisms and their regulation mechanisms regarding host intestinal metabolism need to be further studied.

Supplementary Materials

The following are available online at https://0-www-mdpi-com.brum.beds.ac.uk/2076-2607/9/3/617/s1, Figure S1. Rarefaction analysis of OTUs clustered at 97% sequence identity of all twenty samples. (A) Rarefaction curves on OTU level of all samples; (B) Shannon curves on OTU level of all samples. Figure S2. The co-occurrence network at the OTU level (average relative abundance >0.5%) among five different sites. Figure S3. LEfSe showing differences in the bacterial communities at the OTU level among five different sites. Figure S4. Heatmap profiles showing the 95 different intestinal metabolites detected in the intestinal contents using GC/MS analysis. Figure S5. Principal component analysis (PCA) visualizing the integral structure dissimilarities of microbial function among five different sites. Table S1. Summary of alpha diversity indices and the number of taxa calculated based on a cutoff of 97% similarity of 16S rRNA sequences in different sites. Table S2. Analysis of similarity (ANOSIM) of the structure and function of the bacterial communities at different sites based on the Bray-Curtis metric. Permutation N = 999; R was assessed by permuting the grouping vector to obtain the empirical distribution of R under the null model; a p-value of less than 0.05 means significant. Table S3. Comparison of dominant phyla (>1%, average relative abundance in all samples) in the bacterial communities of different sites. The same letter indicates no significant differences (p > 0.05) between the two groups, while a different letter indicates significant differences (p < 0.05 or p < 0.01) between the two groups. Table S4. The ten highest average abundant OTUs in the bacterial community of five different sites. Table S5. The Nearest Sequenced Taxon Index (NSTI) values of KEGG function prediction based on the PICRUSt2 at five different sites. The accuracy of the functional predictions is decreased with increasing NSTI value. The same letter indicates no significant differences (p > 0.05) between the two groups, while a different letter indicates significant differences (p < 0.05 or p <0.01) between the two groups.

Author Contributions

Conceptualization, Z.W. and A.L.; methodology, Z.W.; software, Z.W.; validation, A.L.; formal analysis, Z.W.; investigation, Z.W.; resources, Y.L. and J.H.; data curation, Z.W. and S.W.; writing—original draft preparation, Z.W.; writing—review and editing, Z.W. and A.L.; visualization, Z.W.; supervision, Q.Z.; project administration, Q.Z. and J.Z.; funding acquisition, A.L. All authors have read and agreed to the published version of the manuscript.

Funding

This research was funded by the National Natural Science Foundation of China (No. 32073023), the Key Project of Scientific & Technological Innovation of Hubei Province (2018ABA101), Wuhan Science and Technology Project (2019020701011480), FEBL project (2016FBZ04), and “key technology and development of food safety” project of MOST (2019YFC1606000).

Institutional Review Board Statement

The study was conducted according to the guidelines of the Declaration of Helsinki, and approved by the Animal Ethical and Welfare Committee of the Institute of Hydrobiology, Chinese Academy of Sciences, China (approval number: IHBCAS-20160816).

Data Availability Statement

The raw sequencing data were deposited in the NCBI Sequence Read Archive under accession number PRJNA692658 (http://0-www-ncbi-nlm-nih-gov.brum.beds.ac.uk/sra, accessed on January 17, 2021).

Acknowledgments

We would like to acknowledge Shanghai Majorbio Bio-pharm Technology Co., Ltd. for providing the free online platform of the Majorbio I-Sanger Cloud Platform (www.i-sanger.com accessed on August 27, 2020) to analyze the raw data.

Conflicts of Interest

The authors declared no conflict of interest in this study.

References

  1. Banerjee, G.; Ray, A.K. Bacterial symbiosis in the fish gut and its role in health and metabolism. Symbiosis 2017, 72, 1–11. [Google Scholar] [CrossRef]
  2. Gomez, D.; Sunyer, J.O.; Salinas, I. The mucosal immune system of fish: The evolution of tolerating commensals while fighting pathogens. Fish Shellfish Immunol. 2013, 35, 1729–1739. [Google Scholar] [CrossRef] [Green Version]
  3. Lazado, C.C.; Caipang, C.M.A. Mucosal immunity and probiotics in fish. Fish Shellfish Immunol. 2014, 39, 78–89. [Google Scholar] [CrossRef]
  4. Li, X.M.; Ringo, E.; Hoseinifar, S.H.; Lauzon, H.L.; Birkbeck, H.; Yang, D.G. The adherence and colonization of microorganisms in fish gastrointestinal tract. Rev. Aquac. 2019, 11, 603–618. [Google Scholar] [CrossRef]
  5. Cahill, M.M. Bacterial-flora of fishes: A review. Microb. Ecol. 1990, 19, 21–41. [Google Scholar] [CrossRef] [PubMed]
  6. Legrand, T.P.R.A.; Catalano, S.R.; Wos-Oxley, M.L.; Stephens, F.; Landos, M.; Bansemer, M.S.; Stone, D.A.J.; Qin, J.G.; Oxley, A.P.A. The inner workings of the outer surface: Skin and gill microbiota as indicators of changing gut health in yellowtail kingfish. Front. Microbiol. 2018, 8, 2664. [Google Scholar] [CrossRef]
  7. Wang, W.W.; Zhou, Z.G.; He, S.X.; Liu, Y.C.; Cao, Y.N.; Shi, P.J.; Yao, B.; Ringo, E. Identification of the adherent microbiota on the gills and skin of poly-cultured gibel carp (Carassius auratus gibelio) and bluntnose black bream (Megalobrama amblycephala Yih). Aquac. Res. 2010, 41, e72–e83. [Google Scholar] [CrossRef]
  8. Tarnecki, A.M.; Patterson, W.F., III; Arias, C.R. Microbiota of wild-caught red snapper Lutjanus campechanus. BMC Microbiol. 2016, 16, 245. [Google Scholar] [CrossRef] [Green Version]
  9. Minich, J.J.; Poore, G.D.; Jantawongsri, K.; Johnston, C.; Bowie, K.; Bowman, J.; Knight, R.; Nowak, B.; Allen, E.E. Microbial ecology of Atlantic salmon (Salmo salar) hatcheries: Impacts of the built environment on fish mucosal microbiota. Appl. Environ. Microbiol. 2020, 86, e00411-20. [Google Scholar] [CrossRef]
  10. Minich, J.J.; Petrus, S.; Michael, J.D.; Michael, T.P.; Knight, R.; Allen, E.E. Temporal, environmental, and biological drivers of the mucosal microbiome in a wild marine fish, Scomber japonicus. Msphere 2020, 5, e00401-20. [Google Scholar] [CrossRef] [PubMed]
  11. Nayak, S.K. Role of gastrointestinal microbiota in fish. Aquac. Res. 2010, 41, 1553–1573. [Google Scholar] [CrossRef]
  12. Ng, W.K.; Romano, N. A review of the nutrition and feeding management of farmed tilapia throughout the culture cycle. Rev. Aquac. 2013, 5, 220–254. [Google Scholar] [CrossRef]
  13. Dong, H.T.; Techatanakitarnan, C.; Jindakittikul, P.; Thaiprayoon, A.; Taengphu, S.; Charoensapsri, W.; Khunrae, P.; Rattanarojpong, T.; Senapin, S. Aeromonas jandaei and Aeromonas veronii caused disease and mortality in Nile tilapia, Oreochromis niloticus (L.). J. Fish Dis. 2017, 40, 1395–1403. [Google Scholar] [CrossRef]
  14. Haygood, A.M.; Jha, R. Strategies to modulate the intestinal microbiota of Tilapia (Oreochromis sp.) in aquaculture: A review. Rev. Aquac. 2018, 10, 320–333. [Google Scholar] [CrossRef]
  15. Doan, H.V.; Hoseinifar, S.H.; Ringo, E.; Esteban, M.A.; Dadar, M.; Dawood, M.A.O.; Faggio, C. Host-associated probiotics: A key factor in sustainable aquaculture. Rev. Fish Sci. Aquac. 2020, 28, 16–42. [Google Scholar] [CrossRef]
  16. Asaduzzaman, M.; Iehata, S.; Akter, S.; Kader, M.A.; Ghosh, S.K.; Khan, M.N.A.; Abol-Munafi, A.B. Effects of host gut-derived probiotic bacteria on gut morphology, microbiota composition and volatile short chain fatty acids production of Malaysian Mahseer Tor tambroides. Aquac. Rep. 2018, 9, 53–61. [Google Scholar] [CrossRef]
  17. Kuebutornye, F.K.A.; Wang, Z.W.; Lu, Y.S.; Abarike, E.D.; Sakyi, M.E.; Li, Y.; Xie, C.X.; Hlordzi, V. Effects of three host-associated Bacillus species on mucosal immunity and gut health of Nile tilapia, Oreochromis niloticus and its resistance against Aeromonas hydrophila infection. Fish Shellfish Immunol. 2020, 97, 83–95. [Google Scholar] [CrossRef]
  18. Wang, M.; Yi, M.M.; Lu, M.X.; Gao, F.Y.; Liu, Z.G.; Huang, Q.B.; Li, Q.Y.; Zhu, D.X. Effects of probiotics Bacillus cereus NY5 and Alcaligenes faecalis Y311 used as water additives on the microbiota and immune enzyme activities in three mucosal tissues in Nile tilapia Oreochromis niloticus reared in outdoor tanks. Aquac. Rep. 2020, 17, 100309. [Google Scholar] [CrossRef]
  19. Legrand, T.P.R.A.; Wynne, J.W.; Weyrich, L.S.; Oxley, A.P.A. A microbial sea of possibilities: Current knowledge and prospects for an improved understanding of the fish microbiome. Rev. Aquac. 2020, 12, 1101–1134. [Google Scholar] [CrossRef]
  20. Wu, L.H.; Liang, H.L.; Hamunjo, C.M.K.; Ge, X.P.; Ji, K.; Yu, H.; Huang, D.Y.; Xu, H.; Ren, M.C. Culture salinity alters dietary protein requirement, whole body composition and nutrients metabolism related genes expression in juvenile genetically improved farmed tilapia (GIFT) (Oreochromis niloticus). Aquaculture 2021, 531, 735961. [Google Scholar] [CrossRef]
  21. Wu, F.; Wen, H.; Tian, J.; Jiang, M.; Liu, W.; Yang, C.G.; Yu, L.J.; Lu, X. Effect of stocking density on growth performance, serum biochemical parameters, and muscle texture properties of genetically improved farm tilapia, Oreochromis niloticus. Aquac. Int. 2018, 26, 1247–1259. [Google Scholar] [CrossRef]
  22. Wu, S.G.; Tian, J.Y.; Wang, G.T.; Li, W.X.; Zou, H. Characterization of bacterial community in the stomach of yellow catfish (Pelteobagrus fulvidraco). World J. Microbiol. Biotechnol. 2012, 28, 2165–2174. [Google Scholar] [CrossRef]
  23. Li, H.; Zhong, Q.P.; Wirth, S.; Wang, W.W.; Hao, Y.T.; Wu, S.G.; Zou, H.; Li, W.X.; Wang, G.T. Diversity of autochthonous bacterial communities in the intestinal mucosa of grass carp (Ctenopharyngodon idellus) (Valenciennes) determined by culture-dependent and culture-independent techniques. Aquac. Res. 2015, 46, 2344–2359. [Google Scholar] [CrossRef] [Green Version]
  24. Sun, D.L.; Jiang, X.; Wu, Q.L.L.; Zhou, N.Y. Intragenomic heterogeneity of 16S rRNA genes causes overestimation of prokaryotic diversity. Appl. Environ. Microbiol. 2013, 79, 5962–5969. [Google Scholar] [CrossRef] [PubMed] [Green Version]
  25. Li, T.T.; Long, M.; Li, H.; Gatesoupe, F.J.; Zhang, X.J.; Zhang, Q.Q.; Feng, D.Y.; Li, A.H. Multi-omics analysis reveals a correlation between the host phylogeny, gut microbiota and metabolite profiles in cyprinid fishes. Front. Microbiol. 2017, 8, 454. [Google Scholar] [CrossRef] [Green Version]
  26. Smith, C.A.; Want, E.J.; O’Maille, G.; Abagyan, R.; Siuzdak, G. XCMS: Processing mass spectrometry data for metabolite profiling using nonlinear peak alignment, matching, and identification. Anal. Chem. 2006, 78, 779–787. [Google Scholar] [CrossRef]
  27. Segata, N.; Izard, J.; Waldron, L.; Gevers, D.; Miropolsky, L.; Garrett, W.S.; Huttenhower, C. Metagenomic biomarker discovery and explanation. Genome Biol. 2011, 12, R60. [Google Scholar] [CrossRef] [PubMed] [Green Version]
  28. Hammer, O.; Harper, D.A.T.; Ryan, P.D. PAST: Paleontological statistics software package for education and data analysis. Palaeontol. Electron. 2001, 4, 1–9. [Google Scholar]
  29. Langille, M.G.I.; Zaneveld, J.; Caporaso, J.G.; McDonald, D.; Knights, D.; Reyes, J.A.; Clemente, J.C.; Burkepile, D.E.; Thurber, R.L.V.; Knight, R.; et al. Predictive functional profiling of microbial communities using 16S rRNA marker gene sequences. Nat. Biotechnol. 2013, 31, 814–821. [Google Scholar] [CrossRef]
  30. Douglas, G.M.; Maffei, V.J.; Zaneveld, J.R.; Yurgel, S.N.; Brown, J.R.; Taylor, C.M.; Huttenhower, C.; Langille, M.G.I. PICRUSt2 for prediction of metagenome functions. Nat. Biotechnol. 2020, 38, 685–688. [Google Scholar] [CrossRef] [PubMed]
  31. Parks, D.H.; Tyson, G.W.; Hugenholtz, P.; Beiko, R.G. STAMP: Statistical analysis of taxonomic and functional profiles. Bioinformatics 2014, 30, 3123–3124. [Google Scholar] [CrossRef] [Green Version]
  32. Bereded, N.K.; Curto, M.; Domig, K.J.; Abebe, G.B.; Fanta, S.W.; Waidbacher, H.; Meimberg, H. Metabarcoding analyses of gut microbiota of Nile tilapia (Oreochromis niloticus) from Lake Awassa and Lake Chamo, Ethiopia. Microorganisms 2020, 8, 1040. [Google Scholar] [CrossRef]
  33. Mongkol, P.; Bunphimpapha, P.; Rungrassamee, W.; Arayamethakorn, S.; Klinbunga, S.; Menasveta, P.; Chaiyapechara, S. Bacterial community composition and distribution in different segments of the gastrointestinal tract of wild-caught adult Penaeus monodon. Aquac. Res. 2018, 49, 378–392. [Google Scholar] [CrossRef]
  34. Gajardo, K.; Rodiles, A.; Kortner, T.M.; Krogdahl, A.; Bakke, A.M.; Merrifield, D.L.; Sorum, H. A high-resolution map of the gut microbiota in Atlantic salmon (Salmo salar): A basis for comparative gut microbial research. Sci. Rep. 2016, 6, 30893. [Google Scholar] [CrossRef] [PubMed] [Green Version]
  35. Perez, T.; Alba, C.; Aparicio, M.; de Andres, J.; Santa Quiteria, J.A.R.; Rodriguez, J.M.; Gibello, A. Abundant bacteria in the proximal and distal intestine of healthy Siberian sturgeons (Acipenser baerii). Aquaculture 2019, 506, 325–336. [Google Scholar] [CrossRef] [Green Version]
  36. Wan, X.L.; McLaughlin, R.W.; Zheng, J.S.; Hao, Y.J.; Fan, F.; Tian, R.M.; Wang, D. Microbial communities in different regions of the gastrointestinal tract in East Asian finless porpoises (Neophocaena asiaeorientalis sunameri). Sci. Rep. 2018, 8, 14142. [Google Scholar] [CrossRef] [PubMed] [Green Version]
  37. Zhang, Z.M.; Li, D.P.; Xu, W.T.; Tang, R.; Li, L. Microbiome of co-cultured fish exhibits host selection and niche differentiation at the organ scale. Front. Microbiol. 2019, 10, 2576. [Google Scholar] [CrossRef] [PubMed]
  38. Wang, A.R.; Ran, C.; Ringo, E.; Zhou, Z.G. Progress in fish gastrointestinal microbiota research. Rev. Aquac. 2018, 10, 626–640. [Google Scholar] [CrossRef] [Green Version]
  39. Tang, W.J.; Zhu, G.X.; Shi, Q.; Yang, S.; Ma, T.Y.; Mishra, S.K.; Wen, A.X.; Xu, H.L.; Wang, Q.; Jiang, Y.Z.; et al. Characterizing the microbiota in gastrointestinal tract segments of Rhabdophis subminiatus: Dynamic changes and functional predictions. Microbiologyopen 2019, 8, e789. [Google Scholar] [CrossRef] [PubMed]
  40. Li, T.T.; Long, M.; Gatesoupe, F.J.; Zhang, Q.Q.; Li, A.H.; Gong, X.N. Comparative analysis of the intestinal bacterial communities in different species of carp by pyrosequencing. Microb. Ecol. 2015, 69, 25–36. [Google Scholar] [CrossRef]
  41. Perez, T.; Balcazar, J.L.; Ruiz-Zarzuela, I.; Halaihel, N.; Vendrell, D.; de Blas, I.; Muzquiz, J.L. Host-microbiota interactions within the fish intestinal ecosystem. Mucosal Immunol. 2010, 3, 355–360. [Google Scholar] [CrossRef] [PubMed]
  42. Laparra, J.M.; Sanz, Y. Interactions of gut microbiota with functional food components and nutraceuticals. Pharmacol. Res. 2010, 61, 219–225. [Google Scholar] [CrossRef] [Green Version]
  43. Hao, Y.T.; Wu, S.G.; Jakovlic, I.; Zou, H.; Li, W.X.; Wang, G.T. Impacts of diet on hindgut microbiota and short-chain fatty acids in grass carp (Ctenopharyngodon idellus). Aquac. Res. 2017, 48, 5595–5605. [Google Scholar] [CrossRef]
  44. Karlsson, F.H.; Ussery, D.W.; Nielsen, J.; Nookaew, I. A closer look at Bacteroides: Phylogenetic relationship and genomic implications of a life in the human gut. Microb. Ecol. 2011, 61, 473–485. [Google Scholar] [CrossRef] [Green Version]
  45. Bennett, A.C.; Murugapiran, S.K.; Hamilton, T.L. Temperature impacts community structure and function of phototrophic Chloroflexi and Cyanobacteria in two alkaline hot springs in yellowstone national park. Environ. Microbiol. Rep. 2020, 12, 503–513. [Google Scholar] [CrossRef]
  46. Cardman, Z.; Arnosti, C.; Durbin, A.; Ziervogel, K.; Cox, C.; Steen, A.D.; Teske, A. Verrucomicrobia are candidates for polysaccharide-degrading bacterioplankton in an arctic fjord of Svalbard. Appl. Environ. Microbiol. 2014, 80, 3749–3756. [Google Scholar] [CrossRef] [PubMed] [Green Version]
  47. Koh, A.; De Vadder, F.; Kovatcheva-Datchary, P.; Backhed, F. From dietary fiber to host physiology: Short-chain fatty acids as key bacterial metabolites. Cell 2016, 165, 1332–1345. [Google Scholar] [CrossRef] [PubMed] [Green Version]
  48. Ventura, M.; Canchaya, C.; Tauch, A.; Chandra, G.; Fitzgerald, G.F.; Chater, K.F.; van Sinderen, D. Genomics of Actinobacteria: Tracing the evolutionary history of an ancient phylura. Microbiol. Mol. Biol. Rev. 2007, 71, 495–548. [Google Scholar] [CrossRef] [Green Version]
  49. Willems, A.; Deley, J.; Gillis, M.; Kersters, K. Comamonadaceae, a New Family Encompassing the Acidovorans rRNA Complex, Including Variovorax Paradoxus gen. nov., comb. nov., for Alcaligenes paradoxus (Davis 1969). Int. J. Syst. Bacteriol. 1991, 41, 445–450. [Google Scholar] [CrossRef] [Green Version]
  50. Coenye, T.; Vandamme, P.; LiPuma, J.J. Ralstonia respiraculi sp. nov., isolated from the respiratory tract of cystic fibrosis patients. Int. J. Syst. Evol. Microbiol. 2003, 53, 1339–1342. [Google Scholar] [CrossRef] [Green Version]
  51. Ammendolia, M.G.; Bertuccini, L.; Minelli, F.; Meschini, S.; Baldassarri, L. A Sphingomonas bacterium interacting with epithelial cells. Res. Microbiol. 2004, 155, 636–646. [Google Scholar] [CrossRef]
  52. Gomila, M.; Bowien, B.; Falsen, E.; Moore, E.R.B.; Lalucat, J. Description of Pelomonas aquatica sp. nov. and Pelomonas puraquae sp. nov., isolated from industrial and haemodialysis water. Int. J. Syst. Evol. Microbiol. 2007, 57, 2979. [Google Scholar] [CrossRef]
  53. Kinjo, Y.; Wu, D.; Kim, G.S.; Xing, G.W.; Poles, M.A.; Ho, D.D.; Tsuji, M.; Kawahara, K.; Wong, C.H.; Kronenberg, M. Recognition of bacterial glycosphingolipids by natural killer T cells. Nature 2005, 434, 520–525. [Google Scholar] [CrossRef] [PubMed]
  54. Boutin, S.; Sauvage, C.; Bernatchez, L.; Audet, C.; Derome, N. Inter individual variations of the fish skin microbiota: Host genetics basis of mutualism? PLoS ONE 2014, 9, e102649. [Google Scholar] [CrossRef] [PubMed]
  55. Ioannou, P.; Mavrikaki, V.; Kofteridis, D.P. Roseomonas species infections in humans: A systematic review. J. Chemother. 2020, 32, 226–236. [Google Scholar] [CrossRef] [PubMed]
  56. Lee, H.J.; Jeong, S.E.; Lee, S.; Kim, S.; Han, H.; Jeon, C.O. Effects of cosmetics on the skin microbiome of facial cheeks with different hydration levels. Microbiologyopen 2018, 7, e557. [Google Scholar] [CrossRef]
  57. Schäffler, H.; Herlemann, D.P.R.; Alberts, C.; Kaschitzki, A.; Bodammer, P.; Bannert, K.; Koller, T.; Warnke, P.; Kreikemeyer, B.; Lamprecht, G. Mucosa-attached bacterial community in crohn’s disease coheres with the clinical disease activity index. Environ. Microbiol. Rep. 2016, 8, 614–621. [Google Scholar] [CrossRef]
  58. Carda-Dieguez, M.; Mira, A.; Fouz, B. Pyrosequencing survey of intestinal microbiota diversity in cultured sea bass (Dicentrarchus labrax) fed functional diets. FEMS Microbiol. Ecol. 2014, 87, 451–459. [Google Scholar] [CrossRef] [PubMed] [Green Version]
  59. Fishman, A.; Tao, Y.; Wood, T.K. Toluene 3-monooxygenase of Ralstonia pickettii PKO1 is a para-hydroxylating enzyme. J. Bacteriol. 2004, 186, 3117–3123. [Google Scholar] [CrossRef] [Green Version]
  60. Hemachander, C.; Bose, N.; Puvanakrishnan, R. Whole cell immobilization of Ralstonia pickettii for lipase production. Process. Biochem. 2001, 36, 629–633. [Google Scholar] [CrossRef]
  61. Sugimoto, A.; Shiraki, M.; Hatakeyama, S.; Saito, T. Secretion pathway for the poly(3-hydroxybutyrate) depolymerase in Ralstonia pickettii T1. Antonie Leeuwenhoek 2008, 94, 223–232. [Google Scholar] [CrossRef] [PubMed]
  62. Wang, P.L.; Qiao, Z.R.; Li, X.A.; Su, Y.L.; Xie, B. Functional characteristic of microbial communities in large-scale biotreatment systems of food waste. Sci. Total Environ. 2020, 746, 141086. [Google Scholar] [CrossRef]
  63. Krute, C.N.; Ridder, M.J.; Seawell, N.A.; Bose, J.L. Inactivation of the exogenous fatty acid utilization pathway leads to increased resistance to unsaturated fatty acids in Staphylococcus aureus. Microbiol. SGM 2019, 165, 197–207. [Google Scholar] [CrossRef] [PubMed]
  64. Kim, S.J.; Moon, J.Y.; Weon, H.Y.; Hong, S.B.; Seok, S.J.; Kwon, S.W. Undibacterium jejuense sp nov and Undibacterium seohonense sp. nov., isolated from soil and freshwater, respectively. Int. J. Syst. Evol. Microbiol. 2014, 64, 236–241. [Google Scholar] [CrossRef] [PubMed]
  65. Kampfer, P.; Rossello-Mora, R.; Hermansson, M.; Persson, F.; Huber, B.; Falsen, E.; Busse, H.J. Undibacterium pigrum gen. nov., sp nov., isolated from drinking water. Int. J. Syst. Evol. Microbiol. 2007, 57, 1510–1515. [Google Scholar] [CrossRef]
  66. Sun, Y.; Yuan, Z.M.; Guo, Y.M.; Qin, Y.Z.; Ban, Y.T.; Niu, H.X.; Bu, Y.Z. Bacterial diversity in the gastrointestinal tracts of Rhinolophus luctus and Murina leucogaster in Henan Province, China. Ann. Microbiol. 2019, 69, 1407–1414. [Google Scholar] [CrossRef]
  67. Kampfer, P.; Irgang, R.; Busse, H.J.; Poblete-Morales, M.; Kleinhagauer, T.; Glaeser, S.P.; Avendano-Herrera, R. Undibacterium danionis sp nov isolated from a zebrafish (Danio rerio). Int. J. Syst. Evol. Microbiol. 2016, 66, 3625–3631. [Google Scholar] [CrossRef] [Green Version]
  68. Rungrassamee, W.; Klanchui, A.; Maibunkaew, S.; Chaiyapechara, S.; Jiravanichpaisal, P.; Karoonuthaisiri, N. Characterization of intestinal bacteria in wild and domesticated adult black tiger shrimp (Penaeus monodon). PLoS ONE 2014, 9, e91853. [Google Scholar] [CrossRef] [PubMed] [Green Version]
  69. Wang, L.; Wang, J.; Lu, K.L.; Song, K.; Mai, K.S.; Zhang, C.X.; Rahimnejad, S. Total replacement of fish meal with soybean meal in diets for bullfrog (Lithobates catesbeianus): Effects on growth performance and gut microbial composition. Aquaculture 2020, 524, 735236. [Google Scholar] [CrossRef]
  70. Guan, Z.Q.; Chen, L.L.; Gerritsen, J.; Smidt, H.; Goldfine, H. The cellular lipids of Romboutsia. BBA Mol. Cell Biol. L 2016, 1861, 1076–1082. [Google Scholar] [CrossRef] [PubMed]
  71. Gerritsen, J.; Hornung, B.; Renckens, B.; van Hijum, S.A.F.T.; dos Santos, V.A.P.M.; Rijkers, G.T.; Schaap, P.J.; de Vos, W.M.; Smidt, H. Genomic and functional analysis of Romboutsia ilealis CRIBT reveals adaptation to the small intestine. Peerj 2017, 5, e3698. [Google Scholar] [CrossRef] [Green Version]
  72. Chen, Y.X.; Liu, H.; Chen, H.L. Characterization of phenol biodegradation by Comamonas testosteroni ZD4-1 and Pseudomonas aeruginosa ZD4-3. Biomed. Environ. Sci. 2003, 16, 163–172. [Google Scholar] [CrossRef] [PubMed]
  73. Yoon, J.; Matsuo, Y.; Adachi, K.; Nozawa, M.; Matsuda, S.; Kasai, H.; Yokota, A. Description of Persicirhabdus sediminis gen. nov., sp nov., Roseibacillus ishigakijimensis gen. nov., sp. nov., Roseibacillus ponti sp. nov., Roseibacillus persicicus sp. nov., Luteolibacter pohnpeiensis gen. nov., sp nov and Luteolibacter algae sp. nov., six marine members of the phylum "Verrucomicrobia", and emended descriptions of the class Verrucomicrobiae, the order Verrucomicrobiales and the family Verrucomicrobiaceae. Int. J. Syst. Evol. Microbiol. 2008, 58, 998–1007. [Google Scholar] [CrossRef] [PubMed]
  74. Zhang, X.M.; Song, S.; Tang, L.J.; Wang, Y.H.; Zhang, X.X.; Li, X.J.; Yu, X.R.; Zhang, J.H.; Kwon, O.O.W.; Zhang, L.P. Gynurincola endophyticus gen. nov., sp. nov., a novel bacterium of the family Chitinophagaceae. Int. J. Syst. Evol. Microbiol. 2019, 69, 816–820. [Google Scholar] [CrossRef]
  75. De Souza, F.P.; de Lima, E.C.S.; Pandolfi, V.C.F.; Leite, N.G.; Furlan-Murari, P.J.; Leal, C.N.S.; Mainardi, R.M.; Suphoronski, S.A.; Favero, L.M.; Koch, J.F.A.; et al. Effect of β-glucan in water on growth performance, blood status and intestinal microbiota in tilapia under hypoxia. Aquac. Rep. 2020, 17, 100369. [Google Scholar] [CrossRef]
  76. Sugita, H.; Miyajima, C.; Deguchi, Y. The vitamin-B12-producing ability of the intestinal microflora of fresh-water fish. Aquaculture 1991, 92, 267–276. [Google Scholar] [CrossRef]
  77. Finegold, S.M.; Vaisanen, M.L.; Molitoris, D.R.; Tomzynski, T.J.; Song, Y.; Liu, C.; Collins, M.D.; Lawson, P.A. Cetobacterium somerae sp nov from human feces and emended description of the genus Cetobacterium. Syst. Appl. Microbiol. 2003, 26, 177–181. [Google Scholar] [CrossRef] [PubMed]
  78. Koo, H.; Hakim, J.A.; Powell, M.L.; Kumar, R.; Eipers, P.G.; Morrow, C.D.; Crowley, M.; Lefkowitz, E.J.; Watts, S.A.; Bej, A.K. Metagenomics approach to the study of the gut microbiome structure and function in zebrafish Danio rerio fed with gluten formulated diet. J. Microbiol. Methods 2017, 135, 69–76. [Google Scholar] [CrossRef] [Green Version]
  79. Borsodi, A.K.; Szabo, A.; Krett, G.; Felfoldi, T.; Andras, S.; Boros, G. Gut content microbiota of introduced bigheaded carps (Hypophthalmichthys spp.) inhabiting the largest shallow lake in Central Europe. Microbiol. Res. 2017, 195, 40–50. [Google Scholar] [CrossRef] [Green Version]
  80. Parata, L.; Mazumder, D.; Sammut, J.; Egan, S. Diet type influences the gut microbiome and nutrient assimilation of Genetically Improved Farmed Tilapia (Oreochromis niloticus). PLoS ONE 2020, 15, e0237775. [Google Scholar] [CrossRef]
  81. Sonner, J.K.; Keil, M.; Falk-Paulsen, M.; Mishra, N.; Rehman, A.; Kramer, M.; Deumelandt, K.; Rowe, J.; Sanghvi, K.; Wolf, L.; et al. Dietary tryptophan links encephalogenicity of autoreactive T cells with gut microbial ecology. Nat. Commun. 2019, 10, 4877. [Google Scholar] [CrossRef]
  82. Kim, S.J.; Kim, S.E.; Kim, A.R.; Kang, S.; Park, M.Y.; Sung, M.K. Dietary fat intake and age modulate the composition of the gut microbiota and colonic inflammation in C57BL/6J mice. BMC Microbiol. 2019, 19, 193. [Google Scholar] [CrossRef] [PubMed]
  83. Do, M.H.; Lee, E.; Oh, M.J.; Kim, Y.; Park, H.Y. High-glucose or -fructose diet cause changes of the gut microbiota and metabolic disorders in mice without body weight change. Nutrients 2018, 10, 761. [Google Scholar] [CrossRef] [PubMed] [Green Version]
  84. Du, F.K.; Li, Y.; Tang, Y.K.; Su, S.Y.; Yu, J.H.; Yu, F.; Li, J.L.; Li, H.X.; Wang, M.Y.; Xu, P. Response of the gut microbiome of Megalobrama amblycephala to crowding stress. Aquaculture 2019, 500, 586–596. [Google Scholar] [CrossRef]
  85. Lee, Y.S.; Kim, T.Y.; Kim, Y.; Lee, S.H.; Kim, S.; Kang, S.W.; Yang, J.Y.; Baek, I.J.; Sung, Y.H.; Park, Y.Y.; et al. Microbiota-derived lactate accelerates intestinal stem-cell-mediated epithelial development. Cell Host Microbe 2018, 24, 833–846. [Google Scholar] [CrossRef] [PubMed] [Green Version]
  86. Xia, Y.; Yu, E.M.; Lu, M.X.; Xie, J. Effects of probiotic supplementation on gut microbiota as well as metabolite profiles within Nile tilapia, Oreochromis niloticus. Aquaculture 2020, 527, 735428. [Google Scholar] [CrossRef]
  87. Oswald, K.; Graf, J.S.; Littmann, S.; Tienken, D.; Brand, A.; Wehrli, B.; Albertsen, M.; Daims, H.; Wagner, M.; Kuypers, M.M.M.; et al. Crenothrix are major methane consumers in stratified lakes. ISME J. 2017, 11, 2124–2140. [Google Scholar] [CrossRef]
  88. Amenyogbe, E.; Chen, G.; Wang, Z.L.; Huang, J.S.; Huang, B.S.; Li, H.J. The exploitation of probiotics, prebiotics and synbiotics in aquaculture: Present study, limitations and future directions: A review. Aquac. Int. 2020, 28, 1017–1041. [Google Scholar] [CrossRef]
Figure 1. Comparison of alpha diversity indices of the bacterial communities at different sites. (A) Comparison of the Sobs index of the bacterial communities at different sites, (B) comparison of the Shannon index of the bacterial communities at different sites, (C) comparison of the Chao index of the bacterial communities at different sites, and (D) comparison of the Simpson index of the bacterial communities at different sites. Higher Sobs and Chao values indicate a higher richness; higher Shannon and lower Simpson values indicate a higher diversity. Statistical significances between two sites were considered at * p < 0.05, ** p < 0.01, and *** p < 0.001 by Welch t-test. G: gill mucosae (G1–G4); C: intestinal contents (C1–C4); M: intestinal mucosae (M1–M4); S: stomach contents (S1–S4); W: stomach mucosae (W1–W4).
Microorganisms 09 00617 g001
Figure 2. Analysis of the bacterial community structure at different sites. (A) Principal coordinate analysis based on the Bray-Curtis metric of the bacterial communities. The percentages indicate the relative contribution of the principal components. (B) The hierarchical clustering tree based on Bray-Curtis metric of the bacterial communities. G: gill mucosae (G1–G4); C: intestinal contents (C1–C4); M: intestinal mucosae (M1–M4); S: stomach contents (S1–S4); W: stomach mucosae (W1–W4).
Microorganisms 09 00617 g002
Figure 3. Distribution of the bacterial communities in all twenty samples at (A) the phylum level or (B) the genus level. G: gill mucosae (G1–G4); C: intestinal contents (C1–C4); M: intestinal mucosae (M1–M4); S: stomach contents (S1–S4); W: stomach mucosae (W1–W4).
Microorganisms 09 00617 g003
Figure 4. (A) Linear discriminant analysis (LDA) effect size (LEfSe) showing differences in the bacterial communities at the operational taxonomic unit (out) level between the stomach contents and stomach mucosae. (B) LEfSe showing differences in the bacterial communities at the OTU level between the intestinal contents and intestinal mucosae. The highlighted taxa are enriched in the group that corresponds to each color. LDA scores can be interpreted as the degree of difference in the relative abundance of OTUs. S: stomach contents (S1–S4); W: stomach mucosae (W1–W4); C: intestinal contents (C1–C4); M: intestinal mucosae (M1–M4).
Microorganisms 09 00617 g004
Figure 5. (A) LEfSe showing differences in the bacterial communities at the OTU level between the stomach contents and contents. (B) LEfSe showing differences in the bacterial communities at the OTU level between the content (C and S) and mucosa (G, M, and W) samples. The highlighted taxa are enriched in the group that corresponds to each color. LDA scores can be interpreted as the degree of difference in the relative abundance of OTUs.
Microorganisms 09 00617 g005
Figure 6. The significant correlation between intestinal main bacterial genera and metabolites. (A) The correlation of intestinal bacteria and amino acid-related metabolites. (B) The correlation of intestinal bacteria and lipid-related metabolites. The correlation coefficient is represented by different colors (red: positive correlation; blue: negative correlation). * Represents significantly negative or positive correlations (*** p < 0.001).
Microorganisms 09 00617 g006
Figure 7. The significant correlation between intestinal main bacterial genera and metabolites. (A) The correlation of intestinal bacteria and carbohydrate-related metabolites. (B) The correlation of intestinal bacteria and other metabolites. The correlation coefficient is represented by different colors (red: positive correlation; blue: negative correlation). * Represents significantly negative or positive correlations (*** p < 0.001).
Microorganisms 09 00617 g007
Figure 8. Heatmap profiles showing the functional categories (Kyoto Encyclopedia of Genes and Genomes (KEGG) level 1 and level 2) of the bacterial communities, as predicted by the Phylogenetic Investigation of Communities by Reconstruction of Unobserved States (PICRUSt2) analysis. The functional clustering analysis is based on the unweighted pair-group method with arithmetic means (UPGMA). Rows represent the KEGG Orthology (KO) functions, columns represent the 20 samples, and the color intensity in the heatmap represents the relative abundance (%) of the functional categories. G: gill mucosae (G1–G4); C: intestinal contents (C1–C4); M: intestinal mucosae (M1–M4); S: stomach contents (S1–S4); W: stomach mucosae (W1–W4).
Microorganisms 09 00617 g008
Figure 9. Extended error bar showing the differentiated putative functions of the bacterial communities between the content and mucosa samples as predicted by PICRUSt2 analysis. Rows represent the 21 differentiated KEGG Orthology (KO) functions (corrected p < 0.05), and the bars in the graph represent the mean proportion (%) of the functional categories. The 95% confidence intervals reflect the difference in mean proportions (%), and corrected p-values are displayed on the right of the figure.
Microorganisms 09 00617 g009
Publisher’s Note: MDPI stays neutral with regard to jurisdictional claims in published maps and institutional affiliations.

