1. Introduction
The microbial lipids produced by oleaginous microorganisms are called single cell oils (SCO), which are potential alternatives for the production of edible oils, oleochemicals, and biofuels such as biodiesel. Oleaginous microorganisms, including bacteria, yeast, molds, and microalgae, can accumulate lipids up to 20% of their dry cell weight [
1]. In recent years, the production of cocoa butter-like lipid by SCO replaces the expensive materials, such as cocoa butter, and their accumulated lipids are expected to play an important role as functional lipids for human health, such as γ-linoleic acid (GLA), arachidonic acid (ARA), docosahexaenoic acid (DHA), and eicosapentaenoic acid (EPA) [
2]. Oleaginous yeasts (e.g.,
Cryptococcus curvatus,
Lipomyces starkeyi,
Rhodosporidium toruloides,
Rhodotorula glutinis,
R. graminis, and
Yarrowia lipolytica) can accumulate lipids mainly as triglycerides (TAGs) up to 30–70% of their dry cell weight, which are similar to the fatty acid profiles of vegetable oils [
1]. Among these oleaginous yeasts,
L. starkeyi is an attractive oil producer with high lipid accumulation for industrial use potential.
L. starkeyi NBRC10381 accumulated lipids up to 85% of their dry cell weight, with high inoculum sizes under nitrogen-limited conditions [
3].
L. starkeyi can convert various carbon sources, such as glucose, xylose, arabinose, galactose, mannose, and cellobiose, into energy and lipid production [
4]. In addition,
L. starkeyi can assimilate waste and raw materials (e.g., crude glycerol) [
5,
6] and agricultural residues (e.g., rice straw) [
7], which leads to avoidance of competition with edible substrates.
Oleaginous yeasts are known to accumulate lipids when there is excess carbon in a nitrogen-limited or other nutrient-limited culture [
1,
8]. Therefore, the ratio of carbon sources and nitrogen sources (C/N ratio) is an important factor for lipid accumulation [
9]. The lipid accumulation in
L. starkeyi is affected by the C/N ratio, aeration levels, pH, and alcohol byproducts [
10]. Recently, the genome of
L. starkeyi NRRL Y-11557 was published [
11], and its genome sequence will facilitate the engineering of lipid biosynthetic and degradative pathways with genomic tools. Furthermore, optimized genetic transformation systems [
12,
13,
14,
15], development of a host designed for highly efficient gene targeting [
16], and overexpression via multiple integration of the target gene into an rDNA locus [
13] were established for
L. starkeyi. The optimized lipid production by metabolic engineering, with available information and genetic engineering tools, will potentially lead to an economically competitive production of biodiesel and oleochemicals using
L. starkeyi.
Random mutagenesis treatment with mutagens, such as ethyl methanesulfonate, nitrosoguanidine (NTG), and ultraviolet (UV) irradiation, improved the lipid productivity of several oleaginous yeasts, such as
R. glutinis [
17],
R. toruloides [
18,
19,
20],
Y. lipolytica [
21,
22],
L. starkeyi [
23,
24,
25], and
C. curvatus [
26]. The transcriptional analysis of the isolated mutants with high levels of lipid production revealed the genes influencing the lipid production [
19,
20,
25,
26]. The isolation and characterization of mutants with altered lipid productivity provide us with valuable factors to improve it. As mentioned above, there are many studies on the acquisition and analysis of mutants with high lipid productivity, but a mutant with decreased lipid productivity has never been isolated in oleaginous yeasts. Although the positive information obtained from high lipid productivity strains is useful to clarify the mechanism of TAG synthesis in
L. starkeyi, the identification of genes responsible for the decreased lipid productivity and obtaining the negative information are important.
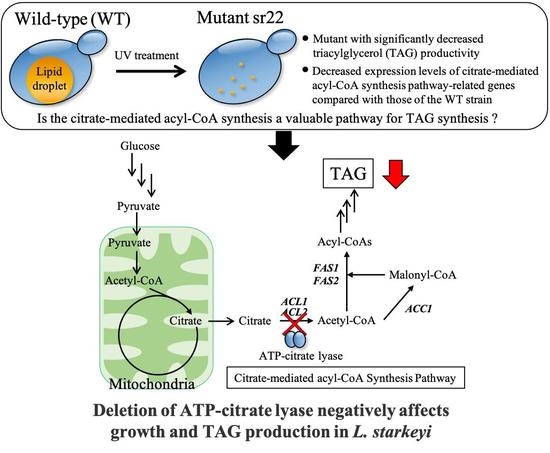
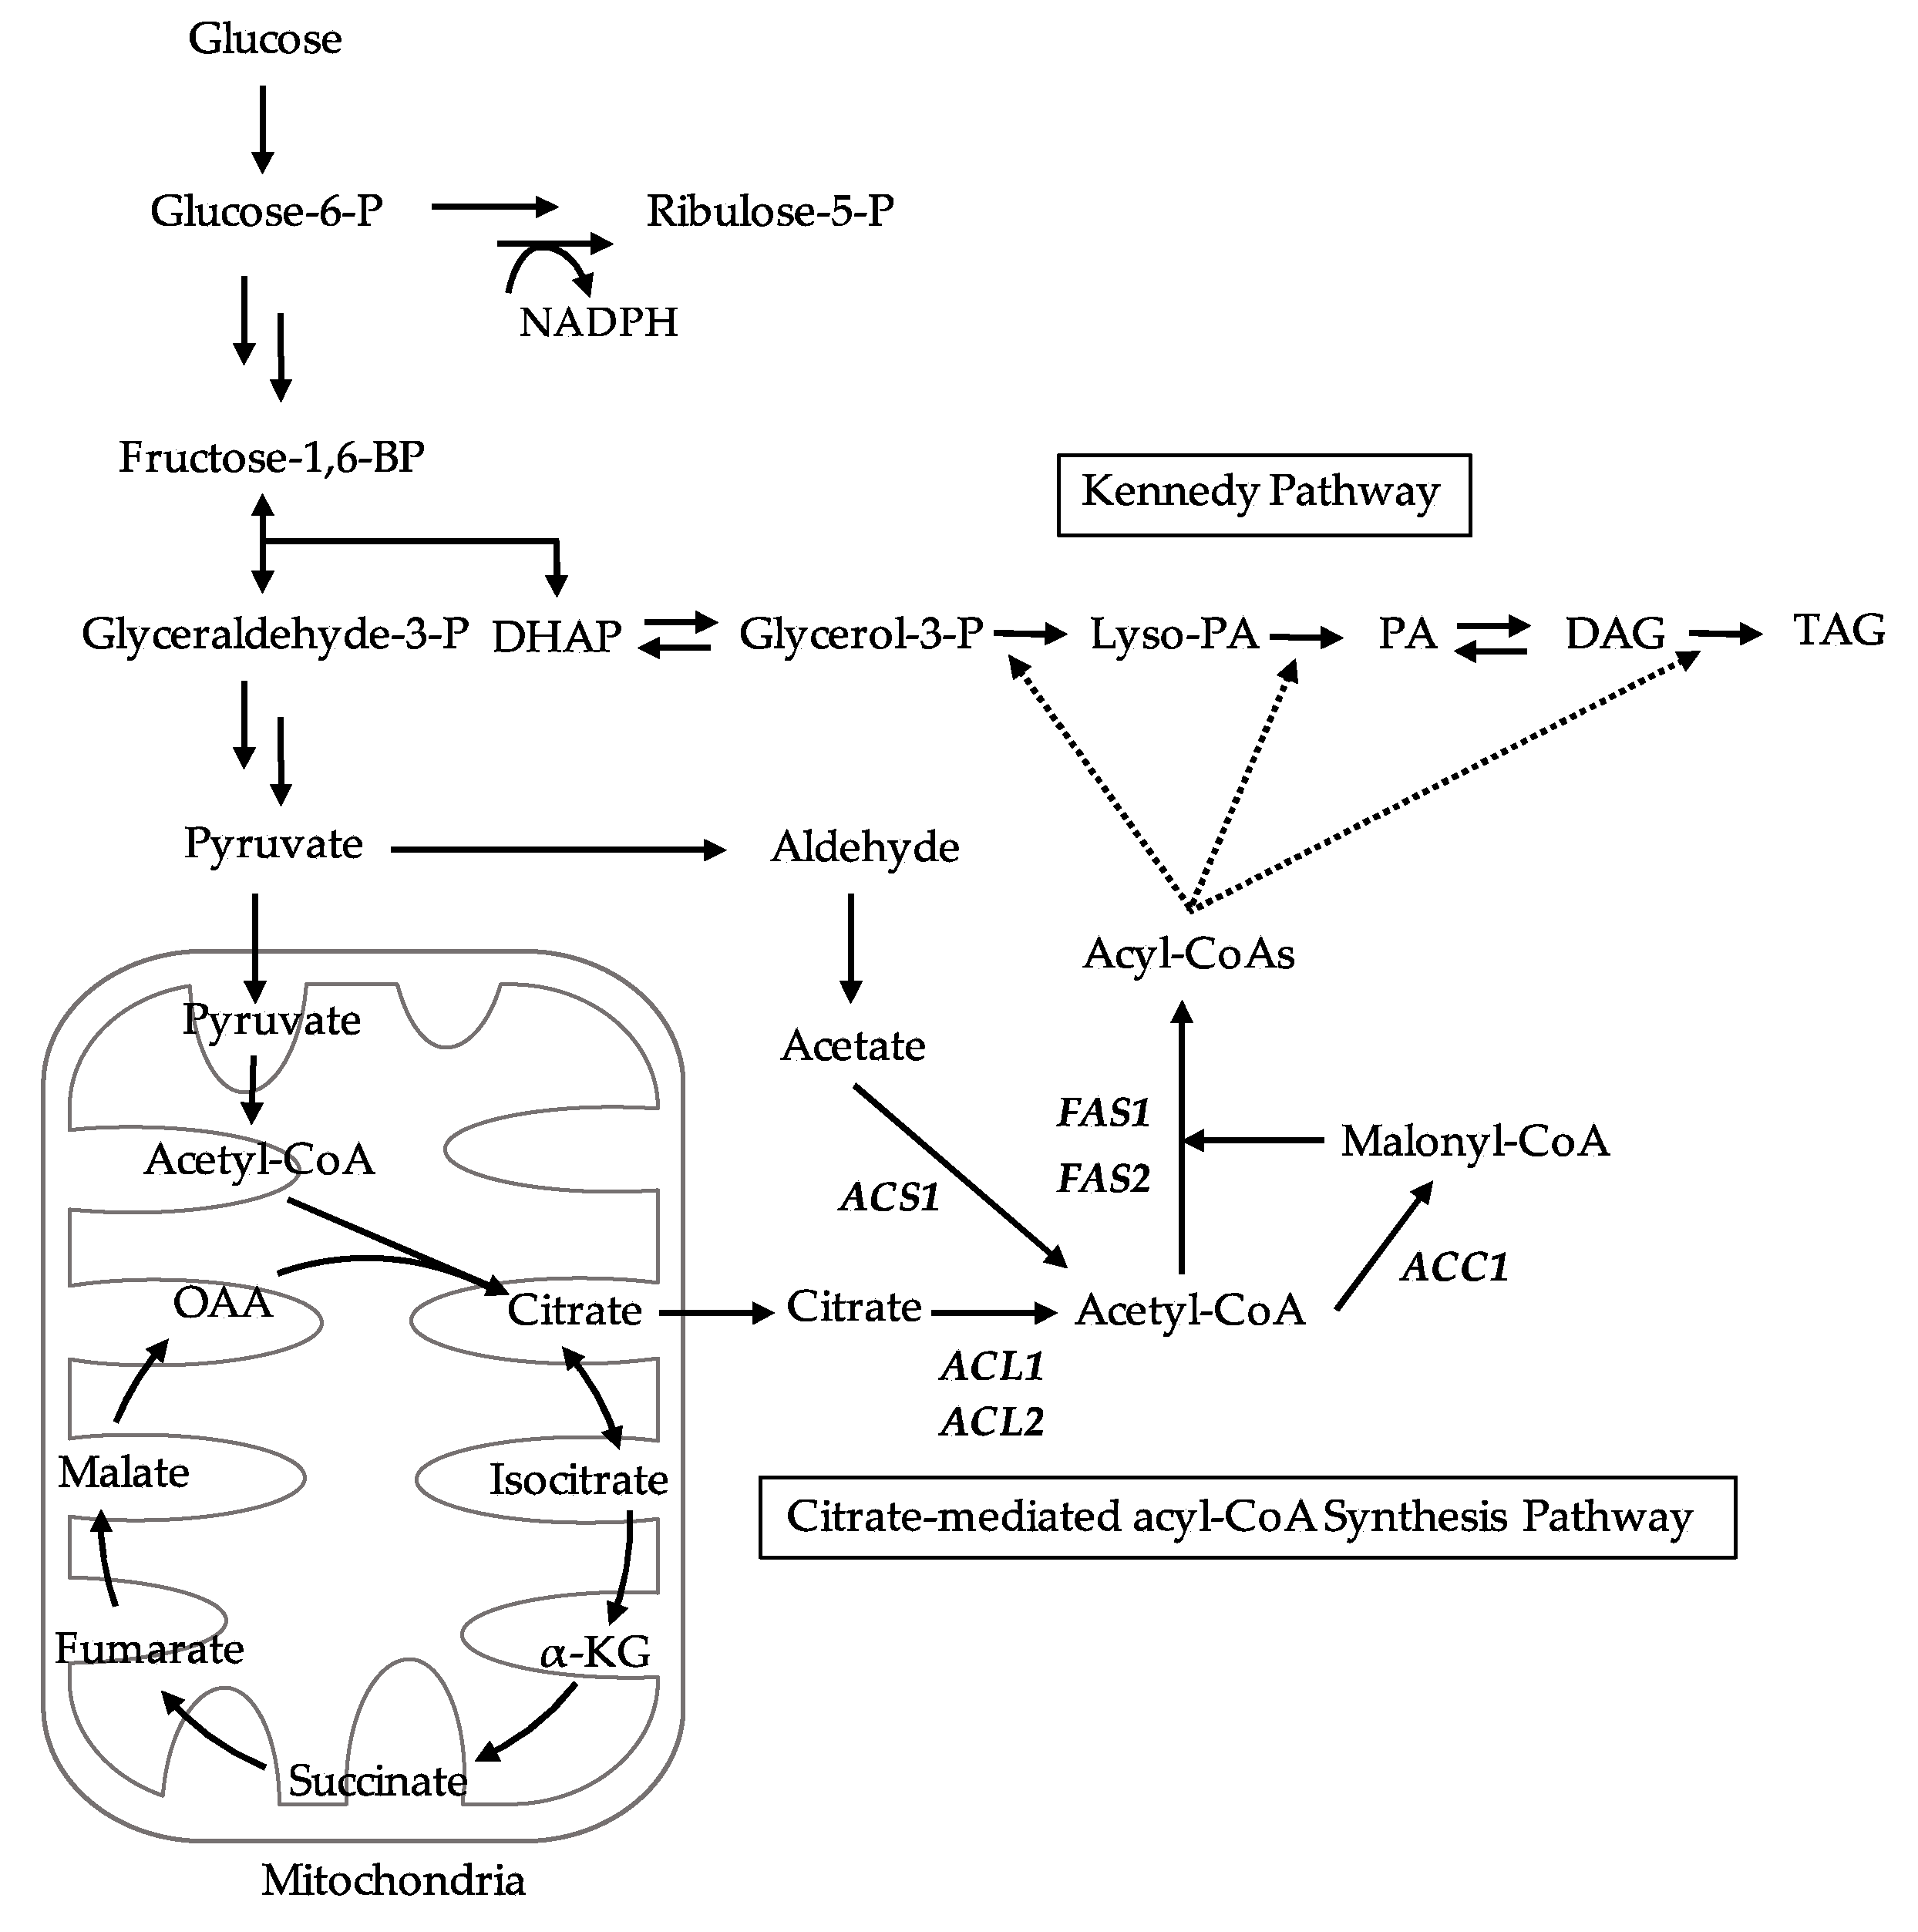
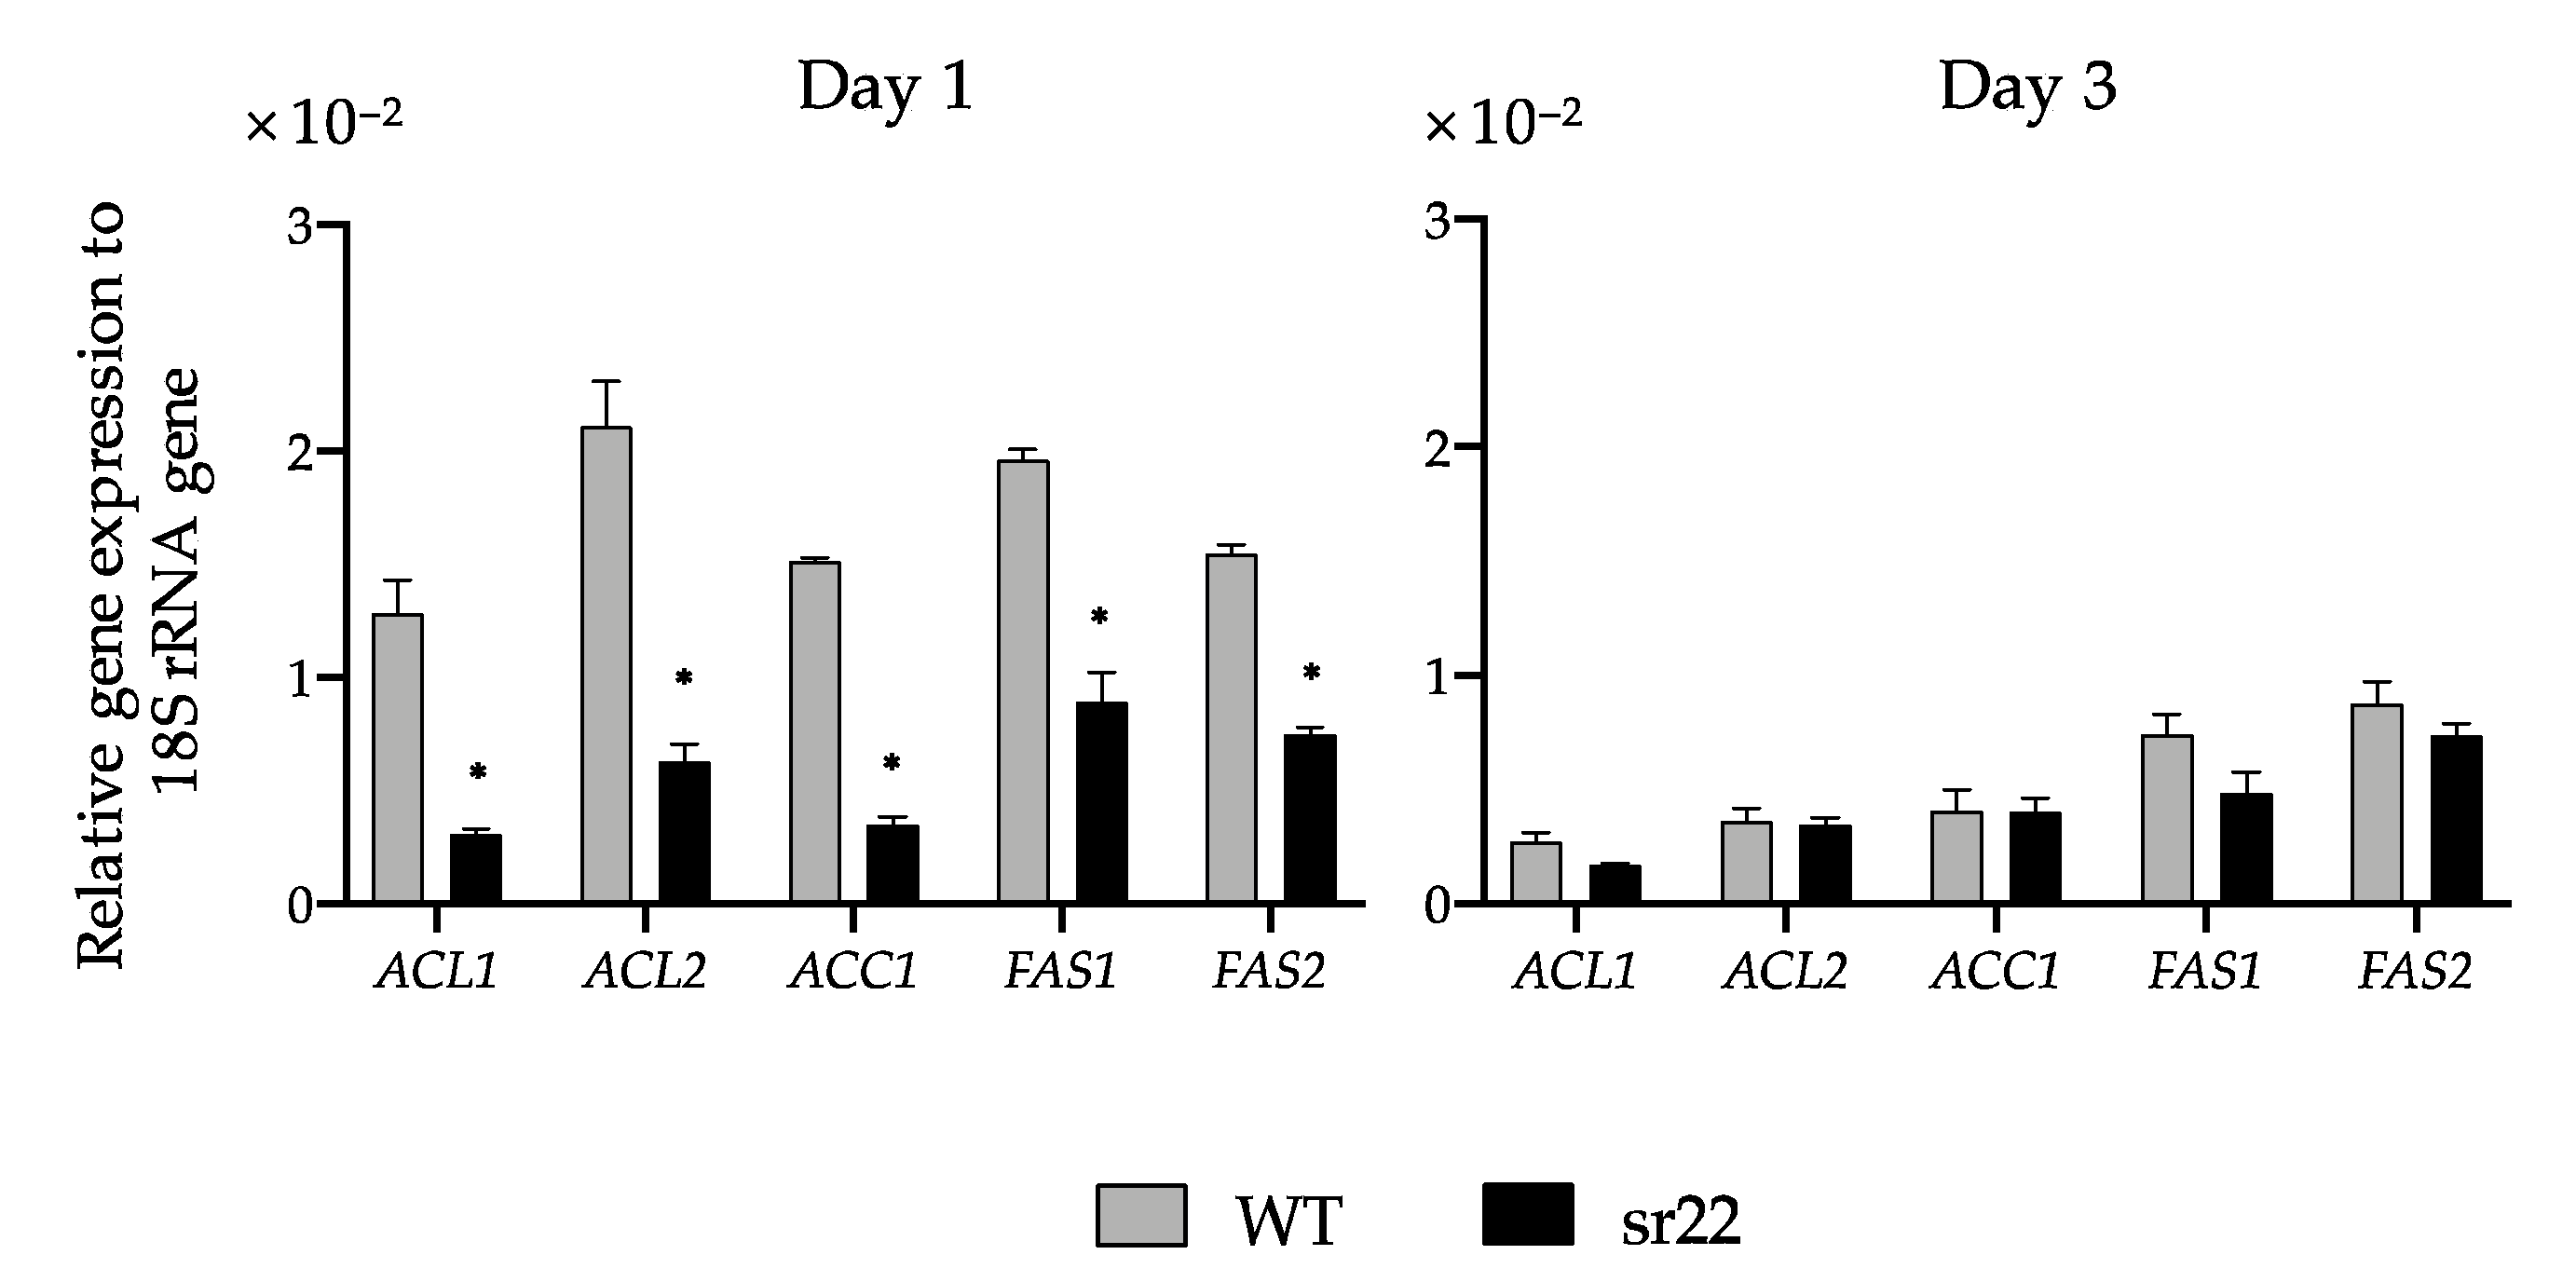
To understand the regulation of TAG synthesis in L. starkeyi, the mutants with significantly decreased TAG productivity were isolated and characterized in this study. Wild-type L. starkeyi CBS1807 cells were mutagenized using UV irradiation, followed by Percoll density gradient centrifugation for the enrichment of high-density cells that were expected to accumulate small amounts of TAG. The sr22 mutant with defective TAG synthesis was isolated from the high-density fraction. Then, the gene expression of citrate-mediated acyl-CoA synthesis pathway on TAG synthesis was evaluated in the wild-type strain and sr22 mutant. Furthermore, we constructed L. starkeyi strains carrying deleted or highly expressed ACL1 and ACL2 genes coding for ATP-citrate lyase (ACL), which is responsible for the first reaction of citrate-mediated acyl-CoA synthesis pathway, and we revealed the importance of citrate-mediated acyl-CoA synthesis in the growth and TAG synthesis of L. starkeyi.
2. Materials and Methods
2.1. Strain and Media
The bacterial and yeast strains used in this study are listed in
Table S1.
Lipomyces starkeyi CBS1807 (Centraalbureau voor Schimmelcultures) was chosen as the wild-type strain for mutagenesis based on our previous study [
24]. The ∆
lslig4 strain is a nonhomologous end-joining-deficient strain with highly efficient homologous recombination. The ∆
lslig4 was generated from
L. starkeyi strain CBS1807 [
16]. The yeast cells were cultured in a yeast extract/peptone/dextrose (YPD) medium (1% yeast extract (Kyokutou, Tokyo, Japan), 2% HIPOLYPEPTON (Nihon Pharmaceutical, Tokyo, Japan), and 2% glucose), semidefined medium (S medium) (0.5% (NH
4)
2SO
4, 0.1% KH
2PO
4, 0.01% NaCl, 0.1% yeast extract (Kyokutou, Tokyo, Japan), 0.05% MgSO
4·7H
2O, 0.01% CaCl
2·2H
2O, and 5% glucose), and semidefined glycerol medium (SG medium) (0.5% (NH
4)
2SO
4, 0.1% KH
2PO
4, 0.01% NaCl, 0.1% yeast extract (Kyokutou, Tokyo, Japan), 0.05% MgSO
4·7H
2O, 0.01% CaCl
2·2H
2O, and 2% glycerol) at 30 °C, as previously described [
24]. The S and SG media were adjusted to pH 5.5 by adding 1 N NaOH. To the solid medium, 2% agar (FUJIFILM Wako Pure Chemical, Osaka, Japan) was added.
Escherichia coli HST08 cells were grown at 37 °C in a liquid L-broth medium with 100 µg/mL ampicillin medium (1% Bacto
TM Tryptone (BD Biosciences, Franklin Lakes, NJ, USA), 0.5% Bacto
TM Yeast Extract (BD Biosciences), and 0.5% NaCl).
2.2. Determination of Cell Concentration
The cell cultures were adequately diluted with Cell Pack (Sysmex, Kobe, Japan) and sonicated with a Vibra Cell sonicator (Sonics & Materials, Danbury, CT, USA) for 20 s (cycles of 5 s on and 5 s off). The number and diameter of L. starkeyi cells cultures were measured using a CDA-1000 electronic particle counter (Sysmex).
2.3. UV Treatment
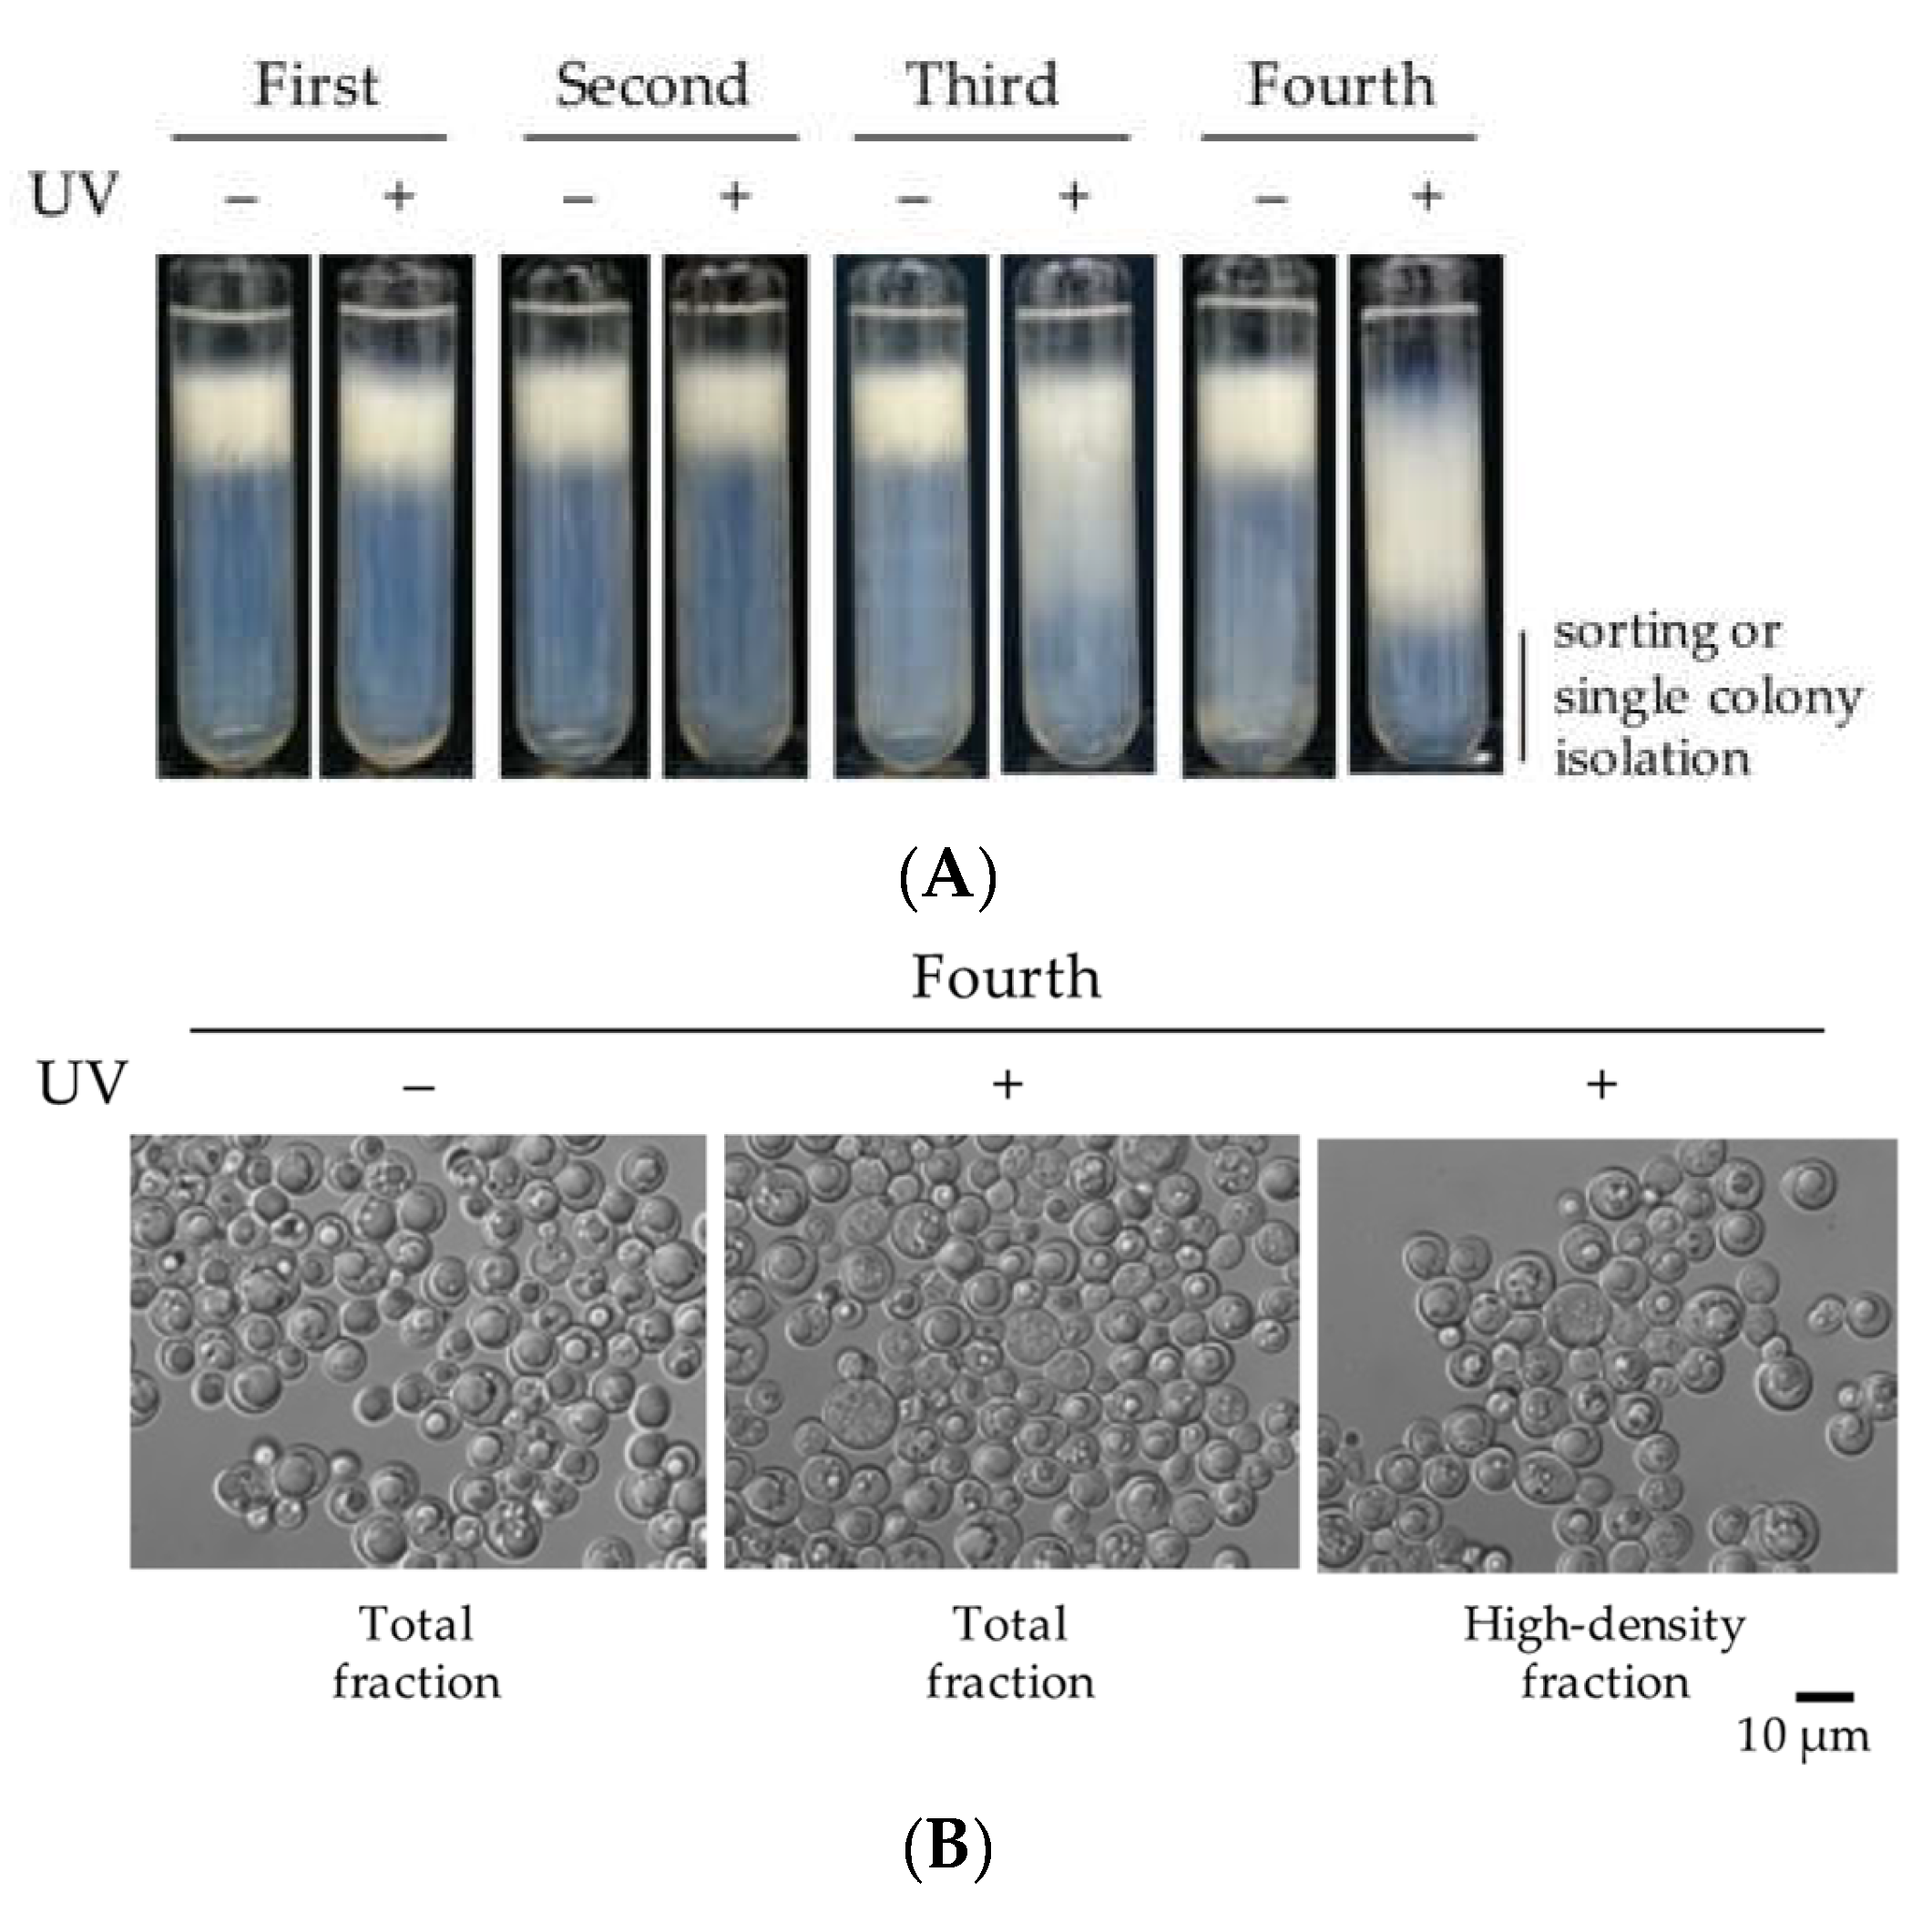
The UV treatment of
L. starkeyi CBS1807 cells was performed only once before the first Percoll gradient centrifugation, as previously described [
25], with an UV irradiation time of 35 s. The cells were obtained, washed with SG medium, and resuspended in 1 mL of SG medium. High-density cell enrichment was performed using Percoll density gradient centrifugation.
2.4. Cell Survival Rate after UV Treatment
The UV-treated (0.816 mW/cm2) and untreated cell suspensions were diluted to 2000 and 10,000 cells/mL with a YPD medium, and 100 µL of each diluted cell suspension were inoculated on a YPD solid medium. After four days of incubation at 30 °C, the number of colonies was counted, and the survival rate of the UV-treated cells was calculated as follows: survival rate (%) = (colony count of UV-treated cells)/(colony count of untreated cells) × 100.
2.5. Enrichment of High-Density Cells Using Percoll Density Gradient Centrifugation
The UV-treated cells were enriched using previously described techniques [
24]. Briefly, the UV-treated cells, other than those used for the measurement of cell survival rate, were washed once with an SG medium; then, the cells were inoculated with 50 mL of SG medium in a 200 mL baffled flask and cultured for six days at 30 °C and 160 rpm. The cultured cells were inoculated at 3.0 × 10
6 cells/mL into 300 mL of S medium in a 500 mL baffled flask and cultured for one day at 30 °C and 160 rpm to prepare cells in log phase with glucose assimilation and little accumulation of TAG. Then, the resultant culture was again inoculated at 1.2 × 10
7 cells/mL into 300 mL of S medium in a 500 mL baffled flask and cultured for six days at 30 °C and 160 rpm. About 1.0 × 10
9 cells were obtained from the culture via centrifugation at 2270×
g for 5 min at 25 °C. After removing the supernatant, the cells were suspended with 1 mL of PBS (0.8% NaCl, 0.29% Na
2HPO
4·12H
2O, 0.02% KCl, and 0.02% KH
2PO
4). This cell suspension was mixed with 8 mL of 90% Percoll (Cytiva, Uppsala, Sweden) and centrifuged at 22,000 rpm in a 70.1 Ti rotor (Beckman Coulter, Brea, CA, USA) for 20 min at 25 °C. After the Percoll density gradient centrifugation, approximately 3 mL of the lower fraction containing the high-density cells was fractionated and inoculated on an SG medium for the next cultivation. This enrichment of high-density cells was repeated four times; then, the lower fraction comprising the high-density cells was inoculated on S solid medium and cultured for four days at 30 °C.
2.6. Large-Scale Cultivation Condition
The
L. starkeyi mutant cells with decreased lipid productivities than the wild-type strain were isolated and characterized under the culture conditions as previously described [
25]. Briefly, the wild-type and mutant cells were cultured in 50 mL of SG medium in a 200 mL baffled flask at 30 °C for three days at 160 rpm. The resulting cultures were transferred to 300 mL of S medium (5% glucose) in a 500 mL baffled flask at 3.0 × 10
6 cells/mL and precultured for one day at 30 °C and 160 rpm. Then, the precultured yeast cells with an initial cell density of 1.2 × 10
7 cells/mL were inoculated into a 500 mL baffled flask with 300 mL of S medium (5% glucose) and cultivated at 30 °C and 160 rpm.
2.7. Small-Scale Cultivation Condition
L. starkeyi ∆lslig4, ∆lslig4∆acl1∆acl2, ∆lslig4/ACL1ACL2, sr22, and sr22/ACL1ACL2 cells were cultured in 50 mL of S medium (5% glucose), with or without 0.05% acetate, in a 200 mL baffled flask for three days at 30 °C and 160 rpm. The cells cultured in the abovementioned medium were transferred to 75 mL of S medium, with or without 0.05% acetate, in a 200 mL baffled flask to yield a cell concentration of 1.25 × 10⁶ cells/mL and cultured at 30 °C for one day. The resultant culture was inoculated at an initial cell density of 1.25 × 10⁶ cells/mL in 75 mL of S medium, with or without 0.05% acetate, in a 200 mL baffled flask and cultivated at 30 °C.
2.8. Microscopy
Differential interference contrast (DIC) microscopy was performed using a BX53 microscope (Olympus, Tokyo, Japan).
2.9. Quantification of TAG Content
The extraction and quantification of the amount of intracellular lipids (mainly TAG) were carried out as previously described [
24]. The cells harvested from the liquid culture were used to prepare a cell suspension (OD 660 = 20) with 500 µL of PBS in a 2 mL tube. The cells were broken by 1 g of glass beads (0.5 mm in diameter, AS ONE, Osaka, Japan) at 25 °C using a Multi-Beads Shocker (Yasui Kikai, Osaka, Japan) for 15 min at 2500 rpm. After that, 500 µL of PBS was added to a 2 mL tube and shaken using a Micro Mixer (TAITEC, Saitama, Japan). The determination of TAG and glycerol in the broken cell samples were enzymatically analyzed using TG E-test (FUJIFILM Wako Pure Chemical) and F-Kit glycerol (Roche Diagnostics, Tokyo, Japan), following the manufacturer’s instructions. Assuming that the total TAG was constituted by triolein, the amount of TAG was determined as the difference in the values obtained using the TG E-test and F-Kit for glycerol.
2.10. Quantification of the Glucose Concentration of the Culture Supernatant
The measurement of the glucose concentration was carried out as previously described [
24]. The glucose concentration of the contained culture supernatant was measured using a Wako Glucose C-II Test (FUJIFILM Wako), following the manufacturer’s instruction.
2.11. Genomic DNA Extraction
The yeast cells (40 units of optical density at 660 nm) cultured with a YPD liquid medium were collected in a 2 mL tube via centrifugation at 10,000× g for 1 min at room temperature. The supernatant was discarded, and the cell pellet was washed twice with distilled water. The resultant cells were suspended with 250 µL of lysing buffer (100 mM NaCl (FUJIFILM Wako), 10 mM Tris-HCl (pH 8.0), and 1 mM EDTA (pH 8.0)), then, the cell suspension was mixed with 250 µL of TE-phenol (phenol equilibrated to TE )10 mM Tris-HCl, pH 8.0; 1 mM EDTA)), phenol-chloroform, and 1 g of glass beads (0.5 mm diameter, AS ONE). The cells were broken by vortexing using a Delta Mixer Se-08 (TAITEC) for 20 min at room temperature. The resultant mixture was mixed with 400 µL of TE-phenol. After the centrifugation at 18,000× g for 10 min at room temperature, the upper layer (250 µL) was transferred to a 1.5 mL test tube and vortexed with 250 µL of phenol-chloroform. After the centrifugation at 18,000× g for 10 min at room temperature, the upper layer (200 µL) was transferred to a 1.5 mL test tube. The supernatant was mixed with 20 µL of 3 M sodium acetate and 500 µL of ethanol. The mixture was allowed to stand for 5 min at room temperature; then, it was centrifugated at 18,000× g for 5 min at room temperature. Removing the supernatant, the resultant pellet was rinsed with 200 µL of 70% ethanol. After the centrifugation at 18,000× g for 2 min at room temperature, the supernatant was removed. The pellet was dissolved in a TE-RNaseA buffer (10 mM Tris-HCl (pH 8.0), 1 mM EDTA (pH 8.0), and 50 µg/mL RNaseA (Nippon Gene, Toyama, Japan)) and incubated at 37 °C for 2 h.
2.12. Quantitative Real Time PCR (qRT-PCR) Analysis
Total RNA extraction, reverse transcription, and quantitative real time polymerase chain reaction (qRT-PCR) analysis were done as previously described [
25]. Briefly, the yeast cells harvested from 3 mL of liquid culture were washed with PBS. The resulting washed cells were suspended in 350 µL of TES buffer (10 mM Tris-HCl (pH 7.5), 10 mM ethylenediaminetetraacetic acid (pH 7.5), and 0.5% sodium lauryl sulfate) and 350 µL of water-saturated phenol in a 2 mL tube. The mixtures were disrupted with 1.4 g of zirconia beads (0.5 mm in diameter, YTZ-0.5; AS ONE) using a Multi-Beads Shocker at 2500 rpm for 12 cycles of 60 s of agitation and 60 s of rest at 4 °C. The homogenate was transferred to a 2 mL tube and centrifuged at 20,000×
g for 10 min at 4 °C. The upper layer (350 µL) was transferred to a 1.5 mL tube and mixed with ISOGENII (Nippon Gene). After vortexing, the tube was set aside for 5 min at room temperature. The solution was vortexed with 240 µL of chloroform and centrifuged at 20,000×
g for 5 min at room temperature. About 800 µL of the upper layer was transferred to a 1.5 mL test tube and mixed with 480 µL of ethanol. The mixture was further purified using an Illustra RNAspin Mini RNA Isolation Kit (Cytiva, Piscataway, NJ, USA), following the manufacturer’s instructions.
The first-strand cDNA was reverse transcribed from the extracted RNA using a PrimeScript RT reagent Kit (TaKaRa Bio, Shiga, Japan) following the manufacturer’s instructions.
Quantitative real time PCR analysis was performed using TB Green Premix Ex Taq II (TaKaRa Bio) on the Thermal Cycler Dice Real Time System III TP950 (TaKaRa Bio). The reaction mixture (20 µL) contained 10 µL of TB Green Premix Ex Taq II (Tli RNaseH Plus), 0.8 µL of 10 µM forward primer, 0.8 µL of 10 µM reverse primer, 2 µL of the DNA template, and 6.4 µL of sterile water. The primers for qRT-PCR were previously described by Takaku et al. [
25] (
Table S2). The PCR reaction conditions included an initial desaturation step at 95 °C for 30 s and 40 cycles of 95 °C for 5 s and 60 °C for 30 s. The final dissociation step was run at 95 °C for 15 s, 60 °C for 30 s, and 95 °C for 15 s. The relative changes in the transcriptional levels of genes were estimated using a relative standard curve method and normalized to the 18S rRNA gene. The standard curves for the relative quantification of target genes were obtained using the genomic DNA of wild-type
L. starkeyi. For each gene, the standard genomic DNAs were amplified together with sample cDNAs in the same PCR run. The genomic DNA of
L. starkeyi was prepared as mentioned above by genomic DNA extraction.
2.13. General Molecular Biology Techniques
The genomic DNA of L. starkeyi strains was prepared as mentioned above. The plasmid DNA was extracted using a FastGene® Plasmid Mini Kit (Nippon Genetics Co., Ltd., Tokyo, Japan). PCR was performed using KOD One® PCR Master Mix DNA polymerase in accordance to the manufacturer’s instructions (Toyobo Co., Ltd., Osaka, Japan). The amplified PCR products were extracted using a FastGene® Gel/PCR extraction Kit (Nippon Genetics Co., Ltd.).
2.14. Construction of the Disruption Cassette Plasmid pKS-hph-ACL1-ACL2
To disrupt the
L. starkeyi ACL genes (
ACL1 (gm1.5446_g) and
ACL2 (gm1.5447_g)), a pKS-hph-ACL1-ACL2 plasmid was constructed. It contained the
LsTDH3 promoter/hph/
LsTDH3 terminator DNA fragment for expression and the untranslated regions (UTRs) of the
ACL1 and
ACL2 genes. The plasmid pKS-hph-ACL1-ACL2 was assembled with four PCR fragments using NEBuilder
® HiFi DNA Assembly (New England BioLabs, Ipswich, MA, USA). The PCR fragments of 5′- and 3′-UTRs of the
ACL1 and
ACL2 genes were amplified with the primer sets ACL1ACL2-5′UTR-Fw/ACL1ACL2-5′UTR-Rv and ACL1ACL2-3′UTR-Fw/ACL1ACL2-3′UTR-Rv, respectively, using the genomic DNA of
L. starkeyi CBS1807 as a template. The PCR fragment containing the
LsTDH3 promoter region, hygromycin B resistance marker (
hph) and
LsTDH3 terminator region was amplified with the primer set ACL1ACL2-P+hph+T-Fw/ACL1ACL2-P+hph+T-Rv using the plasmid pKS-18S-hph [
13]. The PCR fragment of the vector region was amplified with the primer set Vector-Fw/Vector-Not1-site-Rv using the plasmid pKS-18S-hph as a template. The PCR primers used for plasmid construction are described in
Table 1. The DNA fragment used for yeast transformation was obtained by digesting the plasmid pKS-hph-ACL1-ACL2 with
NotI (Takara Bio).
2.15. Construction of the High Expression Cassette Plasmid pKS-PTDH3-ACL1-sNAT1-PTDH3-ACL2
To express a high level of ACL1 and ACL2 genes, we constructed the plasmid pKS-PTDH3-ACL1-sNAT1-PTDH3-ACL2 containing the LsTDH3 promoter/ACL1/LsTDH3 terminator, LsACT1 promoter/sNAT1/LsACT1 terminator, and LsTDH3 promoter/ACL2/LsTDH3 terminator DNA fragments for the expression of ACL1, nourseothricin resistance marker (sNAT1), and ACL2 genes, respectively, in L. starkeyi and the 5′- and 3′-UTRs of LsLIG4 genes. The four DNA fragments, LsLIG4 3′UTR/Vector region/LsLIG4 5′UTR, LsTDH3 promoter/ACL1/LsTDH3 terminator, LsACT1 promoter/sNAT1/LsACT1 terminator, and LsTDH3 promoter/ACL2/LsTDH3 terminator, were assembled using NEBuilder® HiFi DNA Assembly.
To construct the DNA fragment of
LsLIG4 3′UTR/Vector region/
LsLIG4 5′UTR, the DNA fragments of the 5′ and 3′ UTRs of the
LsLIG4 gene were amplified with the primer sets of LsLIG4-5′UTR-Fw2/LsLIG4-5′UTR-Rv and LsLIG4-3′UTR-Fw2/LsLIG4-3′UTR-Rv, respectively, using the genomic DNA of
L. starkeyi CBS1807 as a template. The DNA fragment of the vector region was amplified with the primer set of Vector-Fw2/Vector-Rv, using the plasmid pKS-18S-hph [
13] as a template. The DNA fragment of
LsLIG4 3′UTR/Vector region/
LsLIG4 5′UTR was amplified with a primer set of LsLIG4-3′UTR-Fw2/LsLIG4-5′UTR-Rv using the assembled DNA fragment (
LsLIG4 3′UTR, Vector region,
LsLIG4 5′UTR), with NEBuilder
® HiFi DNA Assembly as a template.
To construct the DNA fragment of LsTDH3 promoter/ACL1/LsTDH3 terminator region, the DNA fragments of LsTDH3 promoter and LsTDH3 terminator were amplified using the primer sets of ACL1-PTDH3-Fw/ACL1-PTDH3-Rv and ACL1-TTDH3-Fw/ACL1-TTDH3-Rv, respectively. The DNA fragment of ACL1 was amplified with the primer set of ACL1-cDNA-Fw/ACL1-cDNA-Rv using the cDNA of L. starkeyi CBS1807 as a template. The DNA fragment of LsTDH3 promoter/ACL1/LsTDH3 terminator region was amplified with the primer set of ACL1-PTDH3-Fw/ACL1-TTDH3-Rv using the assembled DNA fragment (LsTDH3 promoter, ACL1, and LsTDH3 terminator region) as a template using NEBuilder® HiFi DNA Assembly.
To construct the fragment of
LsACT1 promoter/
sNAT1/
LsACT1 terminator region, the DNA fragments of
LsACT1 promoter and
LsACT1 terminator were amplified with the primer sets of PACT1-Fw/PACT1-Rv and TACT1-Fw/TACT1-Rv, respectively, using the genomic DNA of
L. starkeyi CBS1807 as a template [
27]. The DNA fragment of the
sNAT1 region was amplified with the primer set of sNAT1-PACT1-Fw/sNAT1-PACT1-Rv using pKS-LsLIG4-sNAT1 [
15] as a template. Using NEBuilder
® HiFi DNA Assembly, the DNA fragment of
LsACT1 promoter/
sNAT1/
LsACT1 terminator region was amplified using the primer set of PACT1-Fw/TACT1-Rv, with the assembled DNA fragment (
LsACT1 promoter,
sNAT1,
LsACT1 terminator region) as a template.
Finally, to construct the DNA fragment of
LsTDH3 promoter/
ACL2/
LsTDH3 terminator region, the DNA fragments of
LsTDH3 promoter and
LsTDH3 terminator were amplified with the primer sets of ACL2-PTDH3-Fw/ACL2-PTDH3-Rv and ACL2-TTDH3-Fw/ACL2-TTDH3-Rv, respectively, using the genomic DNA of
L. starkeyi CBS1807 as a template. The DNA fragments of
ACL2 were amplified with the primer set of ACL2-cDNA-Fw/ACL2-cDNA-Rv using the cDNA of
L. starkeyi CBS1807 as a template. The DNA fragment of
LsTDH3 promoter/
ACL2/
LsTDH3 terminator region was amplified with the primer set of ACL2-TTDH3-Fw/ACL2-TTDH3-Rv using the assembled DNA fragment (
LsTDH3 promoter,
ACL2, and
LsTDH3 terminator region) as a template by NEBuilder
® HiFi DNA Assembly. The PCR primers used for plasmid construction as described in
Table 1. The DNA fragment used for yeast transformation was obtained by digesting the plasmid pKS-PTDH3-ACL1-sNAT1-PTDH3-ACL2 with ApaI (Takara Bio).
2.16. Yeast Transformation
The transformation of
L. starkeyi by electroporation was performed as described previously [
15]. Briefly,
L. starkeyi ∆
lslig4 or sr22 cells were cultured in YPD to the mid-log phase (OD660, 6.0). The cells were put on ice and collected by centrifugation. After removing the supernatant, the cells were suspended with 8 mL of sterilized distilled water. After adding 1 mL of TE and 1 mL of 2 M LiAc, the cell suspension was incubated at 30 °C for 45 min with slow shaking. Then, 100 µL of 1 M dithiothreitol (DTT) was added, and the cell suspension was incubated at 30 °C for 15 min with slow shaking. After being diluted to 50 mL with ice-cold sterilized distilled water, the cells were harvested by centrifugation, washed with 50 mL of ice-cold sterilized distilled water, and resuspended with 3 mL of 0.5 M ice-cold sucrose. After the centrifugation, 40 µL of the resultant cell pellets and 1 µg of the DNA fragments for yeast transformation were mixed in a chilled 1.5 mL microtube, transferred to a chilled 0.2 cm electroporation cuvette (Bio-Rad Laboratories, Hercules, CA, USA), and pulsed with the conditions of capacitance at 25 µF, field strength at 3.75 kV/cm, and resistance at 800 Ω using the Gene Pulser X-Cell (Bio-Rad Laboratories). After pulsing, 1 mL of YPD medium with 0.5 M sucrose was immediately added to the cuvette, mixed gently, transferred into 4 mL of YPD medium with 0.5 M sucrose, and incubated at 30 °C for 10 h with slow shaking. When the culture was centrifugated, the resultant pellet was resuspended in sterilized distilled water, inoculated on YPD agar plate containing 100 µg/mL hygromycin B or 30 µg/mL nourseothricin, and incubated at 30 °C for four days. To confirm the target DNA integration in the transformants, PCR was performed using the obtained transformant colony as a template and the primer sets of ACL1-3′UTR-out-Fw/ACL1-3′UTR-out-Rv for
ACL1 and
ACL2 locus insertion or LsLIG4-5′UTR-out-Fw/LsLIG4-3′UTR-out-Rv for
LsLIG4 locus insertion (
Figure S1A,B,D,E,G,H). We also confirmed the target DNA integration by Southern blot analysis of the genomic DNA of the transformants (
Figure S1A,C,D,F,G,I).
2.17. Statistical Analysis
The statistical analysis was performed using t-test in GraphPad Prism software, version 8 (GraphPad Software Inc., San Diego, CA, USA). The differences were considered significant at p < 0.05.
4. Discussion
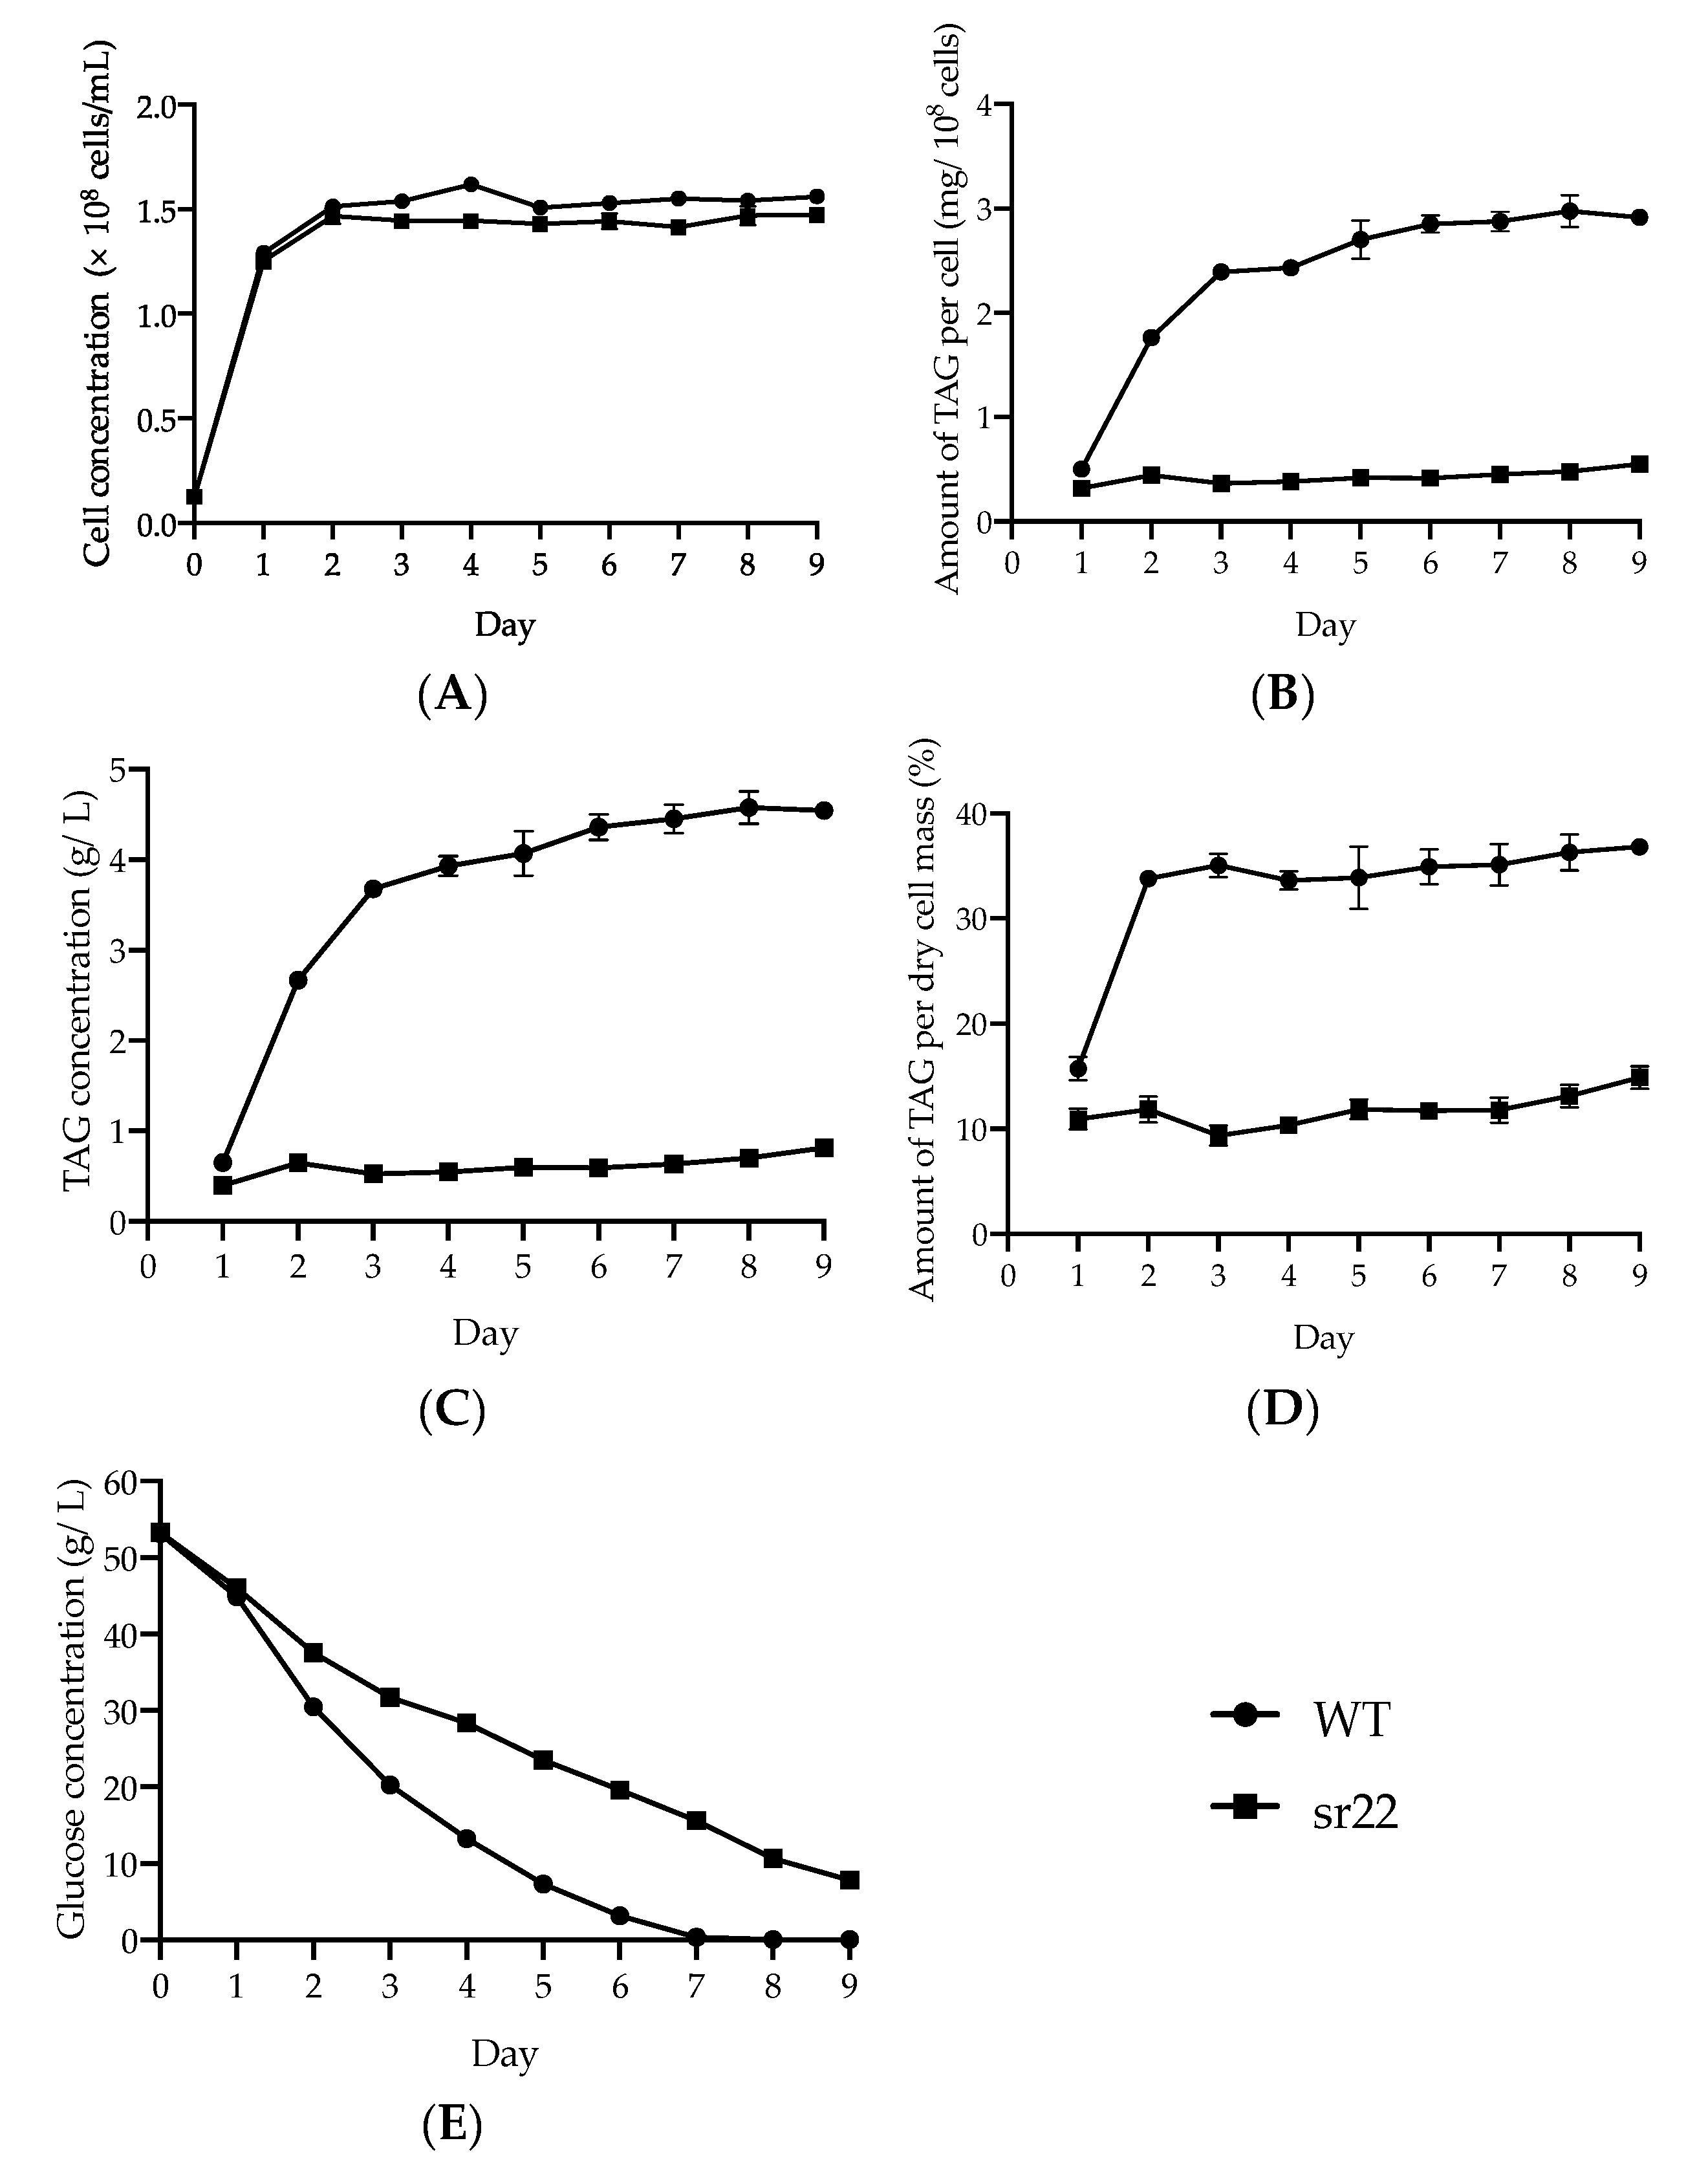
In this study, we obtained an L. starkeyi mutant, sr22, with significantly decreased lipid productivity. The sr22 mutant had decreased expression levels of acyl-CoA synthesis pathway-related genes (ACL1, ACL2, ACC1, FAS1, and FAS2) compared with those of the WT strain. We also revealed that the deletion of ACL1 and ACL2 genes coding for ACL, which is responsible for the first reaction of citrate-mediated acyl-CoA synthesis pathway, led to poor growth and decreased lipid productivity in the glucose medium.
Several mutants with increased lipid productivities were obtained in oleaginous yeasts, such as
R. glutinis [
17],
R. toruloides [
18,
19,
20],
Y. lipolytica [
21,
22],
L. starkeyi [
23,
24,
25], and
C. curvatus [
26]. Some of these mutants have enhanced lipid productivities and increased expression of acyl-CoA synthesis-related genes compared with their parent strains [
19,
20,
25,
26,
36]. However, to our knowledge, there are no recent studies that obtained mutants with greatly decreased lipid productivity and performed the expression analysis of TAG synthesis-related genes in oleaginous yeasts. The isolation and analysis of mutants with increased lipid productivities and decreased lipid productivities will potentially provide valuable information on TAG synthesis. We previously established a significantly efficient method to enrich the low-density cells, which produced an increased amount of TAG. In this study, given that the decrease in TAG in cells corresponds to the increase in intracellular density, we tried to efficiently isolate the mutants with decreased lipid productivities using the highly selective screening strategy in reverse to enrich the high-density cells, which were expected to accumulate less TAG [
24]. The cells with a different amount of TAG were efficiently fractionated and enriched by Percoll density gradient centrifugation. This method is expected to be widely used to isolate TAG accumulation in cells based on their intracellular densities in oleaginous microorganisms.
The expression levels of citrate-mediated acyl-CoA synthesis pathway-related genes (
ACL1,
ACL2,
ACC1,
FAS1, and
FAS2) of the sr22 mutant with greatly decreased lipid productivity were significantly lower than those of the WT strain (
Figure 4). We previously exhibited the significantly increased expression of
ACL1,
ACL2,
ACC1,
FAS1, and
FAS2 genes in the
L. starkeyi mutants with increased lipid productivities (E15, E15-11, E15-15, and E15-25) [
25]. In some oleaginous yeast mutants, the elevated levels of acyl-CoA synthesis pathway-related gene expression were reported to lead to improved lipid productivity. The expressions of
ACL1,
FAS1, and
FAS2 genes in the
R. toruloides mutants R-ZY13 and 8766 3-11C with increased lipid productivities exceeded those in the parent strains [
20,
26]. In
Y. lipolytica, the comparative transcriptomic analysis between the control strain and mutant E26 with significantly improved lipid productivity showed upregulated acyl-CoA synthesis-related genes in the mutant [
36]. Hence, in oleaginous yeasts, the expression changes in
ACL1,
ACL2,
ACC1,
FAS1, and
FAS2 genes linked to the increase or decrease in TAG productivities and the overexpression of citrate-mediated acyl-CoA synthesis-related enzymes may be a driving force for lipogenesis.
We also showed that the ∆
lslig4/
ACL1ACL2 strain with highly expressed
ACL1 and
ACL2 genes in the citrate-mediated acyl-CoA synthesis pathway could not enhance the TAG productivity as compared with ∆
lslig4 (
Figure S5A). There was no difference in the expression levels of
ACC1,
FAS1, and
FAS2 genes between ∆
lslig4/
ACL1ACL2 and the reference strain (∆
lslig4) (
Figure S5B), while the expression levels of
ACL1,
ACL2,
ACC1,
FAS1, and
FAS2 genes in
L. starkeyi mutants with increased lipid productivities were largely increased as compared with those of the reference strain (wild-type). Furthermore, high expression of
ACL1 and
ACL2 genes in the sr22 mutant with greatly decreased lipid productivity did not restore the TAG productivity of sr22 mutant and had no effect on the expression levels of
ACC1,
FAS1, and
FAS2 genes of sr22 mutant (
Figure S6A,B). Thus, we propose that the enhancement of TAG productivity is required for the upregulation of
ACL1,
ACL2,
ACC1,
FAS1, and
FAS2 genes in
L. starkeyi.
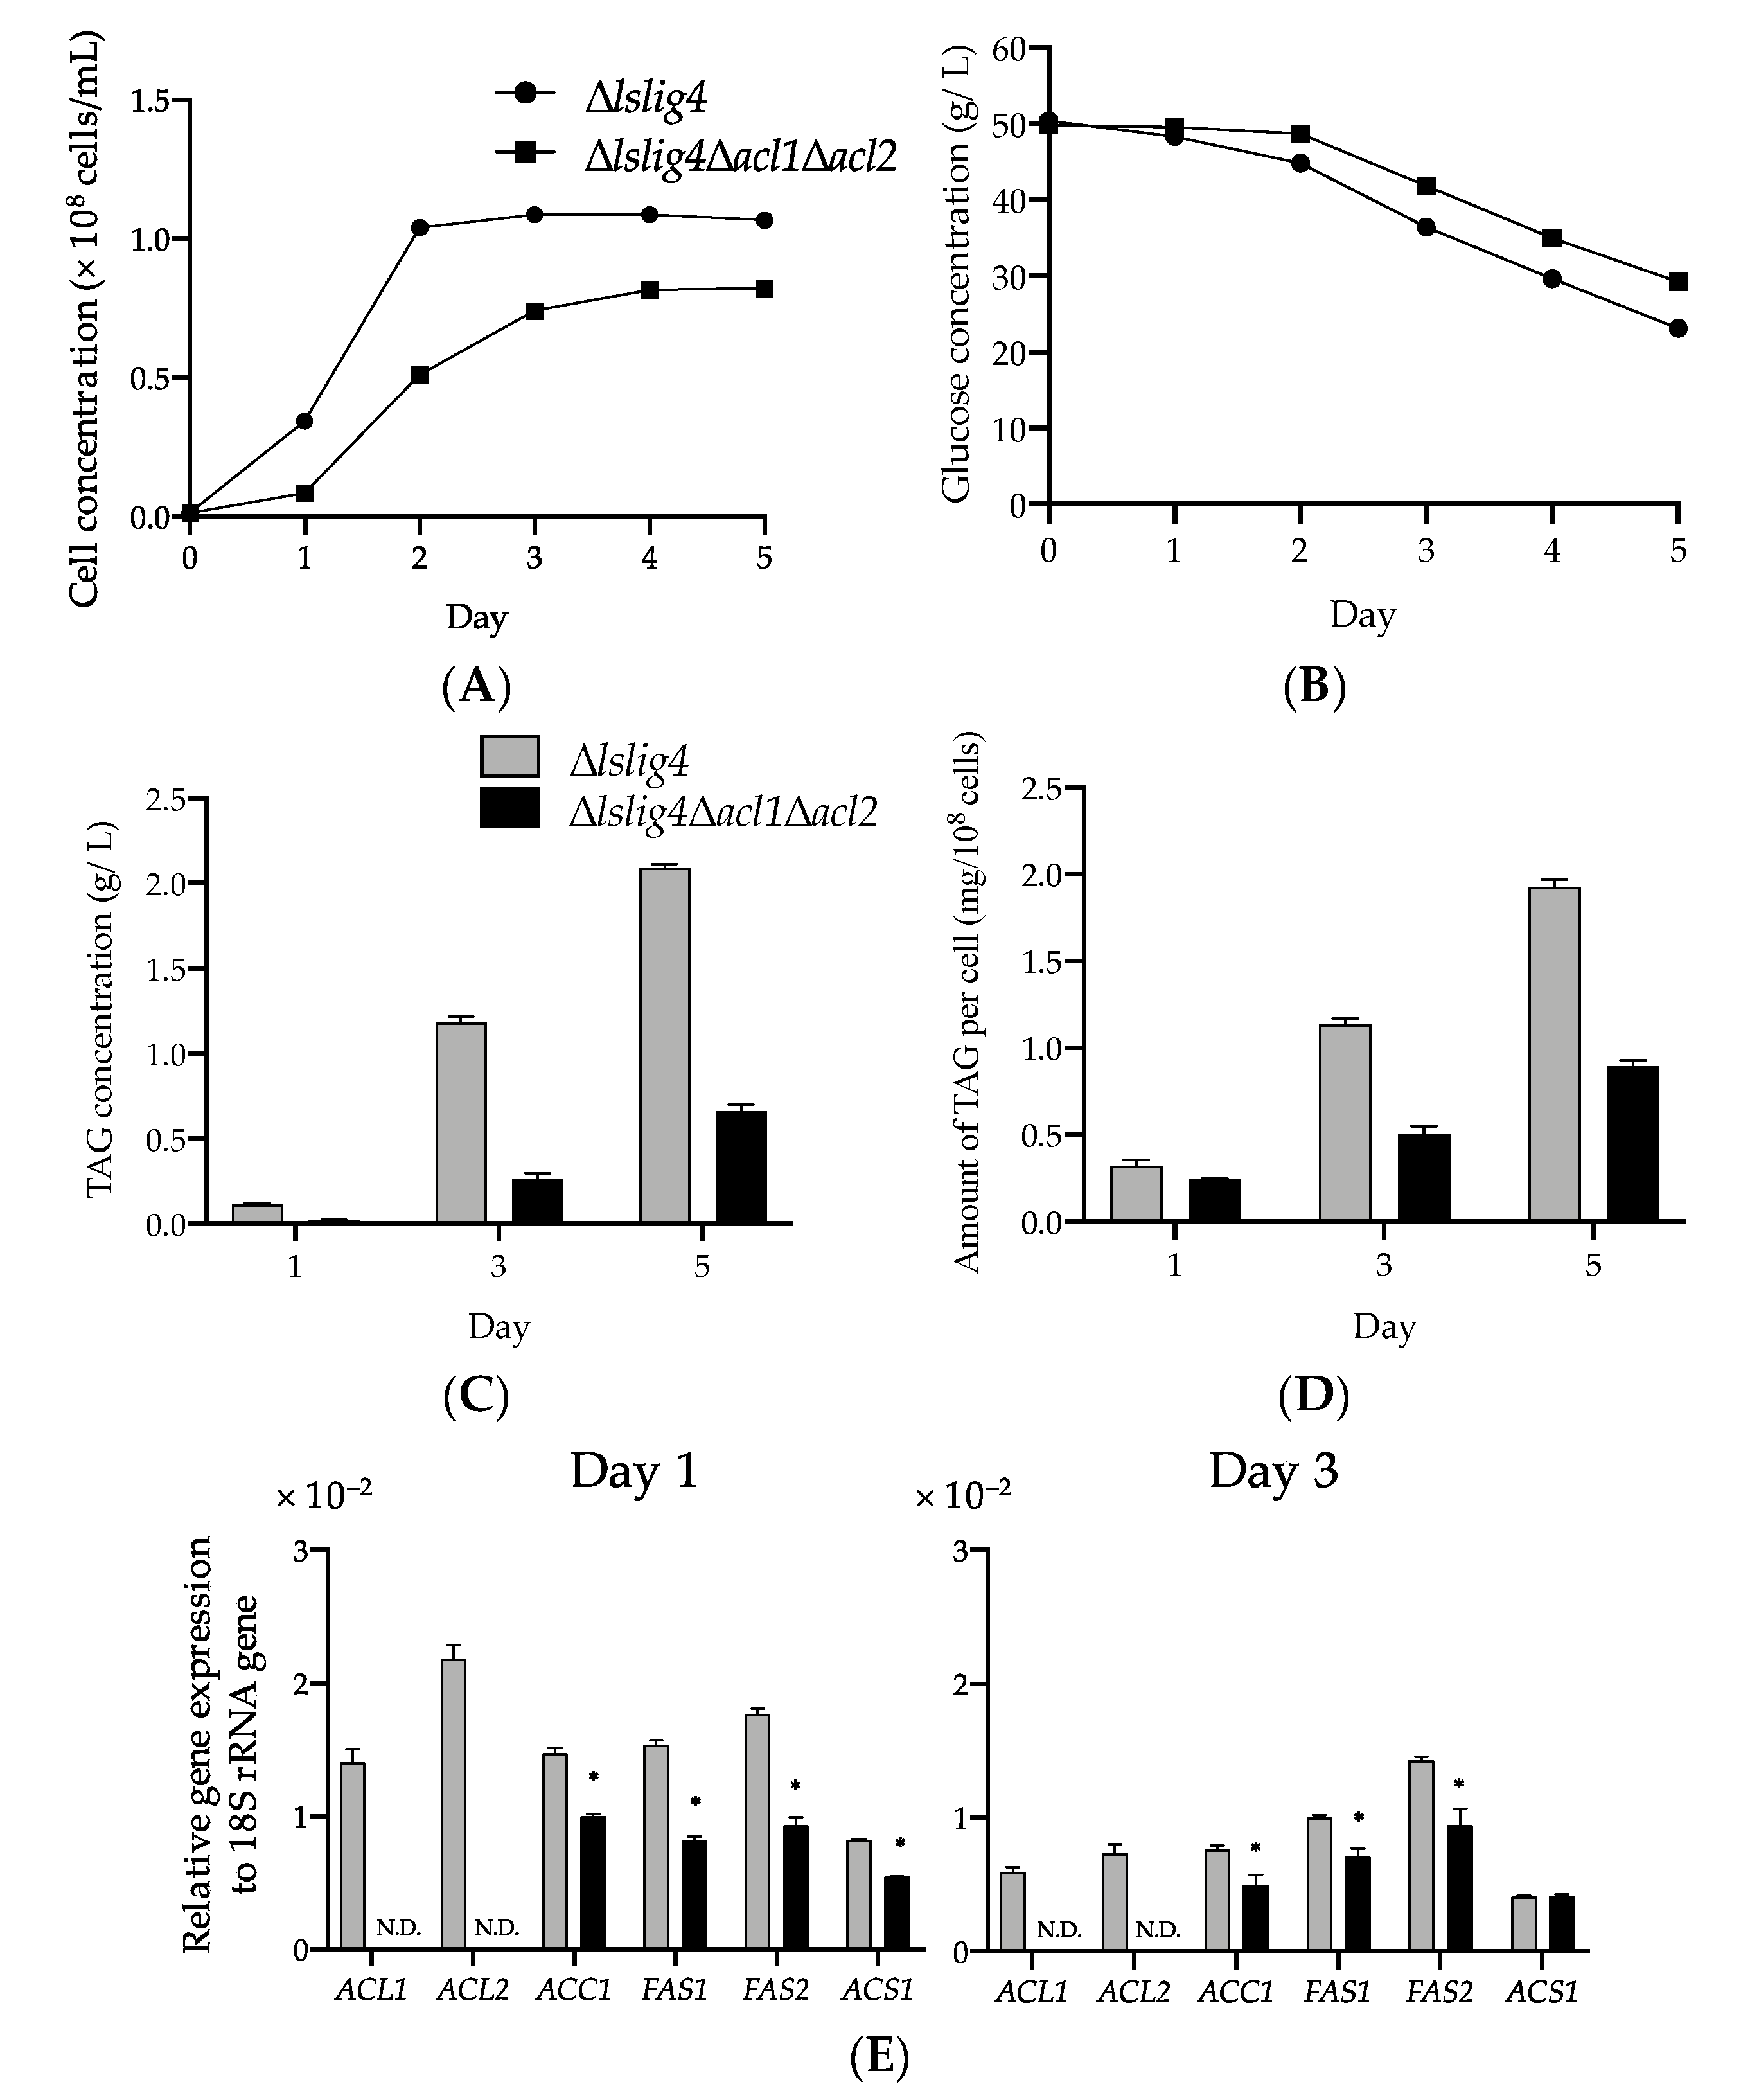
∆
lslig4∆
acl1∆
acl2 exhibited poor cell growth, slow glucose consumption rate, and low TAG accumulation in the S medium containing glucose compared with the reference strain (∆
lslig4) (
Figure 5A–D). ∆
lslig4∆
acl1∆
acl2 also exhibited decreased expressions of
ACS1,
ACC1,
FAS1, and
FAS2 genes in the S medium containing glucose compared ∆
lslig4 (
Figure 5E). The growth and the expression levels of
ACS1,
ACC1,
FAS1, and
FAS2 genes in ∆
lslig4∆
acl1∆
acl2 were recovered to the same level as those of the reference strain ∆
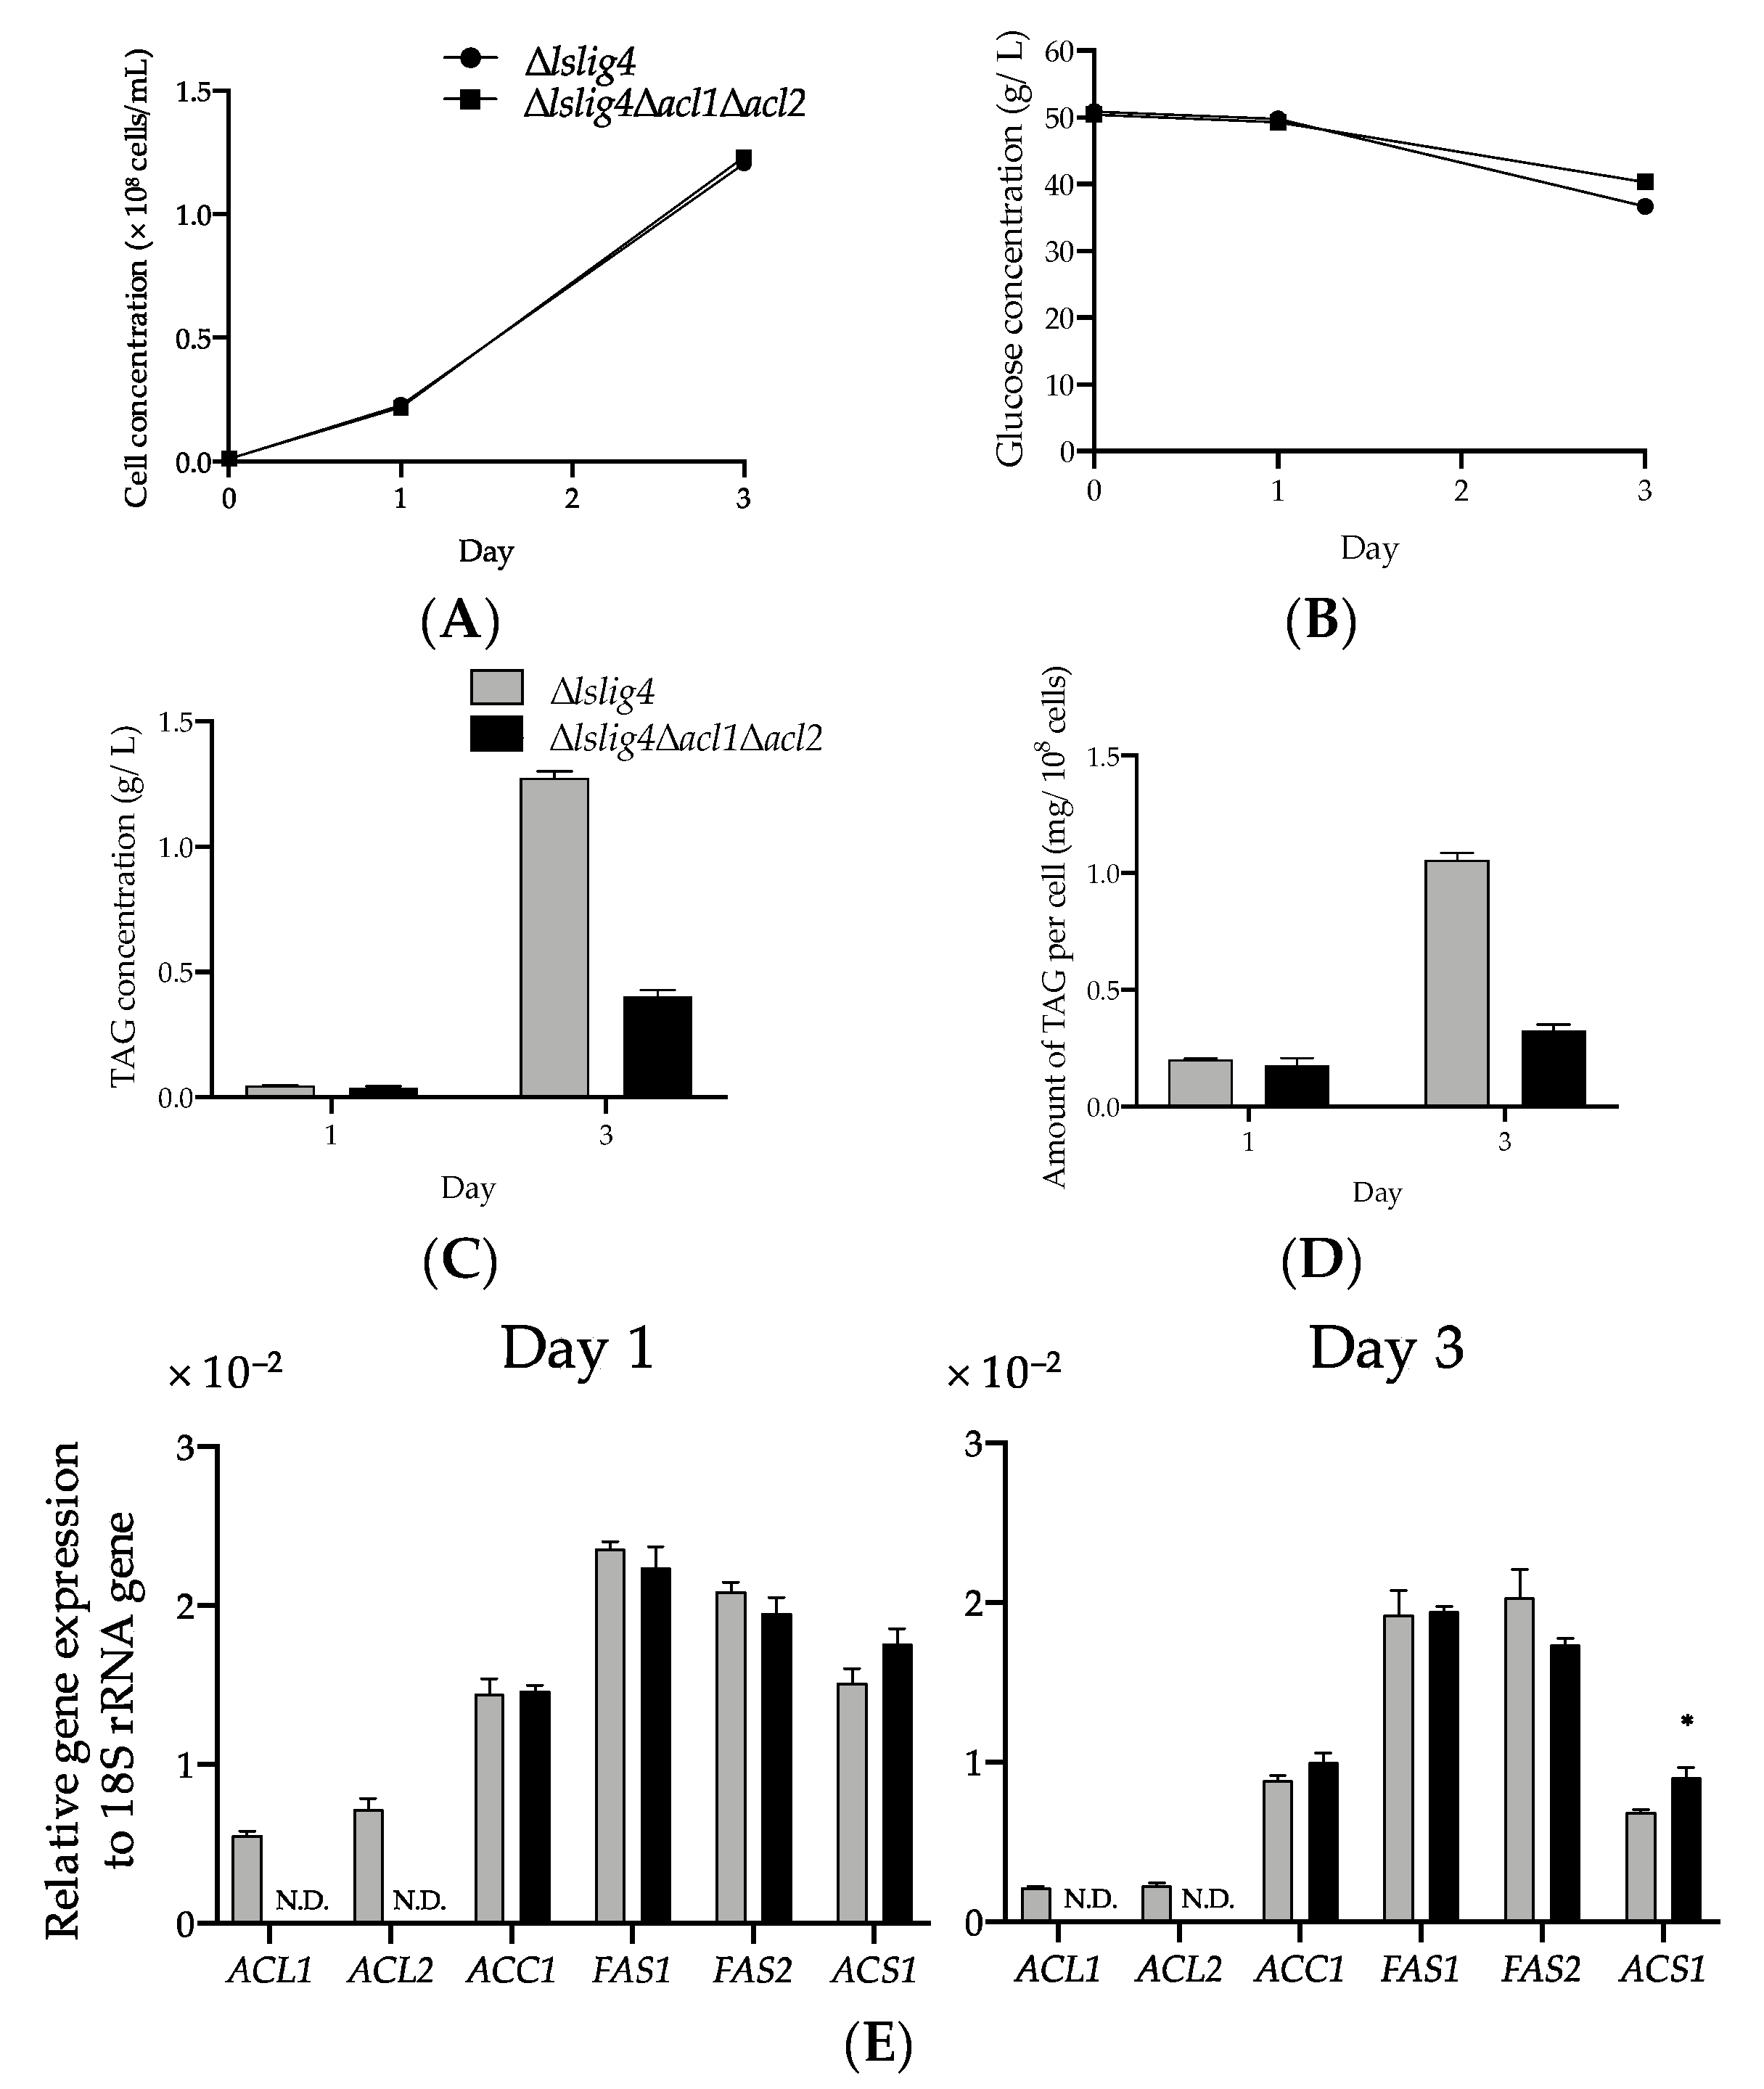
lslig4 when acetate was added to the S medium containing glucose (
Figure 6A,E). However, the TAG productivity in ∆
lslig4∆
acl1∆
acl2 remained lower than that of the reference strain ∆
lslig4 (
Figure 6B–D). In conclusion, our results suggest that cytosolic acyl-CoA is required for the growth and TAG accumulation of
L. starkeyi. Especially, the supply of citrate-derived cytosolic acyl-CoA produced via citrate-mediated synthesis is responsible for its high TAG accumulation and growth at an early stage. The promotion of TAG synthesis requires the upregulation of citrate-mediated acyl-CoA synthesis-related genes (
ACL1,
ACL2,
ACC1,
FAS1, and
FAS2). This study will help us increase the TAG accumulation and expand our current knowledge on the regulation of TAG synthesis in
L. starkeyi. Our future research will improve the TAG productivity by a simultaneous high expression of citrate-mediated acyl-CoA synthesis-related genes by genetic engineering.


 ,
, 


