Article

RTG Signaling Sustains Mitochondrial Respiratory Capacity in HOG1-Dependent Osmoadaptation

1
Department of Biosciences, Biotechnologies and Biopharmaceutics, University of Bari “Aldo Moro”, 70125 Bari, Italy
2
Institute of Biomembranes, Bioenergetics and Molecular Biotechnologies, National Research Council, 70125 Bari, Italy
3
Department of Biology and Biotechnology ‘Charles Darwin’, Pasteur Institute-Cenci Bolognetti Foundation, Sapienza University of Rome, Piazzale Aldo Moro 5, 00185 Rome, Italy
*
Author to whom correspondence should be addressed.
Submission received: 15 August 2021 / Revised: 28 August 2021 / Accepted: 2 September 2021 / Published: 6 September 2021

Abstract

:
Mitochondrial RTG-dependent retrograde signaling, whose regulators have been characterized in Saccharomyces cerevisiae, plays a recognized role under various environmental stresses. Of special significance, the activity of the transcriptional complex Rtg1/3 has been shown to be modulated by Hog1, the master regulator of the high osmolarity glycerol pathway, in response to osmotic stress. The present work focuses on the role of RTG signaling in salt-induced osmotic stress and its interaction with HOG1. Wild-type and mutant cells, lacking HOG1 and/or RTG genes, are compared with respect to cell growth features, retrograde signaling activation and mitochondrial function in the presence and in the absence of high osmostress. We show that RTG2, the main upstream regulator of the RTG pathway, contributes to osmoadaptation in an HOG1-dependent manner and that, with RTG3, it is notably involved in a late phase of growth. Our data demonstrate that impairment of RTG signaling causes a decrease in mitochondrial respiratory capacity exclusively under osmostress. Overall, these results suggest that HOG1 and the RTG pathway may interact sequentially in the stress signaling cascade and that the RTG pathway may play a role in inter-organellar metabolic communication for osmoadaptation.

1. Introduction

Mitochondrial retrograde signaling is an evolutionarily conserved pro-survival pathway sustaining metabolic adaptation especially, but not exclusively, in the case of mitochondrial dysfunction. This pathway has been characterized in its molecular details in Saccharomyces cerevisiae yeast cells lacking mitochondrial DNA. RTG (an acronym for ReTroGrade) genes are the major positive regulators of mitochondrial retrograde signaling, with RTG2 acting as the main upstream regulator and RTG1 and RTG3 forming a heterodimer binding the promoters of RTG-target genes [1]. RTG-dependent retrograde signaling elicits a transcriptional reprogramming of carbon metabolism to re-establish metabolic homeostasis altered by dysfunctional mitochondria [1]. Up-regulation of the peroxisomal isoform of citrate synthase (CIT2) serves to replenish the tricarboxylic acid cycle (TCA) cycle and is considered the hallmark of RTG pathway activation [2,3].
The contribution of mitochondrial retrograde signaling to yeast stress response and cellular adaptation has been described in several cases, including acid stress, endoplasmic reticulum stress, as well as oxidative and osmotic stress [4,5,6,7,8,9]. Particularly noteworthy is the report of the modulation of Rtg1/3 complex activity by the master regulator of osmostress response, the HOG1 stress activated protein kinase (SAPK), which points to a direct connection between RTG genes and targets and the high osmolarity glycerol (HOG) signaling system, functionally conserved from yeast to humans [8,10]. In this context, it is also of note that a prominent role of mitochondrial function as an inducible determinant of osmoadaptation has been described [11].
Although the picture of yeast osmoregulation is both extensive and detailed, integrated by computational simulations providing an overall holistic understanding, the interplay between and within stress pathways is still a matter of investigation [12,13,14,15,16]. In this regard, the way in which RTG signaling contributes to osmoadaptation remains to be elucidated.
This work aims to provide insight into the role of mitochondrial RTG signaling under conditions of salt-induced osmotic stress and its interaction with HOG1. Our results support a positive interaction between the two pathways, suggesting a temporal shift in the stress signaling cascade, with the RTG pathway acting downstream of HOG1. Our data also demonstrate the relevance of the RTG pathway in sustaining mitochondrial function under stress, reinforcing the strict relationship between stress response and metabolism in cellular adaptation.

2. Materials and Methods

2.1. Yeast Strains and Growth Conditions

The S. cerevisiae strains used in this study were W303-1B (WT) cells (MATα ade2 leu2 his3 trp1 ura3) and derivatives Δrtg2 (rtg2Δ::LEU2), Δrtg3 (rtg3::LEU2), Δhog1 (hog1Δ::NAT#2), kindly provided by Prof. Posas, Universitat Pompeu Fabra, Barcelona, Spain, as well as Δrtg2Δhog1 (rtg2Δ::LEU2 hog1Δ::NAT#2) [4,5]. Cells were grown at 30 °C in YPD (1% yeast extract, 2% bactopeptone and 2% glucose with 2% agar for solid medium) in the absence or in the presence of sodium chloride (NaCl). Cell growth was monitored qualitatively on YPD agar plates and quantitatively by measuring optical density (600 nm) on liquid YPD medium cultures grown either in micro-well plates or in flasks.

2.2. Micro- and Batch-Culture Growth Assays

For micro- and batch culture-growth assays, fresh overnight pre-cultures were diluted in triplicate in multiwell plates or flasks to the same initial OD600. Optical density was then constantly monitored using a high-precision TECAN microplate reader equipped with a shaker and a temperature control unit or by using a Thermo Spectronic Genesis 20 spectrophotometer at selected times. Micro-culture growth curves were analyzed in Microsoft Excel, and the cell growth parameters were determined as follows: the specific growth rate was calculated by plotting optical density as a function of time on a semi-logarithmic scale and extracting the angular coefficient of the obtained equation; doubling time was calculated as reported in [17]; growth efficiency was calculated as the percentage of the maximal cell density reached under stress conditions (with NaCl) compared to the control (without NaCl) [18]. Similarly, relative growth was calculated in batch cultures as a percentage of the optical density values under stress conditions compared to the control at different times. At least three independent cultures were analyzed for each condition in each independent experiment.

2.3. Spotting Assay

Fresh overnight yeast cultures (30 °C, YPD medium) were adjusted to the same optical density (OD600 = 1), and serial dilutions were spotted on YPD agar medium with or without NaCl. Plates were incubated at 30 °C for 2–5 days, and images were acquired by means of a ChemiDoc Touch Imaging System and analyzed using Image Lab software.

2.4. Quantitative PCR (qPCR)

The mRNA levels of peroxisomal citrate synthase-encoding gene (CIT2) were determined in continuously growing cells after 5 h of NaCl exposure and in the absence of stress. Then, 5 × 10⁷ cells were collected and centrifuged at 3000× g. Cell pellets were stored at −80 °C before total RNA extraction with a Presto Mini RNA Yeast Kit (Geneaid, New Taipei City, Taiwan). We immediately performed 0.5 μg RNA (OD260/OD280 ≥ 2.0) reverse transcription using a QuantiTect Reverse Transcription Kit (Qiagen, Hilden, Germany), and cDNA was directly used for quantitative PCR (qPCR) analysis or stored at −20 °C. The actin 1 (ACT1) mRNA was amplified in parallel and used as a housekeeping gene.
Quantitative PCR was carried out on a ABI Prism 7900 HT system from Applied Biosystems using the following primer pairs based on the cDNA sequences of the investigated genes and designed with Primer Express 3.0 (Applied Biosystems, Thermo Fisher Scientific, Waltham, Massachusetts, Stati Uniti). The primer sequences used were: CIT2-Forward 5′-TGTAAGGCAATTCGTTAAAGAGCAT-3′ and CIT2-Reverse 5′-CCCATACGCTCCCTGGAATAC-3′; ACT1-Forward 5′-ACTTTCAACGTTCCAGCCTTCT-3′ and ACT1-Reverse 5′-ACACCATCACCGGAATCCAA-3′. The primers were purchased from Invitrogen (Life Technologies). Twenty microliters of reaction volume contained 20 ng of reverse-transcribed first-strand cDNA, 10 μL of SYBR Select Master Mix (Applied Biosystems, Thermo Fisher Scientific, Waltham, Massachusetts, Stati Uniti) and 300 nM of each primer. The specificity of the PCR amplification was checked with the heat dissociation protocol after the final cycle of PCR. The amount of CIT2 mRNA was normalized with ACT1 mRNA and calculated in relative units (2−ΔCt), where ΔCt is the Ctsample−Ctreference gene and Ct is the threshold cycle [19].

2.5. Oxygen Consumption Measurements

Respiration was measured in intact cells at 30 °C using an Oxygraph-2 k system (Oroboros, Innsbruck, Austria) equipped with two chambers, and the data were analyzed using DatLab software as described in [20]. Briefly, yeast cells were harvested after 24 h of growth in YPD in the presence or in the absence of NaCl, centrifuged at 3000× g for 5 min at 4 °C and resuspended in the same medium to a final optical density of 5 OD600 units/mL. Fifty microliters of this suspension, corresponding to about 5 × 10⁶ cells/mL, was added to each chamber containing 2 mL of YPD. The chambers were then closed and respiration recorded.

2.6. Statistical Analysis

All the experiments were repeated at least three times, and the results are reported as means with standard deviation. For the determination of significant differences between samples, all results were analyzed using Student’s t-test run on EXCEL software, with significant differences indicated at p values ** ≤ 0.01 and * 0.05.

3. Results

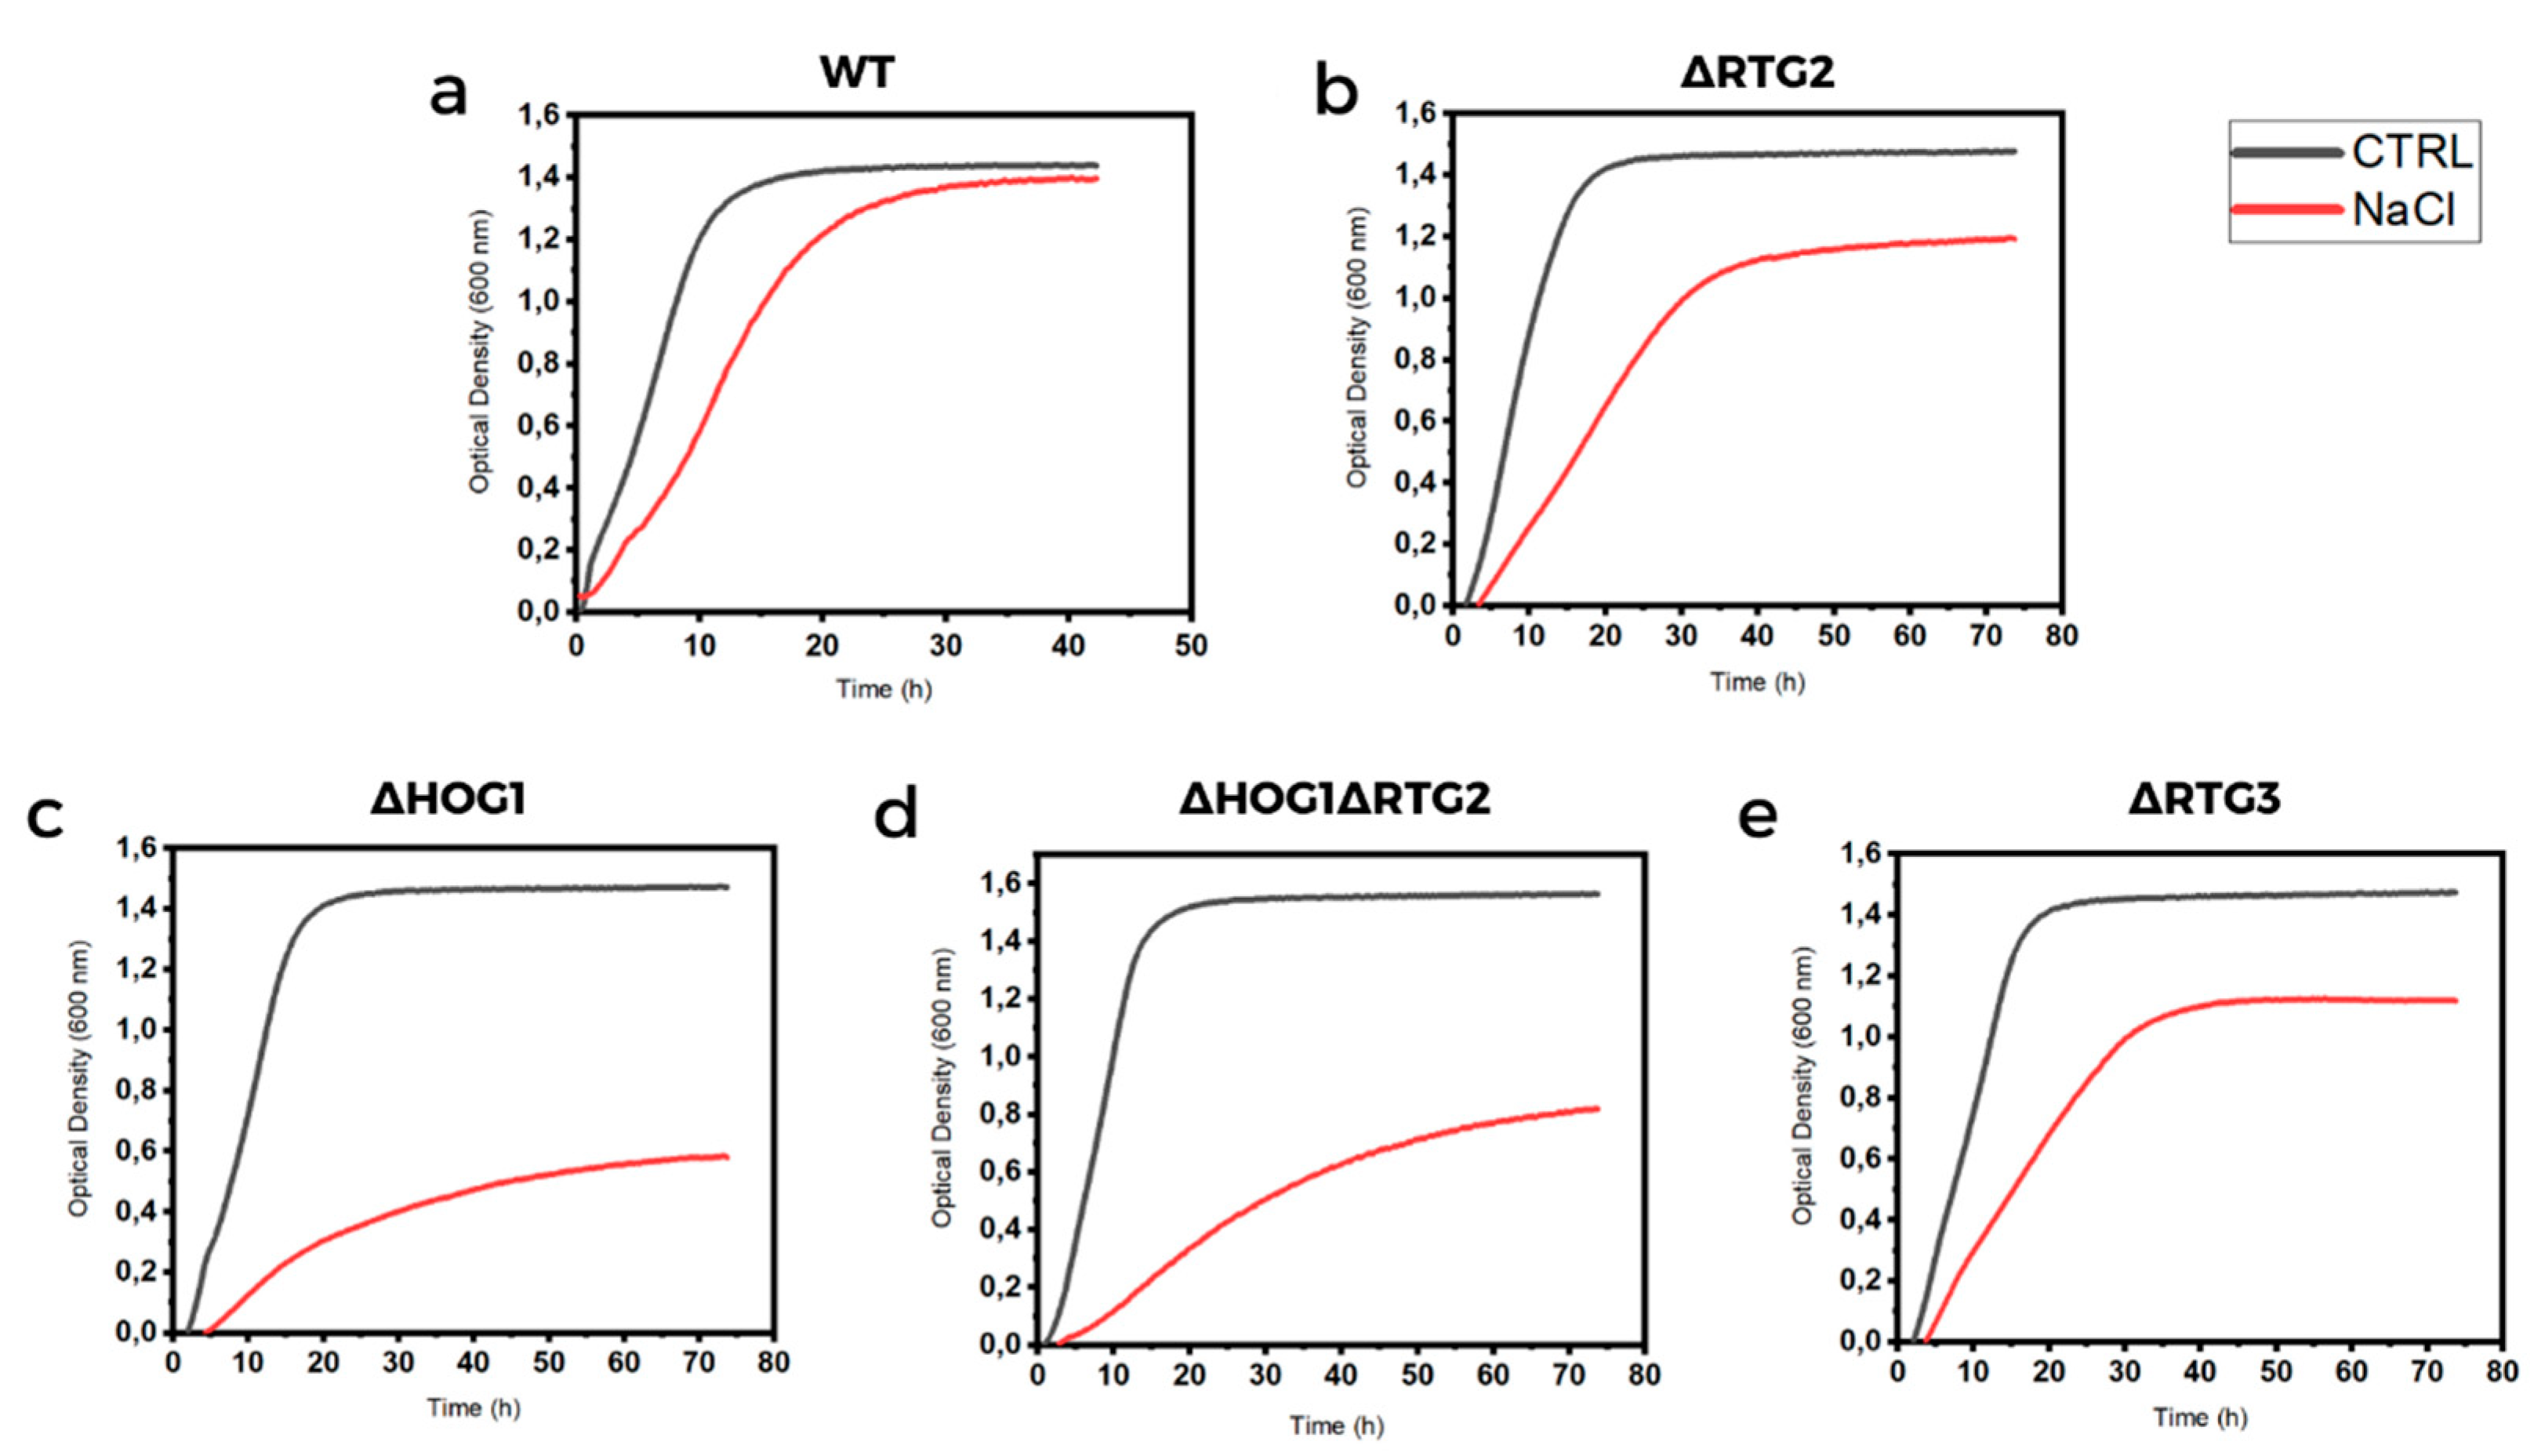
3.1. Cell Sensitivity to Osmotic Stress Due to NaCl Treatment

In a first series of experiments, we analyzed cell sensitivity to osmotic stress by testing the effect of increasing concentrations of NaCl (0.4–1.2 M) on cell growth either in solid rich medium or in continuously growing batch cultures. As reported in Figure 1A, wild-type cells grown in the presence of 0.4 M NaCl did not show significant differences compared to control untreated cells. A relative growth of about 90% was measured by comparing optical density of control and treated cells (0.4 M NaCl) at 24, 48 and 72 h (Figure 1B). As expected, cell sensitivity to osmotic stress increased at higher NaCl concentrations. While 1.2 M was highly toxic in both solid and liquid medium (relative growth of about 30%), exposure to 0.8 M showed an intermediate phenotype on solid medium and a relative growth of about 60% (Figure 1). These data show that cell growth inhibition in the presence of NaCl is dose dependent either on solid or in liquid medium. The concentration of 0.8 M NaCl was selected for the next experiments.

3.2. Impairment of RTG Signaling Sensitizes Cells to High Osmostress in an HOG1-Dependent Manner

In order to gain insight into the role of RTG signaling and its interaction with the HOG1 MAPK pathway under osmostress, we analyzed the effect of RTG2 and/or HOG1 deletion on cell growth in the absence and in the presence of 0.8 M NaCl. While no growth differences could be observed across all untreated cells, an evident growth impairment compared to wild-type cells in the absence of the main sensor of the mitochondrial retrograde pathway was revealed under stress (Figure 2). Notably, smaller colonies could be observed in ∆RTG2 cells grown in the presence of NaCl. As expected, the lack of HOG1 completely abolished growth in a NaCl medium. The double mutant, lacking both HOG1 and RTG2, was unable to grow in the presence of NaCl similarly to the single HOG1 mutant.
To further examine cell growth and the physiological features of the osmostress response, we performed batch culture growth assays of wild-type and mutant cells in the presence and in the absence of NaCl. In fact, growth curve assays in liquid cultures are highly sensitive and able to uncover the subtle phenotypes as compared with cell dilution spot tests on solid media. Cell growth was monitored up to 50 h, and curves from untreated cells were compared to curves from treated cells together with the estimation of kinetic growth parameters (Figure 3 and Table 1). In all cases, growth inhibition due to NaCl treatment could be observed. Specific growth rate was reduced by about 50%, and doubling time increased from 2.0 to 3.9 h in wild-type cells under stress (Figure 3a and Table 1). Deletion of RTG2 exacerbated this phenotype by showing a doubling time of 5.9 h in a NaCl medium with an increase of 1.5-fold compared to wild-type cells. A significant decrease in exponential growth rate was also measured in RTG2-lacking mutants compared to wild-type cells—0.17 and 0.12 h−1, respectively, under NaCl treatment (Figure 3b and Table 1). According to the literature, the highest doubling time was measured for ∆HOG1 cells in NaCl (10.3 h) with the lowest exponential growth rate, 0.08 h−1 (Figure 3c and Table 1). Notably, a slight growth improvement compared to ∆HOG1 was observed in ∆HOG1∆RTG2, which showed a doubling time of 7.2 h with an exponential growth rate of 0.12 h−1 (Figure 3d and Table 1). All untreated wild-type and mutant cells show comparable growth features (Figure 3 and Table 1). Growth efficiency calculated in all samples as the percentage of the maximal cell density reached under stress conditions (with NaCl) compared to the control (without NaCl) mirrored these results, highlighting significant differences among the mutants compared to wild-type cells (Table 1).
Overall, these data demonstrate the involvement of RTG2 in osmoadaptation, confirm that HOG1 is essential for cell survival in the presence of high salt stress and support the interaction between HOG1 and RTG signaling under hyperosmotic conditions.
To further characterize the involvement of RTG2 in osmoadaptation, we performed growth assays by using batch cultures in shaking flasks and analyzed cell proliferation at different times in wild-type and mutant cells. Relative cell growth was measured at 8, 24, 48 and 72 h corresponding to different growth phases referred to as the exponential phase, the diauxic shift and the stationary phase, respectively. As reported in Figure 4, relative growth in the presence of NaCl was similar in wild-type and ∆RTG2 exponential phase cells (about 20%) but significantly different with respect to ∆HOG1 and ∆HOG1∆RTG2 (about 8%) after 8 h. However, a highly significant difference could be observed comparing wild-type and ∆RTG2 relative growth at 24 h, about 60% versus 40%. In the same samples, less significant differences in relative growth could be observed at 48 and 72 h. Relative growth was below 10% in ∆HOG1 and ∆HOG1∆RTG2 at all times analyzed. These results indicate that RTG2 is especially required for osmoadaptation after 24 h of growth (corresponding to 4–5 generations)—that is, when glucose becomes limiting and cells are characterized by a decreased growth rate and a metabolic switch towards respiration.
To verify whether RTG2 acts through RTG signaling in osmoadaptation, we analyzed cell growth of ∆RTG3 cells in solid and liquid rich medium with or without NaCl. As reported in Figure 2, growth impairment could be observed in ∆RTG3 cells with respect to the wild type and with similar features of ∆RTG2. Growth curves obtained for ∆RTG3 indicate a 1.4-fold increase in NaCl doubling time (5, 4 h) with respect to wild-type cells, with a specific growth rate and growth efficiency of 0.12 h−1 and 80%, respectively, similar to the results for ∆RTG2 (Figure 3 and Table 1). As for ∆RTG2, a significant difference in relative growth compared to the wild type was observed after 24 h in shaking batch cultures (Figure 4).
These data indicate that RTG2 contributes to HOG1-dependent osmoadaptation via RTG signaling and confirm previous results on the interplay between RTG3 and HOG1 under stress [8].

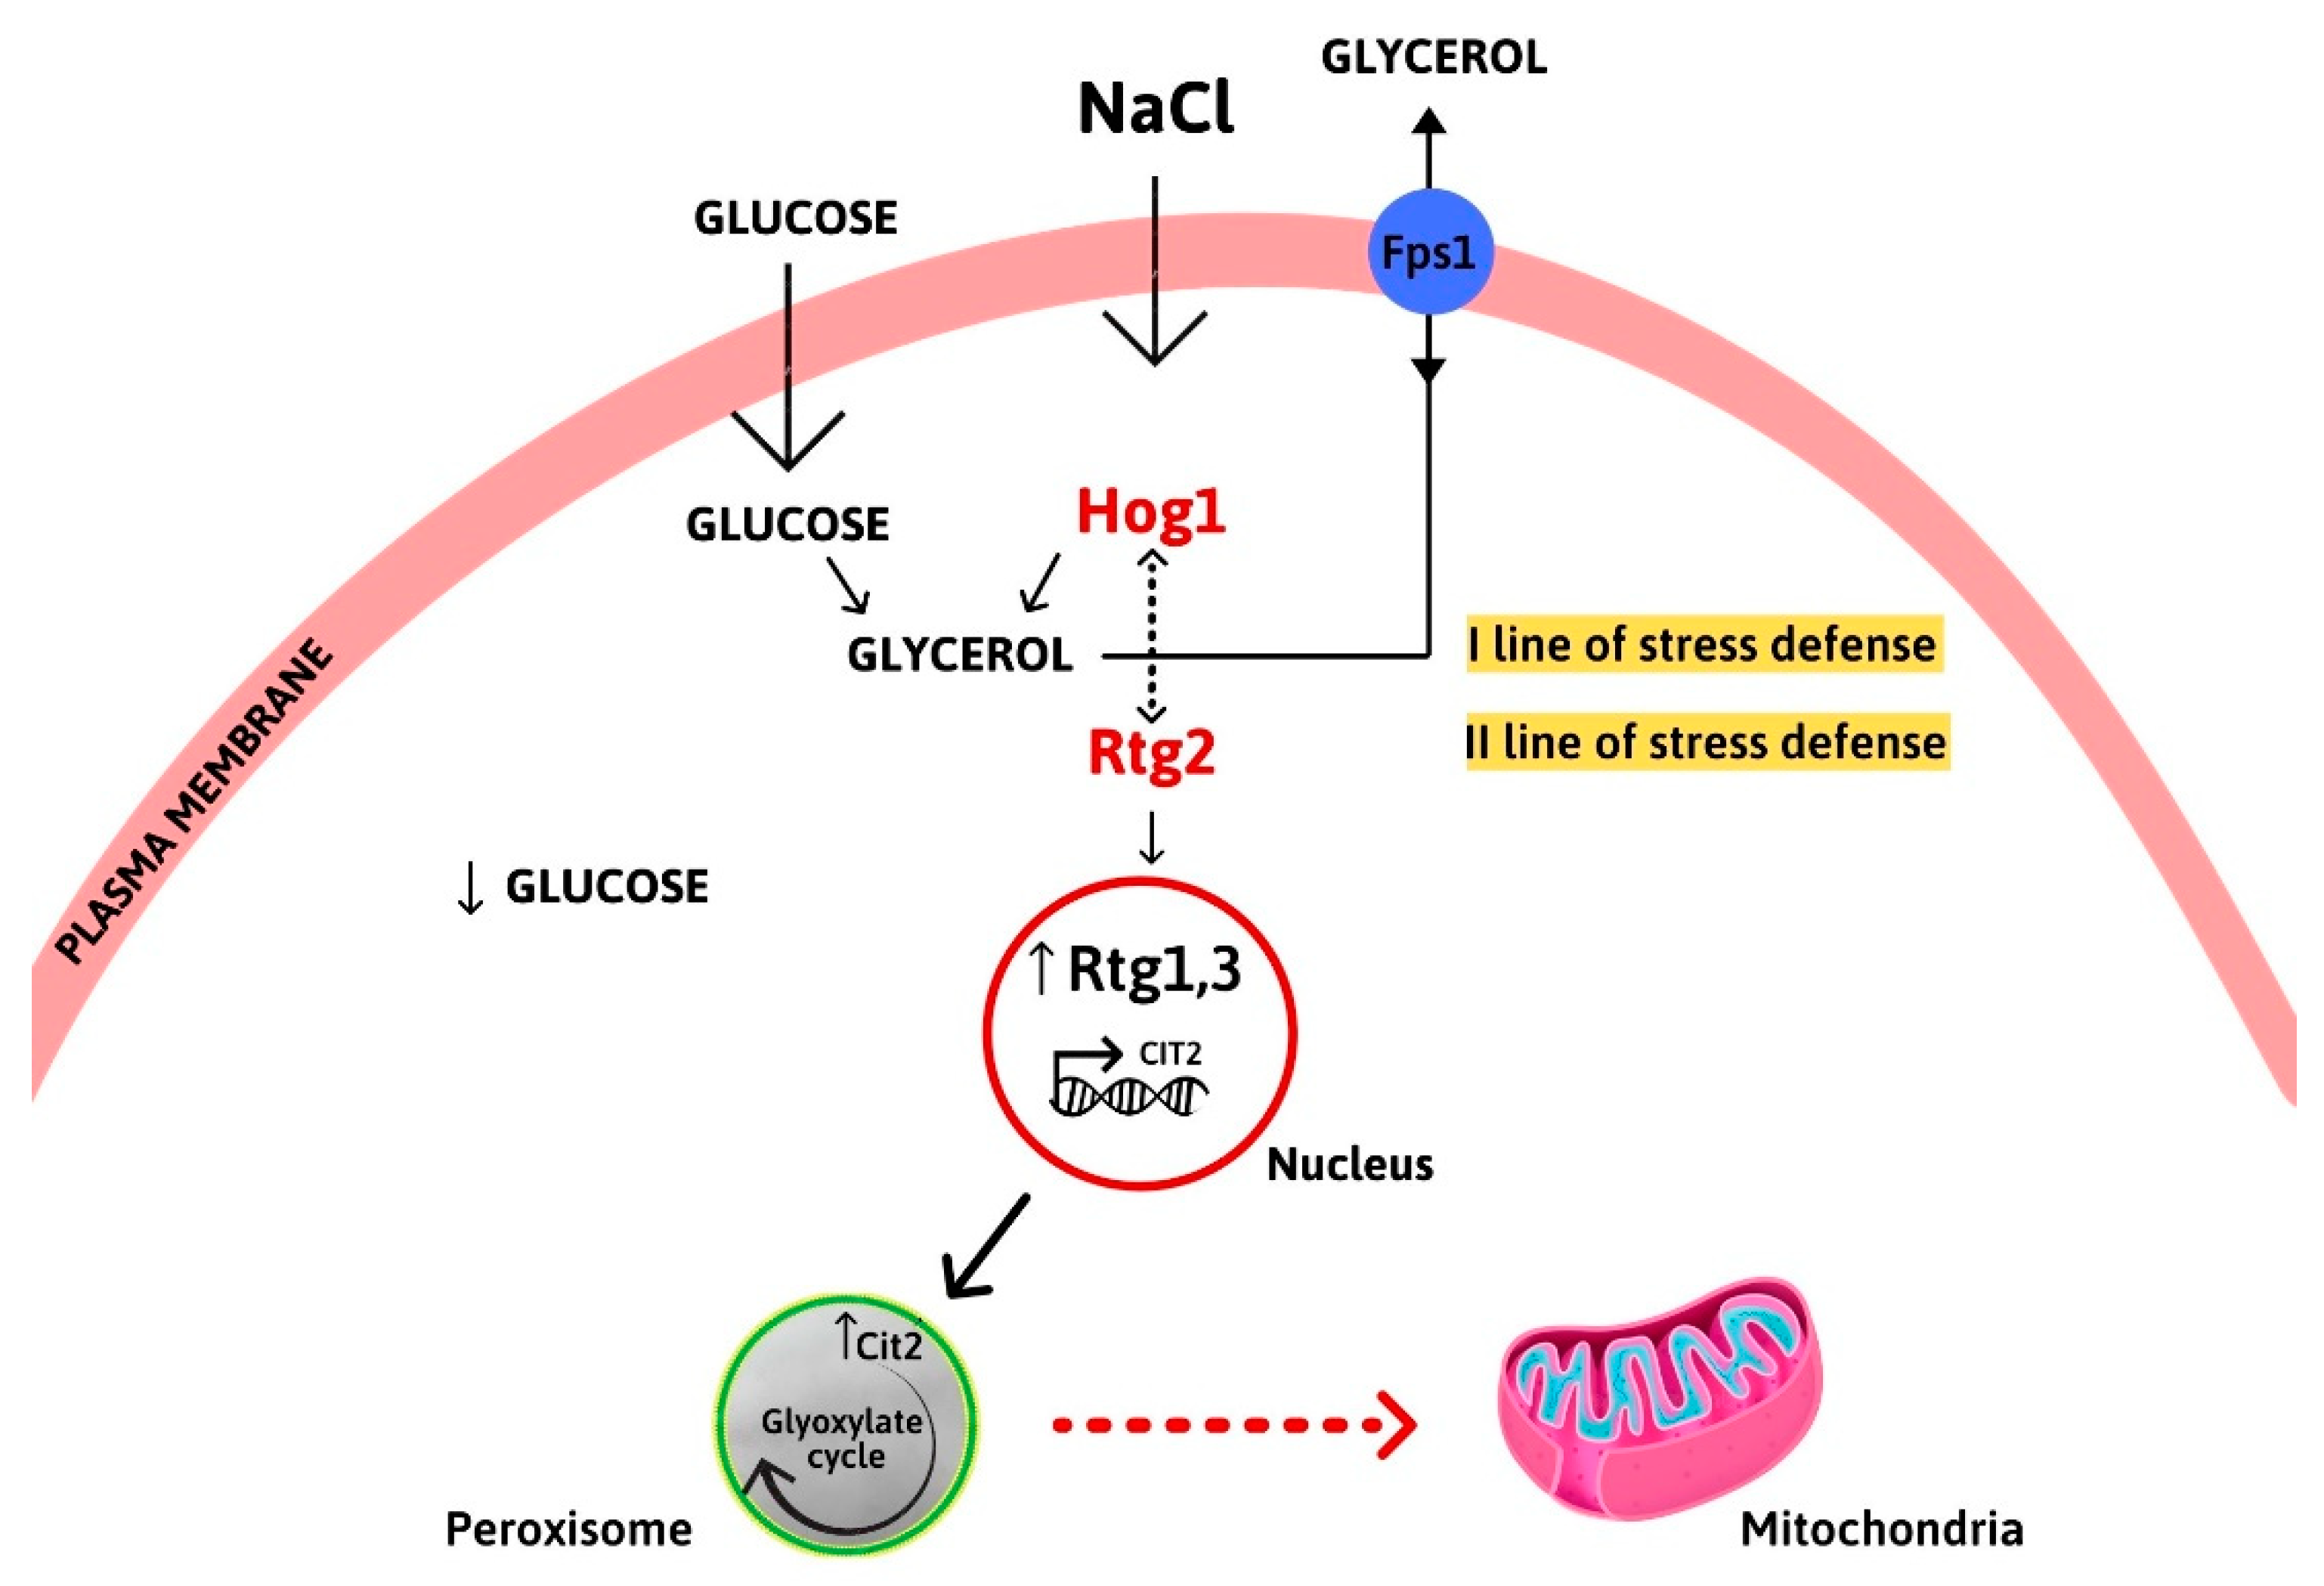
3.3. RTG Signaling Is Activated in Osmoadaptation

Since CIT2 up-regulation is considered a hallmark of RTG-dependent retrograde signaling activation [1,3], and having observed growth impairment of RTG mutants, especially in a late growth phase, its expression was evaluated after 5 h of growth (judged as a time of long-term transcriptional response [18]) in the presence and in the absence of NaCl stress. As shown in Figure 5, NaCl treatment causes a significant increase in CIT2 mRNA expression level (about 7-fold), which is considerably reduced in the absence of RTG2, where a reduction of about 8-fold is observed (Figure 5). As expected, CIT2 was down-regulated in RTG2-lacking cells compared to the wild type under both control and stress conditions, showing that RTG-dependent mitochondrial retrograde signaling is activated as a result of long-term adaptation to osmostress.

3.4. RTG Mutants Show Decreased Respiratory Capacity under Osmostress

Having observed a major involvement of the RTG pathway in a late phase of stress response in cell growth features and in signaling activation, we hypothesized its major requirement during the transition from fermentation to respiration, known to be characterized by structural and functional reorganizations in mitochondrial metabolism [21]. To address this point, mitochondrial respiratory capacity was evaluated in whole cells in the presence and in the absence of NaCl after 24 h of growth. Wild-type cells showed a similar oxygen consumption rate with or without NaCl (Figure 6). In both untreated RTG mutants, respiratory capacity was slightly improved compared to wild-type cells but was significantly reduced in the presence of NaCl, showing a decrease of about 2.5-fold in both untreated mutants and wild-type treated cells (Figure 6).
These data demonstrate that osmoadaptation at the level of mitochondrial function is successfully completed within 24 h of growth, but impairment of RTG signaling negatively affects respiratory capacity in growing cells upon high osmostress.

4. Discussion

This work highlights the relevance of the interplay between signaling and metabolism in cellular stress response. We demonstrated that RTG-dependent retrograde signaling sustains mitochondrial function in a late phase of yeast osmoadaptation still dependently on HOG1, the major regulator of HOG signaling. The role of RTG signaling and its interaction with HOG1 were investigated in wild-type and mutant cells on solid and liquid mediums, i.e., batch cultures, under high osmotic stress conditions induced by NaCl treatment.
We show that the lack of either RTG2, the main sensor of RTG signaling, or the transcriptional factor RTG3 interferes with successful osmoadaptation in a manner dependent on HOG1 (Figure 1 and Figure 2). These data demonstrate that RTG signaling contributes to osmostress resistance and confirm that HOG1 plays a role upstream of RTG2 in the stress signaling cascade, further supporting the interaction between these two pathways under cellular stress [5,8]. This is in agreement with previous work indicating that RTG signaling plays a protective role in stress resistance [7].
Growth measurements of batch cultures in the presence or absence of osmostress gave us the opportunity to compare the real-time growth and physiological features of wild-type and mutant cells [12].
The growth differences among wild-type and mutant cells confirmed the HOG1-dependence of osmoadaptation even in the absence of RTG2 (Figure 3 and Figure 4 and Table 1). The concomitant abolition of HOG1 and RTG2 results in a slight improvement in cell growth in the presence of NaCl, which seems to be evidence of the occurrence of a masking interaction within the sub-class of asymmetric and positive genetic interactions occurring between HOG1 and RTG2, as reported in [22]. Our results also show that RTG signaling could maintain mitochondrial functionality only in response to stress and not during normal growth. However, we showed that RTG pathway activation together with the de-repression of respiratory capacity induces acetic-acid stress resistance [4]. Thus, we cannot exclude the involvement of other osmostress regulators whose activity might be negatively affected by the HOG-RTG signaling axis.
Data deriving from the determination of relative growth in the presence of salt stress highlighted that RTG signaling is especially required in a late phase of stress response, between 16 and 24 h of growth—that is, after 4–5 generations—presumably corresponding to a decrease in glucose concentration accompanied by a metabolic transition towards respiration (Figure 4). In this context, it is plausible that RTG signaling supports the reprogramming of carbon metabolism under osmostress, as observed in [23]. Accordingly, RTG signaling activation was found as expected by CIT2 up-regulation in WT-stressed cells compared to no stress conditions (Figure 5). On the other hand, the very low level of CIT2 in the stressed ∆RTG2 mutant confirms RTG signaling as the major regulator of its expression also under conditions of osmostress. In this regard, considering the fact that Cit2 functions in the glyoxylate cycle, the relevance of peroxisomes in the adaptation of yeast cells to an osmotic environment is reinforced [18]. The low but significant increase in CIT2 expression under stress in RTG2-lacking cells can be explained by additional regulatory mechanisms, including the up-regulation of this gene by Msn2/Msn4 under glucose-limiting conditions to support peroxisomal function [9,24] or through interaction with the carbon catabolite repression pathway [25].
Our data also show that mitochondrial function is required for successful osmoadaptation, as determined by the comparable respiratory activity in the presence and in the absence of stress conditions (Figure 6). This, together with decreased basal respiration in RTG mutants exclusively under stress, provides direct evidence that RTG signaling sustains mitochondrial respiratory function in a high osmotic environment (Figure 6). Thus, both RTG signaling activation and the maintenance of mitochondrial function are confirmed as powerful adaptive strategies under conditions of stress [26,27].
These results provide the first evidence that RTG signaling contributes to ensuring mitochondrial function as part of a HOG1-mediated osmoadaptive response, as has previously been suggested [8]. Interestingly, impairment of RTG signaling improves mitochondrial respiration in the absence of stress conditions, suggesting an interaction between this pathway and other regulators of mitochondrial activity, as already observed in [2].
Mitochondria are important determinants in osmoadaptation, and, here, we show the contribution of RTG signaling to the significant functional changes occurring at a mitochondrial level as a response to glucose depletion [11,21,28].
The temporal and dynamic interactions between HOG1 and the RTG pathway under hyperosmotic conditions are a matter of speculation. HOG1 is known to be required in the well understood first line of cellular defense against stress (the rapid-and-transient mode). In this phase, glucose is diverted from glycolysis to glycerol biosynthesis in order to rapidly support the cellular stress response program [10,29].
RTG signaling might be involved in a later stage of adaptation related to metabolic adjustment for respiration (Figure 7). This is in agreement with the separateness (but note the interdependence) of the time scales between rapid signaling events and the relatively slower downstream adaptive processes in response to hyperosmolarity, which also affects long-term memory in response to periodic stress conditions [30].
The down-regulation of the peroxisomal isoform of citrate synthase and the impaired mitochondrial respiration observed in the RTG mutants suggest the importance of inter-organellar crosstalk for maintenance of cellular homeostasis under changing environmental conditions. In particular, the metabolic communication between peroxisomes and mitochondria in long-term adaptation to salt stress appears to be confirmed [9,18]. In this respect, RTG signaling could provide citrate via the glyoxylate cycle to sustain mitochondrial function under stress conditions.
Overall, our results indicate the sequential cooperation between the two stress signaling pathways HOG and RTG to accomplish cellular adaptation and the central role of RTG signaling in maintaining mitochondrial function under stress conditions. Further research to identify the mechanisms involved in the activation of the RTG pathway in osmotic and other stress responses will help to elucidate the temporal cascade in the stress signaling network and its connections with metabolic clues.

Author Contributions

Conceptualization, N.G.; methodology, N.G., G.A., P.S., C.S., I.P. and A.B.; formal analysis, N.G., G.A., P.S., C.S., I.P. and A.B.; investigation, N.G., G.A., P.S. and C.S.; resources, N.G., A.B., L.P. and S.G.; data curation, N.G., G.A., P.S., C.S., I.P. and A.B.; writing—original draft preparation, N.G.; writing—review and editing, N.G., G.A., P.S., I.P., A.B., C.M., L.P. and S.G.; supervision, N.G.; project administration, N.G., A.B. and S.G.; funding acquisition, N.G., C.M. and S.G. All authors have read and agreed to the published version of the manuscript.

Funding

This research was funded by POR Puglia FESR-FSE 2014-2020 INNONETWORK–“Miglioramento nei processi produttivi di alimenti freschi prodotti da farine mediante approcci basati su tecnologie omiche ed informazioni complesse, elaborate da un sistema informativo progettato e sviluppato in ambiente Cloud–OMICS4FOOD and Ateneo 2020 Sapienza “Uso di sistemi modello microbici per lo studio dell’effetto dello stress sull’invecchiamento e sulle malattie ad esso correlate”.

Data Availability Statement

Raw data from this study are available on reasonable request from the corresponding author.

Acknowledgments

We thank Maria Rosa Mirizzi and Laura Marra for valuable administrative and technical support.

Conflicts of Interest

The authors declare no conflict of interest.

References

  1. Liu, Z.; Butow, R.A. Mitochondrial retrograde signaling. Annu. Rev. Genet. 2006, 40, 159–185. [Google Scholar] [CrossRef] [PubMed]
  2. Liu, Z.; Butow, R.A. A transcriptional switch in the expression of yeast tricarboxylic acid cycle genes in response to a reduction or loss of respiratory function. Mol. Cell Biol. 1999, 19, 6720–6728. [Google Scholar] [CrossRef] [PubMed] [Green Version]
  3. Guaragnella, N.; Ždralević, M.; Palková, Z.; Giannattasio, S. Analysis of mitochondrial retrograde signaling in yeast model systems. Methods Mol. Biol. 2021, 2276, 87–102. [Google Scholar] [CrossRef]
  4. Guaragnella, N.; Ždralević, M.; Lattanzio, P.; Marzulli, D.; Pracheil, T.; Liu, Z.; Passarella, S.; Marra, E.; Giannattasio, S. Yeast growth in raffinose results in resistance to acetic-acid induced programmed cell death mostly due to the activation of the mitochondrial retrograde pathway. Biochim. Biophys. Acta 2013, 1833, 2765–2774. [Google Scholar] [CrossRef] [Green Version]
  5. Guaragnella, N.; Stirpe, M.; Marzulli, D.; Mazzoni, C.; Giannattasio, S. Acid stress triggers resistance to acetic acid-induced regulated cell death through Hog1 activation which requires RTG2 in yeast. Oxid. Med. Cell Longev. 2019, 2019, 4651062. [Google Scholar] [CrossRef] [Green Version]
  6. Hijazi, I.; Knupp, J.; Chang, A. Retrograde signaling mediates an adaptive survival response to endoplasmic reticulum stress in Saccharomyces cerevisiae. J. Cell Sci. 2020, 133, jcs241539. [Google Scholar] [CrossRef]
  7. Torelli, N.Q.; Ferreira-Júnior, J.R.; Kowaltowski, A.J.; da Cunha, F.M. RTG1- and RTG2-dependent retrograde signaling controls mitochondrial activity and stress resistance in Saccharomyces cerevisiae. Free Radic Biol. Med. 2015, 81, 30–37. [Google Scholar] [CrossRef]
  8. Ruiz-Roig, C.; Noriega, N.; Duch, A.; Posas, F.; de Nadal, E. The Hog1 SAPK controls the Rtg1/Rtg3 transcriptional complex activity by multiple regulatory mechanisms. Mol. Biol. Cell 2012, 23, 4286–4296. [Google Scholar] [CrossRef]
  9. Guaragnella, N.; Coyne, L.P.; Chen, X.J.; Giannattasio, S. Mitochondria-cytosol-nucleus crosstalk: Learning from Saccharomyces cerevisiae. FEMS Yeast Res. 2018, 18. [Google Scholar] [CrossRef]
  10. Saito, H.; Posas, F. Response to hyperosmotic stress. Genetics 2012, 192, 289–318. [Google Scholar] [CrossRef] [PubMed] [Green Version]
  11. Pastor, M.M.; Proft, M.; Pascual-Ahuir, A. Mitochondrial function is an inducible determinant of osmotic stress adaptation in yeast. J. Biol. Chem. 2009, 284, 30307–30317. [Google Scholar] [CrossRef] [PubMed] [Green Version]
  12. Hohmann, S. Osmotic stress signaling and osmoadaptation in yeasts. Microbiol. Mol. Biol. Rev. 2002, 66, 300–372. [Google Scholar] [CrossRef] [PubMed] [Green Version]
  13. Parmar, J.H.; Bhartiya, S.; Venkatesh, K.V. Characterization of the adaptive response and growth upon hyperosmotic shock in Saccharomyces cerevisiae. Mol. Biosyst. 2011, 7, 1138–1148. [Google Scholar] [CrossRef] [PubMed]
  14. Brewster, J.L.; Gustin, M.C. Hog1: 20 years of discovery and impact. Sci. Signal. 2014, 7, re7. [Google Scholar] [CrossRef] [PubMed]
  15. Klipp, E.; Nordlander, B.; Krüger, R.; Gennemark, P.; Hohmann, S. Integrative model of the response of yeast to osmotic shock. Nat. Biotechnol. 2005, 23, 975–982. [Google Scholar] [CrossRef]
  16. Lee, B.; Jeong, S.-G.; Jin, S.H.; Mishra, R.; Peter, M.; Lee, C.-S.; Lee, S.S. Quantitative analysis of yeast MAPK signaling networks and crosstalk using a microfluidic device. Lab Chip 2020, 20, 2646–2655. [Google Scholar] [CrossRef]
  17. Toussaint, M.; Conconi, A. High-throughput and sensitive assay to measure yeast cell growth: A bench protocol for testing genotoxic agents. Nat. Protoc. 2006, 1, 1922–1928. [Google Scholar] [CrossRef]
  18. Manzanares-Estreder, S.; Espí-Bardisa, J.; Alarcón, B.; Pascual-Ahuir, A.; Proft, M. Multilayered control of peroxisomal activity upon salt stress in Saccharomyces cerevisiae. Mol. Microbiol. 2017, 104, 851–868. [Google Scholar] [CrossRef] [PubMed] [Green Version]
  19. Scarcia, P.; Agrimi, G.; Germinario, L.; Ibrahim, A.; Rottensteiner, H.; Palmieri, F.; Palmieri, L. In Saccharomyces cerevisiae grown in synthetic minimal medium supplemented with non-fermentable carbon sources glutamate is synthesized within mitochondria. Rend. Fis. Acc. Lincei 2018, 29, 483–490. [Google Scholar] [CrossRef]
  20. Di Noia, M.A.; Todisco, S.; Cirigliano, A.; Rinaldi, T.; Agrimi, G.; Iacobazzi, V.; Palmieri, F. The human SLC25A33 and SLC25A36 genes of solute carrier family 25 encode two mitochondrial pyrimidine nucleotide transporters. J. Biol. Chem. 2014, 289, 33137–33148. [Google Scholar] [CrossRef] [Green Version]
  21. Di Bartolomeo, F.; Malina, C.; Campbell, K.; Mormino, M.; Fuchs, J.; Vorontsov, E.; Gustafsson, C.M.; Nielsen, J. Absolute yeast mitochondrial proteome quantification reveals trade-off between biosynthesis and energy generation during diauxic shift. Proc. Natl. Acad. Sci. USA 2020, 117, 7524–7535. [Google Scholar] [CrossRef] [PubMed] [Green Version]
  22. Costanzo, M.; Kuzmin, E.; van Leeuwen, J.; Mair, B.; Moffat, J.; Boone, C.; Andrews, B. Global genetic networks and the genotype-to-phenotype relationship. Cell 2019, 177, 85–100. [Google Scholar] [CrossRef] [Green Version]
  23. DeRisi, J.L.; Iyer, V.R.; Brown, P.O. Exploring the metabolic and genetic control of gene expression on a genomic scale. Science 1997, 278, 680–686. [Google Scholar] [CrossRef] [Green Version]
  24. Rajvanshi, P.K.; Arya, M.; Rajasekharan, R. The stress-regulatory transcription factors Msn2 and Msn4 regulate fatty acid oxidation in budding yeast. J. Biol. Chem. 2017, 292, 18628–18643. [Google Scholar] [CrossRef] [PubMed] [Green Version]
  25. Laera, L.; Guaragnella, N.; Ždralević, M.; Marzulli, D.; Liu, Z.; Giannattasio, S. The transcription factors ADR1 or CAT8 are required for RTG pathway activation and evasion from yeast acetic acid-induced programmed cell death in raffinose. Microb. Cell 2016, 3, 621–631. [Google Scholar] [CrossRef] [PubMed] [Green Version]
  26. Trendeleva, T.A.; Zvyagilskaya, R.A. Retrograde signaling as a mechanism of yeast adaptation to unfavorable factors. Biochemistry 2018, 83, 98–106. [Google Scholar] [CrossRef] [PubMed]
  27. Knupp, J.; Arvan, P.; Chang, A. Increased mitochondrial respiration promotes survival from endoplasmic reticulum stress. Cell Death Differ. 2019, 26, 487–501. [Google Scholar] [CrossRef] [Green Version]
  28. Martínez-Pastor, M.; Proft, M.; Pascual-Ahuir, A. Adaptive changes of the yeast mitochondrial proteome in response to salt stress. Omics 2010, 14, 541–552. [Google Scholar] [CrossRef]
  29. Petelenz-Kurdziel, E.; Kuehn, C.; Nordlander, B.; Klein, D.; Hong, K.-K.; Jacobson, T.; Dahl, P.; Schaber, J.; Nielsen, J.; Hohmann, S.; et al. Quantitative analysis of glycerol accumulation, glycolysis and growth under hyper osmotic stress. PLoS Comput. Biol. 2013, 9, e1003084. [Google Scholar] [CrossRef]
  30. You, T.; Ingram, P.; Jacobsen, M.D.; Cook, E.; McDonagh, A.; Thorne, T.; Lenardon, M.D.; de Moura, A.P.S.; Romano, M.C.; Thiel, M.; et al. A systems biology analysis of long and short-term memories of osmotic stress adaptation in fungi. BMC Res. Notes 2012, 5, 258. [Google Scholar] [CrossRef] [Green Version]
Figure 1. Sensitivity of wild-type cells to sodium chloride. Wild-type cells (WT), grown overnight in YPD medium, were: (A) diluted to 1 OD600, and ten-fold serial dilutions were spotted on YPD plates with or without sodium chloride (NaCl) at the indicated concentrations, with growth being scored after 2–5 days; (B) diluted to 0.1 OD600 in fresh liquid YPD with or without NaCl at the indicated concentrations, and optical density (OD600) was measured at the indicated times. Relative growth was calculated as the percentage of the OD600 of stressed/control cells.
Microorganisms 09 01894 g001
Figure 2. Sensitivity of wild type and mutant cells to sodium chloride. Wild-type (WT) and mutant cells, lacking RTG2 (∆RTG2), RTG3 (∆RTG3) and/or HOG1 (∆HOG1; ∆HOG1∆RTG2), were grown overnight in YPD medium and diluted to 1 OD600, and ten-fold serial dilutions were spotted on YPD plates without (CTRL) or with 0.8 M sodium chloride (NaCl). Growth was scored after 2–5 days.
Microorganisms 09 01894 g002
Figure 3. Micro-culture growth curves of wild-type and mutant cells. (a) Wild-type (WT) and (be) indicated mutant cells (∆RTG2, ∆HOG1, ∆HOG1∆RTG2 and ∆RTG3) grown overnight in YPD medium were diluted to 0.01 OD600 in fresh liquid YPD with or without 0.8 M sodium chloride (NaCl), and optical density was measured at 600 nm (OD600) over time with a high-precision TECAN microplate reader. Each experiment was performed in triplicate, and representative micro-culture growth curves from three independent experiments are reported.
Microorganisms 09 01894 g003
Figure 4. Relative growth of wild-type and mutant cells in batch cultures in the presence of sodium chloride. Wild-type (WT) and mutant cells (∆RTG2, ∆HOG1, ∆HOG1∆RTG2 and ∆RTG3), grown overnight in YPD medium, were diluted to 0.1 OD600 in fresh liquid YPD with or without 0.8 M sodium chloride (NaCl), and optical density (OD600) was measured at 600 nm at the indicated times. Relative growth was calculated as the percentage of the OD600 of stressed/control cells. Unpaired Student’s t-test: statistical significance differences with ** p < 0.01 and * p < 0.05 when comparing wild type with RTG mutants from six independent experiments at 24 h.
Microorganisms 09 01894 g004
Figure 5. CIT2 expression under high osmotic environment. Wild-type (WT) and ∆RTG2 cells, grown overnight in YPD medium, were diluted to 0.1 OD600 in fresh liquid YPD with or without 0.8 M sodium chloride (NaCl). After 5 h, cells were collected for RNA extraction, and mRNA levels were measured by quantitative PCR. The amount of CIT2 mRNA was normalized with ACT1 mRNA and calculated in relative units (2−ΔCt), where ΔCt is the Ctsample−Ctreference gene and Ct is the threshold cycle. Unpaired Student’s t-test: a statistically significantly difference with ** p < 0.01 when comparing wild-type untreated cells versus NaCl-stressed cells from three independent experiments.
Microorganisms 09 01894 g005
Figure 6. Mitochondrial basal respiration of wild-type and RTG mutants. Wild-type (WT), ∆RTG2 and ∆RTG3 cells, grown overnight in YPD medium, were diluted to 0.1 OD600 in fresh liquid YPD with or without 0.8 M sodium chloride (NaCl). After 24 h, cells were collected and resuspended in the same medium to a final optical density of 5 OD600 units/mL. Oxygen consumption was measured with an Oxygraph-2 k system, and experimental data were analyzed using DatLab software. Unpaired Student’s t-test: a statistically significantly difference with * p < 0.05 when comparing ∆RTG2 and ∆RTG3 control versus NaCl, respectively, or wild-type NaCl versus ∆RTG2 NaCl, and ** p < 0.01 when comparing wild-type NaCl versus ∆RTG3 NaCl from three independent experiments.
Microorganisms 09 01894 g006
Figure 7. Interplay between HOG1 and the RTG pathway in osmoadaptation. Hog1 is activated by osmostress to promote glycerol biosynthesis as a rapid and transient cellular stress response. Intracellular glycerol accumulation is controlled by its own synthesis and by the aquaglyceroporin Fps1p. RTG signaling is activated in a later phase, as determined by CIT2 up-regulation, to sustain mitochondrial function and metabolic homeostasis for cellular adaptation.
Microorganisms 09 01894 g007
Table 1. Growth parameters of reported yeast strains in the absence and in the presence of sodium chloride.
Yeast StrainsSpecific Growth Rate (µmax h−1)Doubling Time (h)Growth Efficiency (%)
WT0.38 ± 0.022.0 ± 0.32-
WT + NaCl0.17 ± 0.013.9 ± 0.7187 ± 2
RTG20.39 ± 0.032.2 ± 0.07-
RTG2 + NaCl0.12 ± 0.015.9 ± 0.1280 ± 4
HOG10.32 ± 0.012.1 ± 0.4-
HOG1 + NaCl0.08 ± 0.0210.3 ± 0.244 ± 9
HOG1RTG20.29 ± 0.092.5 ± 0.78-
HOG1RTG2 + NaCl0.12 ± 0.017.2 ± 0.256 ± 12
RTG30.37 ± 0.042.5 ± 0.14-
RTG3 + NaCl0.12 ± 0.015.4 ± 0.71 80 ± 2
Growth rate, doubling time and growth efficiency of wild-type (WT) and mutant cells (∆RTG2, ∆HOG1, ∆HOG1∆RTG2 and ∆RTG3) grown in the absence and in the presence of sodium chloride (NaCl) are the mean ± standard deviation of three independent experiments, each performed in triplicate.
Publisher’s Note: MDPI stays neutral with regard to jurisdictional claims in published maps and institutional affiliations.

