
Descriptive Histopathological and Ultrastructural Study of Hepatocellular Alterations Induced by Aflatoxin B1 in Rats

 , and
, and 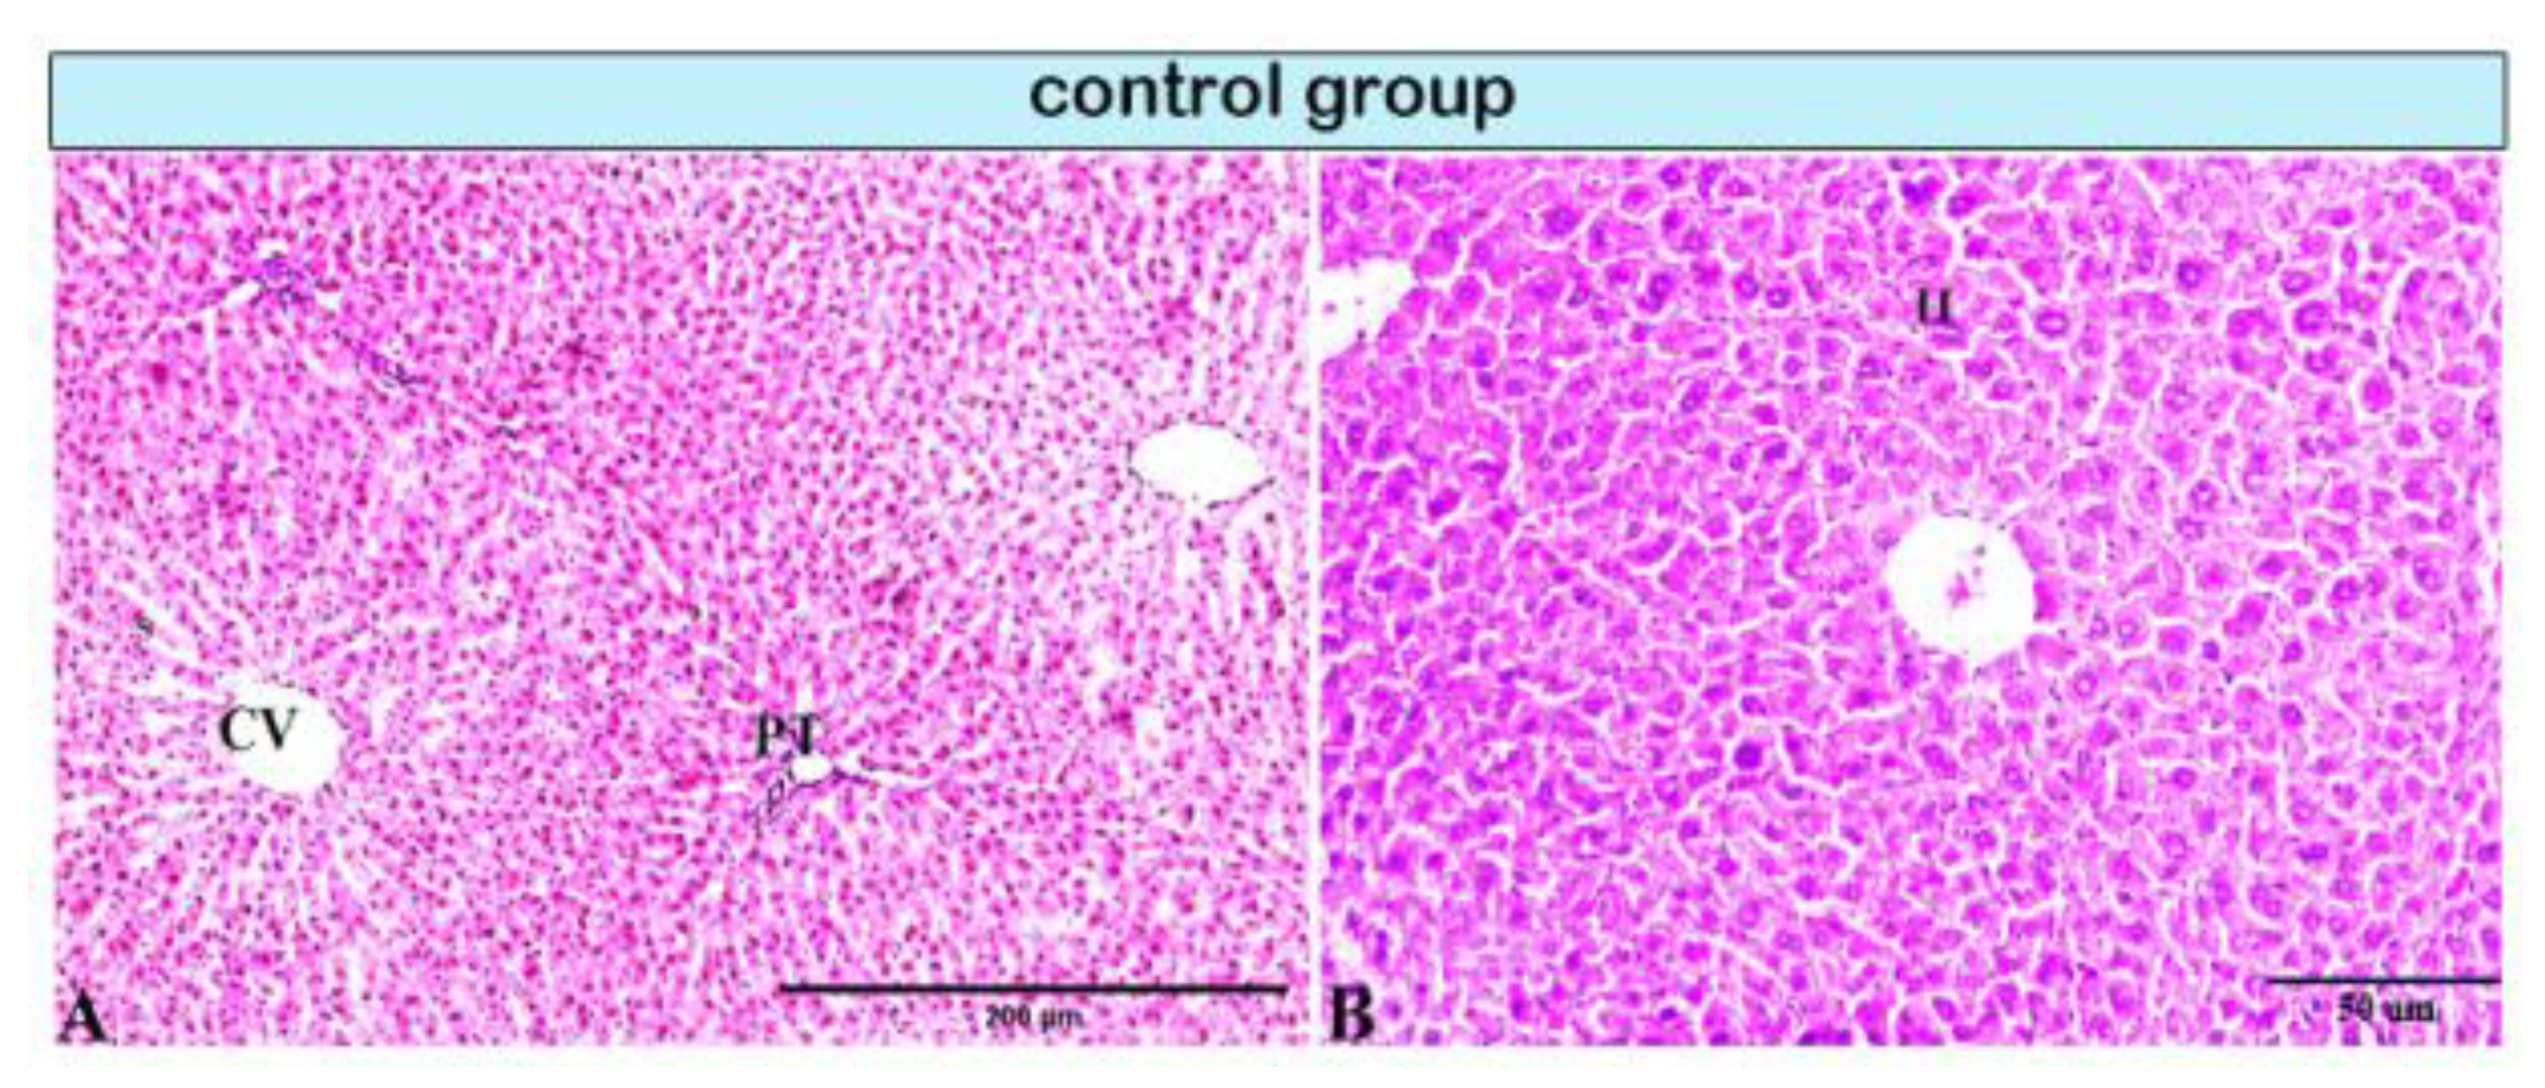
Abstract
:Simple Summary
Abstract
1. Introduction
2. Materials and Methods
2.1. Chemicals
2.2. Animals and Experimental Design
2.3. Specimen Processing and Staining
2.4. Ordinal Method for Validating Histopathologic Scoring
2.5. Semi-Thin Section Preparation and Transmission Electron Microscopy
2.6. Digital Colorization of TEM Images
2.7. Statistical Analysis
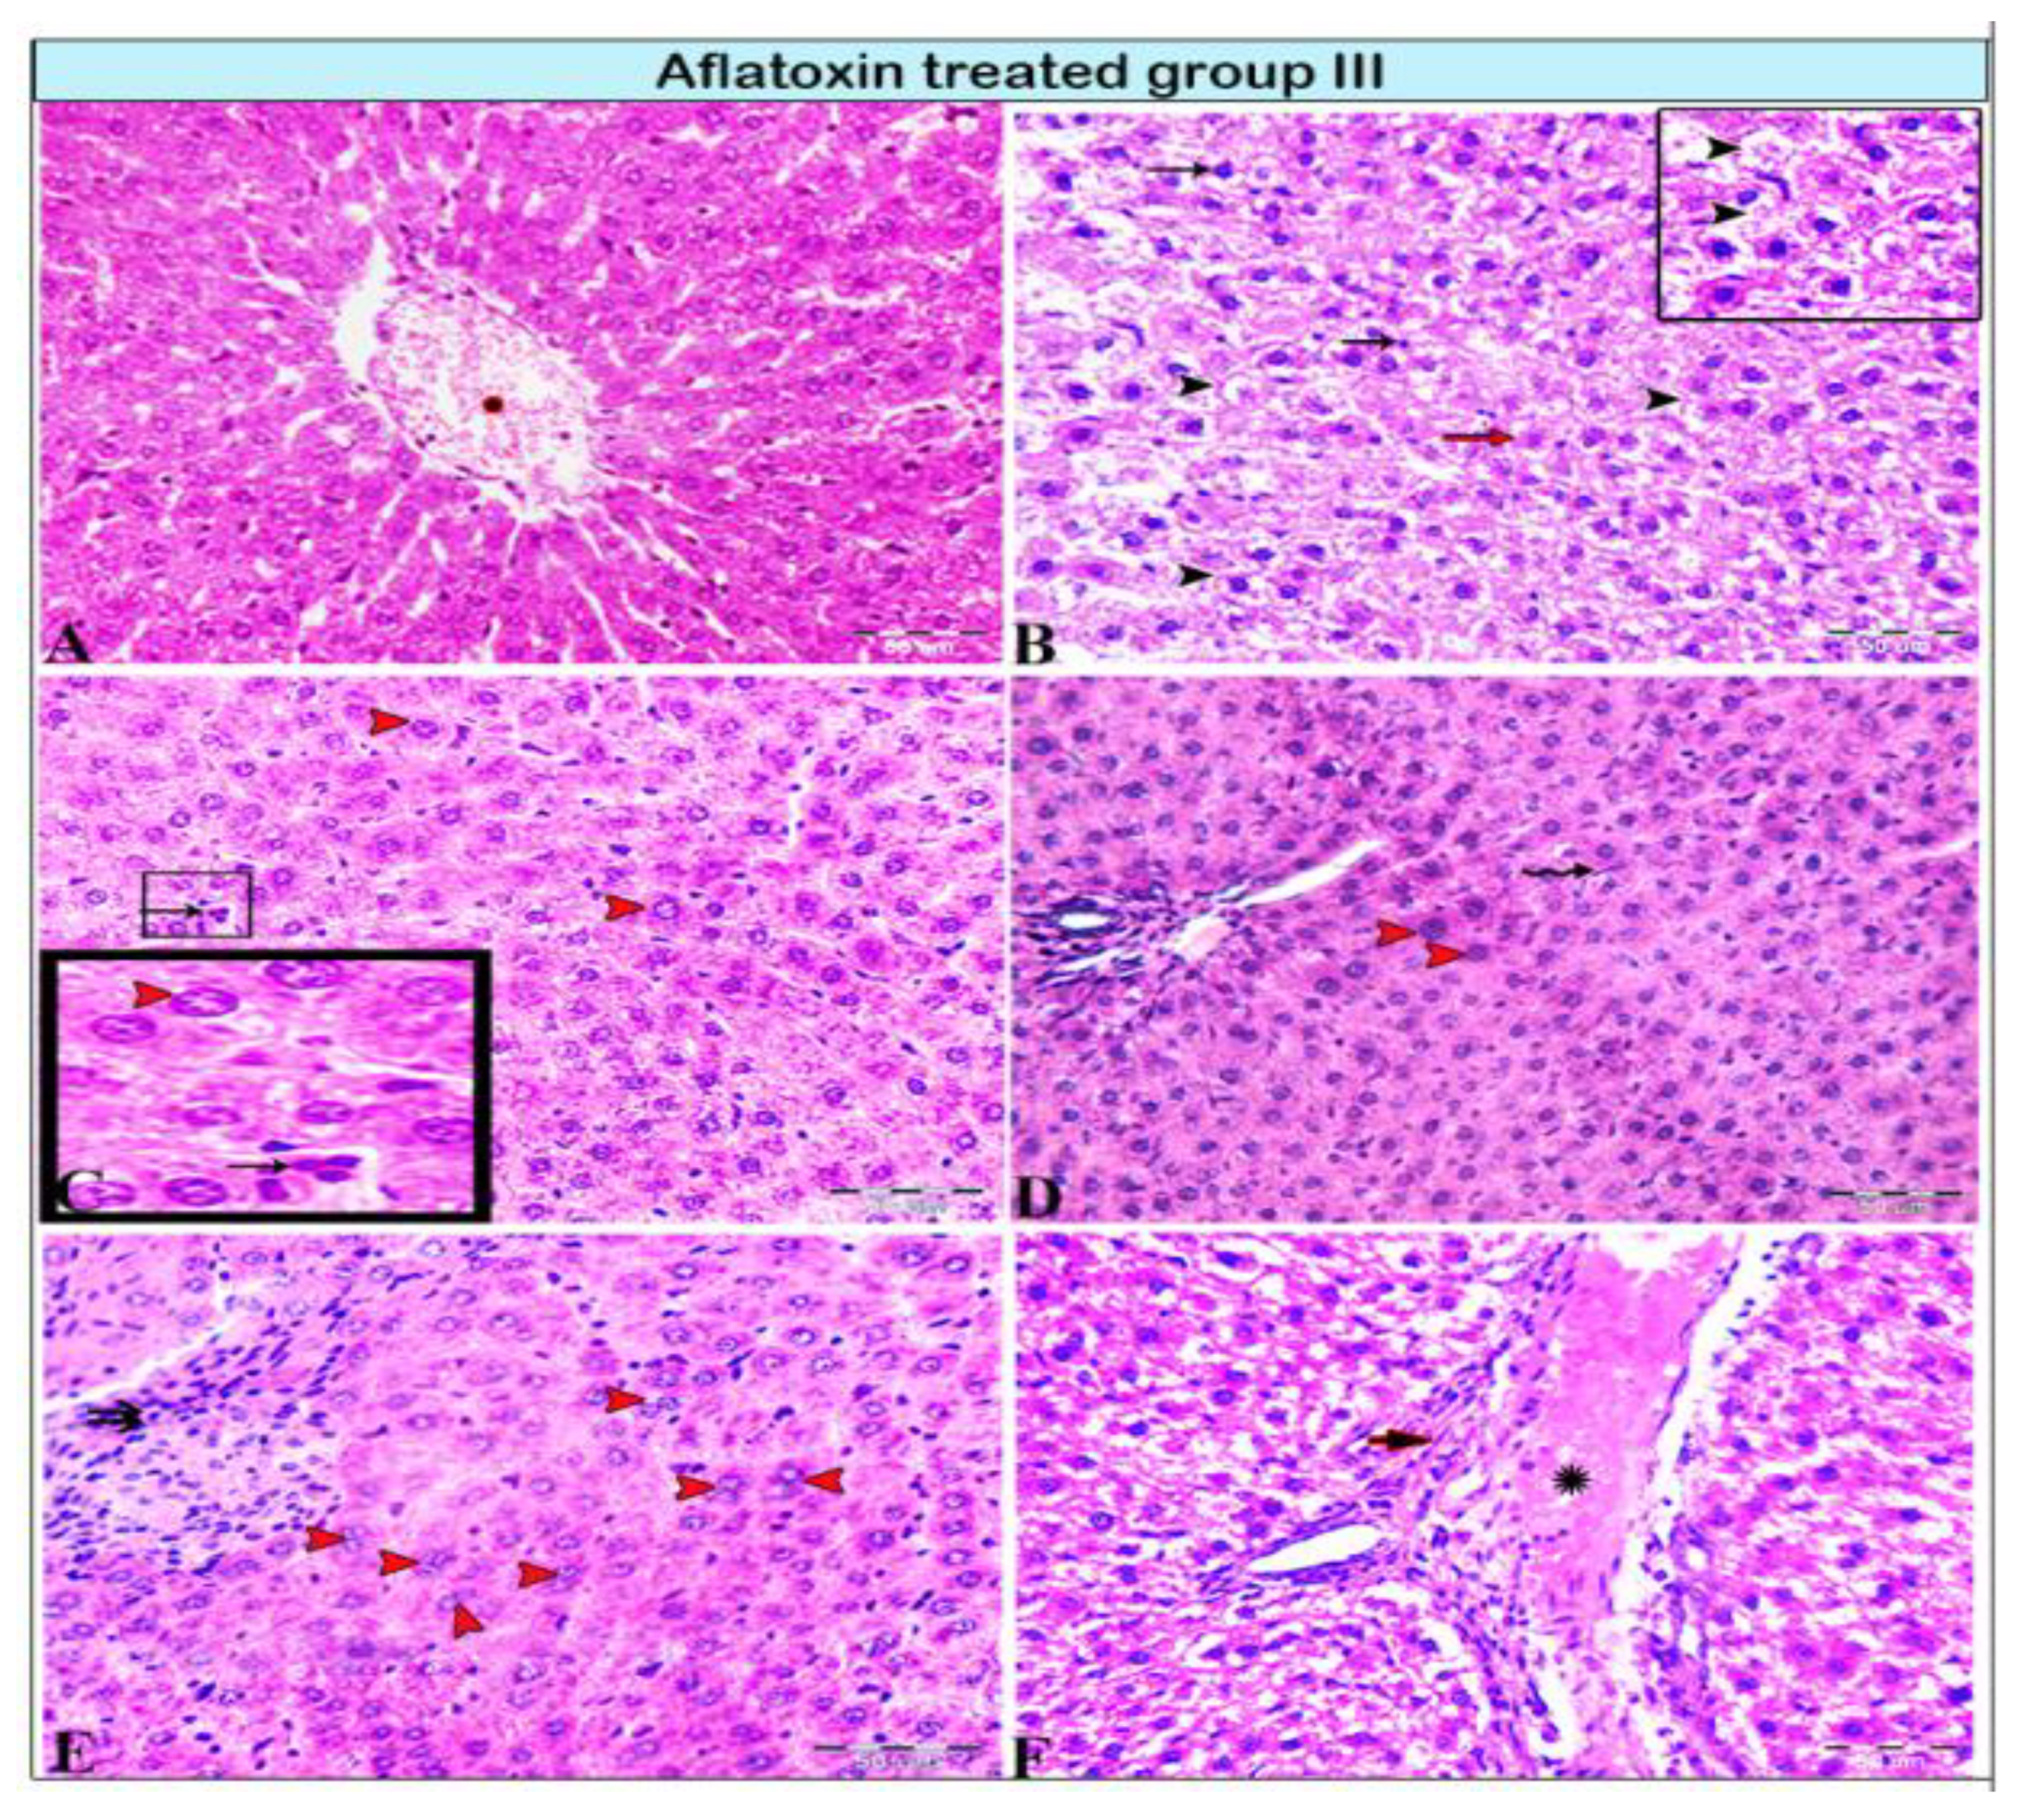
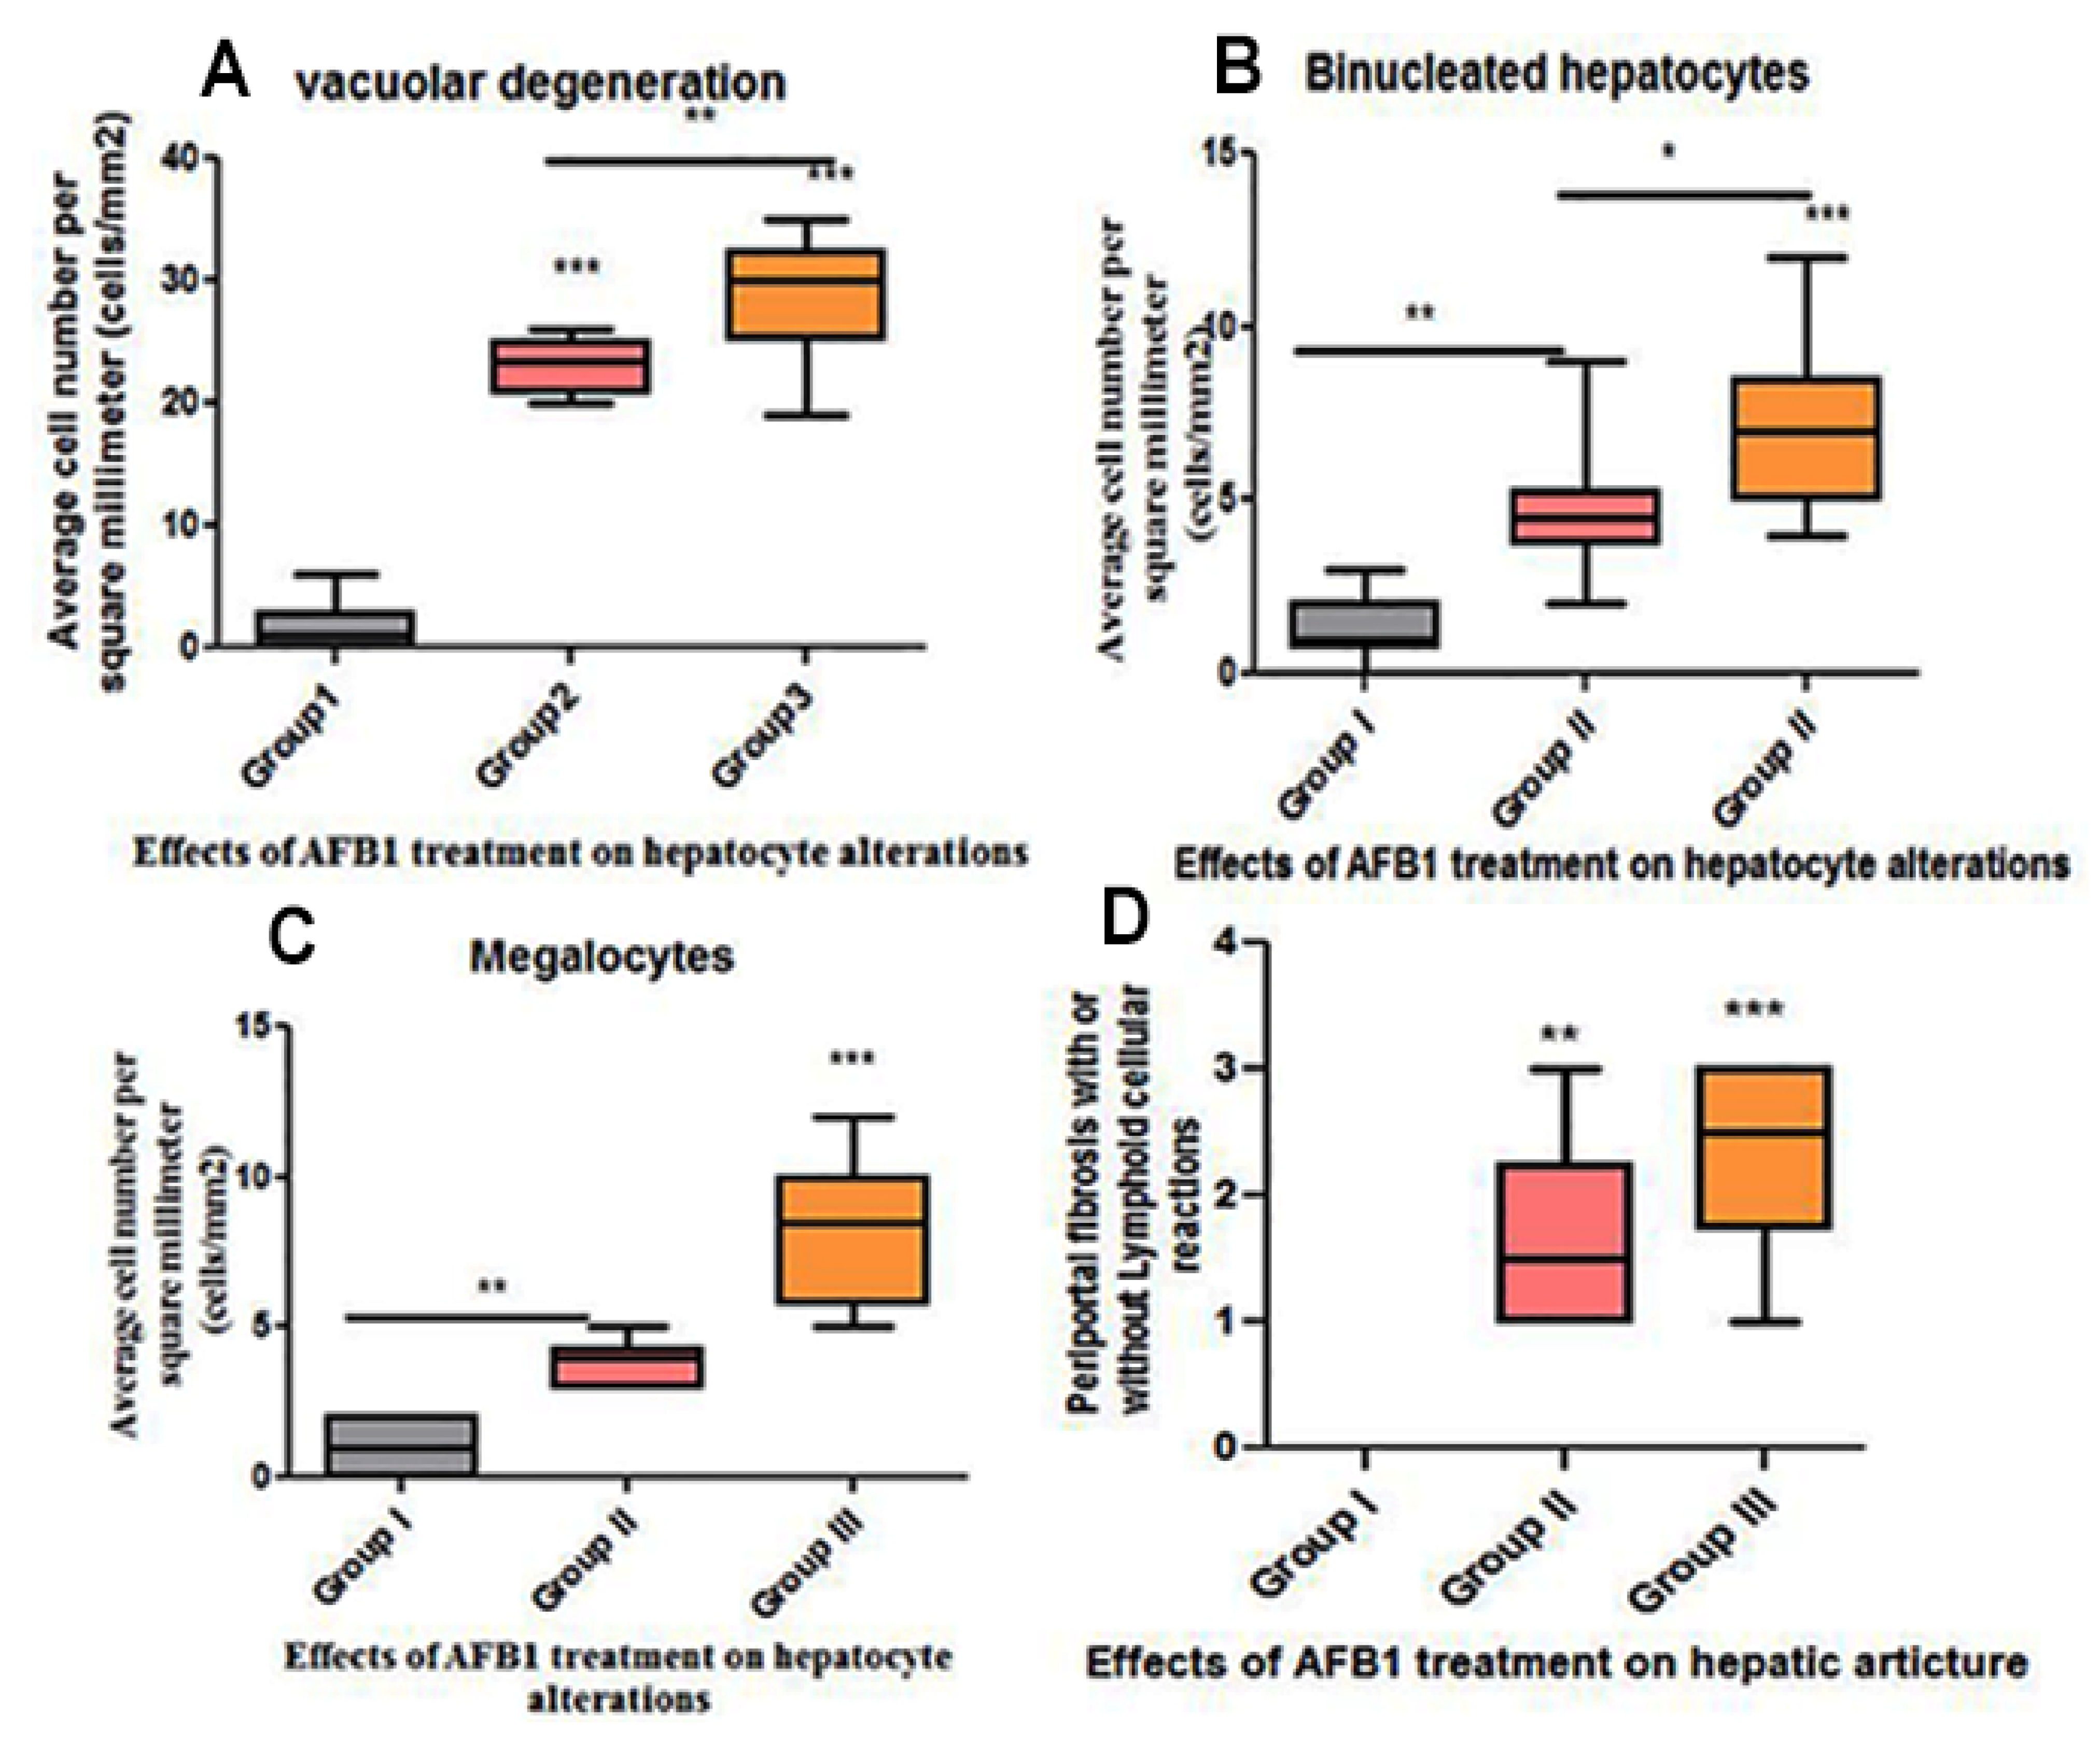
3. Results
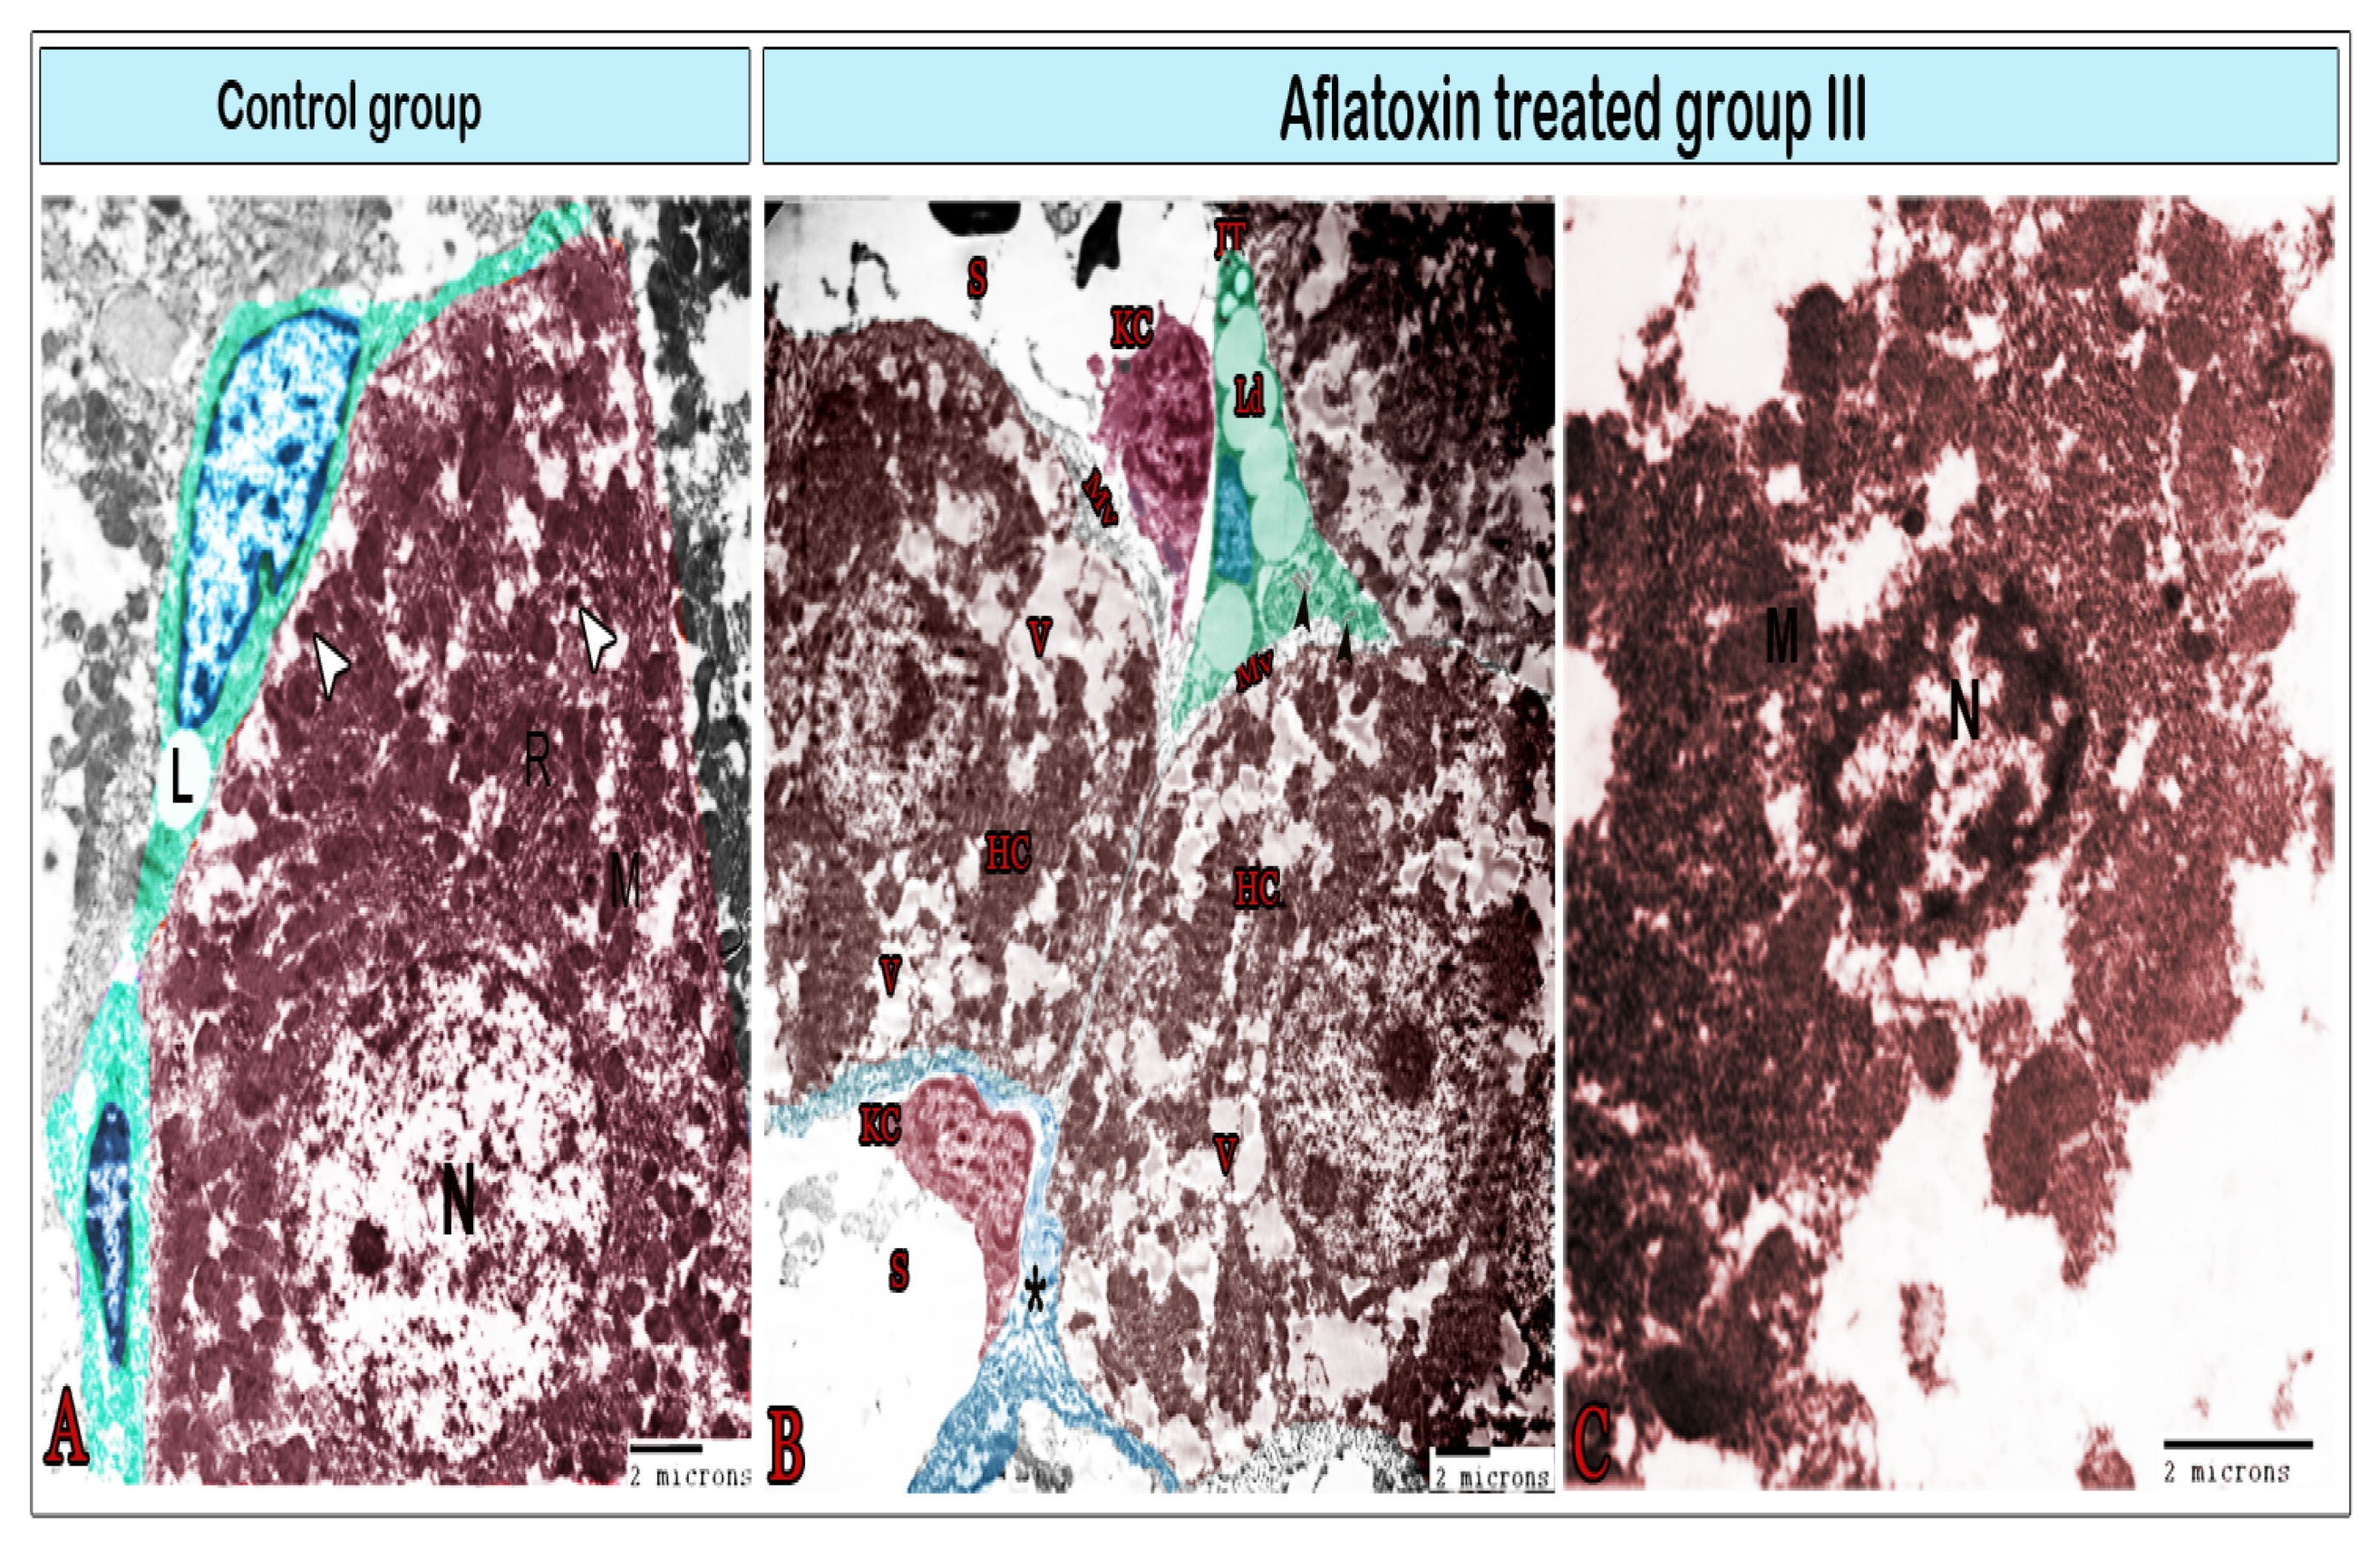
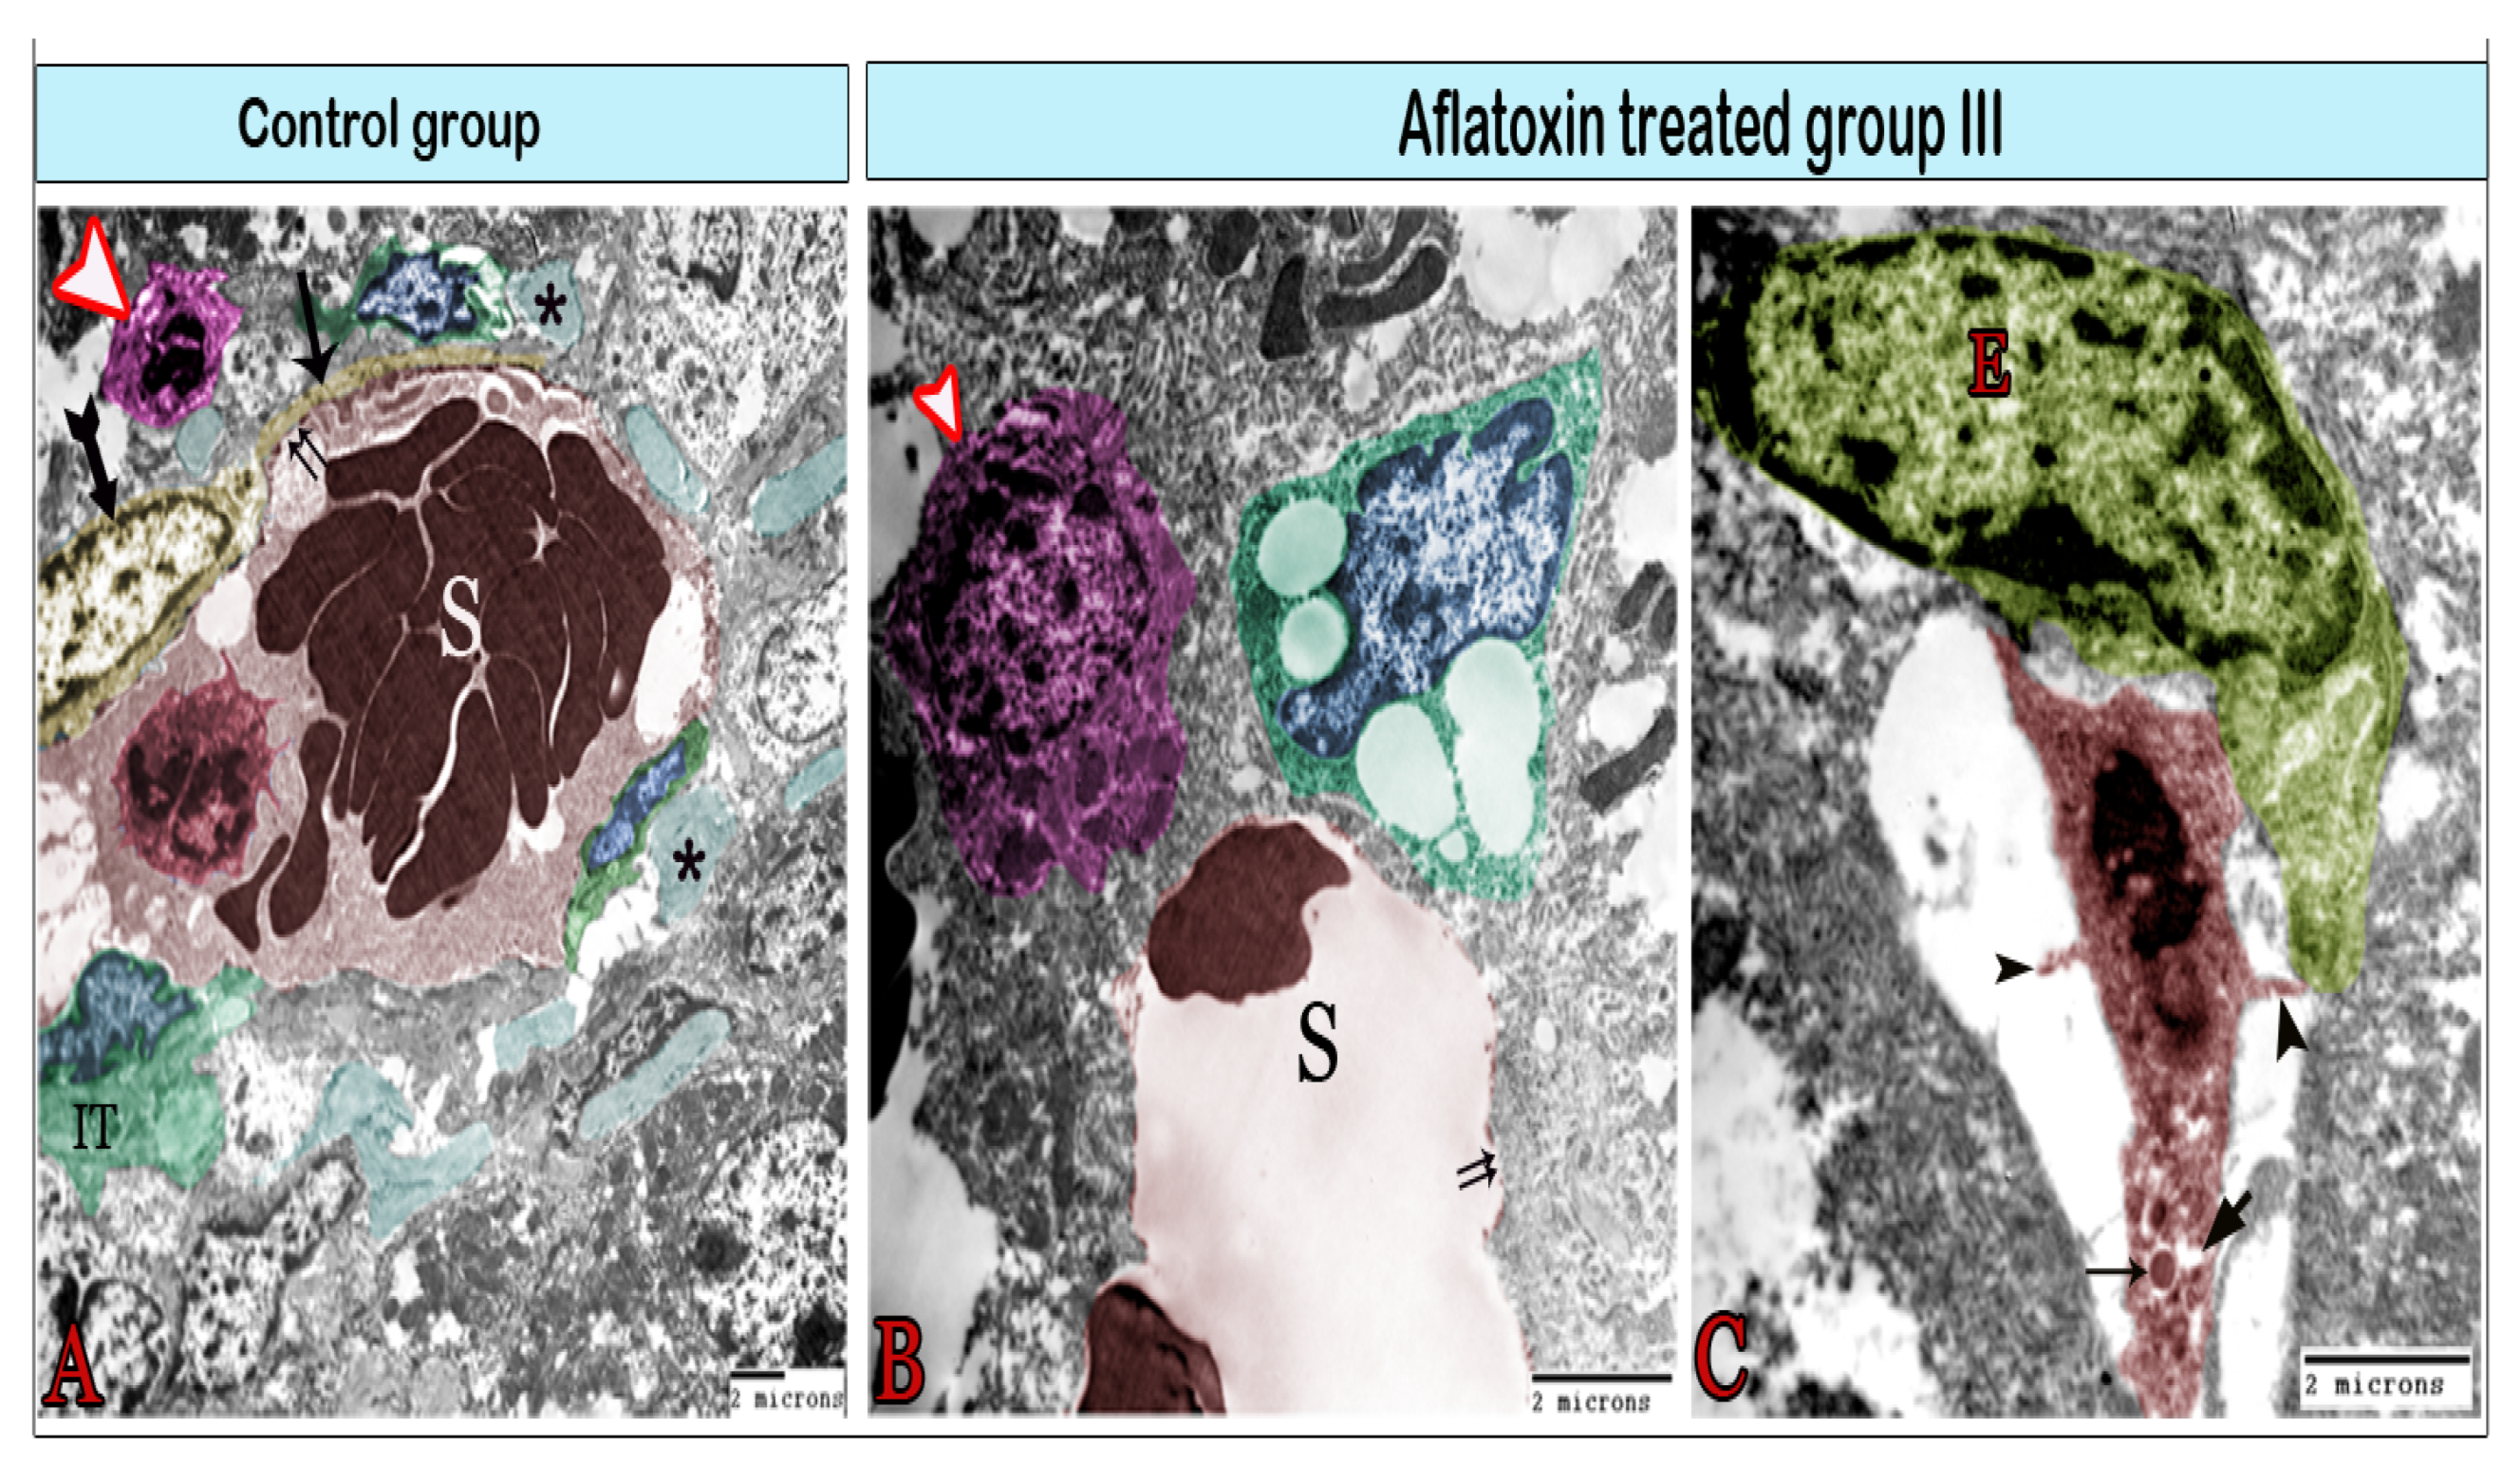
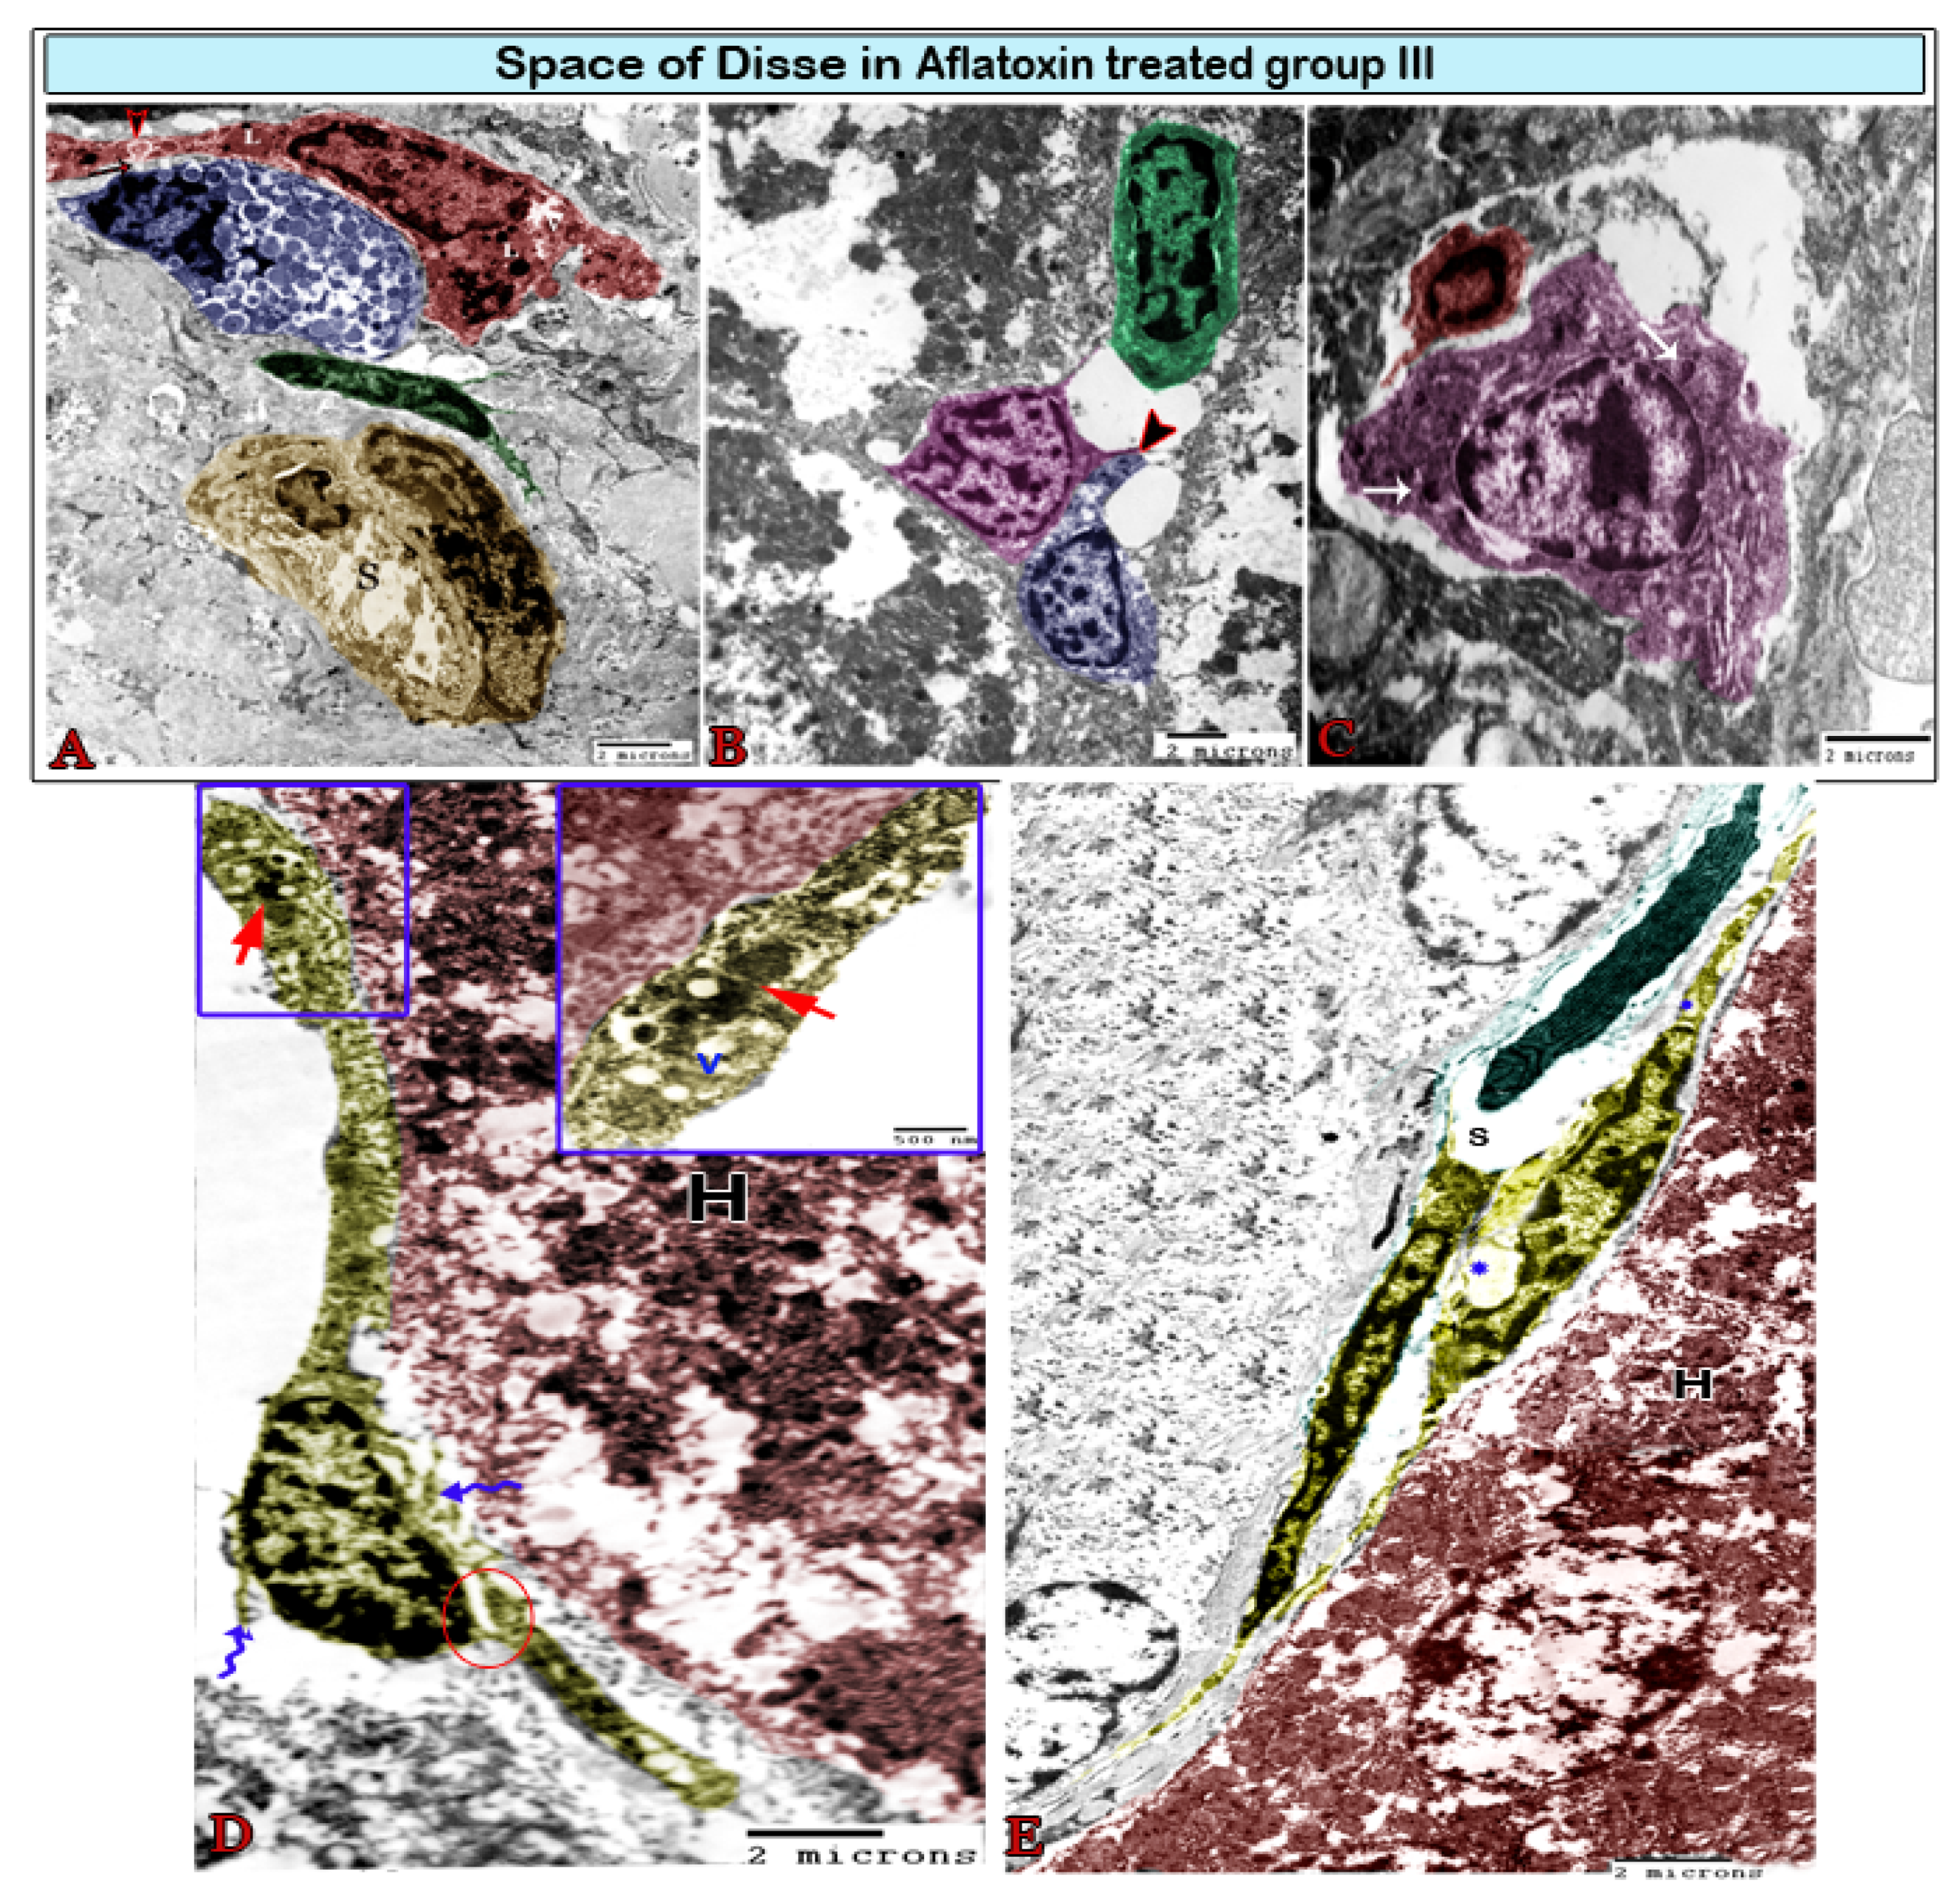
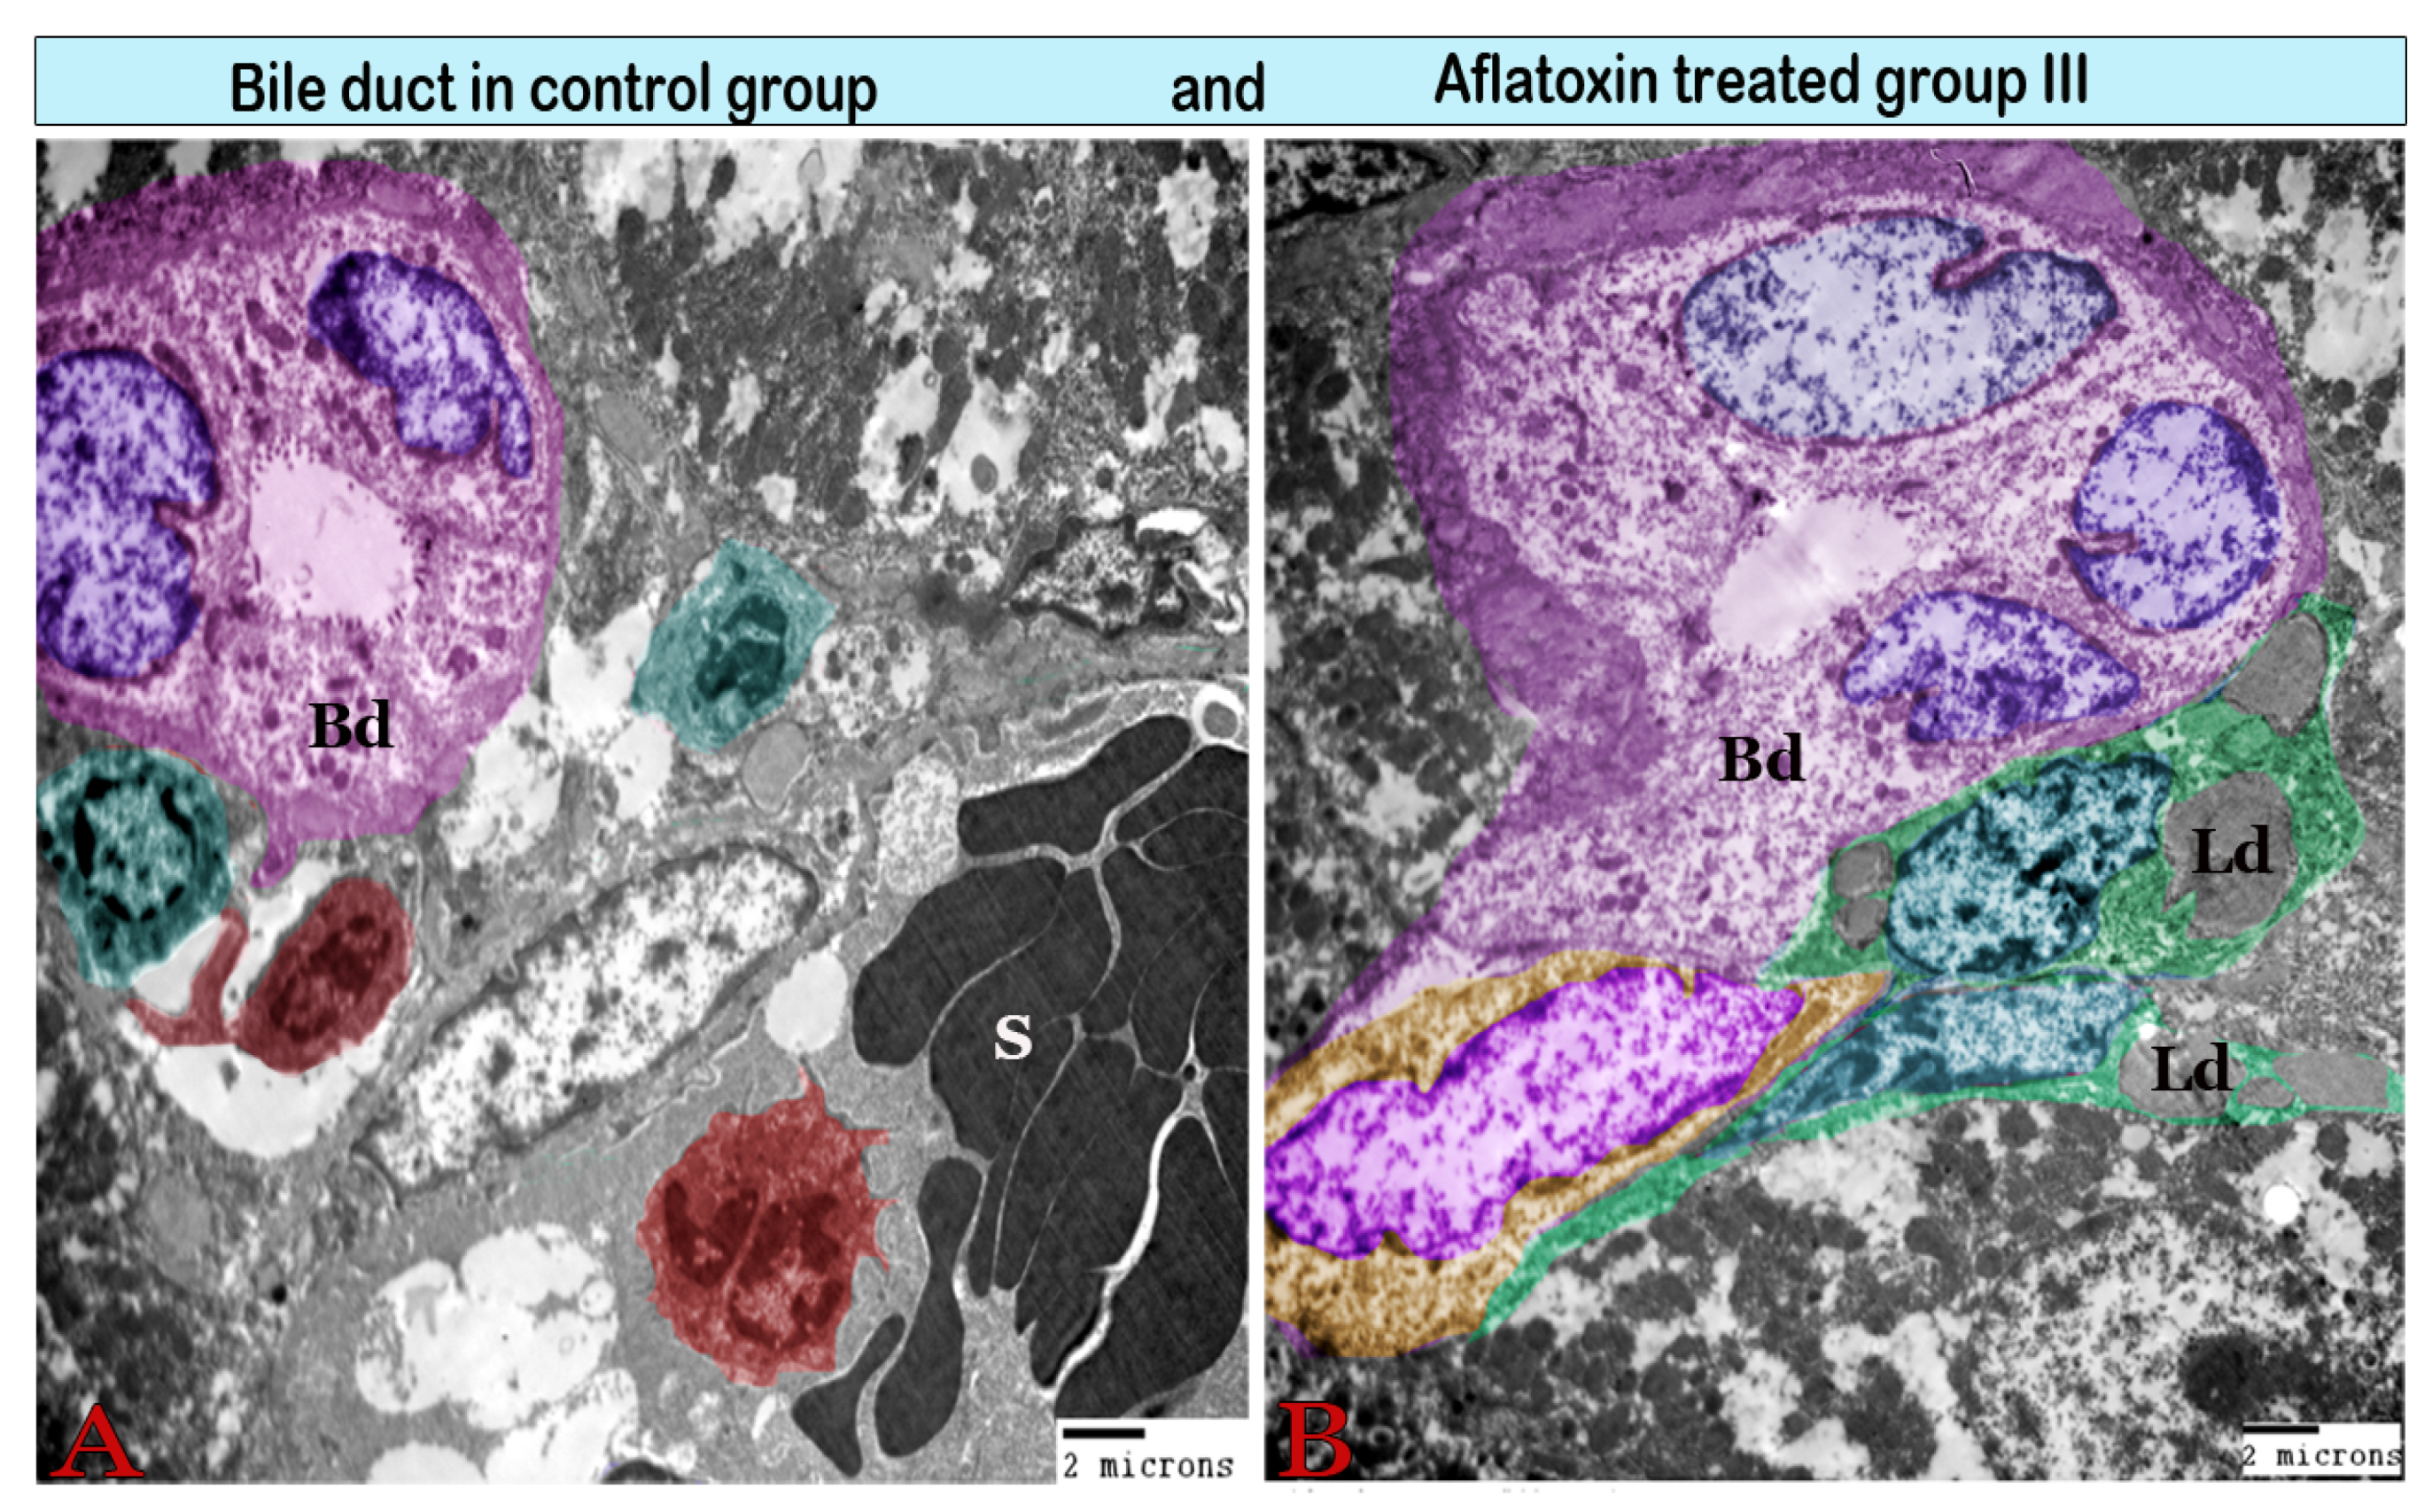
Transmission Electron Microscopy
4. Discussion
Author Contributions
Funding
Institutional Review Board Statement
Data Availability Statement
Acknowledgments
Conflicts of Interest
References
- Sana, S.; Anjum, A.A.; Yaqub, T.; Nasir, M.; Ali, M.A.; Abbas, M. Molecular Approaches for Characterization of Aflatoxin Producing Aspergillus flavus Isolates from Poultry Feed. Pak. Vet. J. 2019, 39, 169–174. [Google Scholar] [CrossRef]
- Ismail, A.; Gonçalves, B.L.; de Neeff, D.V.; Ponzilacqua, B.; Coppa, C.F.; Hintzsche, H.; Sajid, M.; Cruz, A.G.; Corassin, C.H.; Oliveira, C.A. Aflatoxin in foodstuffs: Occurrence and recent advances in decontamination. Food Res. Int. 2018, 113, 74–85. [Google Scholar] [CrossRef]
- Wu, F. Measuring the economic impacts of Fusarium toxins in animal feeds. Anim. Feed Sci. Technol. 2007, 137, 363–374. [Google Scholar] [CrossRef]
- Pankaj, S.; Shi, H.; Keener, K.M. A review of novel physical and chemical decontamination technologies for aflatoxin in food. Trends Food Sci. Technol. 2018, 71, 73–83. [Google Scholar] [CrossRef]
- Basappa, S. Aflatoxins: Formation, Analysis and Control; Alpha Science International: Oxford, UK, 2009. [Google Scholar]
- Williams, J.H.; Phillips, T.D.; Jolly, P.E.; Stiles, J.K.; Jolly, C.M.; Aggarwal, D. Human aflatoxicosis in developing countries: A review of toxicology, exposure, potential health consequences, and interventions. Am. J. Clin. Nutr. 2004, 80, 1106–1122. [Google Scholar] [CrossRef]
- Mahato, D.K.; Lee, K.E.; Kamle, M.; Devi, S.; Dewangan, K.; Kumar, P.; Kang, S.G. Aflatoxins in food and feed: An overview on prevalence, detection and control strategies. Front. Microbiol. 2019, 10, 2266. [Google Scholar] [CrossRef]
- Fung, F.; Clark, R.F. Health effects of mycotoxins: A toxicological overview. J. Toxic. Clin. Toxic. 2004, 42, 217–234. [Google Scholar]
- Binder, E.; Tan, L.; Chin, L.; Handl, J.; Richard, J. Worldwide occurrence of mycotoxins in commodities, feeds and feed ingredients. Anim. Feed Sci. Technol. 2007, 137, 265–282. [Google Scholar] [CrossRef]
- Sherif, S.O.; Salama, E.E.; Abdel-Wahhab, M.A. Mycotoxins and child health: The need for health risk assessment. Int. J. Hyg.Env. Health 2009, 212, 347–368. [Google Scholar]
- Wu, F. Mycotoxin reduction in Bt corn: Potential economic, health, and regulatory impacts. Transgenic Res. 2006, 15, 277–289. [Google Scholar] [CrossRef]
- Mohajeri, M.; Behnam, B.; Cicero, A.F.; Sahebkar, A. Protective effects of curcumin against aflatoxicosis: A comprehensive review. J. Cell. Physiol. 2018, 233, 3552–3577. [Google Scholar] [CrossRef] [PubMed]
- Tulayakul, P.; Dong, K.; Li, J.; Manabe, N.; Kumagai, S. The effect of feeding piglets with the diet containing green tea extracts or coumarin on in vitro metabolism of aflatoxin B1 by their tissues. Toxicon 2007, 50, 339–348. [Google Scholar] [CrossRef] [PubMed]
- McCord, J.M. The evolution of free radicals and oxidative stress. Am. J. Med. 2000, 108, 652–659. [Google Scholar] [CrossRef]
- Smela, M.E.; Currier, S.S.; Bailey, E.A.; Essigmann, J.M. The chemistry and biology of aflatoxin B1: From mutational spectrometry to carcinogenesis. Carcinogenesis 2001, 22, 535–545. [Google Scholar] [CrossRef] [Green Version]
- Monmeesil, P.; Fungfuang, W.; Tulayakul, P.; Pongchairerk, U. The effects of astaxanthin on liver histopathology and expression of superoxide dismutase in rat aflatoxicosis. J. Vet. Med. Sci. 2019, 1162–1172. [Google Scholar] [CrossRef] [Green Version]
- Khoshpey, B.; Farhud, D.; Zaini, F. Aflatoxins in Iran: Nature, hazards and carcinogenicity. Iran. J. Public Health 2011, 40, 1. [Google Scholar] [PubMed]
- Tang, L.; Guan, H.; Ding, X.; Wang, J.-S. Modulation of aflatoxin toxicity and biomarkers by lycopene in F344 rats. Toxicol. Appl. Pharmacol. 2007, 219, 10–17. [Google Scholar] [CrossRef] [PubMed]
- El-Mahalaway, A.M. Protective effect of curcumin against experimentally induced aflatoxicosis on the renal cortex of adult male albino rats: A histological and immunohisochemical study. Int. J. Clin. Exp. Pathol. 2015, 8, 6019. [Google Scholar]
- Yassein, S.N.; Zghair, Z. Study of toxicity and pathogenicity of Aflatoxin B1 and G1 in mice. Al Anbar J. Vet. Sci 2012, 5, 23–31. [Google Scholar]
- Laag, E.M.; Elaziz, H.O.A. Effect of aflatoxin-B1 on rat cerebellar cortex: Light and electron microscopic study. Egypt. J. Histol. 2013, 36, 601–610. [Google Scholar] [CrossRef]
- Karaca, A.; Yilmaz, S.; Kaya, E.; Altun, S. The effect of lycopene on hepatotoxicity of aflatoxin B1 in rats. Arch. Physiol. Biochem. 2019, 1–8. [Google Scholar] [CrossRef]
- Bancroft, I.D.; Stevens, A. Theory and Practice of Histologic Techniques, 2nd ed.; Longman Group Limited: London, UK, 1982. [Google Scholar]
- Gibson-Corley, K.N.; Olivier, A.K.; Meyerholz, D.K. Principles for valid histopathologic scoring in research. Vet. Pathol. 2013, 50, 1007–1015. [Google Scholar] [CrossRef] [Green Version]
- Suvarna, S.K. Bancroft’s Theory and Practice of Histological Techniques Consult; Elsevier: Amsterdam, The Netherlands, 2013. [Google Scholar]
- Abdel-Maksoud, F.M.; Hussein, M.T.; Attaai, A. Seasonal Variation of the Intraepithelial Gland in Camel Epididymis with Special Reference to Autophagosome. Microsc. Microanal. 2019, 25, 1052–1060. [Google Scholar] [CrossRef] [Green Version]
- Rojkind, M. The liver as a bioecological system. In LiverBiol. Pathobiol., 2nd ed.; Raven Press Ltd.: New York, NY, USA, 1988; pp. 1269–1285. [Google Scholar]
- Abdel-Latif, M.S.; Elmeleigy, K.M.; Aly, T.A.; Khattab, M.S.; Mohamed, S.M. Pathological and biochemical evaluation of coumarin and chlorophyllin against aflatoxicosis in rat. Exp. Toxicol. Pathol. 2017, 69, 285–291. [Google Scholar] [CrossRef] [PubMed]
- Yaman, T.; Yener, Z.; Celik, I. Histopathological and biochemical investigations of protective role of honey in rats with experimental aflatoxicosis. BMC Complementary Altern. Med. 2016, 16, 232. [Google Scholar] [CrossRef] [PubMed] [Green Version]
- Yener, Z.; Celik, I.; Ilhan, F.; Bal, R. Effects of Urtica dioica L. seed on lipid peroxidation, antioxidants and liver pathology in aflatoxin-induced tissue injury in rats. Food Chem. Toxicol. 2009, 47, 418–424. [Google Scholar] [CrossRef] [PubMed]
- Guicciardi, M.; Malhi, H.; Mott, J.; Gores, G. Apoptosis and Necrosis in the Liver; John Wiley & Sons Inc: Hoboken, NY, USA, 2013; pp. 977–1010. [Google Scholar]
- Kim, P.K.; Zuckerbraun, B.S.; Otterbein, L.E.; Vodovotz, Y.; Billiar, T.R. Til cell death do us part: Nitric oxide and mechanisms of hepatotoxicity. Biol. Chem. 2004, 385, 11–15. [Google Scholar] [CrossRef] [PubMed]
- Cotran, R.S.; Kumar, V.; Stanley, R. Robbins Pathologic Basis of Disease; WB Saunders Company: Philadelphia, PA, USA, 2004. [Google Scholar]
- Kalengayi, M.M.; Desmet, V.J. Sequential histological and histochemical study of the rat liver during aflatoxin B1-induced carcinogenesis. Cancer Res. 1975, 35, 2845–2852. [Google Scholar] [PubMed]
- Maxie, M.G. Jubb, Kennedy, and Palmer’s Pathology of Domestic Animals; W.B. Saunders Ltd: Philadelphia, PA, USA, 2016; Volume 2. [Google Scholar]
- Neal, G.; Godoy, H.; Judah, D.; Butler, W. Some effects of acute and chronic dosing with aflatoxin B1 on rat liver nuclei. Cancer Res. 1976, 36, 1771–1778. [Google Scholar]
- Bischoff, K.; Mukai, M.; Ramaiah, S.K. Liver toxicity. In Veterinary Toxicology; Elsevier: Amsterdam, The Netherlands, 2018; pp. 239–257. [Google Scholar]
- Klaunig, J.E.; Wang, Z.; Pu, X.; Zhou, S. Oxidative stress and oxidative damage in chemical carcinogenesis. Toxicol. Appl. Pharmacol. 2011, 254, 86–99. [Google Scholar] [CrossRef]
- El-Shazly, H.H.; EI-Sheikh, I.A. Arrest of mitotic cycle and induction of chromosomal aberrations by aflatoxin B2 in root cells of Vicia faba L. Cytologia 2000, 65, 113–122. [Google Scholar] [CrossRef] [Green Version]
- Fu, S.; Korkmaz, E.; Braet, F.; Ngo, Q.; Ramzan, I. Influence of kavain on hepatic ultrastructure. World J. Gastroenterol. 2008, 14, 541. [Google Scholar] [CrossRef]
- Wisse, E.; Braet, F.; Luo, D.; De Zanger, R.; Jans, D.; Crabbe, E.; Vermoesen, A. Structure and function of sinusoidal lining cells in the liver. Toxicol. Pathol. 1996, 24, 100–111. [Google Scholar] [CrossRef] [PubMed]
- Le Bail, B.; Bioulac-Sage, P.; Senuita, R.; Quinton, A.; Saric, J.; Balabaud, C. Fine structure of hepatic sinusoids and sinusoidal cells in disease. J. Electron. Microsc. Tech. 1990, 14, 257–282. [Google Scholar] [CrossRef]
- Wisse, E. Kupffer cell reactions in rat liver under various conditions as observed in the electron microscope. J. Ultrastruct. Res. 1974, 46, 499–520. [Google Scholar] [CrossRef]
- Kresse, M.; Latta, M.; Kunstle, G.; Riehle, H.M.; van Rooijen, N.; Hentze, H.; Tiegs, G.; Biburger, M.; Lucas, R.; Wendel, A. Kupffer Cell-Expressed Membrane-Bound TNF Mediates Melphalan Hepatotoxicity via Activation of Both TNF Receptors. J. Immunol. Bethesda 2005, 175, 4076–4083. [Google Scholar] [CrossRef]
- Roberts, R.A.; Ganey, P.E.; Ju, C.; Kamendulis, L.M.; Rusyn, I.; Klaunig, J.E. Role of the Kupffer Cell in Mediating Hepatic Toxicity and Carcinogenesis. Toxicol. Sci. 2007, 96, 2–15. [Google Scholar] [CrossRef] [PubMed] [Green Version]
- He, Q.; Kim, J.; Sharma, R.P. Fumonisin B1 hepatotoxicity in mice is attenuated by depletion of Kupffer cells by gadolinium chloride. Toxicology 2005, 207, 137–147. [Google Scholar] [CrossRef]
- Kaneda, K.; Wake, K. Distribution and morphological characteristics of the pit cells in the liver of the rat. Cell Tissue Res. 1983, 233, 485–505. [Google Scholar] [CrossRef]
- Sallusto, F.; Lanzavecchia, A. The instructive role of dendritic cells on T-cell responses. Arthritis Res. Ther. 2002, 4, S127. [Google Scholar] [CrossRef]
- Ibba-Manneschi, L.; Rosa, I.; Manetti, M. Telocytes in Chronic Inflammatory and Fibrotic Diseases. Adv. Exp. Med. Biol. 2016, 913, 51–76. [Google Scholar] [CrossRef] [PubMed]
- Fu, S.; Wang, F.; Cao, Y.; Huang, Q.; Xiao, J.; Yang, C.; Popescu, L.M. Telocytes in human liver fibrosis. J. Cell. Mol. Med. 2015, 19, 676–683. [Google Scholar] [CrossRef] [PubMed]
- Wang, F.; Song, Y.; Bei, Y.; Zhao, Y.; Xiao, J.; Yang, C. Telocytes in liver regeneration: Possible roles. J. Cell. Mol. Med. 2014, 18, 1720–1726. [Google Scholar] [CrossRef] [PubMed]
- Qian, G.; Wang, F.; Tang, L.; Massey, M.E.; Mitchell, N.J.; Su, J.; Williams, J.H.; Phillips, T.D.; Wang, J.-S. Integrative toxicopathological evaluation of aflatoxin B1 exposure in F344 rats. Toxicol. Pathol. 2013, 41, 1093–1105. [Google Scholar] [CrossRef] [Green Version]
- Sato, K.; Marzioni, M.; Meng, F.; Francis, H.; Glaser, S.; Alpini, G. Ductular reaction in liver diseases: Pathological mechanisms and translational significances. Hepatology 2019, 69, 420–430. [Google Scholar] [CrossRef] [PubMed] [Green Version]
- Newberne, P.M.; Wogan, G.N. Sequential morphologic changes in aflatoxin B1 carcinogenesis in the rat. Cancer Res. 1968, 28, 770–781. [Google Scholar]


Publisher’s Note: MDPI stays neutral with regard to jurisdictional claims in published maps and institutional affiliations. |
© 2021 by the authors. Licensee MDPI, Basel, Switzerland. This article is an open access article distributed under the terms and conditions of the Creative Commons Attribution (CC BY) license (http://creativecommons.org/licenses/by/4.0/).
Share and Cite
Ali, F.A.Z.; Abdel-Maksoud, F.M.; Abd Elaziz, H.O.; Al-Brakati, A.; Elmahallawy, E.K. Descriptive Histopathological and Ultrastructural Study of Hepatocellular Alterations Induced by Aflatoxin B1 in Rats. Animals 2021, 11, 509. https://0-doi-org.brum.beds.ac.uk/10.3390/ani11020509
Ali FAZ, Abdel-Maksoud FM, Abd Elaziz HO, Al-Brakati A, Elmahallawy EK. Descriptive Histopathological and Ultrastructural Study of Hepatocellular Alterations Induced by Aflatoxin B1 in Rats. Animals. 2021; 11(2):509. https://0-doi-org.brum.beds.ac.uk/10.3390/ani11020509
Chicago/Turabian StyleAli, Fatma Abo Zakaib, Fatma M. Abdel-Maksoud, Hekmat Osman Abd Elaziz, Ashraf Al-Brakati, and Ehab Kotb Elmahallawy. 2021. "Descriptive Histopathological and Ultrastructural Study of Hepatocellular Alterations Induced by Aflatoxin B1 in Rats" Animals 11, no. 2: 509. https://0-doi-org.brum.beds.ac.uk/10.3390/ani11020509