
Early Detection of Avian Diseases Based on Thermography and Artificial Intelligence
by
 ,
,
Mohammad Sadeghi
1,
Ahmad Banakar
1,*,
Saeid Minaei
1,
Mahdi Orooji
2,
Abdolhamid Shoushtari
3 and
Guoming Li
4,* 1
Biosystems Engineering Department, Tarbiat Modares University, Tehran 14117-13116, Iran
2
Department of Medical Engineering, Tarbiat Modares University, Tehran 14117-13116, Iran
3
Department of Poultry Disease, Razi Vaccine and Serum Research Institute, Karaj 31976-19751, Iran
4
Department of Poultry Science, Institute for Artificial Intelligence, University of Georgia, Athens, GA 30602, USA
*
Authors to whom correspondence should be addressed.
Animals 2023, 13(14), 2348; https://0-doi-org.brum.beds.ac.uk/10.3390/ani13142348
Submission received: 14 June 2023
/
Revised: 8 July 2023
/
Accepted: 11 July 2023
/
Published: 19 July 2023
(This article belongs to the Special Issue Automated Monitoring of Livestock and Poultry with Machine Learning Technology)
Abstract
:Simple Summary
From an economic point of view, timely information about the flock state is crucial for poultry farmers. When a flock is infected with a disease, if quick and necessary measures are not taken, the disease will spread and affect the whole flock. Artificial intelligence is one of the popular methods in precision livestock farming and is effective in various fields such as weight measurement, feed intake estimation, and disease diagnosis. So far, chicken disease has been diagnosed using sound signal processing and video recordings. This study attempted to develop a new and rapid method of poultry disease diagnosis based on thermography for data collection and artificial intelligence for data analytics. With the proposed method, Avian Influenza and Newcastle Disease can be detected within 24 h after virus infection.
Abstract
Non-invasive measures have a critical role in precision livestock and poultry farming as they can reduce animal stress and provide continuous monitoring. Animal activity can reflect physical and mental states as well as health conditions. If any problems are detected, an early warning will be provided for necessary actions. The objective of this study was to identify avian diseases by using thermal-image processing and machine learning. Four groups of 14-day-old Ross 308 Broilers (20 birds per group) were used. Two groups were infected with one of the following diseases: Newcastle Disease (ND) and Avian Influenza (AI), and the other two were considered control groups. Thermal images were captured every 8 h and processed with MATLAB. After de-noising and removing the background, 23 statistical features were extracted, and the best features were selected using the improved distance evaluation method. Support vector machine (SVM) and artificial neural networks (ANN) were developed as classifiers. Results indicated that the former classifier outperformed the latter for disease classification. The Dempster–Shafer evidence theory was used as the data fusion stage if neither ANN nor SVM detected the diseases with acceptable accuracy. The final SVM-based framework achieved 97.2% and 100% accuracy for classifying AI and ND, respectively, within 24 h after virus infection. The proposed method is an innovative procedure for the timely identification of avian diseases to support early intervention.
1. Introduction
A modern broiler house accommodates tens of thousands of animals, and the number is more for layer houses. The high rearing stocking density is favorable for economic profits but increases the risks of bacterial/virus transmission and causing diseases [1]. For instance, the USDA Animal and Plant Health Inspection Service reported that by 18 May 2023, a total of 325 commercial flocks, 511 backyard flocks, and 58.79 million birds were affected by the highly pathogenic Avian Influenza (HPAI) outbreak [2]. The outbreak severely struck the low-profit-margin poultry industry and led to economic loss for producers. Optimal strategies that help ameliorate the threat of emerging diseases in the poultry industry must include rapid and accurate health assessment, so producers can intervene timely to prevent severe outbreaks.
Manual observation methods are not suitable for this task, as most caretakers are not qualified to diagnose health problems, and they need to identify the issue if there is a potential challenge occurring and then call veterinarians for sampling and diagnosing. Furthermore, clinical signs such as diarrhea and nasal discharge, and other complication symptoms can appear in multiple diseases (e.g., Newcastle Disease “ND”, AI, and fowl cholera) [3], making it difficult to pinpoint from visual observation and provide corresponding treatment. Common methods to assess bird health consist of on-site sampling and subsequent disease diagnosis at a laboratory, which can take several days to receive a diagnosis and requires skilled laboratory operators and veterinarians [4]. Delayed disease diagnosis may lead to the disease progressing to the point where the symptoms are widespread and pronounced [5].
Alternative solutions are to use precision livestock and poultry techniques, as they could provide timely and accurate disease diagnosis results [6]. Automated monitoring systems have brought benefits to farm production management and improvement in animal health and welfare [7,8,9]. Among the wide range of techniques, sound recognition and computer vision systems are popular tools to investigate animal health and welfare status and identify animal behavior and internal situation; they are non-invasive for data collection, ensuring continuous animal monitoring without disturbing [10,11,12,13,14]. Animals use vocalization to express conditions such as warning, alarm, nesting, threat, distress, fear, food, privacy, dominance, and time calls [15,16]. Despite being a useful tool, sound recognition requires microphones placed close to animals to collect accurate audio signals for processing. Close placement of the microphones could result in dust accumulation and damage pecked by birds [17,18]. Instead, computer vision systems are typically installed far from animals, resulting in less dust and dirt accumulation and damage to the equipment. Previous studies have investigated computer vision techniques for disease diagnosis. Minna et al. (2018) identified the sick yellow feather chicken based on head features (e.g., eye and comb) in captured images with the support vector machine (SVM) classifier. The final accuracy of classifying healthy and sick birds was 92.5% [19]. Zhuang et al. (2018) developed an early warning algorithm to detect H5N2 AI for broilers based on their outlines and skeleton information gained from images. They also applied an SVM classifier and obtained 99.46% accuracy for disease recognition [20]. Okinda et al. (2019) designed a machine vision system to detect and predict healthy and sick birds infected with Newcastle Disease Virus. The SVM classifier improved with the Radial Basis Function, achieved 97% accuracy for the disease prediction [21]. Akmomolafe and Medeiros (2021) showed that Avian Influenza and Newcastle Disease Virus can be detected using a convolutional neural network classifier with classification accuracy ranging from 95% to 98% [22]. The abovementioned studies utilized features of spatial variations on single images and temporal changes in bird mobility across multiple frames. Another set of computer vision-based disease recognition is based on feces image which can reflect important features for digestive diseases. Wang et al., (2019) classified normal and abnormal birds based on shape, color, water content, and shape and water in the dropping images. They developed deep learning object detection algorithms (R-CNN and YOLO-V3) for the classification and gained the best mean average precision of 93.3% [23].
Although these studies show great potential for combing computer vision systems and machine learning for poultry disease recognition, few focused on the combination of thermography and machine learning. Animals, if infected with diseases, may exhibit irregular body temperature, which could be captured by thermography [24,25]. Therefore, the aim of this study was to identify avian diseases using thermography image processing and machine learning. The ND and AI were used as examples to evaluate system efficacy and accuracy as they are popular and fatal diseases in the poultry industry.
2. Materials and Methods
2.1. Experiment Setup
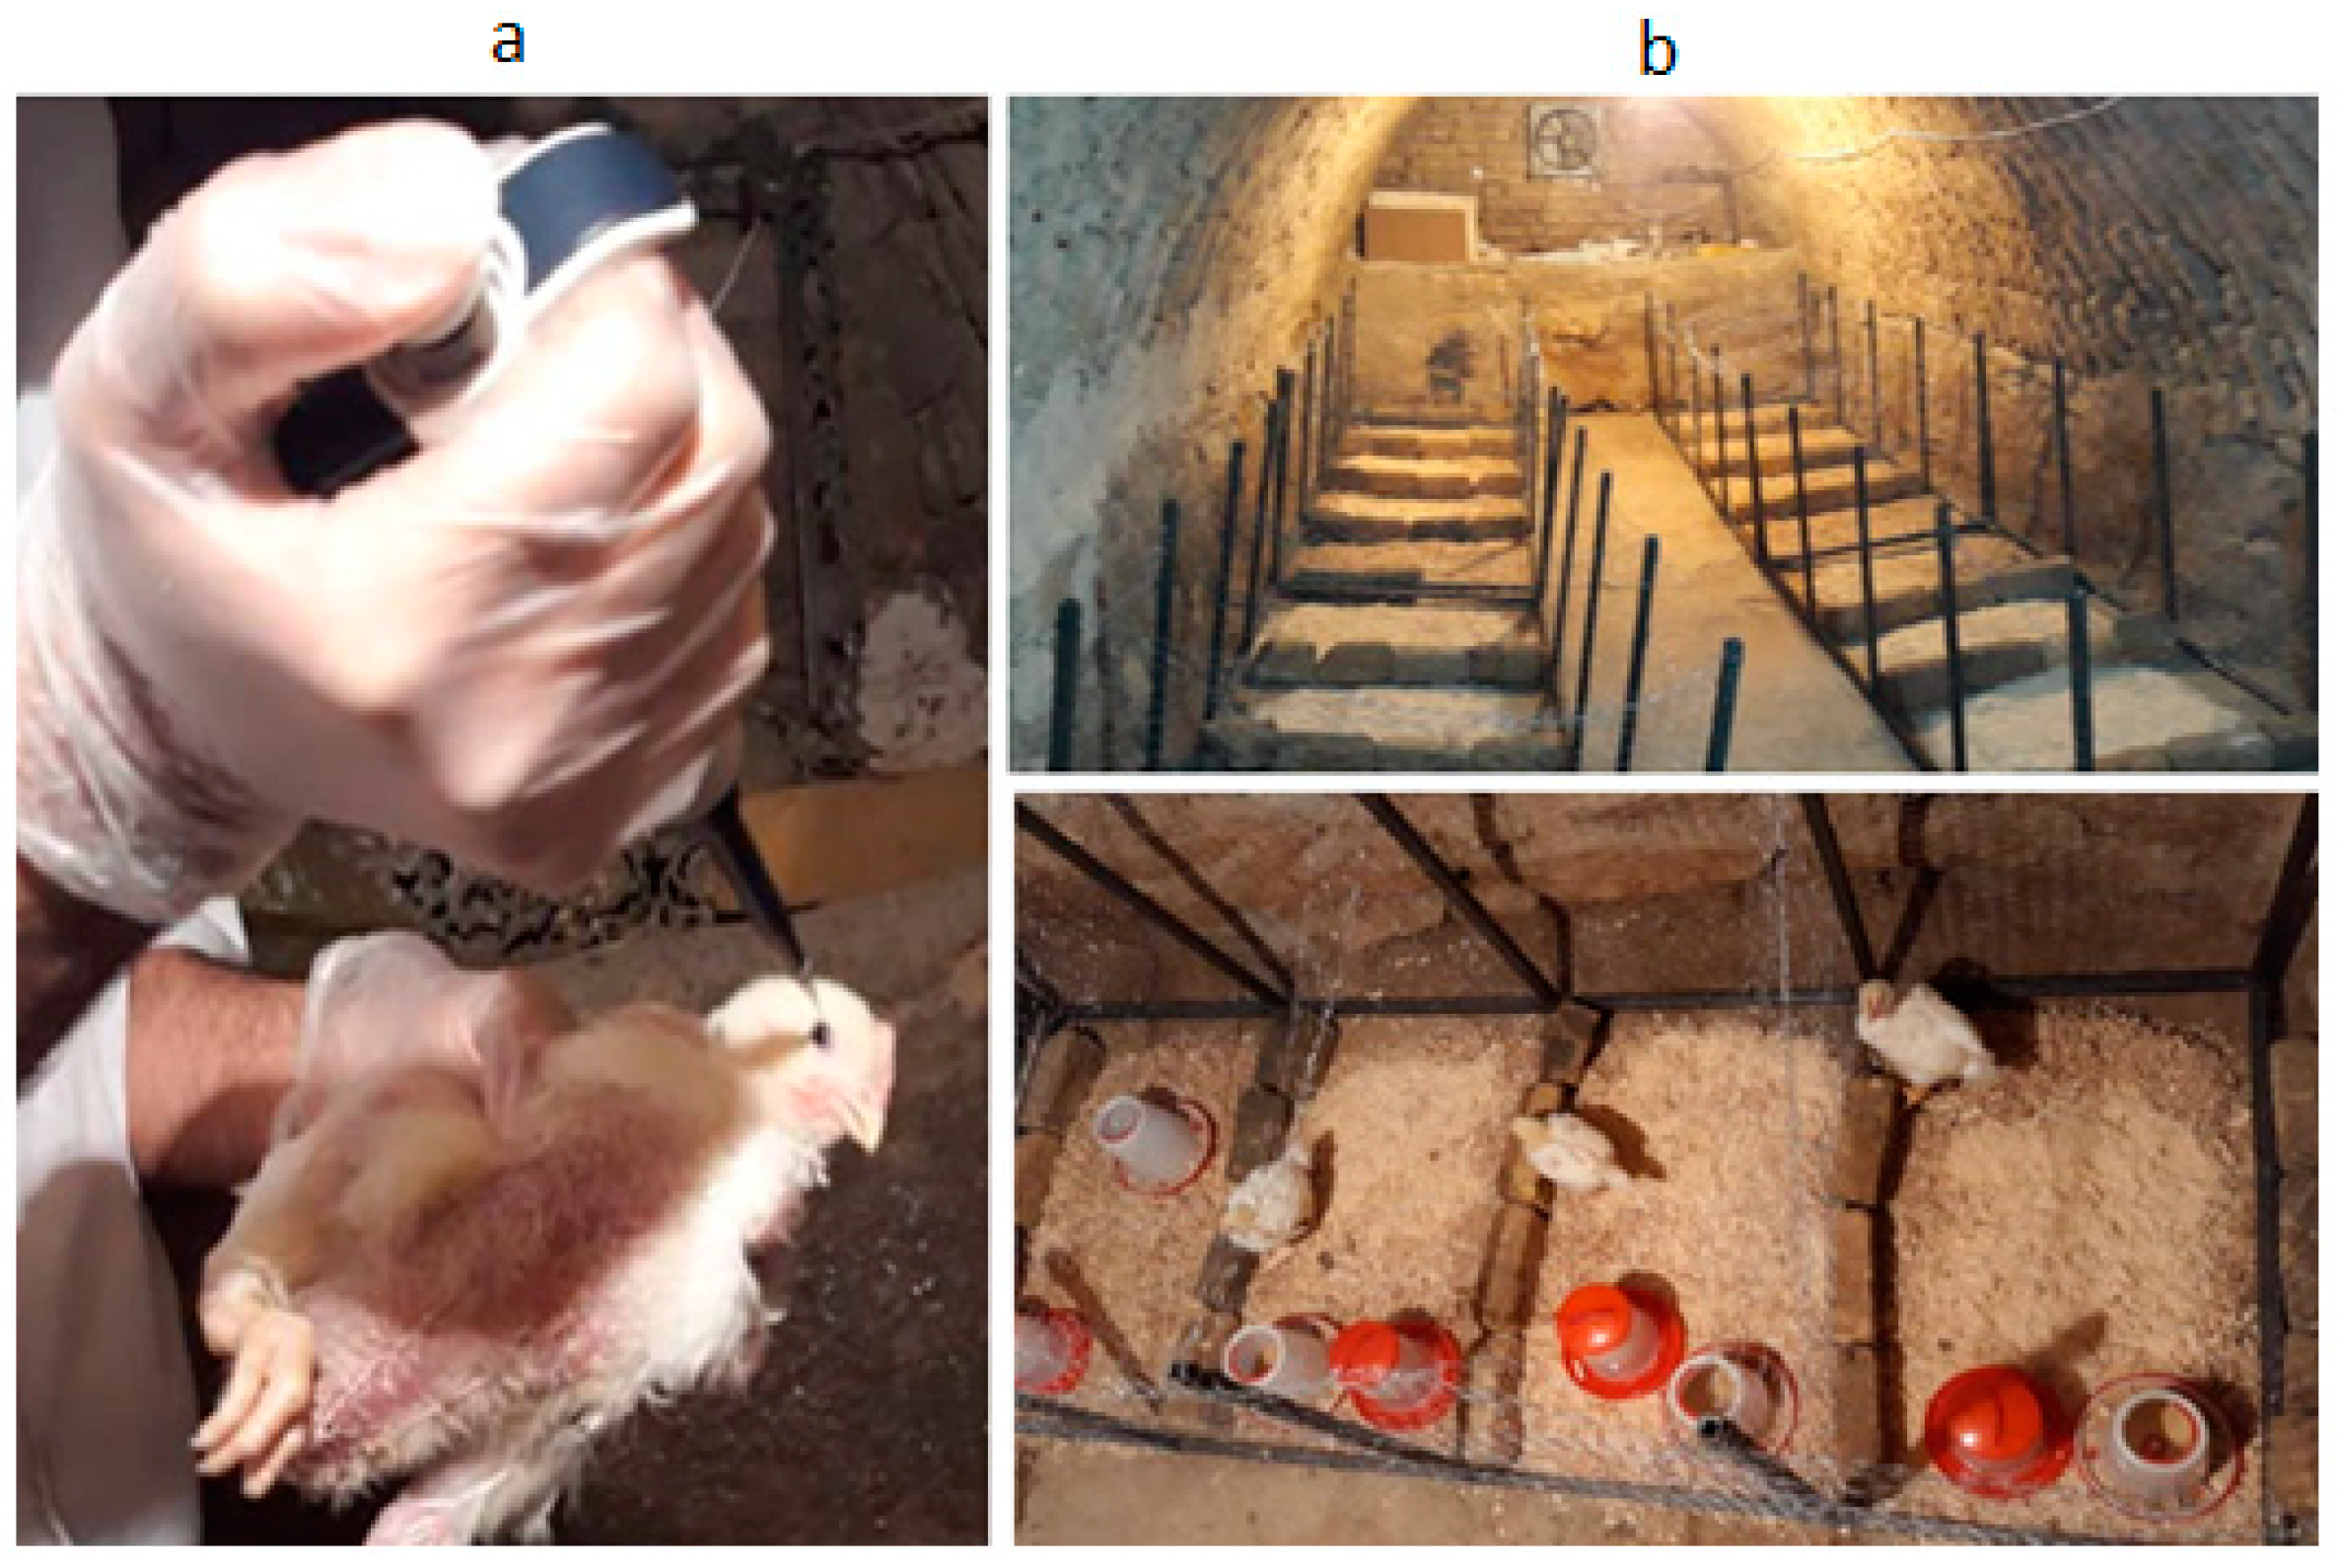
The experiments were carried out at Tarbiat Modares University, Tehran, Iran. The ND virus’s molecular-and-pathological characterization was carried out at RAZI Institute, Karaj, Iran. The ND Virulence type was velogenic strains, and ND tropism was viscerotropism. The AI virus type was H9N2. Twenty 14-day-old Ross 308 broilers were raised in 20 experimental pens (1.20 m long × 0.80 m wide for each), and four groups of birds were used, with each kept in a separate room. Two groups of birds were infected with ND and AI, respectively, by eye drops (0.1 cc for each eye). Figure 1a shows the operations of virus infection for a chicken. The rest two were considered control groups. Each group of birds was kept in separate pens in a room meshed with stainless steel wire, allowing all birds to see each other (Figure 1b). Separating birds into independent can help better understand the disease infection progress, as group-housed birds can be cross-contaminated.
The virus infection was verified based on clinical signs, RT-PCR test, and virus isolation from infected tissues. The RT-PCR test was conducted using protocol 2, which was described in [26]. Birds needed feed and water intake during the first 8 h after the lights were turned on, and bird infection was conducted after that to avoid bird stress. A total of seven sections were planned. Section 1 indicates the 8th hour after disease infection, Section 2 indicates the 16th hour after disease infection, …, and Section 7 indicates the 56th hour after disease infection.
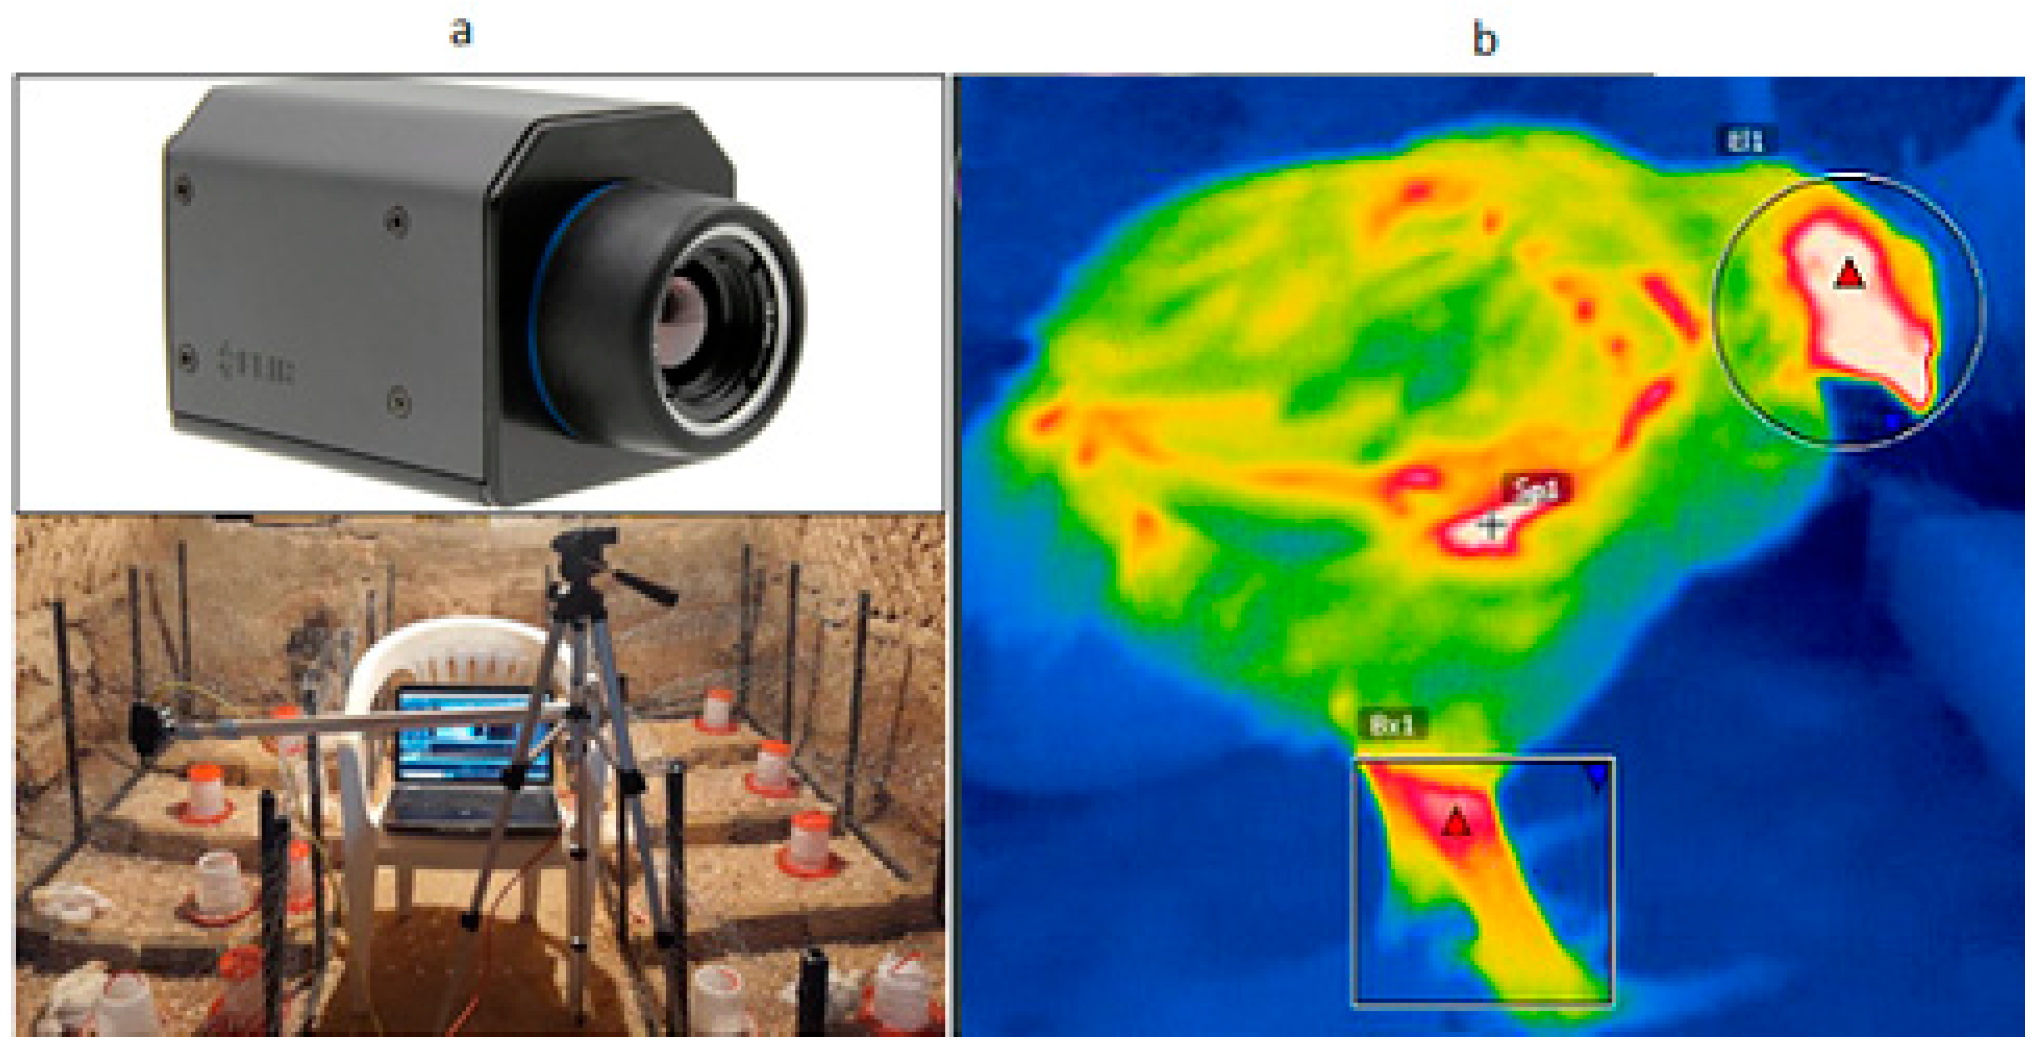
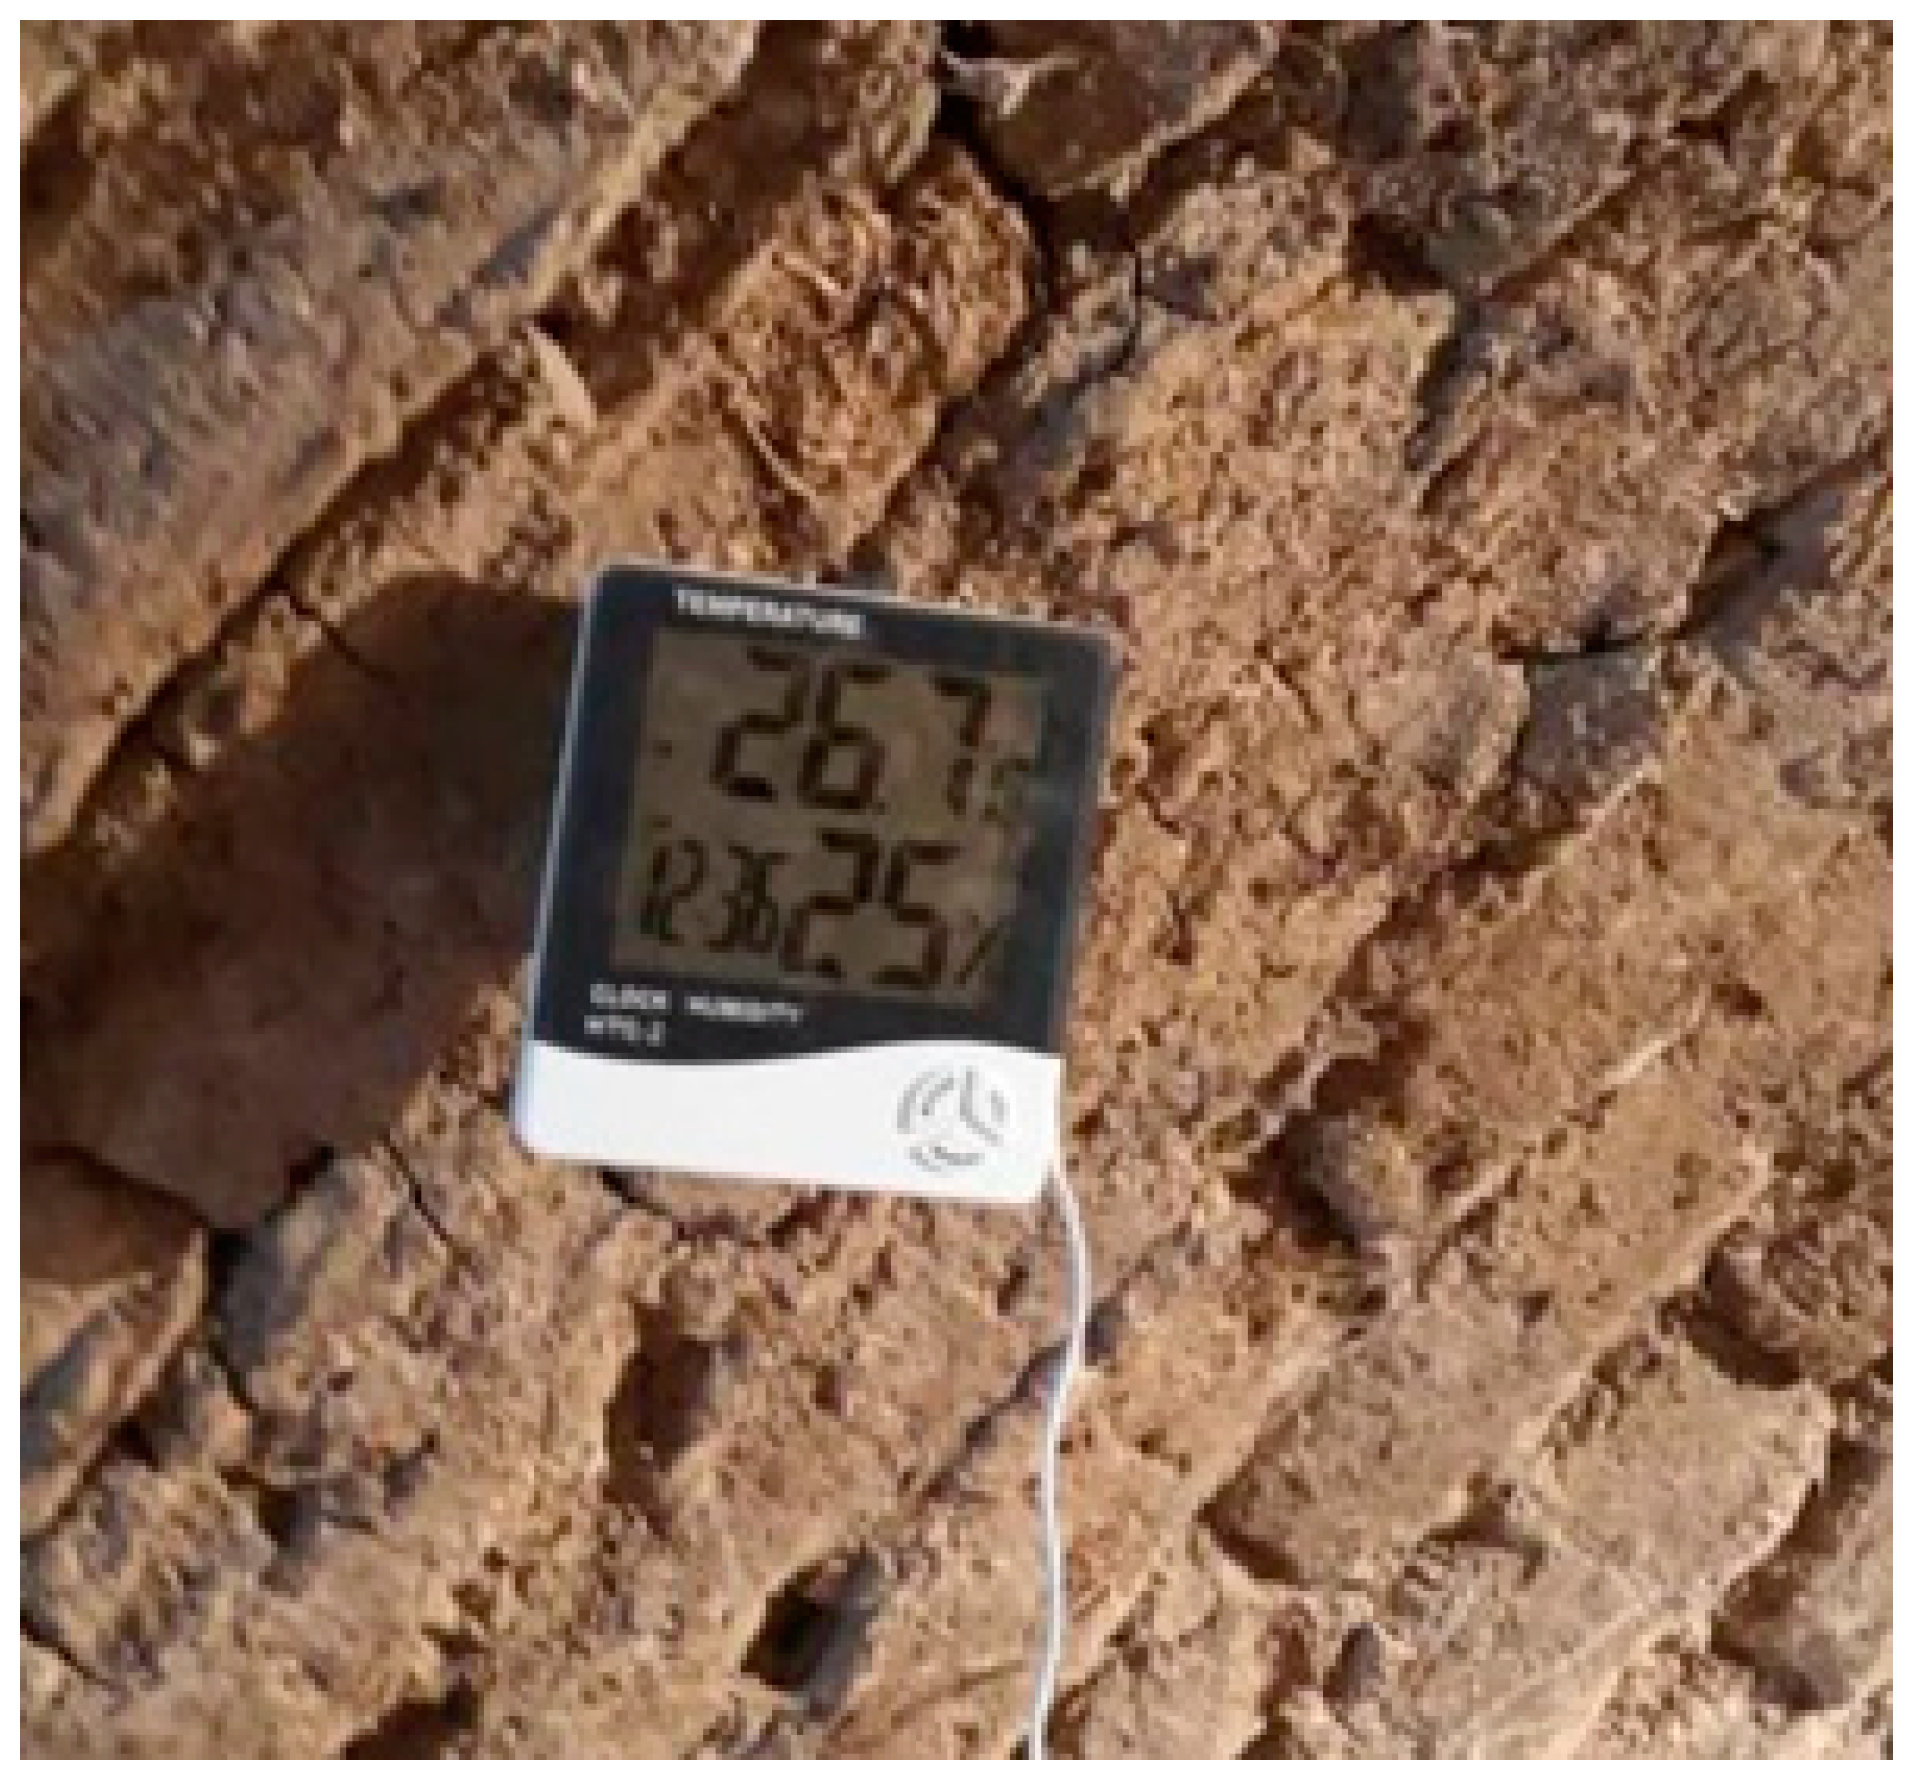
Thermal images were captured using a FLIR a65 thermal camera with a resolution of 640 × 512 pixels. The camera has good performance within the ambient temperature of −25 to 135 °C (Figure 2a). The captured images were loaded into FLIR Tools software version 4.1 to remove background (Figure 2b), and then the preprocessed images were further enhanced in MATLAB 2020 (Math works Ins., Natic, MA, USA). No existing packages were used in the following sections, and all steps were coded with the listed formulas. The total number of chickens was 80 (40 birds for ND and control samples and 40 birds for AI and control samples), and 240 thermal images were collected from each section (three images were taken from each bird). The experiment was performed within three consecutive days after virus infection. The emissivity of thermography and distance between the camera and birds were 0.95 and 50 cm, respectively. The close-distance data collection can be achieved by movable robotic systems once available. As ambient temperature and relative humidity could influence the accuracy of thermography, they were measured for each image using a digital temperature humidity meter (Figure 3).
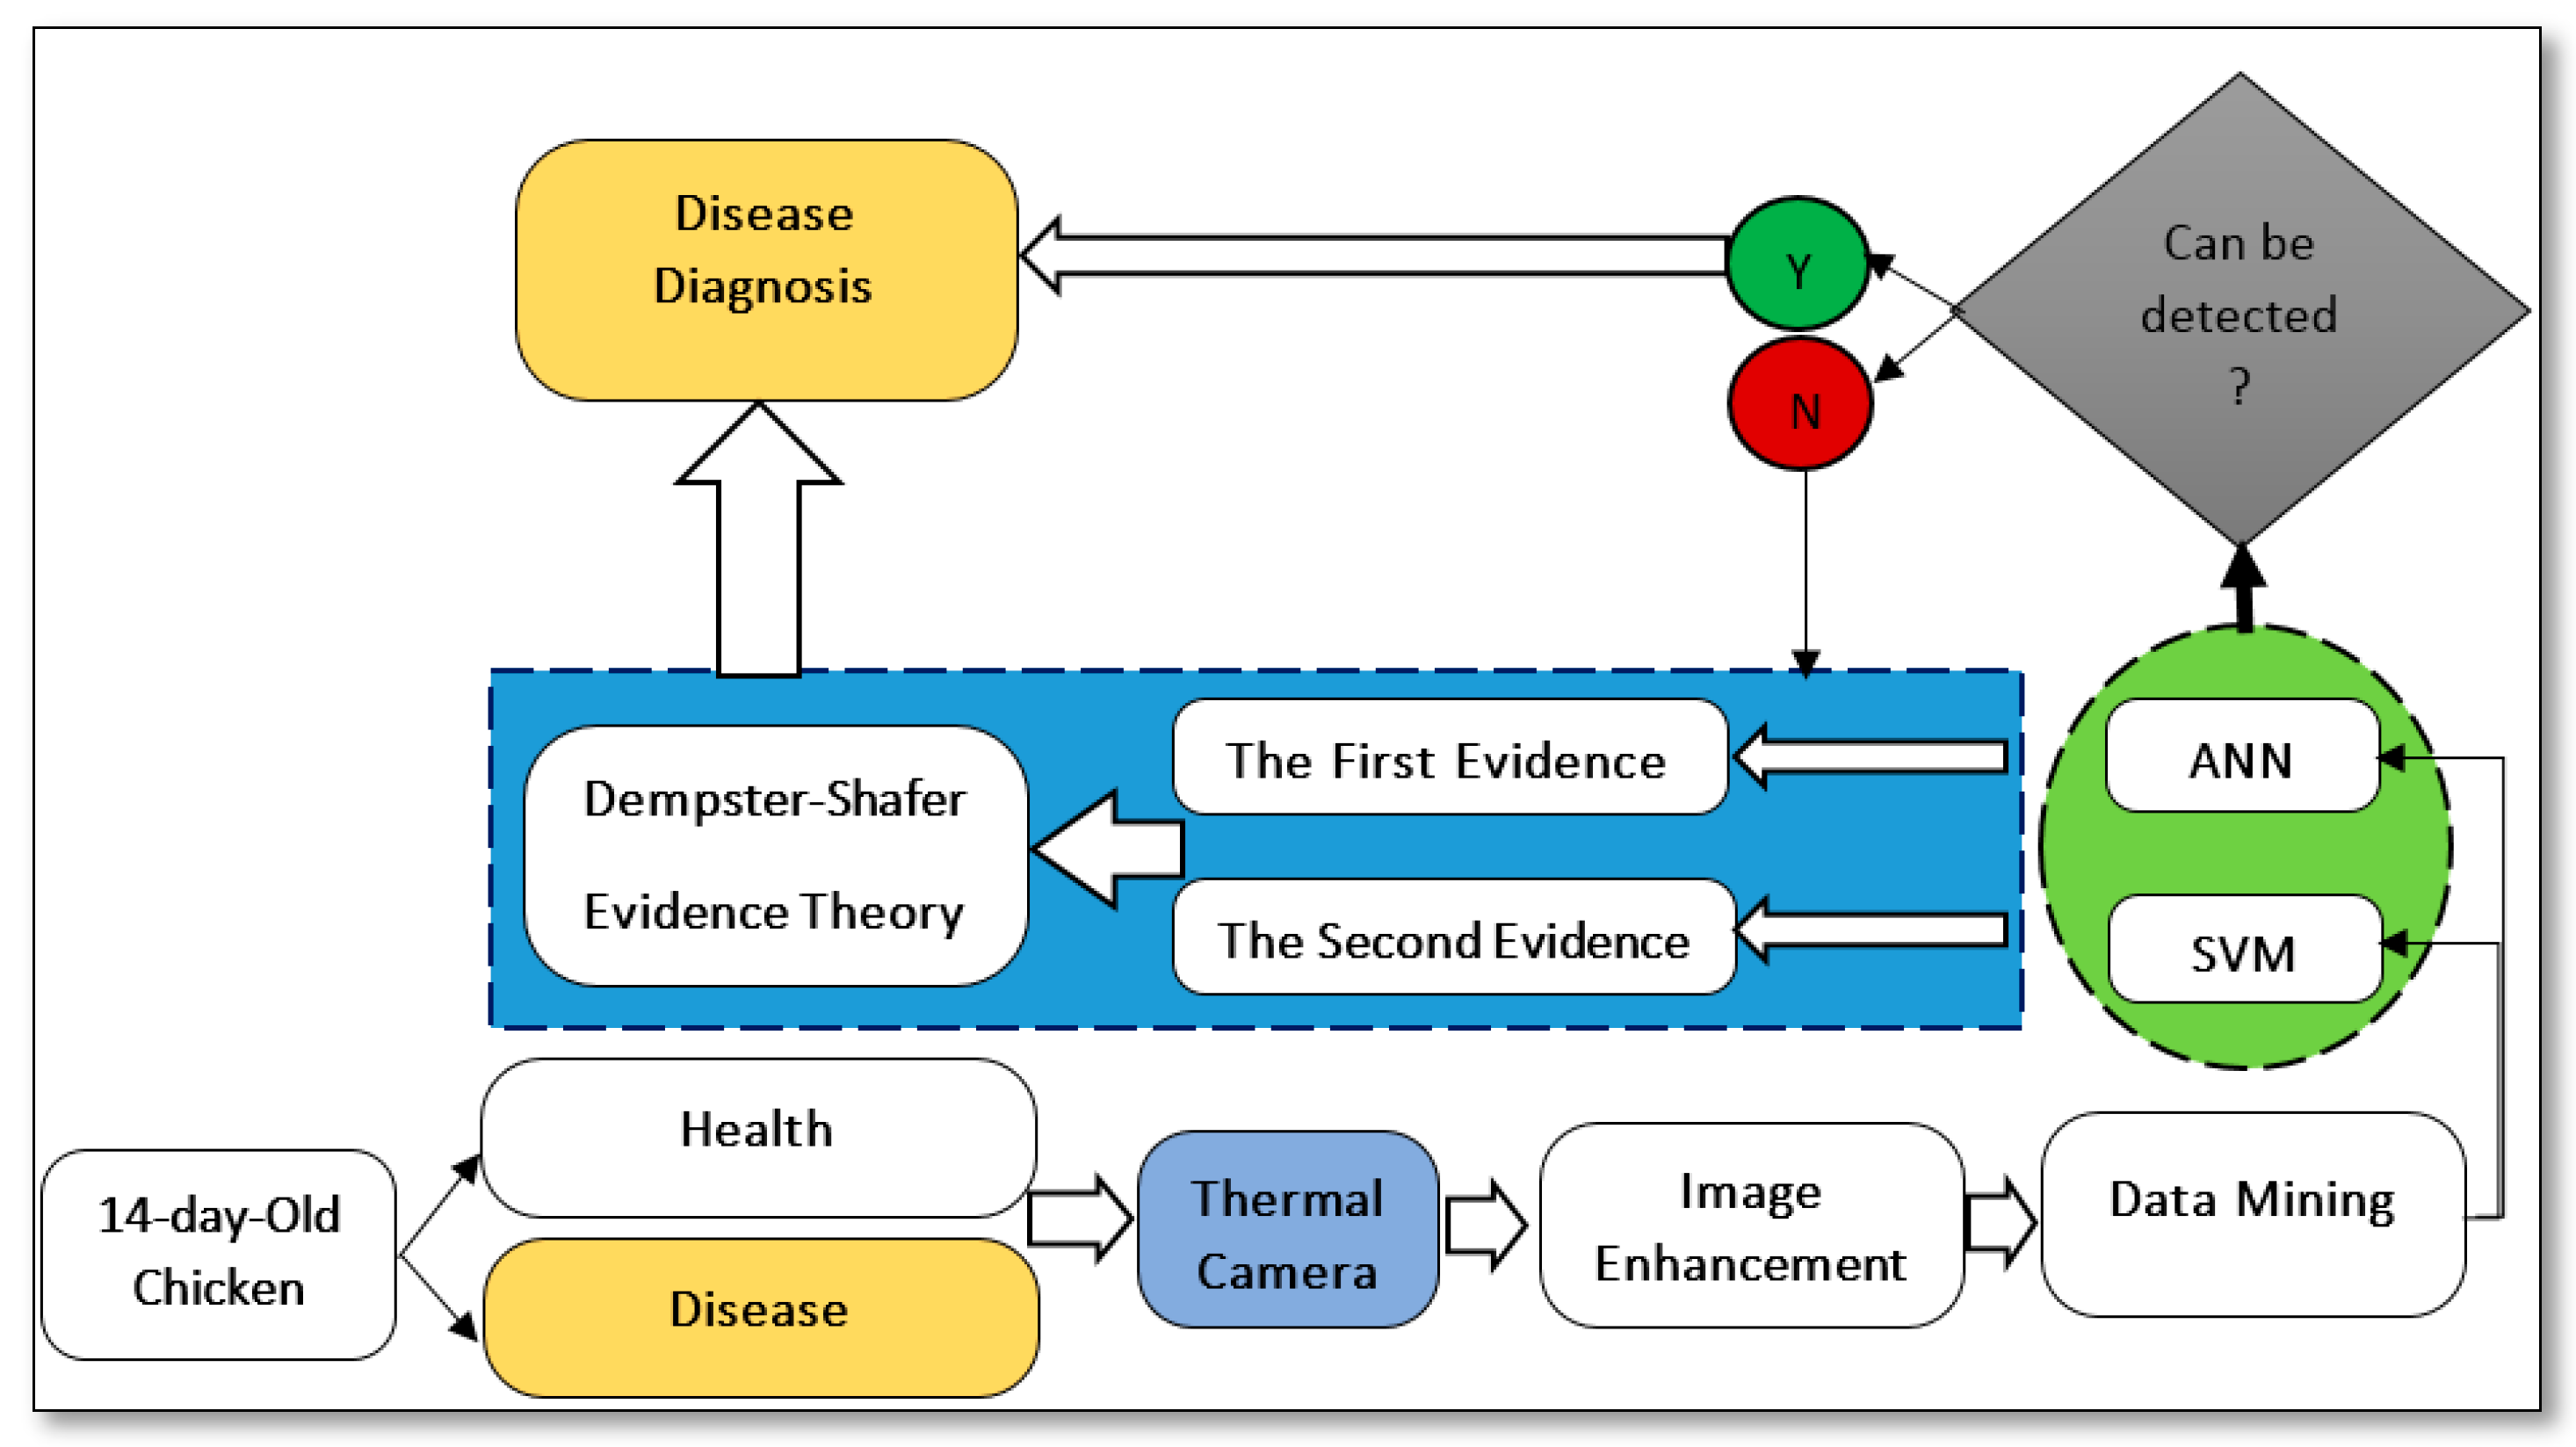
The proposed algorithm framework to identify avian diseases (ND and AI) based on thermal images and machine learning is shown in Figure 4. The thermal images of chickens were captured by FLIR camera and preprocessed in FLIR software and Matlab 2020 software. The preprocessing steps included de-noising, background removal, and image enhancement (erosion and dilation) using Image Region Analyzer and Image Segmenter toolbox. In the data mining step, 23 statistical features were extracted from each image, and the best features were selected. The best features were considered as inputs of the machine learning classifier (SVM and ANN). The outputs of the classifiers were improved by the Dempster–Shafer (D-S) evidence theory, after which the diseases were detected.
Deep learning-based techniques, such as convolutional neural networks, can process thermal images directly without feature extraction but require large number of images to obtain robust performance, which we did not have in this study. Instead, extracting the features from thermal images followed by classical machine learning modeling can help us better understand which features are important to gain accurate performance with small datasets. The machine learning-based methods were also GPU-free (without graphical processing units), which could be economically friendly for poultry producers as well.
2.2. Feature Extraction and Selection
The raw data contained relatively little information for classification and were not used directly as input for the classifiers. Therefore statistical features were extracted based on intensity information on thermal images. Table 1 shows the formulas for calculating the 23 statistical features, in which x(n) is the intensity for data points n on a thermal image (n = 1, 2, …, N) [27].
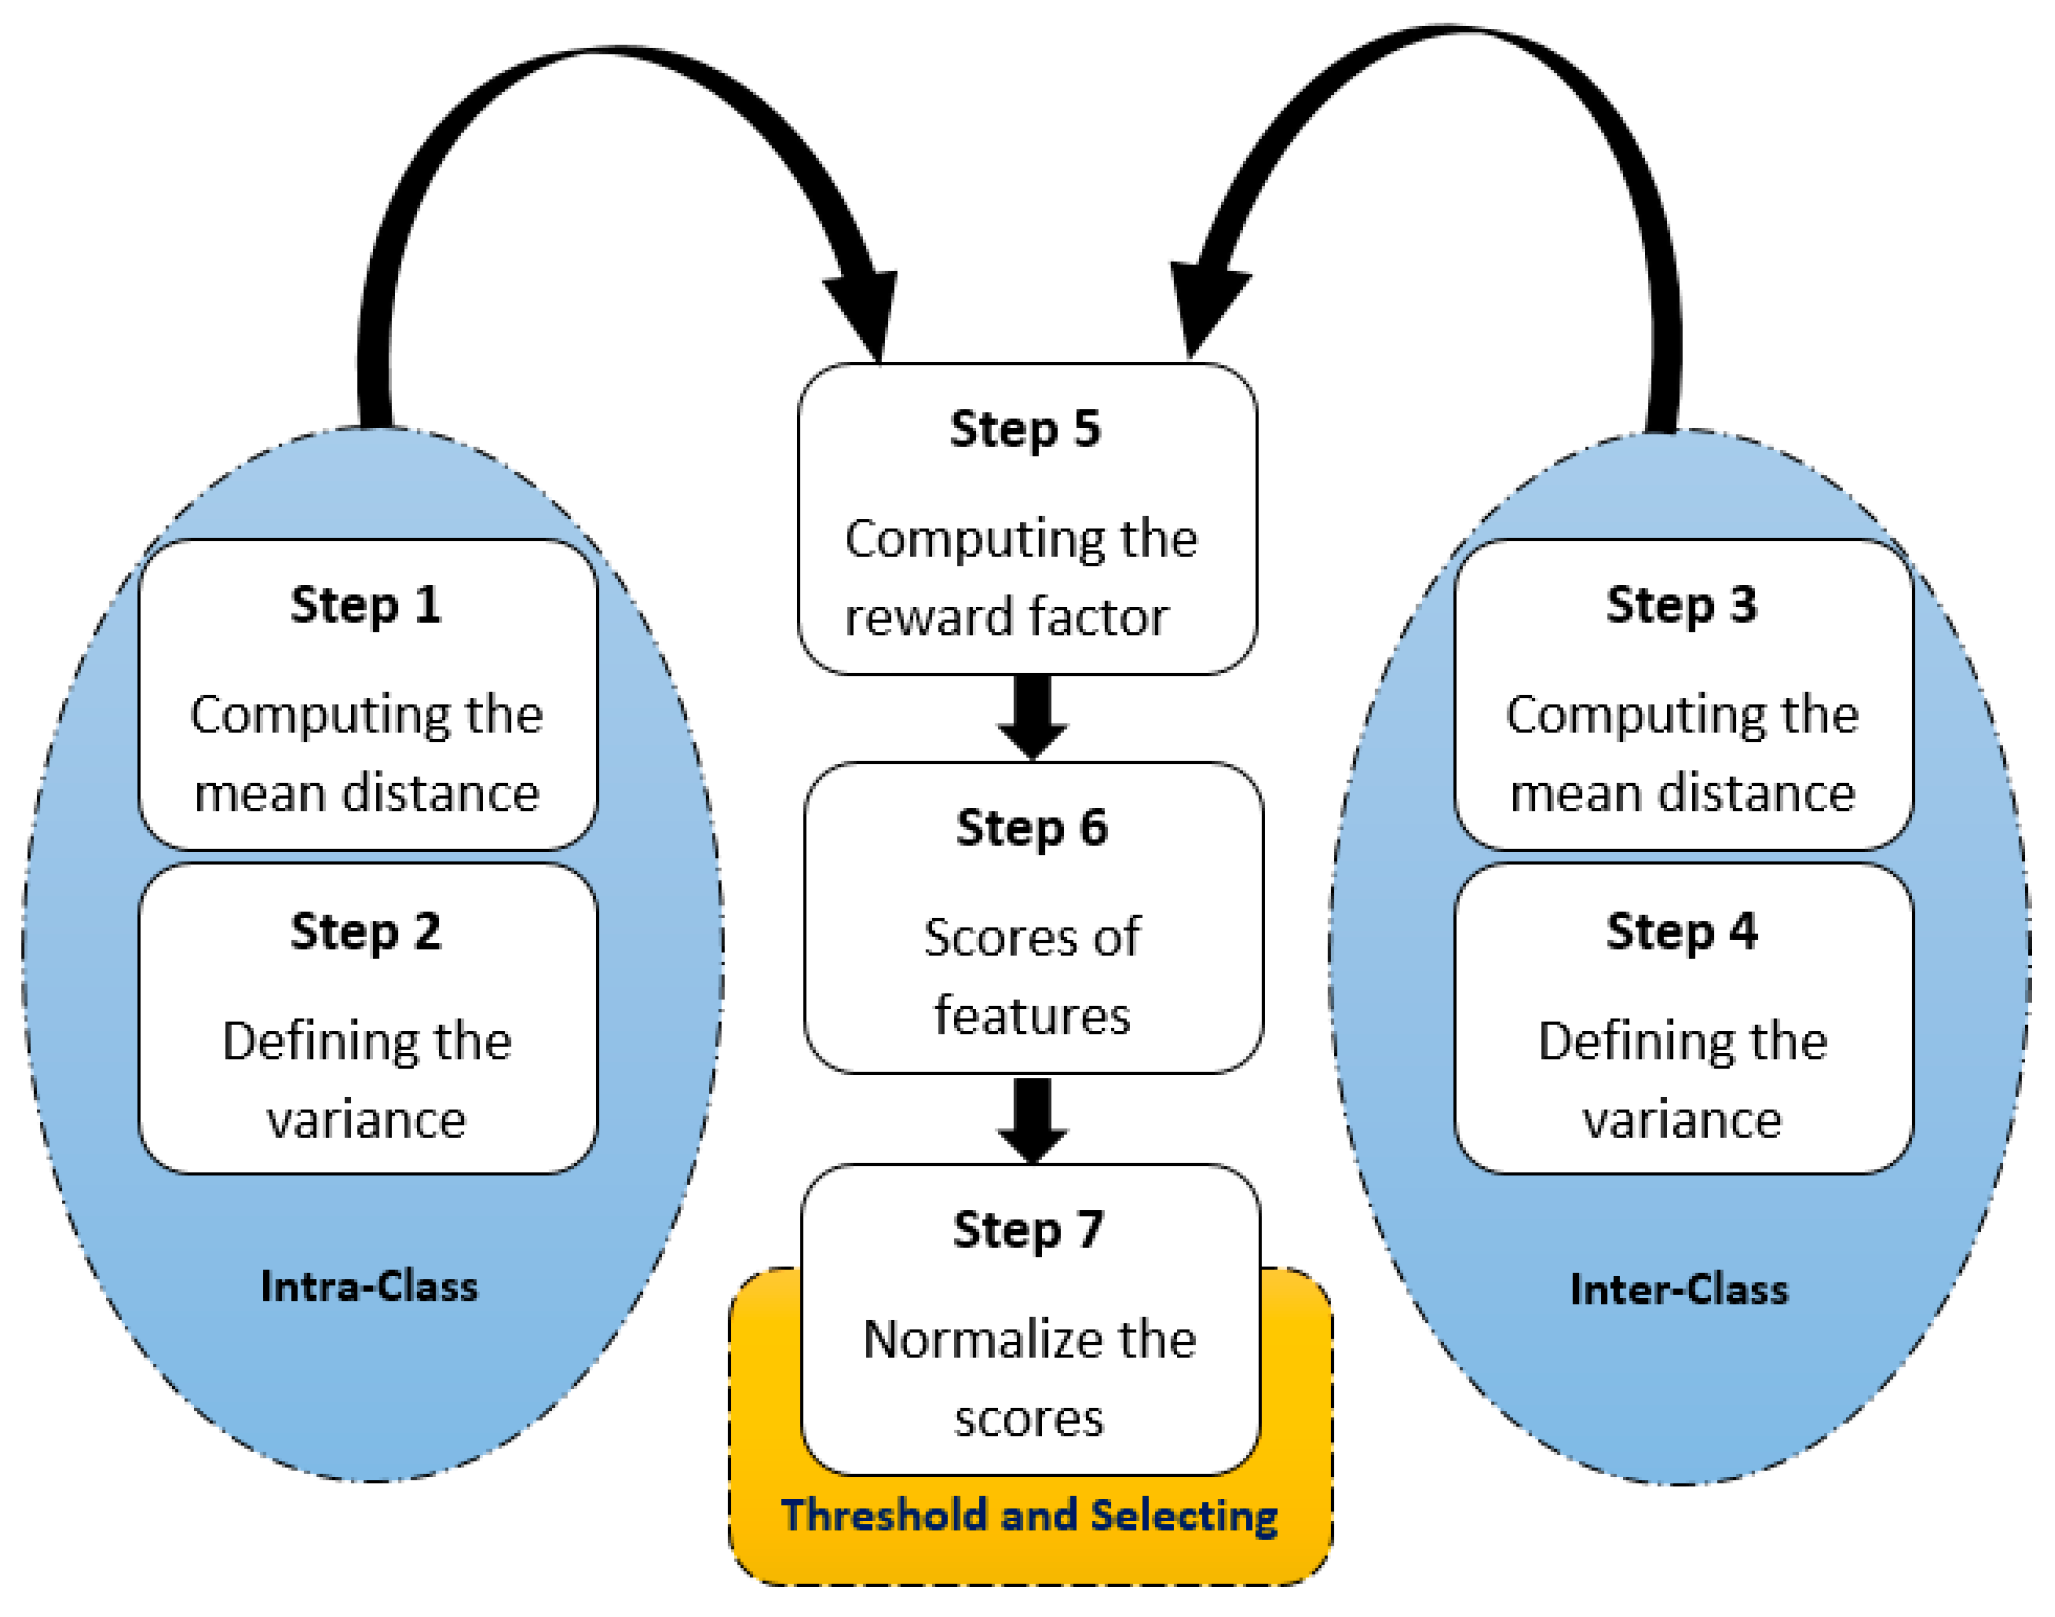
The 23 features, if all fed into the classifiers, could increase model complexity. So, the improved distance evaluation (IDE) procedure has been used for feature dimensionality reduction. Seven steps shown in Figure 5 should be conducted to execute the IDE. Firstly, the mean distance and variance must be computed for intra-class and inter-class. Then, in the fifth step, the reward factor was computed. The best features included the largest intra-class and the lowest inter-class differences. Based on that, the sixth step was to calculate the difference scores of intra-class and inter-class, which was normalized in the seventh step. Finally, the best features were selected based on an arbitrary threshold [28]. The threshold is determined in Section 3.1.
2.3. Artificial Neural Network
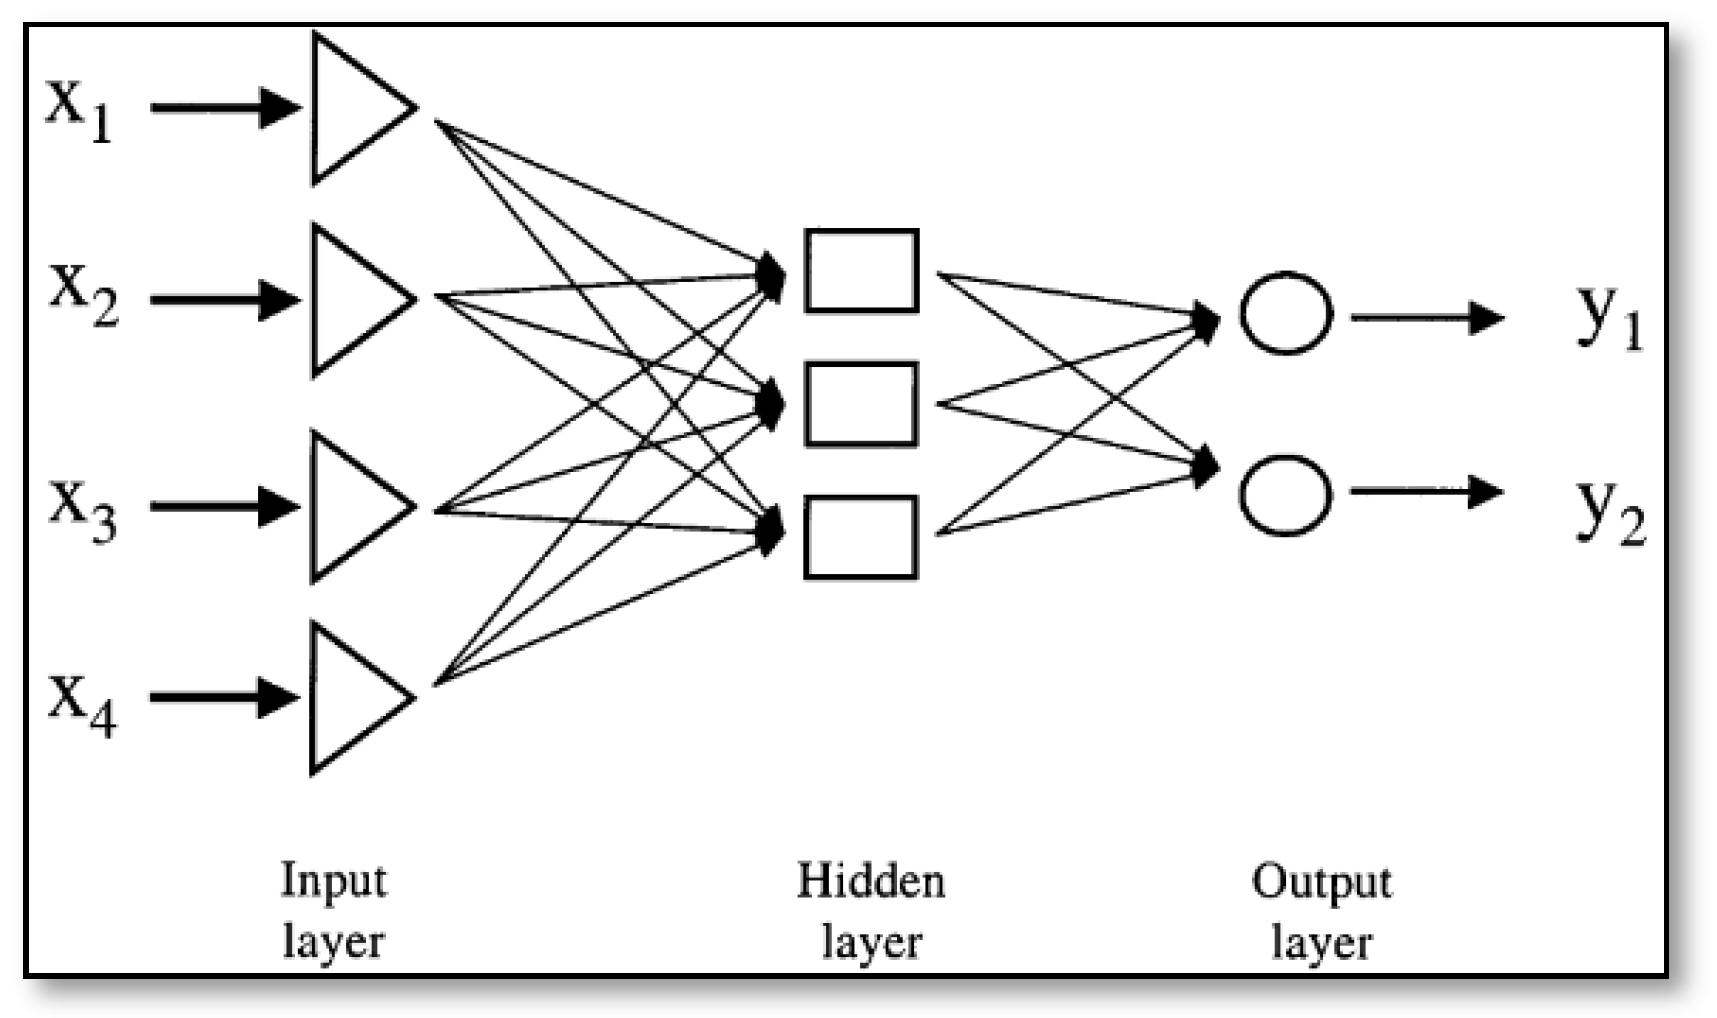
The ANNs are biologically-inspired computer programs designed to simulate the way in which a human brain processes information. The ANN included an input layer, a hidden layer, and an output layer (Figure 6). Each layer was connected with neurons, and the number of neurons in the input layer was determined by the number of the best features selected by IDE. The number of classes determined the number of neurons in the output layer, and the number of neurons in the hidden layer was decided by trial and error during model training. Various ANNs have been applied in classification, regression, and modeling [29]. The optimal ANN was used to detect avian diseases in this study.
2.4. Support Vector Machine
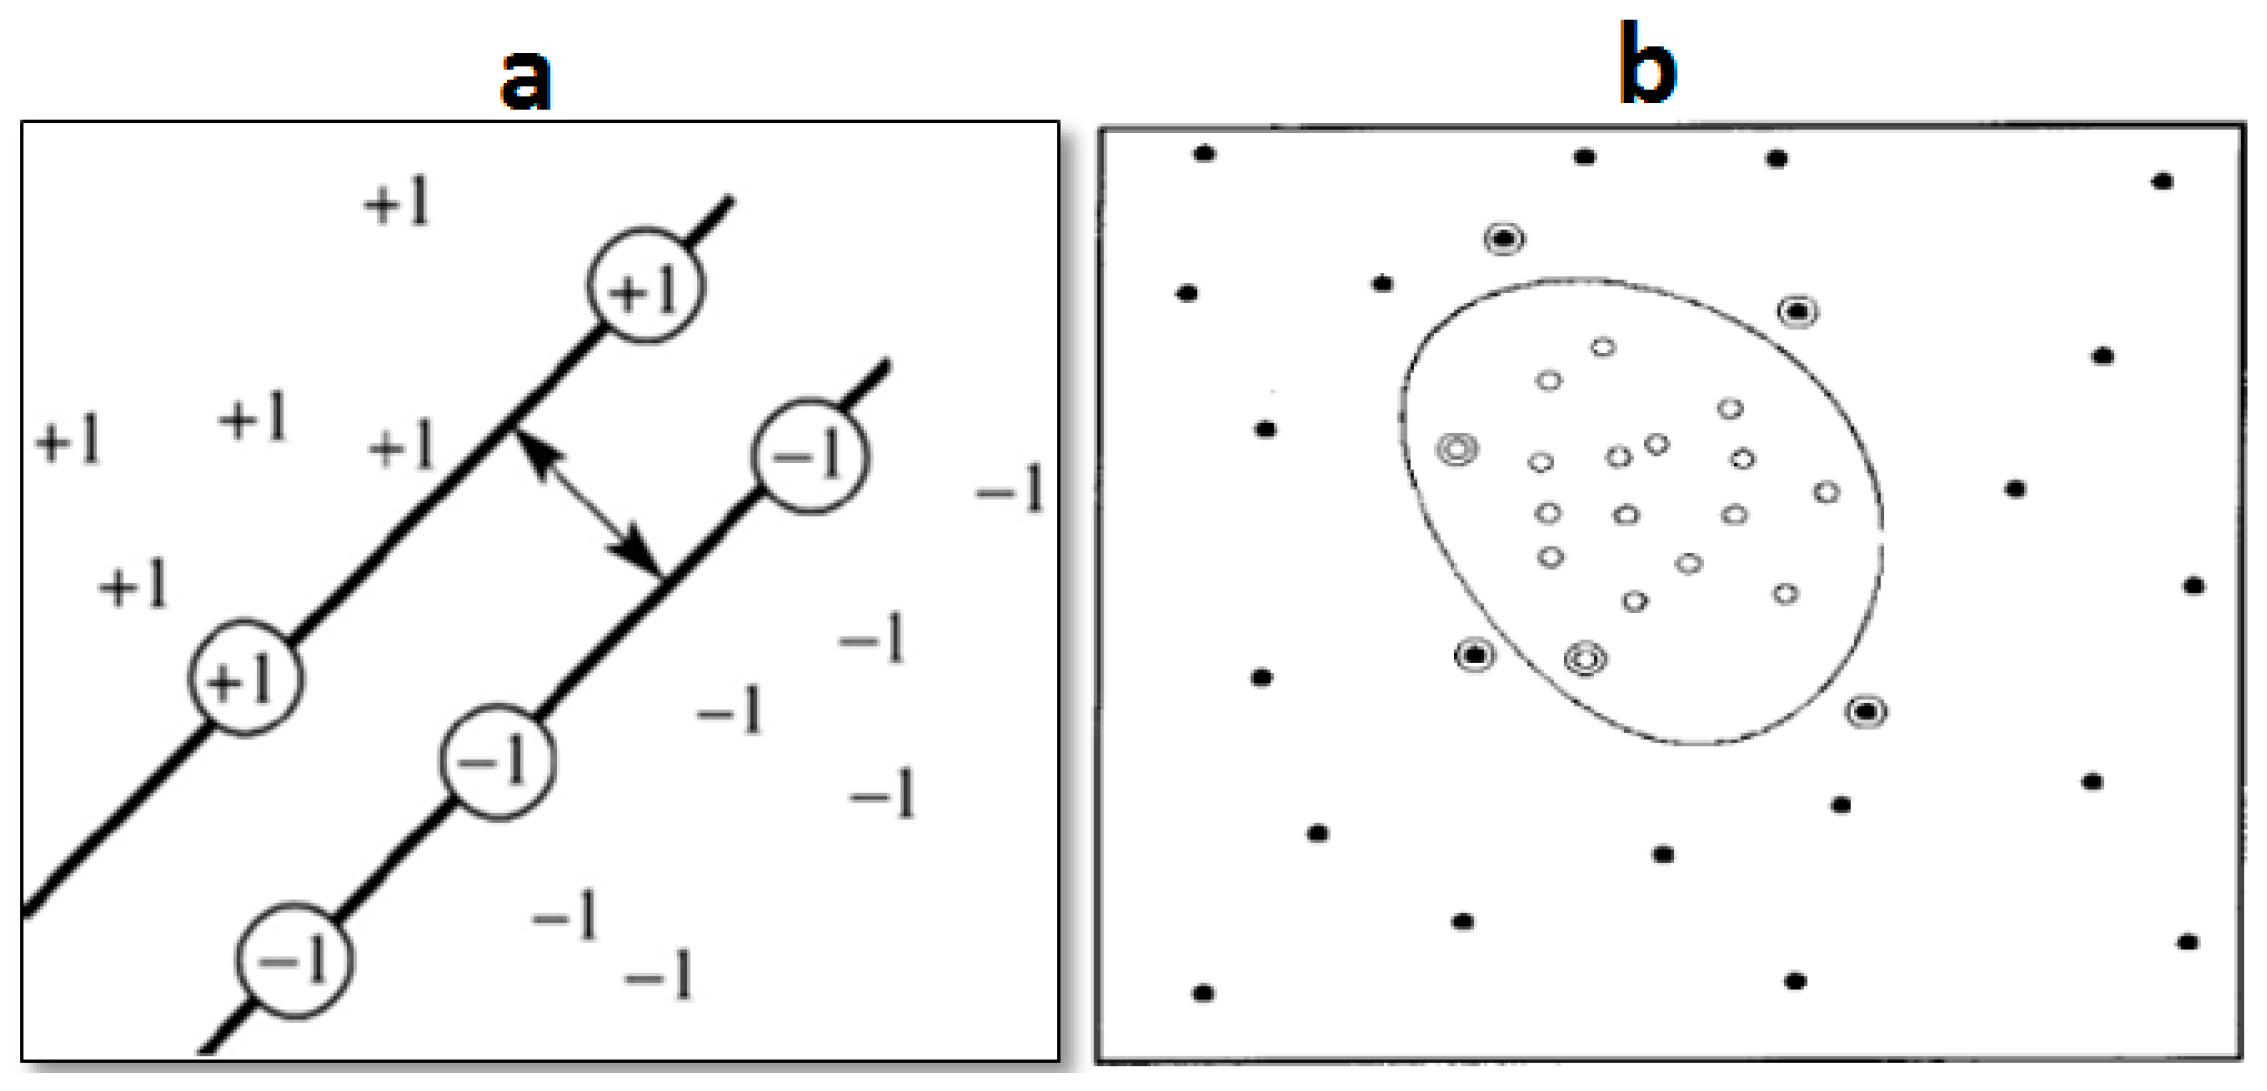
The SVM is a robust classifier first introduced by Cortes and Vapnic in 1995, building the statistical learning theory [30]. The SVM intends to maximize the margin between the two classes. Separating classes using a hypothetical hyperplane is the main idea. Some hyperplanes include the linear, quadratic, and Gaussian Radial Basic Function (RBF) [31]. Figure 7a shows the optimal margin in a linear hyperplane [32], and Figure 7b shows the RBF hyperplane [33]. The SVM was initially introduced for binary classification (two classes) and then applied to solve multiclass problems. The RBF was selected for the hyperplane in the SVM due to its optimal performance [34].
2.5. Dempster–Shafer Evidence Theory
The D-S evidence theory was first proposed by Dempster and further developed and refined by Shafer [35]. The D-S has been used in fault diagnosis [36] and disease diagnosis [27]. This theory investigates aspects connected with uncertainty and lack of knowledge and is favorable for solving real-life problems [37]. In this study, whenever ANN and SVM cannot detect the diseases with acceptable accuracy, the D-S will be used in data fusion stage.
2.6. Classifier Evaluation Metrics
The metrics to evaluate the developed models included Sensitivity, Specificity, Training, and Testing accuracy for healthy (“acc_healthy”) and unhealthy (“acc_unhealthy”) birds. True Positive, False Positive, True Negative, and False Negative are defined in Table 2 based on a confusion matrix and were calculated to determine the evaluation metrics. The calculation procedures of sensitivity, specificity, and accuracy are presented in Equations (1)–(6).
3. Results
3.1. Data-Mining Results
In this stage, 23 statistical features were extracted from all raw data collected. The AI infection group and the corresponding control group were defined as Group A; the ND infection group and the corresponding control group were defined as Group B. Each feature was scored by IDE, and the best features, which had the most scores, were selected. The outputs of IDE were used as inputs of the classifiers. Table 3 and Table 4 show the feature scores for Groups A and B, respectively. The best threshold for Group A is 0.7 because there was a significant difference between 0.7 and other lower threshold limits. A closer-to-one value indicates better feature quality for classification. So, all features with scores of 0.7 or higher were favorable for classification for Group A. Therefore, F2 (maximum), F4 (quadratic mean square), F9 (root mean square divided by the mean), F21 (the sixth central moment), and F22 (the fourth central moment divided by the square of the variance), which had the feature score of over 0.7 in all seven sections, were selected to identify the AI disease.
Based on Table 4, the best threshold for Group B was 0.8 because there was a significant difference between 0.8 and other lower threshold limits. The F2 (maximum), F3 (standard deviation), F9 (root mean square divided by the mean), F16 (Skewness), and F17 (kurtosis), which had a feature score of over 0.7 in all seven sections, were selected to identify the ND disease.
The thresholds (0.7 for Group A and 0.8 for Group B) were selected manually based on the analysis of the feature scores. For Group A, the difference between the scores for Section 3 and Section 5 does not look significant (same for Group B, Section 4). But most of the feature scores fall into the set thresholds. We wanted to keep consistent thresholds for all groups.
3.2. Classifier Performance
This study included 120 thermal images for each group. Table 5 shows the number of thermal images and data splitting for the ANN and SVM development. The data splitting for ANN was 70% for training, 15% for cross-validation, and 15% for testing. The splitting for SVM was 70% for training and 30% for testing. The classifiers were cross-validated, and the average performance was reported. The performance was also used to determine the model parameters, such as Sigma and C for SVM and the number of neurons in the hidden layer for ANN.
3.2.1. ANN Performance
As the outputs of IDE were five features for both groups of AI and ND, the number of neurons in the input layer was five, the number of neurons in the output layer was two (because each group had two classes), and the number of neurons in the hidden layer was determined as eight for AI and seven for ND based on the evaluation metric performance. Table 6 shows the ANN performance to detect the AI for all the times for data collection (sections) with the structure of 5 × 8 × 2. The testing accuracy of ANN to detect AI in Section 1 (the 8th hour after virus infection) was 70.37%, while its validation accuracy was 75.93%. Finally, this accuracy reached 100% in Section 7 (the 56th hour after virus infection). The acceptable accuracy of 92.59% was obtained in Section 4. The Specificity in Section 3 or later was 100% which means the ANN did not diagnose any True Positives (the real sickness) as healthy. The Sensitivity in Section 4 was 85.71%, indicating that the classifier cannot accurately exclude False Negative (wrongly identifying healthy birds as unhealthy).
Table 7 shows the ANN performance to detect the ND for all the times for data collection (sections) with the structure of 5 × 7 × 2. The test accuracy of ANN to detect ND was 68.52% in Section 1 and 100% in Section 5. In all sections, the specificity was higher than sensitivity which means that the main problem of ANN was to misdiagnose the healthy birds as unhealthy.
3.2.2. SVM Performance
The outputs of IDE were used as inputs of SVM. The kernel function of RBF and the solver of Sequential Minimal Optimization and Sigma (σ) of 1 were selected as key parameters for SVM (Table 8). The box constraint was 5 for AI prediction and 10 for ND classification.
Table 9 shows the SVM performance to detect the AI in all sections. The classifier obtained 97.22% testing accuracy in Section 3 (the 24th hour after virus infection). The testing accuracy dropped to 77.78% in Section 4 but rebounded to over 94% after Section 5. In comparison, the ANN achieved 100% testing accuracy in Section 4 for classifying AI. The performance discrepancy may be due to the lack of classification ability for SVM in Section 4, where the D-S evidence theory was introduced to improve AI classification accuracy. The D-S evidence theory is applied in Section 3.3.
Table 10 shows the SVM performance to detect the ND in all sections. In Section 1, the overall testing accuracy was 80.56%, related to the high sensitivity (100.00%). In Section 2, the overall testing accuracy even dropped to 78.77%. Similarly, the ANN had low testing accuracy of 74.07% in identifying ND in Section 2 (Table 7). These all indicated the difficulties in accurate ND diagnosis within the 16 h of the disease infection. Parts of the reasons can be found in feature scores calculated by IDE in Table 3 and Table 4, where the feature scores in Section 2 were relatively lower than those in other stages. Therefore, Section 2 was determined as the time point for introducing the D-S evidence theory to improve ND classification accuracy. The D-S evidence theory is applied in Section 3.3.
In Section 3, the SVM reached 100% testing accuracy. In other sections, the performance of Specificity and Sensitivity fluctuated. These could be attributed to the natural regulation of bird body temperature at different hours of the day. The body temperature was the lowest at 1 am, gradually increased until 8 am, dropped until 12 pm, reached maximum from 12 pm to 6 pm, and then dropped again until 1 am. The data collection started at 8 am in Section 1, at 4 pm in Section 2, and at 12 pm in Section 3. In Section 2, both healthy and unhealthy birds increased their body temperature, causing temperature similarities in the thermal images and subsequent poor classification performance. Meanwhile, the virus may not spread fully inside the bird’s body, making the unhealthy birds indistinguishable from healthy birds.
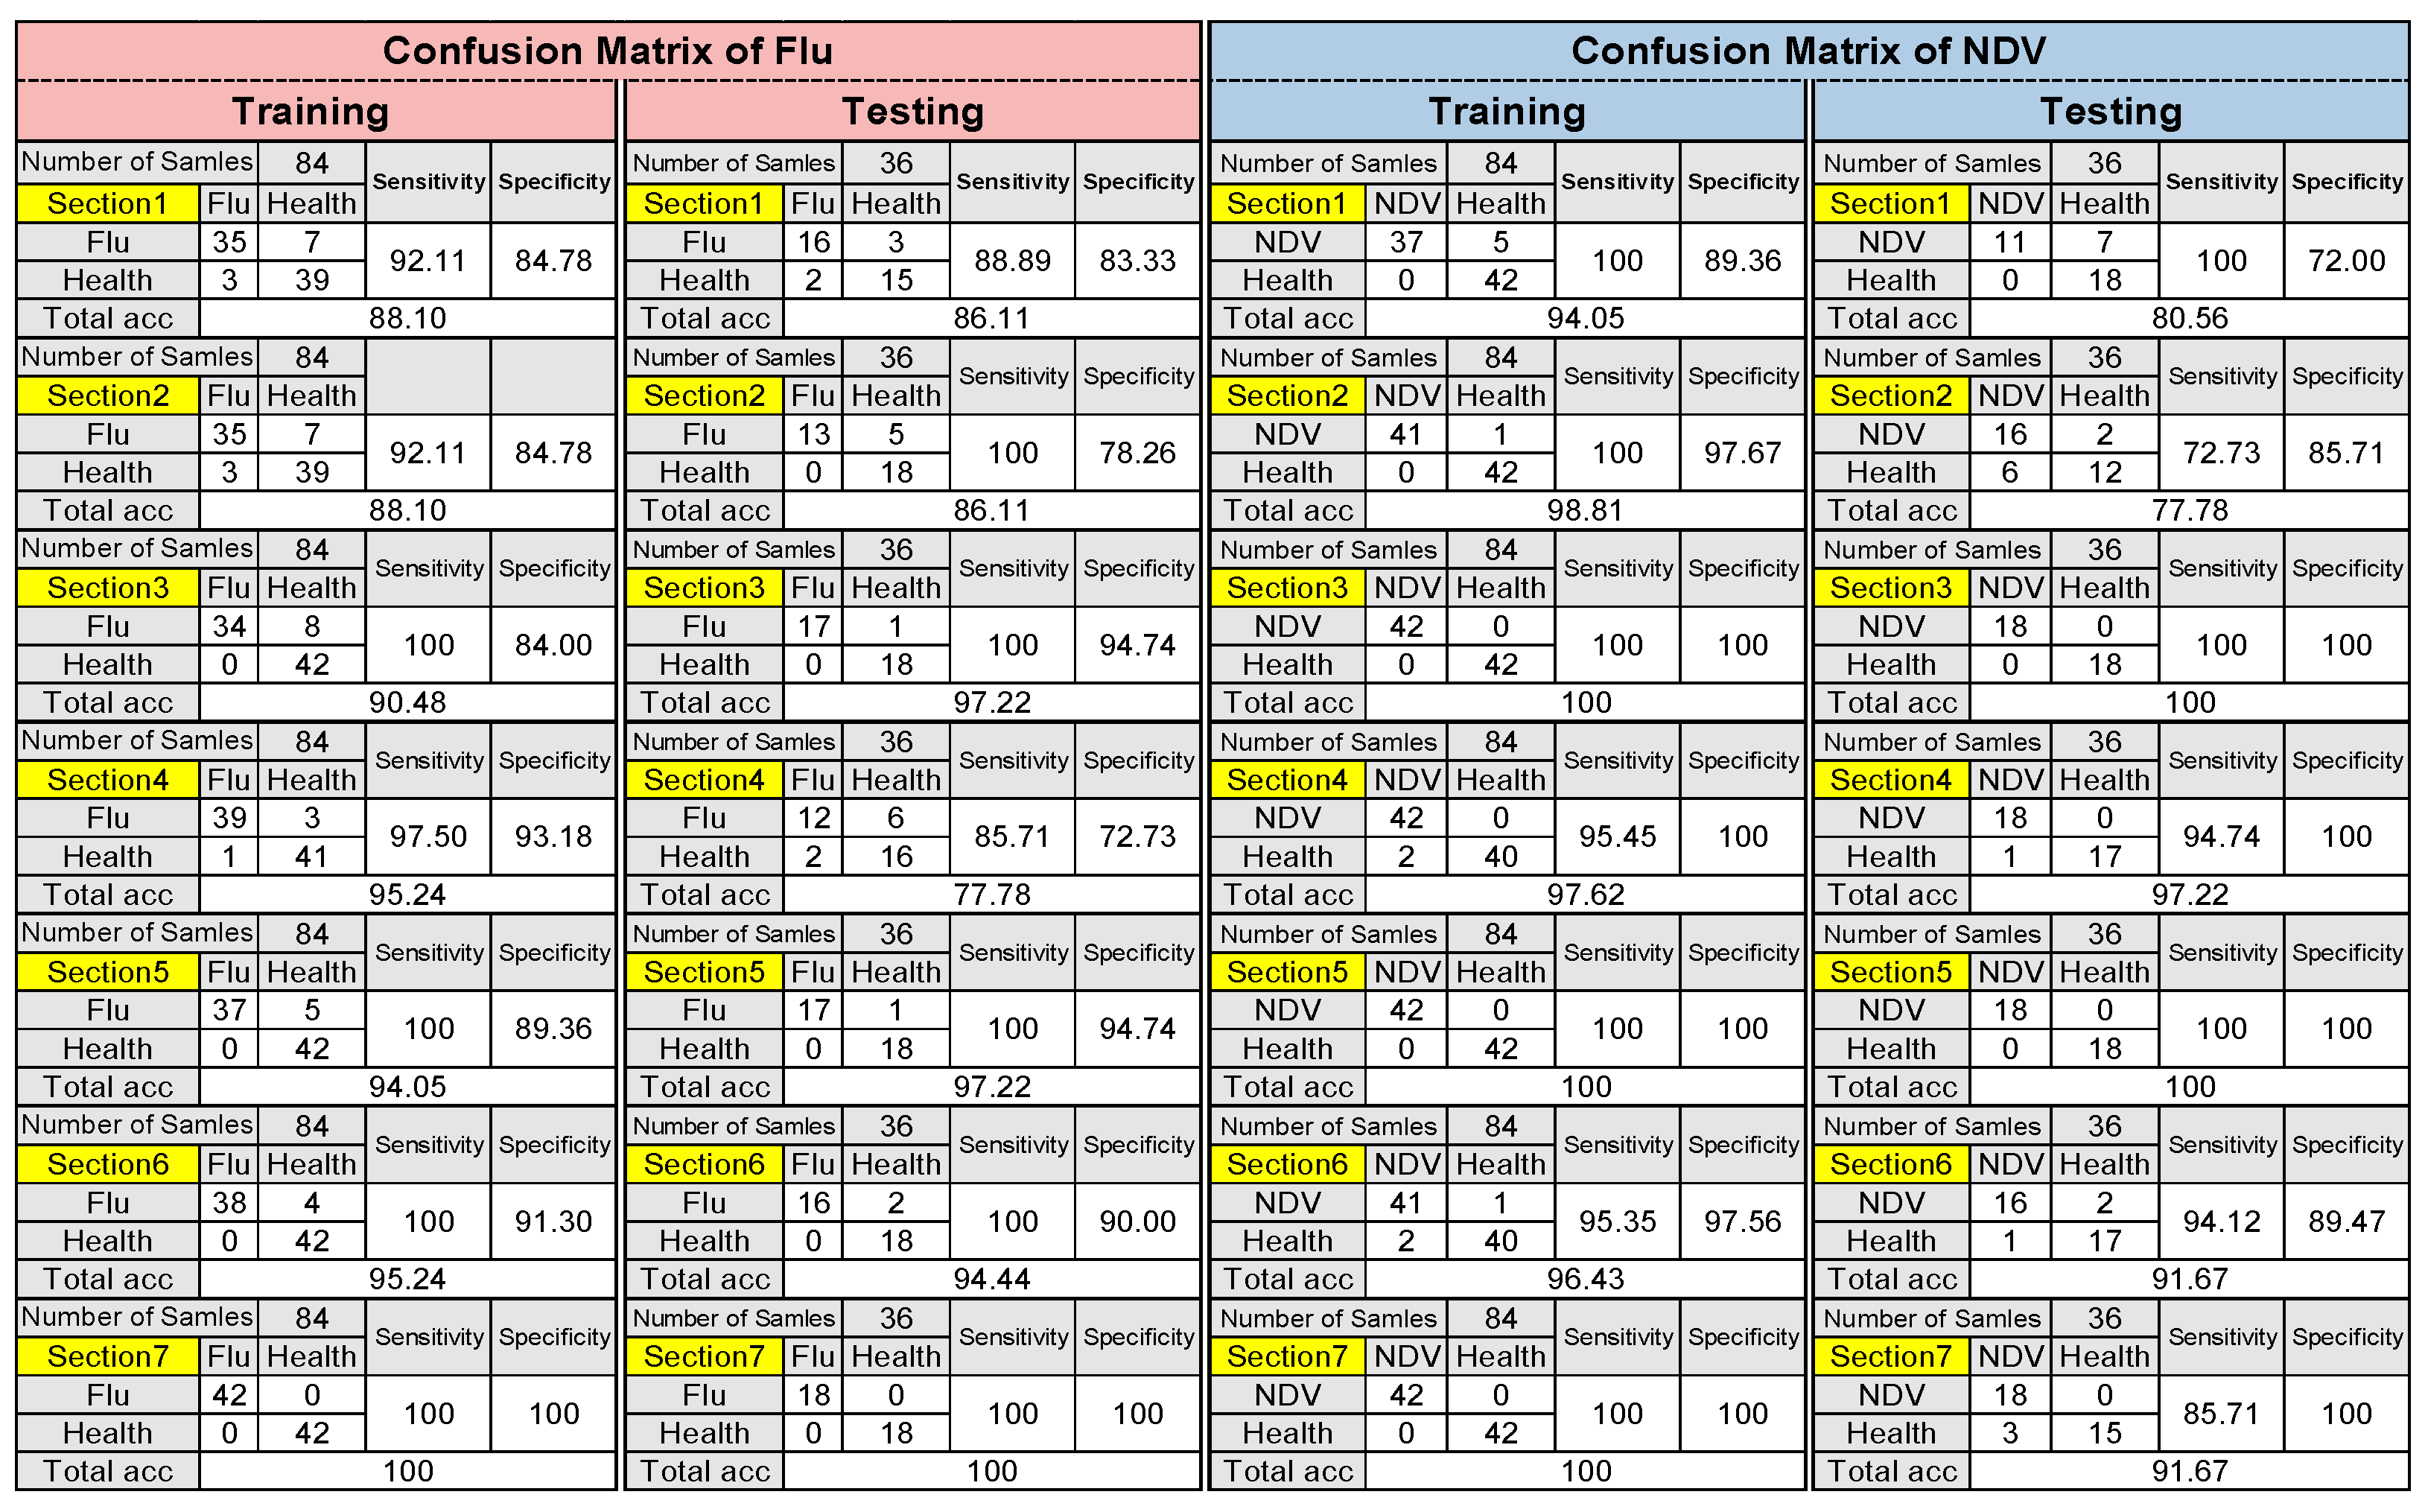
Since the SVM outperformed the ANN, it was selected for further analysis, and the confusion matrix for classifying the two diseases in all sections is presented in Figure 8. The table contains information such as sensitivity, specificity, and overall accuracy of the SVM in both the training and testing stages. In Section 4, the Sensitivity and Specificity were reported as 85.71 and 72.73%, respectively, and SVM wrongfully classified 6 Flu out of 18 as healthy and 2 healthy out of 18 as Flu. On the other hand, In Section 2, the Sensitivity and Specificity were reported as 72.73 and 85.71 percent, respectively, and SVM wrongly classified 2 ND out of 18 as healthy and 6 healthy out of 18 as ND.
3.3. Data Fusion Results
As mentioned earlier, whenever ANN and SVM cannot detect the disease with acceptable accuracy, the D-S was used as the data fusion stage. According to the references reviewed in this study, the performance was acceptable when its value was over 80%. The set acceptable performance varies among studies. In Section 3.2, the classifiers had problems detecting AI in Section 4 and ND in Section 2, where the D-S should be introduced. Table 11 and Table 12 show the results of data fusion to identify AI in Section 4 and ND in Section 2 with Dempster–Shafer evidence theory, respectively.
Based on Table 11, the specificity increased from 72.73% (Table 9) to 100%; and the sensitivity increased from 85.71% (Table 9) to 98.15%; the performance of AI classification via SVM in Section 4 has been improved with D-S evidence theory. Based on Table 13, the Sensitivity increased from 72.73% (Table 10) to 82.90%; the Specificity increased from 85.71% (Table 10) to 96.35%; and the performance of ND classification via SVM in Section 2 has been improved with D-S evidence theory.
4. Discussion
In general, the SVM outperformed the ANN in identifying chickens infected with AI with higher sensitivity and testing accuracy. For example, the testing accuracy of AI in Section 1 was 86.11% for SVM (Table 9) and 70.37% for ANN (Table 6). This indicates that the SVM may do a better job in alerting producers if birds were infected with AI within the first 8 h of infection, which helps producers take early intervention and reduce economic loss. SVM did better when the input was the features extracted from raw data. But that does not mean SVM outperforms ANN in any classification tasks. Model comparison and tuning are still required to determine the optimal model for specific tasks.
According to Table 7, the performance of ANN to detect ND reduced after Section 5, but this problem was solved by SVM, as indicated in Table 10. Furthermore, in Section 4, the accuracy of the ANN was very low (Table 7), while the SVM obtained over 90% testing accuracy in this section (Table 10). The low accuracy of ANN was related to the inability of this classifier to distinguish ND in Section 4. Other researchers have also confirmed that the SVM performed better than the ANN in poultry disease classification issues. Okinda et al. (2019) compared SVM and ANN for classifying Newcastle disease, and the RBF-SVM, Cubic_SVM, and ANN had 97.8%, 97.1%, and 96.9%, respectively [18]. This topic has also been confirmed in other fields like mechanical faults diagnosis. Kankar et al. (2011) compared SVM and ANN for classifying ball bearings; the SVM had 73.97% and the ANN had 71.23% [38].
Based on Table 11 and Table 12, the classification performance of AI and ND in Sections 4 and 2 was improved by D-S evidence theory. These results agreed with previous research [39,40]. Banakar et al. (2016) developed an intelligent device for diagnosing avian disease based on vocalization and signal processing. In their study, the accuracy of SVM increased from 83.33% to 91.15% after using the D-S evidence theory [27]. Khazaee et al. (2012) presented data fusion methodology by using ANN and SVM classifiers to distinguish between vibration conditions of planetary gears. They showed that the accuracy of the classifiers increases by more than 14% when using D-S evidence [41].
A summary of the SVM performance to diagnose AI and ND is shown in Table 13, which was based on predicting AI in Section 4 and ND in Section 2 with D-S evidence theory. Based on the proposed method in this study, which was based on thermal images and machine learning, the AI and ND can be detected within 24 h after virus infection (Section 3). The SVM may provide an alarm about the presence of the virus even within the first 8 h (Section 1), but reporting accuracy was below 90%, which may result in False Positives and False Negatives for producers, further degrading the confidence of producers in using the product. The best way was to continuously collect the reporting results and gain more confidence before sending a valid alarm within the first 24 h.
Previous research also investigated avian disease detection via machine learning. Sadeghi et al. (2015) identified and classified the chickens infected with Clostridium Perfringens based on vocalization signals and ANN [42]. Banakar et al. (2016) diagnosed avian diseases using signal processing and SVM, and the system achieved an accuracy of 91.15% in classifying the disease within 48 h after virus infection [27]. Okinda e al. (2019) used machine vision systems to diagnose avian diseases. They infected the chickens with ND and classified the disease with a 97% accuracy on the 4th day after virus infection using RBF-SVM. The parameters of this study were optimized based on the appearance and physical characteristics of the bird body [21]. Overall, our study can provide earlier alarms of disease infection with decent accuracy than the previous studies, indicating the great potential of the combined technique (thermography for data collection and machine learning for data analytics) in this space.
Our dataset was relatively small, with 1680 images in seven sections (240 thermal images per section). However, the disease challenge experiments are typically expensive, and this study serves as the first trial for verifying the possibility of the combined techniques for disease diagnosis. More data should be collected to consolidate the results. We did not expect to develop a viable system that can be directly applied in commercial farms. It is unrealistic to infect birds with avian influenza and Newcastle disease in commercial farms to collect the data for system development, as that can damage producers’ profits and create the risks of disease spreading. Therefore, most of the disease challenge experiments are run cautiously in experimental labs with strict biosecurity control, which could result in small datasets, separated bird housing, and close-distance data collection. These are all future directions for system improvement.
5. Conclusions
This study investigated the performance of using thermography and machine learning to classify Avian Influenza and Newcastle Disease for 14-day-old broilers. After a series of optimizations (e.g., parameter tuning and model comparison), the Support Vector Machine with Dempster–Shafer Evidence Theory outperformed the Artificial Neural Networks and successfully classified the two diseases within 24 h after virus infection, with 100% sensitivity, over 94% specificity, and over 97% testing accuracy. It is concluded that thermography combined with machine learning is a useful tool for timely disease prediction, which can be properly utilized to set early alarms and reduce producer economic losses.
Author Contributions
Conceptualization, M.S., A.B. and G.L.; methodology, M.S.; software, M.S.; validation, M.S., A.B. and S.M.; formal analysis, M.S.; investigation, G.L. and M.O.; resources, A.S.; data curation, M.S.; writing—original draft preparation, M.S.; writing—review and editing, A.B., S.M. and G.L.; supervision, A.B.; project administration, A.B.; funding acquisition, A.B and G.L. All authors have read and agreed to the published version of the manuscript.
Funding
Partial funding of this work was supported by federal and state funds allocated to the University of Georgia. The authors would like to thank the ‘Iranian National Science Foundation’ for financial support of PhD project with grant number 98012001.
Institutional Review Board Statement
The animal study protocol was approved by the Research Ethics Committees of Tarbiat Modares University (protocol # IR.MODARES.REC.1400.263—22/01/03).
Informed Consent Statement
Not applicable.
Data Availability Statement
Data is contained within the article.
Conflicts of Interest
The authors declare no conflict of interest. The funders had no role in the design of the study; in the collection, analyses, or interpretation of data; in the writing of the manuscript; or in the decision to publish the results.
References
- Tsiouris, V.; Georgopoulou, I.; Batzios, C.; Pappaioannou, N.; Ducatelle, R.; Fortomaris, P. High stocking density as a predisposing factor for necrotic enteritis in broiler chicks. Avian Pathol. 2015, 44, 59–66. [Google Scholar] [CrossRef] [PubMed] [Green Version]
- Available online: https://www.aphis.usda.gov/aphis/ourfocus/animalhealth/animal-disease-information/avian/avian-influenza/hpai-2022/2022-hpai-commercial-backyard-flocks (accessed on 7 July 2023).
- Hinrichs, J.; Sims, L.; McLeod, A. Some direct costs of control for avian influenza. In Proceedings of the 11th International Society for Veterinary Epidemiology and Economics (ISVEE), Cairns, Australia, 6–11 August 2006. [Google Scholar]
- Laurence, J.C. Hepatitis A and B immunizations of individuals infected with human immunodeficiency virus. Am. J. Med. 2005, 118, 75–83. [Google Scholar] [CrossRef] [PubMed]
- Rizwan, M.; Carroll, B.T.; Anderson, D.V.; Daley, W.; Harbert, S.; Britton, D.F.; Jackwood, M.W. Identifying rale sounds in chickens using audio signals for early disease detection in poultry. In Proceedings of the 2016 IEEE Global Conference on Signal and Information Processing (GlobalSIP), Washington, DC, USA, 7–9 December 2016; IEEE: New York, NY, USA, 2016; pp. 55–59. [Google Scholar]
- Wu, D.; Cui, D.; Zhou, M.; Ying, Y. Information perception in modern poultry farming: A review. Comput. Electron. Agric. 2022, 199, 107131. [Google Scholar] [CrossRef]
- Costa, A.; Ismayilova, G.; Borgonovo, F.; Leroy, T.; Berckmans, D.; Guarino, M. The use of image analysis as a new approach to assess behaviour classification in a pig barn. Acta Vet. Brno 2013, 82, 25–30. [Google Scholar] [CrossRef] [Green Version]
- Halachmi, I.; Metz, J.H.M.; Land, A.V.; Halachmi, S.; Kleijnen, J.P.C. Case study: Optimal facility allocation in a robotic milking barn. Trans. ASAE 2002, 45, 1539. [Google Scholar] [CrossRef] [Green Version]
- Ismayilova, G.; Costa, A.; Fontana, I.; Berckmans, D.; Guarino, M. Labelling the Behaviour of Piglets and Activity Monitoring from Video as a Tool of Assessing Interest in Different Environmental Enrichments/Oznaczanie zachowania i monitorowanie aktywności prosiąt na podstawie zapisu wideo jako narzędzie oceny ich zainteresowania różnymi elementami wzbogacającymi środowisko. Ann. Anim. Sci. 2013, 13, 611–621. [Google Scholar]
- Fontana, I.; Tullo, E.; Butterworth, A.; Guarino, M. An innovative approach to predict the growth in intensive poultry farming. Comput. Electron. Agric. 2015, 119, 178–183. [Google Scholar] [CrossRef] [Green Version]
- Aydin, A.; Bahr, C.; Berckmans, D. A relational study of gait score with resting behaviours of broiler chickens. In Proceedings of the Precision Livestock Farming 2013-Papers Presented at the 6th European Conference on Precision Livestock Farming, ECPLF 2013, Leuven, Belgium, 10–12 September 2013. [Google Scholar]
- Cuan, K.; Zhang, T.; Li, Z.; Huang, J.; Ding, Y.; Fang, C. Automatic Newcastle disease detection using sound technology and deep learning method. Comput. Electron. Agric. 2022, 194, 106740. [Google Scholar] [CrossRef]
- Gonzalez, J.J.; Nasirahmadi, A.; Knierim, U. Automatically Detected Pecking Activity in Group-Housed Turkeys. Animals 2020, 10, 2034. [Google Scholar] [CrossRef]
- Yavari, M.; Banakar, A.; Sharafi, M. Sound Signals Processing of Roosters for Sexual Maturity and Puberty Diagnosis. J. Agric. Mach. 2020, 10, 265–271. [Google Scholar]
- Manteuffel, G.; Puppe, B.; Schön, P.C. Vocalization of farm animals as a measure of welfare. Appl. Anim. Behav. Sci. 2004, 88, 163–182. [Google Scholar] [CrossRef]
- Tefera, M. Acoustic signals in domestic chicken (Gallus gallus): A tool for teaching veterinary ethology and implication for language learning. Ethiop. Vet. J. 2012, 16, 77–84. [Google Scholar] [CrossRef] [Green Version]
- Mavrikakis, N.C.; Mikropoulos, P.; Siderakis, K.; Pellas, I.; Thalassinakis, E. Evaluation of the damage caused by bird pecking activity along composite high voltage insulators. In Proceedings of the 2018 IEEE International Conference on High Voltage Engineering and Application (ICHVE), Athens, Greece, 10–13 September 2018; IEEE: New York, NY, USA, 2018; pp. 1–4. [Google Scholar]
- Jones, R.; Carmichael, N.L. Carmichael. Pecking at string by individually caged, adult laying hens: Colour preferences and their stability. Appl. Anim. Behav. Sci. 1998, 60, 11–23. [Google Scholar] [CrossRef]
- Minna, B.; Zhang, T.; Zhuang, X.; Jiao, P. Recognition method of sick yellow feather chicken based on head features. Nongye Jixie Xuebao/Trans. Chin. Soc. Agric. Mach. 2018, 49. [Google Scholar]
- Zhuang, X.; Bi, M.; Guo, J.; Wu, S.; Zhang, T. Development of an early warning algorithm to detect sick broilers. Comput. Electron. Agric. 2018, 144, 102–113. [Google Scholar] [CrossRef]
- Okinda, C.; Lu, M.; Liu, L.; Nyalala, I.; Muneri, C.; Wang, J.; Zhang, H.; Shen, M. A machine vision system for early detection and prediction of sick birds: A broiler chicken model. Biosyst. Eng. 2019, 188, 229–242. [Google Scholar] [CrossRef]
- Akomolafe, O.P.; Medeiros, F.B. Image Detection and Classification of Newcastle and Avian Flu Diseases Infected Poultry Using Machine Learning Techniques. Univ. Ib. J. Sci. Log. ICT Res. 2021, 6, 121–131. [Google Scholar]
- Wang, J.; Shen, M.; Liu, L.; Xu, Y.; Okinda, C. Recognition and classification of broiler droppings based on deep convolutional neural network. J. Sens. 2019, 2019, 3823515. [Google Scholar] [CrossRef] [Green Version]
- Dunbar, M.R.; Johnson, S.R.; Rhyan, J.C.; McCollum, M. Use of infrared thermography to detect thermographic changes in mule deer (Odocoileus hemionus) experimentally infected with foot-and-mouth disease. J. Zoo Wildl. Med. 2009, 40, 296–301. [Google Scholar] [CrossRef] [Green Version]
- Dunbar, M.R.; MacCarthy, K.A. Use of infrared thermography to detect signs of rabies infection in raccoons (Procyon lotor). J. Zoo Wildl. Med. 2006, 37, 518–523. [Google Scholar] [CrossRef] [Green Version]
- Capua, I.; Alexander, D.J. (Eds.) Avian Influenza and Newcastle Disease: A Field and Laboratory Manual; Springer Science & Business Media: Berlin/Heidelberg, Germany, 2009. [Google Scholar]
- Banakar, A.; Sadeghi, M.; Shushtari, A. An intelligent device for diagnosing avian diseases: Newcastle, infectious bronchitis, avian influenza. Comput. Electron. Agric. 2016, 127, 744–753. [Google Scholar] [CrossRef] [PubMed]
- Lei, Y.; He, Z.; Zi, Y. A new approach to intelligent fault diagnosis of rotating machinery. Expert Syst. Appl. 2008, 35, 1593–1600. [Google Scholar] [CrossRef]
- Guo, G.; Wang, H.; Bell, D.; Bi, Y.; Greer, K. Basic concepts of artificial neural network (ANN) modeling and its application in pharmaceutical research. J. Pharm. Biomed. Anal. 2000, 22, 717–727. [Google Scholar]
- Cortes, C.; Vapnik, V. Support-vector networks. Mach. Learn. 1995, 20, 273–297. [Google Scholar] [CrossRef]
- Joachims, T. Text categorization with support vector machines: Learning with many relevant features. In Proceedings of the European Conference on Machine Learning, Chemnitz, Germany, 21–23 April 1998; Springer: Berlin/Heidelberg, Germany; pp. 137–142. [Google Scholar]
- Ivanciuc, O. Applications of support vector machines in chemistry. Rev. Comput. Chem. 2007, 23, 291. [Google Scholar]
- Scholkopf, B.; Sung, K.-K.; Burges, C.; Girosi, F.; Niyogi, P.; Poggio, T.; Vapnik, V. Comparing support vector machines with Gaussian kernels to radial basis function classifiers. IEEE Trans. Signal Process. 1997, 45, 2758–2765. [Google Scholar] [CrossRef] [Green Version]
- Burges, C.J.C. A tutorial on support vector machines for pattern recognition. Data Min. Knowl. Discov. 1998, 2, 121–167. [Google Scholar] [CrossRef]
- Ai, L.; Wang, J.; Wang, X. Multi-features fusion diagnosis of tremor based on artificial neural network and D–S evidence theory. Signal Process. 2008, 88, 2927–2935. [Google Scholar] [CrossRef]
- Yang, B.S.; Kim, K.J. Application of Dempster–Shafer theory in fault diagnosis of induction motors using vibration and current signals. Mech. Syst. Signal Process. 2006, 20, 403–420. [Google Scholar] [CrossRef]
- Al-Ani, A.; Deriche, M. A new technique for combining multiple classifiers using the Dempster-Shafer theory of evidence. J. Artif. Intell. Res. 2002, 17, 333–361. [Google Scholar] [CrossRef]
- Kankar, P.; Sharma, S.C.; Harsha, S. Fault diagnosis of ball bearings using machine learning methods. Expert Syst. Appl. 2011, 38, 1876–1886. [Google Scholar] [CrossRef]
- Zhu, D.Q.; Yu, S.L. Data fusion algorithm based on DS evidential theory and its application for circuit fault diagnosis. Acta Electron. Sin. 2002, 30, 221. [Google Scholar]
- Ruhm, K.H. Sensor fusion and data fusion–Mapping and reconstruction. Measurement 2007, 40, 145–157. [Google Scholar] [CrossRef]
- Khazaee, M.; Ahmadi, H.; Omid, M.; Moosavian, A.; Khazaee, M. 810. Vibration condition monitoring of planetary gears based on decision level data fusion using Dempster-Shafer theory of evidence. J. Vibroeng. 2012, 14, 838–850. [Google Scholar]
- Sadeghi, M.; Banakar, A.; Khazaee, M.; Soleimani, M.R. An intelligent procedure for the detection and classification of chickens infected by clostridium perfringens based on their vocalization. Braz. J. Poult. Sci. 2015, 17, 537–544. [Google Scholar] [CrossRef] [Green Version]
Figure 1.
Photos of the experiment: (a) Eye drop operation for virus infection; and (b) pen scenarios.
Figure 1.
Photos of the experiment: (a) Eye drop operation for virus infection; and (b) pen scenarios.

Figure 2.
Photos of thermal image collection: (a) FLIR a65 camera and camera setup; and (b) a thermal image with a bird only.
Figure 2.
Photos of thermal image collection: (a) FLIR a65 camera and camera setup; and (b) a thermal image with a bird only.

Figure 3.
Photo of the digital temperature humidity meter.

Figure 4.
Proposed algorithm framework to identify avian diseases. ANN is artificial neural network, and SVM is support vector machine.
Figure 4.
Proposed algorithm framework to identify avian diseases. ANN is artificial neural network, and SVM is support vector machine.

Figure 5.
The seven steps of conducting the improved distance evaluation.

Figure 6.
Architecture of the Artificial Neural Network.

Figure 7.
Concept of the hyperplanes in Support Vector Machine [32,33]: (a) linear hyperplane; (b) plane with Radial Basis Function.

Figure 8.
Confusion matrix of SVM for detecting Avian Influenza (Flu) and NDV (Newcastle Disease Virus) in all sections.
Figure 8.
Confusion matrix of SVM for detecting Avian Influenza (Flu) and NDV (Newcastle Disease Virus) in all sections.


Table 1.
Formulas to extract features from chicken thermal images.
| The Name of Feature | Formula for the Feature | The Name of Feature | Formula for the Feature |
|---|---|---|---|
| Mean | Geometric mean | ||
| Maximum | Correlation coefficient | ||
| Standard deviation (std) | The average deviation from the mean | ||
| Quadratic mean square | Skewness | ||
| Root mean square | Kurtosis | ||
| Third central moment divided by the std | The third central moment | ||
| Crest factor | The fourth central moment | ||
| Maximum divided by the Quadratic mean square | The fifth central moment | ||
| Root mean square divided by the mean | The sixth central moment | ||
| Impulse factor | The fourth central moment divided by the square of the variance | ||
| Variance | The sum of squares | ||
| Harmonic mean |
Table 2.
Definitions for True Positive (TP), False Positive (FP), True Negative (TN), False Negative (FN), and actual condition and predicted condition.
Table 2.
Definitions for True Positive (TP), False Positive (FP), True Negative (TN), False Negative (FN), and actual condition and predicted condition.
| Actual Condition | |||
|---|---|---|---|
| Unhealthy | Healthy | ||
| Predicted condition | Unhealthy | TP | FP |
| Healthy | FN | TN | |
Table 3.
Feature scores of Group A (AI infection group + corresponding control group).
| Features | Section 1 | Features | Section 2 | Features | Section 3 | Features | Section 4 | Features | Section 5 | Features | Section 6 | Features | Section 7 |
|---|---|---|---|---|---|---|---|---|---|---|---|---|---|
| F21 | 1.000 | F22 | 1.000 | F21 | 1.000 | F12 | 1.000 | F12 | 1.000 | F22 | 1.000 | F22 | 1.000 |
| F2 | 0.835 | F21 | 0.938 | F2 | 0.882 | F22 | 0.959 | F14 | 0.848 | F12 | 0.979 | F12 | 0.904 |
| F4 | 0.835 | F4 | 0.925 | F4 | 0.882 | F14 | 0.864 | F22 | 0.838 | F2 | 0.915 | F2 | 0.817 |
| F22 | 0.764 | F2 | 0.925 | F22 | 0.881 | F7 | 0.774 | F7 | 0.832 | F4 | 0.915 | F4 | 0.817 |
| F9 | 0.761 | F12 | 0.874 | F9 | 0.755 | F8 | 0.774 | F8 | 0.832 | F14 | 0.910 | F14 | 0.803 |
| F23 | 0.597 | F14 | 0.830 | F12 | 0.680 | F6 | 0.751 | F6 | 0.804 | F21 | 0.889 | F19 | 0.795 |
| F1 | 0.497 | F9 | 0.758 | F3 | 0.677 | F15 | 0.751 | F20 | 0.804 | F7 | 0.851 | F21 | 0.761 |
| F3 | 0.497 | F3 | 0.702 | F14 | 0.646 | F20 | 0.751 | F15 | 0.804 | F8 | 0.851 | F7 | 0.740 |
| F16 | 0.494 | F6 | 0.584 | F23 | 0.638 | F2 | 0.703 | F5 | 0.753 | F6 | 0.822 | F18 | 0.598 |
| F17 | 0.491 | F15 | 0.584 | F7 | 0.497 | F4 | 0.703 | F2 | 0.656 | F15 | 0.822 | F10 | 0.597 |
| F12 | 0.472 | F20 | 0.584 | F8 | 0.497 | F21 | 0.578 | F4 | 0.656 | F20 | 0.822 | F6 | 0.590 |
| F14 | 0.455 | F7 | 0.562 | F16 | 0.494 | F10 | 0.431 | F23 | 0.654 | F5 | 0.812 | F15 | 0.590 |
| F18 | 0.385 | F8 | 0.562 | F5 | 0.479 | F5 | 0.489 | F10 | 0.408 | F9 | 0.771 | F20 | 0.590 |
| F19 | 0.323 | F5 | 0.525 | F6 | 0.477 | F9 | 0.468 | F11 | 0.330 | F3 | 0.756 | F13 | 0.583 |
| F11 | 0.363 | F23 | 0.576 | F20 | 0.477 | F23 | 0.456 | F21 | 0.521 | F11 | 0.456 | F9 | 0.549 |
| F10 | 0.343 | F11 | 0.320 | F15 | 0.477 | F11 | 0.381 | F3 | 0.490 | F10 | 0.451 | F3 | 0.467 |
| F7 | 0.258 | F10 | 0.309 | F11 | 0.308 | F3 | 0.385 | F9 | 0.477 | F16 | 0.443 | F8 | 0.459 |
| F8 | 0.258 | F16 | 0.439 | F10 | 0.298 | F1 | 0.365 | F19 | 0.304 | F13 | 0.282 | F1 | 0.447 |
| F5 | 0.242 | F17 | 0.251 | F17 | 0.370 | F19 | 0.203 | F18 | 0.206 | F23 | 0.266 | F11 | 0.590 |
| F6 | 0.232 | F1 | 0.089 | F1 | 0.363 | F18 | 0.157 | F1 | 0.168 | F17 | 0.236 | F5 | 0.422 |
| F15 | 0.232 | F18 | 0.081 | F18 | 0.232 | F16 | 0.106 | F16 | 0.166 | F19 | 0.091 | F17 | 0.312 |
| F20 | 0.232 | F13 | 0.056 | F19 | 0.141 | F13 | 0.058 | F17 | 0.021 | F1 | 0.070 | F23 | 0.032 |
| F13 | 0.078 | F19 | 0.019 | F13 | 0.120 | F17 | 0.038 | F13 | 0.017 | F18 | 0.024 | F16 | 0.008 |
Note: The bold font indicates selected features for each section.
Table 4.
Feature score for Group B (ND infection group + corresponding control group).
| Features | Section 1 | Features | Section 2 | Features | Section 3 | Features | Section 4 | Features | Section 5 | Features | Section 6 | Features | Section 7 |
|---|---|---|---|---|---|---|---|---|---|---|---|---|---|
| F16 | 1.000 | F16 | 0.987 | F16 | 1.000 | F17 | 1.000 | F13 | 1.000 | F16 | 1.000 | F16 | 1.000 |
| F9 | 1.000 | F9 | 0.943 | F2 | 0.985 | F16 | 0.976 | F2 | 0.943 | F3 | 0.987 | F9 | 0.939 |
| F3 | 0.988 | F17 | 0.845 | F9 | 0.965 | F2 | 0.943 | F9 | 0.871 | F9 | 0.947 | F3 | 0.906 |
| F17 | 0.929 | F3 | 0.813 | F3 | 0.897 | F9 | 0.880 | F16 | 0.869 | F17 | 0.911 | F17 | 0.815 |
| F21 | 0.858 | F5 | 0.805 | F17 | 0.888 | F3 | 0.878 | F3 | 0.845 | F2 | 0.891 | F2 | 0.809 |
| F4 | 0.816 | F2 | 0.803 | F19 | 0.812 | F19 | 0.868 | F23 | 0.543 | F5 | 0.699 | F1 | 0.687 |
| F1 | 0.816 | F6 | 0.683 | F18 | 0.684 | F23 | 0.774 | F17 | 0.427 | F8 | 0.674 | F4 | 0.687 |
| F2 | 0.810 | F15 | 0.683 | F5 | 0.523 | F21 | 0.757 | F12 | 0.356 | F7 | 0.674 | F14 | 0.655 |
| F5 | 0.802 | F20 | 0.683 | F8 | 0.513 | F4 | 0.720 | F22 | 0.337 | F21 | 0.643 | F5 | 0.636 |
| F6 | 0.654 | F1 | 0.662 | F7 | 0.513 | F1 | 0.720 | F19 | 0.335 | F6 | 0.629 | F15 | 0.635 |
| F15 | 0.654 | F4 | 0.662 | F6 | 0.509 | F5 | 0.696 | F18 | 0.310 | F20 | 0.629 | F6 | 0.635 |
| F20 | 0.654 | F21 | 0.660 | F15 | 0.509 | F8 | 0.679 | F11 | 0.450 | F15 | 0.629 | F20 | 0.635 |
| F7 | 0.645 | F8 | 0.652 | F20 | 0.509 | F7 | 0.679 | F14 | 0.232 | F19 | 0.623 | F7 | 0.605 |
| F8 | 0.645 | F7 | 0.652 | F23 | 0.457 | F6 | 0.643 | F21 | 0.198 | F14 | 0.616 | F8 | 0.605 |
| F22 | 0.636 | F14 | 0.620 | F11 | 0.450 | F15 | 0.643 | F7 | 0.191 | F1 | 0.610 | F21 | 0.583 |
| F19 | 0.617 | F19 | 0.620 | F13 | 0.393 | F20 | 0.643 | F8 | 0.191 | F4 | 0.610 | F22 | 0.519 |
| F14 | 0.615 | F22 | 0.618 | F14 | 0.371 | F14 | 0.581 | F15 | 0.169 | F23 | 0.546 | F12 | 0.503 |
| F12 | 0.572 | F12 | 0.618 | F1 | 0.318 | F22 | 0.560 | F20 | 0.169 | F22 | 0.513 | F19 | 0.462 |
| F23 | 0.542 | F23 | 0.467 | F4 | 0.318 | F12 | 0.506 | F6 | 0.169 | F12 | 0.480 | F11 | 0.450 |
| F11 | 0.450 | F18 | 0.461 | F12 | 0.310 | F11 | 0.450 | F1 | 0.156 | F11 | 0.450 | F23 | 0.434 |
| F13 | 0.309 | F11 | 0.450 | F10 | 0.218 | F13 | 0.270 | F10 | 0.156 | F13 | 0.261 | F13 | 0.375 |
| F10 | 0.284 | F10 | 0.134 | F22 | 0.214 | F10 | 0.197 | F4 | 0.156 | F10 | 0.243 | F18 | 0.268 |
| F18 | 0.272 | F13 | 0.095 | F21 | 0.180 | F18 | 0.196 | F5 | 0.146 | F18 | 0.239 | F10 | 0.209 |
Note: The bold font indicates selected features for each section.
Table 5.
The number of thermal images for each group.
| Group | Classifier | Number of Thermal Images | Training | Validation | Testing |
|---|---|---|---|---|---|
| A or B | ANN | 120 | 84 | 18 | 18 |
| SVM | 120 | 84 | 0 | 36 |
Note: ANN is artificial neural network; SVM is support vector machine.
Table 6.
Detection of Avian Influenza using thermal images and ANN.
| Disease | Classifier | The Time for Data Collection | Validation Accuracy (%) | Testing Specificity | Testing Sensitivity (%) | Training Accuracy (%) | Testing Accuracy (%) |
|---|---|---|---|---|---|---|---|
| Avian Influenza (AI or Flu) | ANN Structure: 5 × 8 × 2 | Section 1 | 75.93 | 93.33 | 41.67 | 74.60 | 70.37 |
| Section 2 | 72.22 | 71.43 | 69.23 | 81.35 | 70.37 | ||
| Section 3 | 92.59 | 100.00 | 69.44 | 84.52 | 79.63 | ||
| Section 4 | 98.15 | 100.00 | 85.71 | 93.65 | 92.59 | ||
| Section 5 | 94.44 | 100.00 | 85.71 | 96.83 | 92.59 | ||
| Section 6 | 98.15 | 100.00 | 90.63 | 94.44 | 94.44 | ||
| Section 7 | 100.00 | 100.00 | 100.00 | 100.00 | 100.00 |
Note: The highlighted section indicates the earlier time for successful disease detection.
Table 7.
Detection of Newcastle Disease using thermal images and ANN.
| Disease | Classifier | The Time for Data Collection | Validation Accuracy (%) | Testing Specificity (%) | Testing Sensitivity (%) | Training Accuracy (%) | Testing Accuracy (%) |
|---|---|---|---|---|---|---|---|
| Newcastle Disease (ND) | ANN Structure: 5 × 7 × 2 | Section 1 | 68.52 | 77.78 | 59.26 | 74.21 | 68.52 |
| Section 2 | 87.04 | 72.73 | 75.00 | 78.57 | 74.07 | ||
| Section 3 | 74.07 | 86.96 | 77.42 | 83.33 | 81.48 | ||
| Section 4 | 62.96 | 64.29 | 53.85 | 69.05 | 59.26 | ||
| Section 5 | 100.00 | 100.00 | 100.00 | 100.00 | 100.00 | ||
| Section 6 | 92.59 | 85.71 | 63.16 | 89.68 | 77.78 | ||
| Section 7 | 92.59 | 83.33 | 83.33 | 87.30 | 83.33 |
Note: The highlighted section indicates the earlier time for successful disease detection.
Table 8.
SVM core parameters for the prediction of Avian Influenza (AI) and Newcastle Disease (ND).
| Group | Kernel Function | σ | Solver | Box Constraint (C) |
|---|---|---|---|---|
| AI | Radial Basic Function | 1 | Sequential Minimal Optimization | 5 |
| ND | 10 |
Table 9.
Detection of Avian Influenza using thermal images and SVM.
| Disease | Classifier | The Time for Data Collection | Validation Accuracy (%) | Testing Specificity (%) | Testing Sensitivity (%) | Training Accuracy (%) | Testing Accuracy (%) |
|---|---|---|---|---|---|---|---|
| Avian Influenza (AI or Flu) | SVM (sigma = 1 & C = 5) | Section 1 | 86.11 | 83.33 | 88.89 | 88.10 | 86.11 |
| Section 2 | 86.11 | 78.26 | 100.00 | 88.10 | 86.11 | ||
| Section 3 | 97.22 | 94.74 | 100.00 | 90.48 | 97.22 | ||
| Section 4 | 77.78 | 72.73 | 85.71 | 95.24 | 77.78 | ||
| Section 5 | 97.22 | 94.74 | 100.00 | 94.05 | 97.22 | ||
| Section 6 | 94.44 | 90.00 | 100.00 | 95.24 | 94.44 | ||
| Section 7 | 100.00 | 100.00 | 100.00 | 100.00 | 100.00 |
Note: The highlighted section indicates the earlier time for successful disease detection.
Table 10.
Detection of Newcastle Disease using thermal images and SVM.
| Disease | Classifier | The Time for Data Collection | Validation Accuracy (%) | Testing Specificity (%) | Testing Sensitivity (%) | Training Accuracy (%) | Testing Accuracy (%) |
|---|---|---|---|---|---|---|---|
| Newcastle Disease (ND) | SVM (sigma = 1 & C = 10) | Section 1 | 80.56 | 72.00 | 100.00 | 94.05 | 80.56 |
| Section 2 | 77.78 | 85.71 | 72.73 | 98.81 | 77.78 | ||
| Section 3 | 100.00 | 100.00 | 100.00 | 100.00 | 100.00 | ||
| Section 4 | 97.22 | 100.00 | 94.74 | 97.62 | 97.22 | ||
| Section 5 | 100.00 | 100.00 | 100.00 | 100.00 | 100.00 | ||
| Section 6 | 91.67 | 89.47 | 94.12 | 96.43 | 91.67 | ||
| Section 7 | 91.67 | 100.00 | 85.71 | 100.00 | 91.67 |
Note: The highlighted section indicates the earlier time for successful disease detection.
Table 11.
The results of data fusion for identifying Avian Influenza in Section 4 with Dempster–Shafer evidence theory.
Table 11.
The results of data fusion for identifying Avian Influenza in Section 4 with Dempster–Shafer evidence theory.
| Section 4 | Infection | Healthy | Testing Sensitivity (%) | Testing Specificity (%) | Testing Accuracy (%) | |
|---|---|---|---|---|---|---|
| Bird States | AI infection | 100.00 | 0.00 | 98.15 | 100.00 | 99.05 |
| Health | 1.89 | 98.11 | ||||
Table 12.
The results of data fusion for identifying Newcastle Disease in Section 2 with Dempster–Shafer evidence theory.
Table 12.
The results of data fusion for identifying Newcastle Disease in Section 2 with Dempster–Shafer evidence theory.
| Section 2 | Infection | Healthy | Testing Sensitivity (%) | Testing Specificity (%) | Testing Accuracy (%) | |
|---|---|---|---|---|---|---|
| Bird States | ND infection | 96.97 | 3.03 | 82.90 | 96.35 | 88.48 |
| Healthy | 20.00 | 80.00 | ||||
Table 13.
Summary of the SVM performance to diagnose AI and ND using thermal images.
| The Time for Data Collection | AI (Flu) | ND | ||||
|---|---|---|---|---|---|---|
| Sensitivity (%) | Specificity (%) | Testing Accuracy (%) | Sensitivity (%) | Specificity (%) | Testing Accuracy (%) | |
| Section 1 | 88.89 | 83.33 | 86.11 | 100.00 | 72.00 | 80.56 |
| Section 2 | 100.00 | 78.26 | 86.11 | 82.90 | 96.35 | 88.48 |
| Section 3 | 100.00 | 94.74 | 97.22 | 100.00 | 100.00 | 100.00 |
| Section 4 | 98.15 | 100.00 | 99.05 | 94.74 | 100.00 | 97.22 |
| Section 5 | 100.00 | 94.74 | 97.22 | 100.00 | 100.00 | 100.00 |
| Section 6 | 100.00 | 90.00 | 94.44 | 94.12 | 89.47 | 91.67 |
| Section 7 | 100.00 | 100.00 | 100.00 | 85.71 | 100.00 | 91.67 |
Disclaimer/Publisher’s Note: The statements, opinions and data contained in all publications are solely those of the individual author(s) and contributor(s) and not of MDPI and/or the editor(s). MDPI and/or the editor(s) disclaim responsibility for any injury to people or property resulting from any ideas, methods, instructions or products referred to in the content. |
© 2023 by the authors. Licensee MDPI, Basel, Switzerland. This article is an open access article distributed under the terms and conditions of the Creative Commons Attribution (CC BY) license (https://creativecommons.org/licenses/by/4.0/).
Share and Cite
MDPI and ACS Style
Sadeghi, M.; Banakar, A.; Minaei, S.; Orooji, M.; Shoushtari, A.; Li, G. Early Detection of Avian Diseases Based on Thermography and Artificial Intelligence. Animals 2023, 13, 2348. https://0-doi-org.brum.beds.ac.uk/10.3390/ani13142348
AMA Style
Sadeghi M, Banakar A, Minaei S, Orooji M, Shoushtari A, Li G. Early Detection of Avian Diseases Based on Thermography and Artificial Intelligence. Animals. 2023; 13(14):2348. https://0-doi-org.brum.beds.ac.uk/10.3390/ani13142348
Chicago/Turabian StyleSadeghi, Mohammad, Ahmad Banakar, Saeid Minaei, Mahdi Orooji, Abdolhamid Shoushtari, and Guoming Li. 2023. "Early Detection of Avian Diseases Based on Thermography and Artificial Intelligence" Animals 13, no. 14: 2348. https://0-doi-org.brum.beds.ac.uk/10.3390/ani13142348
Note that from the first issue of 2016, this journal uses article numbers instead of page numbers. See further details here.