1. Introduction
Electrical geophysical surveys have become one of the main surface geophysical methods in hydrogeological research due to their successful application in various aspects of hydrogeological research, e.g., subsurface mapping to define formations that protect an aquifer, estimating volume extent and internal structure of aquifers, mapping the infiltration of the vadose zone, and contamination of the groundwater, etc. [
1,
2,
3,
4]. The most common method, electrical resistivity tomography (ERT), uses electrical current to image the electrical resistivity of the subsurface, which, in hydrogeology, may be associated with the degree of water saturation [
5]. Numerous studies have shown that site complexity can be studied effectively by ERT to define aquifer geometry and geological structure and to gain insight into hydrogeological processes [
6,
7,
8,
9,
10].
Resistivity profiling gained renewed popularity during the 1990s with the introduction of computer-automated data collection systems and robust data inversion methods [
11,
12,
13]. Recent advances in field instrumentation has led to the development of multi-channel, multi-electrode systems for quick and reliable data acquisition that greatly reduces human, computational, and time resources [
2]. Automated data collection allows hundreds of individual measurements to be made in a short time while minimizing human labor previously needed for resistivity fieldwork. Commercially available inversion software for personal computers and advances in computer hardware have allowed rapid processing and inversion of apparent resistivity field data for the creation of two-dimensional resistivity models of the subsurface [
14].
Igneous and metamorphic, or crystalline, rocks are characterized by negligible porosity and permeability in terms of groundwater exploitability. However, alteration processes happening in the first few 10–100 m of depth can greatly increase their fracture permeability [
15]. This can form modestly productive secondary porosity aquifers in the zone affected by alteration. In many areas of the world, such aquifers are very important for agriculture and drinking water supply [
16]. Besides permeability, alteration processes also affect rock total porosity, i.e., water content, which results in a wide range of electrical resistivities within the alteration zone. Contrasting electrical resistivity of rocks affected by varying degree of weathering therefore makes ERT a very suitable method for exploration of alteration zones in crystalline rocks [
8,
17,
18].
Crystalline rocks are scarcely present in Croatian territory. The drinking water supply of the northeastern (Pannonian basin) part of Croatia is mainly related to alluvial aquifers of the Sava and Drava river valleys, while in the southwestern part (the Dinarides), it is based on large karstic springs formed in carbonate rocks. Water resources in the crystalline rocks are therefore marginally used in Croatia and generally considered negligible.
Medvednica Mount is situated to the NW from the Croatian capital, Zagreb. This makes it very attractive for recreation and tourism purposes. Although there are no permanent settlements or agricultural areas, there are a number of mountain huts, hotels, and restaurants located on the main mountain ridge. This increases drinking water supply demands, and the possibility of water resources exploitation directly on the mountain is quite important for infrastructure planning and development. Core parts of the mountain are built with Paleozoic metamorphic rocks. Jelenske vode springs include several springs of few l/s capacity, located on the northern slopes of the mountain, only 200 m bellow the main ridge. They are the most significant springs present in the central part of the mountain. Although three main springs already have intake structures for water supply purposes, the Jelenske vode area has never been hydrogeologicaly investigated in detail, and exact capacity and dynamics of the springs have not been defined. The main purpose of this study was to investigate water supply potential and flow processes of aquifers formed in Medvednica Mount metamorphic rocks, which are drained by the springs of Jelenske vode. ERT profiling, together with monitoring of the spring’s discharge and hydrochemical characteristics, were the main methods used to characterize hydrogeological properties of the area.
2. Geological and Hydrogeological Setting
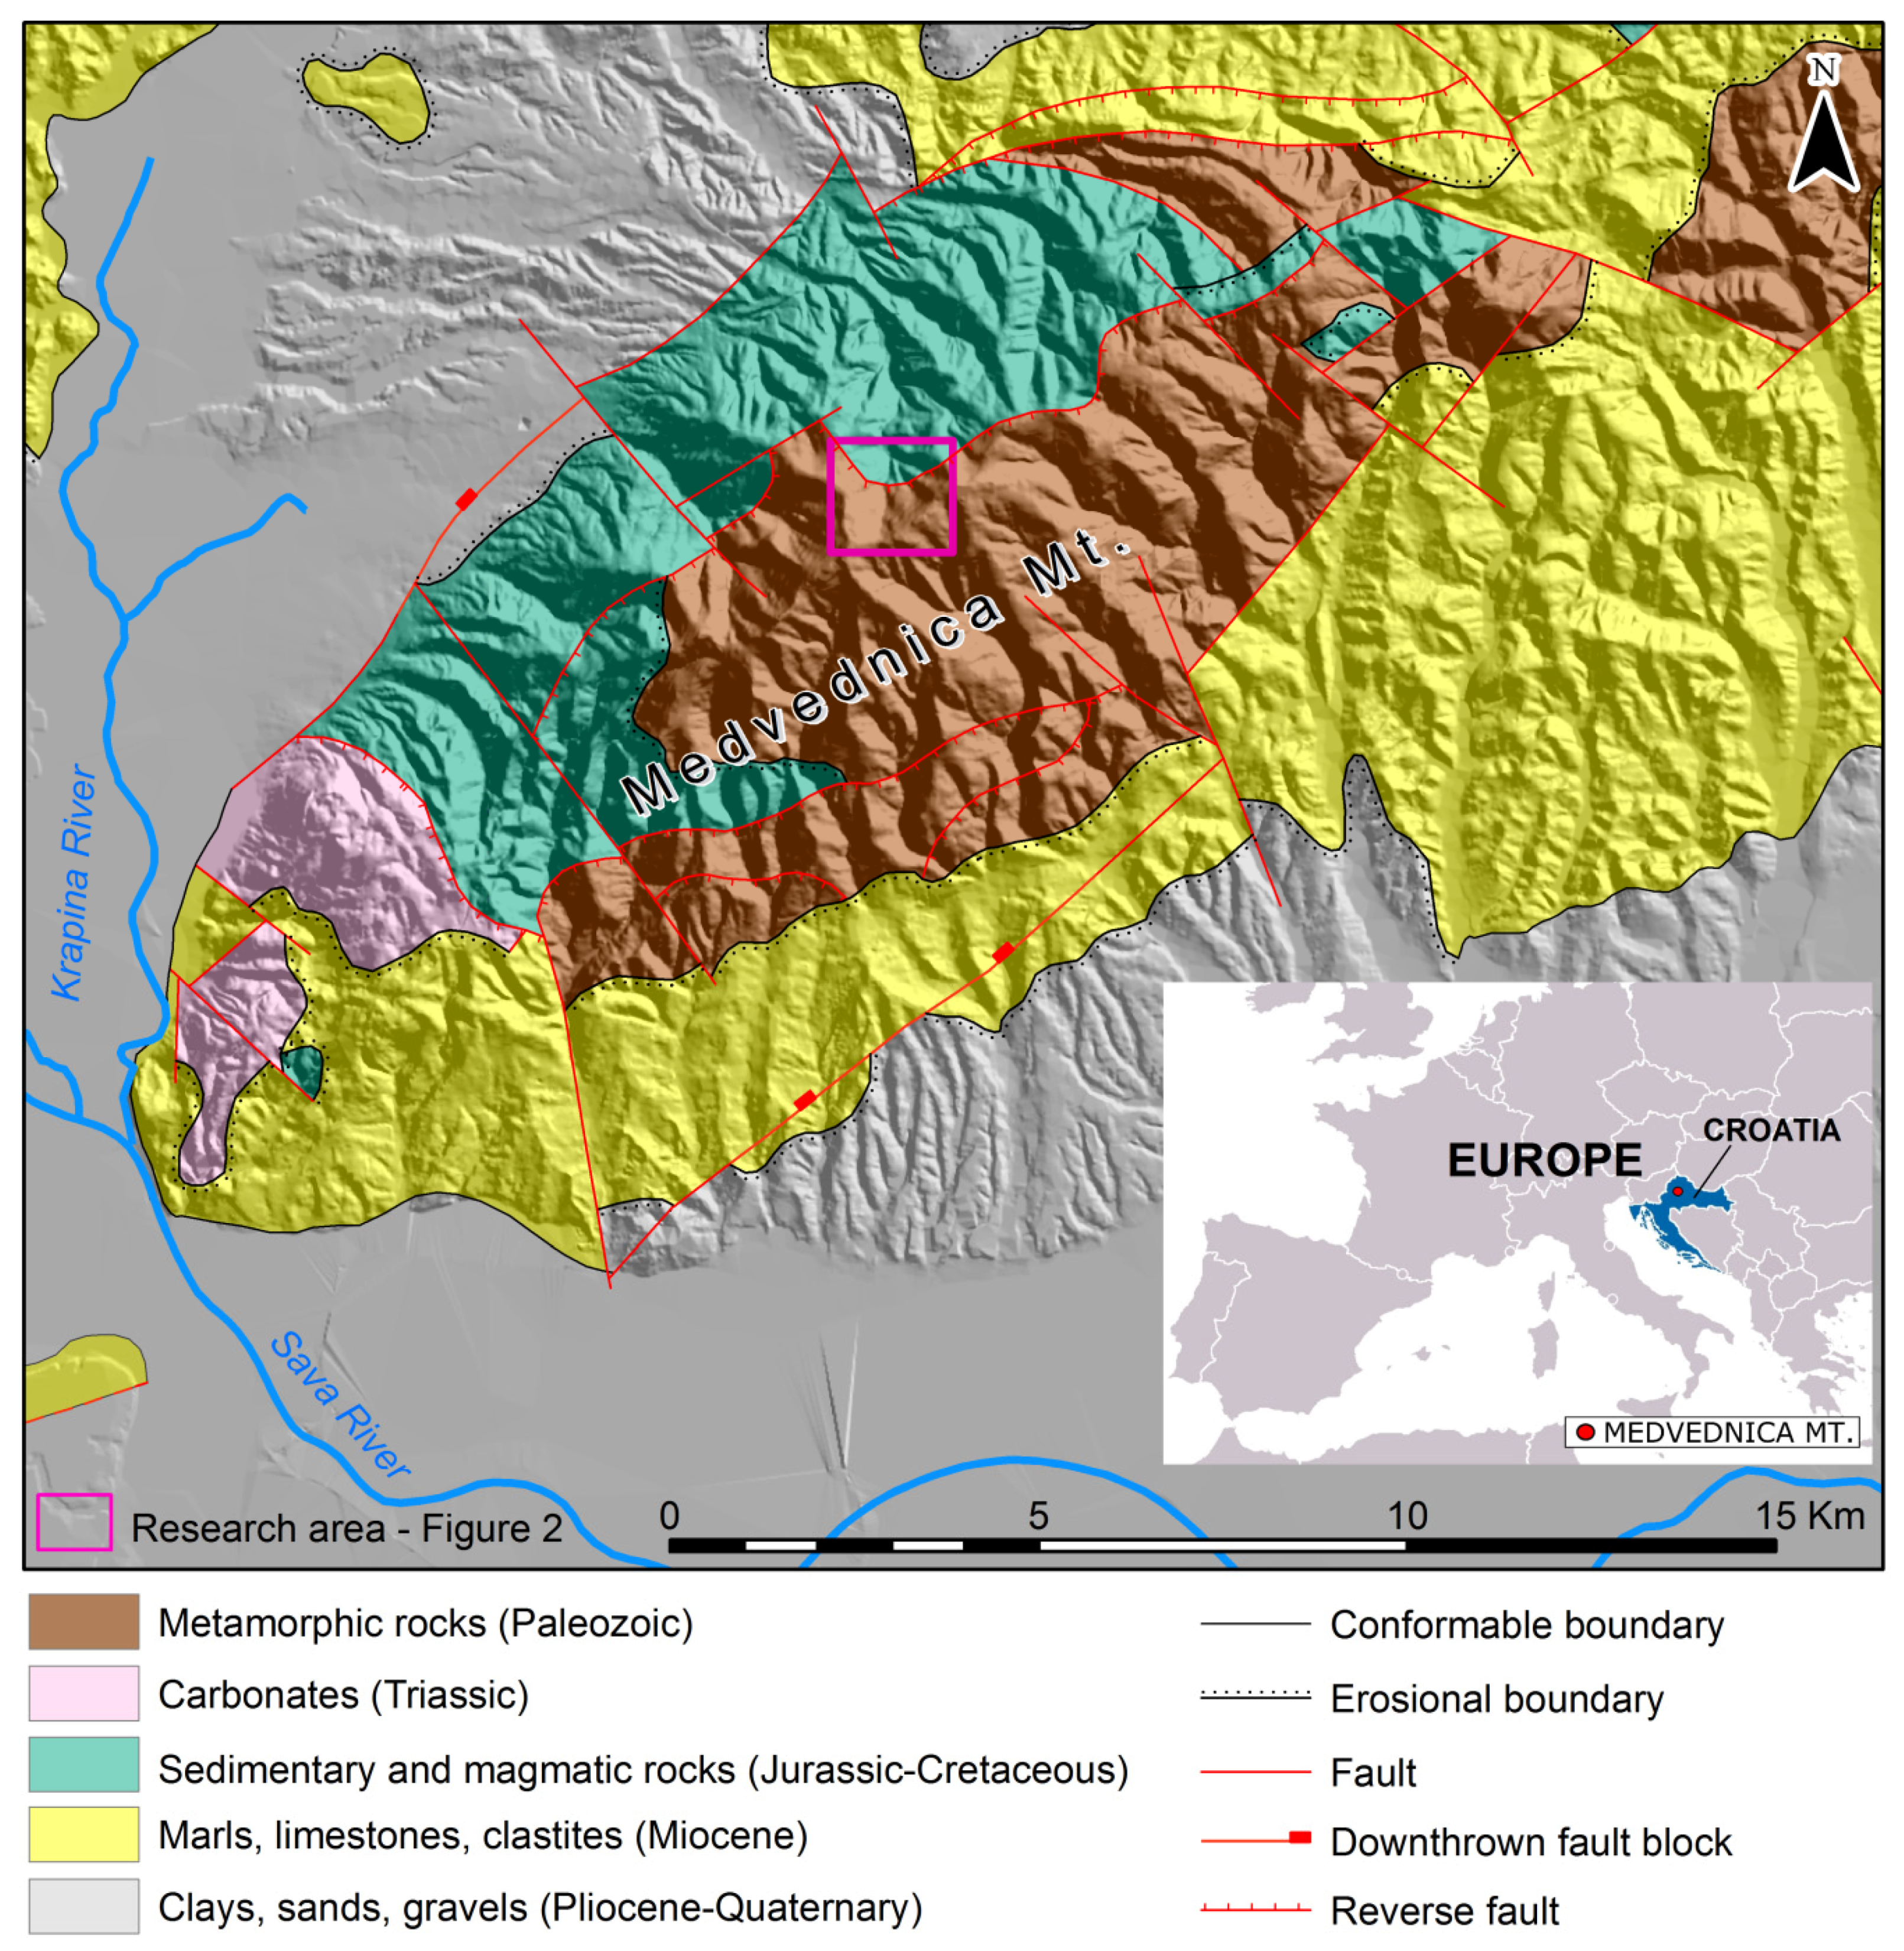
Medvednica Mount is an isolated mountain massif in northern Croatia (
Figure 1). It has a pronounced NE–SW oriented mountain ridge with an approximate length of 40 km and maximum elevation of 1032 m.a. s. l. The mountain is bounded to the south by the Sava River alluvial plain and to the north by the Krapina River valley. Zagreb, the Croatian capital and the largest city, is situated on and beneath the southwestern slopes of the mountain.
The core parts of the mountain are composed of pre-Tertiary rocks, which are surrounded by overlying Miocene–Quaternary sediments [
19]. NE and central parts of the mountain core consist mostly of metamorphic, clastic sedimentary, and magmatic rocks, while the SW part is composed of Triassic carbonate rocks, mainly dolostones (
Figure 1). Pre-Tertiary rocks of the mountain core are unconformably overlain by the Middle Miocene reef limestones and marls, which grade into the Upper Miocene and Pliocene–Quaternary, predominantly clastic deposits down the southern slopes of the mountain. On the NW flanks of the massif, the Miocene sediments are locally tilted to the subvertical as a result of subsequent large-scale thrusting and folding of the area [
20]. On the southern slopes, the Miocene strata generally gently dip away from the mountain ridge.
Medvednica Mount is located in the transitional zone between two major orogenic mountain belts, with the Alps to the north and the Dinarides to the southwest [
21,
22]. Medvednica Mount is also on the western margin of the Pannonian Basin and represents one of its “inselbergs”, which expose deformed Paleozoic and Mesozoic rocks surrounded by Neogene strata [
20,
23]. The Medvednica Mount formation process involved complex multiphase tectonic history. Multiple events of thrusting and nappe stacking were interrupted by periods of extension and associated exhumation [
22]. During the Oligocene–Early Miocene compressional phase, Triassic carbonates were thrusted onto the western part of the mountain core (i.e., the “Žumberak” nappe, [
20]). This compressional phase was followed by widespread extension and normal faulting in the Middle Miocene, resulting in marine transgression within the Pannonian basin and deposition of predominantly carbonate sediments along the flanks of the mountain. The final inversion and compression phase started at the end of Miocene and is still active today [
24].
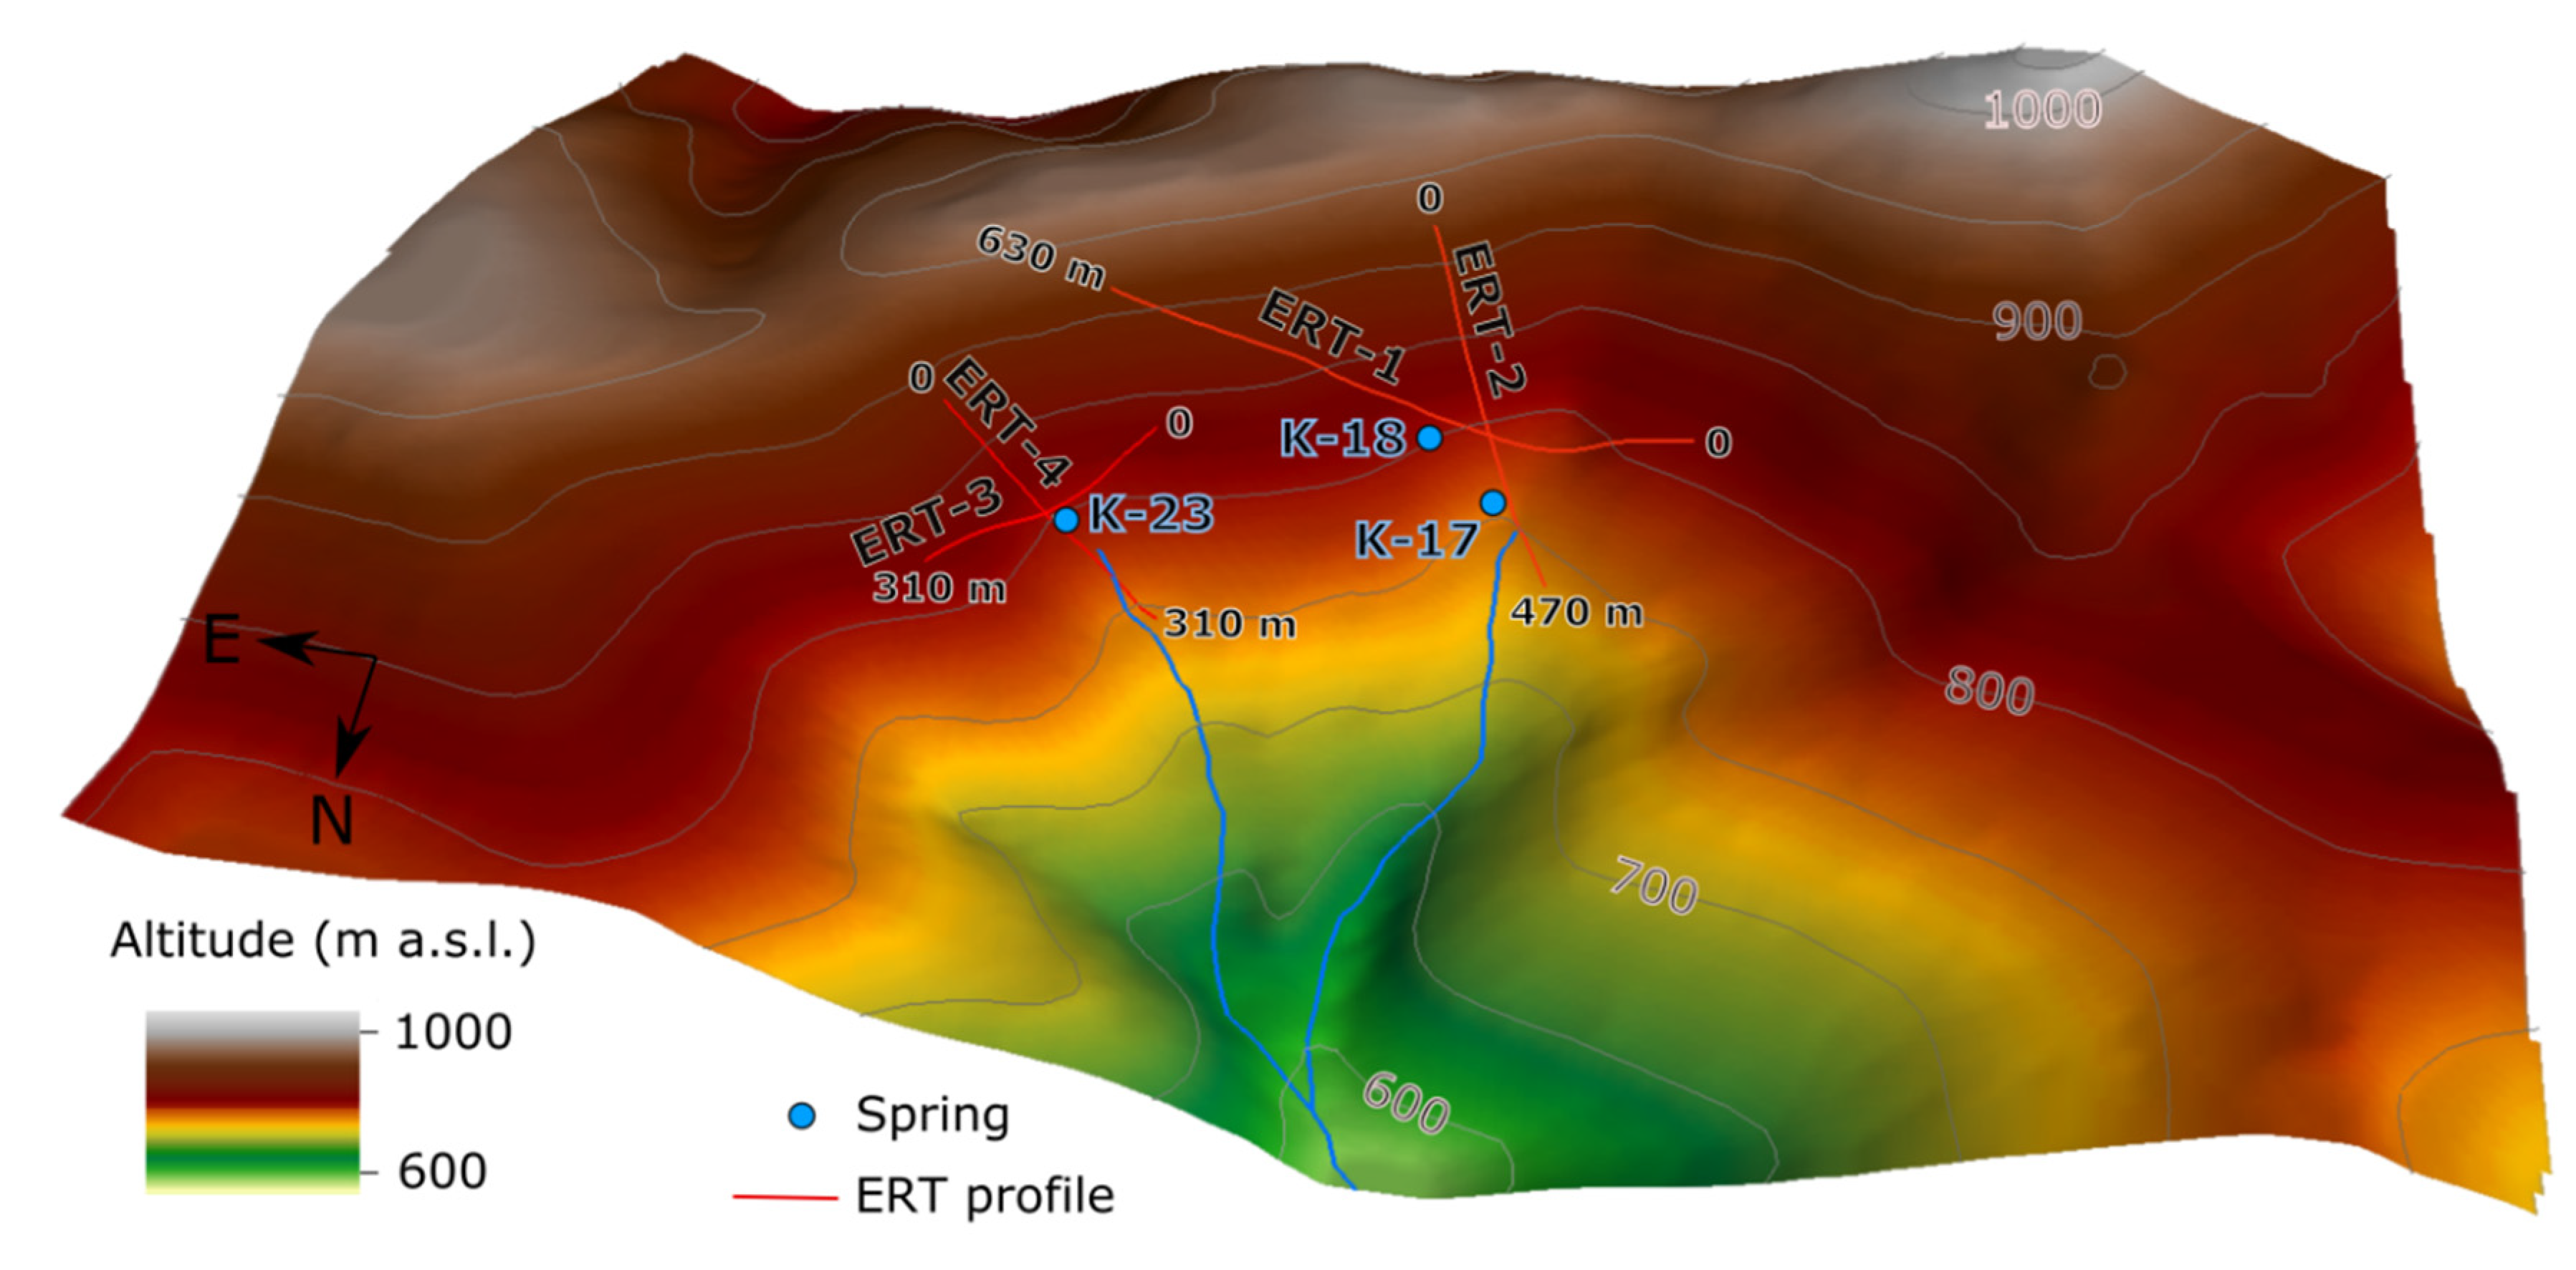
The investigated aquifers were completely situated in low grade metamorphic rocks of the Paleozoic age (
Figure 1). The main discharge points were a group of springs jointly called “Jelenske vode”, and three of them were captured for public water supply (K17, K18, K23;
Figure 2). The springs were located on relatively steep northern slopes of Medvednica Mount, 200 m bellow the mountain ridge (
Figure 2). Metamorphic rocks in the area of Jelenske vode were predominantly of the greenschist type, but there was also some slate, phyllite, and, rarely, marble rocks, which were irregularly interbedded with schists [
26,
27]. Younger Mesozoic (Jurassic–Cretaceous) magmatic and sedimentary rocks were present on the mountain downslope from the investigated area (
Figure 1), so their properties did not affect investigated aquifers. Non-weathered metamorphic rocks exhibited very low permeability, but secondary fracturing within the rock alteration zone significantly increased their permeability. Surficial, completely weathered rock layer, i.e., saprolite [
28], was present on gentler slopes, while it was mostly removed by erosion on steeper slopes where fractured basement rocks were exposed. Alteration processes affected rocks unevenly, resulting in irregularly (horizontally and vertically) distributed zones of varying weathering degree. Generally, slate and phyllite rocks are more prone to intensive weathering, rock disintegration, and saprolite formation than greenschists. Less weathered and fragmented rocks were reflected on the terrain with outcrops forming small cliffs and steep slopes. More intensely weathered rocks were covered by saprolite cover up to several meters thick on gentler slopes.
A decrease of permeability below the altered/fractured zone kept groundwater level near the terrain surface, which explains the occurrence of relatively high springs on the slopes of Medvednica Mount. Although the total porosity of saprolite and highly weathered rocks was higher, the fracture permeability and persistency was lower due to rock disintegration and clogging by clay. The most productive springs (K17, K23;
Figure 2) were located at the topographic transitions from steep to gentler slopes at the contact of greenschist outcrops with saprolite-covered terrain. Their locations were predisposed by an intersection of distinct fractures in the fractured zone of the bedrock with the terrain surface. This formed concentrated groundwater discharges with capacity of a few liters per second. Recharge of the most productive springs was therefore more related to the drainage function of the most persistent and permeable fractures in the fractured zone than to the most weathered and disintegrated zones. A number of lower yield groundwater discharges were also present at the heads and along the stream gullies. These minor springs were mainly related to more disperse draining of a shallow saprolite and strongly weathered and disintegrated rocks.
3. Materials and Methods
3.1. Electrical Resistivity Tomography (ERT)
The resistivity method is one of the oldest geophysical survey techniques [
29]. The purpose of electrical surveys is to determine the subsurface resistivity distribution by making measurements at the ground surface. From these measurements, apparent resistivity of the subsurface can be acquired. Apparent resistivity data from the field is then inverted into two-dimensional resistivity subsurface models using resistivity inversion software [
1,
2,
3,
4,
5,
12]. Igneous and metamorphic rocks typically have high resistivity values. The resistivity of these rocks is greatly dependent on the degree of fracturing and the percentage of the fractures saturated by groundwater [
30]. Thus, a given rock type can have a large range of resistivity, from about 100 to 1 million Ωm, depending on whether it is saturated or dry. This characteristic is useful in the detection of fracture zones and other weathering features, such as in engineering and groundwater surveys [
7,
8,
9,
10,
14,
17,
18].
A 2D electrical resistivity tomography survey was carried out using a multi-electrode resistivity system. This system was composed of a various number of electrodes connected to the resistivity meter by a multi-core cable. The measurements were made by passing the current into the ground through two current electrodes and measuring the difference in the resulting voltage at two potential electrodes [
2]. The current and voltage measurements were converted into apparent resistivity values using a geometric factor that depends on the applied configuration of the current and potential electrodes (array). By making measurements with different spacing at different locations along the cable, a continuous cross section of apparent resistivity (pseudosection) was obtained. Selection of active electrodes during the measurement was done automatically by the microprocessor within the resistivity meter.
Several data acquisition arrays are available for subsurface resistivity studies. Each of these arrays takes a series of voltage and current measurements from an array of electrodes placed on the ground surface along a line. Commonly used data acquisition arrays include Wenner, Wenner–Schlumberger, dipole–dipole, and pole–pole, among others [
14]. According to the majority of authors, the Wenner array has the best signal response and highest resolution of horizontal structures, but relatively shallow penetration depth and limited ability to detect vertical structures [
30,
31,
32]. The Wenner–Schlumberger array is considered to have good signal response, the ability to resolve horizontal and vertical structures relatively well, and greater penetration depth than the Wenner array [
30,
31,
32,
33].
Field measurements in the presented study were done using the POLARES 2.0 electrical imaging system (P.A.S.I. srl), which uses a sinusoidal alternate current of adjustable frequency. This system has an automatic electronic switching unit to commute signals on the different electrodes, so the instrument can measure both the current and voltage with a microprocessor-controlled sequence of measurements. This system was connected to stainless steel electrodes, which were laid out in a straight line with a constant spacing of 10 m via a multi-core cable. The resistivity meter selected only four active electrodes to be used for each measurement.
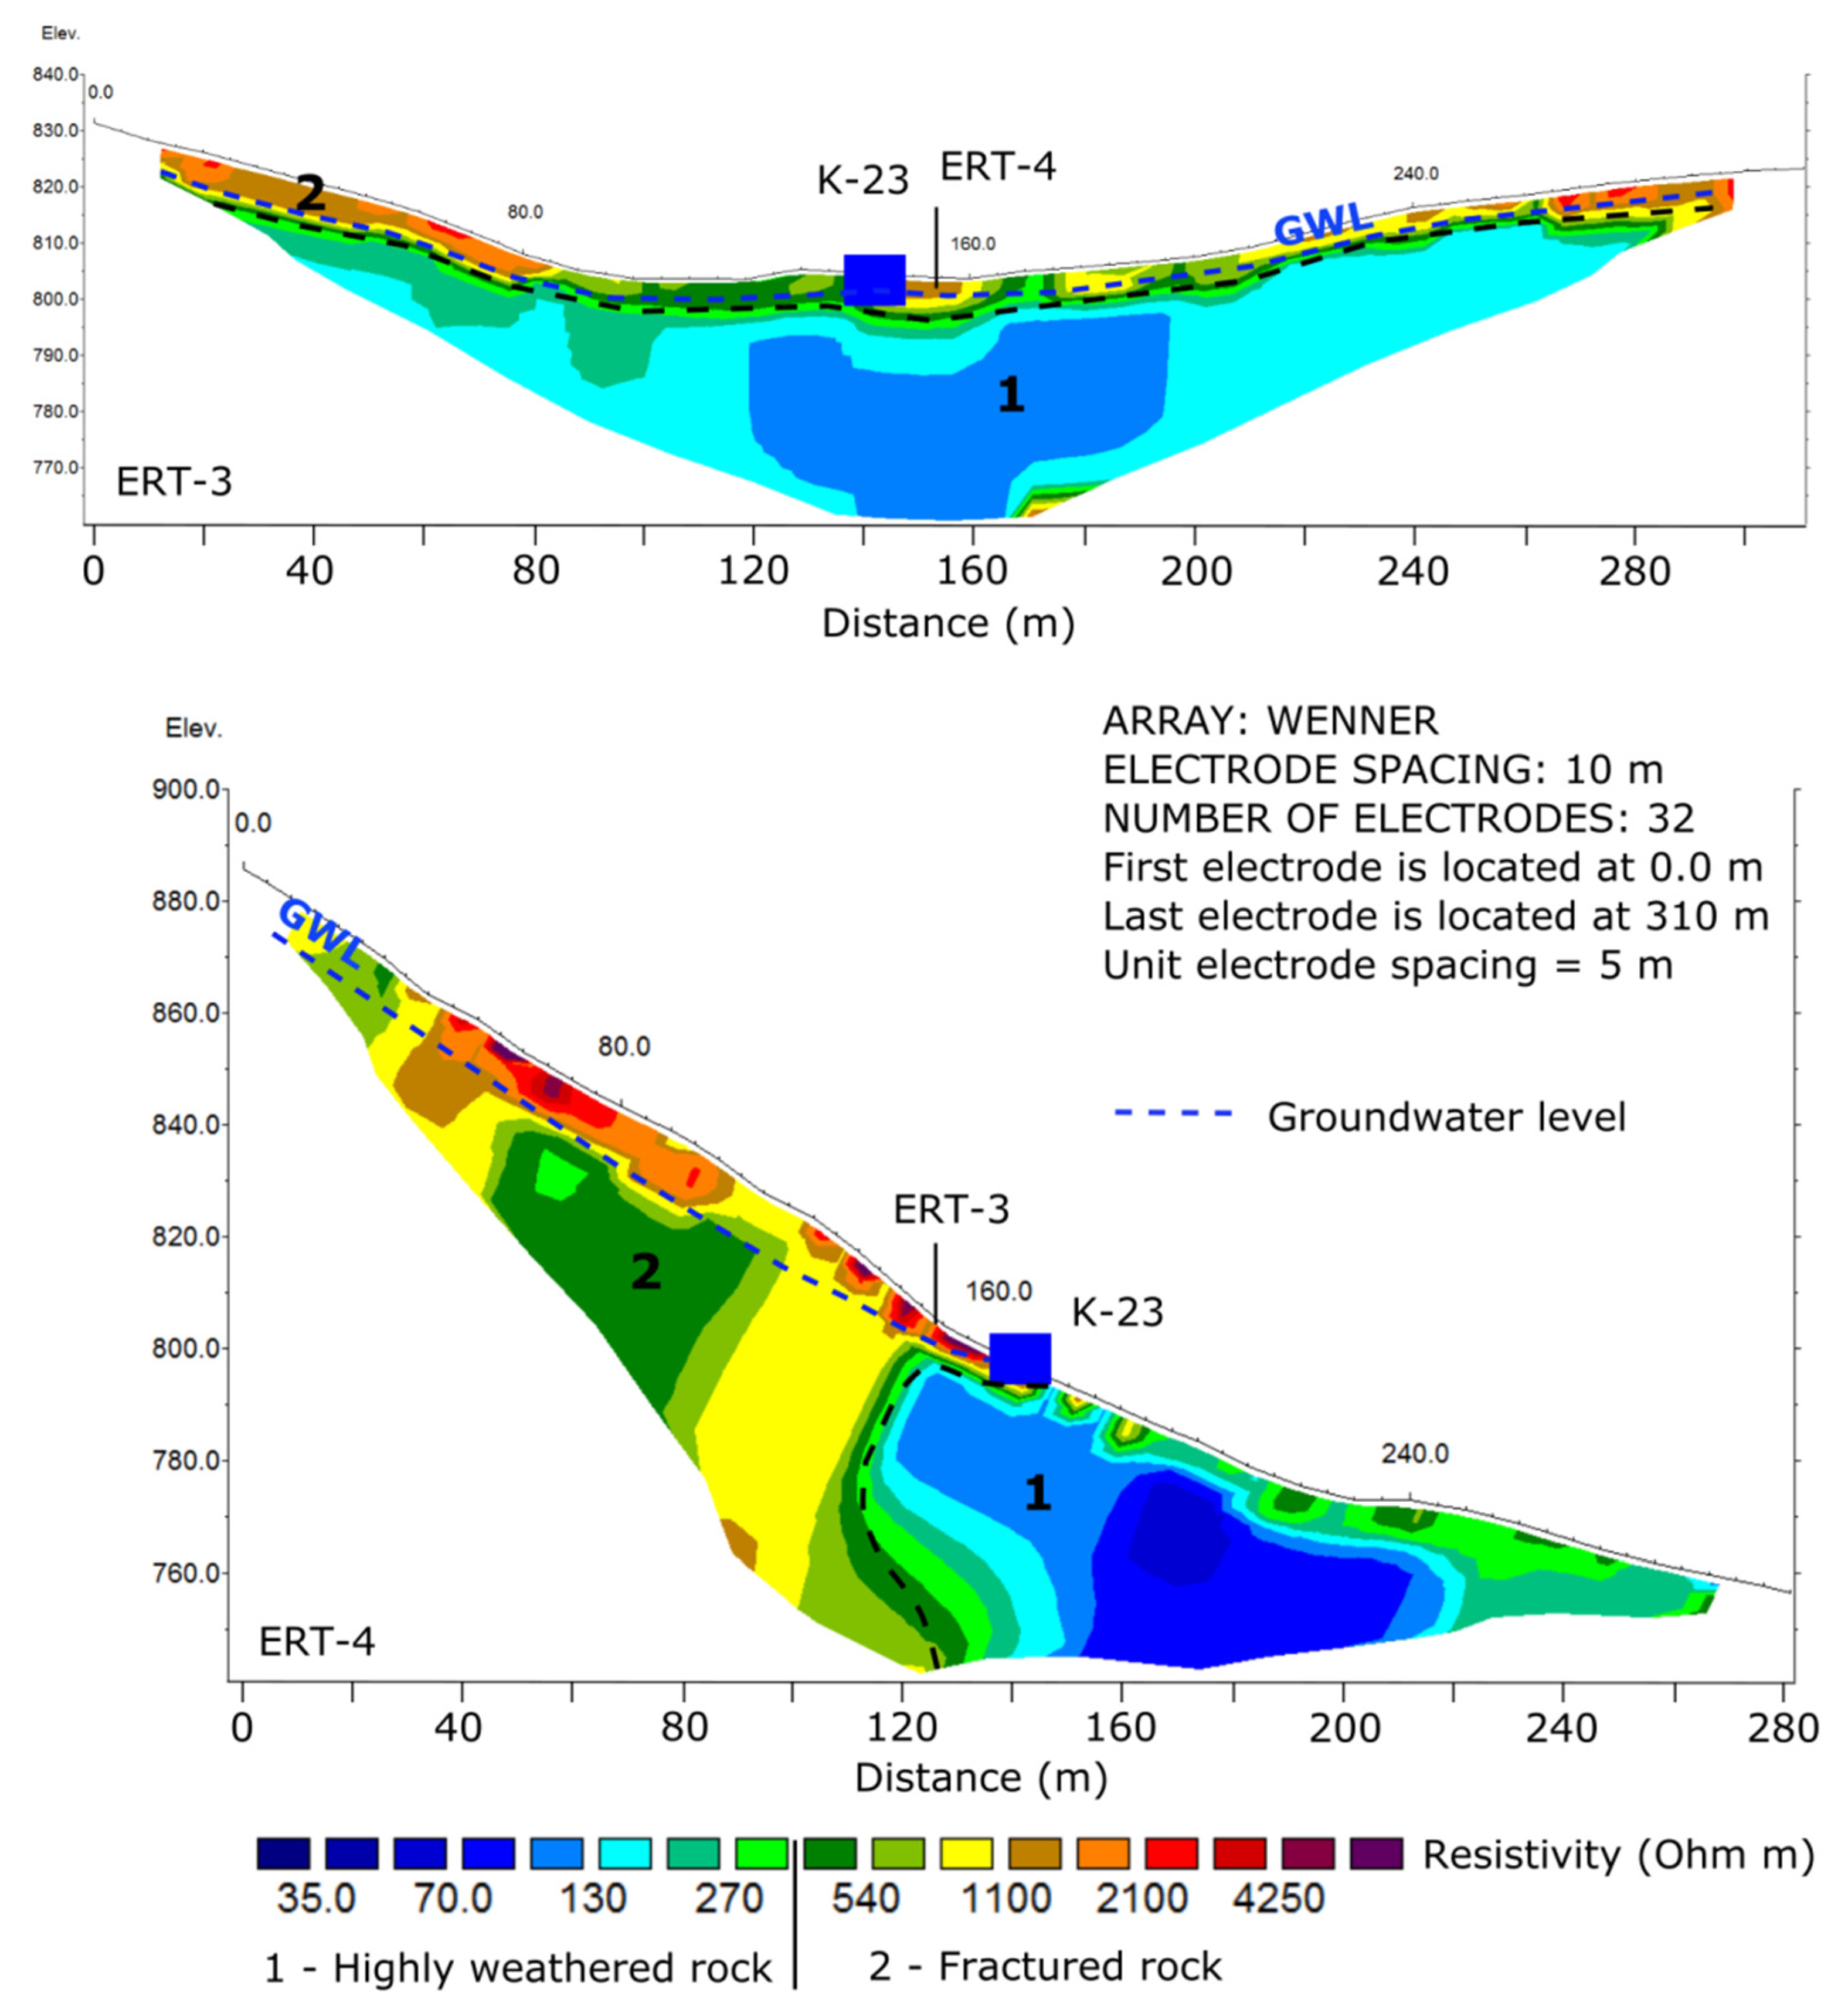
Surveys were conducted using the Wenner–Schlumberger array and the Wenner array (ERT-3 and ERT-4) at a frequency of 1.8 Hz and a maximum phase of 20° between the voltage signal and the current signal.
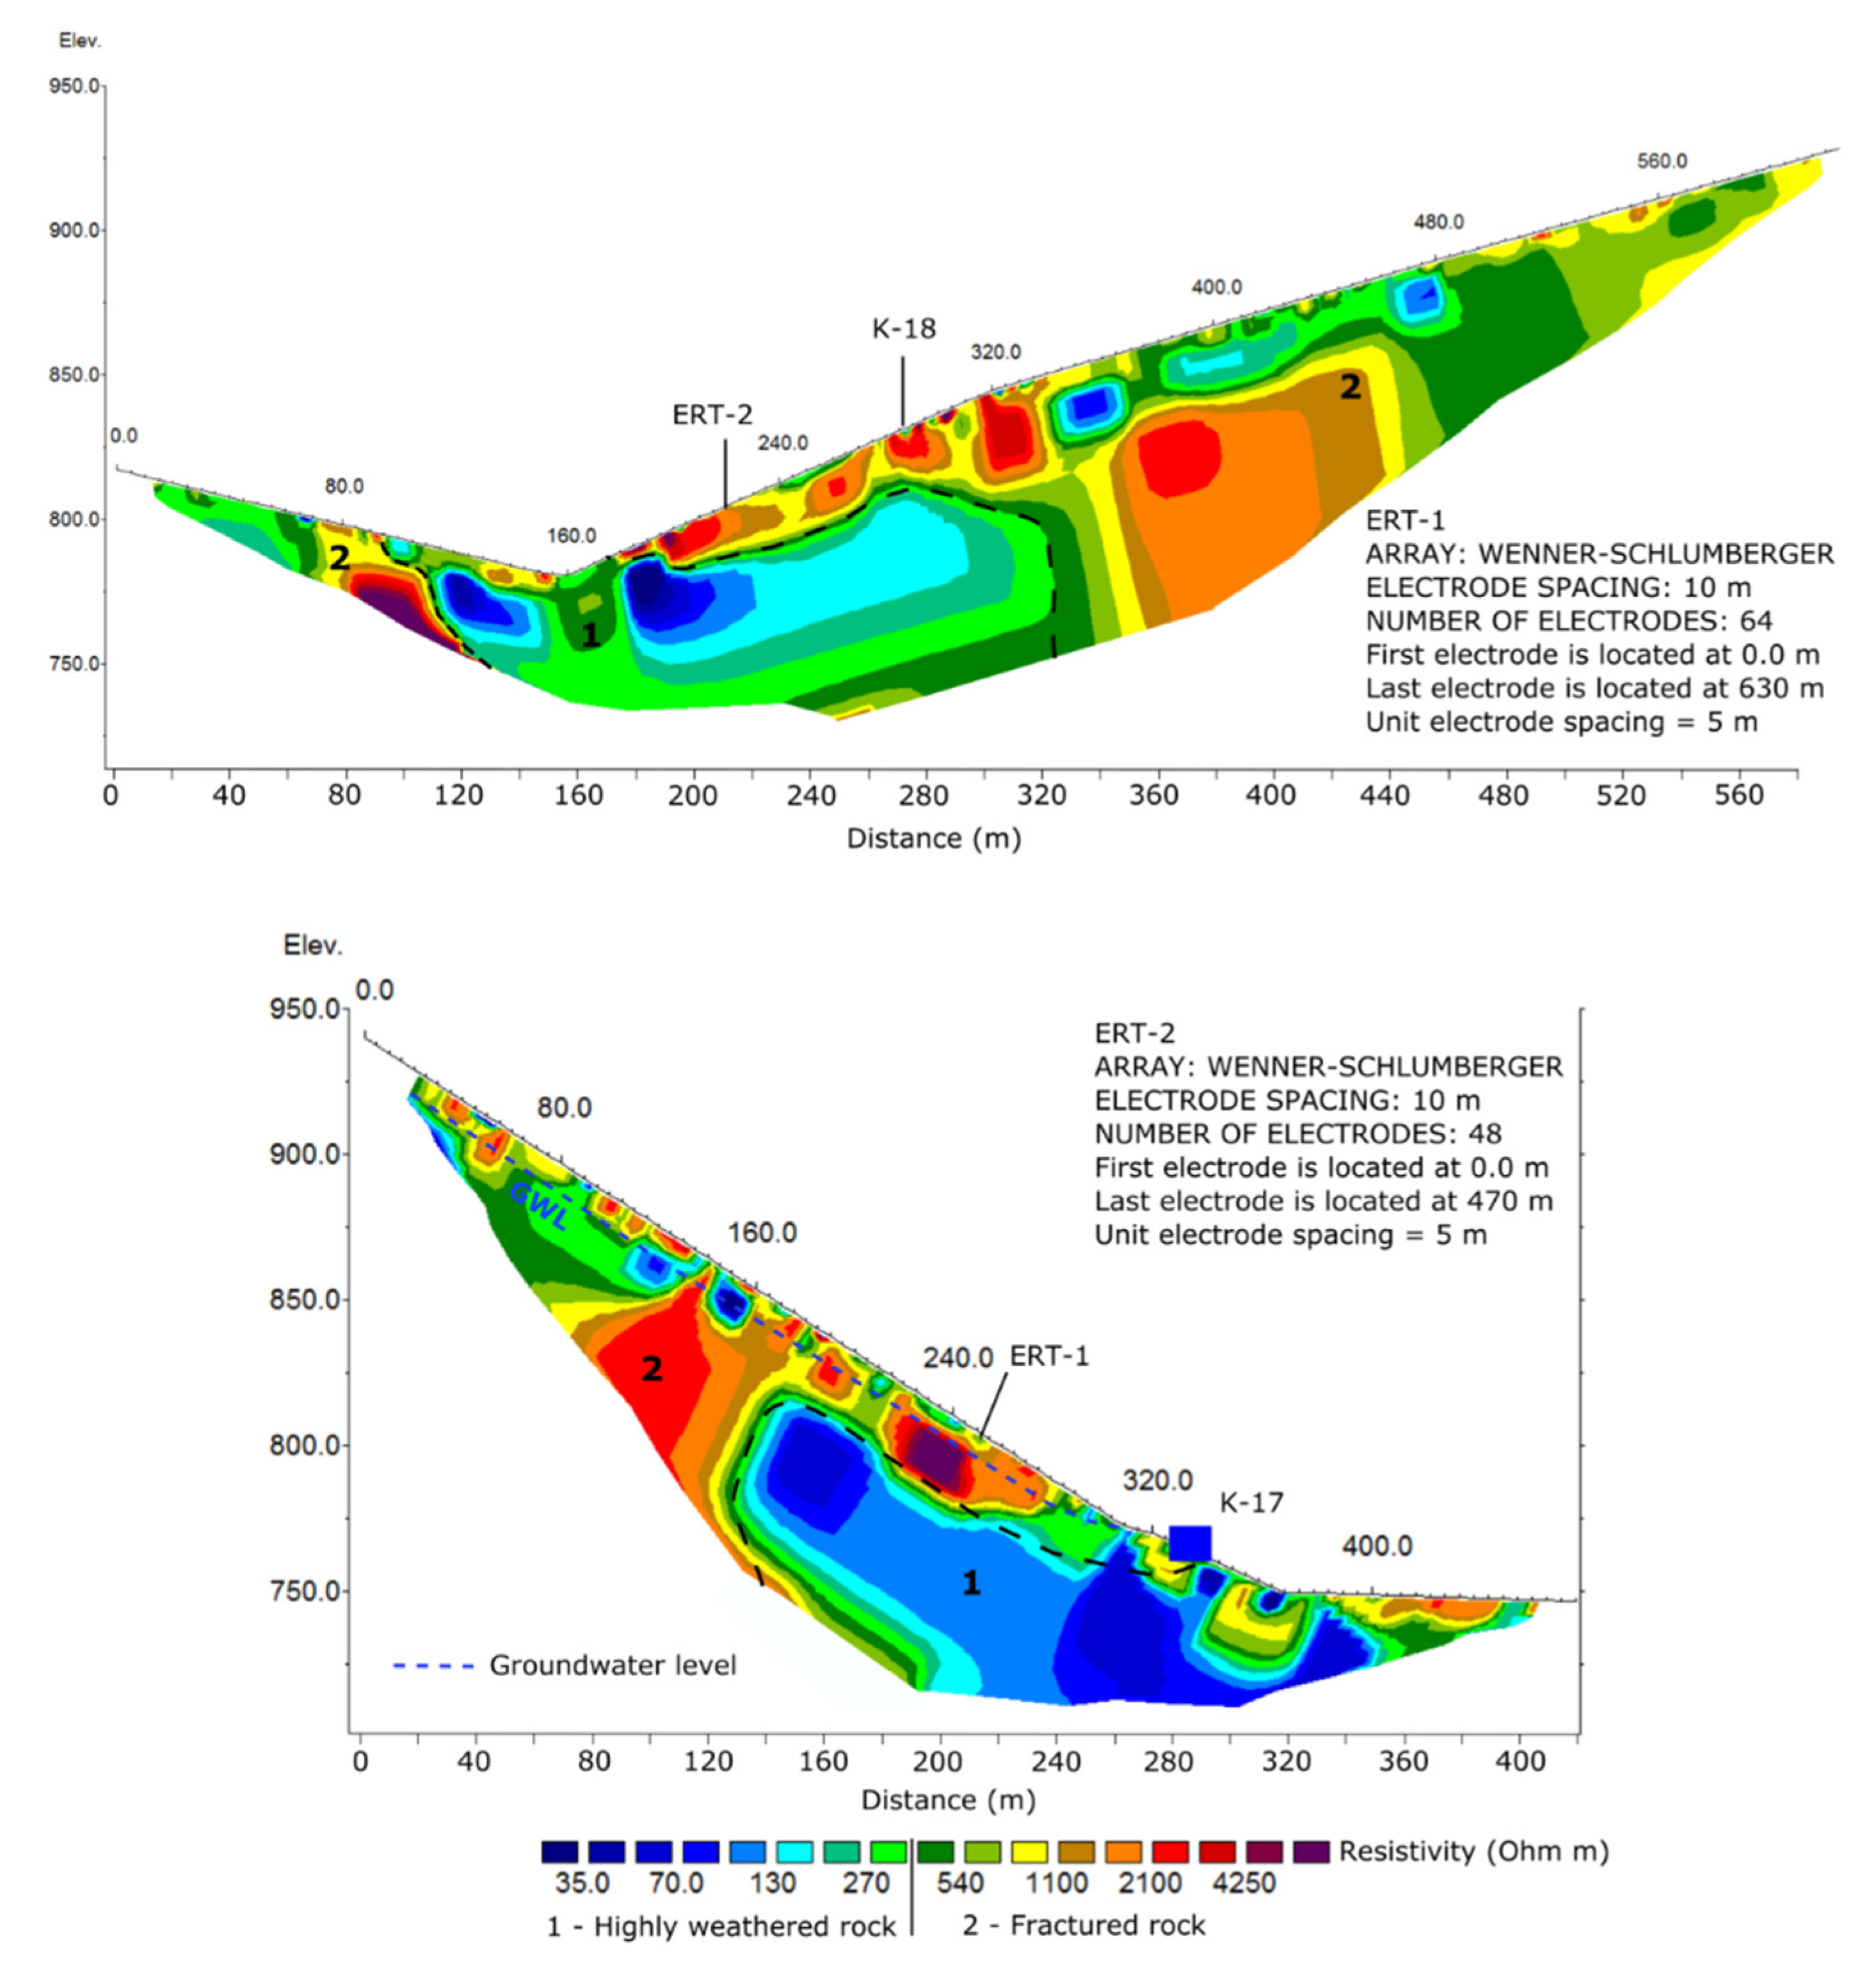
Figure 2 shows positions of four profiles and positions of springs. The first profile (ERT-1) was measured with 64 steel electrodes; the length of the profile was 630 m, with an exploration depth of about 100 m. Profile ERT-2 was measured with 48 electrodes; the length of the profile was 470 m, with an exploration depth of about 75 m. Profile ERT-3 and ERT-4 were measured with 32 electrodes; the lengths of the profiles were both 310 m, with an exploration depth of about 50 m.
All profiles were situated on the hill slopes, so it was important to measure altitude and position of every electrode. This was measured using the TruPulse 360 laser Rangefinder (Laser Technology Inc., Centennial, CO, USA), which has an integrated compass. This is a simple 2-shot routine that instantly calculates the distance, inclination, and azimuth direction value between any two remote points.
Before every measurement, the contact impedance (electrode contact resistance) value of each electrode was checked. Contact impedance values should be as low as possible to facilitate the current injection, and, more importantly, they should be homogeneous to avoid spot anomalies in the data. Poor electrode contact causes potential errors in the data [
34]. When contact impedance was high, sodium-chloride solution was used to improve contact with the medium. During the field measurements, the frequency was lowered until the number of incorrect measurements was below 10%.
The RES2DINV resistivity inversion software [
30] was used to automatically invert the apparent resistivity data from the field into two-dimensional resistivity subsurface models. This software has two different inversion routines for the creation of earth models from resistivity field data [
14]. The smoothness-constrained least-squares method [
35,
36] is based on an L2 norm [
37,
38]. This method minimizes the square of the differences between the measured and calculated apparent resistivity values and typically produces smoothly varying resistivity distributions, so the precise location of interfaces can sometimes be difficult to determine in the absence of a priori subsurface information [
2]. The second inversion routine within RES2DINV is an L1 norm regularized inversion method [
37], also known as the robust or blocky inversion method [
39]. This method minimizes the absolute difference between the measured and calculated apparent resistivity values [
40]. Inversion with the L1 norm usually produces earth resistivity models with relatively sharp boundaries between resistivity zones, but the resistivity usually has limited variation within resistivity zones [
30]. In the studied case, the smoothness constrained inversion resulted in a much higher root-mean-square (RMS) error (the absolute root-mean-square error) and an unrealistic image of geological settings. Since the robust inversion model was the best fit with surface geological mapping and resulted in the lowest RMS error, it was selected for data inversion.
The RES2DINV program by default uses a model where the width of the interior model blocks is the same as the unit electrode spacing. In situations with large resistivity variations near the ground surface, better results can be obtained by using narrower model cells, e.g., half of the unit electrode spacing usually gives the optimum result [
30]. Measurements in the area of Jelenske vode showed large resistivity variations near the ground surface so a model cell size of half the unit electrode spacing was used.
In surveys of the areas with significant changes in the elevation of the ground surface, the effect of the topography must be taken into account when carrying out an inversion of the data set. The RES2DINV program has three different methods that can be used to incorporate the topography into the inversion model [
30]. In all these methods, the surface nodes of the mesh are shifted up or down so that they match the actual topography. In this case, the topography becomes part of the mesh and is automatically incorporated into the inversion model. The difference between these three methods is the way the subsurface nodes are shifted. The simplest approach, used by the first finite-element method, is to shift all the subsurface nodes by the same amount as the surface node along the same vertical mesh line. According to Loke [
30], this is probably acceptable for cases with small to moderate topographic variation. This approach was used in the presented study, since using the other approaches resulted in higher RMS errors.
3.2. Monitoring of the Springs Hydrodynamics and Hydrochemistry
Spring discharge monitoring, i.e., spring hydrograph, is a basic parameter in determining the dynamic characteristics of an aquifer, which drains at the spring [
41]. Monitoring of additional water physicochemical properties (e.g., water temperature and electrical conductivity) can greatly enhance insight into groundwater flow processes [
42,
43]. High temporal resolution of measurements contributes to a more detailed and reliable characterization of dynamics. Occasional measurements usually miss peaks on hydrographs and/or chemographs after intense rainfall due to their very short duration. Monitoring of the three springs of Jelenske vode (K17, K18, and K23,
Figure 1) was established in October 2018 and lasted until May 2019, which covered both the relatively dry season in autumn and winter, as well as the intense rainfalls in April and especially May 2019.
Continuous monitoring of the dynamics of springs was achieved by using automatic measuring devices with internal memory; data loggers that were placed in the spring intake structures. Onset HOBO Water level loggers were used to measure the water level and the HOBO Fresh Water Conductivity Data Logger was used for the measuring of electrical conductivity and temperature. The water level measurement data were subsequently compensated for changes in atmospheric pressure. Atmospheric pressure was measured by a separate device of the same type as the water level.
In order to determine the functional dependence of the discharge on changes in the water level (consumption curve), several flow measurements under different hydrological conditions should be made during the monitoring of the water level. Based on the consumption curve, the continuous water level measurement data can be transformed into continuous discharge data. The discharge of the three monitored springs was measured directly eight times (monthly intervals) during the monitoring period, using a calibrated bucket, measuring the time required for filling a certain volume of water. Using directly measured discharge data and data of water level measured by data loggers, the consumption curve was made for the spring K-17. At the other two monitored springs, due to technical limitations (inadequate drainage pipe construction, which produced an instable water level), it was not possible to reconstruct continuous discharge data.
Rainfall is the main (and usually the only) source of recharge for drainage systems that drain at the springs. Therefore, rainfall monitoring concurrent with monitoring of the springs provides additional insight into the dynamic features of the system. Precipitation monitoring was established using an automatic logger (Onset HOBO Rain Gauge RG-3 M) with an hourly measurement interval. For collection of cumulative monthly rain samples, we used RAIN SAMPLER RS1B, manufactured by Palmex, which is specially designed to collect and store samples without evaporation [
44]. This is especially important for analyzing stable isotopes of oxygen and hydrogen in water, since the isotopic composition of water changes significantly in the case of evaporation. During the monitoring period, seven samples of spring water were collected (at each spring separately) and rainwater from the spring area was collected at monthly intervals.
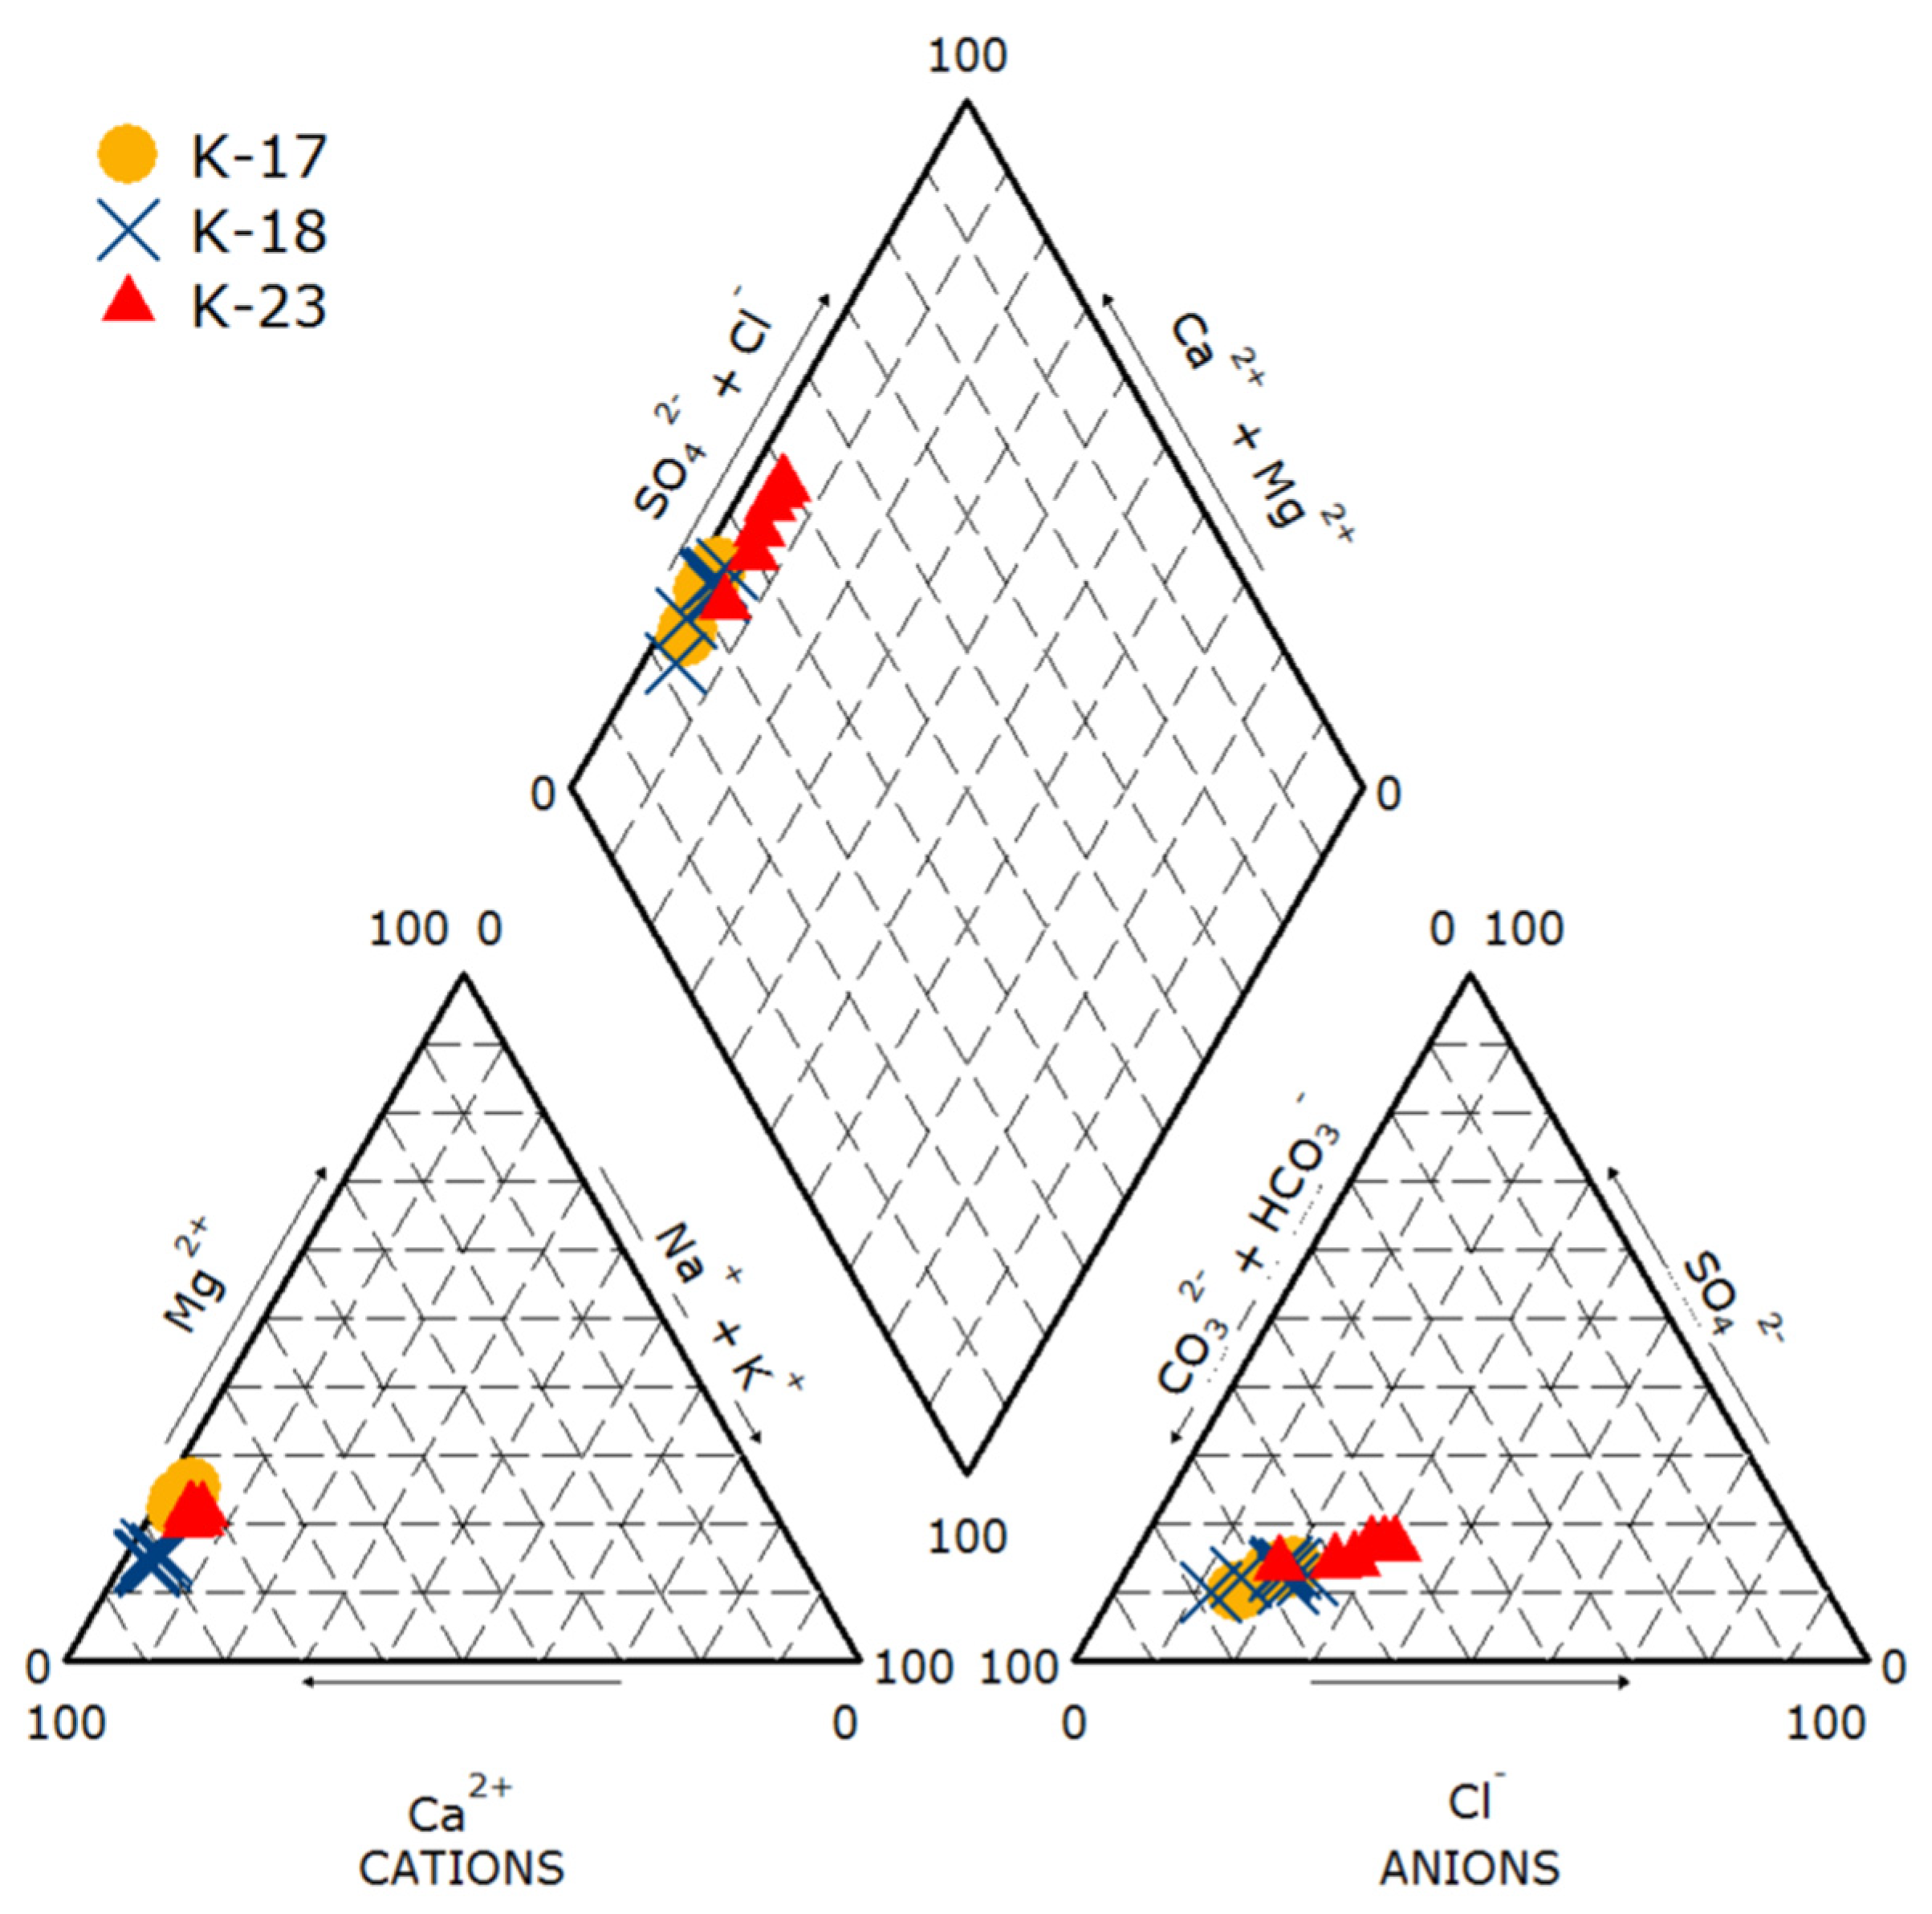
The main anions (HCO3−; Cl−; SO42−) and cations (Ca2+; Mg2+; Na+; K+), natural tracers and indicators of organic matter contamination (NO3−; TOC), and the composition of stable isotopes of oxygen and hydrogen were analyzed on spring water samples. Analyses of stable isotopes of oxygen and hydrogen were also made on monthly precipitation samples. All sample analyses were performed in the hydrochemical laboratory of the Department of Hydrogeology and Engineering Geology of the Croatian Geological Survey. Analyses of principal anions and cations were done using an ion chromatograph Thermo Scientific Dionex ICS-6000 HPIC System. Total organic carbon (TOC) was analyzed using the QBD1200 Laboratory TOC Analyzer (HACH). Stable isotopes of oxygen and hydrogen were analyzed using the Picarro L2130-i Isotope and Gas Concentration Analyzer (PICARRO), using the Secondary Water Isotopes Standard Kit (Picarro) for calibration of the results.
Results of the principal anion and cation analysis in monthly water samples provided definition of the spring water’s hydrochemical facies by construction of a Piper diagram [
45], which graphically presents principal ion ratios. Stable isotope analyses of oxygen and hydrogen in the spring water and rainwater samples served to define spring water origin by its comparison with local precipitation characteristics: Spring water isotope values were plotted and compared with the local meteoric water line defined by local rainwater isotopic characteristics [
46]. Isotopic analyses also enabled a rough estimation of spring water mean residence time (MRT) in the aquifer by using a simple equation based on observed annual oscillation amplitudes in rainwater and spring water samples.
where T is the mean residence time;
A and
B are the amplitudes of the seasonal variation of the isotopic content in the aquifer recharge (rainwater) and the spring water, respectively; ω is the angular frequency. A detailed description and a theoretical background of the applied equation are given in References [
47,
48].
5. Discussion
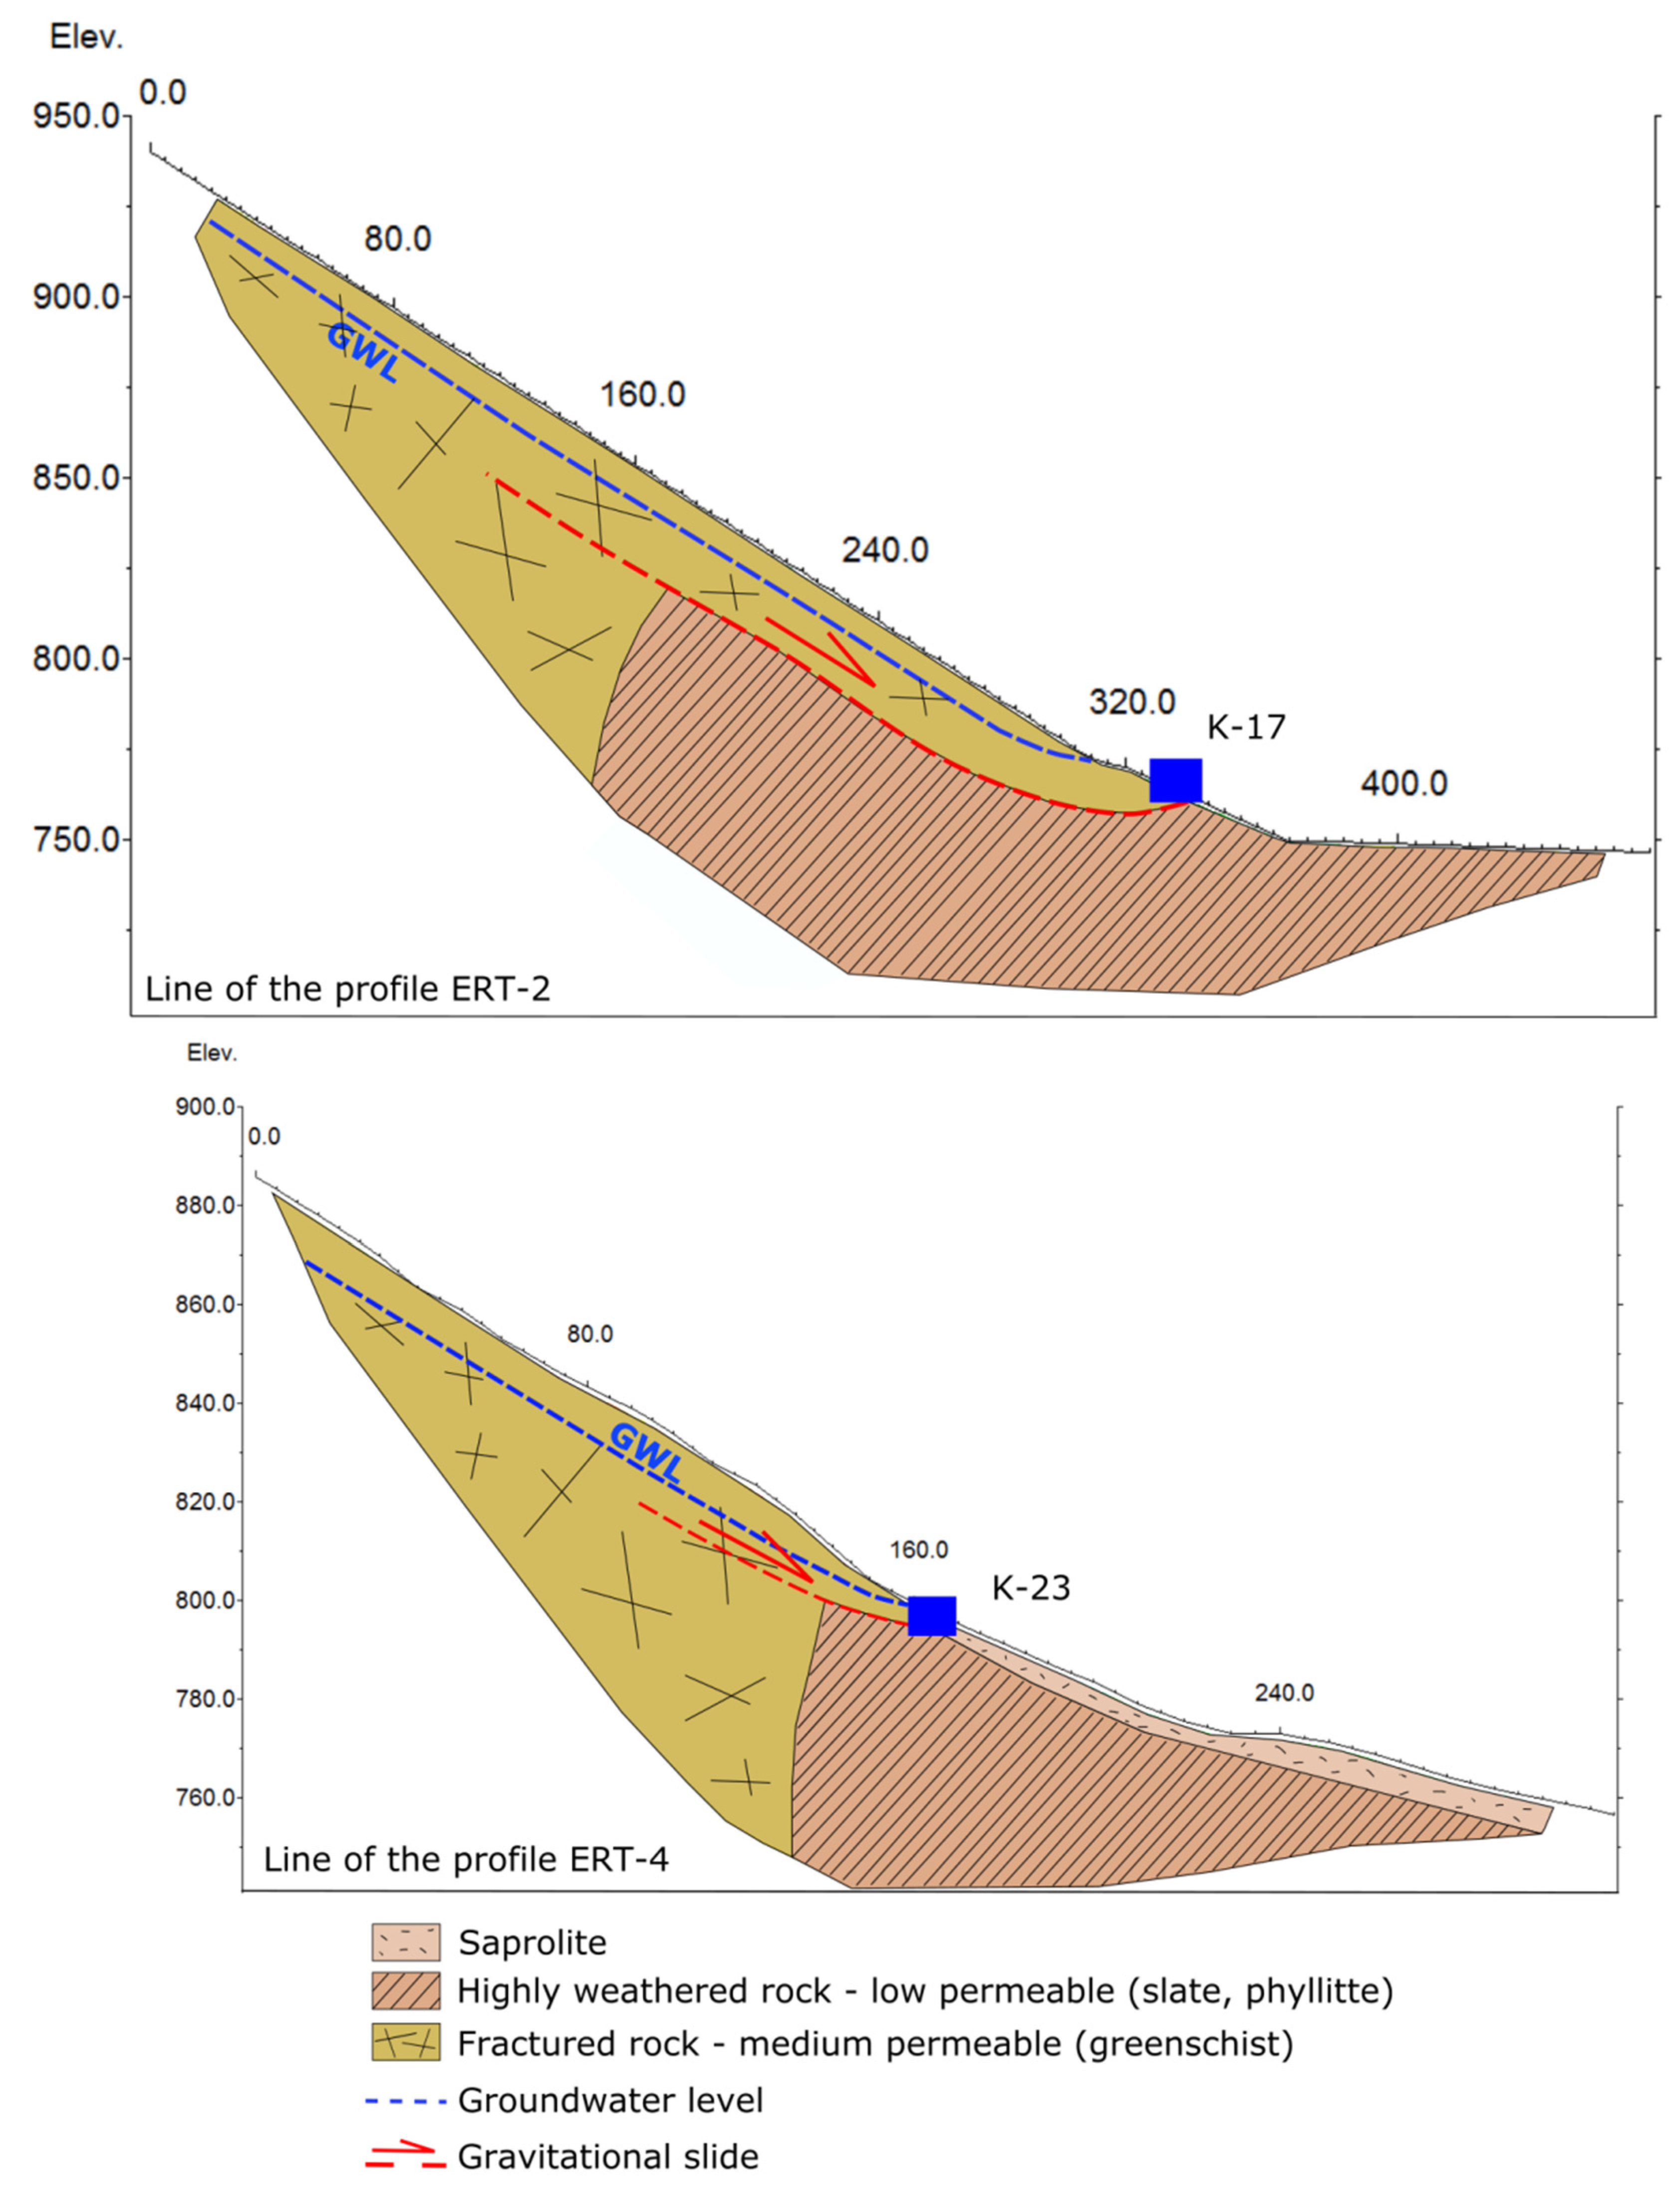
The ERT survey revealed a very complex subsurface structure of the Jelenske vode area (
Figure 3 and
Figure 4). The measured resistivity range was very wide (approximately 20–10,000 Ωm). The distribution of higher and lower resistivity zones on the measured profiles were generally not related to the depth bellow the terrain surface. High differences in resistivity were attributed to the various degrees of weathering of metamorphic rocks within the alteration zone. Transitions from high to low resistivity zones were quite sharp, indicating distinct contact between highly and moderately weathered rock masses. Complete coverage of the measured ERT profiles was within the alteration zone, which was visible from the absence of uniform resistivity increase at the bottom parts of the profiles.
Greenschists were found to be more resistant to weathering than slates and phyllites by surficial mapping. Greenschists are generally characterized by fracture porosity, probably enhanced by alteration processes [
15]. Phyllites and slates, observable on the surface only in intensely eroded stream gullies, are more prone to intensive weathering and saprolite accumulation on the surface. Contact of less weathered rocks with intensely weathered rocks, mostly covered by a saprolite layer, were marked in terrain morphology by transitions from steeper to gentler slopes. Major springs of the Jelenske vode area were situated on such transitions, with greenschist rocks exposed on the surface of slopes above them and mostly saprolite-covered terrain below them. According to the spring positions, as well as measured ERT profiles, highly weathered rock masses form relative barriers for underground fracture flow, which raised the groundwater level to the surface and caused the formation of springs (
Figure 8). Both major springs of Jelenske vode, K17 and K23, were located at, or close to, the transition from medium-high to low resistivity zones on the ERT profiles (
Figure 3 and
Figure 4). On the K17 location, highly weathered rock mass was overlain by approximately 20 m of less weathered rocks, with the spring located at the base of less weathered layer. Higher resistivity rocks lying on top of low resistivity rocks in the immediate hinterland of K17 was interpreted as gravitational sliding of harder greenschist blocks on highly weathered rocks below (
Figure 8). The K23 spring was located at the steep contact of less weathered rock above and highly weathered rock mass below (
Figure 8). Increase of resistivity in the shallow subsurface zone (several meters thick) on the upper parts of both profiles (
Figure 3,
Figure 4 and
Figure 8) was attributed to the depth of groundwater level in the fractured rock mass. A similar significant contrast in specific resistivity between the unsaturated and saturated zone has been noticed by other studies on hard-rock aquifers [
17,
49,
50].
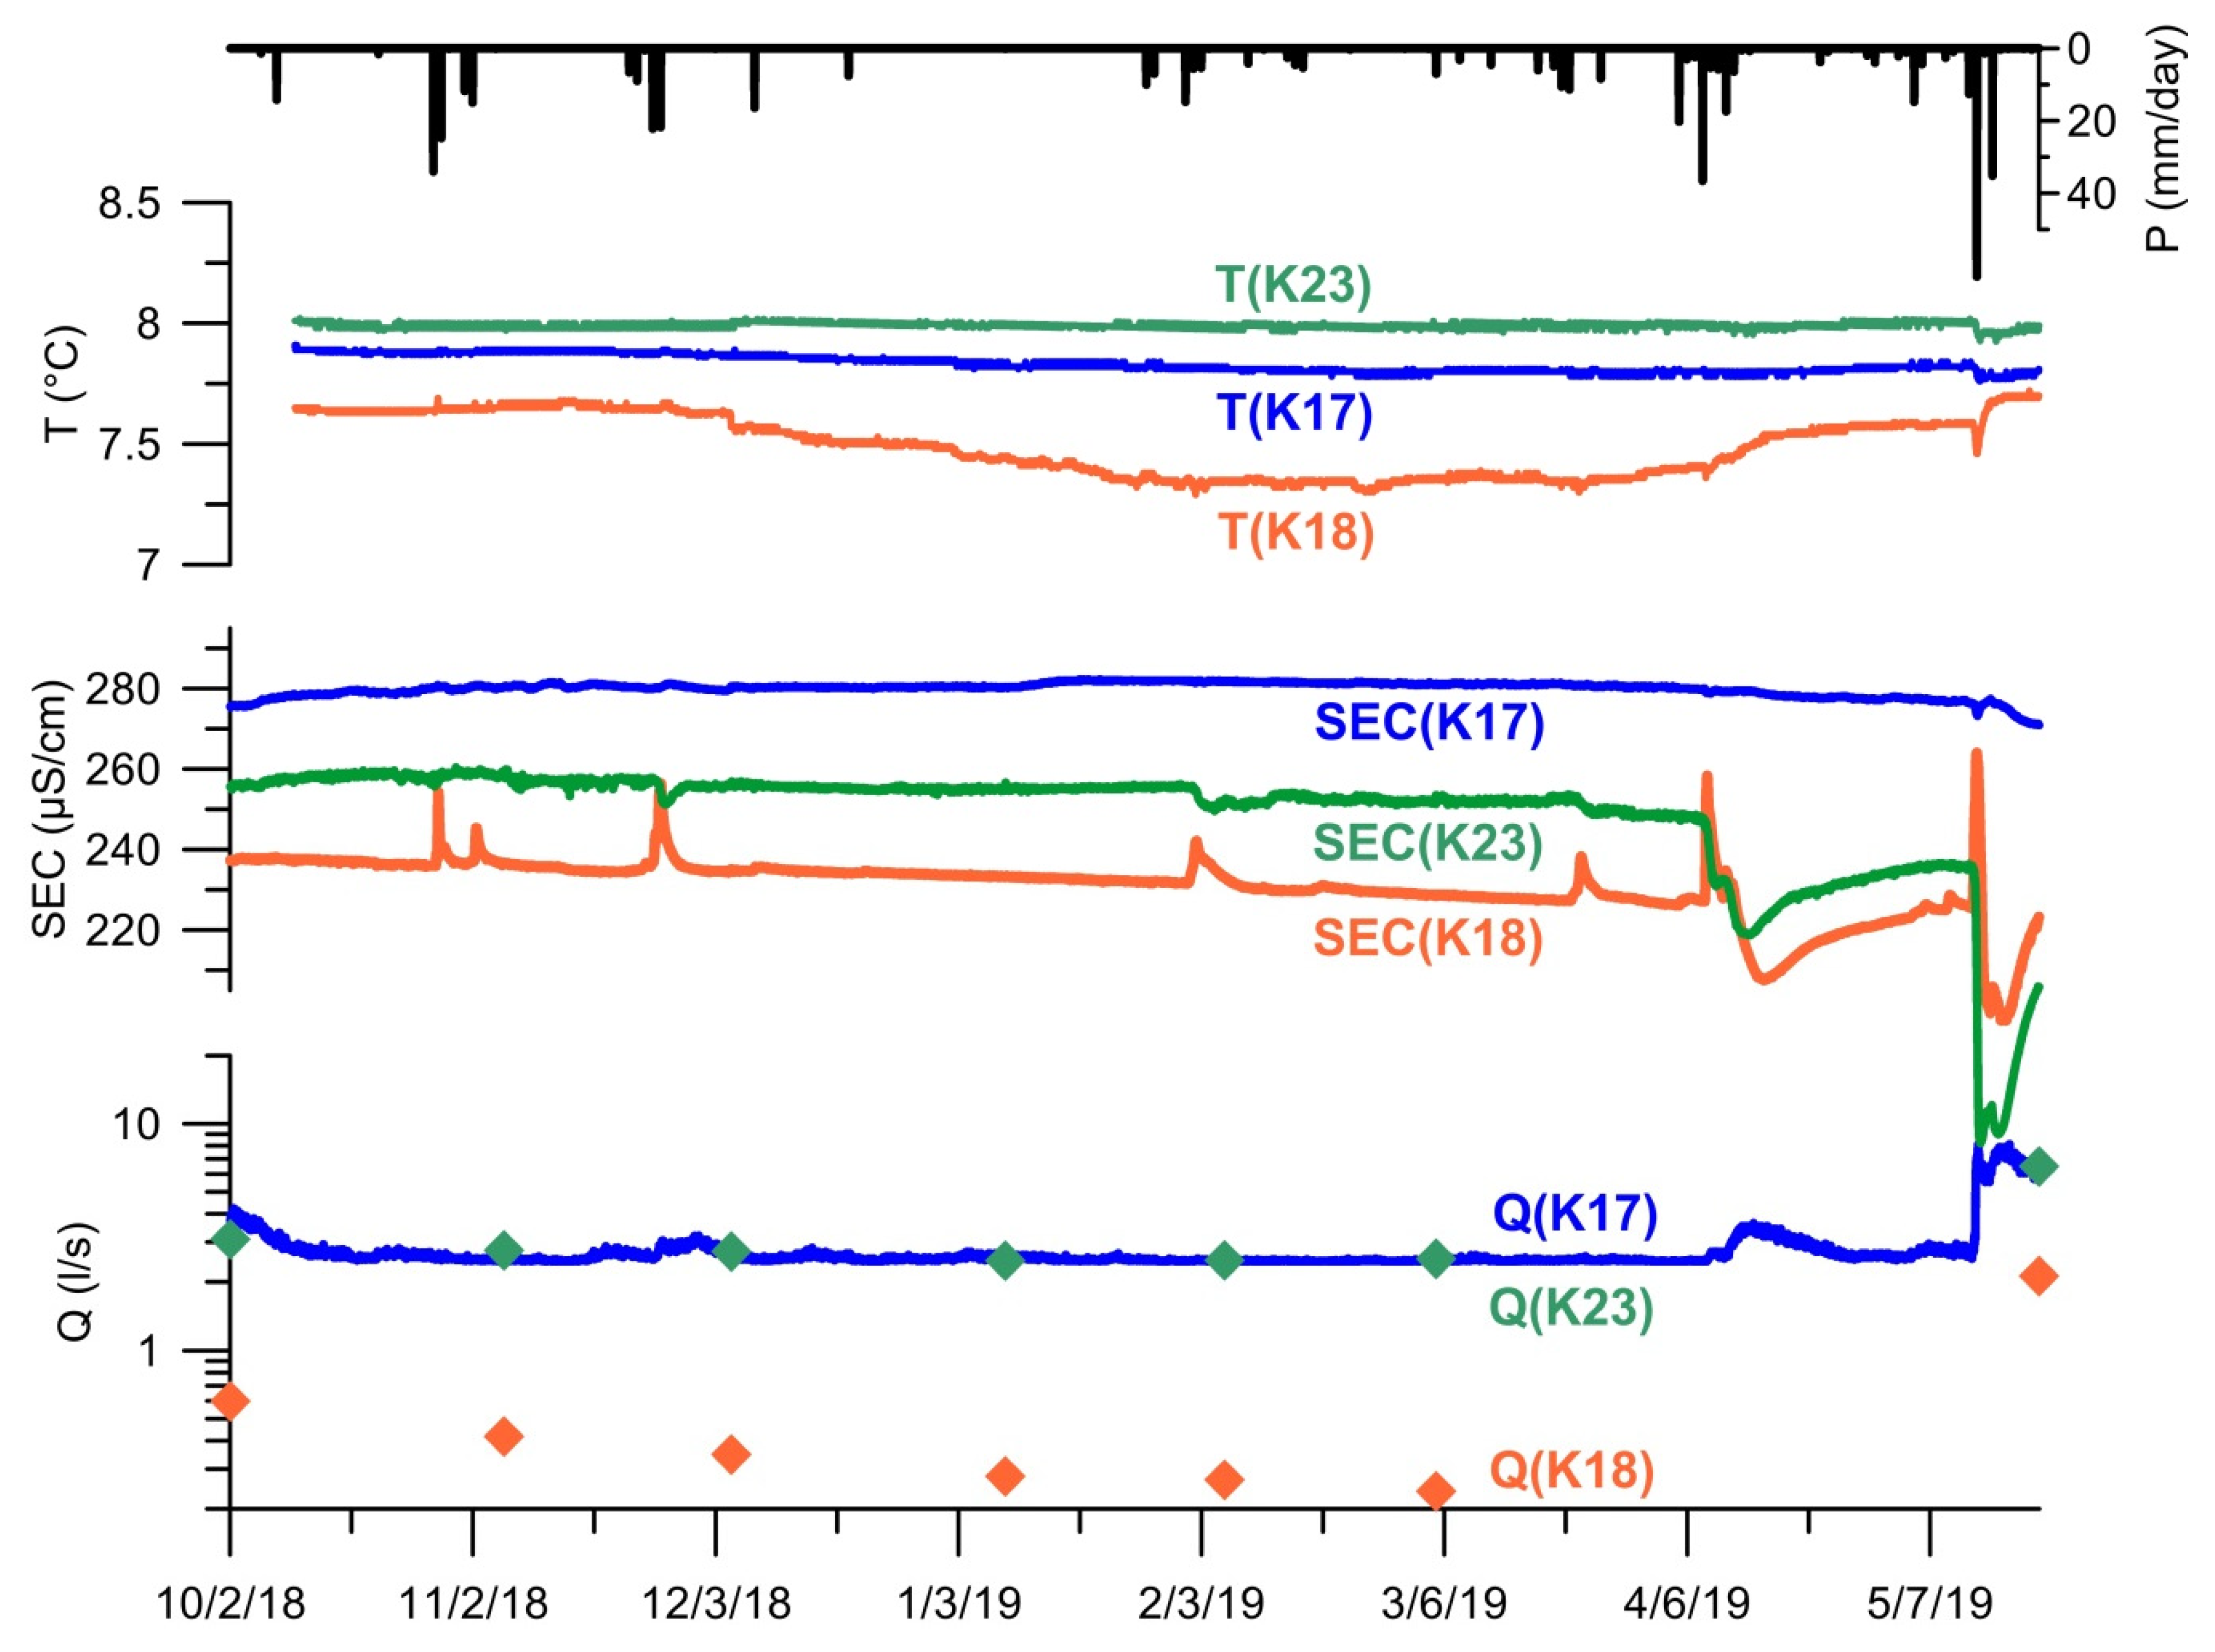
Springs K17 and K23 were marked by very similar flow quantity and dynamics, which points to similar sizes and characteristics of aquifers in their hinterland. Low minimum/maximum ratios and very slow discharge recession during dry season confirm considerable groundwater reserves, which slowly drain from low permeable volumes of the aquifers. However, both springs also reacted quickly to high precipitation events by doubling their discharge in just a few hours. This is an indication of the existence of well-connected permeable fracture networks, which efficiently integrate the aquifers, enable quick groundwater flow, and drain it in a concentrated form at the springs.
SEC is a parameter that directly reflects water mineralization. Mineralization of the water can be an indication of water residence time in the subsurface, as considerable time is often required for water to reach chemical equilibrium with surrounding rocks (especially in the case of predominantly silicate rocks, such as the metamorphic rocks of Medvednica Mount). Water emerging at the spring is usually a mixture of waters with different residence times within the aquifer [
51]. Decline in SEC generally indicates an increase of relatively younger water share in spring water, usually after rainfall. SEC dynamics was much more pronounced on K23 in comparison to the K17 spring. This points to a dominant piston flow effect on K17, i.e., a push of water already stored in a system due to an increase of pressure after the rainfall, with only a very small portion of freshly infiltrated water reaching the spring (minor drops of SEC). Much larger falls of SEC values on K23 show a greater share of water quickly transported through the system after the rain. This indicates a connection of a permeable fracture network directly with the surface, while this connection is more buffered in the case of the K17 aquifer. The temperature, which is a less conservative natural tracer than SEC [
52], was almost constant during majority of the monitoring period, showing its effective equilibration within the aquifer. Only one minor drop, observable on both springs, simultaneous with the highest peak on the hydrograph, was a consequence of a share of very quickly transported water through the subsurface, probably infiltrated in the springs close to the hinterland during intensive rainfall.
Spring K18 showed considerably lower discharge during the entire monitoring period, as well as faster recession during the dry season, when it almost dried up. This showed that its aquifer was much smaller and less integrated by extensive fracture networks. After the moderate rainfalls during the mostly dry season, SEC dynamics showed only mobilization of water with higher mineralization. Only after the major rainfall events, less mineralized water, i.e., “young” water, also appeared at the spring. More mineralized water could originate from the highly weathered low permeable rock mass and saprolite cover, where pressure pulses mobilize water in small fractures and pores, which is tied by cohesive and capillary forces during average conditions. Yearly temperature oscillation, observed on K18, additionally indicates a relatively shallow aquifer affected by seasonal temperature changes.
Spring water hydrochemical facies, as well as relatively low mineralization, was in accordance with general characteristics of groundwater originating from magmatic and metamorphic rocks [
53,
54]. Mineralization was slightly higher than expected for pure silicate rocks (especially on K17), which is probably a consequence of the presence of carbonate minerals in the metamorphic rocks of the Jelenske vode area. A slightly heightened and variable chloride content on K23, with respect to the other two springs, could be caused by pollution from the road and the mountain hut located on the Medvednica Mount. ridge directly above the Jelenske vode area. Possibility of anthropogenic influence on that spring is consistent with its SEC dynamics, i.e., the possibility of fast water transport through the K23 aquifer.
The stable isotope content in the water of all three monitored springs was relatively similar, with observable but low magnitude yearly oscillation. The groundwater mean residence time (MRT) was estimated based on the sine-wave approach, considering the difference in oscillation magnitudes of precipitation and spring water isotopic values [
47,
48]. It should be noted that this was only a preliminary estimation based on a very short monitoring of less than 1 year. However, yearly amplitudes were clearly identifiable on both spring water and precipitation values (
Figure 7). Although a span of water MRTs in a spring water sample can cover a range of several orders of magnitude, the MRT value is still an indicative parameter for evaluation and comparison of various groundwater flow systems. The estimated MRT of approximately 3.5 years on the Jelenske vode springs is relatively long, considering local character and relatively small extents of investigated aquifers. This confirms the hypothesis about prevailing multiyear storage of water in investigated aquifers, although water MRTs can range from several days (indicated by SEC and T monitoring) to several decades or even more.
Combined analysis of ERT results, and hydrodynamic and hydrochemical characteristics of the Jelenske vode springs, showed that aquifers, which are drained by springs with a relatively stable flow regime and minimum discharge above 1 l/s, are formed within less weathered but intensely fractured rock mass (
Figure 8). Lower permeability fissures enable water storage and slow discharge recession during droughts, while a well-integrated and permeable system of major fractures efficiently drains aquifers at points of concentrated discharge, i.e., springs. Although highly weathered rocks and saprolite cover have higher total porosity and water content, disintegration of rock structure and clogging by clay residue lowers fracture persistence and permeability. Thus, highly weathered rock zones can form barriers to fast water flow within major fracture systems. Therefore, within the alteration zone of metamorphic rocks in the Jelenske vode area, blocks with moderate to higher electrical resistivity can be attributed to fractured aquifers, while low resistivity blocks indicate highly weathered rocks of generally lower permeability.
6. Conclusions
The ERT method proved very suitable for identification of zones of various degrees of weathering in the metamorphic rock alteration zone. Highly weathered zones showed resistivity generally below 200 Ωm, while less weathered fractured rock mass displayed resistivities above 500 Ωm. Highly weathered and less weathered zones were often in sharp contact, and contact positions were not related to the depth below surface. The measured ERT profile depth was completely within the alteration zone, and non-altered rocks were mostly below the penetration depth of the profiles. Both main springs at the Jelenske vode area (K17 and K23) were located near the contact of less weathered rocks above the springs, with highly weathered rocks below. Although alteration processes in metamorphic rocks initially increase fracture permeability, weathering progression in later stages reverses this process by reduction of fracture persistence and permeability (clogging by clay residues). In this way, highly weathered rocks form barriers to relatively fast groundwater flow within major fracture systems. This raises the water level toward the surface and results in appearance of the main springs. Therefore, in the alteration zone of the surveyed terrain, blocks with moderate to higher electrical resistivity were interpreted as fractured rocks forming local aquifers, while low resistivity blocks indicated highly weathered rocks of generally low permeability (despite their higher total porosity, i.e., water content). The observed inverse porosity–permeability relationship is analogous to course (gravel, sand) and fine grained (clay, silt) alluvial sediments.
Recharge of the main springs of the Jelenske vode is provided by the drainage function of permeable fracture networks, which connect and integrate surrounding rock masses and thus form aquifers. Water storage, i.e., reserves, is contained mostly in lower permeability aquifer volumes (small fractures and fissures), while more permeable fractures enable relatively fast transport and concentrated discharge at the springs. Fast infiltration to the drainage network after the intense precipitation was observed on the K23 aquifer, while infiltration was more buffered on K17, probably due to better developed soil cover and surficial saprolite layer. In contrast to aquifer characteristics of the two main springs, the K18 spring discharges from shallower aquifer with much lower reserves, which is probably related to the drainage of the saprolite layer and surficial zone of the fractured bedrock. Although K18 was the only analyzed spring with such characteristics, the majority of other springs without intake structures in the Jelenske vode area were similar (based on occasional observations). Hydrochemical facies and mineralization of samples from all three monitored springs were in accordance with general characteristics of groundwater originating from metamorphic rocks. Additionally, stable isotope compositions revealed similar MRTs for all springs (3.5 years). This is relatively long, considering relatively shallow depth and small aquifer extents.
Although studied aquifers can be categorized as modestly productive, their location in the central part of the mountain makes them an appropriate source of water supply for the nearby tourism facilities. Their relatively small extent decreases the area, which should be covered by sanitary protection measures, especially in comparison to more widely-used karstic aquifers. A decrease of permeability with depth keeps the water level close to the surface, even on steep slopes. This offers a possibility of drilling additional shallow boreholes in order to increase water supply. Potential boreholes should be located sufficiently away from the already exploited springs in order to prevent reduction of the spring capacity. However, limited extent of interconnected fracture systems should reduce the area influenced by water level drawdown.
Combining the ERT method with monitoring of spring discharge dynamics and hydrochemical characteristics proved to be an efficient methodology for characterization of aquifers formed in crystalline rocks. The ERT method successfully revealed the local subsurface structure of the alteration zone, in which aquifers can be formed, while discharge and hydrochemical monitoring revealed groundwater flow characteristics at the catchment scale. In areas without significant natural springs, the described monitoring of groundwater dynamics and chemistry can be based on borehole measurements.
Although data acquired by the ERT should be considered qualitative (soft) data, described methodology presents a cost-effective input for future detailed aquifer characterization, which should be complemented by drilling in order to obtain hard data, i.e., the confirmation of the presented model of the subsurface.


