1. Introduction
Rockfalls are among the fastest natural mass movements, with a high damage capacity due to the high velocities and high impact energies produced during the propagation [
1]. The term fragmental rockfall is reserved for the events in which the individual fragments move as independent rigid bodies interacting with the ground surface by means of episodic impacts [
2,
3]. Their behavior is very different from that of rock avalanches. In the latter, the masses of fragments move as a granular flow. The breakage produces an increase in the number of fragments and consequently, modifies the probability of impact and the impact energy of each fragment [
4,
5,
6,
7]. Rock fragmentation has a direct effect in the hazard characterization and, in the quantification of risk [
7].
In the mining industry, the fragmentation of rock blocks has been characterized by the mean size or the diameter before (D) and after (d) breakage [
8,
9,
10], which has been related with the explosive energy and powder factors. To complement it, a shape coefficient for the whole distribution may be included [
10]. The mean size and the uniformity coefficient are parameters required to generate statistical distributions, that are compared to the observed rock fragments distributions. The most commonly used approach is the Rosin–Rammler distribution models [
11,
12,
13,
14]. Alternatively, the largest remaining fragment has been suggested as descriptor of the fragmentation intensity [
15,
16].
The rockfall fragmentation has been analyzed empirically by means of real scale tests [
17,
18,
19], and in the laboratory [
16]. The results showed the complexity in predicting the fragmentation criteria based exclusively on impact energy thresholds of individual rock blocks. On the other hand, numerical simulations with Discrete Elements Methods highlight that high kinetic energy associated with steep slopes increases the intensity of fragmentation [
20].
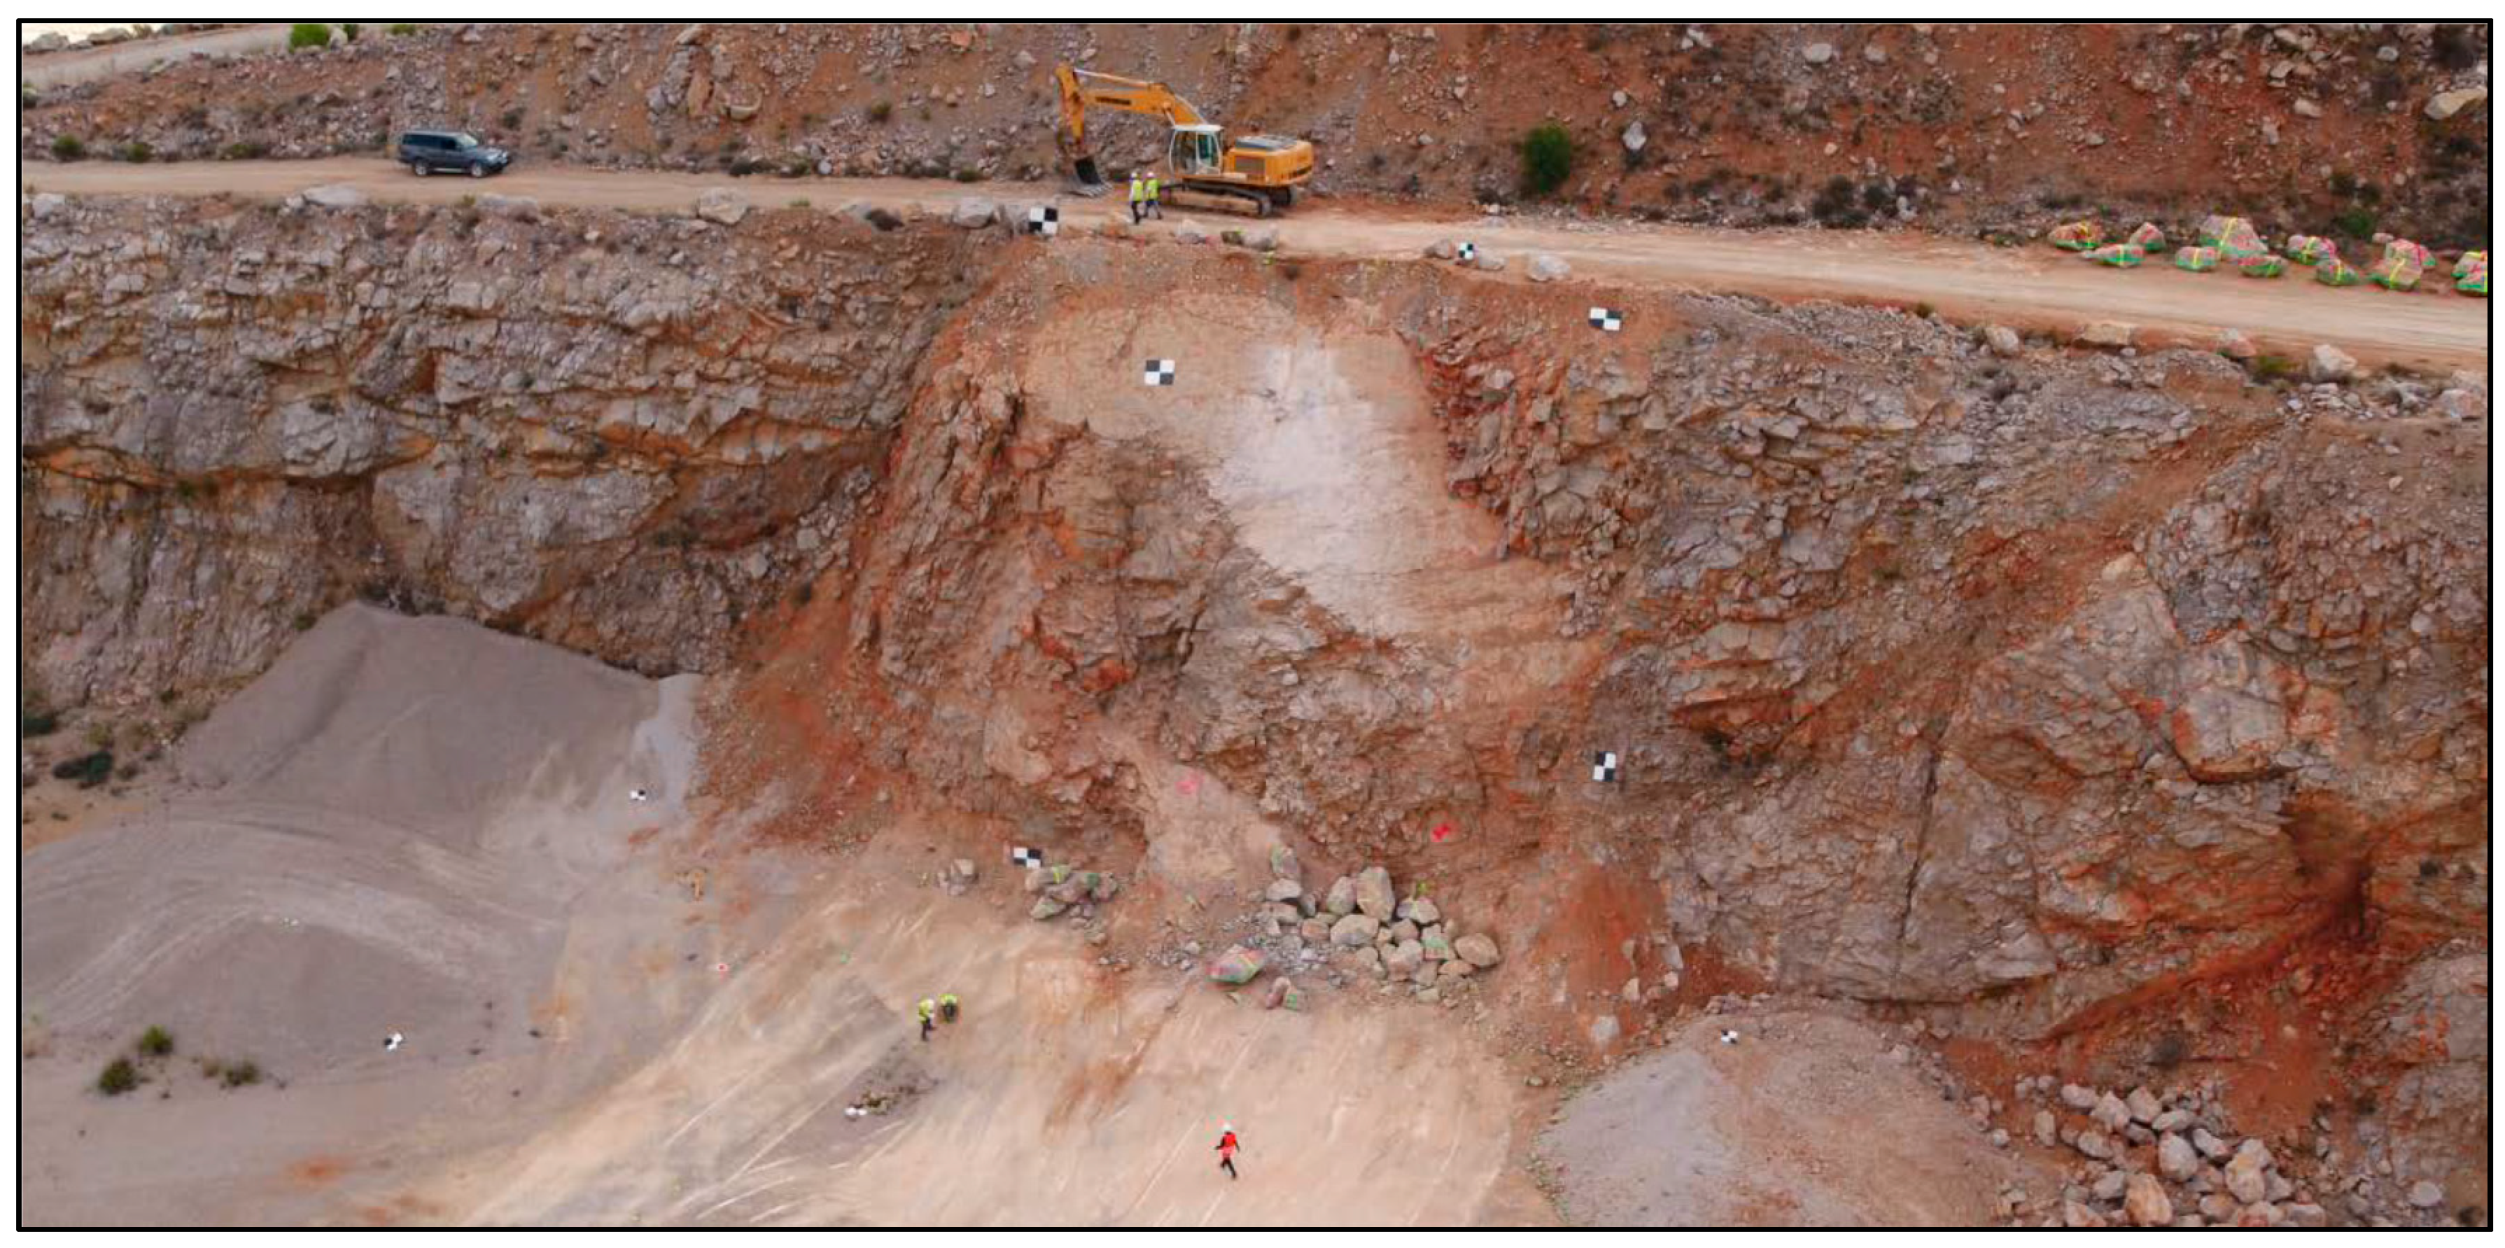
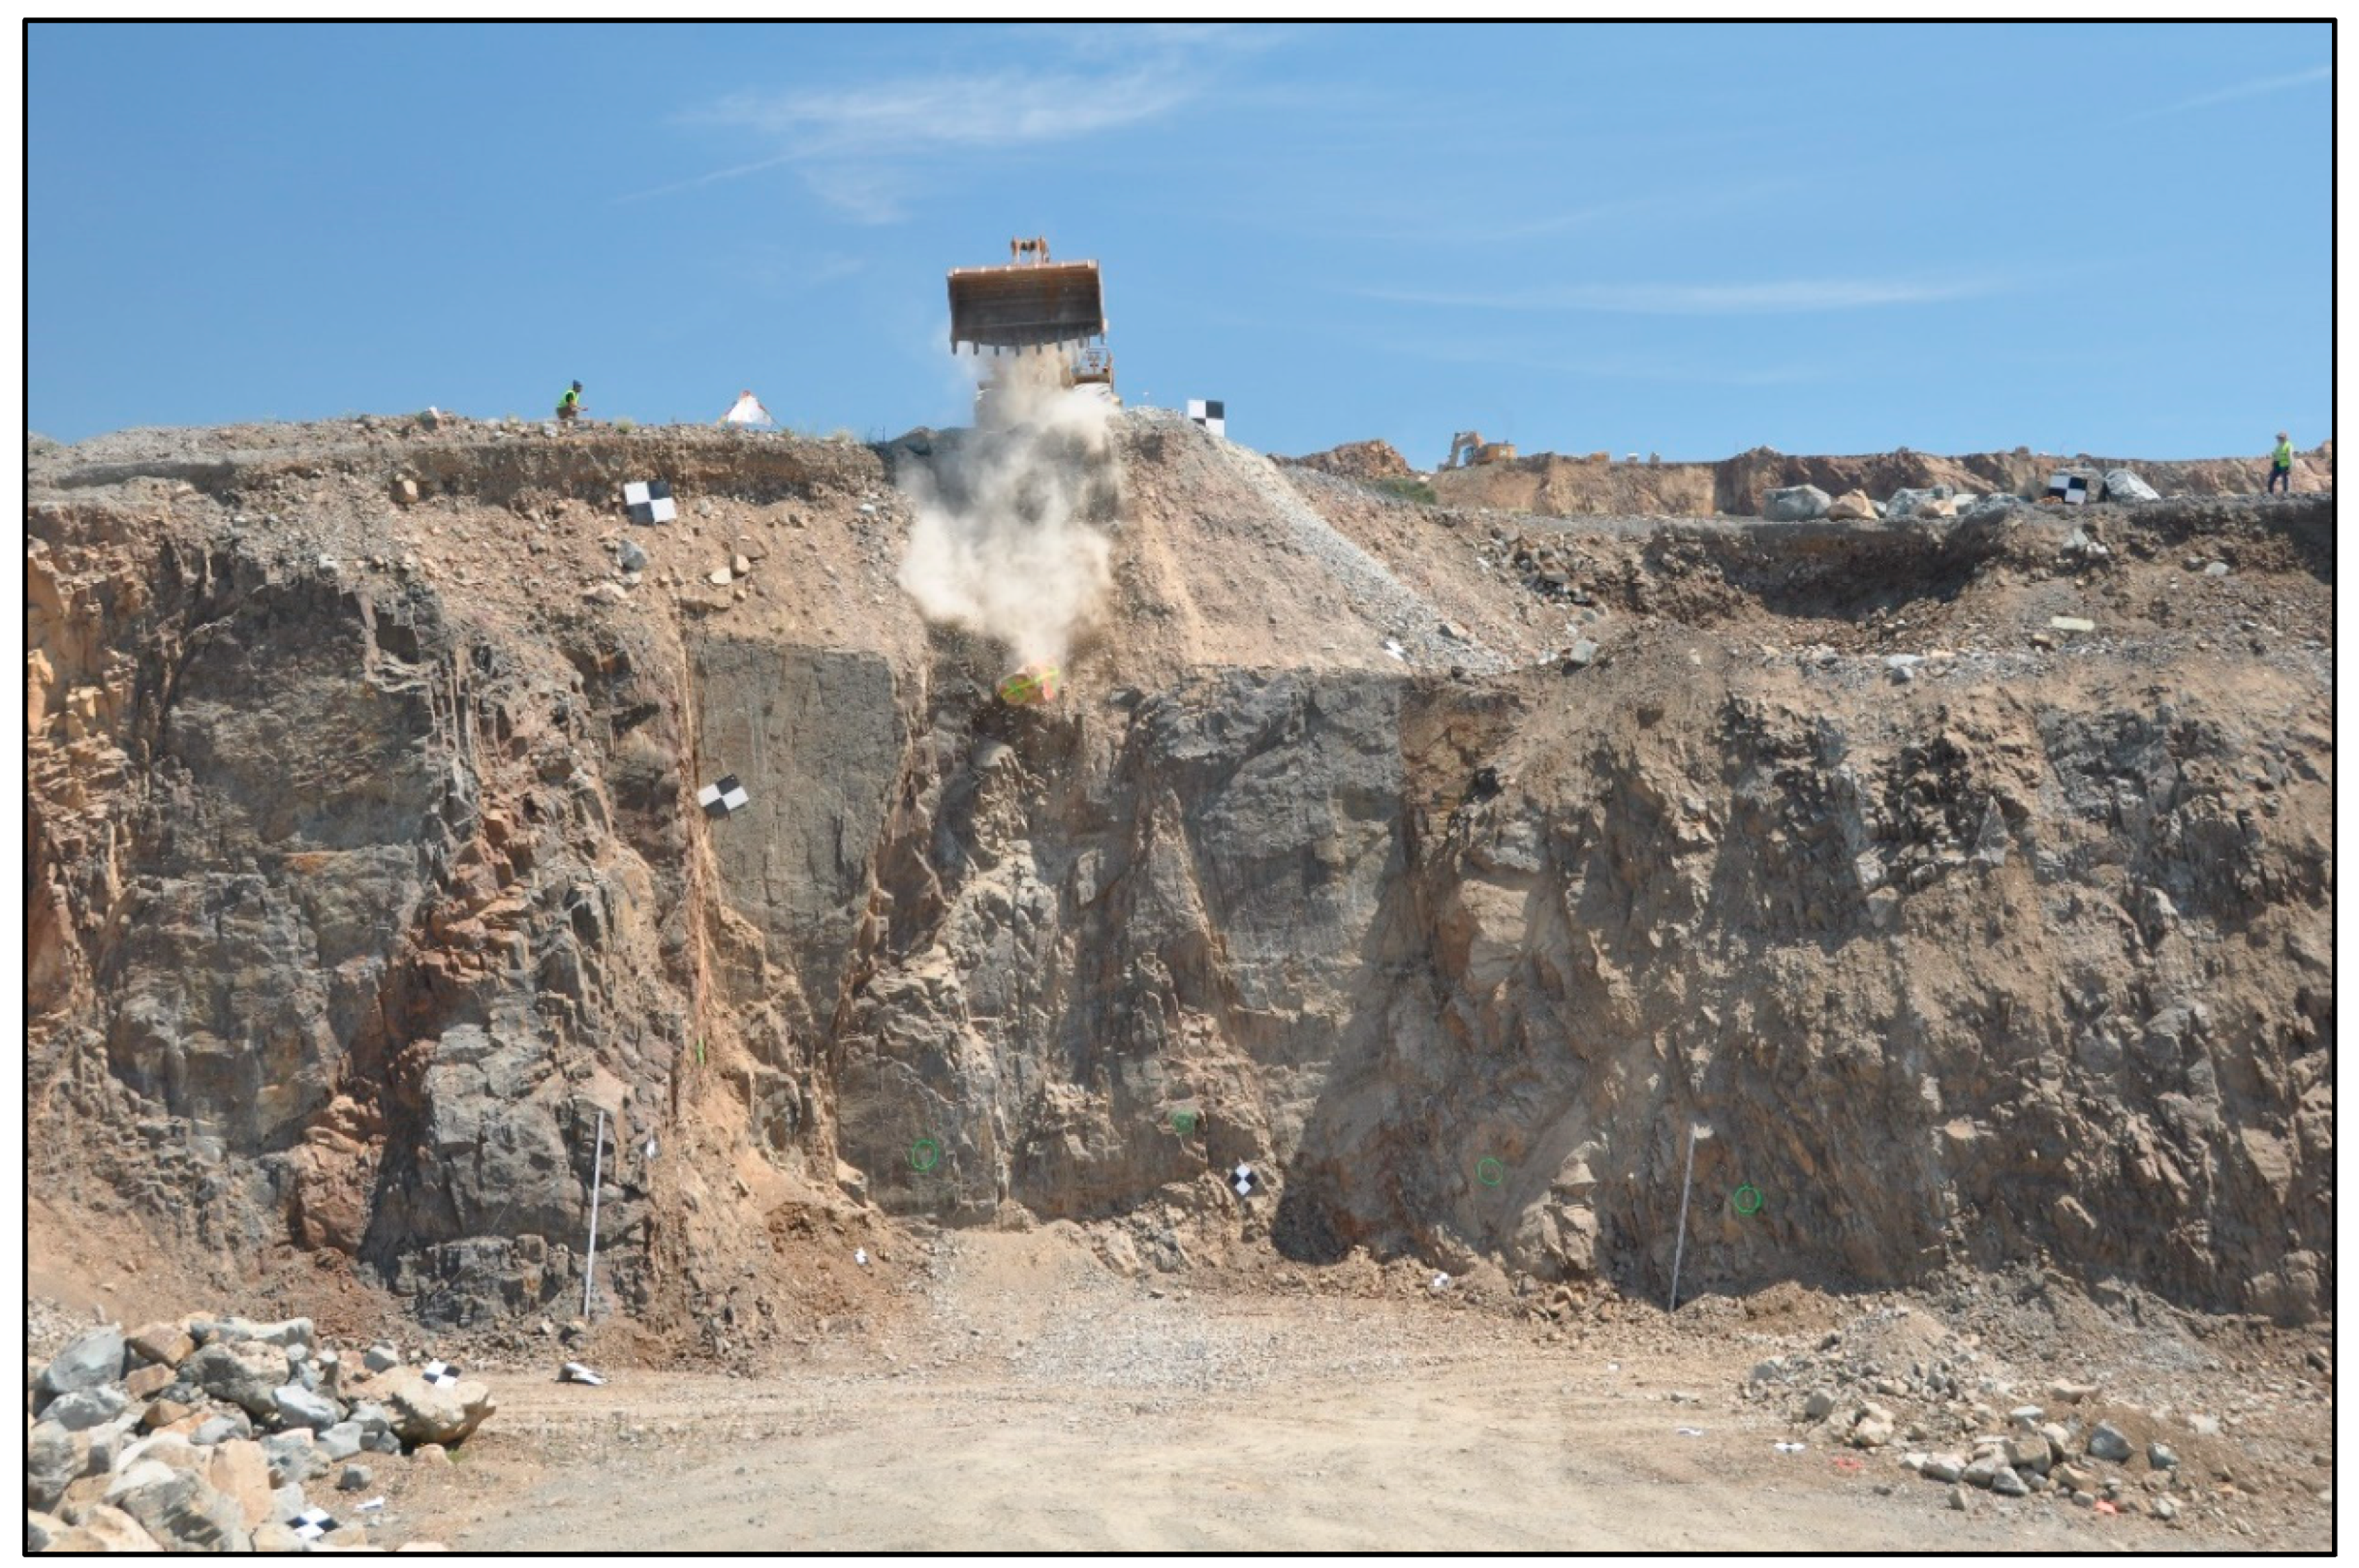
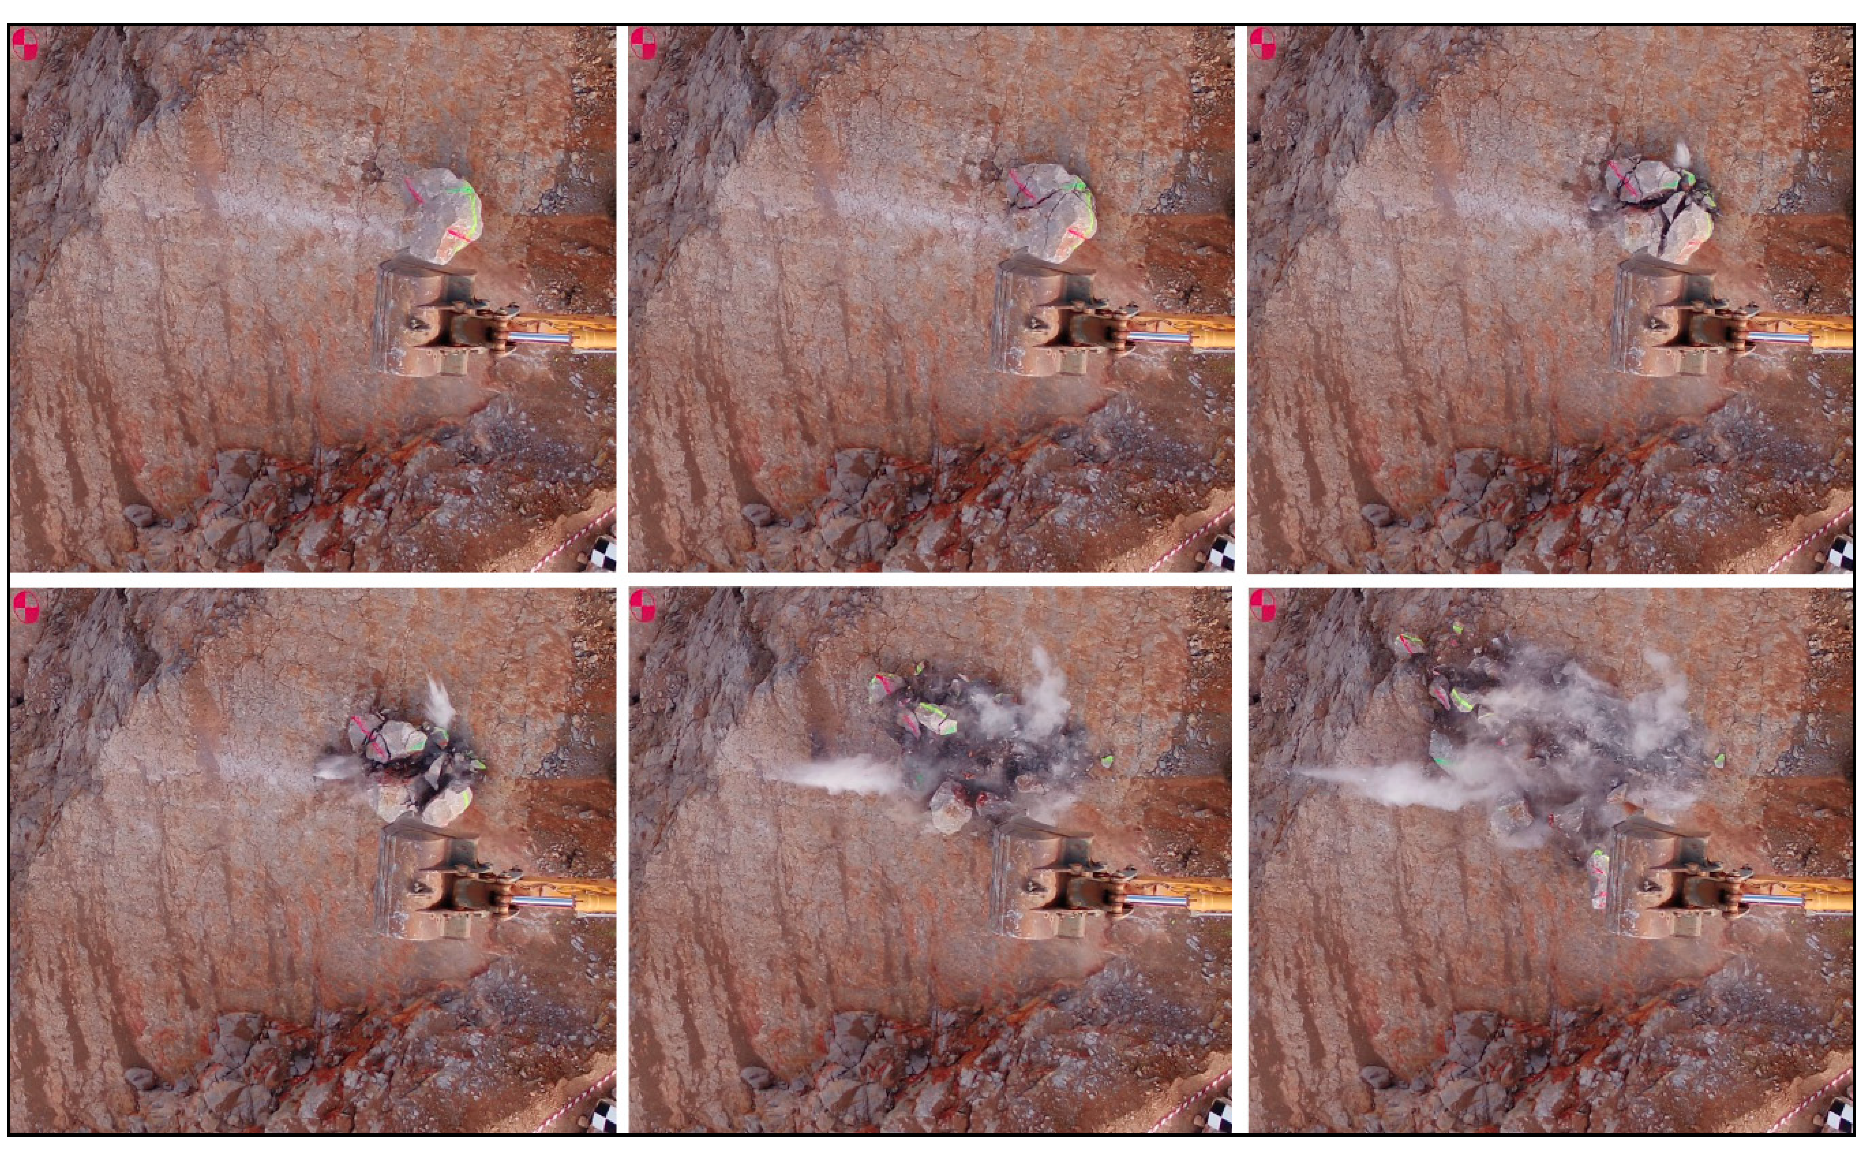
Real-scale fragmentation tests (
Figure 1 and
Figure 2) may provide high quality data in a very controlled scenario with the possibility to repeat the test several times [
21]. We performed four real-scale fragmentation tests in quarries dropping rock blocks of volumes ranging between 0.17 m
3 and 5 m
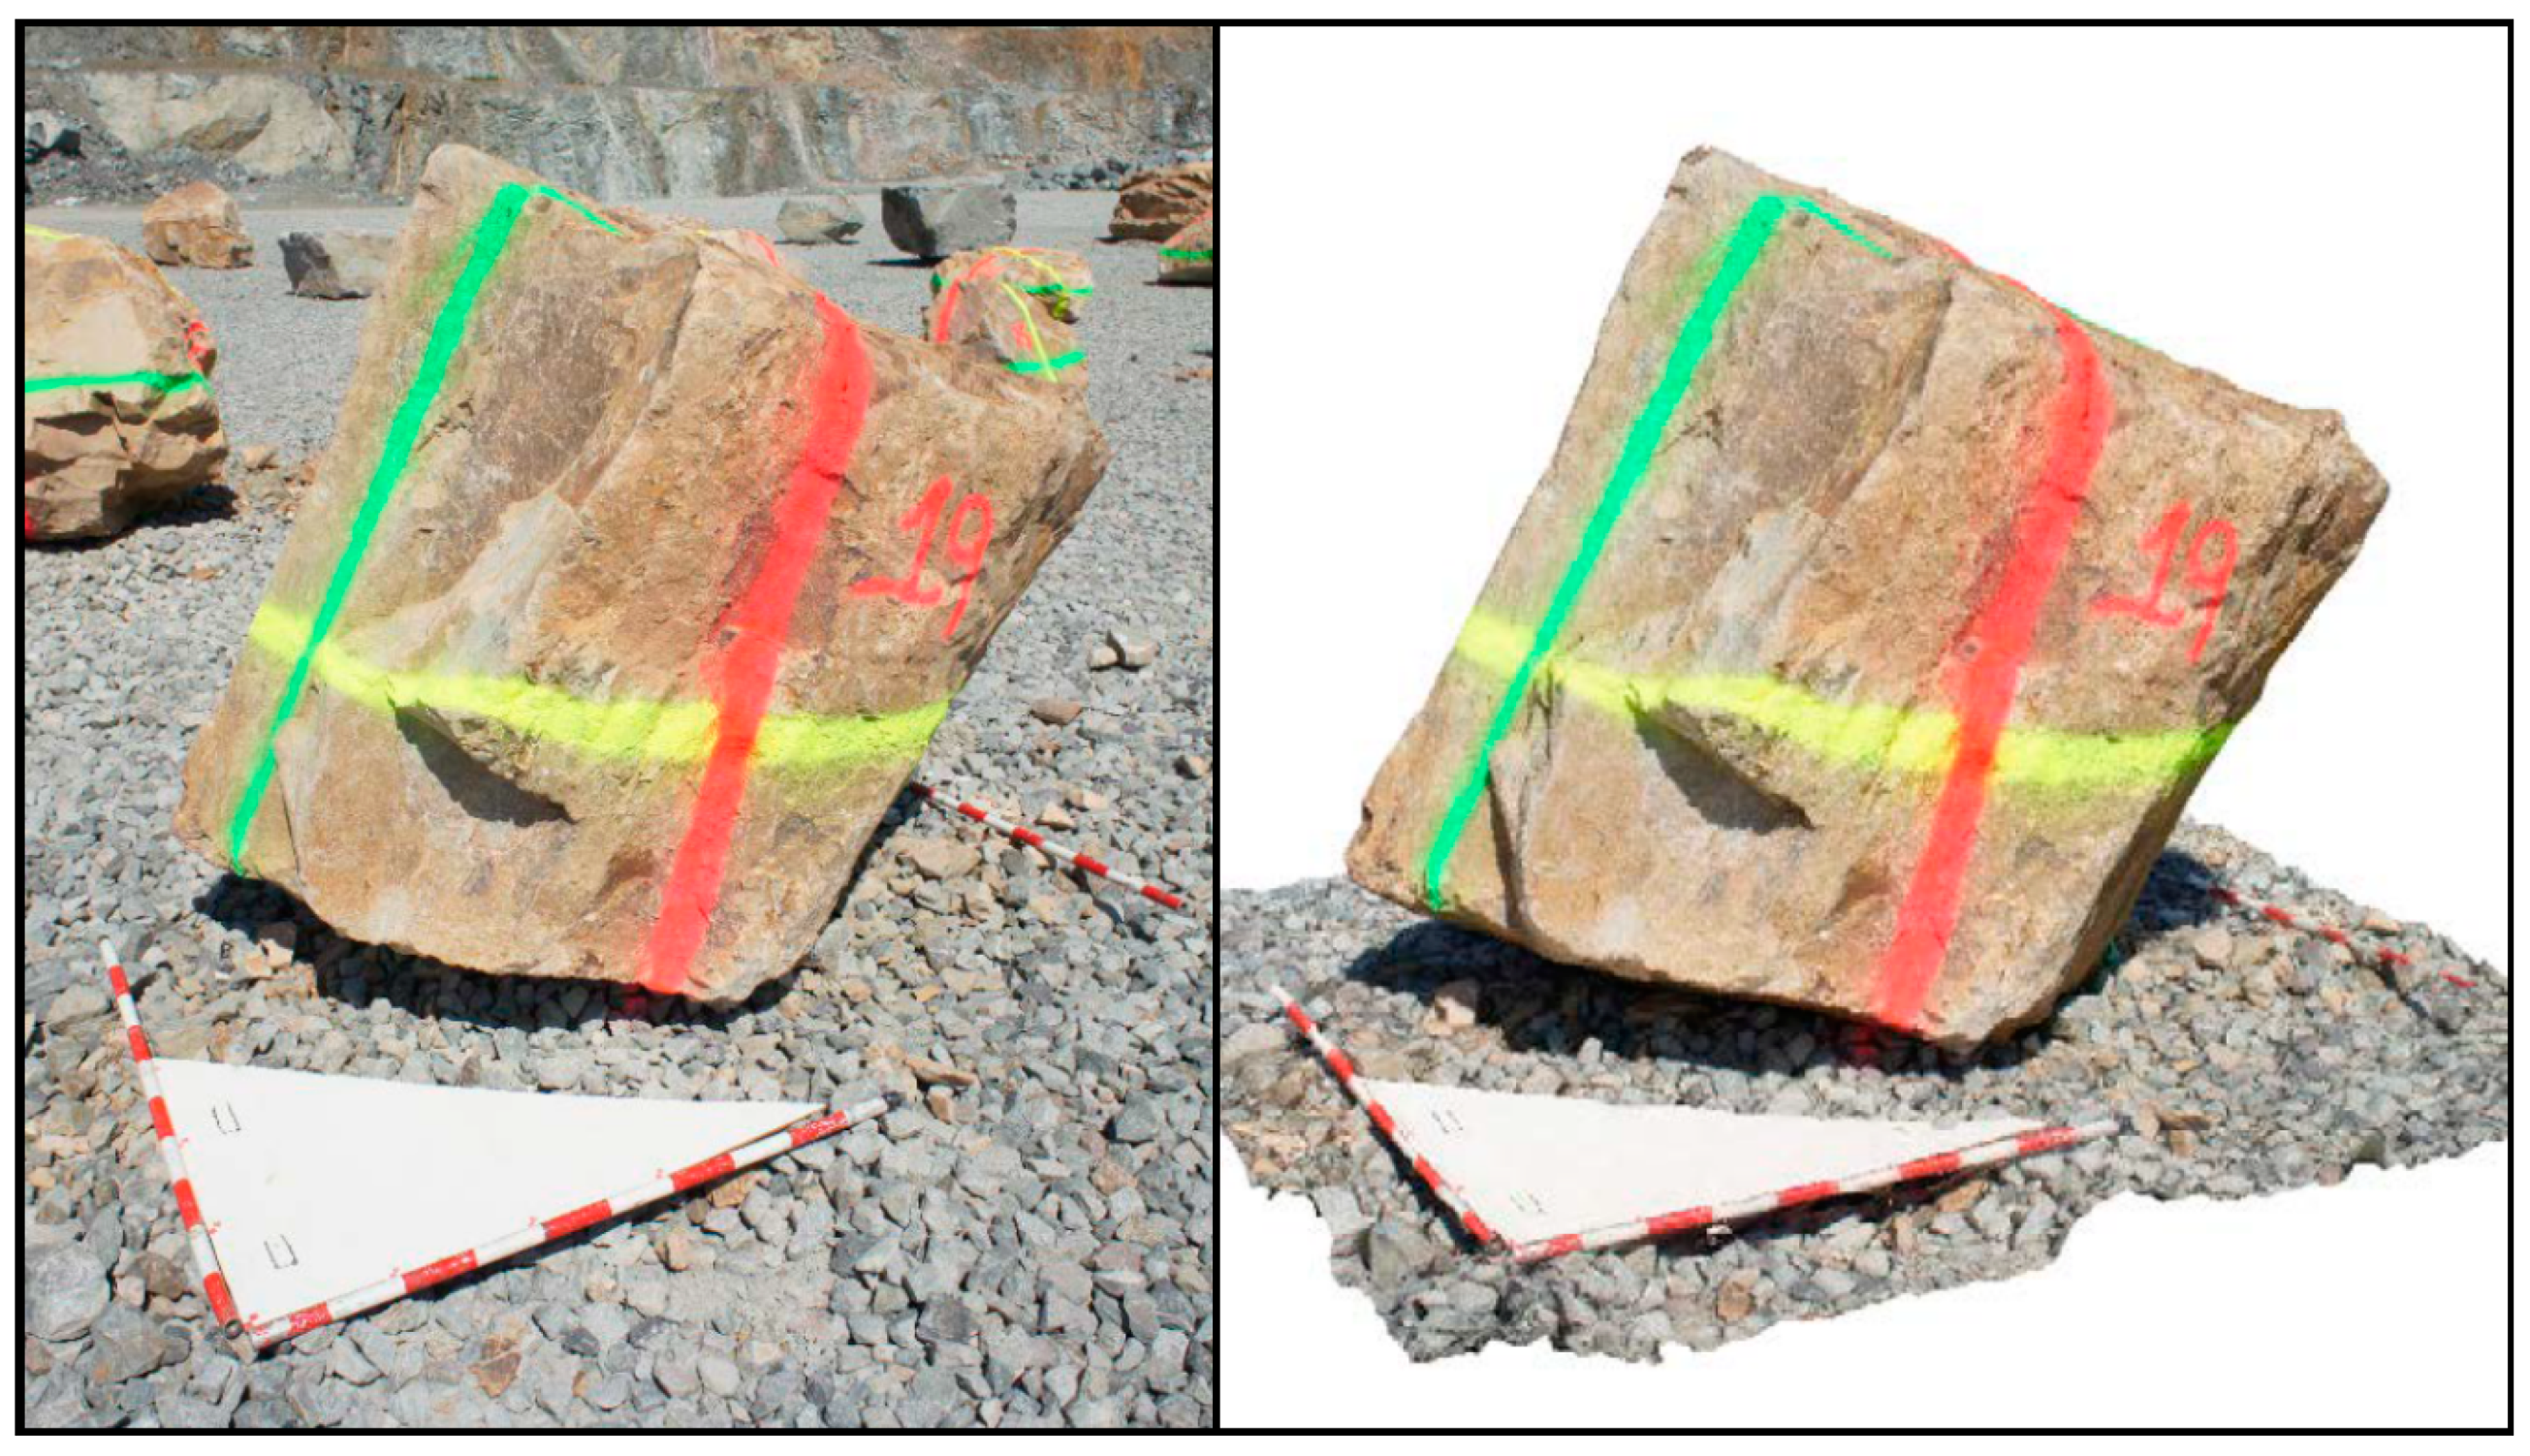
3. In the present work, we will focus only on the initial volumes and on the final block size distributions of fragments. The main features recorded during the tests are the initial volume of the blocks and the volume of fragments generated using a tape and a 3D photogrammetric reconstruction. Distancemeters, targets measured with a total station and GNSS, and UAV flights were used for the 3D scenario reconstruction. The UAV flights are also used to record videos and take pictures during the tests.
In this work, we argue that to characterize fragmentation, it is necessary to consider both the maximum fragment size and the total number of fragments. The second contribution is the analysis/characterization of the fragmentation phenomenon in different sites based on the fragmentation patterns observed. This work was developed in the RockModels research project and the first author Ph.D. thesis [
22].
3. Results
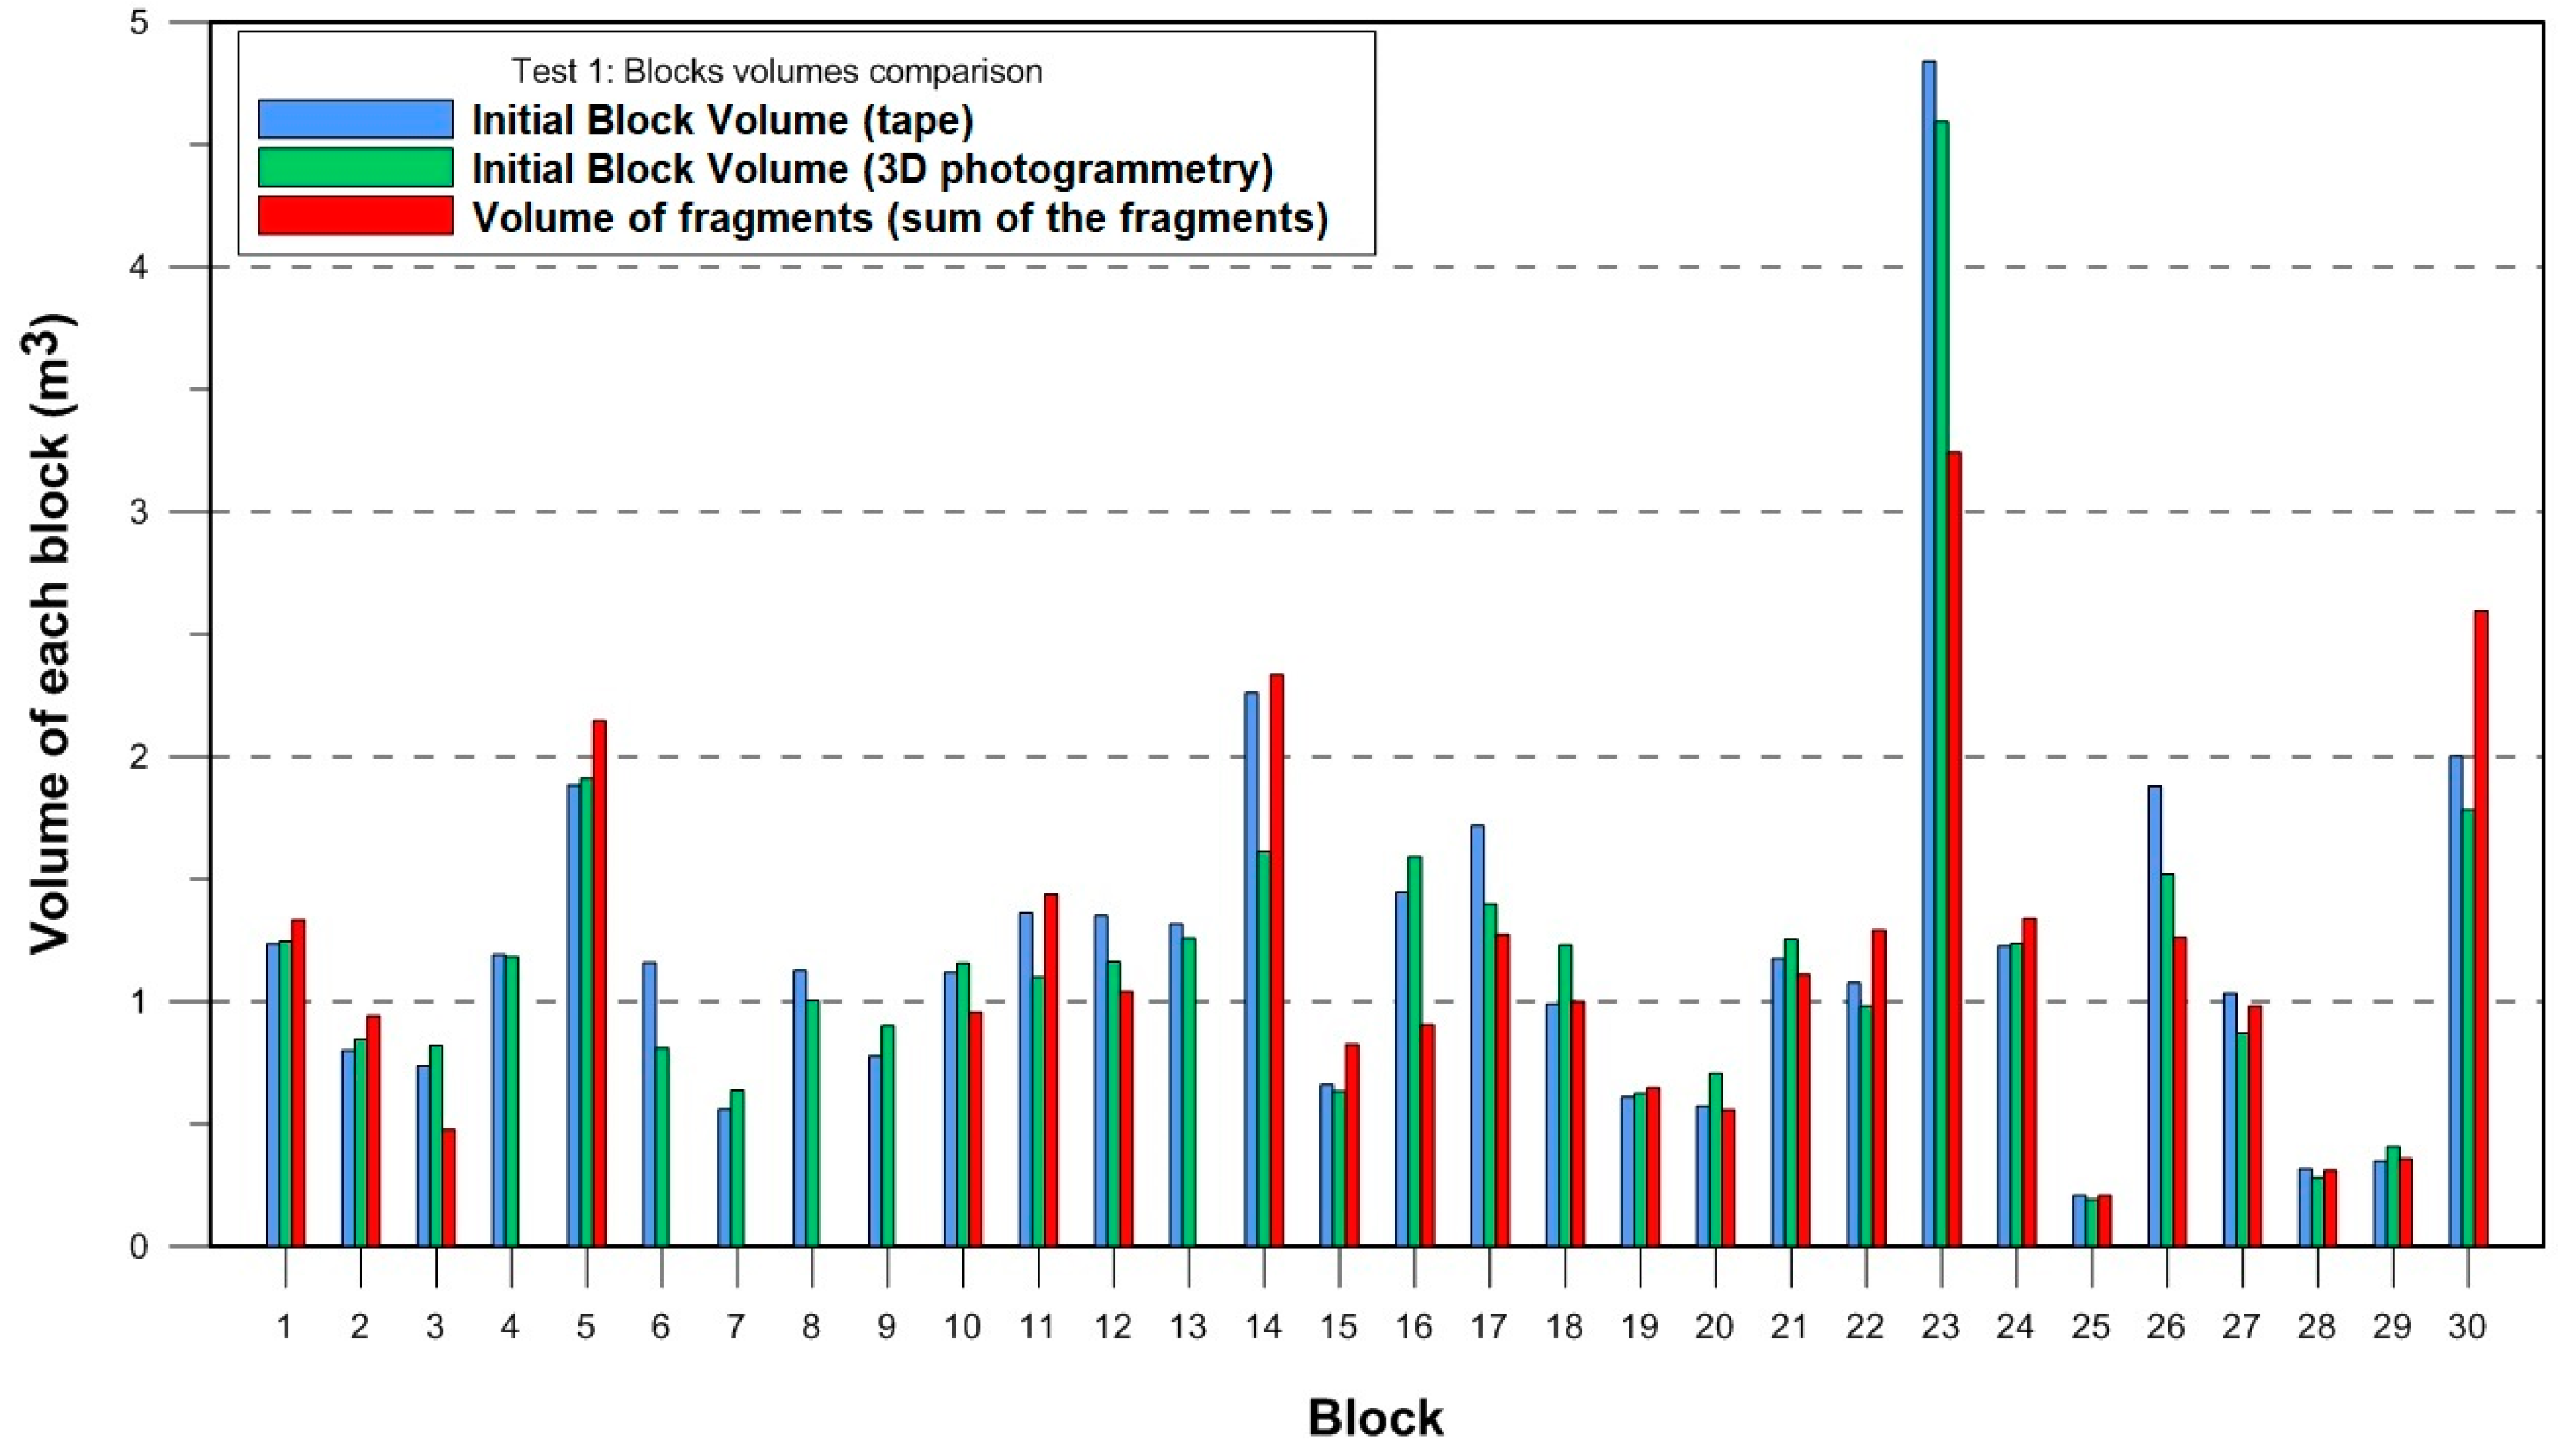
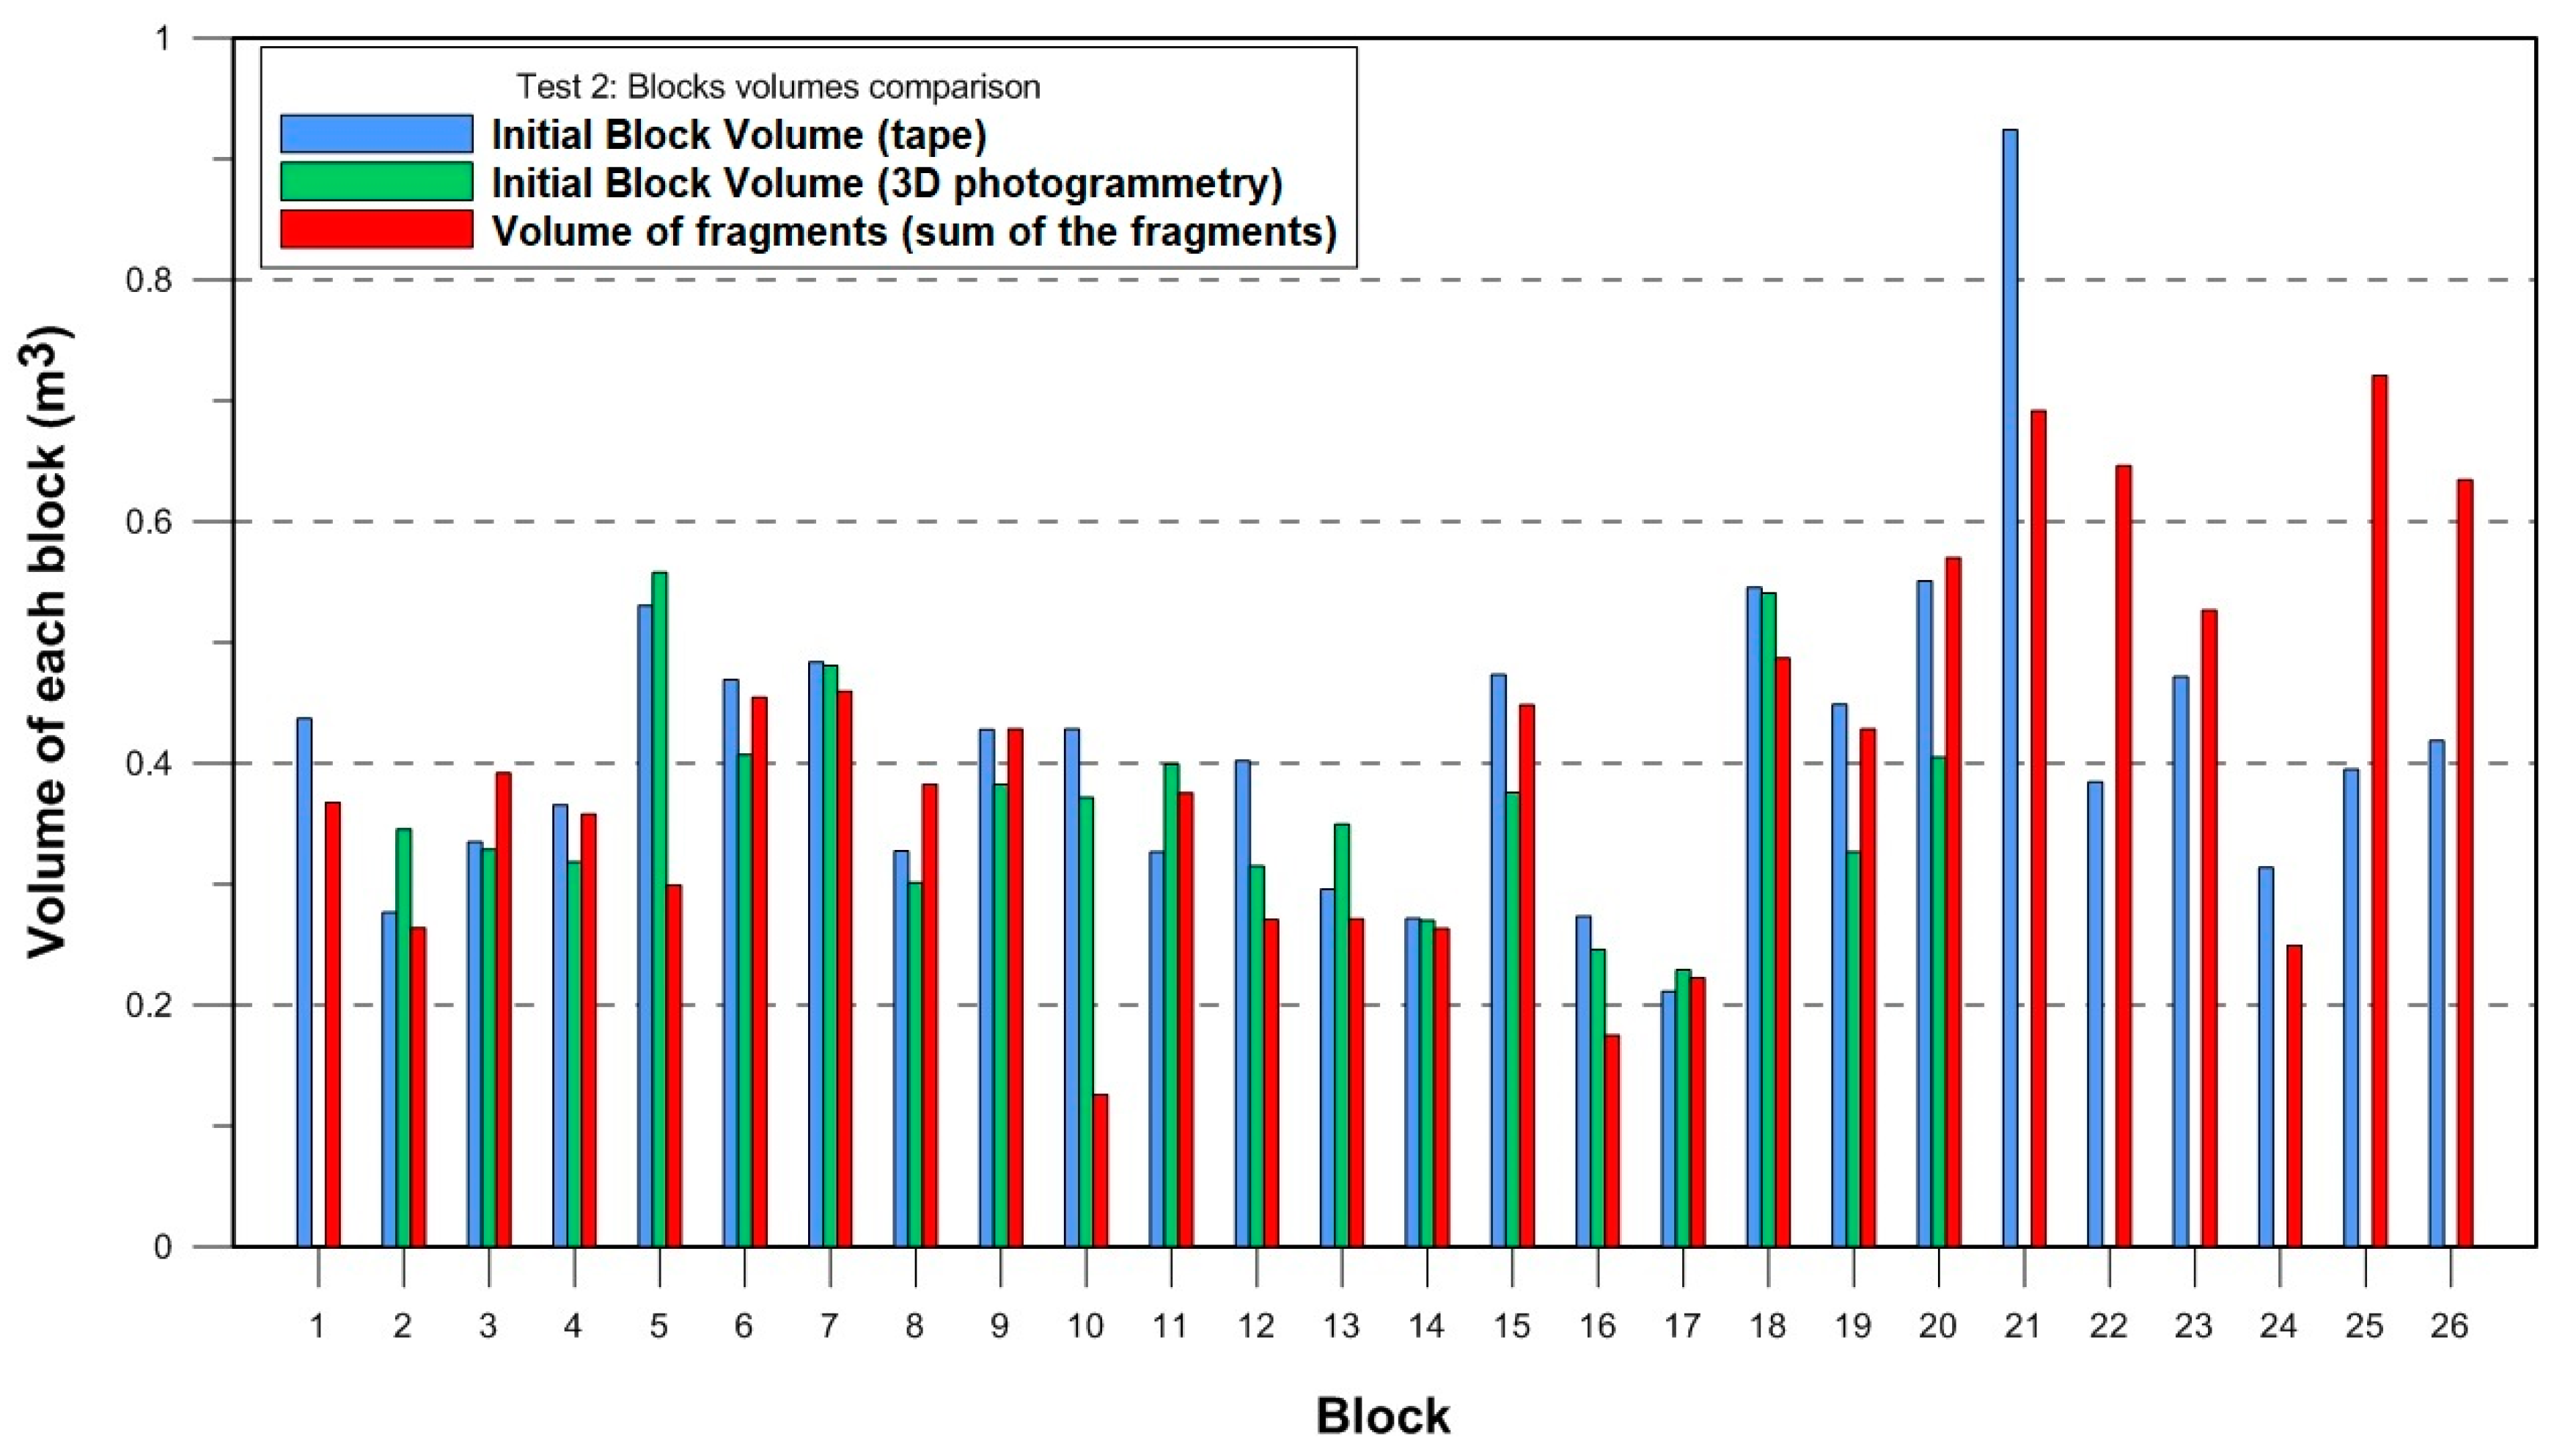
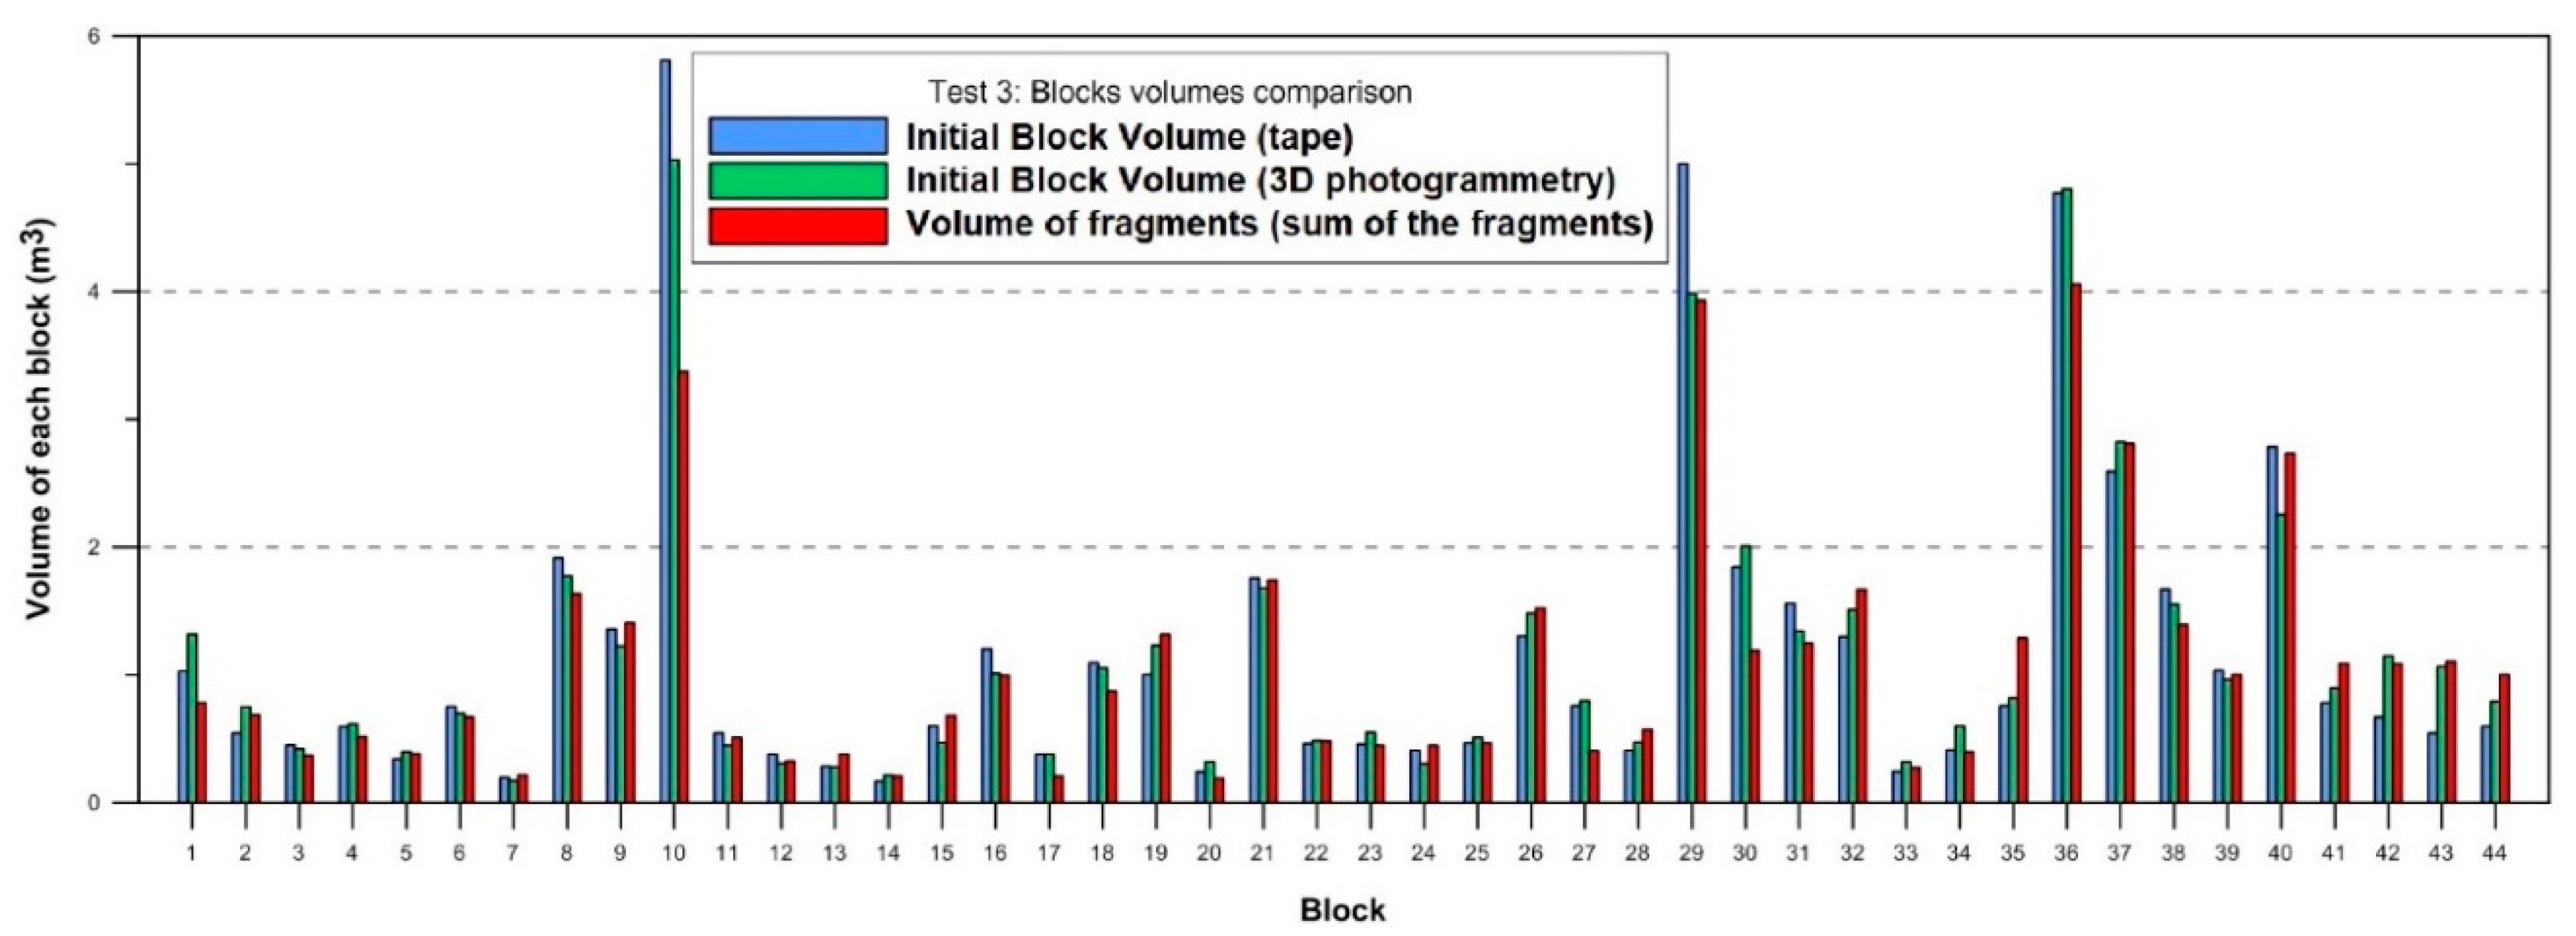
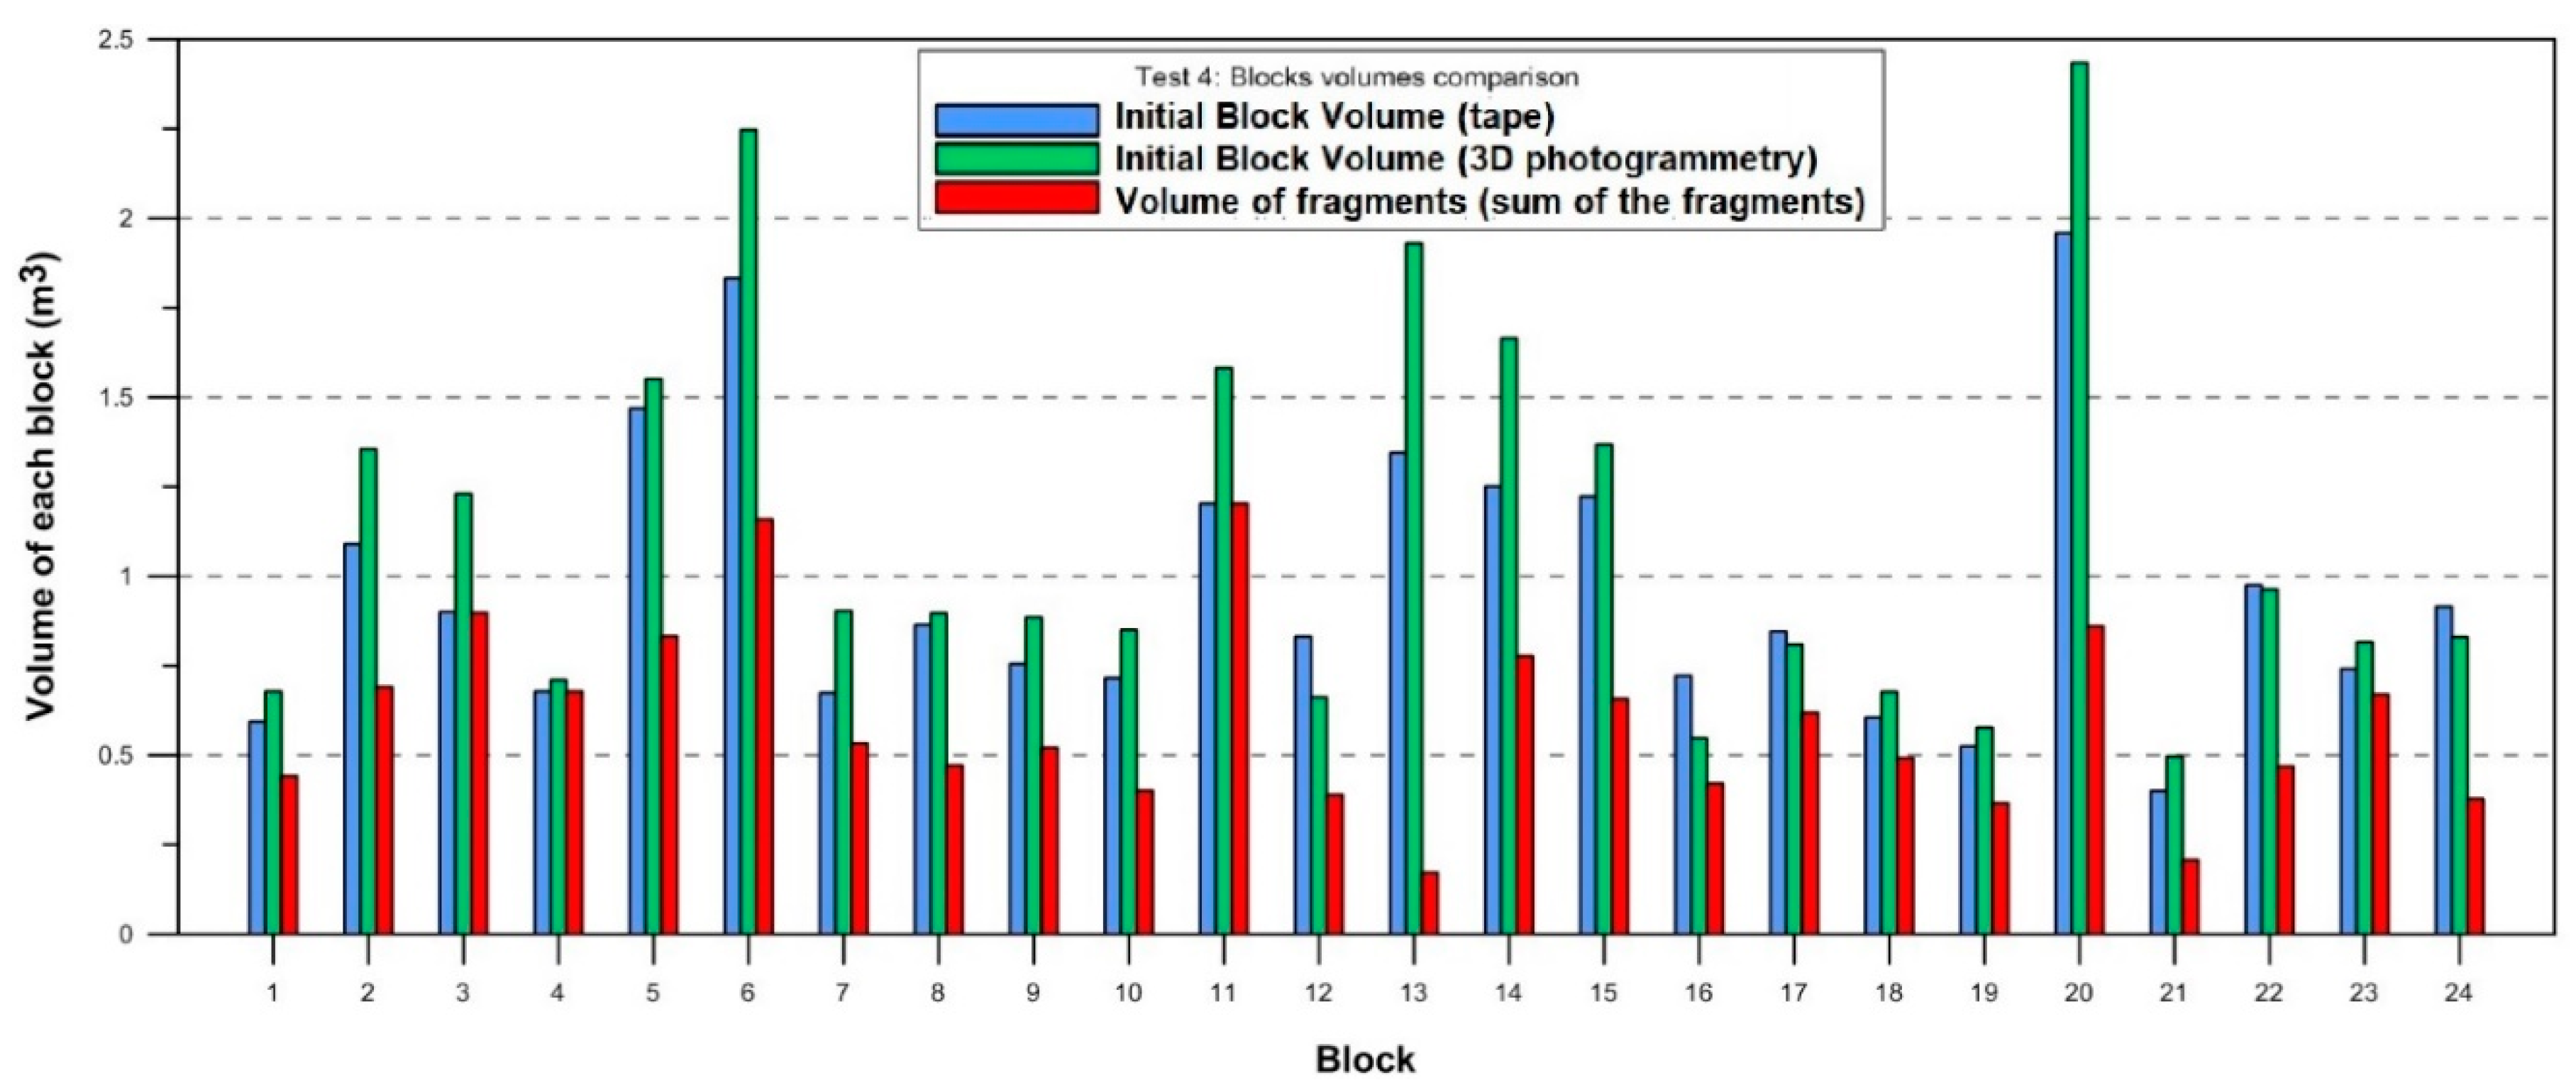
3.1. Initial Block Volume and Total Fragments Volumes
The fragments generated by the breakage of the blocks were measured with a tape. The minimum fragment size measured was 8 × 10
−6 m³, which corresponds to a 2 × 2 × 2 cm fragment. Ideally, the sum of the fragment volumes should yield the initial volume (
Figure 6,
Figure 7,
Figure 8 and
Figure 9). However, a fraction of the broken block is not included because the fragments are too small to be measured.
At test site 1, blocks 4, 6, 7, 8, 9, and 13 did not break, so there are no fragments. However, after the block 13, all the blocks were measured even when they remain intact without breakage. At test site 2, some blocks (from 21 to 26) could not be reconstructed in 3D. The volumes calculated using the 3D models are used as reference volume for each block.
At test sites 1, 2 and 3, the volumes measured before and after each drop differ between 10% and 20%. At test site 4, the volume of the fragments measured with tape are systematically smaller than the initial volume obtained with the two techniques used. The most probable cause of this discrepancy is the change of personnel in charge of measuring the fragments with the tape. In the opposite scenario, if the measurements of the fragments overestimate their volumes, then, the initial block volume can be lower than the sum of all the fragments volumes.
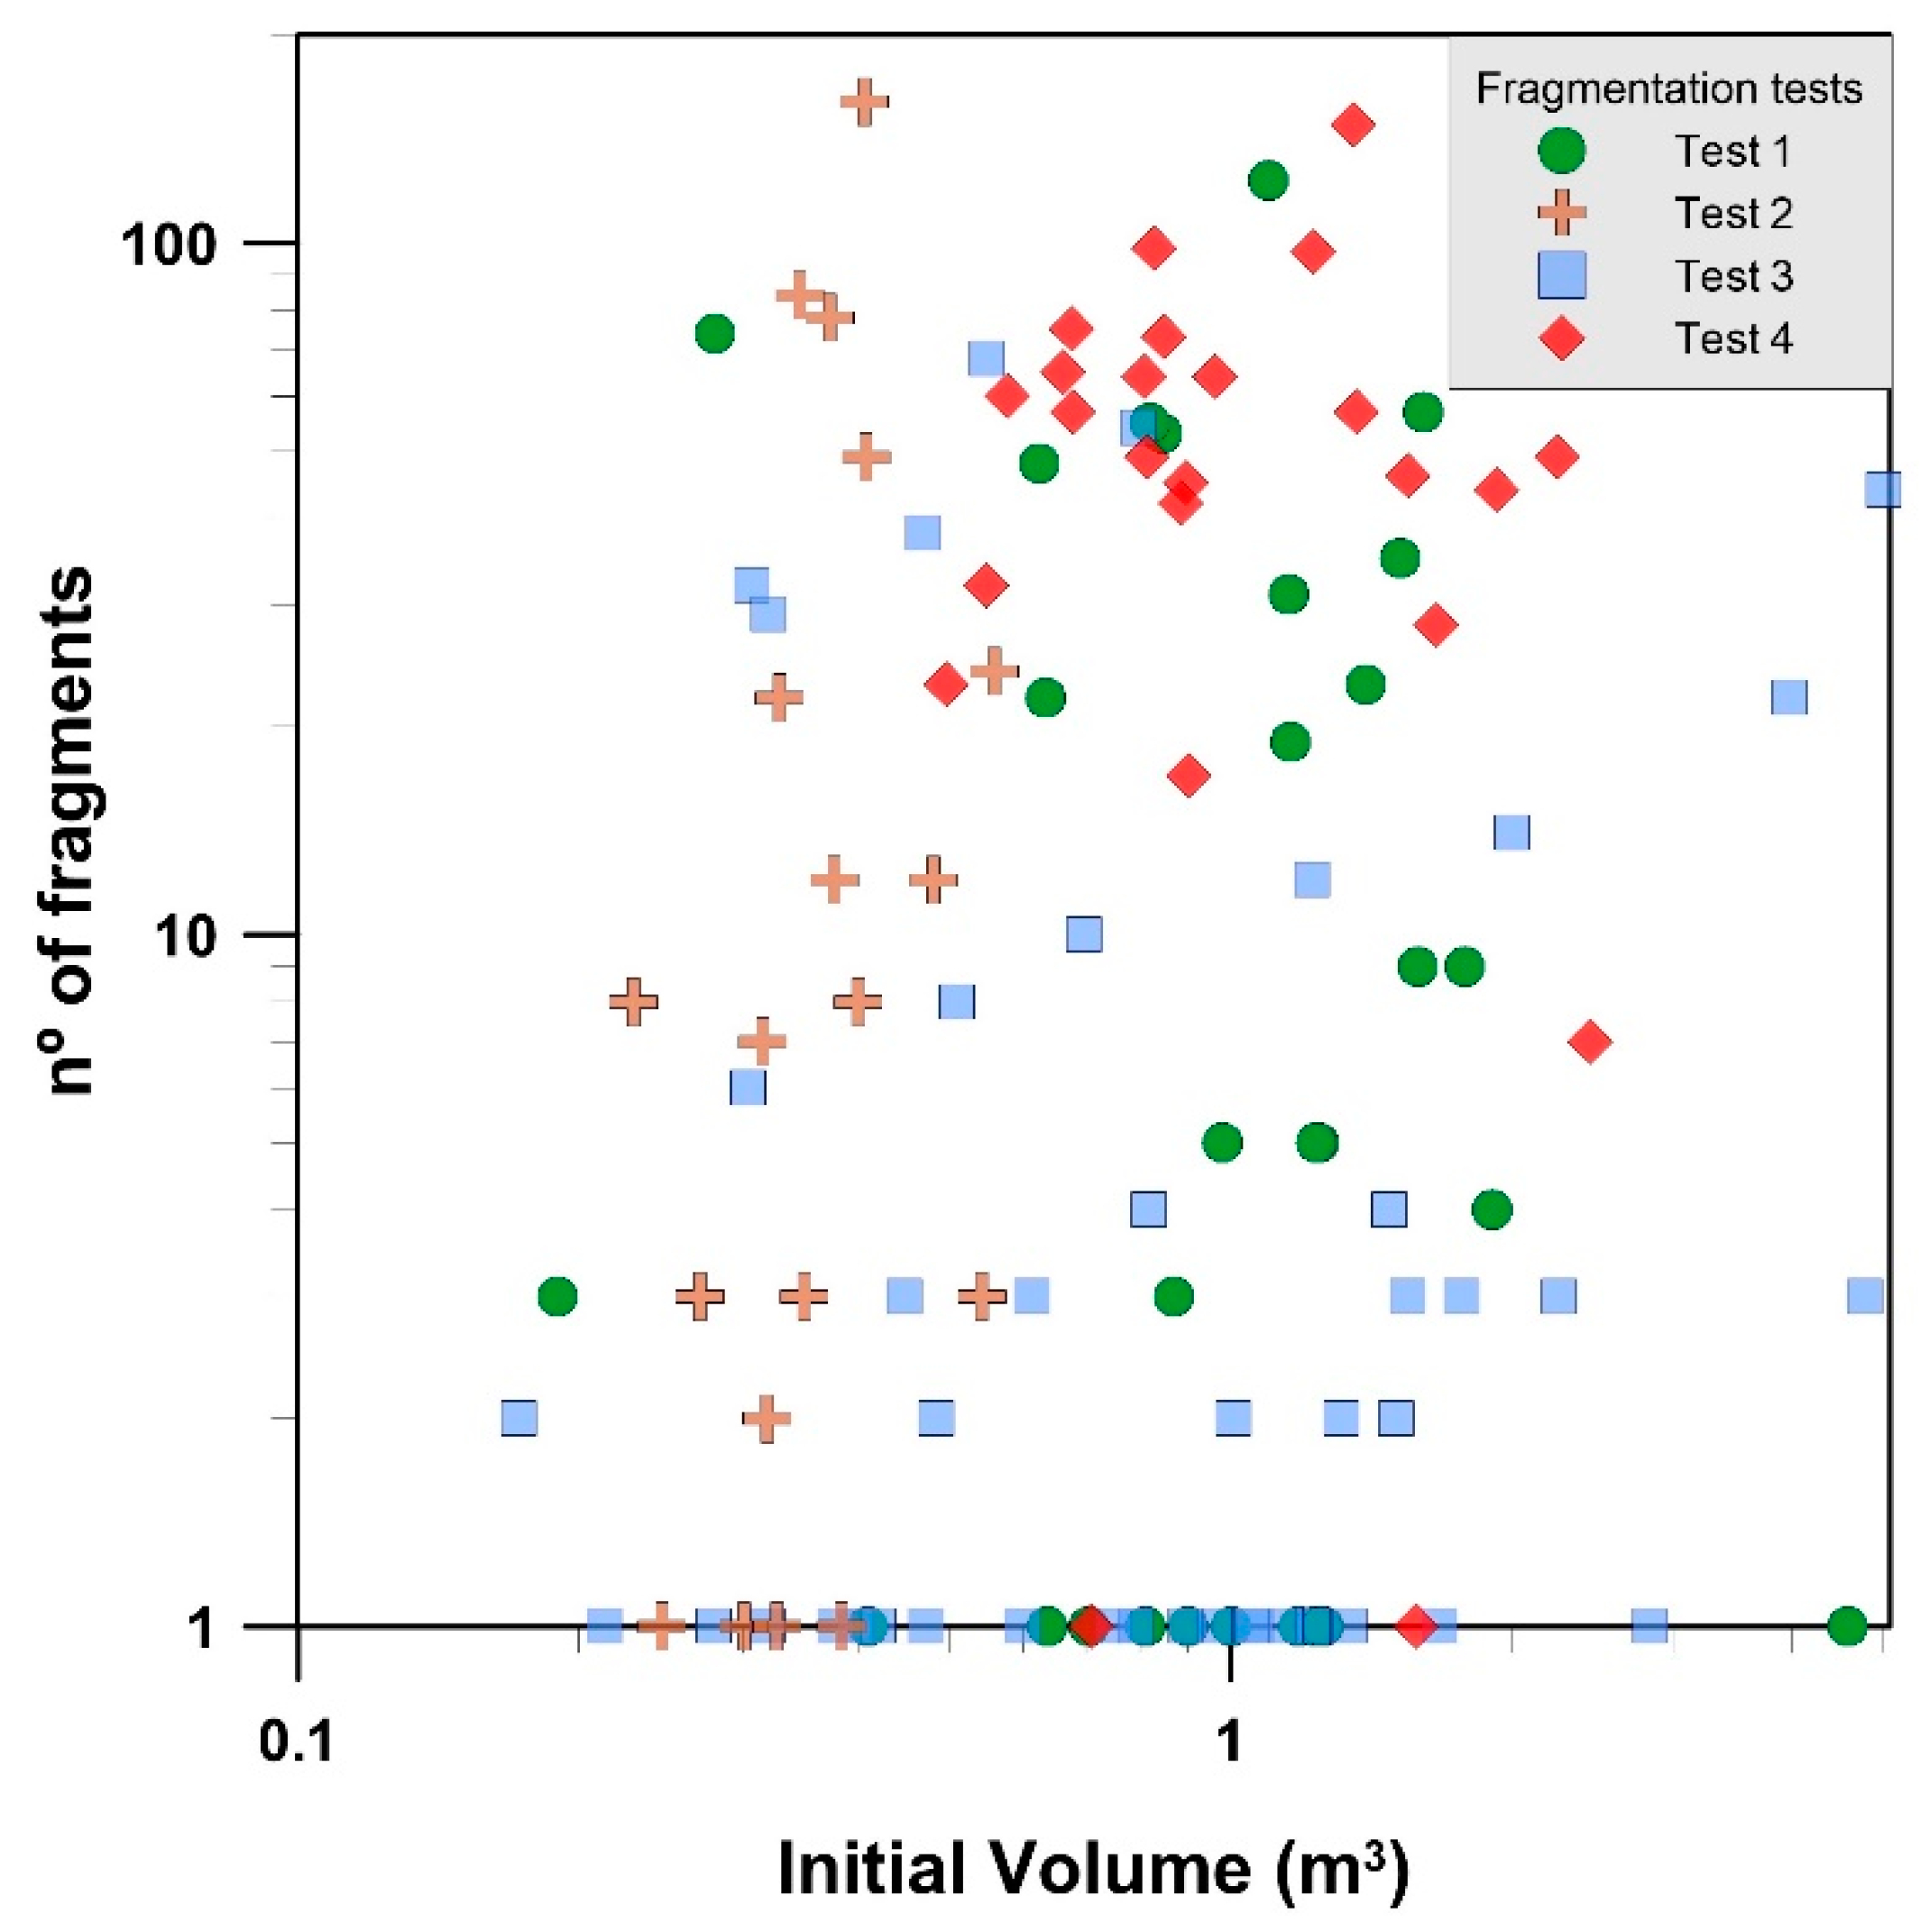
3.2. Number of Fragments Generated
We measured a total of 2907 fragments for all the test sites.
Table 1 and
Figure 10 show the number of fragments measured for each block dropped, arranged test by test, versus the initial volume measured with the 3D photogrammetric reconstruction. A Multiplying Factor (MF) is introduced to quantify the average number of fragments generated in each scenario (test site). The MF ranges from 9 to 50 (
Table 1).
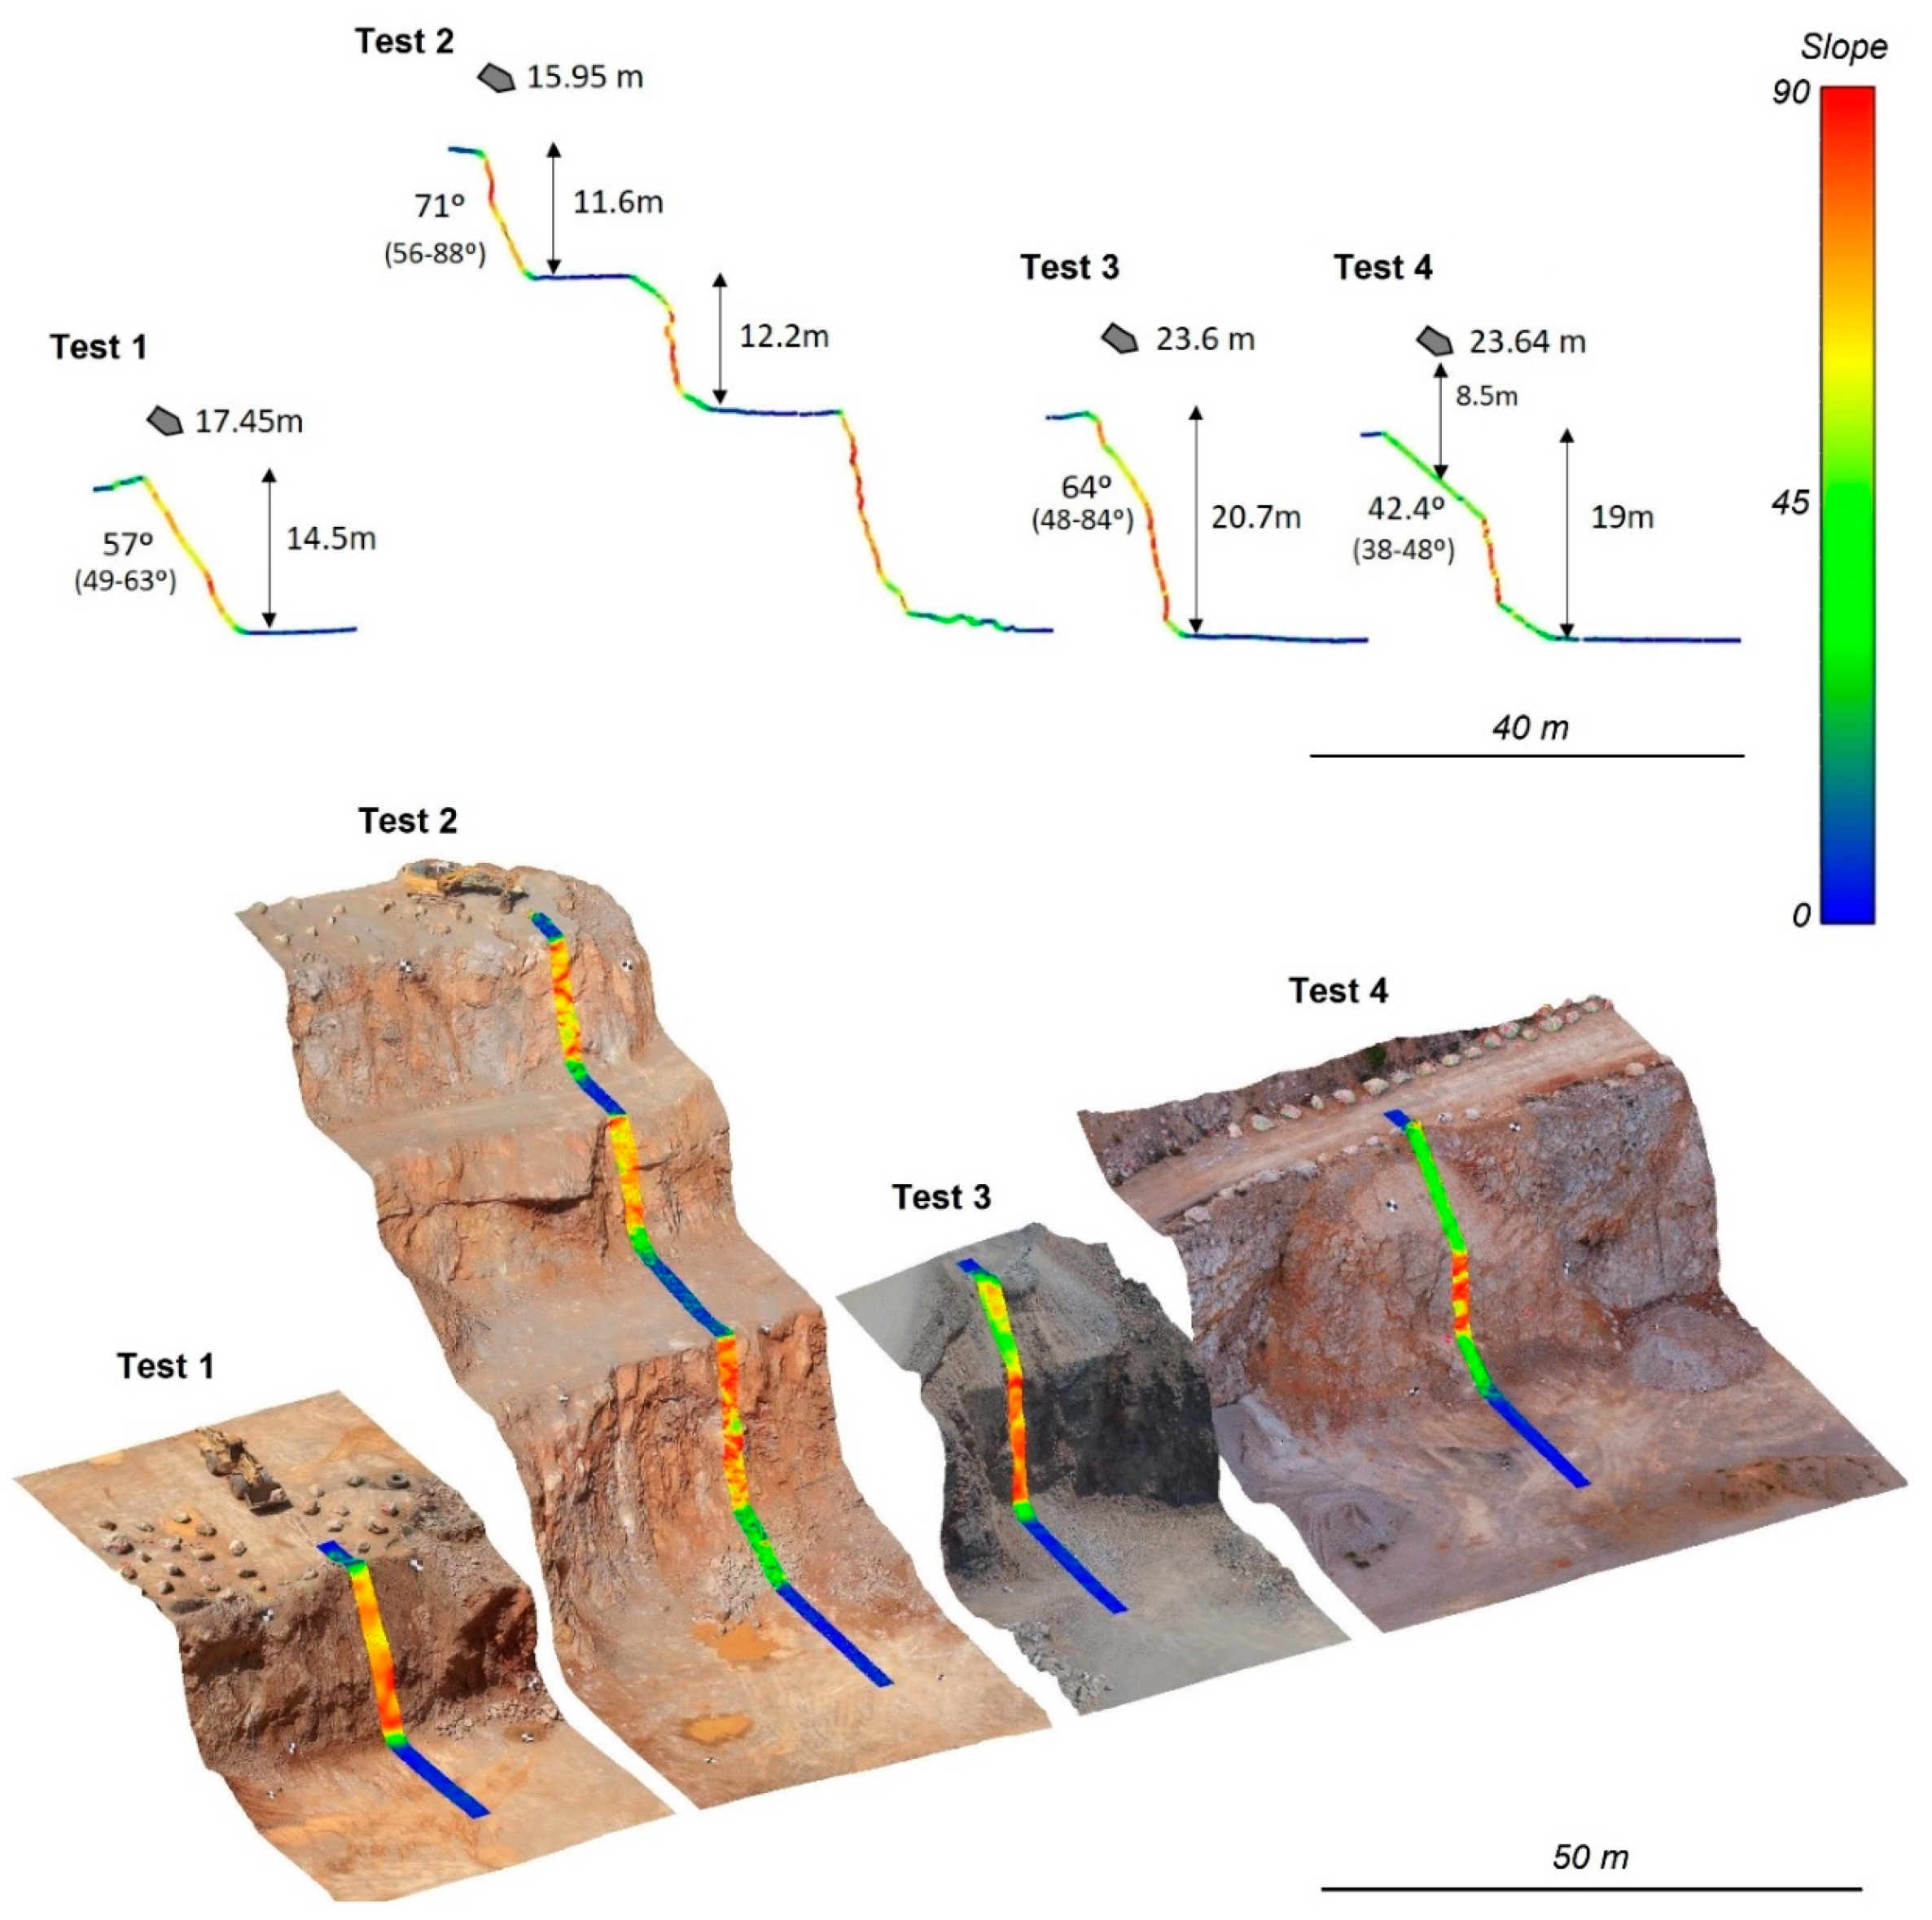
Test site 1 has 6 falls that generate more than 40 fragments, and one with more than 120 fragments generated, with an MF of 19.8. Test site 2 shows 4 blocks that generate more than 50 fragments, and one with more than 150 fragments, with an MF of 26.1. Despite test sites 1 and 2 being, respectively, single bench and double bench slopes, both the MF and the total number of generated fragments are very similar (549 and 680, respectively). The results are not surprising, because the profiles and the drop height (17.45 and 15.95 m) are similar, and because only two blocks from test site 2 passed the first bench.
Test site 3 shows an overall lack of fragmentation, with a small number of fragments per block and many blocks without fragmentation. Notwithstanding the number of blocks being higher than in the others test sites, the total number of fragments measured is less than 400 (392), and the MF is 8.9.
Finally, test site 4 shows high fragmentation as most of the rock blocks generated more than 40 fragments. Although fewer blocks (24) were released in this test, the number of fragments generated was the highest of all test sites, 1241 fragments, with an MF of 51.7. That is, five times more breakage than in test site 3.
Focusing only on the results from the number of fragments, 3 fragmentation scenarios are identified: the low fragmentation scenario with an MF less than 10 at test site 3; the medium fragmentation scenario with an MF between 20 and 26 at tests sites 1 and 2; and the high fragmentation scenario with an MF over 50 at test site 4.
In terms of rockfall hazard assessment and management, the results show that a single block is capable of generating a large number of fragments and a large dispersion of trajectories, significantly increasing the probability of impact. In contrast, the reduction in the volume of each fragment supposes a reduction in its energy, with further implications in the runout distance [
5,
6,
7].
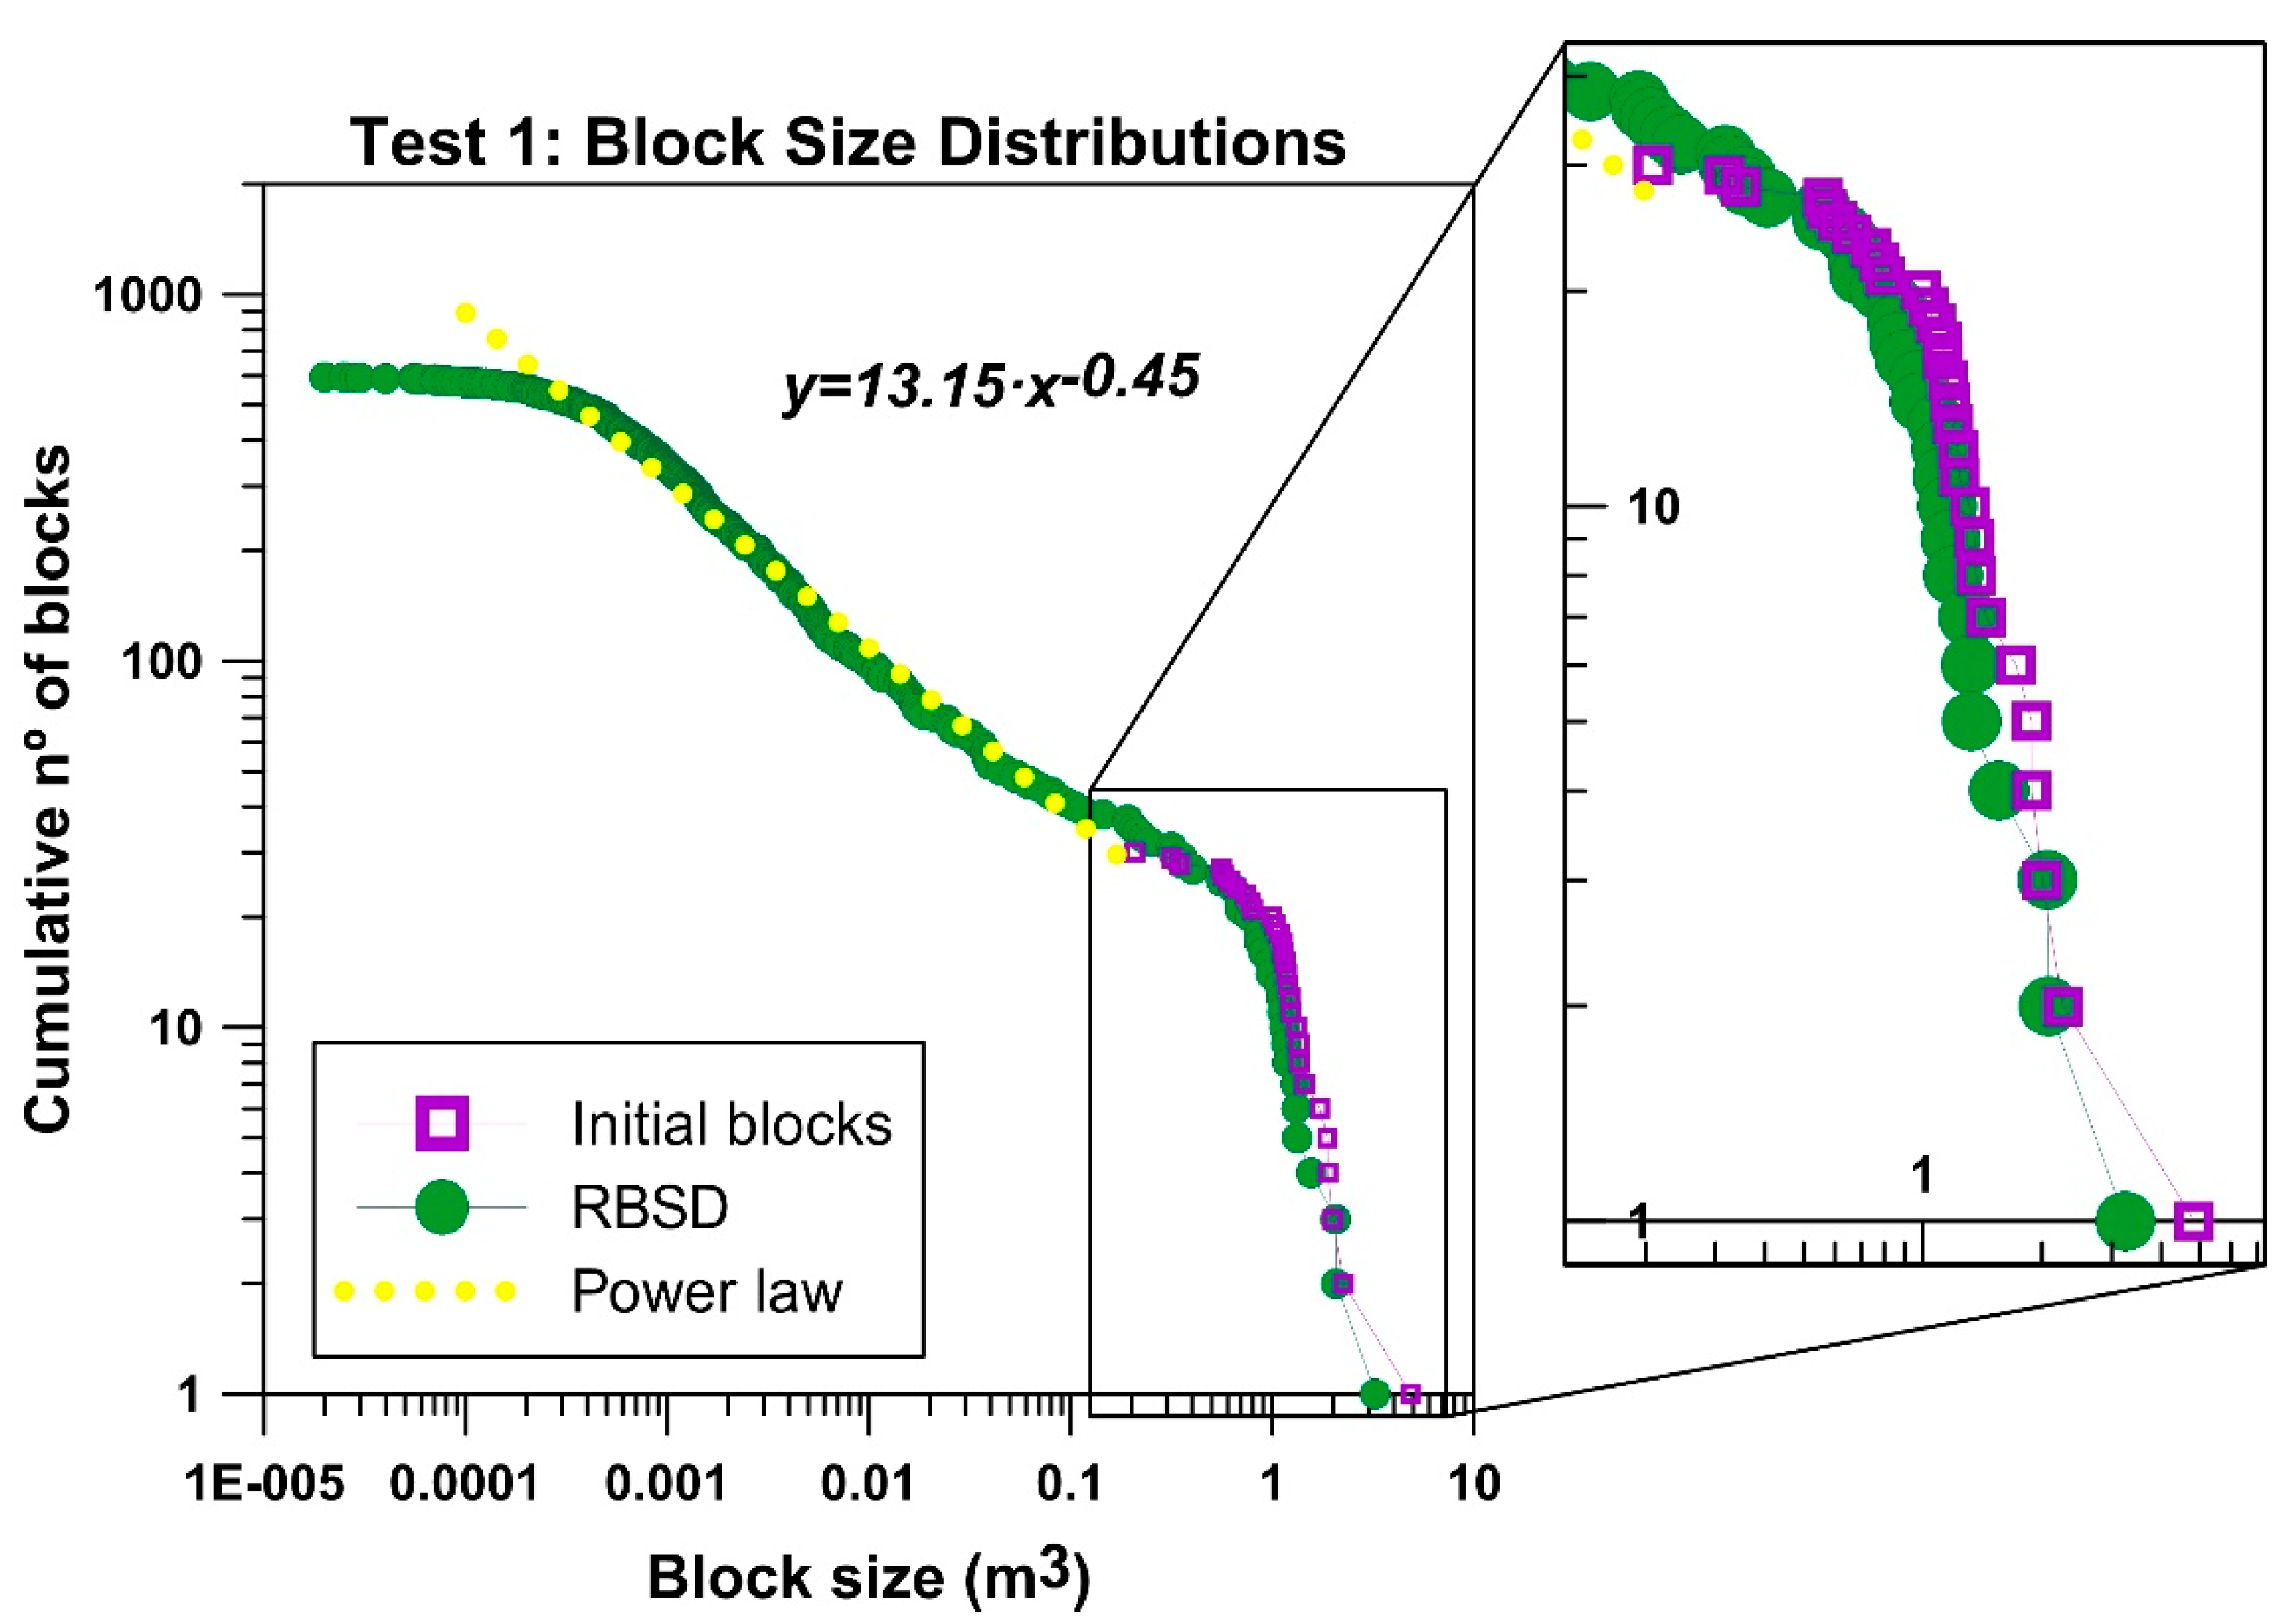
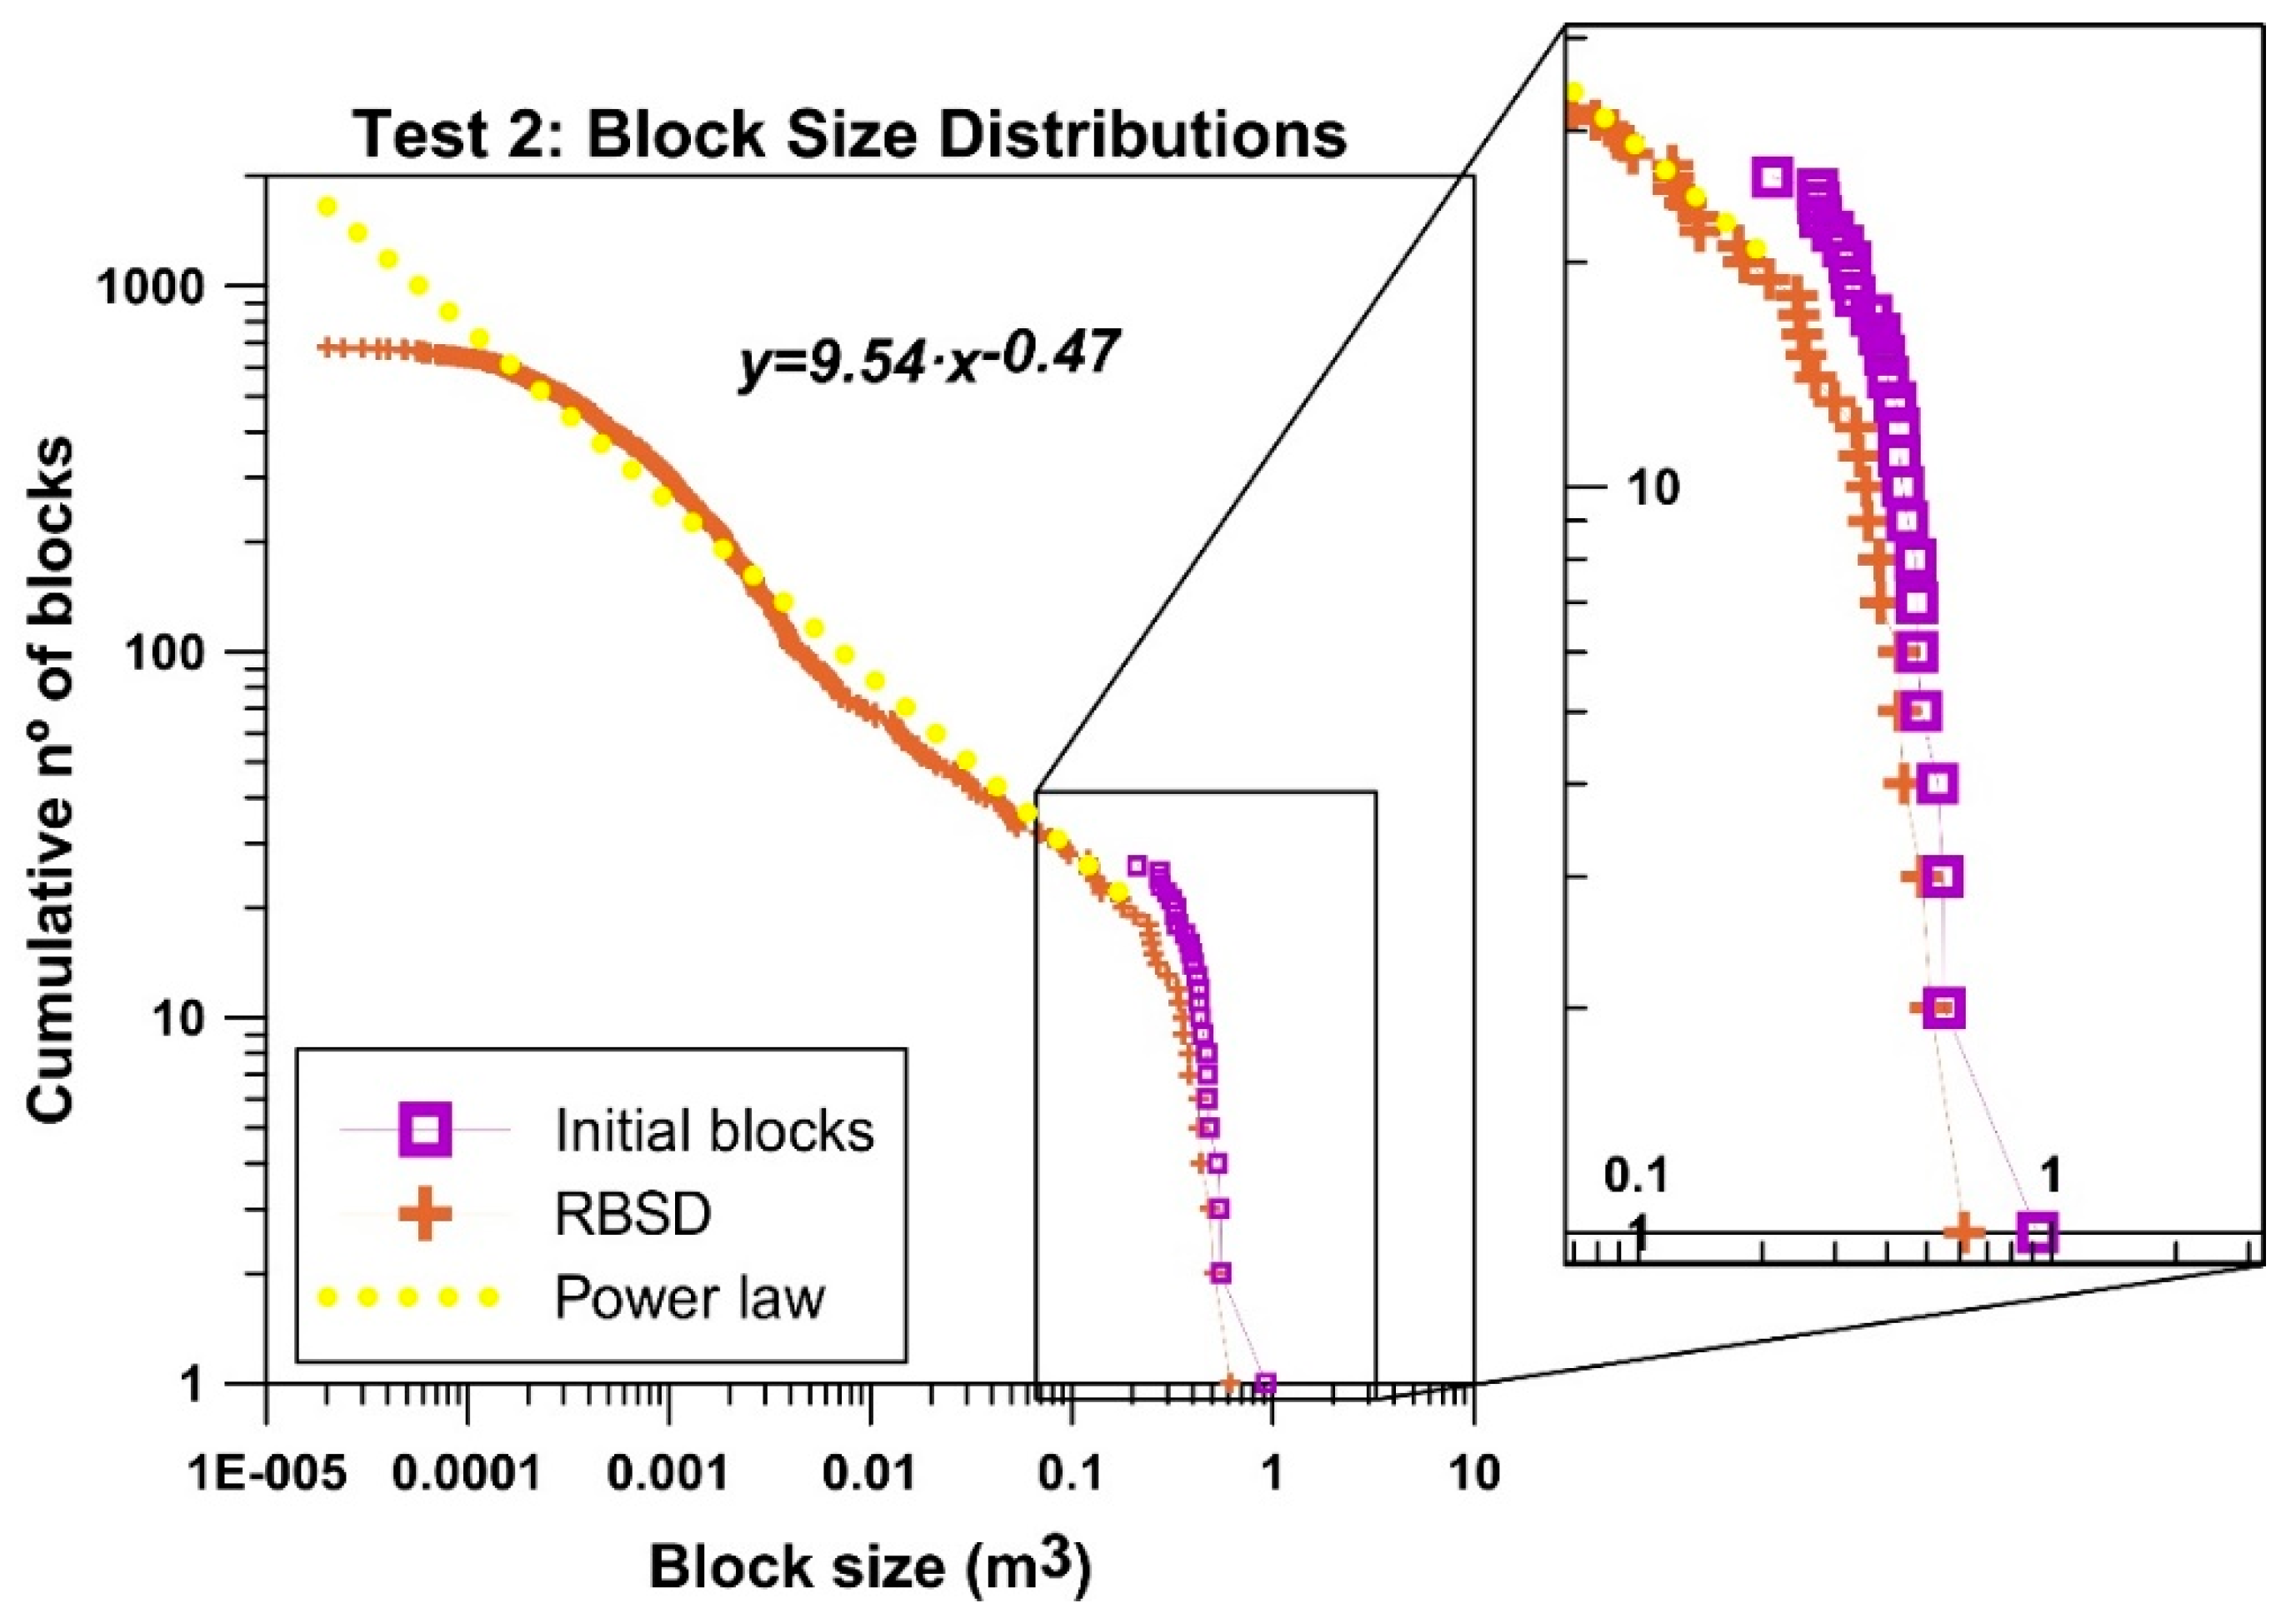
3.3. Distributions
For the purpose of analysis, we have interpreted the results of each test site considering all the drops together. Therefore, we start from an initial distribution of block volumes for each test site and we obtain a distribution of all generated fragments’ volumes. We measured all the block volumes of each testing site before they were dropped and plotted as a list of initial volumes (purple distributions in
Figure 11,
Figure 12,
Figure 13 and
Figure 14). Then, all the fragments measured at each test site were added in a single list of fragments and sorted also by volume, yielding the fragments distribution or the Rockfall Block Size Distribution (RBSD) of the test sites (
Figure 11,
Figure 12,
Figure 13 and
Figure 14). It is interesting to note that the distributions obtained are very similar to the distributions found in natural rockfalls [
4,
5,
6].
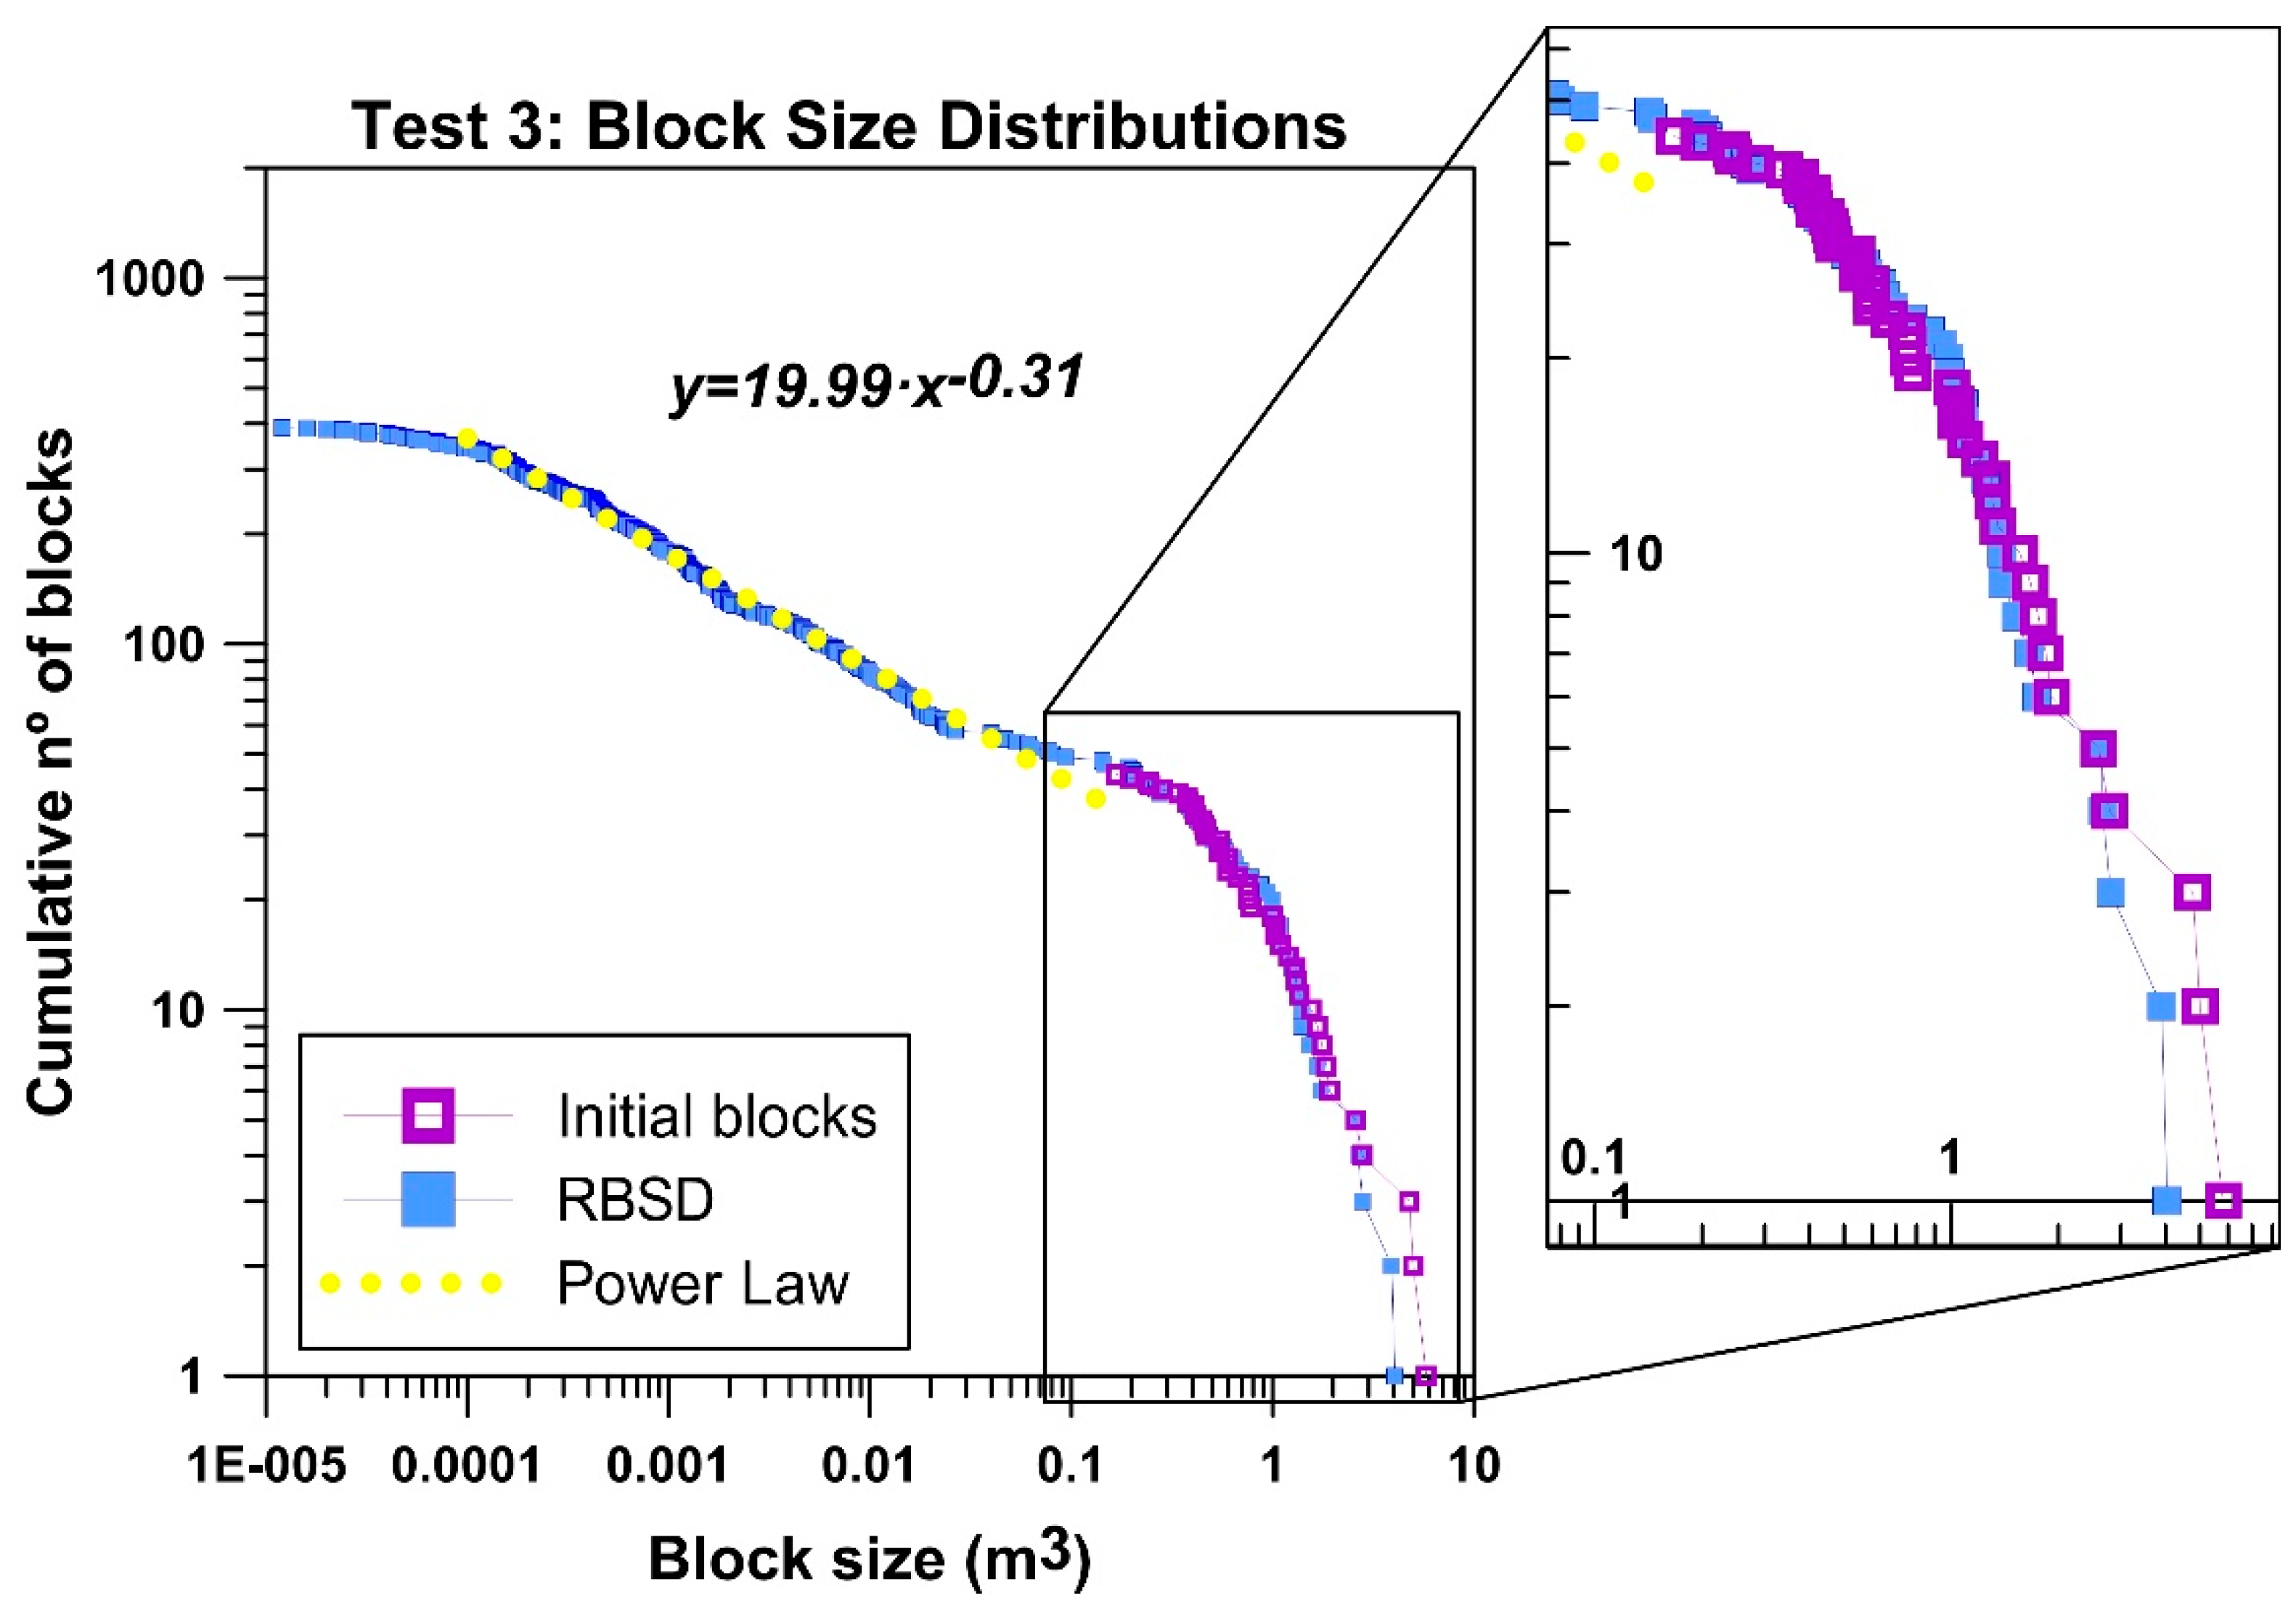
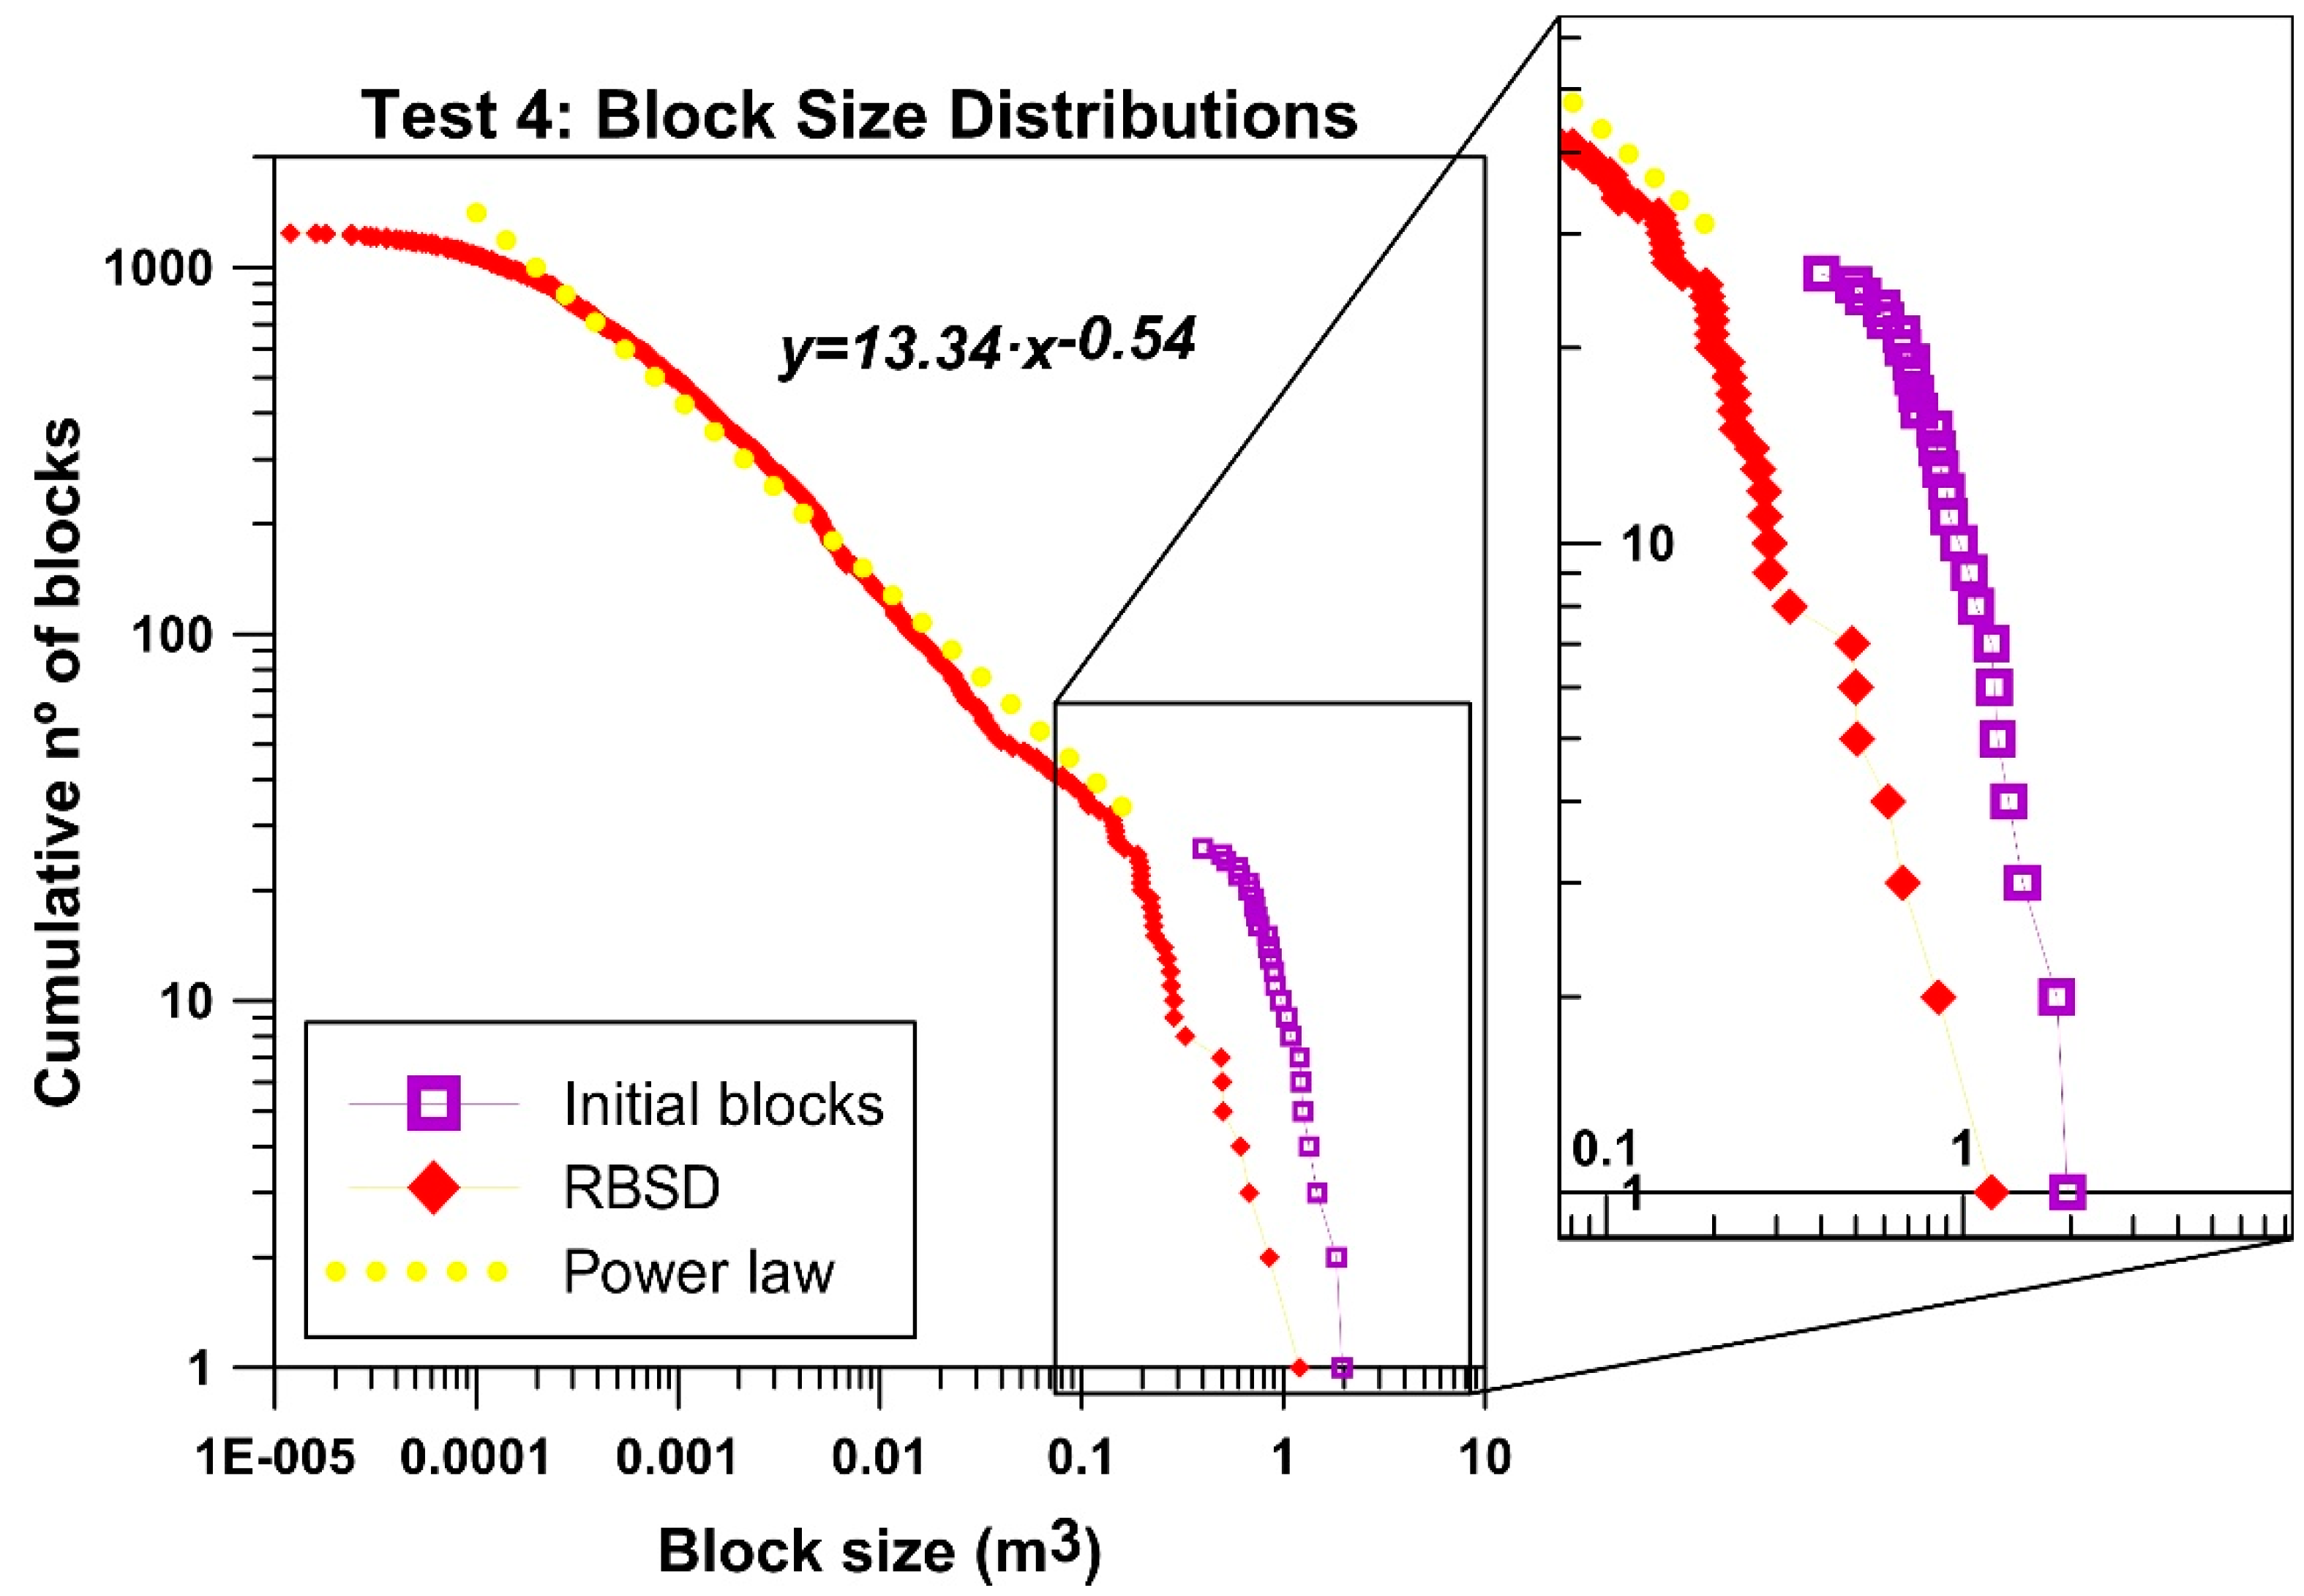
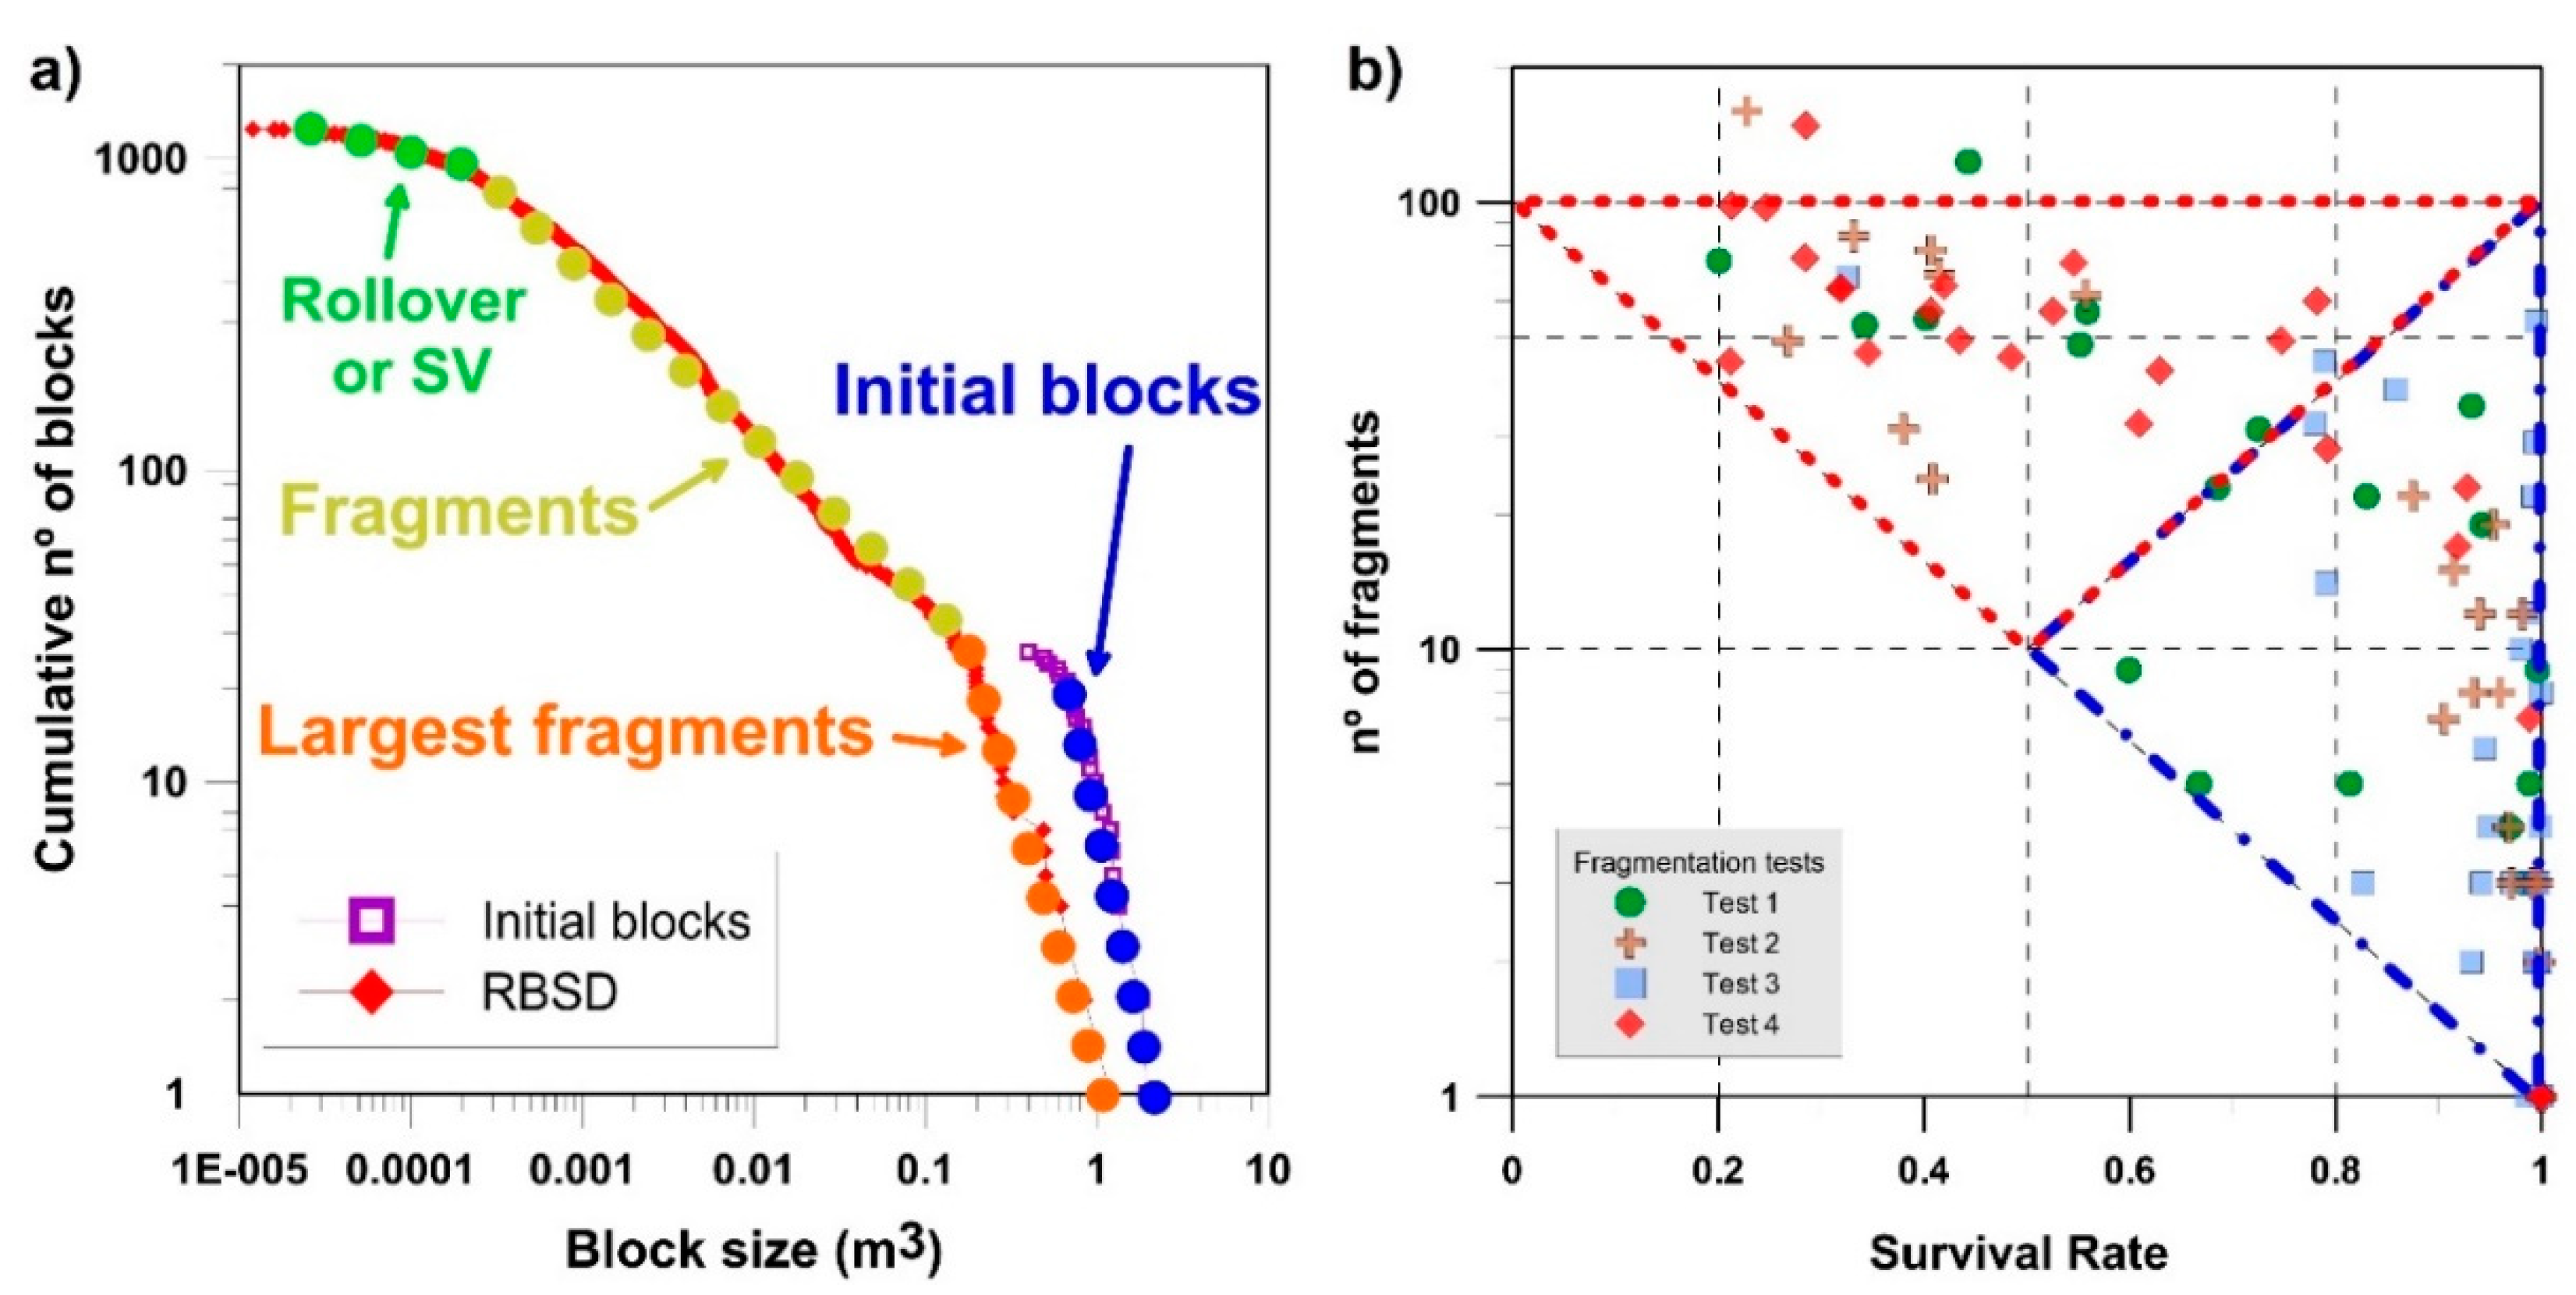
The shape of the distributions may be interpreted as having 3 components: the remnants blocks (tail of the distribution); the generated fragments; and the rollover. The rollover, where the tendency of the power law decreases for the smaller volumes, is due to either undersampling (in the tests, fragments smaller than 2 × 2 × 2 cm, were not measured) or due to the scale variant fractal behavior, observed in fragments at sizes larger than the minimum measured. The biggest fragments of the RBSD are the remnants of the initial blocks. The arrangement of the biggest fragments of the RBSD is parallel to the original block volume distribution, which results from the arbitrary choice of the initial volumes (
Figure 11,
Figure 12,
Figure 13 and
Figure 14). The distribution of the generated fragments fit roughly to a power law (yellow dots, data plotted in log–log scale), with a lesser slope or exponent. The exponent of the fitted power laws is 0.45, 0.47, 0.31 and 0.54 for test sites 1, 2, 3 and 4, respectively, with coefficients of determination (r-squared) from 0.95 to 0.99. The exponents obtained express the intensity of the fragmentation and are consistent with the MF, describing the same fragmentation scenarios: a low fragmentation at test site 3 with an exponent of 0.31, medium fragmentation at test sites 1 and 2 with exponents close to 0.45; and a high fragmentation at test site 4 with an exponent of 0.54. Finally, all the distributions show rollover. Notice that the distribution of the initial blocks and the largest fragments at test site 3 are very close due to the lack of breakage (
Figure 13), and further apart in test site 4 due to the intense breakage of the blocks (
Figure 14). Moreover, the fragment’s volume distribution in test site 4 shows a slope steeper than the other distributions. Meaning that the presence of small rock fragments is predominant in test site 4. Based on these observations, we conclude the intensity of the fragmentation cannot be described with a single parameter only (e.g., the largest fragments), and that the whole distribution of fragments must be considered.
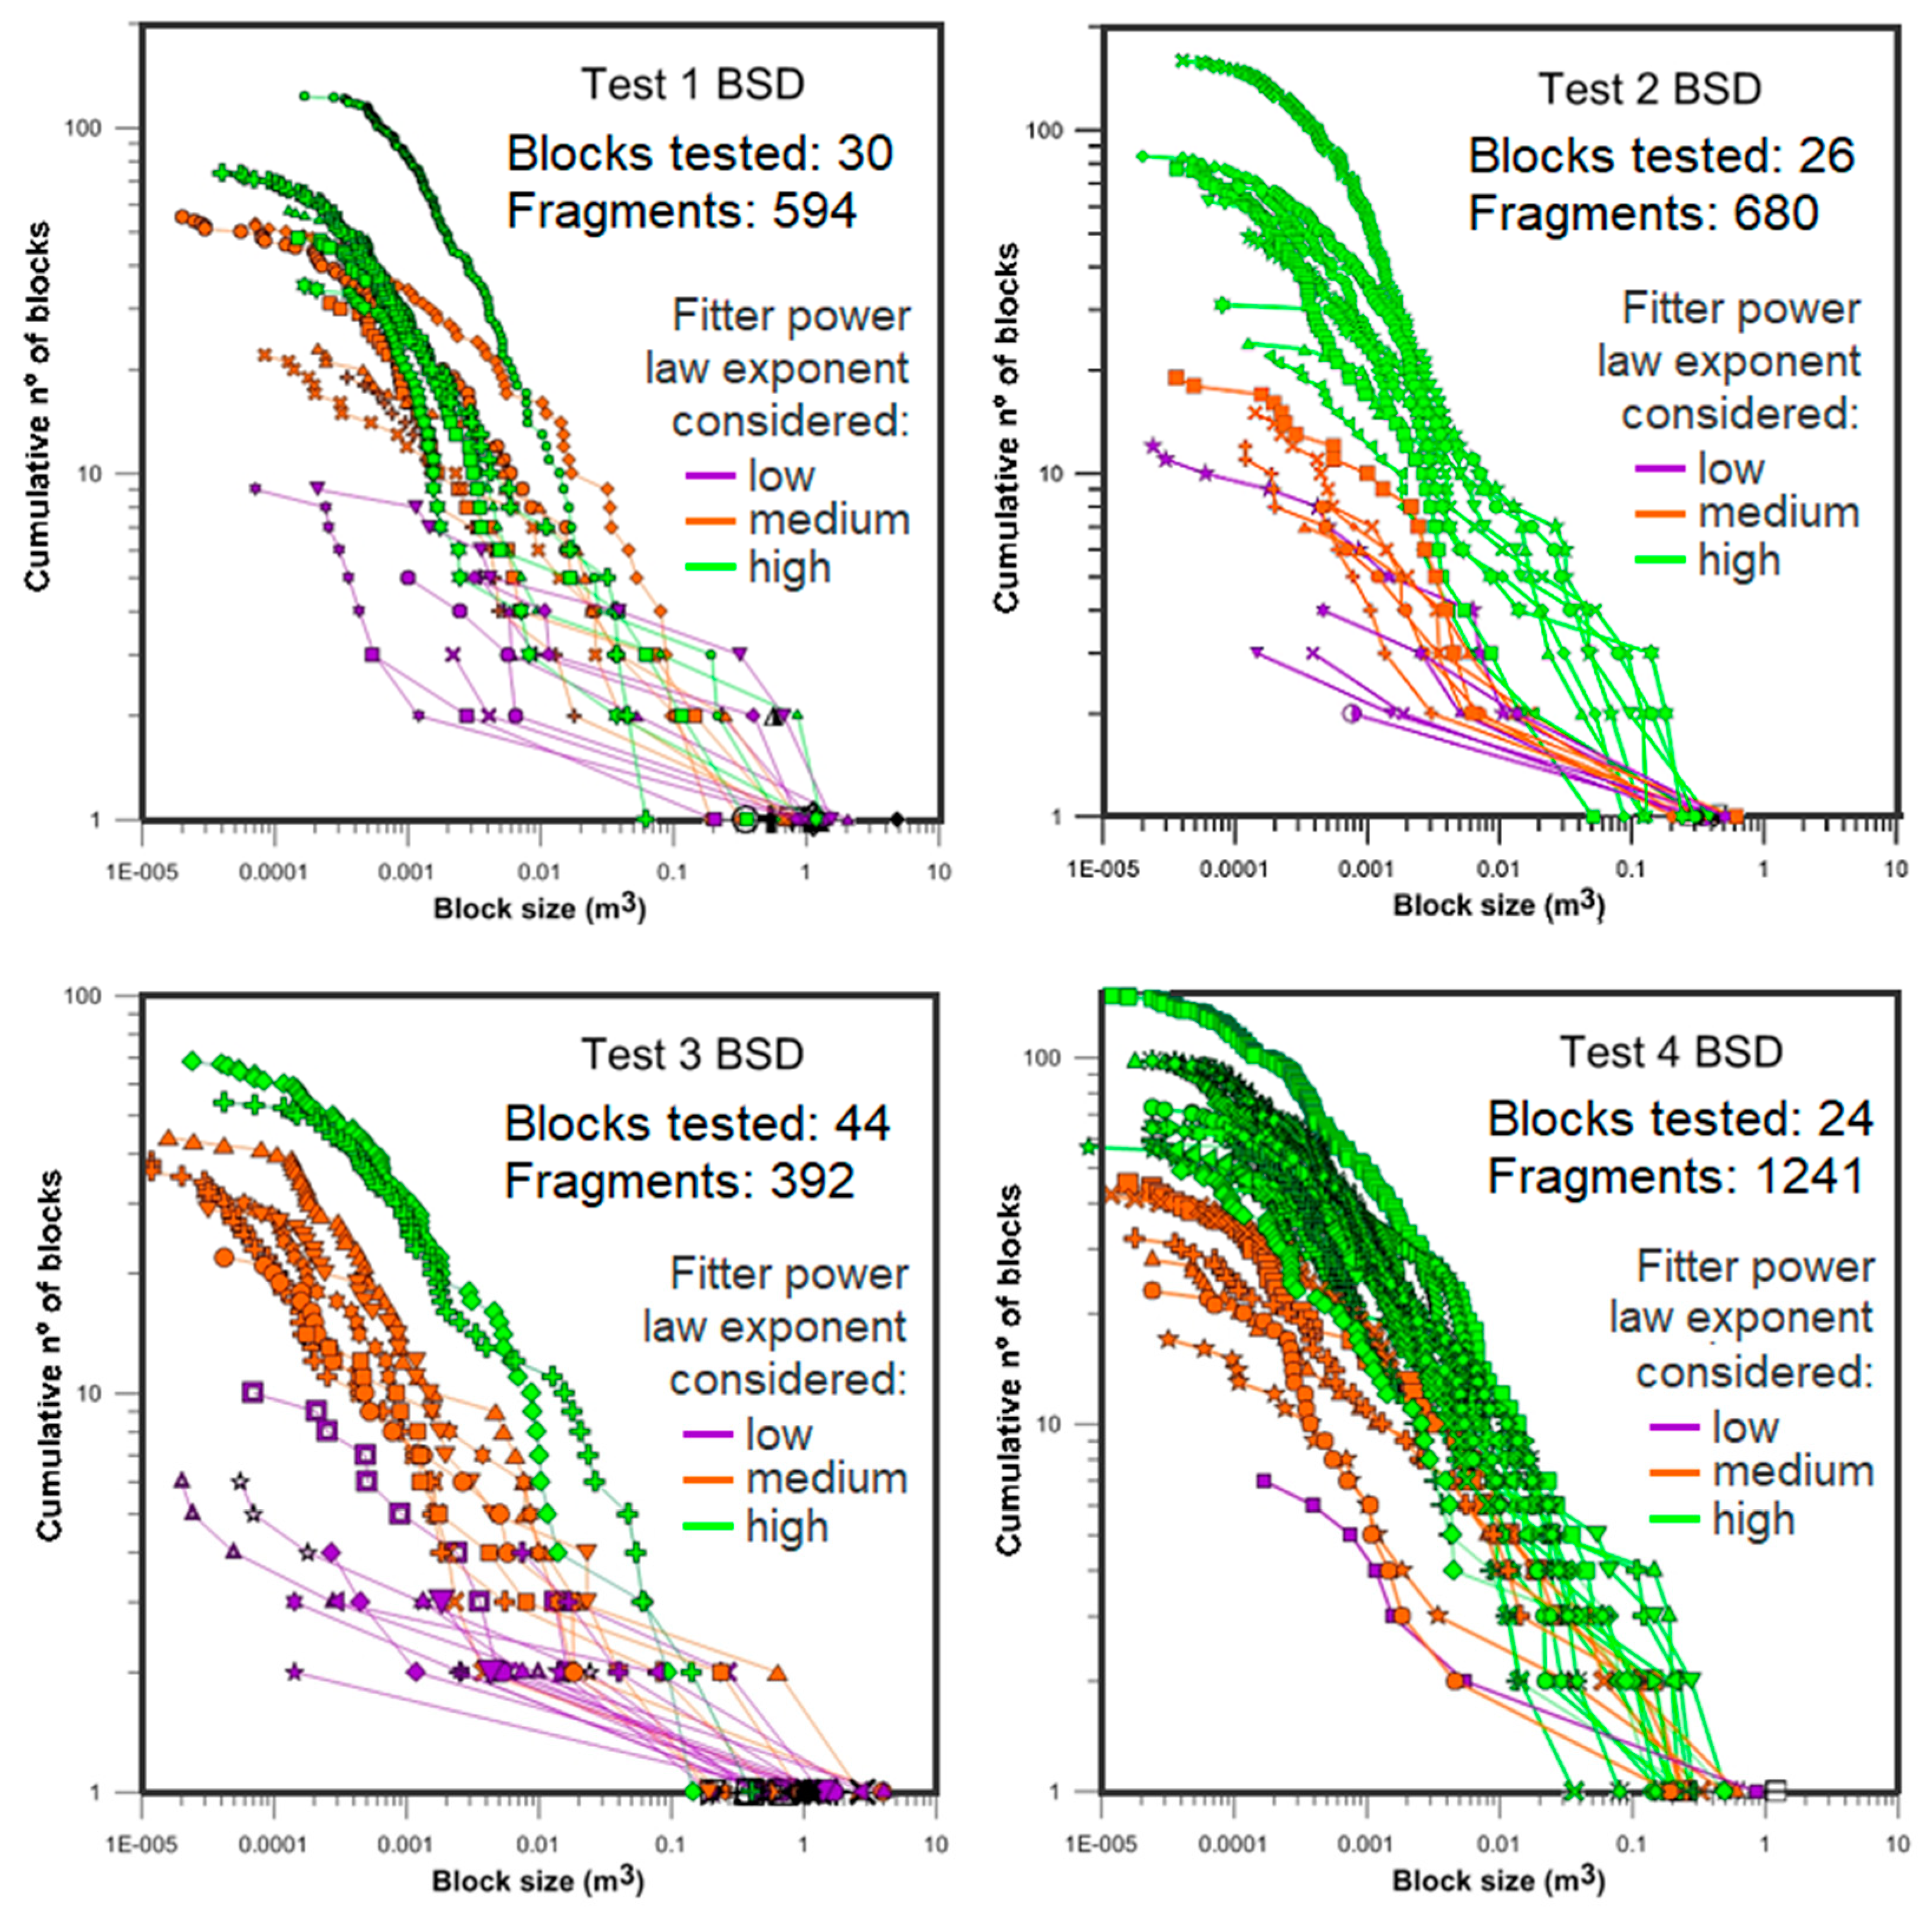
We plot all the volume distributions of all the fragments obtained from each tested block, arranged also by testing sites (
Figure 15). We have colored the distributions defining three fragmentation intensity classes: low, medium and high values of the exponent of the fitted power law. The exponent values range from 0.15 to 0.25 for the low intensity class (purple in
Figure 15), from 0.25 to 0.5 for medium class (orange in
Figure 15), and >0.5 for high intensity class (green in
Figure 15).
In this way, we can observe the variation of the breakage pattern at each testing site. In test site 1, we observe blocks that break progressively until reaching a high number of fragments (>100 fragments). Test site 2 may be differentiated by the blocks that generate more or less than 20 fragments, with a change of tendency of the exponent of the fitted power laws. Most of the blocks at test site 3 did not break. Most of the volume distributions show low exponents of the fitted power law. Finally, the distributions of the fragment volumes of test site 4 show mostly high exponents of the fitted power law and a high number of fragments generated.
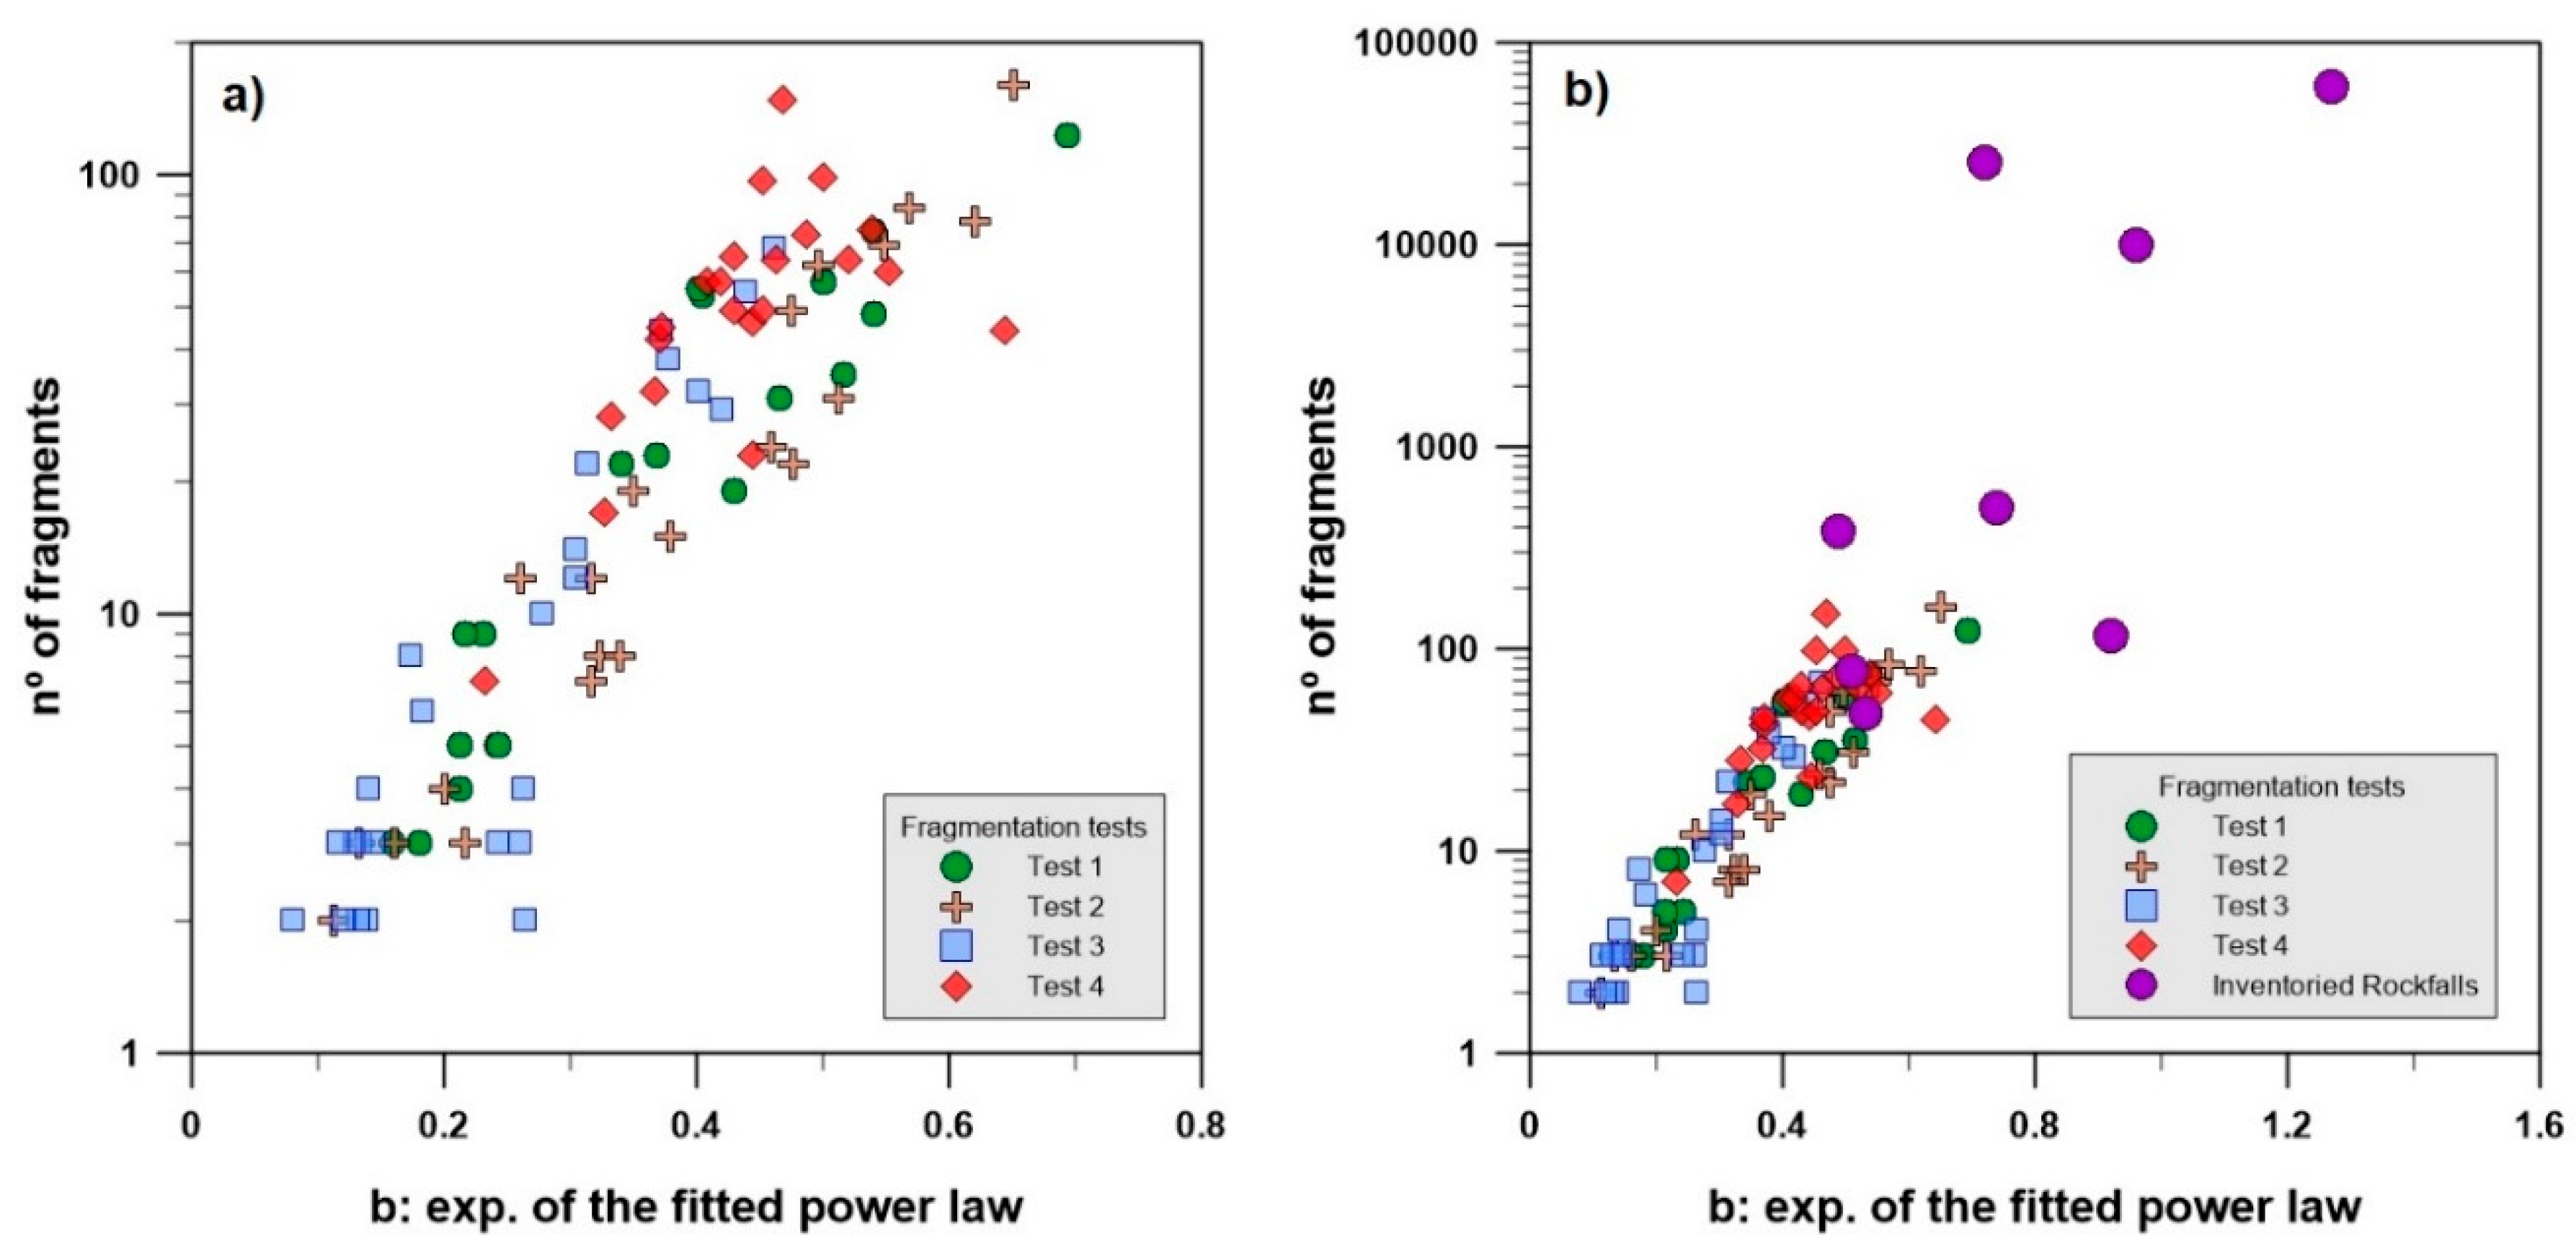
The number of fragments generated is directly correlated to the exponent of the fitted power law of the fragments’ size distribution (
Figure 16). It is interesting to note the contrasting behavior of testing sites 3 and 4, with low and high values, respectively, of the number of fragments and exponent of the fitted power laws. Adding the information of the natural fragmental rockfall inventory [
6] (purple dots in
Figure 16b), the trend is maintained with the increase in the number of fragments and also for exponents. Notice that the number of fragments from natural rockfalls may be generated from breakage or due to the disaggregation.
Each block size distribution has two important descriptors, the biggest fragment, that controls the bottom right position of the BSD, and the total number of fragments, that controls the slope of the distribution (intensity of the fragmentation).
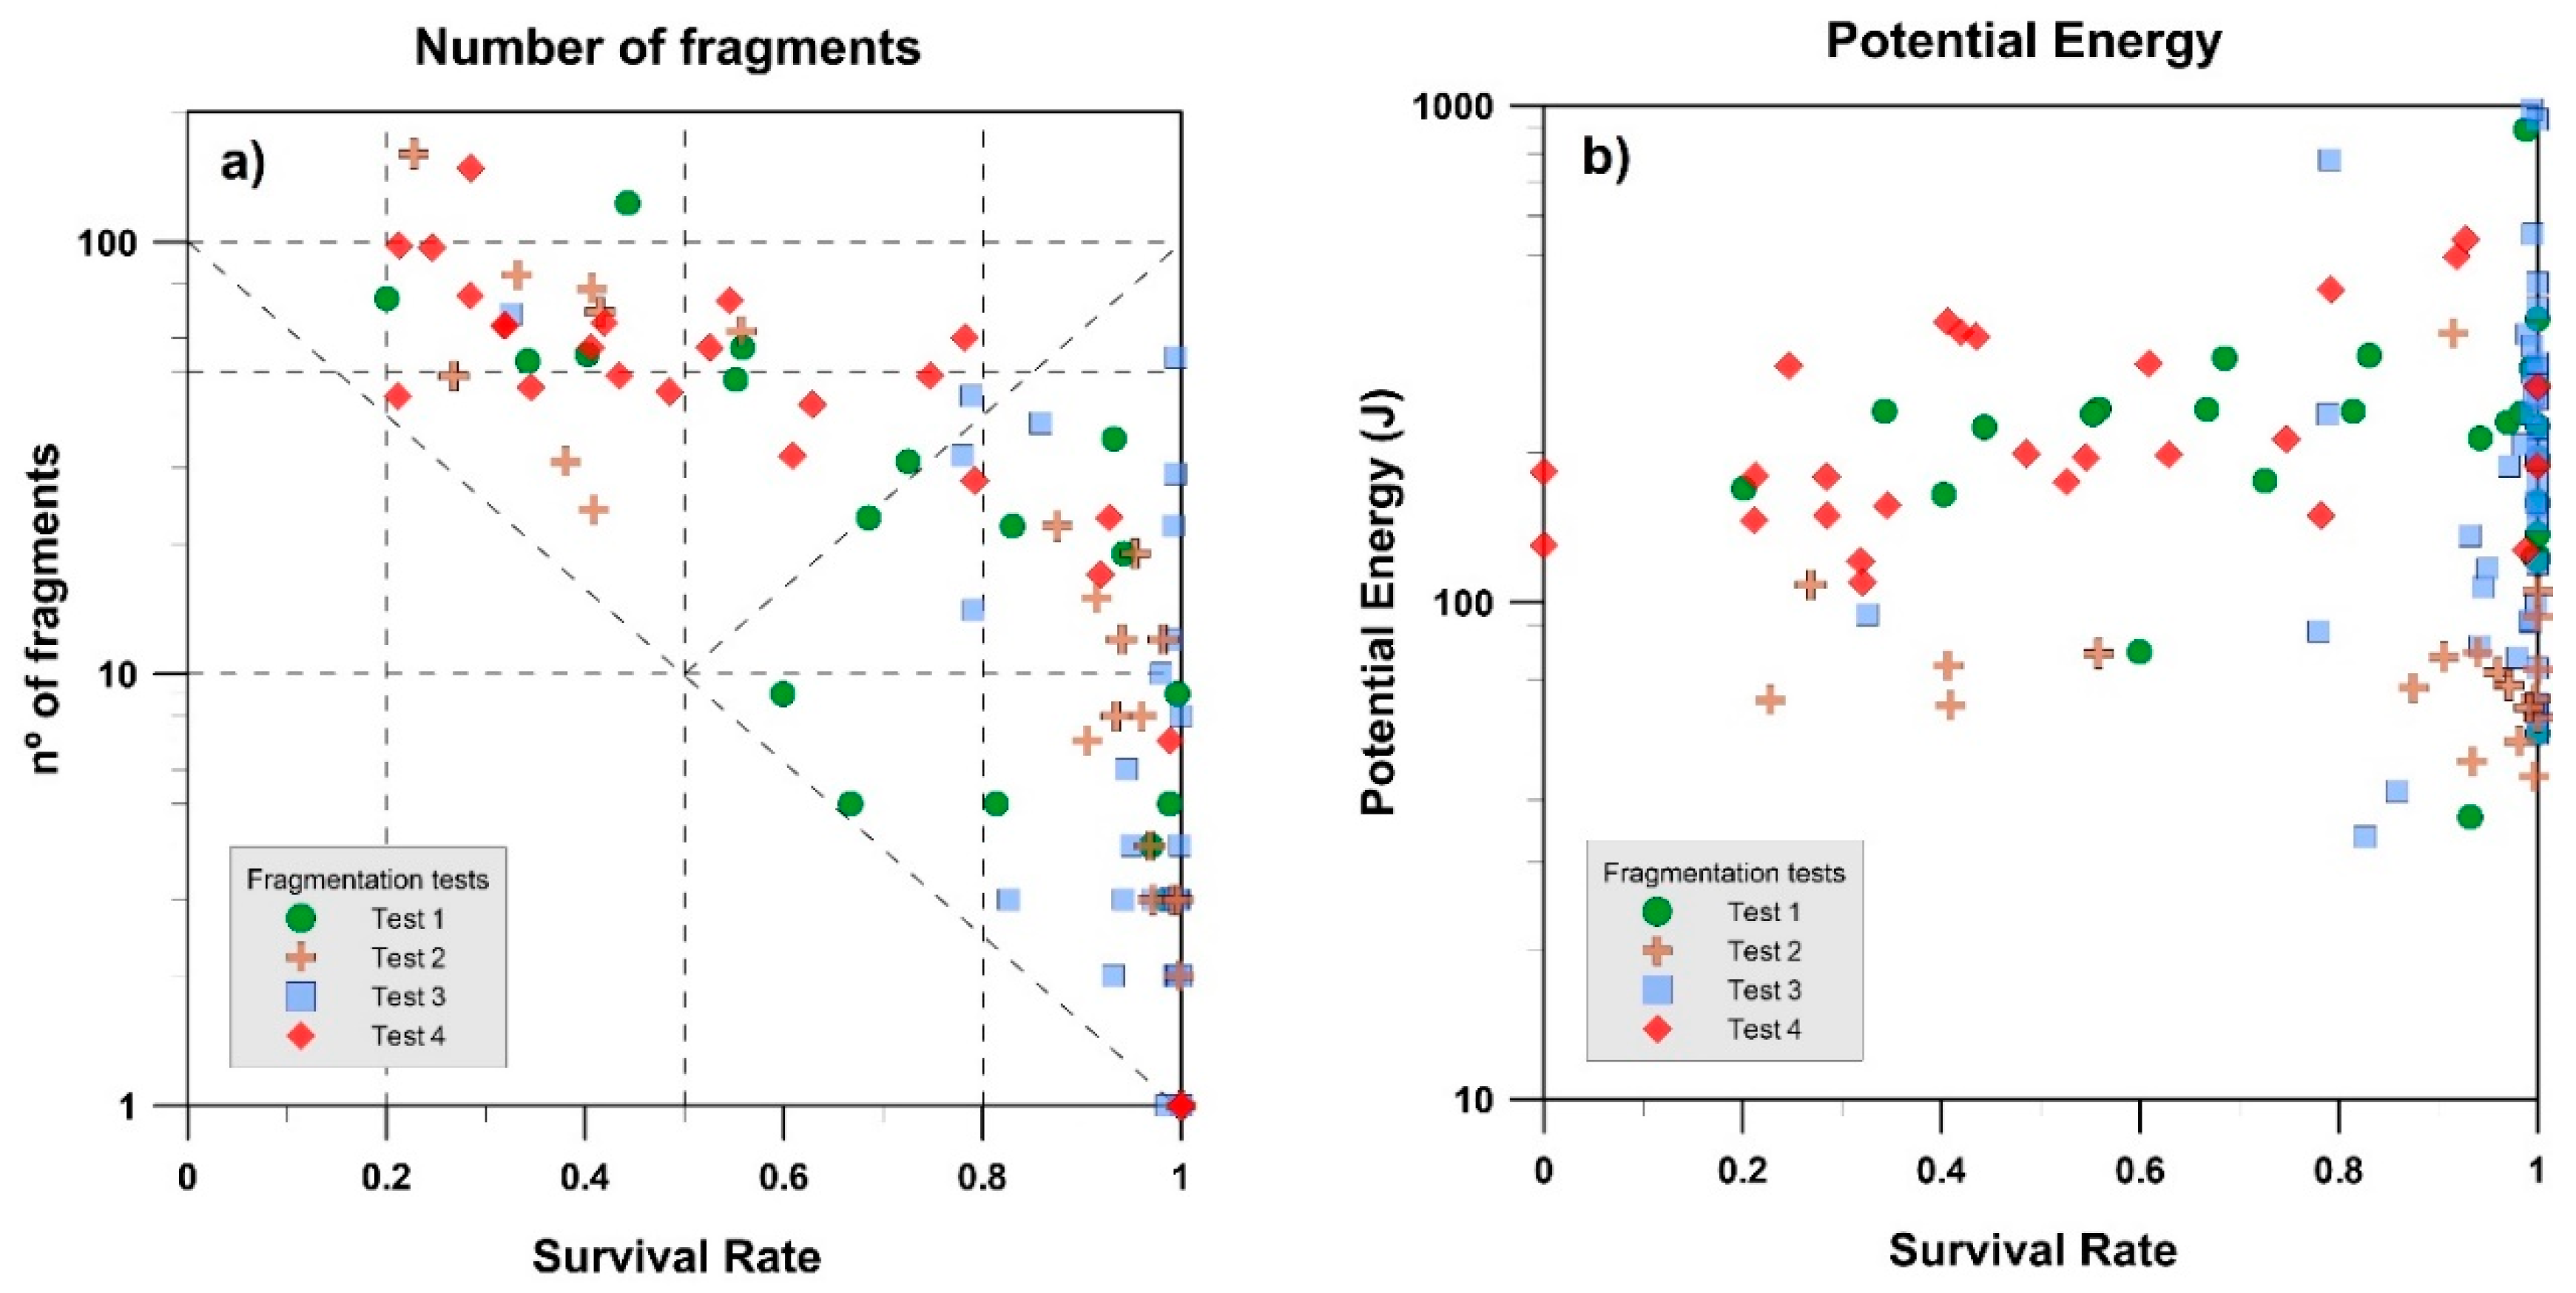
Rockfalls that generate a large number of fragments and high exponent values are associated with high values of total potential energy [
6]. However, the number of fragments and the exponents of test site 4 show a high degree of scattering (red diamonds in
Figure 16a), despite the fact that the blocks were released with a very similar potential energy (
Figure 17b). This is indicative that the potential energy—or the amount of energy—is not the only factor controlling fragmentation, as has already been observed by other researchers [
18].
3.4. Survival Rate
The Survival rate (Sr) is the largest fragment volume measured over the initial volume. Then, a Sr = 1 means that the block remains intact. Two blocks with the same Sr may produce different number of blocks [
5,
6]. Then, the Sr and the number of fragments are necessary to characterize the fragmentation results.
Figure 17a shows the Survival rate and the number of fragments produced by each block tested. As the Sr decreases (the size of largest fragment generated reduces), the number of fragments produced increases. However, there is no direct relationship, and the same number of fragments can be generated within a wide range of Sr and vice versa. The Sr in the tests performed cannot be directly related to the potential energy, as shown in
Figure 17b, exemplifying that it is not possible to establish a fixed energetic threshold. All the blocks of each testing site were released from the same height, although the potential energy varies slightly since each block has its own volume. Other variables, such as the mechanical rock properties, the impact angle against the terrain or ground stiffness, as well as the type of impact (face, edge or corner), the block shape and the pre-existing block fissures, must affect the probability of breakage and the generation of fragments [
23].
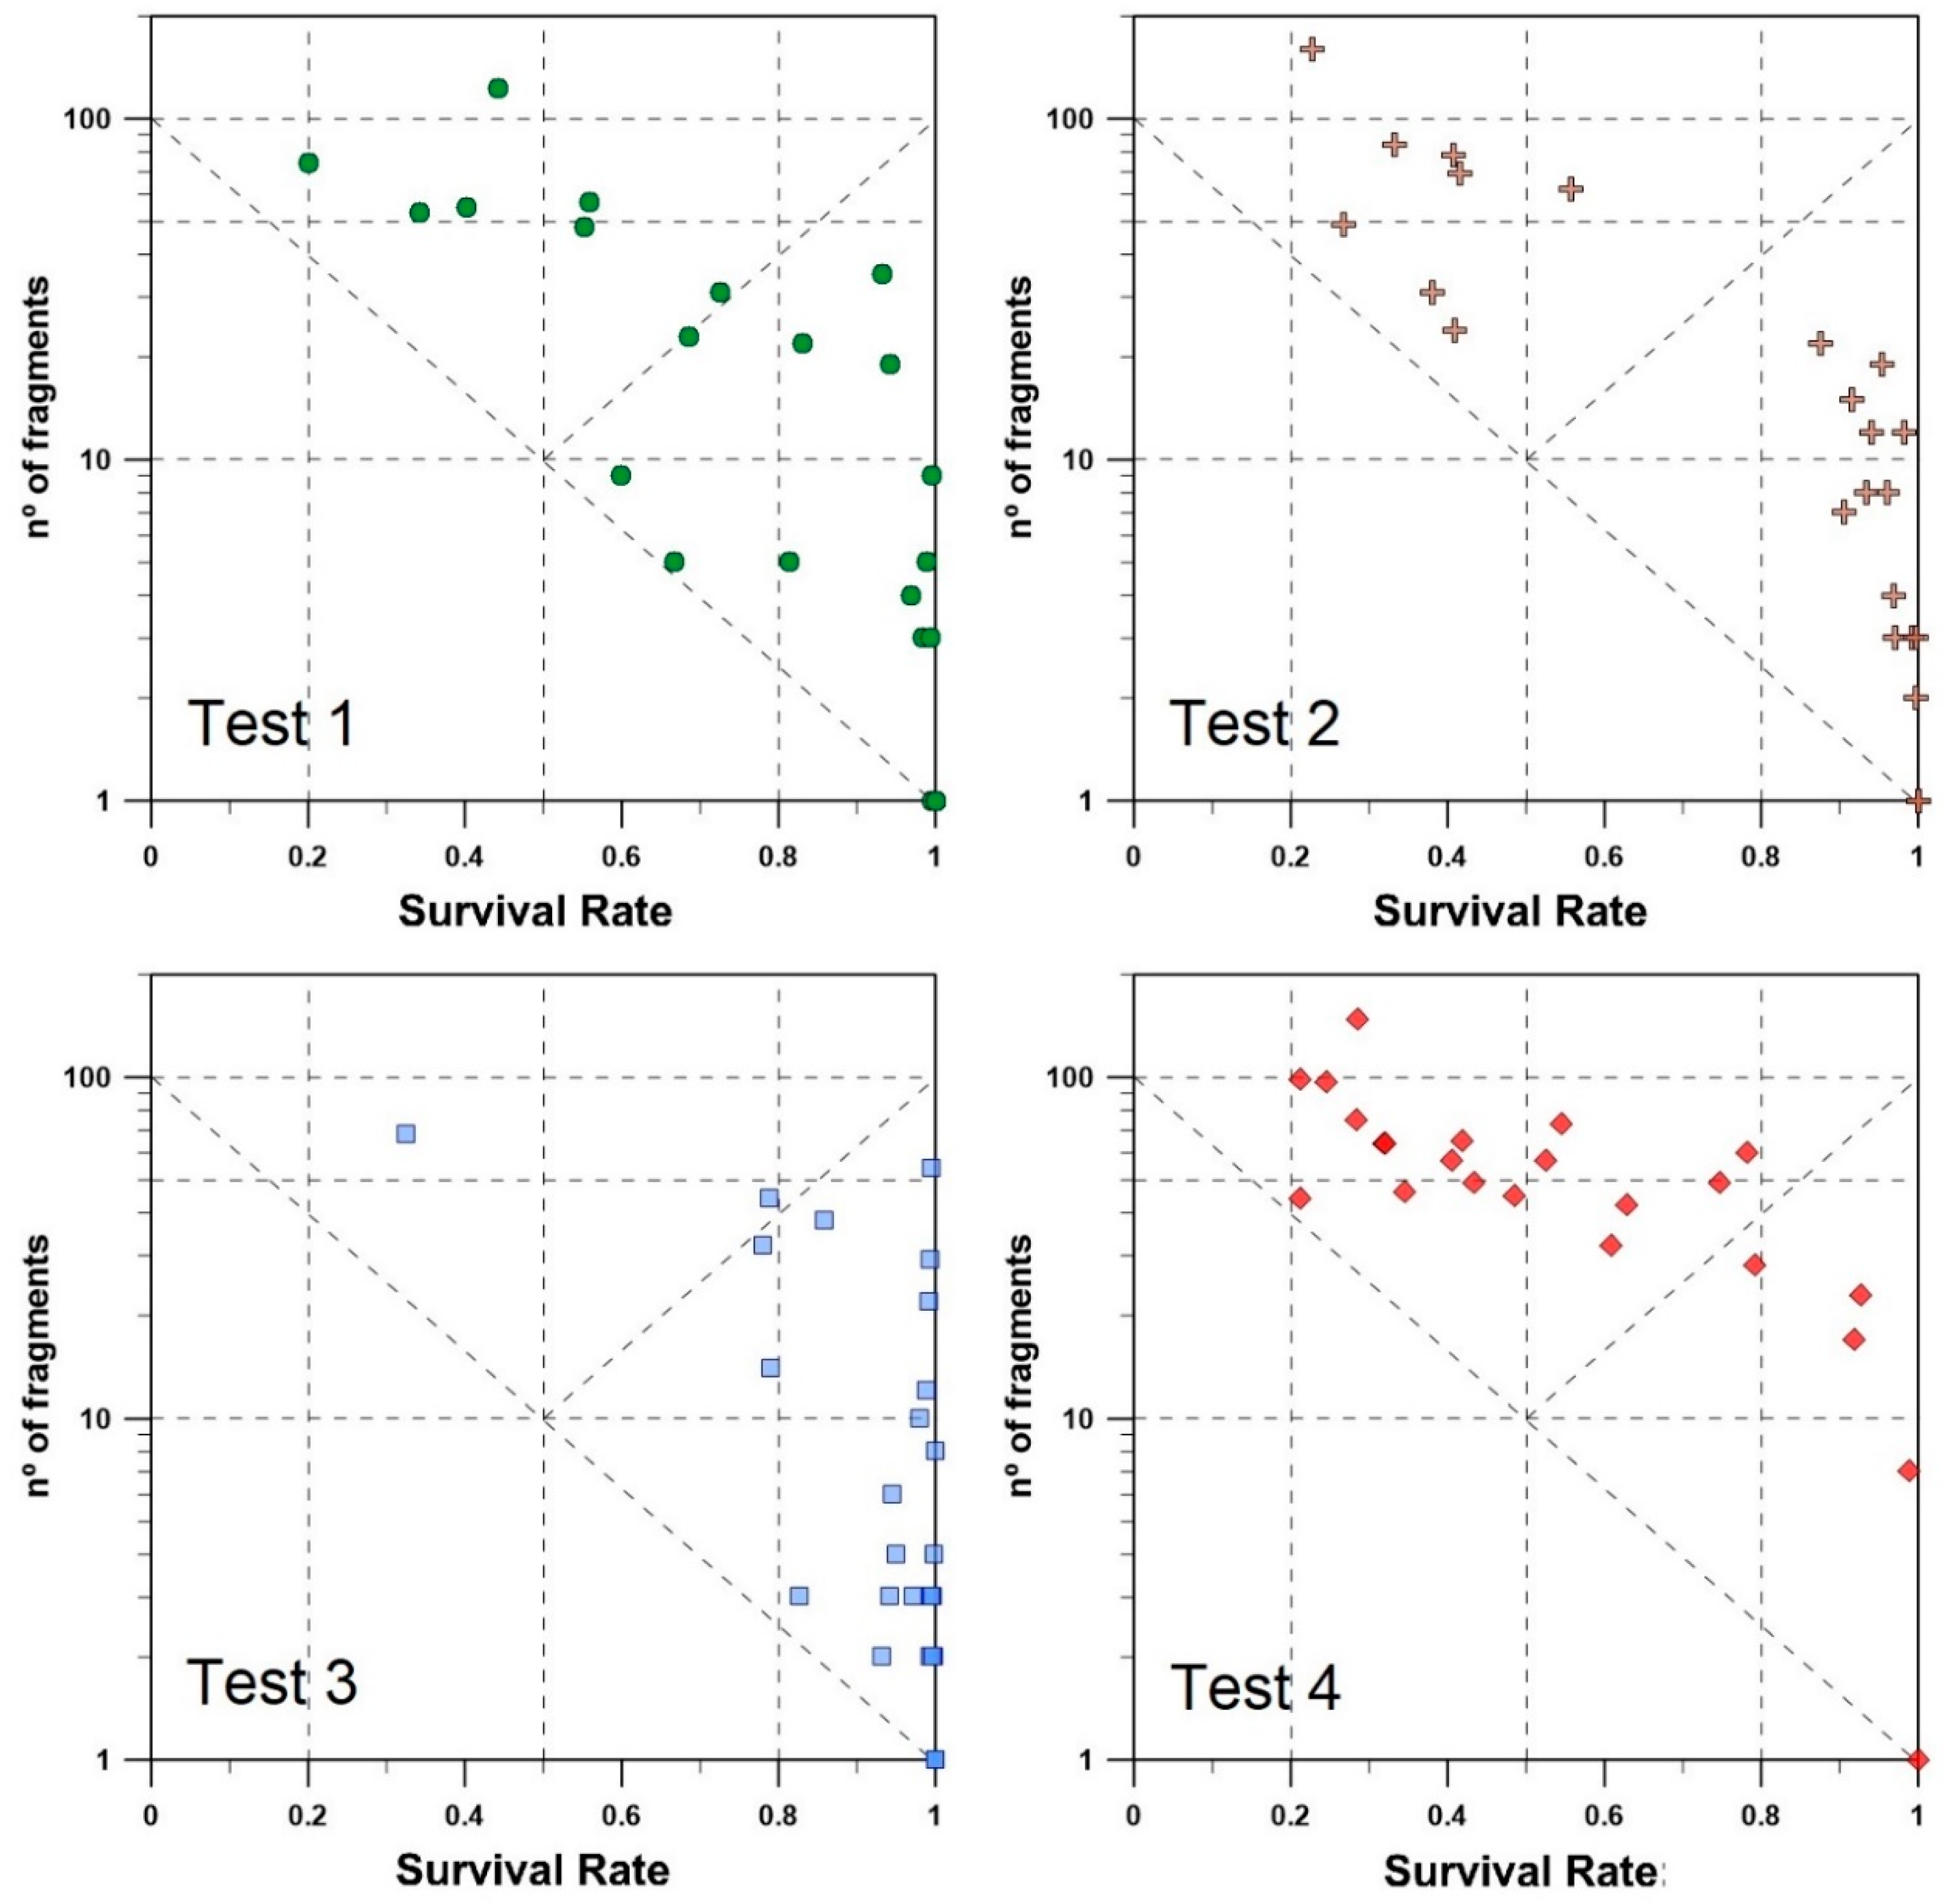
Plotting the number of fragments versus the Sr separately by testing sites (
Figure 18), a distinct behavior is observed. Blocks at test site 1 may either remain virtually intact or break substantially with Sr ranging from 1 to 0.2, increasing the number of fragments gradually. Based on our perception during the tests, the impact angle, the block shape, the relative orientation between the anisotropies (e.g., fissures) of the rock block and the impact angle, and the rigidity of the ground at the impact point, must control the fragmentation. Blocks from test site 2 may be grouped in two sets of Sr > 0.85 or Sr < 0.55 with less or more than 20 fragments, respectively. In this case, blocks impacting on a more rigid substrate, generate a higher number of fragments and low values of Sr. Moreover, the results seem to be very similar to test site 1. Test site 3 is a steep slope with a soft terrain in the upper part of the profile (see
Figure 3), and a flat surface below composed of soft ground (compacted debris). Under such circumstances, the falling blocks impact tangentially to the slope surface and fall on the soft ground surface below. None of the blocks broke during the impact against the slope. Most of the blocks in test site 3 remained virtually intact, with high values of Sr (>0.8–0.9). Despite these high values of Sr, the number of blocks ranges from 1 (no breakage) to 60. On the other side, test site 4 were carried out releasing the blocks 8.5 m above a fault plane of 42° of slope and a total height of 23.6 m. The fault plane (see
Figure 1 and
Figure 2) is very stiff (the same lithology as the tested block) and the slope geometry favors a high normal component of the impact force. In consequence, the blocks break in a very explosive way, most of them producing more than 40 fragments, and even up to more than 100. Contrastingly, Sr ranges from 1 (or 0.8) to 0.2. Testing sites 3 and 4 show opposite behaviors, highlighting the importance of the terrain stiffness and impact angle.
3.5. Block Contact Geometry
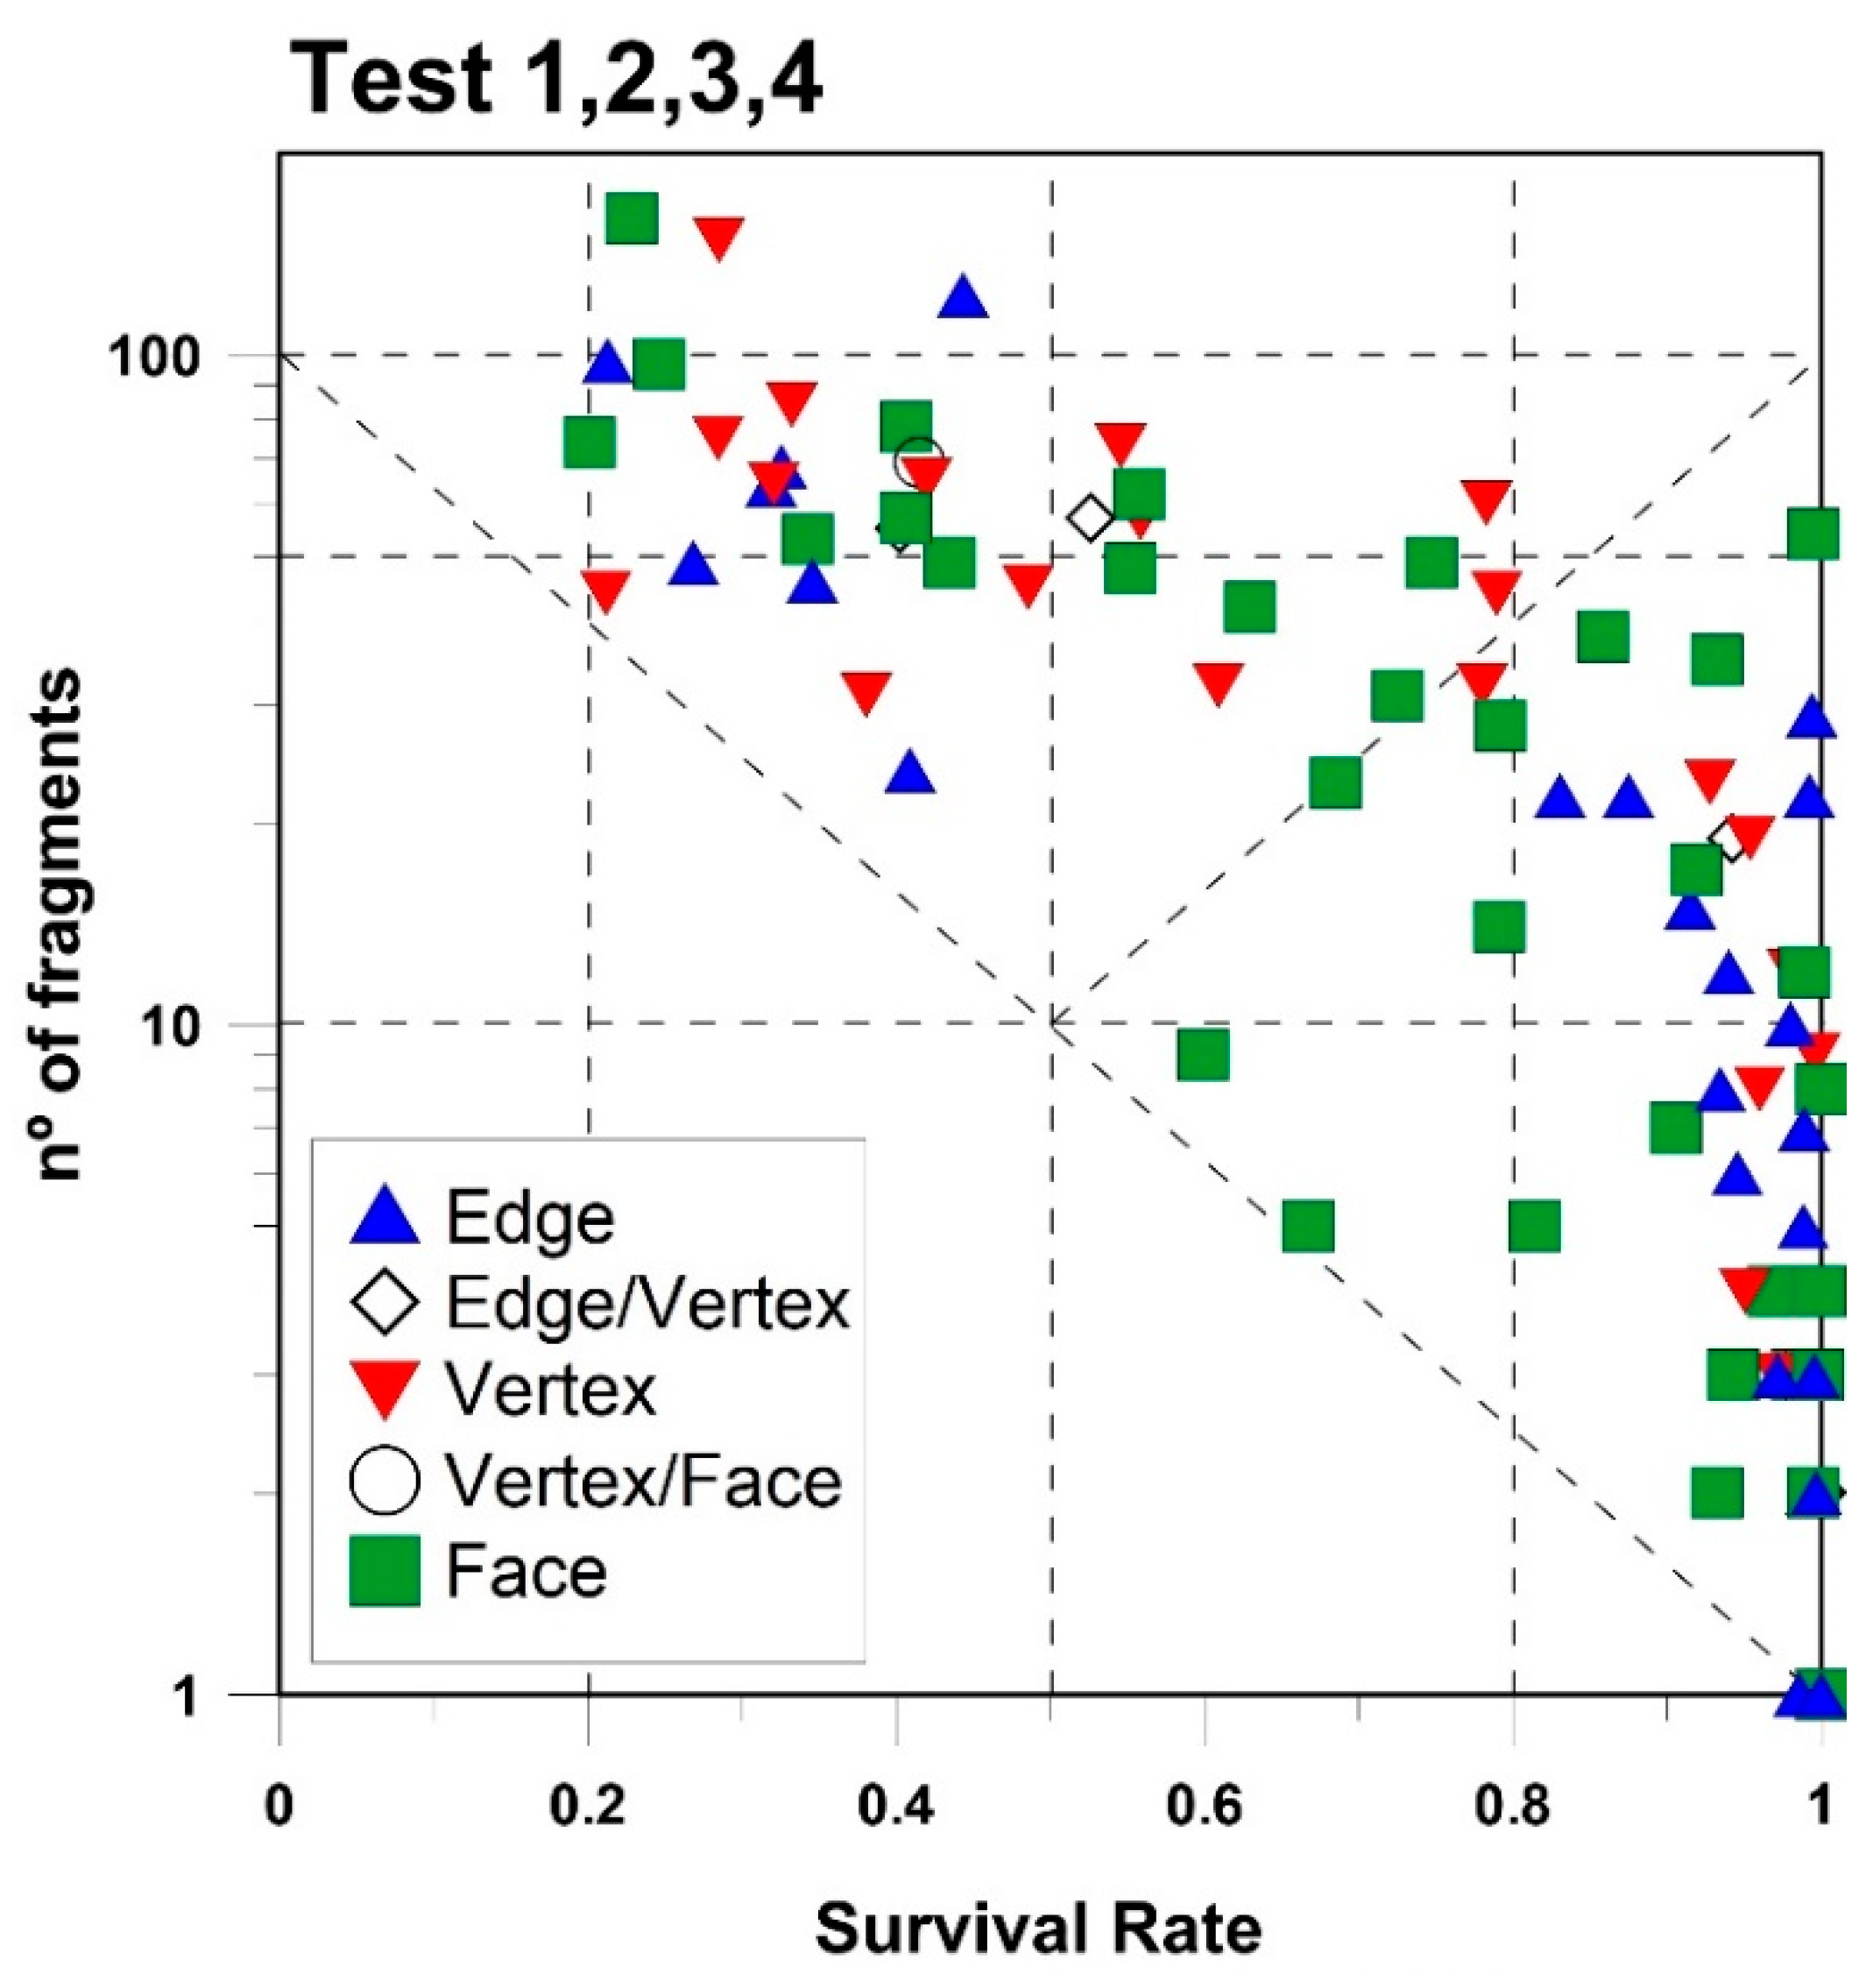
The block contact geometry is obtained from the analysis of the high-speed videos recorded from different points of view. After the visualization of each block tested and selecting the best camera position and group of frames, each block impact against the ground is classified as edge, vertex or face. Some impacts raise doubts and are classified in intermediate classes such as edge/vertex or vertex/face. The data obtained from all the blocks tested in the 4 test sites suggest that no clear correlation exist of the contact between the block and the ground and the number of produced fragments or the Sr (
Figure 19). The
Figure 19 shows the scattering of the green squares that represent block face impacts. A similar scattering can be observed for the red triangles that represent the block vertex impacts. The edge impacts are concentrated in two groups—the ones with an Sr > 0.8 or 0.9, and the ones with an Sr < 0.45.
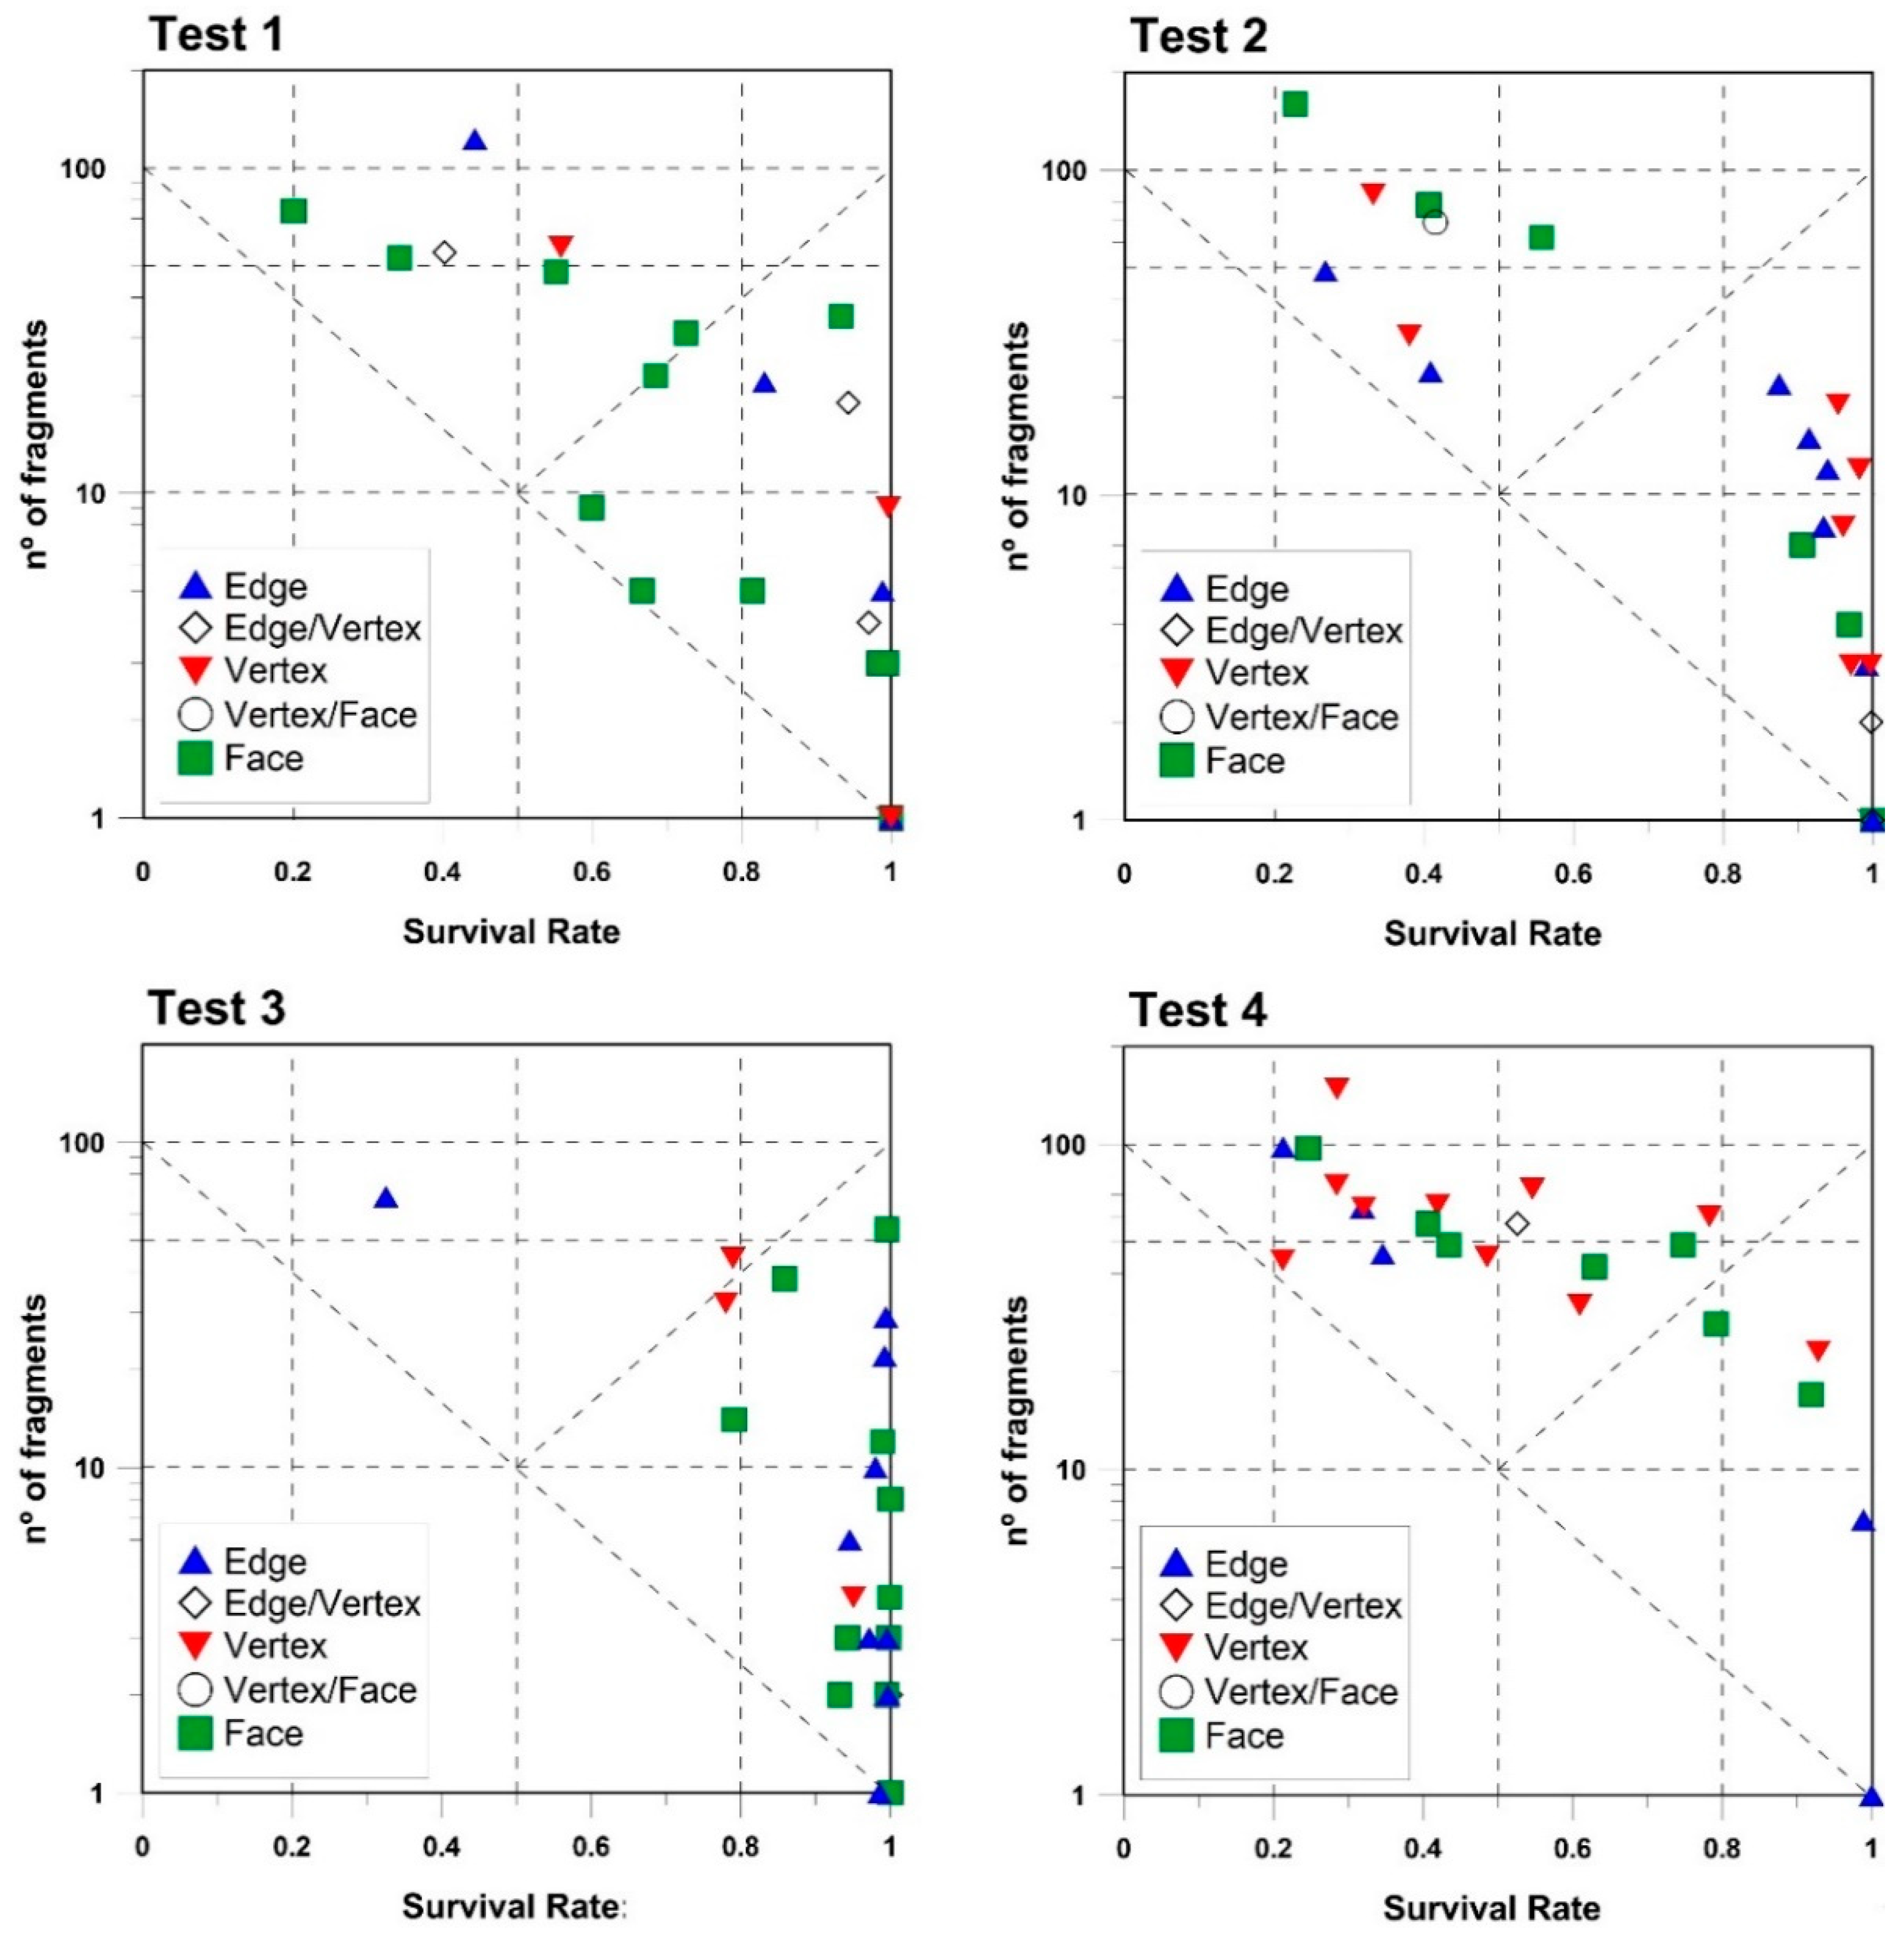
To better visualize the effect of the impact geometry in each test site,
Figure 20 shows the same information plotted separately for each test site. No correlation is observed between the block contact geometry and the number of fragments and the survival rate. This suggests that the contact geometry, by itself, is not a key factor controlling the fragmentation pattern. On the other hand, the number of fragments, the survival rate and the exponent of the fitted power law over the fragments size distribution allows the identification of three fragmentation scenarios that could be related with the profile geometry, the impact angle and the ground stiffness.
4. Discussion
Real-scale fragmentation tests allow the measurement and observation of the rock fragmentation phenomenon in a highly controlled scenario and with the capability to repeat the experiment. The results show large variations of the breakage behavior for the same conditions within each test. Test by test, we can identify different patterns, just using the multiplying factor MF (mean number of fragments produced per block tested), from a low value of 9 at test site 3 to a high value of 50 at test site 4, being 20 and 26 at test sites 1 and 2, respectively. The same conclusions are obtained by looking to the total number of fragments generated or the exponent of the fitted power laws, which is related to the intensity of the fragmentation. We argue that the characterization of the fragmentation requires considering both the largest fragment remnant (survival rate) and the fragments distribution (the exponent or the total number of fragments).
Different fragmentation patterns are observed at the testing sites. All range of fragmentation features are observed in test site 1. Two behaviors are observed in test site 2, the ones that break and the ones that break moderately. The latter, with similar results to those of test site 1. In both cases, the exponent of the fitted power law is close to 0.45. Test site 3, involved very soft terrain of the ground surface. Most of the blocks remain unbroken, with an Sr > 0.85, but producing a number of fragments between 2 to 100. Test 4 is placed at the opposite end. The Sr ranges from 0.2 to 0.8, but most of the blocks generate more than 40 fragments. Based on all these observations, we conclude that, despite some trends being identified, the fragmentation shows a very high stochastic behavior. However, it is possible to define fragmentation scenarios, which can be approached in a probabilistic way.
The power law shape of the distributions confirms the suitability of using the Rockfall Fractal Fragmentation Model, either based on scale-invariant or scale-variant. The fractal formulation is able to reproduce the behavior observed in natural rockfall events [
5,
6].
The stiffness or capacity of the terrain to absorb energy appears as a major factor in controlling fragmentation, as shown by comparing the results of test site 3 with the others. A similar result can be seen with the impact angle. We do not observe any correlation between the fragmentation patterns and the block contact geometry defined by classes as edge, vertex or face. No correlation was observed between the fragmentation patterns and the energy of the blocks.
5. Conclusions
The real-scale fragmentation tests provide a large amount of high-quality data: initial volumes, block size distributions, energies, impact angles, as well as all the information needed in order to calibrate fragmentation models such as the Rockfall Fractal Fragmentation Model [
5,
6], propagation models like the RockGIS [
24,
25] and/or discrete elements methods codes.
The characterization of the fragmentation phenomenon based on the largest fragment only or on the mean size before and after the breakage are not able to illustrate the complexity of the generated fragments size distribution. Two rock blocks that break yielding the same Sr (survival rate, or the largest fragment volume over the initial volume), can produce a highly variable number of fragments, between a minimum of two to several hundred, as observed in the tests performed. The implication for the rockfall hazard characterization in terms of the probability of impact or to design the protection measures is relevant. For this reason, we propose to characterize the block fragmentation considering the largest block remnant (Sr) and the number of fragments. The exponent of the fitted power law over the fragments size distribution is also a measure of the intensity of the fragmentation.
Test sites 1 and 2 show similar results, with an MF (multiplying factor) between 20 and 26. The exponent of the fitted power law over the fragments size distributions is close to 0.45 in both cases. The slope profiles of these two sites have similar heights and impact angles, as well as the same impact ground stiffness. Test site 2 is a double bench scenario; however, only two blocks tested passed the second bench. From our point of view, test sites 1 and 2 define similar contexts and yield similar fragmentation patterns. The volume distribution of the largest fragments generated is close to the initial volume distribution (
Figure 11 and
Figure 12). Although only a small fraction of the block fragments, the number of fragments generated is very high (594 and 680 fragments, respectively) with an MF over 20.
Test site 3 corresponds to a scenario of soft impact ground (low stiffness), and the results highlight the relevance of this factor. The MF obtained is less than 9, and the exponent of the fitted power law over the fragment distribution is the lowest with a value of 0.31. In this test site, fragmentation is characterized by an Sr > 0.8. Despite of these high values of Sr, the number of fragments generated may range between 1 (no breakage) and 50. In other words, in a context of low fragmentation, the number of fragments generated can also be high.
Test site 4 was selected trying to maximize the breakage by means of a less inclined and stiff fault bedrock plane to increase the normal component of the impact. The results show explosive fragmentation, giving an MF of 50 and an exponent of the fitted power law over the fragments distribution of 0.54. Plotting Sr versus the number of fragments shows that most of the blocks produce more than 40 fragments and up to > 100. However, the Sr ranges from 1 (or 0.8) to 0.2.
Different fragmentation patterns result from the comparison between the initial volumes distribution and the fragments distribution (
Figure 21a). The largest fragments show a distribution parallel to the initial blocks. The distance between both distributions is a function of Sr. This distance may have a meaning similar to the diameter before and after the breakage [
10]. However, this descriptor refers to the largest fragment only, and does not describe the rest of the distribution. When the tail of the distribution corresponds to the initial block remnants ends, the shape of the distribution is defined by the part of the block that separates from the initial block (the newly generated fragments), and the fitted power law expresses the intensity of the fragmentation (yellow dots in
Figure 21a). The exponent of this power law can be used when the number of fragments must be predicted (in modelling), and for the definition of fractal behavior [
4,
5,
6]. Finally, the fragments distributions end with a rollover (green dots in
Figure 21a), due to either undersampling (in the tests, fragments smaller than 2 × 2 × 2 cm, were not measured) or due to the scale variant fractal behavior (in the plots, rollover is observed at sizes larger than the minimum measured) [
4,
5,
6].
Based on the observed results, we define three fragmentation scenarios: the low fragmentation scenario of test site 3, with an MF close to 10, an exponent of 0.31, and values of Sr > 0.8 or 0.9. A high scattering is observed in the number of fragments generated (dashed blue triangular perimeter in
Figure 21b); a medium fragmentation scenario of test sites 1 and 2, with an MF close to 45, an exponent of 0.45, and high scattering of results in the plot of Sr versus the number of fragments; and the high fragmentation scenario of test site 4, with an MF of 50, an exponent of 0.54, and over 40 fragments per block. However, the Sr parameter shows high scattering, between 0.8 and 0.2 (dashed red triangular perimeter in
Figure 21b), indicating that the probability of block breakage cannot be determined from simple analysis of the information collected in the tests carried out.
The geometry of the slope profile and the impact angle seem to have a greater influence on the probability of breakage. However, the variability of these factors has not been sufficiently taken into account in the design of the tests, and their effect cannot be assessed quantitatively. Moreover, the stiffness of the impact terrain seems to exert a notable influence as can be deduced from the comparison of the results of tests 3 and 4. The block contact geometry, considering whether the blocks impacts against the terrain with a vertex, an edge or a face, does not appear to be a relevant parameter for the probability of breakage.

 ,
, 


