
Role of Hydrothermal Fluids in the Formation of the Kamioka Skarn-Type Pb–Zn Deposits, Japan


1
Center for Integrated Research and Education of Natural Hazards, Shizuoka University, 836 Ohya, Shizuoka 422-8529, Japan
2
Faculty of Science, Shizuoka University, 836 Ohya, Shizuoka 422-8529, Japan
3
Geological Survey of Japan, National Institute of Advanced Industrial Science and Technology (AIST), Tsukuba 305-8567, Japan
4
Museum of Natural and Environmental History, Shizuoka 422-8017, Japan
*
Author to whom correspondence should be addressed.
Geosciences 2021, 11(11), 447; https://0-doi-org.brum.beds.ac.uk/10.3390/geosciences11110447
Submission received: 5 September 2021
/
Revised: 27 October 2021
/
Accepted: 28 October 2021
/
Published: 29 October 2021
Abstract
:The Kamioka mine, located in Gifu Prefecture in Japan, is famous for the large water Cherenkov detector system, the Super-Kamiokande. The Kamioka skarn-type Pb–Zn deposits are formed in crystalline limestone and are replaced by skarn minerals within the Hida metamorphic rocks. The Kamioka deposits mainly consist of the Tochibora, Maruyama, and Mozumi deposits. The present study focuses on the ore-forming hydrothermal fluid activity in the Kamioka deposits and the peripheral exploration area based on the carbon and oxygen isotope ratios of calcite and rare earth element (REE) analyses. The carbon and oxygen isotope ratios of crystalline limestone (as the host rock) are not homogeneous, and depending on the degree of hydrothermal activity, they decreased to various degrees because of the reaction with the ore fluids. Thus, the carbon and oxygen isotope ratios of crystalline limestone can be used as an indicator of the influence of the hydrothermal fluids for the ore mineralization. The REE contents in the ores of igneous origin are one order of magnitude higher than the limestone origin. Further, depending on the formation temperatures, calcites precipitated during ore mineralization have a stable carbon isotope ratio and a widely varying oxygen isotope ratios. The Kamioka district fracture system is likely a major control factor on ore mineralization from hydrothermal activity. In addition, the skarnization-related ore-forming fluids are mostly meteoric in origin, confirming the conclusions from previous studies.
Keywords:
Kamioka deposit; skarn-type; Pb; Zn; carbon isotope; oxygen isotope; REE; meteoric; hydrothermal fluid1. Introduction
The Kamioka skarn-type Pb–Zn deposits are located in Gifu Prefecture, approximately 240 km northwest of Tokyo, Japan. The mining at the deposit was large-scale but no longer in operation; the total production and ore reserves are approximately 90 million tons with an average grade of Pb 0.7%, Zn 5.0%, and Ag 30 g/t [1].
The Kamioka deposits were formed in crystalline limestone within the Hida metamorphic rocks and have since been replaced by skarn minerals. Carbonate rocks in the Hida belt were metamorphosed before the ore mineralization and became crystalline limestones [2]. The stable isotope geochemistry of contact metamorphic carbonate rocks was studied from the isotope exchange of the rocks with mass balance calculations in the pioneer work [3].
The relationship between skarnization and ore mineralization is an important issue that needs to be solved. If ore mineralization resulted from hydrothermal processes, an ore-forming mechanism occurring in an open system should be considered. The contribution of meteoric water to the mineralization in the Kamioka deposits has been suggested in previous studies (e.g., [4,5]). The present study investigates the ore-forming mechanism of the Kamioka skarn-type Pb–Zn deposits based on carbon and oxygen isotope ratios of calcite because calcite is ubiquitous in the deposits regardless of its origin.
The Kamioka is currently world famous for elementary particle physics research instead of mining. The Super-Kamiokande, a large water Cherenkov detector system, is situated at 1000 m underground in the Kamioka mine. It is the successor to the pioneer Kamiokande facility. The Super-Kamiokande detector consists of a stainless-steel tank (diameter: 39.3 m, height: 41.4 m) filled with 50,000 tons of ultrapure water. Approximately 13,000 photo-multipliers with a diameter of 50 cm are installed on the inside of the tank walls. Super-Kamiokande experiments have revealed several neutrino properties, and the 2002 and 2015 Nobel Prizes in Physics were awarded to Professors M. Koshiba and T. Kajita, for great achievements in neutrino physics using the former Kamiokande and Super-Kamiokande experimental facilities.
2. Geologic Setting and Mineralogy
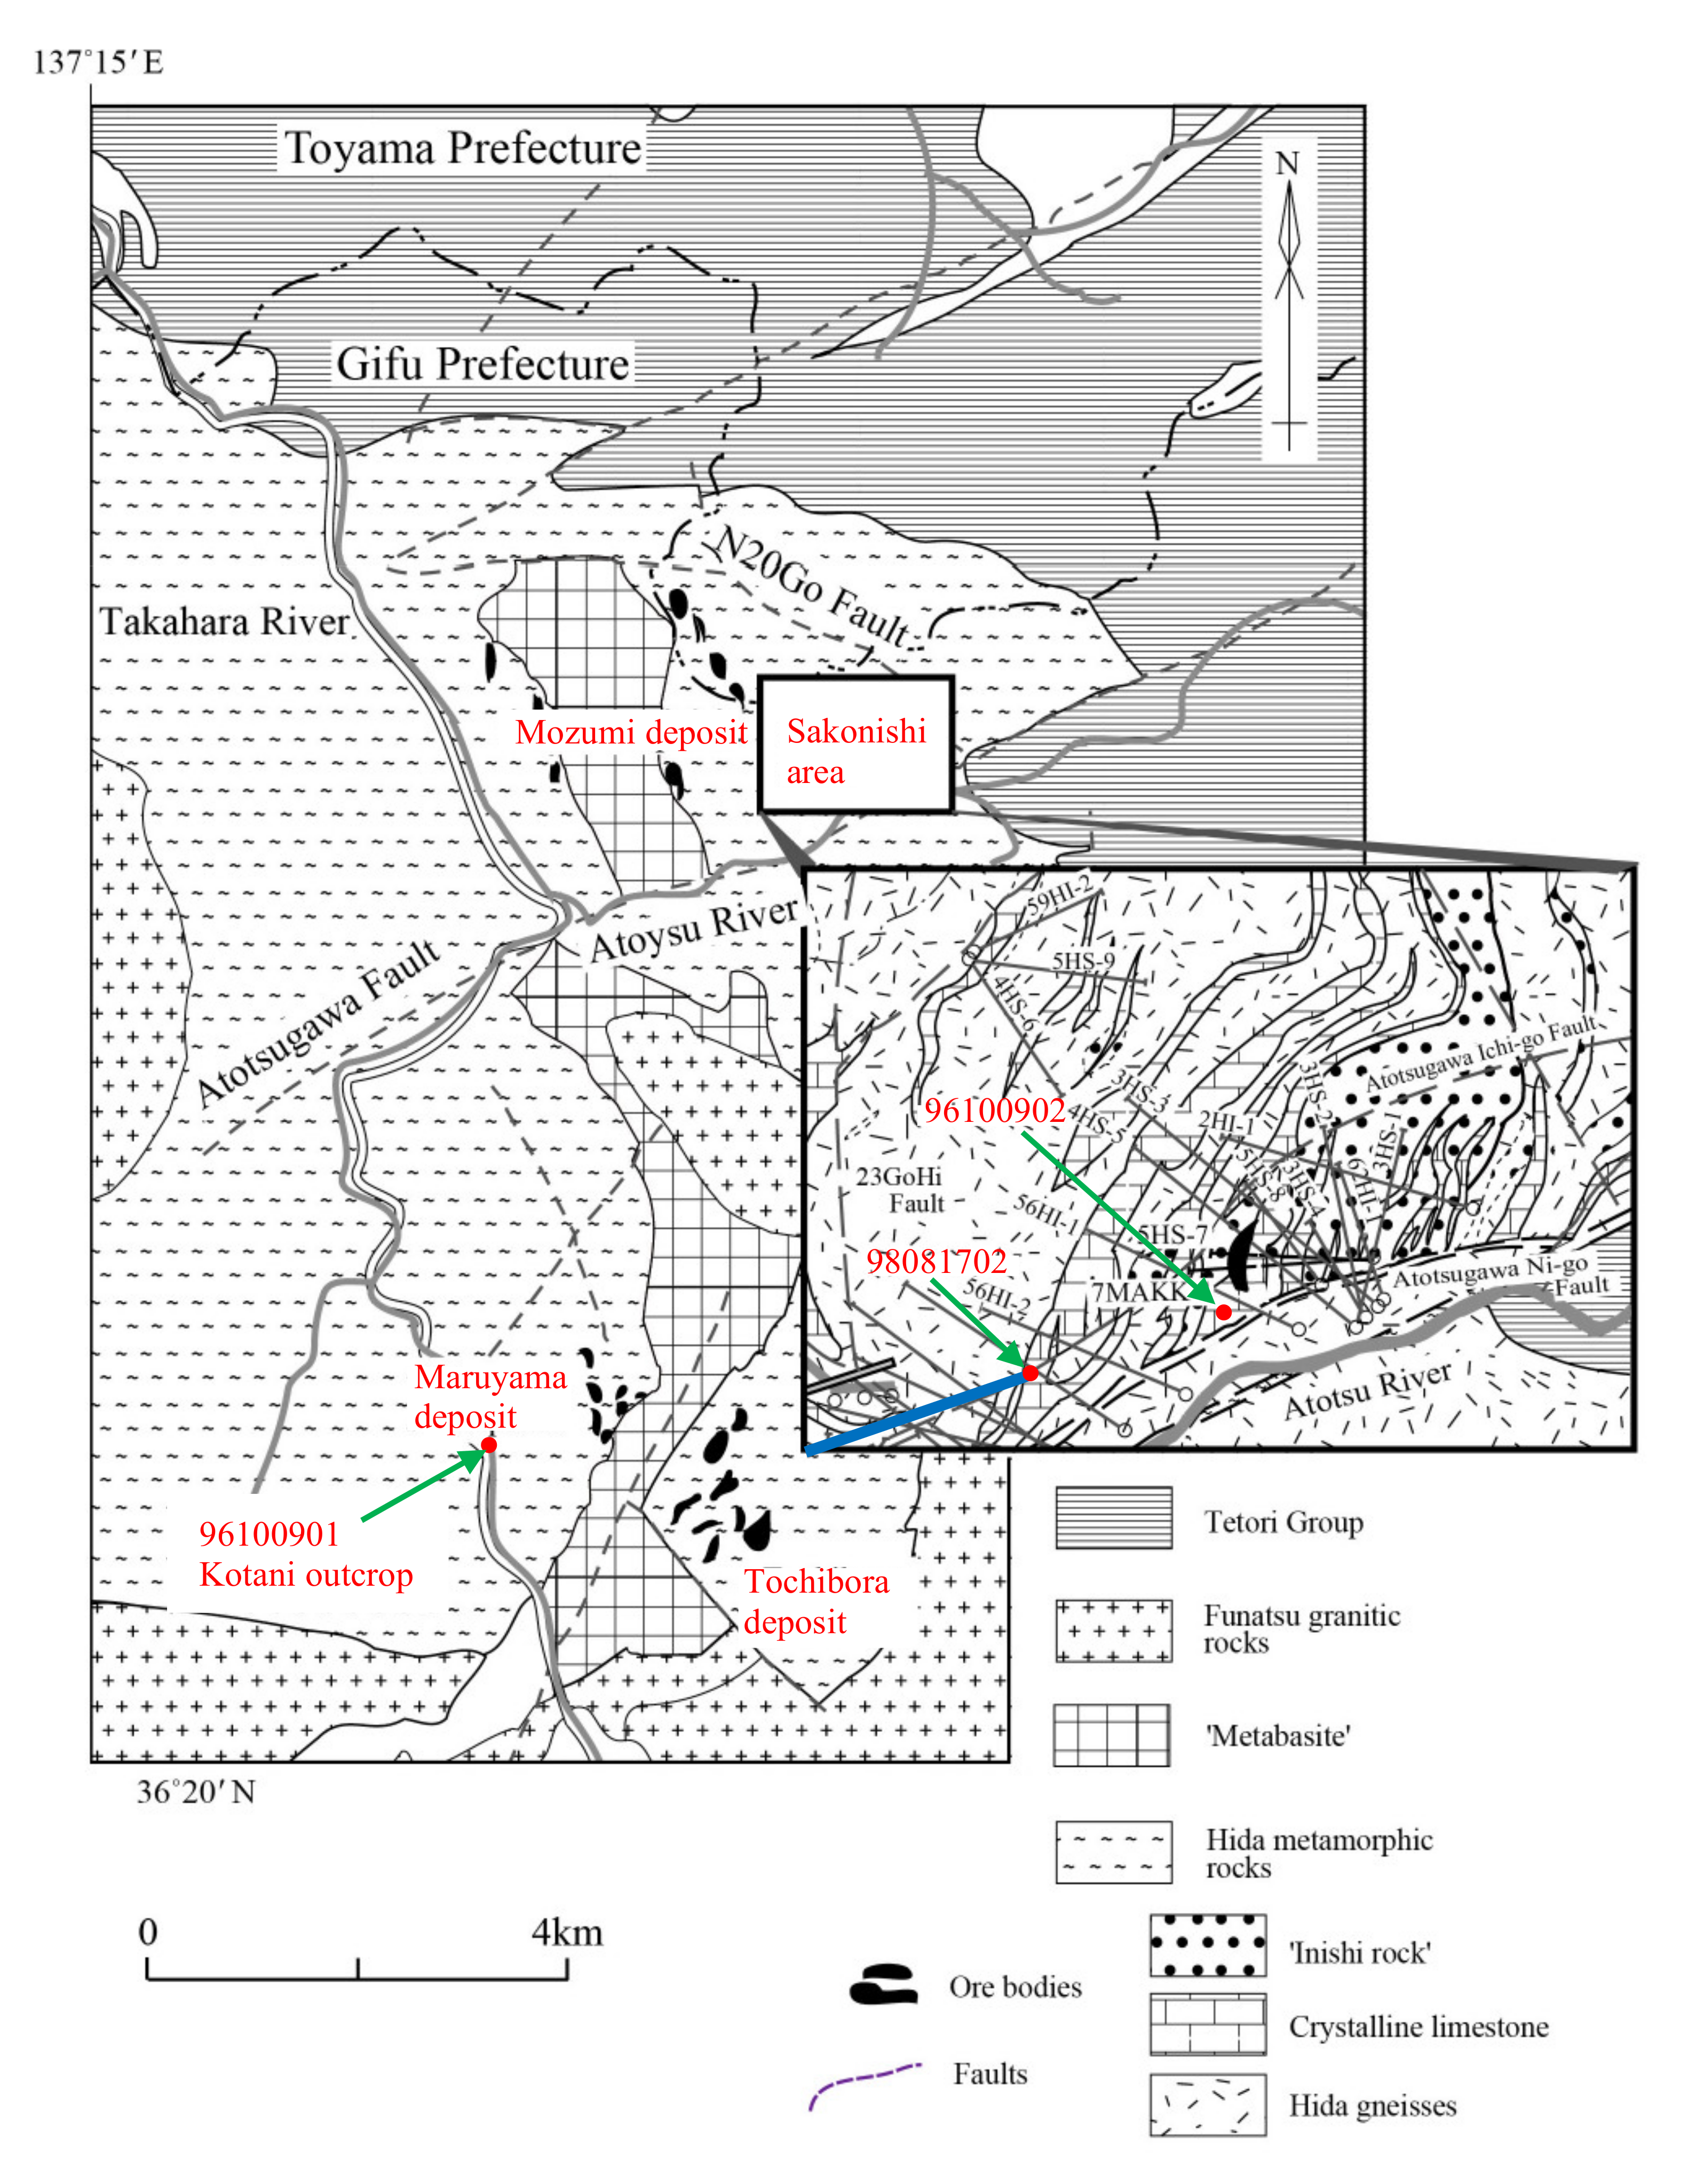
The Kamioka mining district is composed of the Hida metamorphic complex and consists of Hida metamorphic rocks (Hida gneisses, crystalline limestone, and the “Inishi rock”), “metabasite,” Funatsu granitic rocks, and the Tetori Group (Figure 1). The Hida metamorphic rocks and metabasite are the basement rocks that occupy the central part of the area (Figure 1). The Hida gneisses intercalate crystalline limestone (white to whitish gray in color and partly containing graphite) beds of several meters to several hundred meters thick. The locally named Inishi rock is thought to be a migmatite or a kind of skarn [6] and mainly consists of clinopyroxene (diopside–hedenbergite), plagioclase, and microcline with minor amounts of sphene, apatite, and hornblende [6]. The Hida metamorphic rocks are very hard, enabling the mining of ores by the sublevel stoping method. This allowed for the creation of a very large underground space for the Super-Kamiokande detector system. The implementation plan to build a larger Cherenkov detector system containing 261,000 tons of ultrapure water, named the Hyper-Kamiokande, is in progress. The metabasite is a metamorphosed mafic rock that lost its original texture and mineralogy due to complete recrystallization and consists of hornblende and plagioclase with minor amounts of biotite, sphene, and apatite [6]. The Funatsu granitic rocks are distributed in the south part of the basement rocks (Figure 1). A reliable Rb–Sr isochron age of 188.8 ± 4.4 Ma was obtained for 22 samples of the Funatsu granitic rocks [7]. The K–Ar age of hornblende separated from the metabasite is 192.8 ± 6 Ma, representing the time of metabasite reheating by the intrusion of the Funatsu granitic rocks [8]. The upper Jurassic to lower Cretaceous sedimentary rocks of the Tetori Group unconformably overlie the Hida metamorphic rocks. In addition, granitic and quartz porphyry have intruded the Hida metamorphic complex [9]. The Kamioka deposits were formed in crystalline limestone within the Hida metamorphic rocks where the Inishi rock is remarkably distributed [10]. The Inishi rock distribution is limited to the central part, and the Kamioka Pb–Zn ore deposits are closely associated with the Inishi rock [6].
The Kamioka mining district, 12 km in the north–south direction and 3 km in the east–west direction, includes three major ore deposits: the Tochibora, Maruyama, and Mozumi deposits from the south to the north on the eastern side of the Takahara River (Figure 1). Among them, the Tochibora deposit is the largest, and each deposit consists of multiple ore bodies (approximately 50 ore bodies in total). There is a zonal structure centered on the metabasite in the three deposits (Figure 1). The Mozumi deposit is located 8 km north of the Tochibora deposit, and the Sakonishi exploration area has steep Atotsugawa faults (Figure 1). The Tochibora and Maruyama deposits of the Kamioka deposits are crossed by several large faults [11] and igneous dikes [12,13]. Several major fracture systems exist in the Sakonishi area [2,14]. Meanwhile, the Mozumi deposit, which is adjacent to the west of the Sakonishi area, has several fault extensions in the Sakonishi area [15].
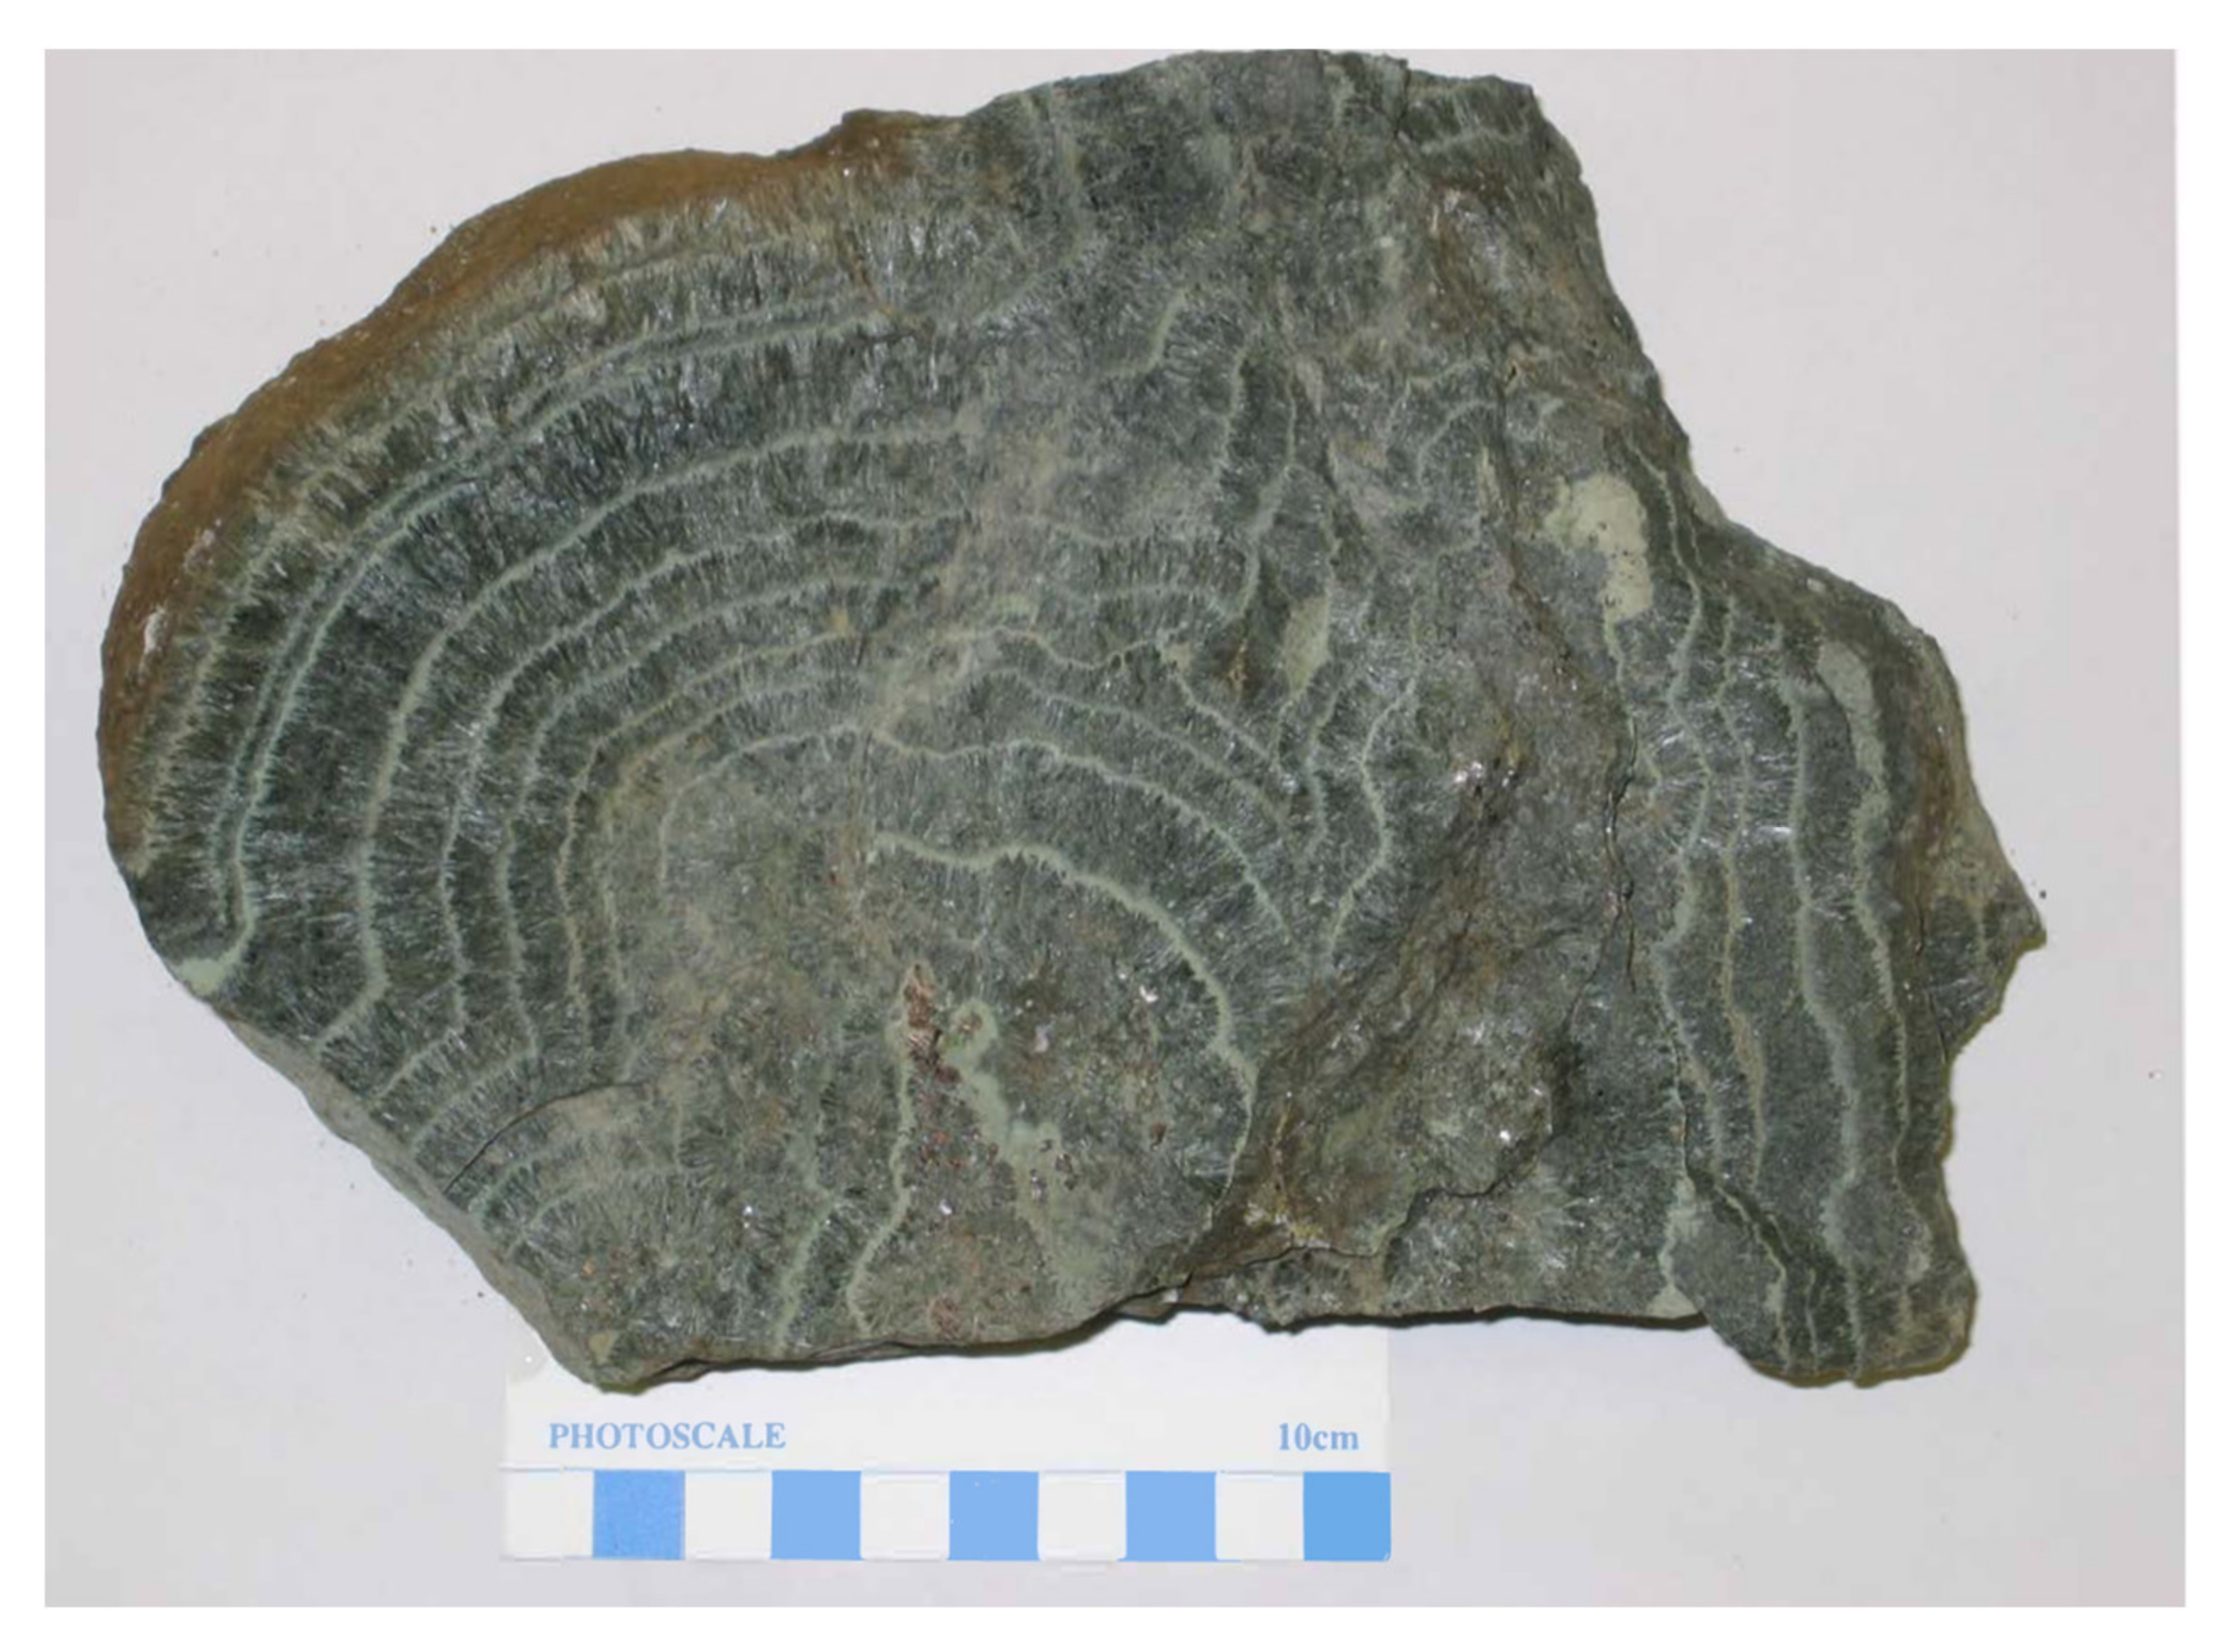
The ores in the Kamioka deposits are classified into four types: the “Mokuji” ore, the “Shiroji” ore, disseminated ore, and silver ore [6]. Sphalerite and galena are also disseminated in the Inishi rock or in the gneiss [12]. The Mokuji (meaning tree rings in Japanese) ore is the most abundant among them and is composed of long prismatic hedenbergite in a radial arrangement, similar to the annual rings of a tree (Figure 2). Sphalerite and galena are disseminated in the hedenbergite (Mokuji ore). The Shiroji (meaning white color in Japanese) ore is irregularly massive, lens or vein in shape. It primarily consists of quartz and calcite with sphalerite and galena as ore minerals. The Shiroji ore is rich in galena, compared with the Mokuji ore, and the Pb–Zn concentration ranges from 10% to 30% [11]. The disseminated and silver ores are less common than the Mokuji and Shiroji ores. The disseminated ore does not appear in crystalline limestone. The silver ore is found in silicification and sericite-altered Inishi rock or gneiss. The main silver minerals are pyrargyrite and argentite [11]. The Inishi rock is mineralized with calcite, quartz, sphalerite, and galena. Five sericite samples from the Shiroji ore and altered Inishi rock yielded a K–Ar age from 67.5 ± 2.0 to 63.8 ± 1.4 Ma [16]. Hastingsite skarn, occurring near the Tochibora deposit, was dated at 63.3 ± 1.6 Ma by the K–Ar method [17]. Dike rocks in the Kamioka mining area were dated from 65 to 55 Ma by the K–Ar method [13]. These data suggest that the Kamioka ore deposits formed from the end of Cretaceous to the beginning of the Paleogene age.
3. Materials and Methods
3.1. Materials
This study used eleven samples from the Tochibora deposit, two samples from the Maruyama deposit, three samples from the Mozumi deposit, and two samples from the Sakonishi area (Table 1). The 96100901 sample is a boulder from the Kotani outcrop in the Maruyama deposit area (Figure 1). The Sakonishi area is an exploration area where the core drilling was performed (Figure 1). Based on a semi-quantitative mineral determination by powder method X-ray diffraction (XRD), the relative abundance of calcite was obtained. In addition, the sample size was adjusted to 0.2 mg of calcite as was contained in the sample for the carbon and oxygen isotope ratio analyses.
3.2. Carbon and Oxygen Isotope Ratio Analyses
The carbon and oxygen isotope ratios of 20 calcite-bearing samples were determined. CO2 was liberated from mixtures of calcite and other silicate minerals by reaction with 100% phosphoric acid at 60 °C [18]. Carbon and oxygen isotope analyses were performed on a Finnigan MAT-250 mass spectrometer (Thermo Finnigan, Bremen, Germany) at Shizuoka University. Isotope ratios are reported in standard δ notation in per mil (‰) relative to the Vienna standard mean ocean water (SMOW) for δ18O and relative to the Vienna Pee Dee Belemnite (PDB) for δ13C. Reproducibility was approximately ±0.1‰ (2σ) for both the δ13CPDB and δ18OSMOW values of calcite. Oxygen isotope ratios were normalized to limestone reference material by using measurements on a laboratory working standard and utilizing the NBS 19 [19].
3.3. Rare Earth Element Analysis
Rare earth element (REE) concentrations in selected four samples were determined by inductively coupled plasma mass spectrometry at ALS, Brisbane, Australia. The sample size for the REE analysis was approximately 1 g each.
4. Results
4.1. Carbon and Oxygen Isotope Ratio Analyses
The δ13CPDB and δ18OSMOW values of calcite from the Tochibora, Maruyama, and Mozumi deposits and from the Sakonishi area are listed in Table 1 and are shown in Figure 3. The δ13CPDB and δ18OSMOW values of ore calcite range from −6.7‰ to −2.5‰ and from +3.5‰ to +9.7‰, respectively. The δ13CPDB value of −4.5‰ and the δ18OSMOW value of +12.7‰ for the boulder sample (96100901; Table 1) are excluded from the range. Ore calcites have relatively low δ13CPDB values, and their δ18OSMOW values scatter in a wide range.
4.2. Rare Earth Element Analysis
The results of the REE analyses in ppm of rock samples from the Kamioka deposits are listed in Table 2. Mokuji and disseminated ore samples are from the Tochibora deposit, and an Inishi ore and a crystalline limestone samples are from the Mozumi deposit. The descriptions of the samples are shown in Table 1.
5. Discussion
5.1. Carbon and Oxygen Isotope Ratios of the Barren Crystalline Limestone
Barren crystalline limestones that were not affected by the ore mineralization are found at the Sommbo-dani and Kirimo-dani areas, several kilometers away from the deposits [2]. The δ13C and δ18O values of the barren crystalline limestone from these areas range from +2‰ to +4‰ and from +22‰ to +23‰, respectively [2]. Although the sedimentation age of the initial limestone of the crystalline limestone is not accurately known, it is believed to be between the Silurian and Permian ages (e.g., [4]). The ranges of the δ13C and δ18O values of the marine carbonates at the sedimentation age are from 0‰ to +6‰ and from +23‰ to +28‰, respectively [20]. As limestone in the Hida belt underwent metamorphism, it became crystalline. During metamorphic crystallization, the δ18O value (ranging from +22‰ to +23‰) of the barren crystalline limestone may have slightly decreased, whereas the δ13C value (ranging from +2‰ to +4‰) may have remained the same.
5.2. Carbon and Oxygen Isotope Ratios of Calcite from the Kamioka Mining District
Although the δ18O values of ore minerals in magmatic hydrothermal skarn deposits may be similar to those of magmatic water (+5.5‰ to +9.0‰; [21]) at high temperatures, the δ18O value of garnet in Mengku skarn-type iron deposits in China [22] is as low as +1‰. This is inconsistent with a magmatic origin, suggesting instead a shear-zone induced hydrothermal system with meteoric water [22]. Even if there was early-stage magmatic fluid for the Takatori hypothermal tungsten–quartz vein deposit in Japan, the δ18O value of the fluid decreased with decreasing temperature because the fluid was mixed with meteoric water [23].
All of the δ13C and δ18O values of the calcite analyzed in this study (Figure 3) are far from those of the barren crystalline limestone (the δ13C values range from +2‰ to +4‰ and the δ18O values range from +22‰ to +23‰). The δ13C and δ18O values of calcite from crystalline limestones are considered first. Assuming that the isotope values of the barren crystalline limestone correspond to the initial δ13C and δ18O values of the crystalline limestone before the ore mineralization, the δ18O values of the 83111605b and 83111607 crystalline limestones significantly decreased during the mineralization (Table 1, Figure 3). Both the δ13C and δ18O values decreased in the 83111506b crystalline limestone. The same is seen for the 83111506a crystalline limestone, but the changes were small.
It is likely that an important source of carbon in the Kamioka deposits was the carbon that remained after the decarbonation of the crystalline limestone [24]. Shimazaki and Kusakabe [4] analyzed δ18O values for igneous and metamorphic rocks. The δ18O values of fluid in equilibrium with the clinopyroxene skarn in the Kamioka deposits were estimated to range from −5‰ to +3‰ at a temperature of 500 °C. Shimazaki and Kusakabe [5] also analyzed the deuterium/hydrogen ratios of the sericites from the deposits, and the δD values ranged from −100‰ to −120‰. They suggested that the deposits were formed by a huge convective circulation of fluids that were meteoric in origin and driven by a hidden batholithic intrusion during the late Cretaceous. Sakurai and Shimazaki [1], Hirokawa et al. [14], and Naito et al. [25] explored the Sakonishi area (southeast of the Mozumi deposit) where blind ore was found. Following the finding, Morishita [2] displayed a three-dimensional distribution of carbon and oxygen isotope ratios of calcite both from the surface and from the drill holes in the Sakonishi area. The results revealed that the depleted zone’s δ13C and δ18O values may correspond to the conduit of the hydrothermal fluids.
Since the carbon isotope fractionation factor between calcite and H2CO3 (app) (= H2CO3 + CO2 (aq)) is small at hydrothermal temperatures [26], and assuming that the carbon isotope ratio of the fluid was negative, the δ13C value of the barren crystalline limestone decreased during the reaction with hydrothermal fluid. When the δ13C and δ18O values of a hydrothermal fluid and dissolved carbon species remain unchanged, the δ18O value of the precipitating calcite depends on its formation temperature (e.g., [27]). It is suggested that the δ18O values of calcite may have decreased as the hydrothermal fluid activities increased (higher temperatures or higher fluid–rock ratios, [2,4]). Morishita [2] focused on the activity of hydrothermal fluids for mineralization in the Sakonishi area that neighbors the Mozumi deposits in the Kamioka district (Figure 1). Since the δ13C and δ18O values of crystalline limestone in the ore mineralization zone of the Sakonishi area are lower than those of the barren crystalline limestone, the ore bodies may have formed by prominent hydrothermal activity [2]. Therefore, the δ13C and δ18O values of crystalline limestone can be used as an indicator of the related hydrothermal activity [2].
5.3. Origin of Calcite in the Sakonishi Area
Figure 4 shows the δ13C and δ18O values of crystalline limestone and disseminated calcite from the drill holes 4MAHS-5 and 4MAHS-6 in the Sakonishi area (Figure 1). Figure 4 also shows the range (the δ13C values range from +2‰ to +4‰ and the δ18O values range from +22‰ to +23‰) of the carbon and oxygen isotope ratios of barren crystalline limestone. The samples are divided into crystalline limestones and disseminated vein-shaped calcites by the naked eye [2]. The δ13C and δ18O values of crystalline limestone may decrease from the initial values under the influence of hydrothermal fluids. Although there is a weak positive correlation between the δ13C and δ18O values, they scatter in a wide range (Figure 4). Therefore, the δ13C and δ18O values may change from the initial values of crystalline limestone in different ways during the mineralization. This implies that the δ13C value of crystalline limestone does not change in conjunction with the δ18O value, and this suggests that each isotope change mechanism is different [2]. The δ13C values of the disseminated calcites form a narrow range (from −8‰ to −4‰), and Morishita [2] estimated that the δ13C value of the Sakonishi hydrothermal fluid was similar to that of the earth crustal mean (approximately −7‰; e.g., [28]) instead of to that of limestone [20]. The δ18O values of disseminated calcites spread in a large range (Figure 4) because they likely depend on the formation temperature. Therefore, disseminated calcites are considered to crystallize from hydrothermal fluids, whereas crystalline limestones are considered to be affected by carbon and oxygen isotope exchanges with hydrothermal fluids under various degrees of fluid–rock ratios and temperatures.
5.4. Characteristics of Carbon and Oxygen Isotope Ratios of the Kamioka Deposits
Figure 5 superimposes Figure 3 on Figure 4. The 83111507, 83111508, 83111509, 95072706, and 96100902 samples from the disseminated ores plot within the range of disseminated calcites from the Sakonishi area (Table 1; Figure 5). The difference in the δ18O values likely depends on the formation temperature of calcite. Since the 83111509 sample is from a clay zone of the disseminated ores (Table 1), the relatively high δ18O value may be a result of the relatively low forming temperature. The 83111503 sample from the mineralized Inishi rock (calcite, quartz, sphalerite, and galena were added) is also in the range.
The 83111500 and 96100905 samples (Mokuji) plot within the disseminated calcite range in Figure 5. The 83111522 sample from a Mokuji druse has a relatively high δ18O value. The 96100901 sample (Shiroji), collected from the Kotani outcrop (Figure 1) along the Takahara River outside the mine, also has a high δ18O value. The 95072806 and 98081702 samples (disseminated type) have relatively high δ13C values; however, they are in the range of previously determined disseminated calcites [2] from the Sakonishi area (Figure 5). The 96100902 sample from the Sakonishi area has a lower δ18O value than the 98081702 sample from the same area, suggesting that the 96100902 sample was affected by more intense hydrothermal activity. Since a conduit of the hydrothermal fluid was assumed to be near the locality of the 96100902 sample, the hydrothermal activity may have been intense [2]. No clear differences in isotope data are observed among the three ore deposits and the sample from the Sakonishi area.
In addition, crystalline limestone samples were also analyzed. The δ13C and δ18O values of the 83111514a sample are almost the same as those of the barren crystalline limestone, whereas those of the 83111514b sample, which is taken from the same hand specimen as that of the 83111514a sample, are slightly lower (Figure 5). Both samples look fresh; however, the graphite concentration is different (Table 1). The δ13C values of the 83111605b and 83111607 samples did not change according to the value of the original barren crystalline limestone. However, the δ18O values significantly decreased to a value similar to the disseminated type ores because both the crystalline limestones exist proximal to the ore bodies (Table 1). Therefore, they may have been subjected to similar hydrothermal fluids. The 83111515 sample also has the same δ13C value as the barren crystalline limestone, and the decrease in the δ18O value is small. The 83111506a and 83111506b samples have different δ13C and δ18O values (Figure 5). The crystalline limestones are not homogeneous in the Kamioka deposits. Active hydrothermal fluids can affect the 83111506b crystalline limestone significantly as compared to 83111506a. The δ13C and δ18O values can decrease through various mechanisms interacting with hydrothermal activities. Meanwhile, the δ13C and δ18O values of the other samples scatter in the range of barren, 83111605b, and 83111506b crystalline limestones, and they are within the range of crystalline limestones in the Sakonishi area (Figure 5).
5.5. REE Geochemistry of the Kamioka Deposits
The REE concentrations (Table 2) indicate the environment of the deposit formation. The REE contents in CI chondrite are taken from McDonough and Sun [29] to plot the REE patterns. Chondrite-normalized REE patterns for the Kamioka ores and the crystalline limestone display light REE-rich patterns (Figure 6). The REE pattern for the 83111508 sample (disseminated ore) shows a positive Eu anomaly (Figure 6). The presence of a positive Eu anomaly is generally interpreted as a divalent Eu in the fluid that has incorporated into the Ca2+ site of calcite under a reducing environment. This incorporation increases the total amount of Eu (Eu2+ + Eu3+). The 83111508 sample contains graphite in addition to calcite (Table 1), indicating a reducing environment during the ore formation.
The REE pattern for the 83111605a sample (mineralized Inishi rock), from the same hand specimen as the 83111605b sample, shows a negative Eu anomaly (Figure 6). The REE concentrations and the pattern of the 83111605a sample are similar to those for the Inishi rock in the Mozumi deposit [30]. The REE pattern for the 83111607 sample (crystalline limestone) shows a negative Eu anomaly (Figure 6). This is consistent with those for most marine carbonates and the crystalline limestones from the Kamioka deposits [30]. The REE pattern for the 83111500 sample (Mokuji) shows a negative Eu anomaly. Figure 6 shows that the shape and REE concentrations are very similar to those for the 83111607 sample (crystalline limestone). The original rock of the Mokuji is a crystalline limestone, and the REE characteristics of crystalline limestone may remain unchanged after the Mokuji formation by skarnization. Kato [30] concluded that the REE concentrations do not change when epidote skarn was formed from the Inishi rock in the Kamioka deposits, and this suggests that skarnization does not change the REE characteristics. The 83111508 (disseminated ore in Inishi rock) and 83111605a (mineralized Inishi rock) samples contain REEs one order of magnitude higher than the 83111500 (Mokuji) and 83111607 (crystalline limestone) samples. Considering the previous work [30] and this study, the REE patterns and rock concentrations from the Kamioka skarn-type ore deposits can reflect the types of original rocks and hydrothermal activities.
5.6. Concluding Remarks: Genesis of the Ore-Forming Fluid at the Kamioka Deposits
The minimum δ18O values of the calcite from the Kamioka deposits and the Sakonishi area are approximately +4‰ and −1‰, respectively (Figure 5). These calcites are formed through reactions with ore-forming hydrothermal fluids and through direct precipitation from the fluids. The δ18O value of the fluid that precipitates calcite is calculated from the oxygen isotope fractionation between the calcite and the fluid at the formation temperature by using the calibration curve from O’Neil et al. [27]. Although the formation temperature of calcite is not accurately known, the fractionation factor is approximately 1.0018 at maximum mineralization temperature of 500 °C [4]. If the δ18O value of calcite is in the range −1‰–+4‰ and the maximum formation temperature is 500 °C, the estimated δ18O value of the fluids responsible for the mineralization of the deposits ranges from −3‰ to +2‰. Assuming that the δ18O values of the fluids are the same, if the ore calcite having a minimum δ18O value of +3.7‰ is precipitated at the maximum temperature of 500 °C, the ore calcite that has a maximum δ18O value of +9.7‰ can precipitate at 240 °C, as estimated using the calibration curve from O’Neil et al. [27]. Thus, an approximate range of temperatures for hydrothermal fluids might be 500 °C–240 °C. Shimazaki and Kusakabe [4] analyzed clinopyroxene and quartz from the Kamioka deposits for δ18O values and obtained that δ18O values of the fluids lie in the range −4‰–+3‰. These δ18O values (from this study and [4]) are lower than those of magmatic fluids. The skarnization-related and ore-forming fluids are mostly meteoric in origin, confirming the conclusions of Wada [24] and Shimazaki and Kusakabe [4,5].
Ore mineralization through hydrothermal activity was controlled using a fracture system in the Sakonishi area of the Kamioka district [2,14]. The δ13C and δ18O values of most crystalline limestones in the Kamioka mining district are lower than those of barren crystalline limestones outside of the district. The low δ13C and δ18O values are considered to have formed through prominent hydrothermal activities. Thus the δ13C and δ18O values of crystalline limestone in the Kamioka deposits can be used as an indicator of the influence of hydrothermal fluids on the ore mineralization. Meteoric water was efficiently transported downward along faults at shear zones in the Mengku skarn-type iron deposit in China [22]. There are several fracture systems in the Kamioka district. The Mozumi deposit, adjacent to the west of the Sakonishi area, has several fault extensions in the Sakonishi area [15]. The fault extensions are considered the main conduits for the hydrothermal fluid flow in the Mozumi deposit [25]. The Tochibora and Maruyama deposits of the Kamioka deposits have several large faults [11] and igneous dikes [12,13] that may be the main conduits for hydrothermal fluids in the Kamioka deposits.
Author Contributions
Conceptualization, Y.M.; methodology, Y.M. and A.W.; formal analysis, Y.M. and A.W.; investigation, Y.M. and A.W.; resources, Y.M. and A.W.; writing—original draft preparation, A.W. and Y.M.; writing—review and editing, Y.M.; funding acquisition, Y.M. All authors have read and agreed to the published version of the manuscript.
Funding
This research was funded by the Japan Society for the Promotion of Science (JSPS) Kakenhi grant number 18K03758.
Data Availability Statement
Data are contained within the article.
Acknowledgments
We are grateful to the geologists at the Kamioka mine for their courtesy during the underground survey. We thank the Japan Oil, Gas and Metals National Corporation (formerly the Metal Mining Agency of Japan) for providing access to the drill hole samples. Yoriko Yabe is thanked for help with isotope analyses. Two anonymous reviewers have improved the readability of our manuscript.
Conflicts of Interest
The authors declare no conflict of interest.
References
- Sakurai, W.; Shimazaki, H. Exploration of blind skarn deposits based on the mineralization model of the Kamioka mine, Gifu prefecture, central Japan. Resour. Geol. 1993, 16, 141–150. [Google Scholar]
- Morishita, Y. Three-dimensional isotopic characteristics of crystalline limestone around the Sakonishi Zn ore bodies in the Kamioka mining district, Japan. Resour. Geol. 1999, 49, 243–257. [Google Scholar] [CrossRef]
- Shieh, Y.N.; Taylor, H.P., Jr. Oxygen and carbon isotope studies of contact metamorphism in of carbonate rocks. J. Petrol. 1969, 10, 307–331. [Google Scholar] [CrossRef]
- Shimazaki, H.; Kusakabe, M. Oxygen isotope study of the Kamioka Zn-Pb skarn deposits, central Japan. Miner. Depos. 1990, 25, 221–229. [Google Scholar] [CrossRef]
- Shimazaki, H.; Kusakabe, M. D/H ratios of sericites from the Kamioka mining area. Mining Geol. 1990, 40, 385–388. [Google Scholar]
- Akiyama, S. Geologic structure of the Hida metamorphic belt and mineralization of the Kamioka-type ore deposits—Studies on regional geology and mineralization in the Kamioka district, No. 1. Mining Geol. 1980, 30, 345–362, (In Japanese with English abstract). [Google Scholar]
- Shibata, K.; Nozawa, T. Isotopic ages of the Funatsu granitic rocks. J. Jpn. Assoc. Mineral. Petrol. Econ. Geol. 1984, 79, 289–298, (In Japanese with English abstract). [Google Scholar] [CrossRef]
- Kano, T.; Shibata, K.; Terayama, S. K-Ar age of hornblende from a dioritic rock in the Tochibora ore deposit of the Kamioka mine in the Hida metamorphic region, central Japan. Mining Geol. 1989, 39, 283–288, (In Japanese with English abstract). [Google Scholar]
- Nitta, T.; Akiyama, S. Silver mineralization in the Kamioka mine. Mining Geol. 1981, 10, 175–192, (In Japanese with English abstract). [Google Scholar]
- Sohma, T.; Akiyama, S. Geological structure lithofacies in the central part of the Hida metamorphic belt. J. Geol. Soc. Jpn. 1984, 90, 609–628, (In Japanese with English abstract). [Google Scholar] [CrossRef] [Green Version]
- Akiyama, S. Recent information about the mineralization in the Kamioka mining area—Studies on regional geology and mineralization in the Kamioka district, No. 2. Mining Geol. 1981, 31, 157–168, (In Japanese with English abstract). [Google Scholar]
- Machida, M.; Otsubo, T.; Furuyado, A. Disseminated type mineralization in the Tochibora ore deposits, Kamioka mine, Gifu prefecture, Japan. Mining Geol. 1987, 37, 119–131, (In Japanese with English abstract). [Google Scholar]
- Sakurai, W.; Shiokawa, S. K-Ar Ages of the dike rocks in the Kamioka Pb-Zn skarn deposits in the Hida terrain, Japan. Resour. Geol. 1993, 43, 311–319, (In Japanese with English abstract). [Google Scholar]
- Hirokawa, M.; Hayashi, K.; Machida, M. On the exploration of the Sakonishi district in the Kamioka mining area, Gifu Prefecture. Resour. Geol. 1995, 45, 157–168, (In Japanese with English abstract). [Google Scholar]
- Nitta, T.; Fukahori, Y.; Mishima, H. On the successful exploration at the lower part of the Mozumi mining area, the Kamioka mines (No. 2). Mining Geol. 1971, 21, 84–96, (In Japanese with English abstract). [Google Scholar]
- Nagasawa, K.; Shibata, K. K-Ar ages of sericites from the Kamioka mine and its significance in geochronology of the Kamioka deposits. Mining Geol. 1985, 35, 57–65, (In Japanese with English abstract). [Google Scholar]
- Sato, K.; Uchiumi, S. K-Ar ages and mineralization of the Kamioka Pb-Zn skarn deposits in the Hida terrain, Japan. Mining Geol. 1990, 40, 389–396, (In Japanese with English abstract). [Google Scholar]
- Wada, H.; Niitsuma, N.; Saito, T. Carbon and oxygen isotopic measurements of ultra-small samples. Geosci. Rep. Shizuoka Univ. 1982, 7, 35–50, (In Japanese with English abstract). [Google Scholar]
- Morishita, Y.; Matsuhisa, Y. Measurement of carbon and oxygen isotope ratios of carbonate reference samples. Bull. Geol. Surv. Jpn. 1984, 35, 69–79, (In Japanese with English abstract). [Google Scholar]
- Veizer, J.; Ala, D.; Azmy, K.; Bruckschen, P.; Buhl, D.; Bruhn, F.; Carden, G.A.F.; Diener, A.; Ebneth, S.; Godderis, Y.; et al. 87Sr/86Sr, δ13C and δ18O evolution of Phanerozoic seawater. Chem. Geol. 1999, 161, 59–88. [Google Scholar] [CrossRef] [Green Version]
- Taylor, H.P., Jr. Oxygen and hydrogen isotope relationship in hydrothermal mineral deposits. In Geochemistry of Hydrothermalore Deposits, 3rd ed.; Barnes, H.L., Ed.; John Wiley & Sons, Inc.: New York, NY, USA, 1997; pp. 229–302. [Google Scholar]
- Zang, Z.; Dong, L.; Liu, W.; Zhao, H.; Wang, X.; Cai, K.; Wan, B. Garnet U-Pb and O isotopic determinations reveal a shear-zone induced hydrothermal system. Sci. Rep. 2019, 9, 10382. [Google Scholar] [CrossRef]
- Morishita, Y.; Nishio, Y. Ore genesis of the Takatori tungsten–quartz vein deposit, Japan: Chemical and isotopic evidence. Minerals 2021, 11, 765. [Google Scholar] [CrossRef]
- Wada, H. Carbon isotopic study on graphite and carbonate in the Kamioka mining district, Gifu prefecture, central Japan, in relation to the role of graphite in the pyrometasomatic ore deposition. Miner. Depos. 1978, 13, 201–220. [Google Scholar] [CrossRef]
- Naito, K.; Fukahori, Y.; Peiming, H.; Sakurai, W.; Shimazaki, H.; Matsuhisa, Y. Oxygen and carbon isotope zonations of wall rocks around the Kamioka Pb-Zn skarn deposits, central Japan: Application to prospecting. J. Geochem. Explor. 1995, 54, 199–211. [Google Scholar] [CrossRef]
- Bottinga, Y. Calculation of fractionation factors for carbon and oxygen isotopic exchange in the system calcite-carbon dioxide-water. J. Phys. Chem. 1968, 72, 800–808. [Google Scholar] [CrossRef]
- O’Neil, J.R.; Clayton, R.N.; Mayeda, T.K. Oxygen isotope fractionation in divalent metal carbonates. J. Chem. Phys. 1969, 51, 5547–5558. [Google Scholar] [CrossRef]
- Fuex, A.N.; Baker, D.R. Stable carbon isotopes in selected granitic, mafic, and ultramafic igneous rocks. Geochim. Cosmochim. Acta 1973, 37, 2509–2521. [Google Scholar] [CrossRef]
- McDonough, W.F.; Sun, S.S. The composition of the Earth. Chem. Geol. 1995, 120, 223–253. [Google Scholar] [CrossRef]
- Kato, Y. Rare Earth Elements as an Indicator to Origins of Skarn Deposits: Examples of the Kamioka Zn-Pb and Yoshiwara-Sannotake Cu (-Fe) Deposits in Japan. Resour. Geol. 1999, 49, 183–198. [Google Scholar] [CrossRef]
Figure 1.
Geological map of the Kamioka mining district in the Hida metamorphic terrain (modified from [2]: Reproduced with permission from Resource Geology; published by the Society of Resource Geology). The localities of the major deposits (the Tochibora, Mozumi, and Maruyama deposits) and the Sakonishi area are shown. The localities of 96100901 (Kotani outcrop) and the Sakonishi samples (96100902 and 98081702) are shown. Drill holes in the Sakonishi area are shown in the rectangular insertion, and the drill hole collars are indicated with circles. The exploration adit in blue is at −500 mL (350 m above sea level).

Figure 2.
A typical Mokuji ore (hedenbergite with sphalerite and galena) from Maebira, −315 mL, 5 Otsu-3 of the Tochibora deposit.
Figure 2.
A typical Mokuji ore (hedenbergite with sphalerite and galena) from Maebira, −315 mL, 5 Otsu-3 of the Tochibora deposit.

Figure 3.
The δ13C and δ18O values of calcite from the Tochibora, Maruyama, and Mozumi deposits and from the Sakonishi area in the Kamioka mining district (Table 1).
Figure 3.
The δ13C and δ18O values of calcite from the Tochibora, Maruyama, and Mozumi deposits and from the Sakonishi area in the Kamioka mining district (Table 1).

Figure 4.
The δ13C and δ18O values of crystalline limestone and disseminated fissure-filling calcite from drill holes 4MAHS-5 and 4MAHS-6 in the Sakonishi area (the isotope data are from [2]). The square box in blue indicates the range of the δ13C and δ18O values of barren crystalline limestone from the Sommbo-dani and Kirimo-dani areas [2]. It is assumed that the range of the square box indicates the isotope ratios of crystalline limestone that underwent the Hida metamorphism but not ore mineralization.

Figure 5.
The δ13C and δ18O values of the calcite obtained in this study are superimposed on Figure 4. Crystalline limestone *1 and disseminated *1 calcites (both are represented by open symbols) are from the Sakonishi area [2]. Kamioka ore *2 and the crystalline limestone *3 samples are from the Tochibora, Maruyama, or Mozumi deposits, and the Sakonishi *4 samples are from the Sakonishi area. The square box indicates the range of the δ13C and δ18O values of the barren crystalline limestone. Note that the sample numbers in the figure are for crystalline limestone *3 samples and all solid symbols represent new data obtained in this study.

Figure 6.
Chondrite-normalized REE patterns for the Kamioka ores and a crystalline limestone (Table 2). The REE concentrations in CI chondrite are taken from [29]. Note that the REE pattern for sample 83111500 (Mokuji) is similar to that for sample 83111607 (crystalline limestone). The REE contents of sample 83111605a (mineralized Inishi rock) and sample 83111508 (disseminated ore) are one order of magnitude higher than those of sample 83111500 (Mokuji) and sample 83111607 (crystalline limestone).


Table 1.
Descriptions and isotope data of various rocks from the Kamioka mining district.
| Sample No. | Deposit | Locality | Rock Type | δ13CPDB (‰) | δ18OSMOW (‰) | Mineral Paragenesis *1/Note |
|---|---|---|---|---|---|---|
| 83111500 | Tochibora | Maebira −250 mL *2 | “Mokuji” | −5.0 | 3.7 | Hedenbergite–sphalerite–galena–quartz–calcite/next to crystalline limestone |
| 83111503 | Tochibora | Maebira −250 mL | Mineralized “Inishi rock” | −6.7 | 4.3 | Calcite–quartz–sphalerite–galena/right next to “Mokuji” |
| 83111506a *3 | Tochibora | Maebira −250 mL | Crystalline limestone | 0.9 | 14.0 | Calcite/grayish white |
| 83111506b *3 | Tochibora | Maebira −250 mL | Crystalline limestone | −2.2 | 5.1 | Calcite/white |
| 83111507 | Tochibora | Maebira −250 mL, Shin-No.2 | Disseminated | −5.5 | 6.0 | Calcite–quartz–sphalerite in ‘Inishi rock’ |
| 83111508 | Tochibora | Maebira −250 mL, Shin-No.2 | Disseminated | −5.9 | 5.0 | Calcite–sphalerite–graphite in ‘Inishi rock’ |
| 83111509 | Tochibora | Maebira −250 mL, Shin-No.2 | Disseminated | −5.7 | 8.2 | Calcite–sphalerite–quartz in clay zone of ‘Inishi rock’ |
| 83111514a *3 | Tochibora | Maebira −330 mL, No.10 | Crystalline limestone | 3.9 | 20.4 | Calcite with graphite/grayish white |
| 83111514b *3 | Tochibora | Maebira −330 mL, No.10 | Crystalline limestone | 1.5 | 17.3 | Calcite with a small amount of graphite/grayish white |
| 83111515 | Tochibora | Maebira −300 mL, No.9 | Crystalline limestone | 3.4 | 13.7 | Calcite with a small amount of graphite/grayish white |
| 83111522 | Tochibora | Maebira −315 mL, 5 Otsu-3 | “Mokuji” | −4.9 | 9.7 | Hedenbergite–sphalerite–galena–crystalline calcite–quartz in a druce |
| 83111605a *3 | Mozumi | −500 mL, East No.5 | Mineralized “Inishi rock” | - | - | Calcite–quartz–sphalerite–galena/right next to crystalline limestone |
| 83111605b *3 | Mozumi | −500 mL, East No.5 | Crystalline limestone | 2.4 | 4.2 | Calcite/grayish white, right next to “Inishi rock” |
| 83111607 | Mozumi | −500 mL, East No.5 | Crystalline limestone | 2.4 | 4.8 | Calcite/ grayish white, right next to “Mokuji” ore |
| 83111609 | Mozumi | −500 mL, East No.5 | Crystalline limestone | 0.5 | 9.7 | Calcite/grayish white |
| 95072706 | Tochibora | −320 mL, 9-ban 31st ore body | Ag-rich disseminated | −5.2 | 4.2 | Calcite–quartz–graphite |
| 95072806 | Maruyama | −240 mL, 5 Otsu | Disseminated | −2.5 | 8.8 | Sphalerite–quartz–calcite |
| 96100901 | Maruyama | Kotani outcrop | “Shiroji” | −4.5 | 12.7 | Quartz–calcite–galena–sphalerite/boulder |
| 96100902 | Sakonishi | Underground tunnel for exploration | Disseminated | −4.4 | 3.5 | Sphalerite–galena–pyrite–calcite |
| 96100905 | Tochibora | Maebira outcrop 280 mL | “Mokuji” | −5.3 | 7.0 | Hedenbergite–sphalerite–galena–calcite |
| 98081702 | Sakonishi | 9MAHSU-2 drill core 257.2 m | Disseminated | −3.0 | 5.7 | Sphalerite–galena–calcite (Zn-rich) |
*1: Mineral paragenesis was determined by XRD analysis and naked eye observation. *2: The mL is the adit name indicating the altitude. The altitude of the main adit (0 mL) is 850 m above sea level. *3: The samples with branch numbers of a and b are obtained from the same specimen.
Table 2.
REE concentrations in the Kamioka ores and a crystalline limestone in ppm.
| Sample No. | La | Ce | Pr | Nd | Sm | Eu | Gd | Tb | Dy | Ho | Er | Tm | Yb | Lu |
|---|---|---|---|---|---|---|---|---|---|---|---|---|---|---|
| 83111500 | 1.60 | 3.51 | 0.45 | 1.60 | 0.28 | 0.05 | 0.23 | 0.04 | 0.23 | 0.05 | 0.13 | 0.02 | 0.19 | 0.04 |
| 83111508 | 7.60 | 11.75 | 1.67 | 6.90 | 1.75 | 1.96 | 1.98 | 0.32 | 2.04 | 0.40 | 1.12 | 0.15 | 0.82 | 0.11 |
| 83111605a | 12.70 | 29.60 | 4.14 | 16.30 | 3.00 | 0.48 | 1.84 | 0.26 | 1.54 | 0.28 | 0.83 | 0.11 | 0.63 | 0.09 |
| 83111607 | 3.10 | 3.63 | 0.50 | 1.90 | 0.31 | 0.07 | 0.26 | 0.03 | 0.21 | 0.05 | 0.17 | 0.03 | 0.23 | 0.04 |
Publisher’s Note: MDPI stays neutral with regard to jurisdictional claims in published maps and institutional affiliations. |
© 2021 by the authors. Licensee MDPI, Basel, Switzerland. This article is an open access article distributed under the terms and conditions of the Creative Commons Attribution (CC BY) license (https://creativecommons.org/licenses/by/4.0/).
Share and Cite
MDPI and ACS Style
Morishita, Y.; Wada, A. Role of Hydrothermal Fluids in the Formation of the Kamioka Skarn-Type Pb–Zn Deposits, Japan. Geosciences 2021, 11, 447. https://0-doi-org.brum.beds.ac.uk/10.3390/geosciences11110447
AMA Style
Morishita Y, Wada A. Role of Hydrothermal Fluids in the Formation of the Kamioka Skarn-Type Pb–Zn Deposits, Japan. Geosciences. 2021; 11(11):447. https://0-doi-org.brum.beds.ac.uk/10.3390/geosciences11110447
Chicago/Turabian StyleMorishita, Yuichi, and Ayaka Wada. 2021. "Role of Hydrothermal Fluids in the Formation of the Kamioka Skarn-Type Pb–Zn Deposits, Japan" Geosciences 11, no. 11: 447. https://0-doi-org.brum.beds.ac.uk/10.3390/geosciences11110447
Note that from the first issue of 2016, this journal uses article numbers instead of page numbers. See further details here.