
Quantifying Multiple Erosion Events in the Distal Sector of the Northern Alpine Foreland Basin (North-Eastern Switzerland), by Combining Basin Thermal Modelling with Vitrinite Reflectance and Apatite Fission Track Data


Abstract
:1. Introduction
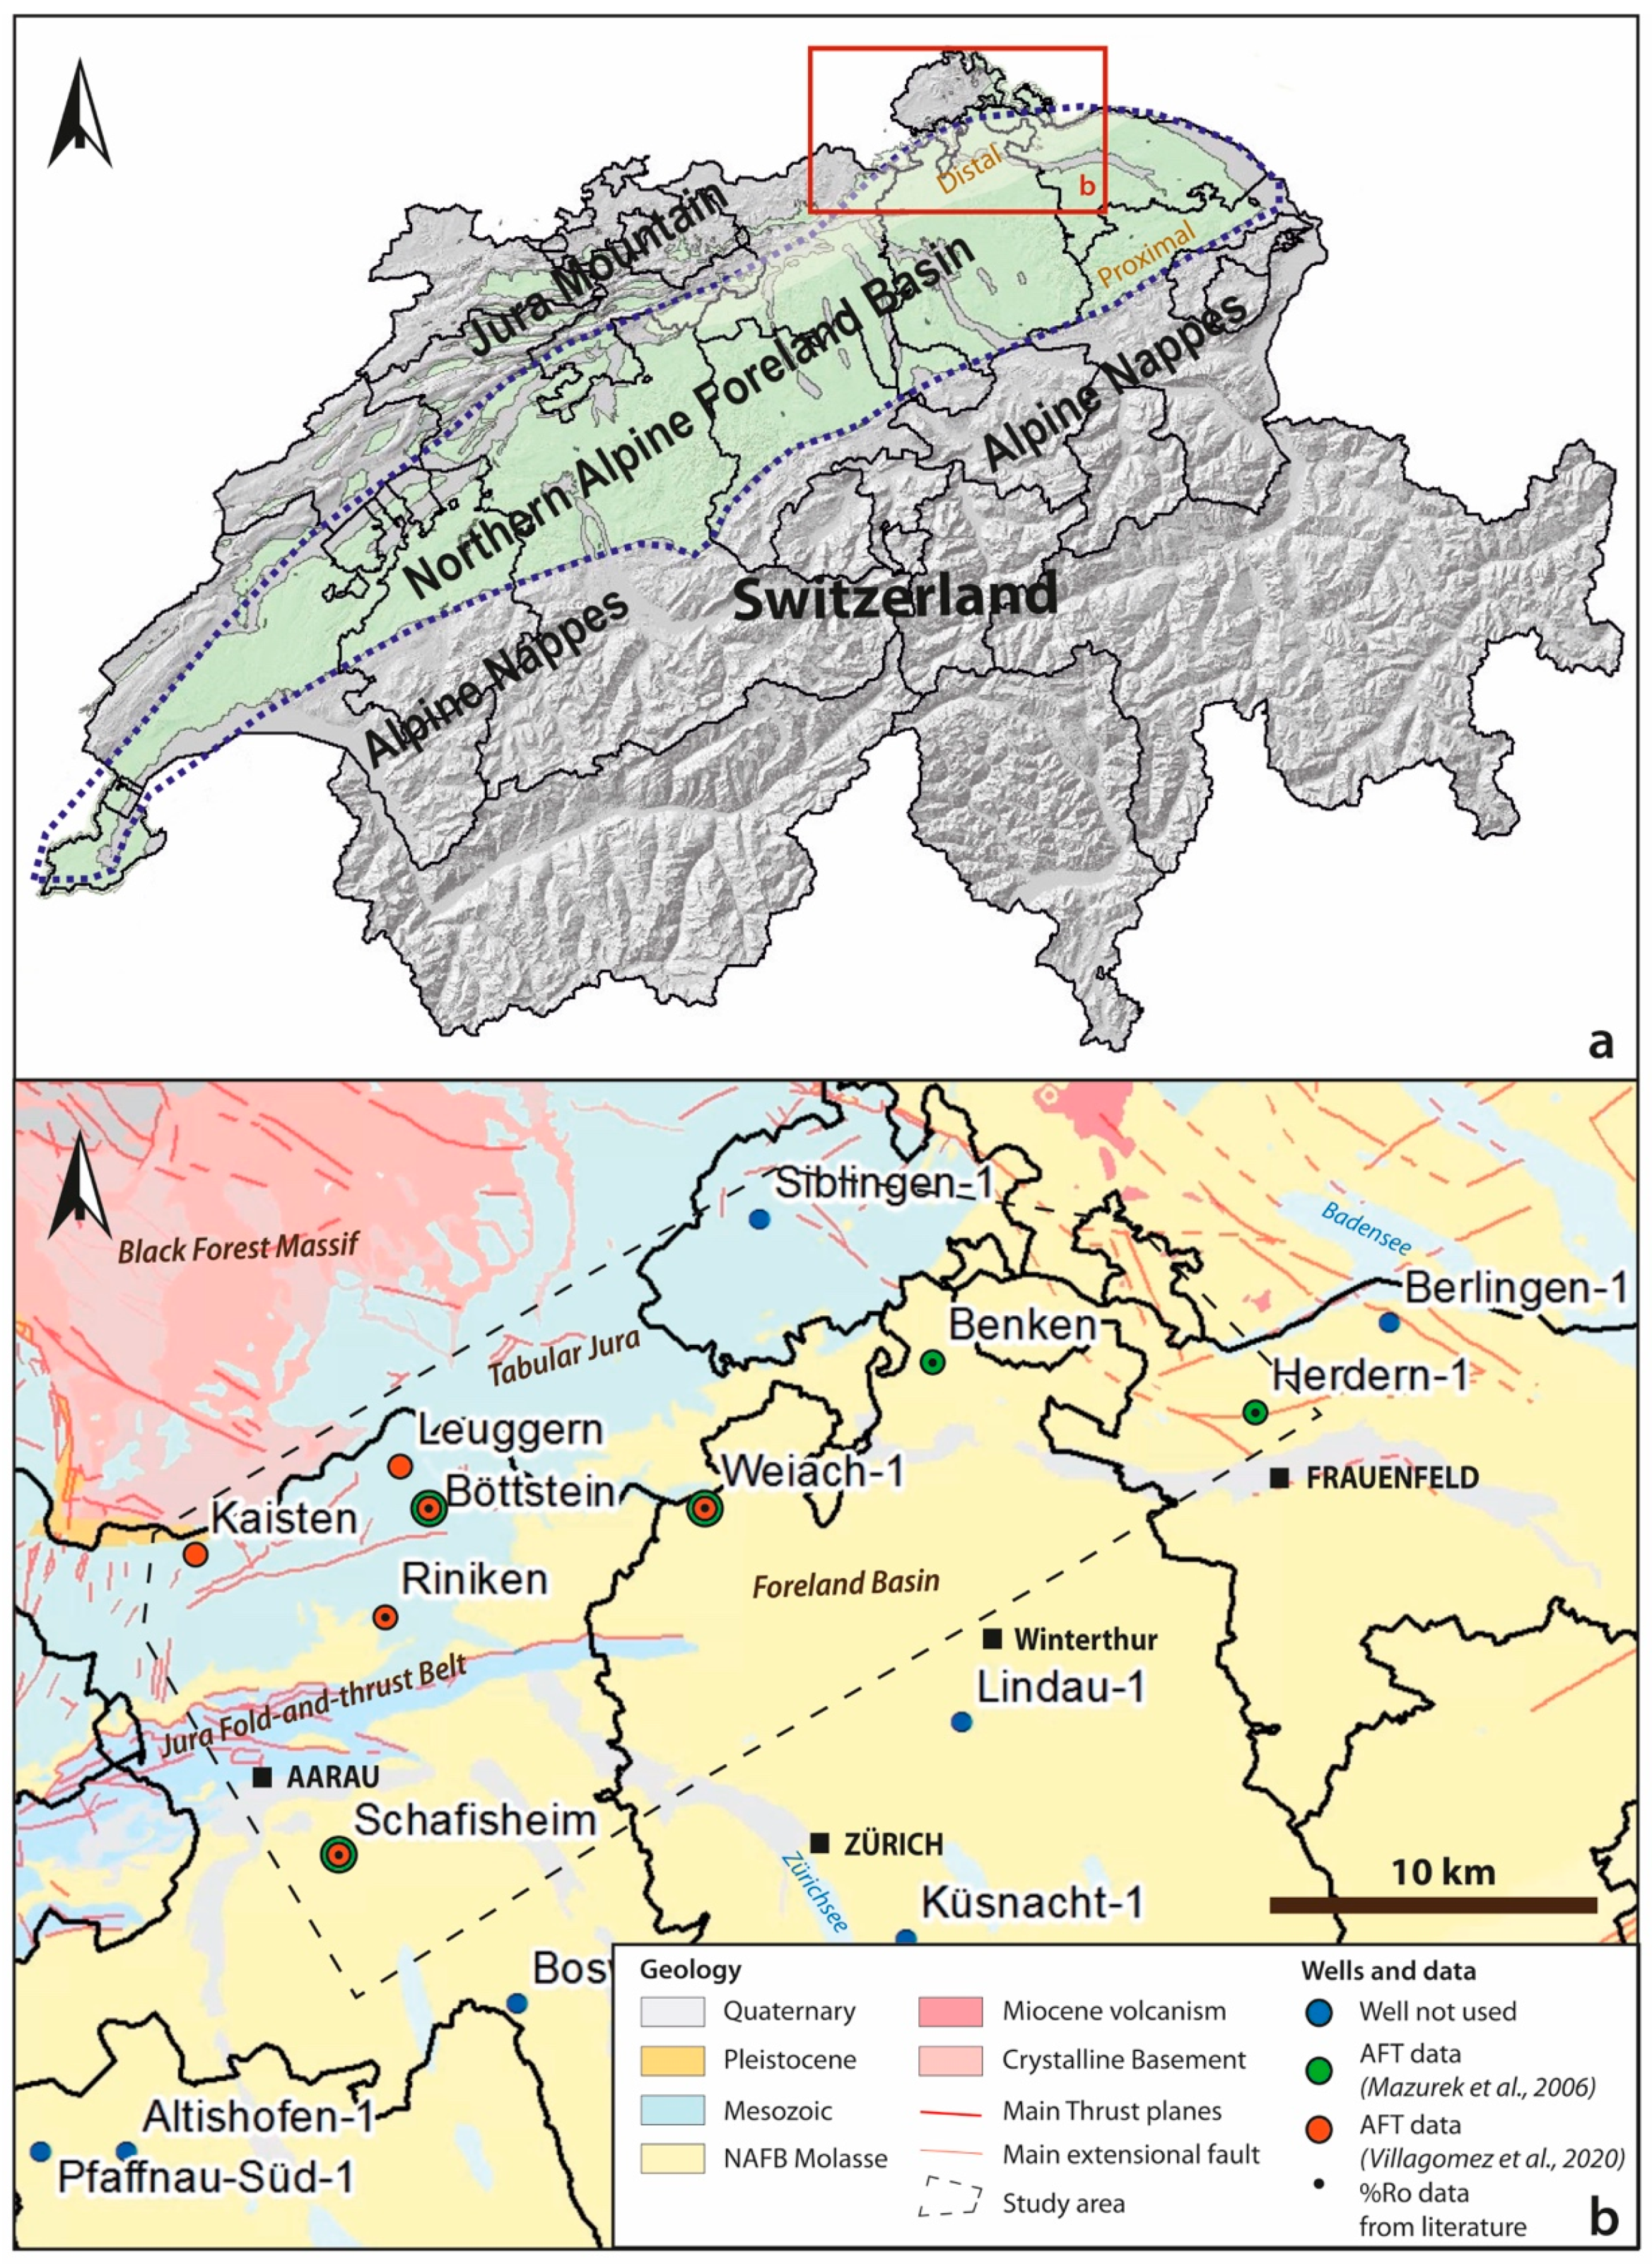
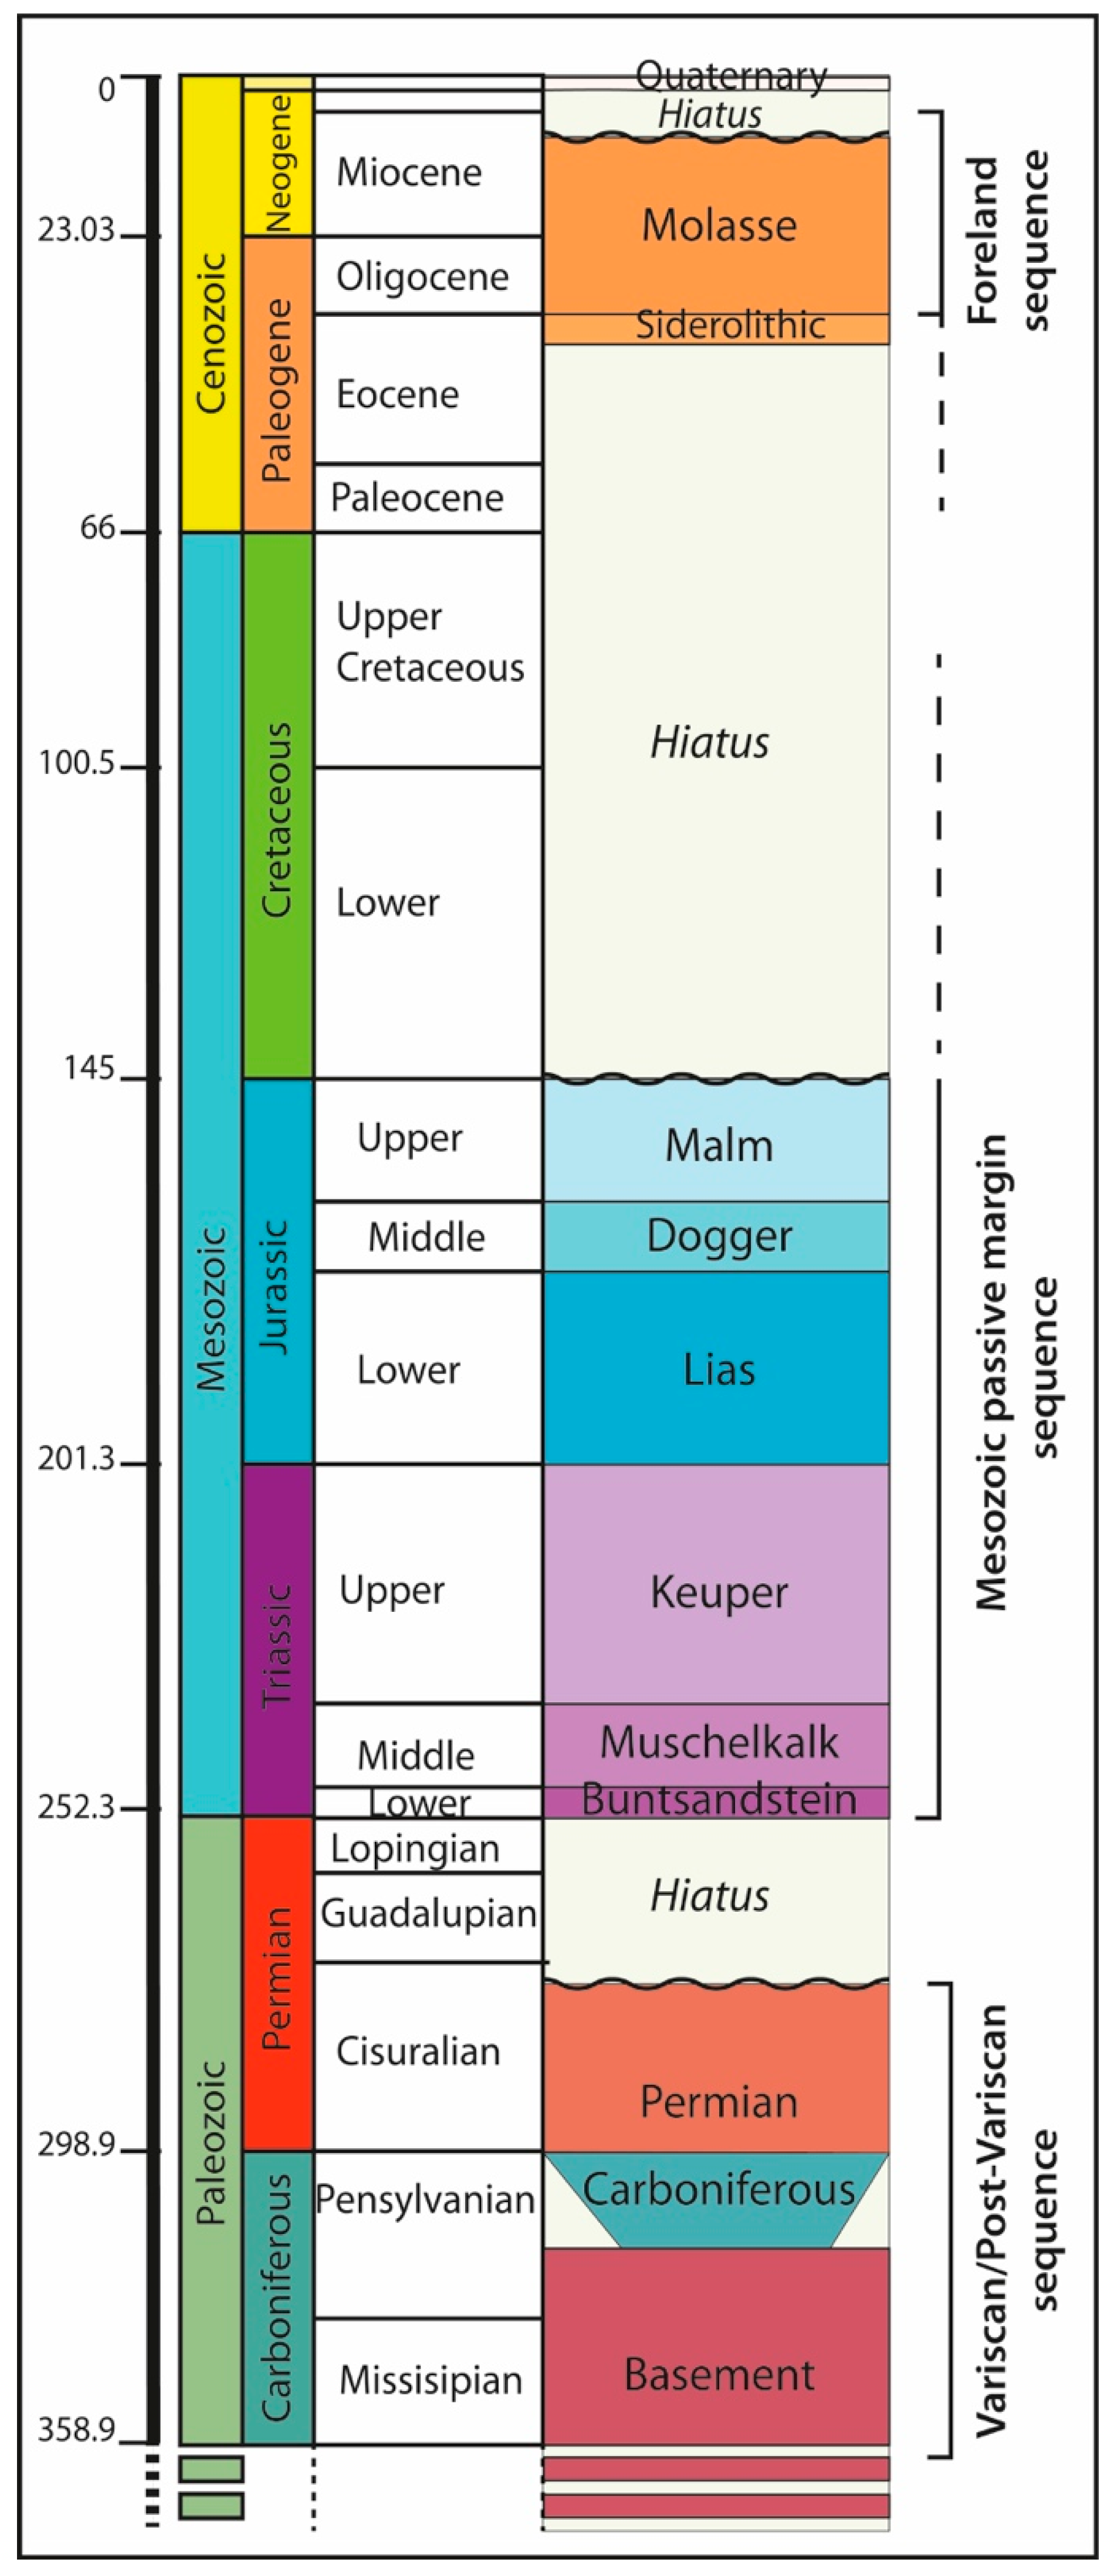
2. Geological Setting
2.1. Basin Erosional Unconformities
2.2. Apatite Fission Tracks (AFT) Investigations in Northern Switzerland
3. Methods and Data
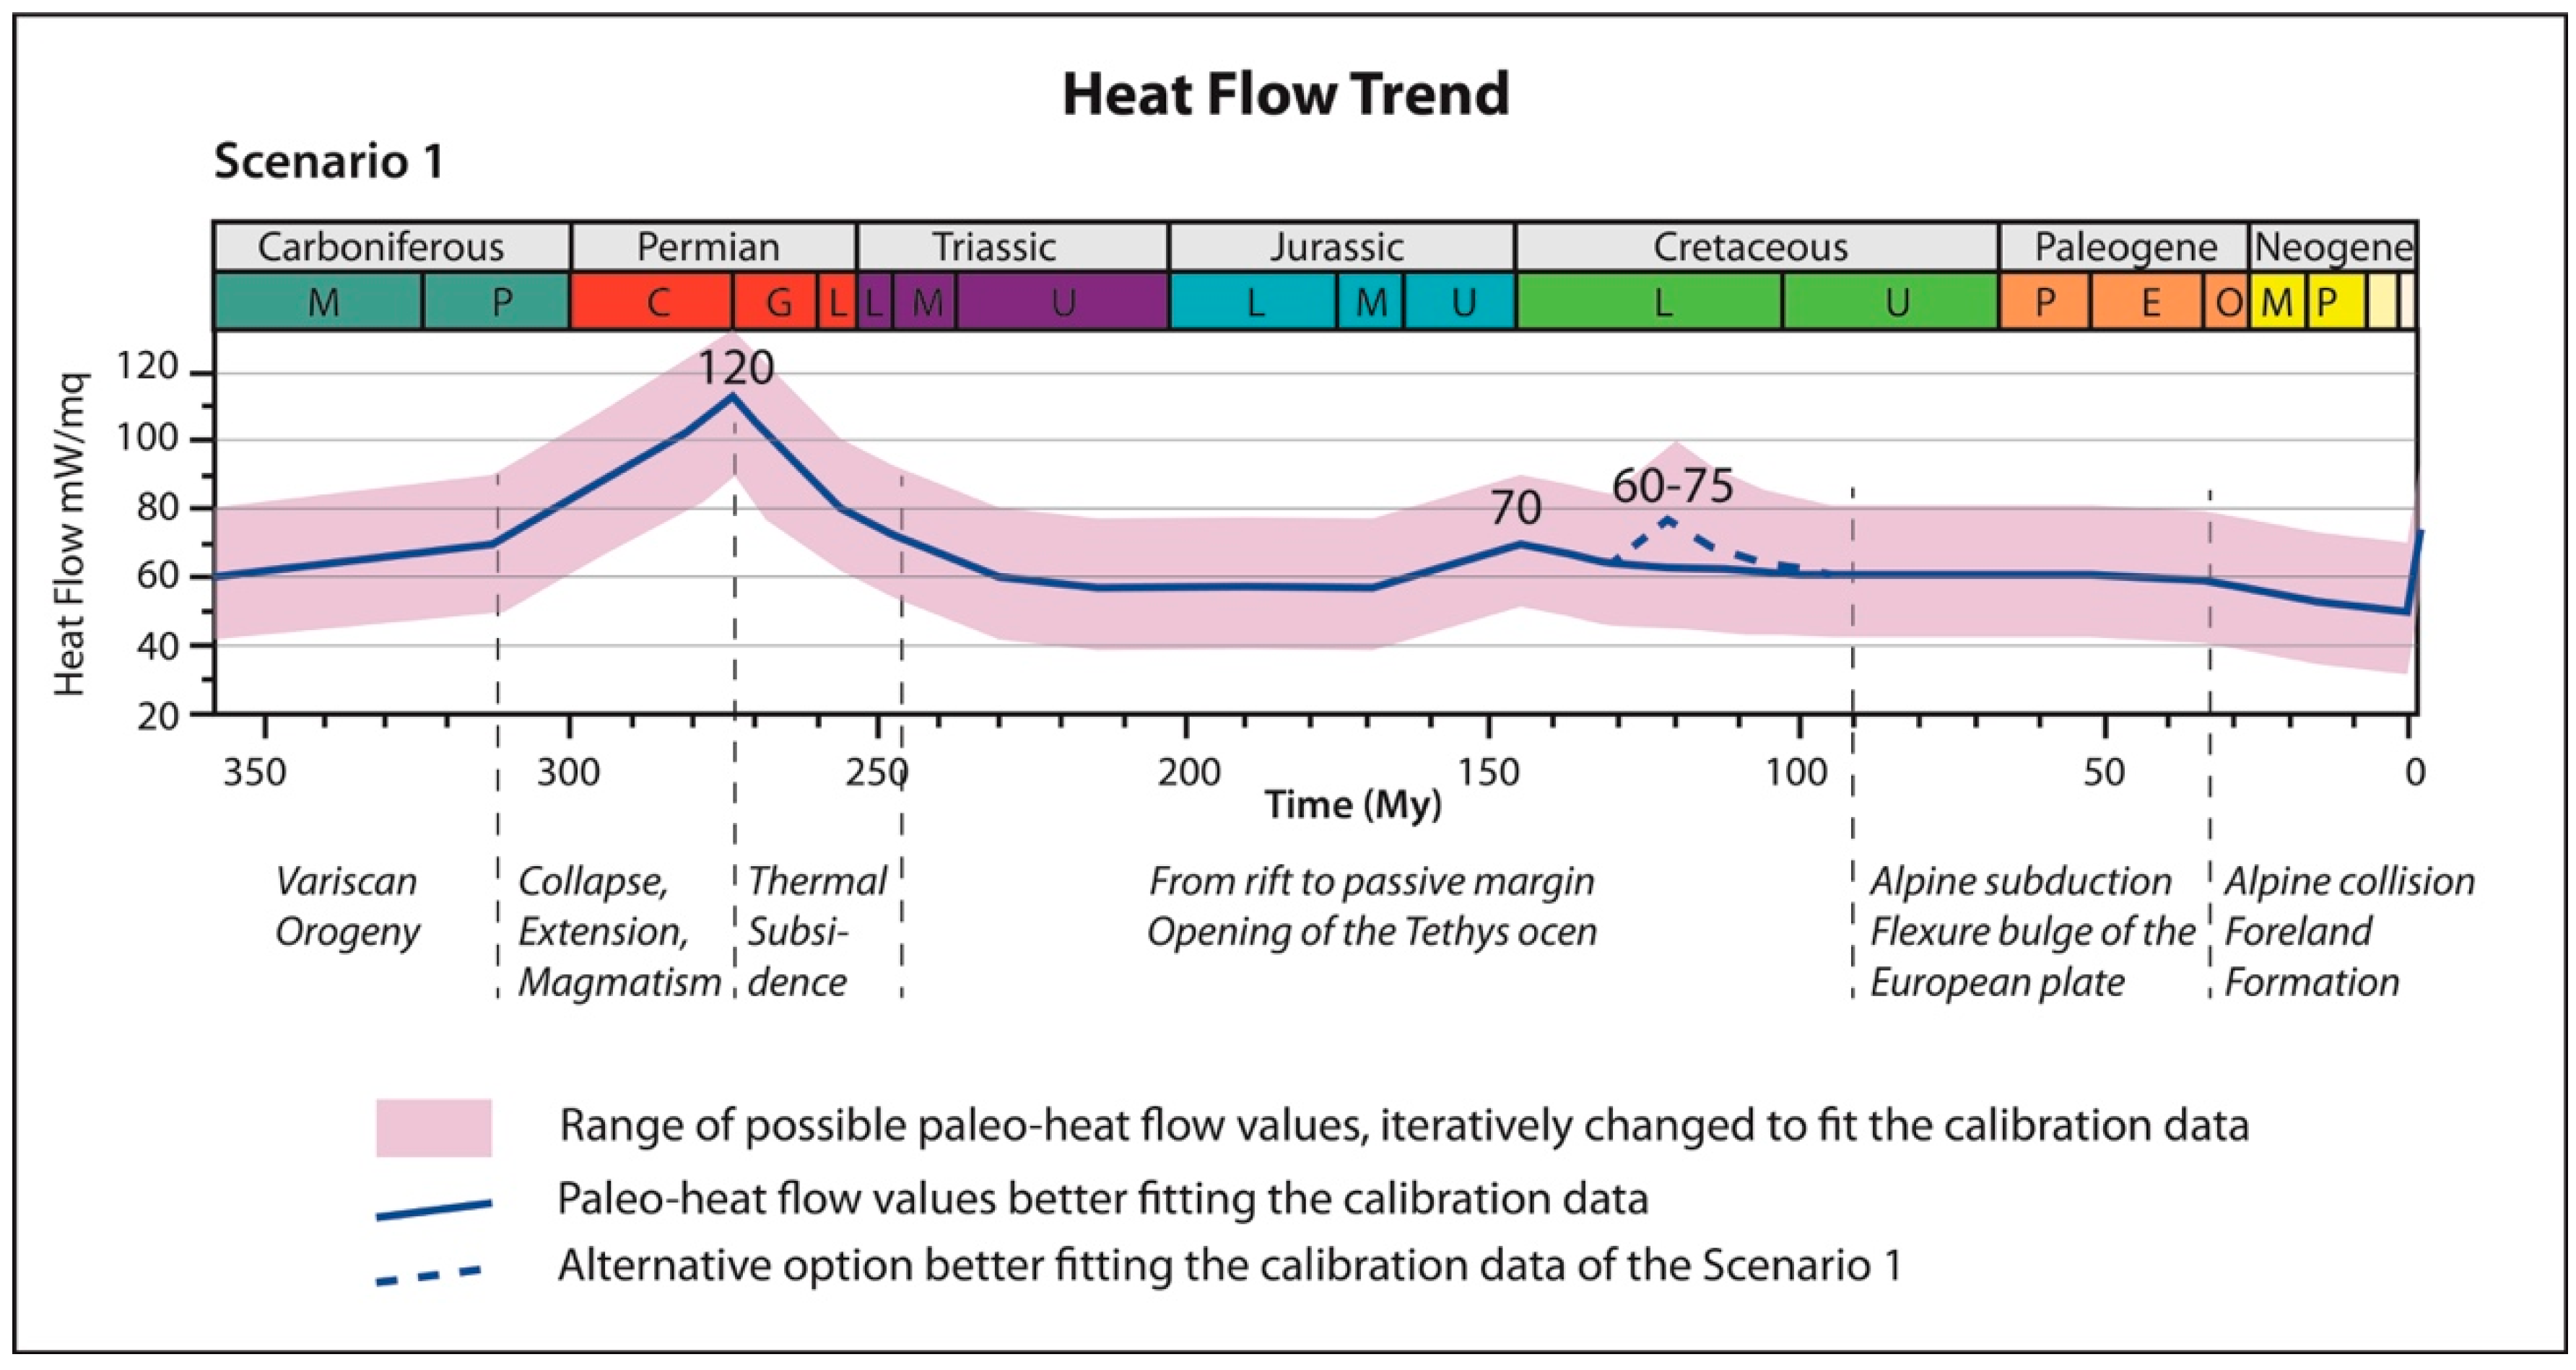
3.1. Basal Heat Flow
3.2. Calibration Process and Data
4. Results
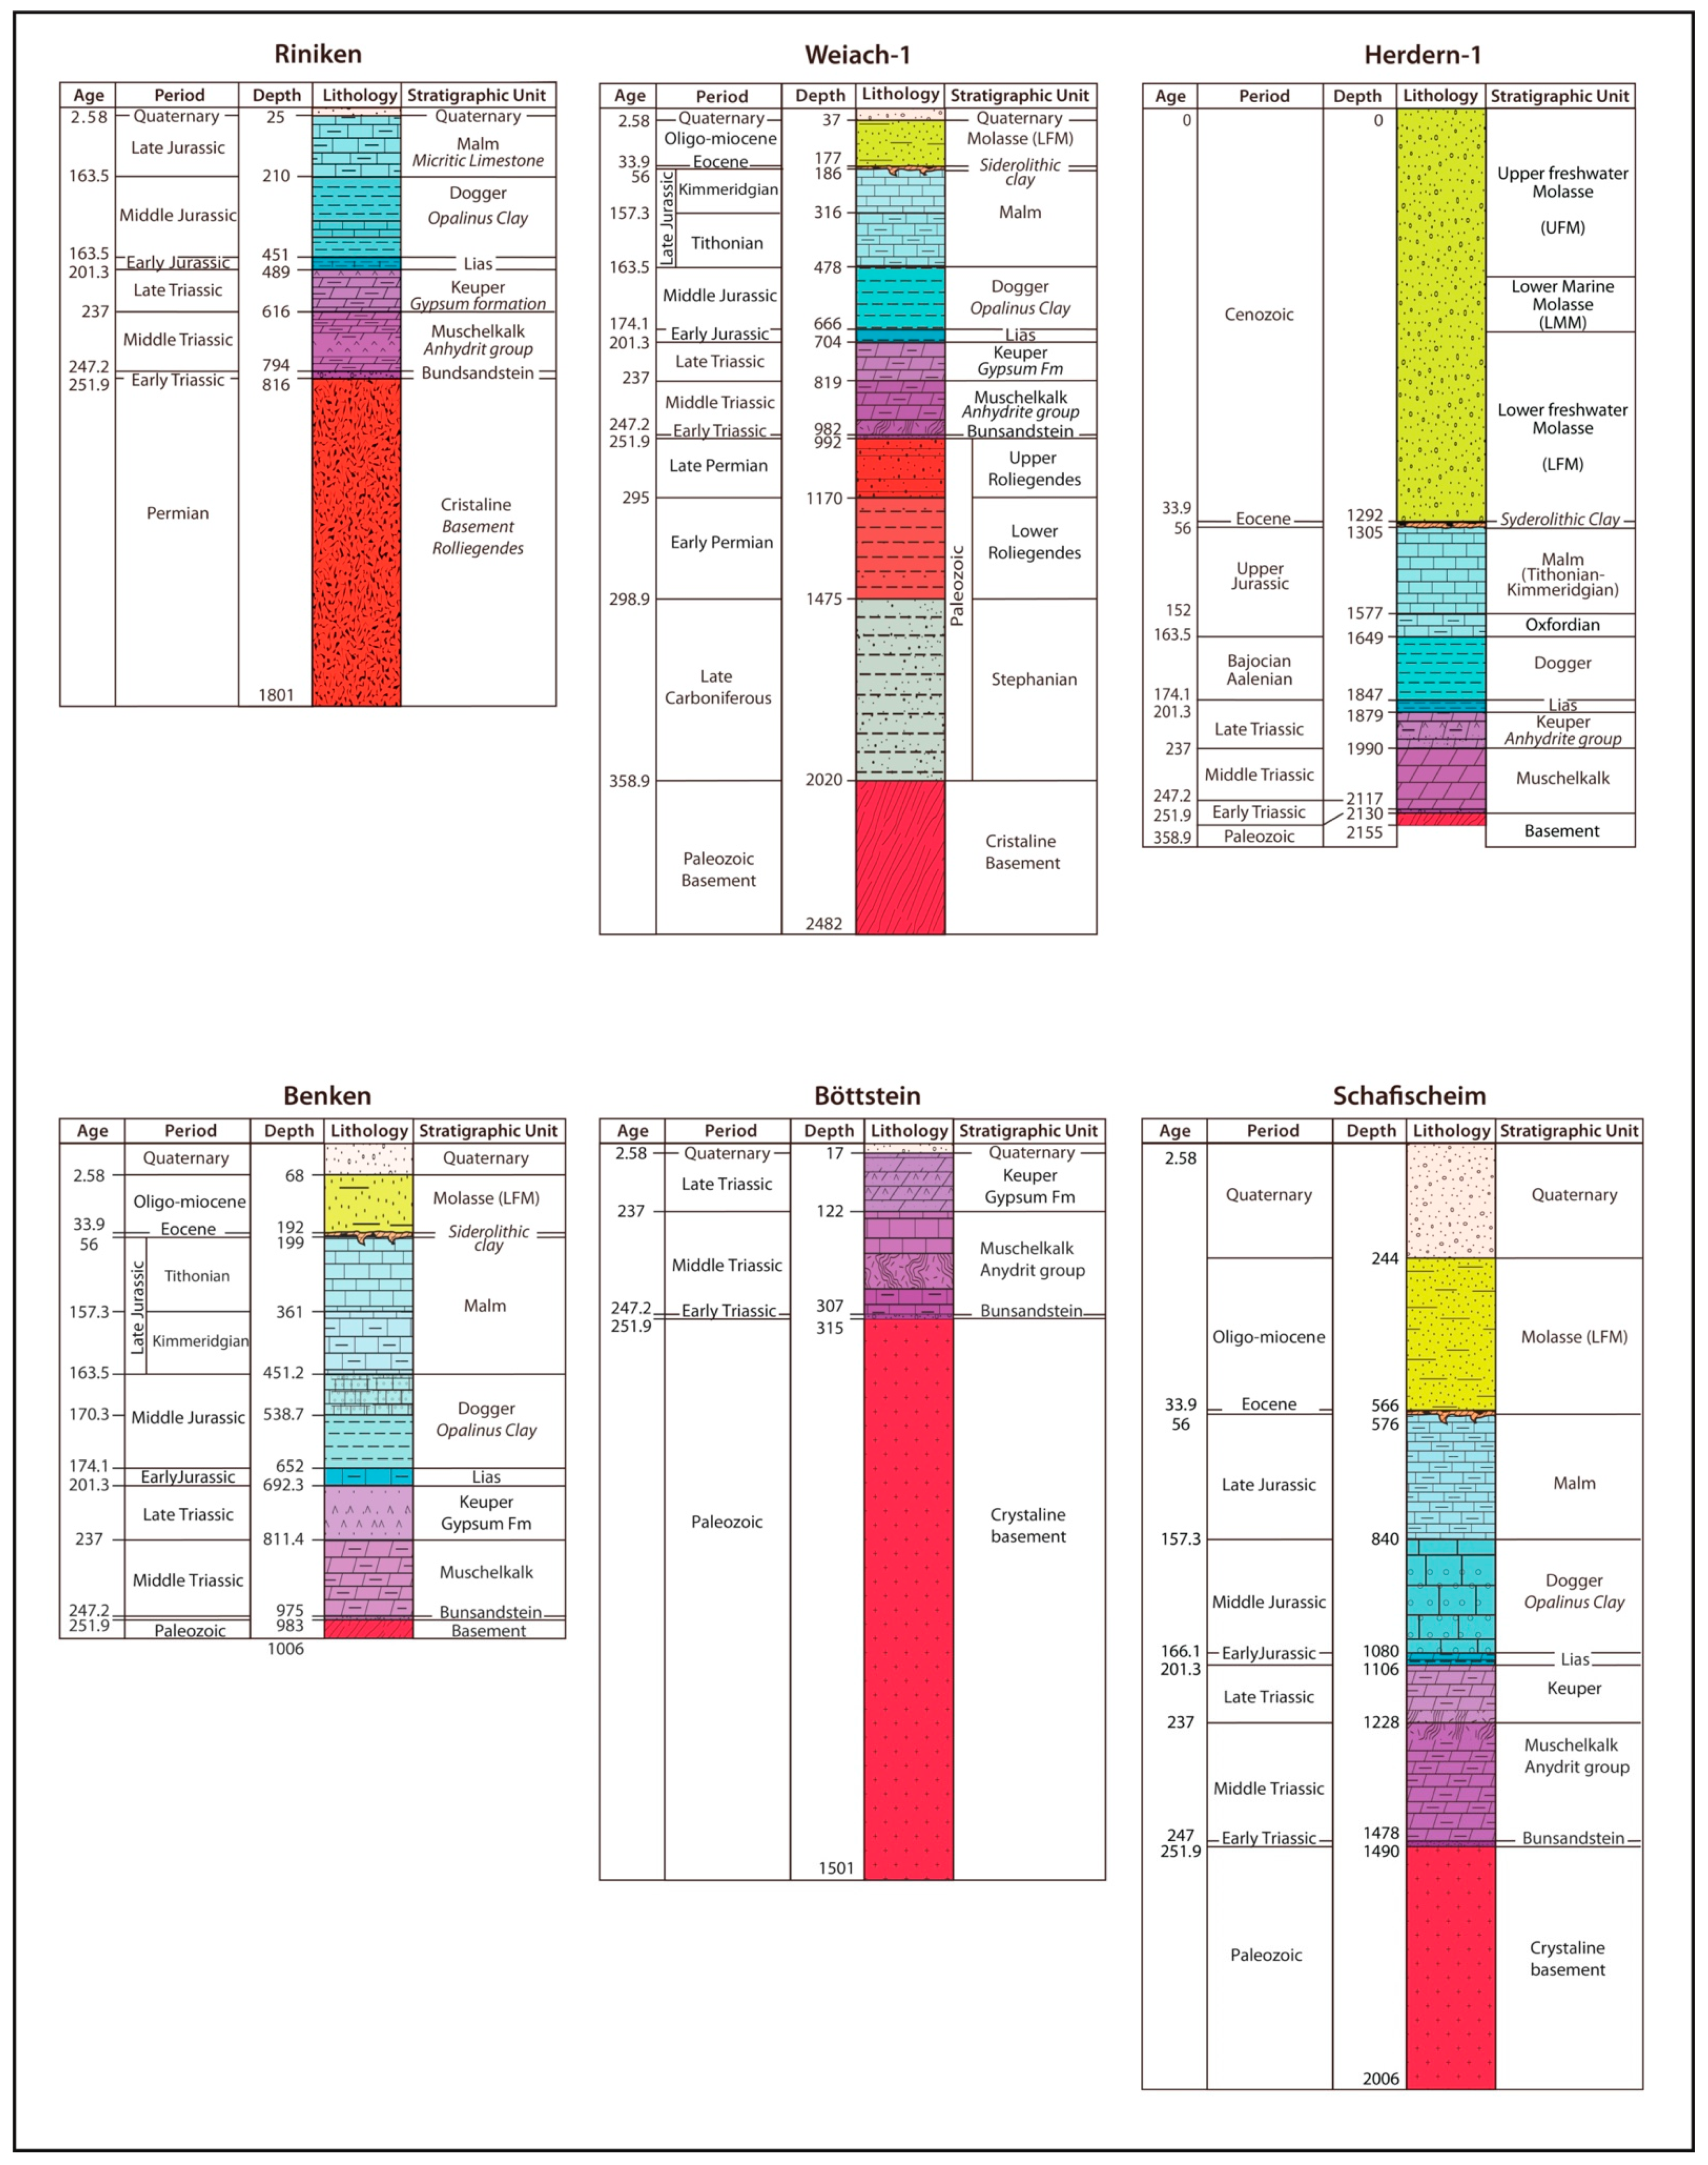
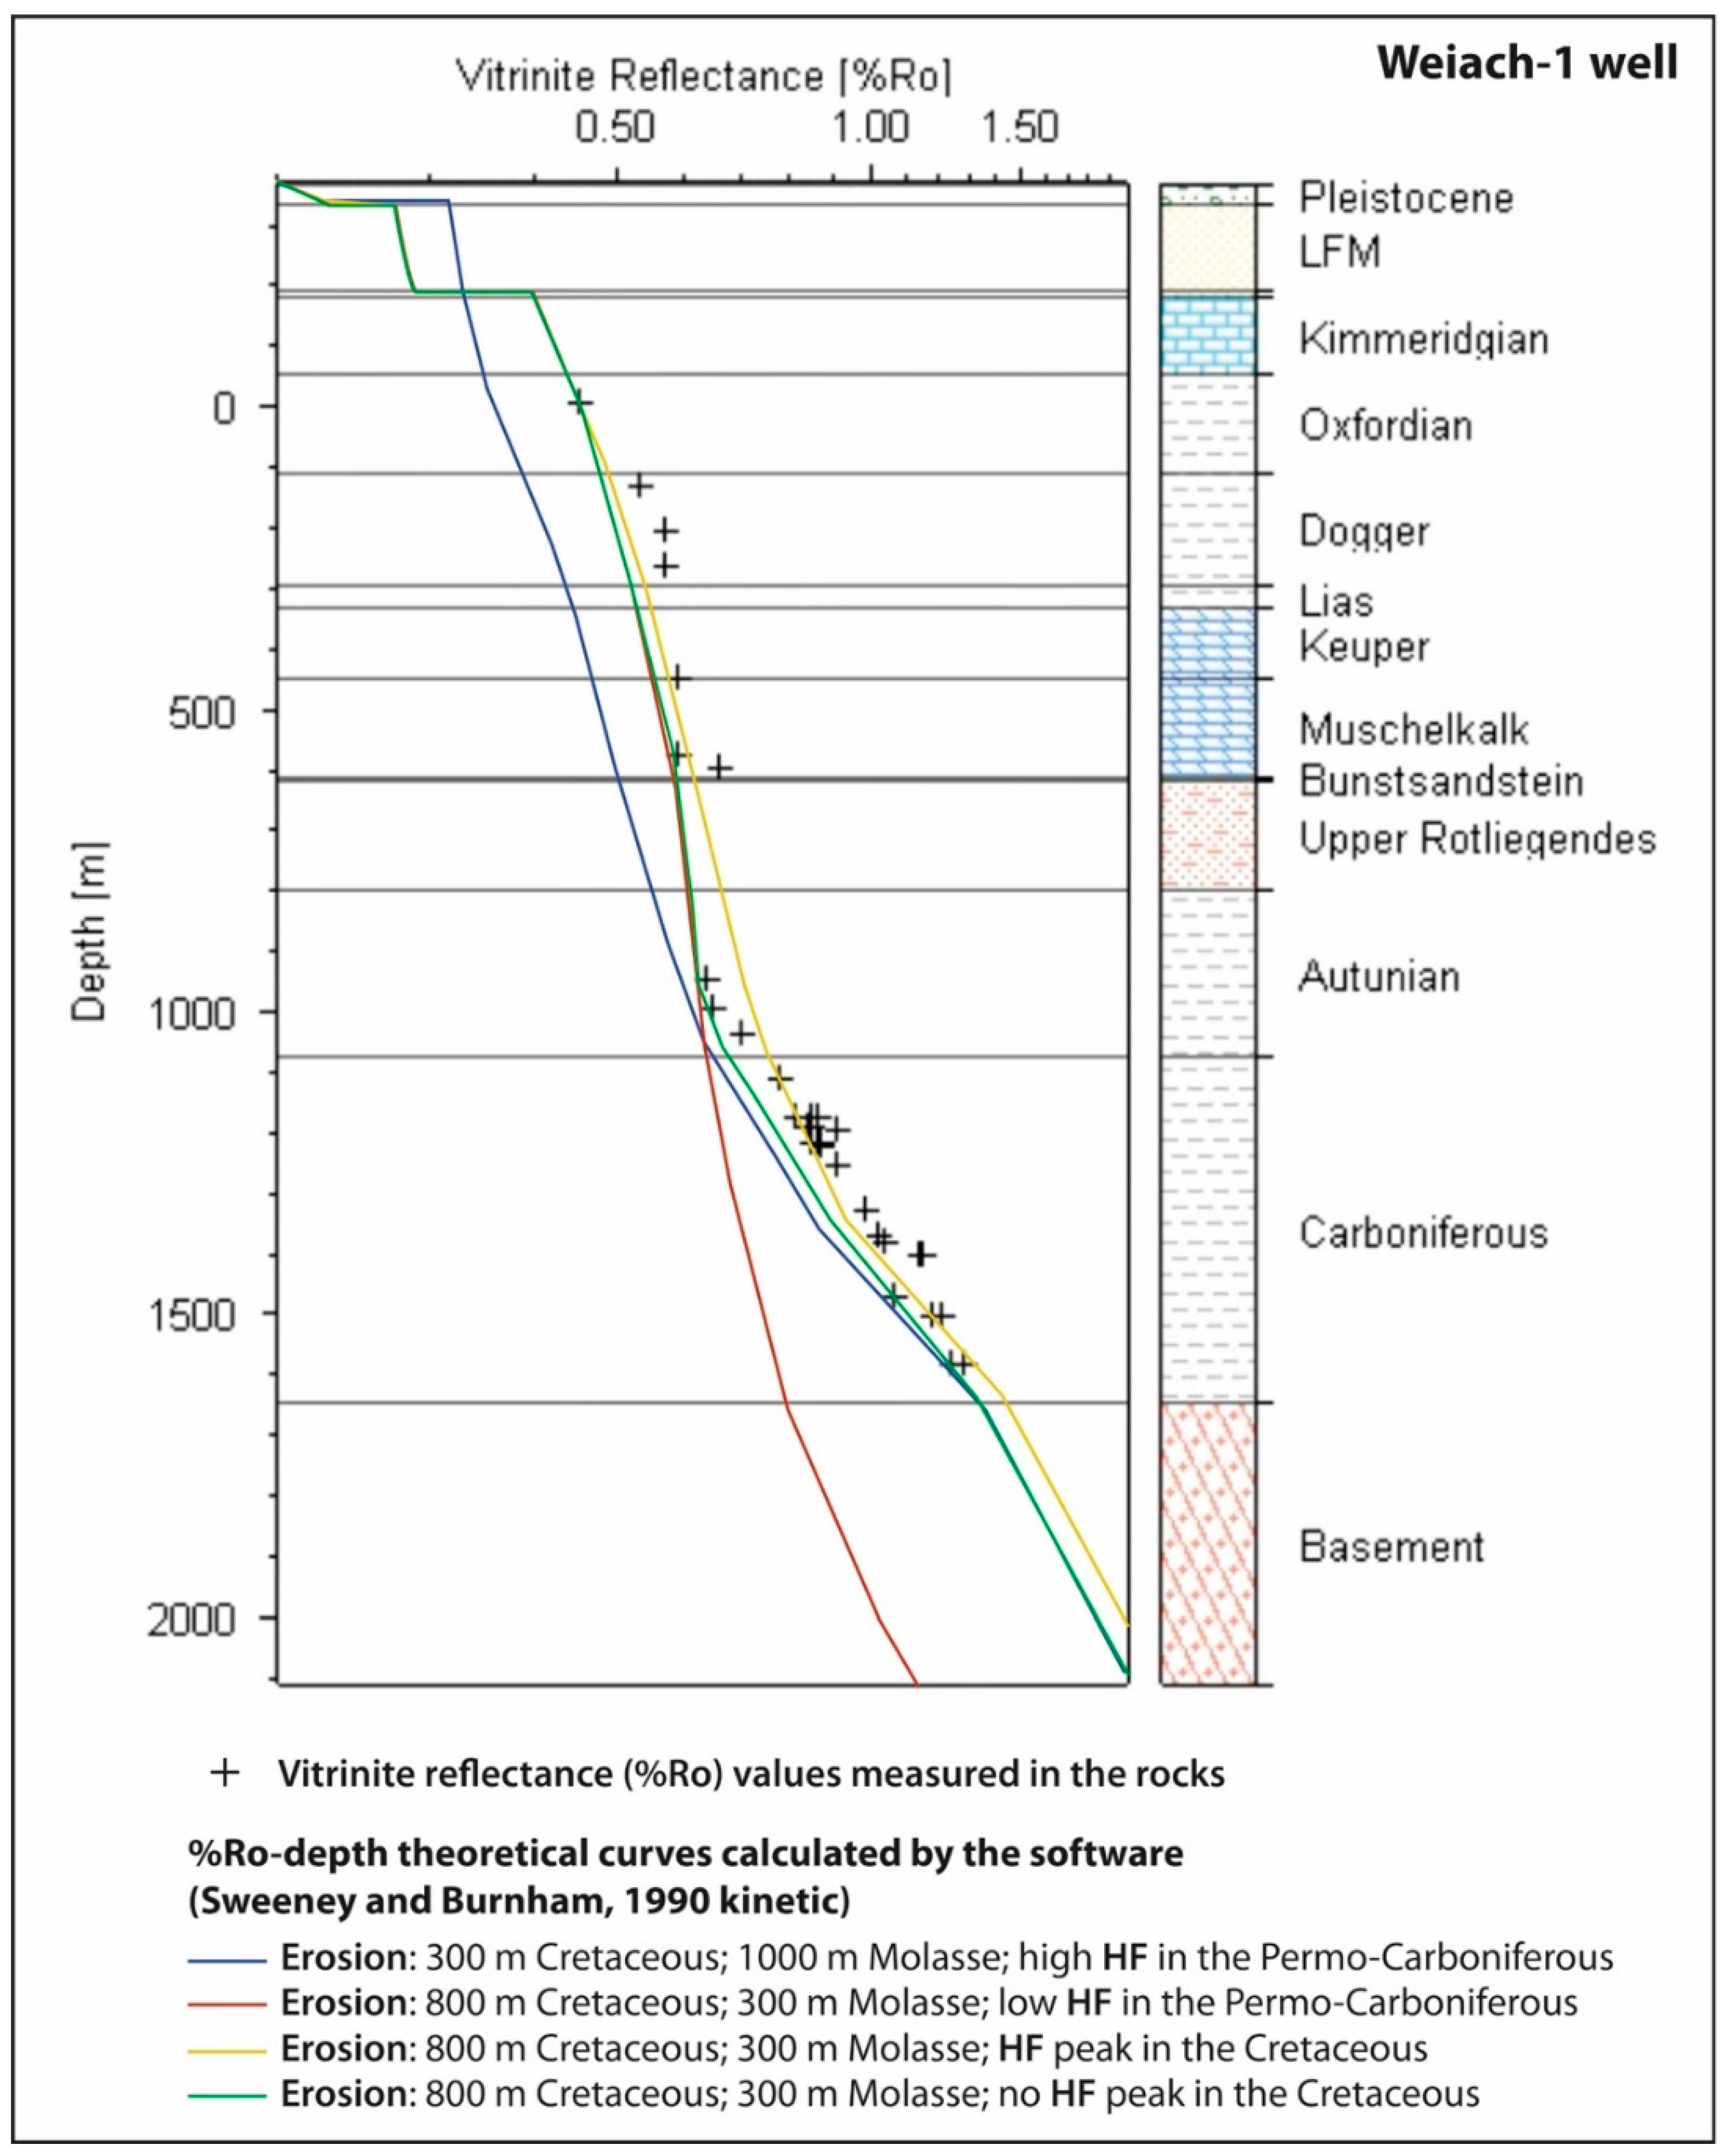
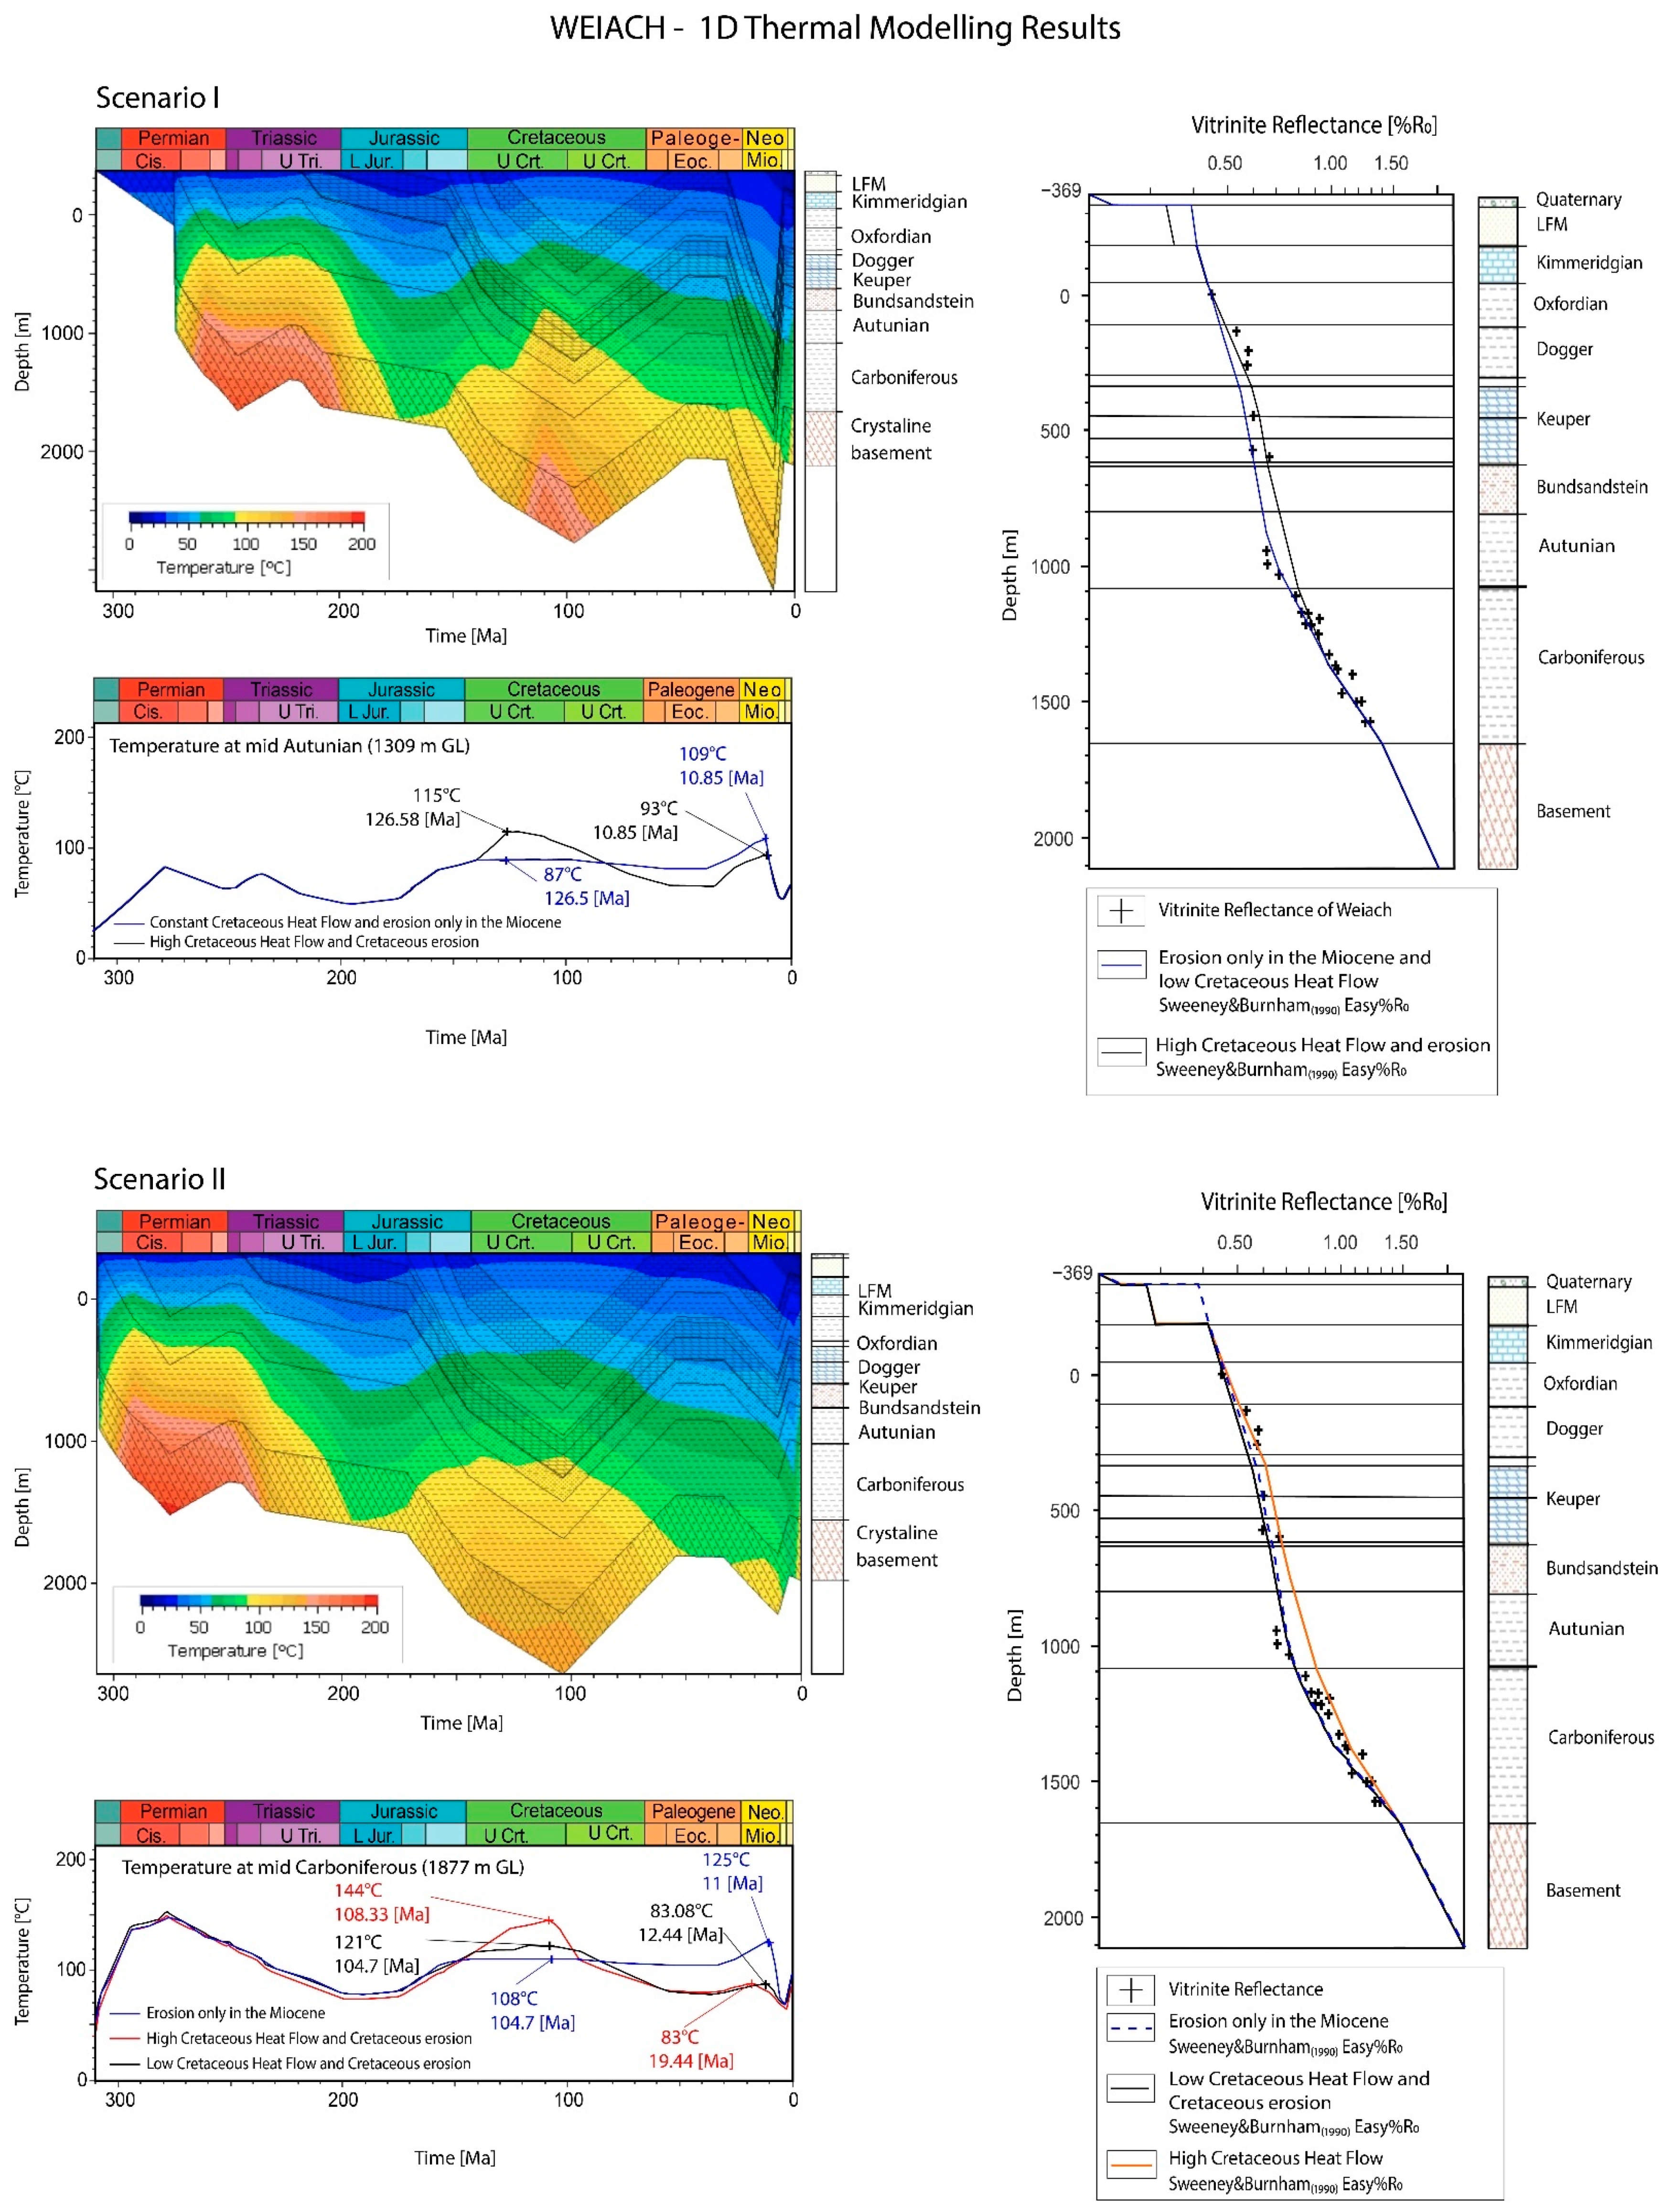
4.1. Weiach-1 Well
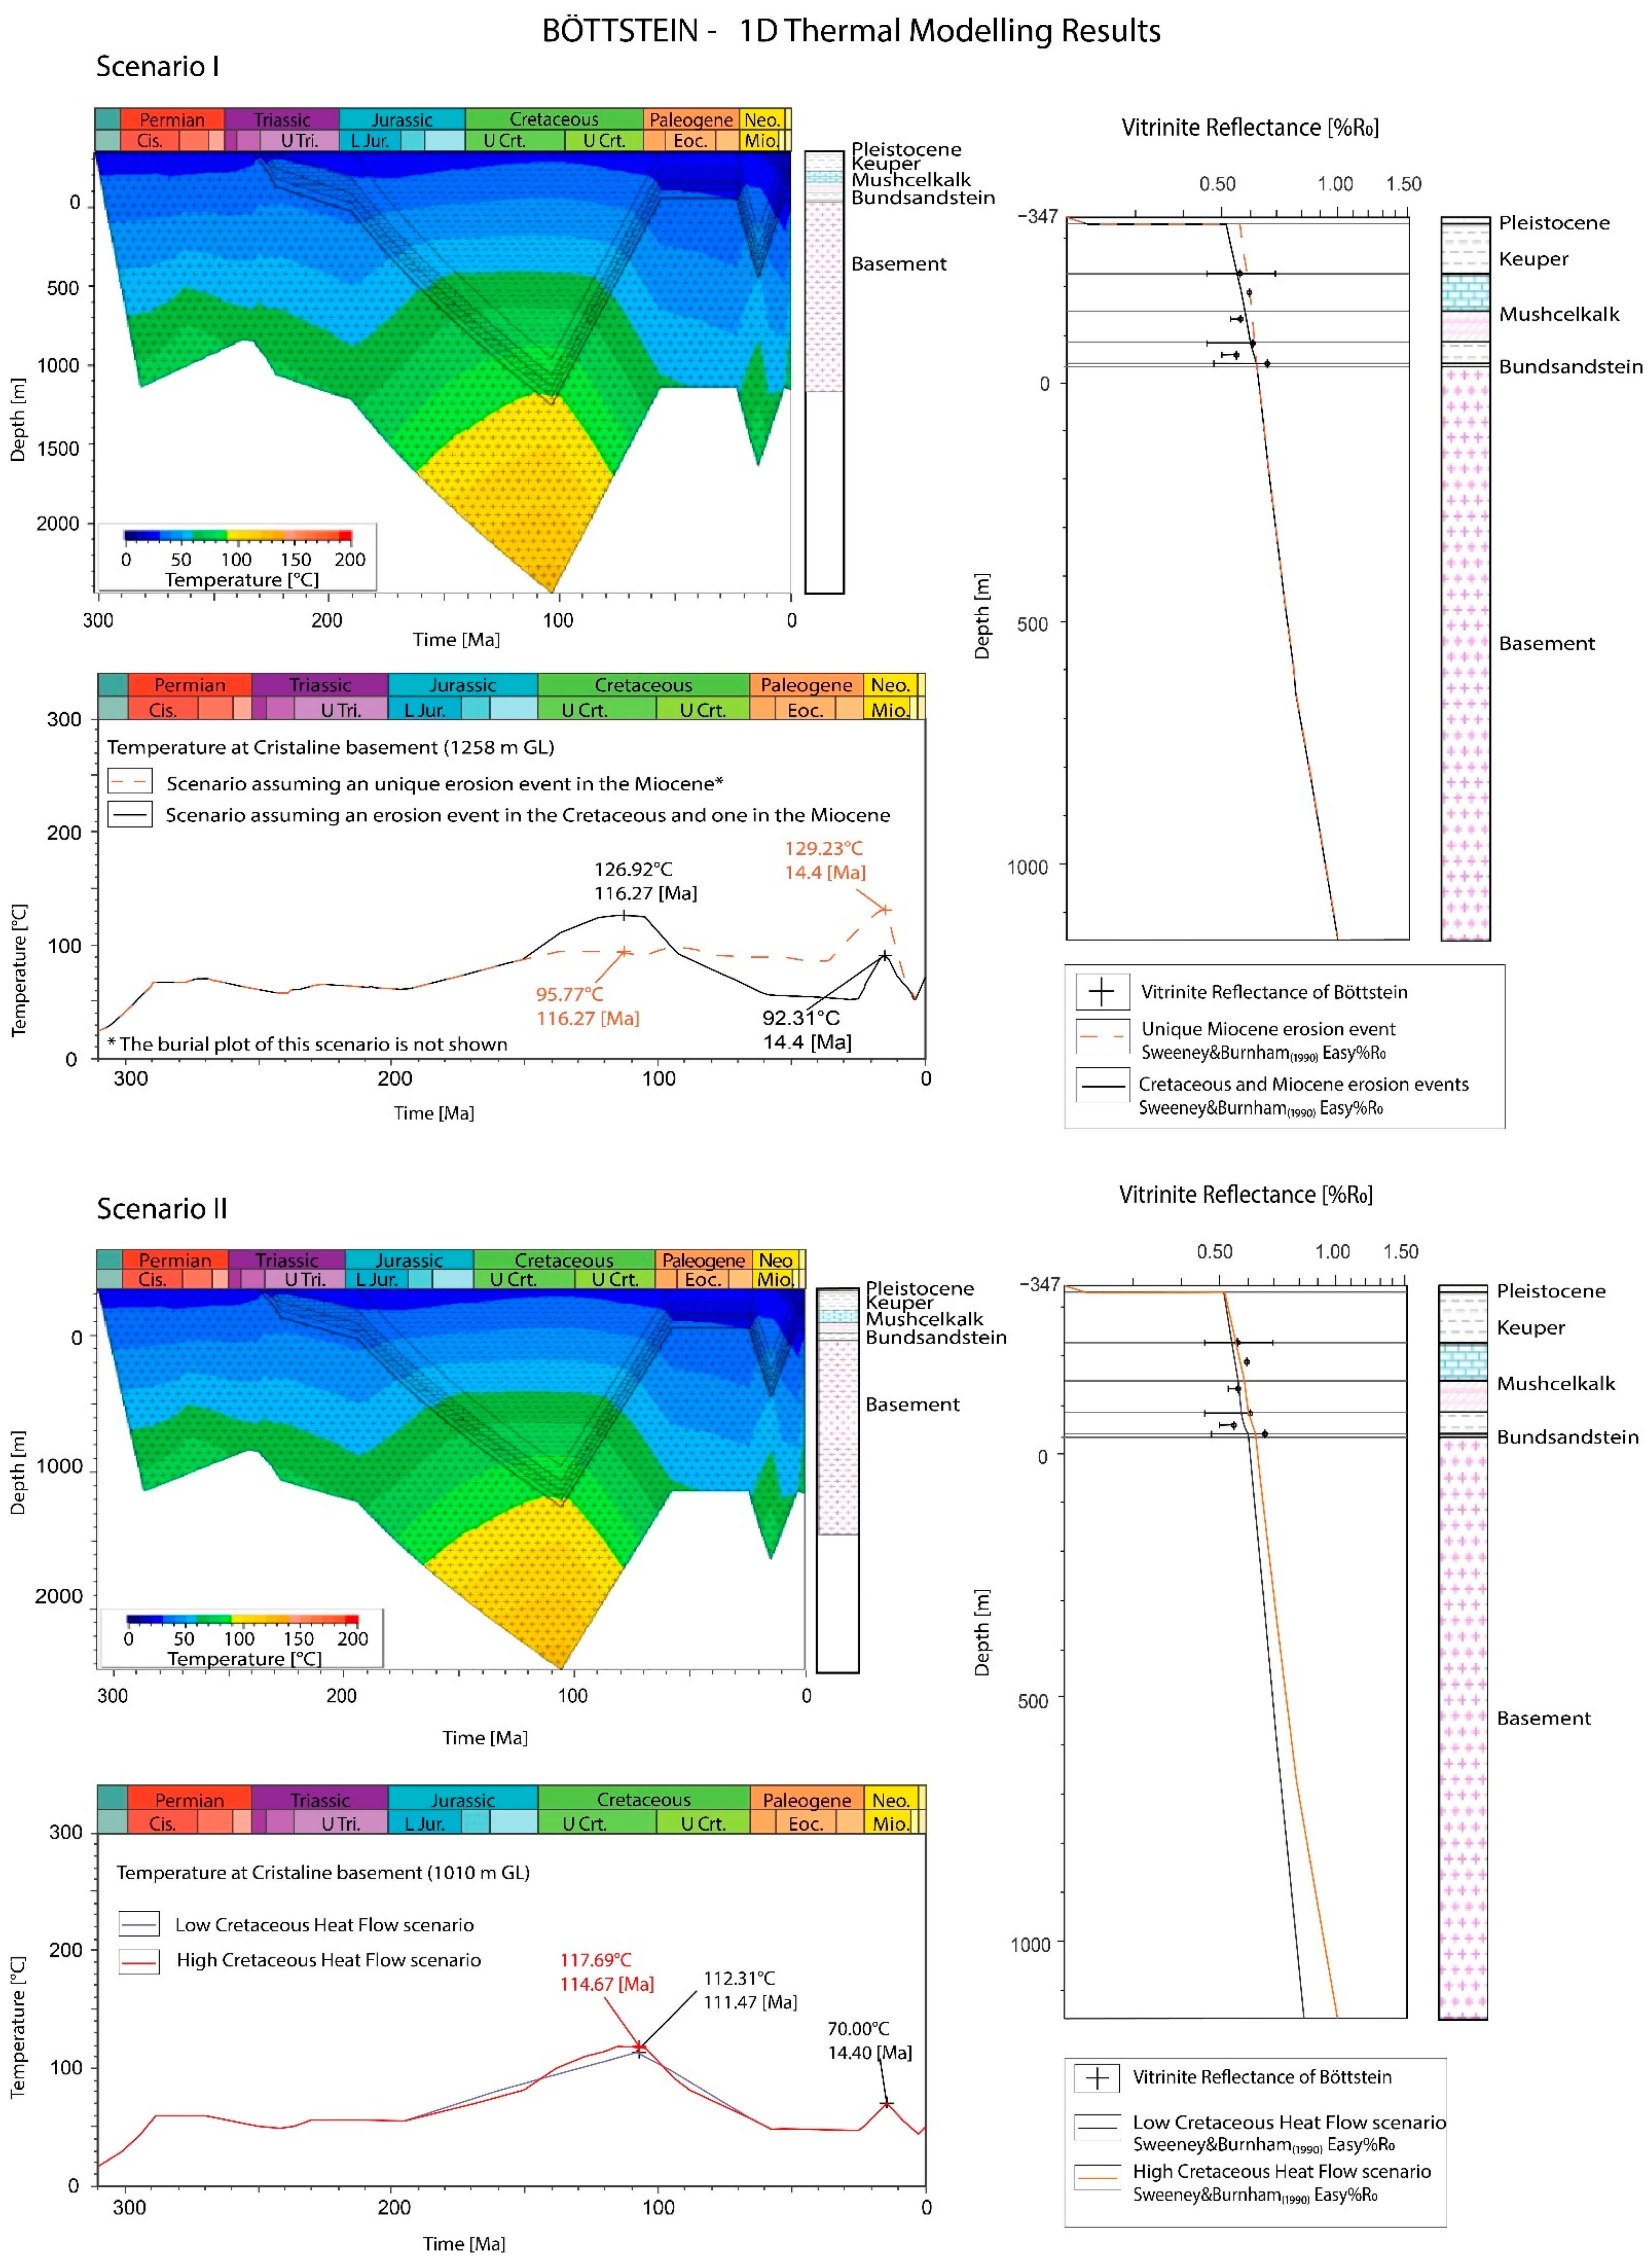
4.2. Böttstein-1 Well
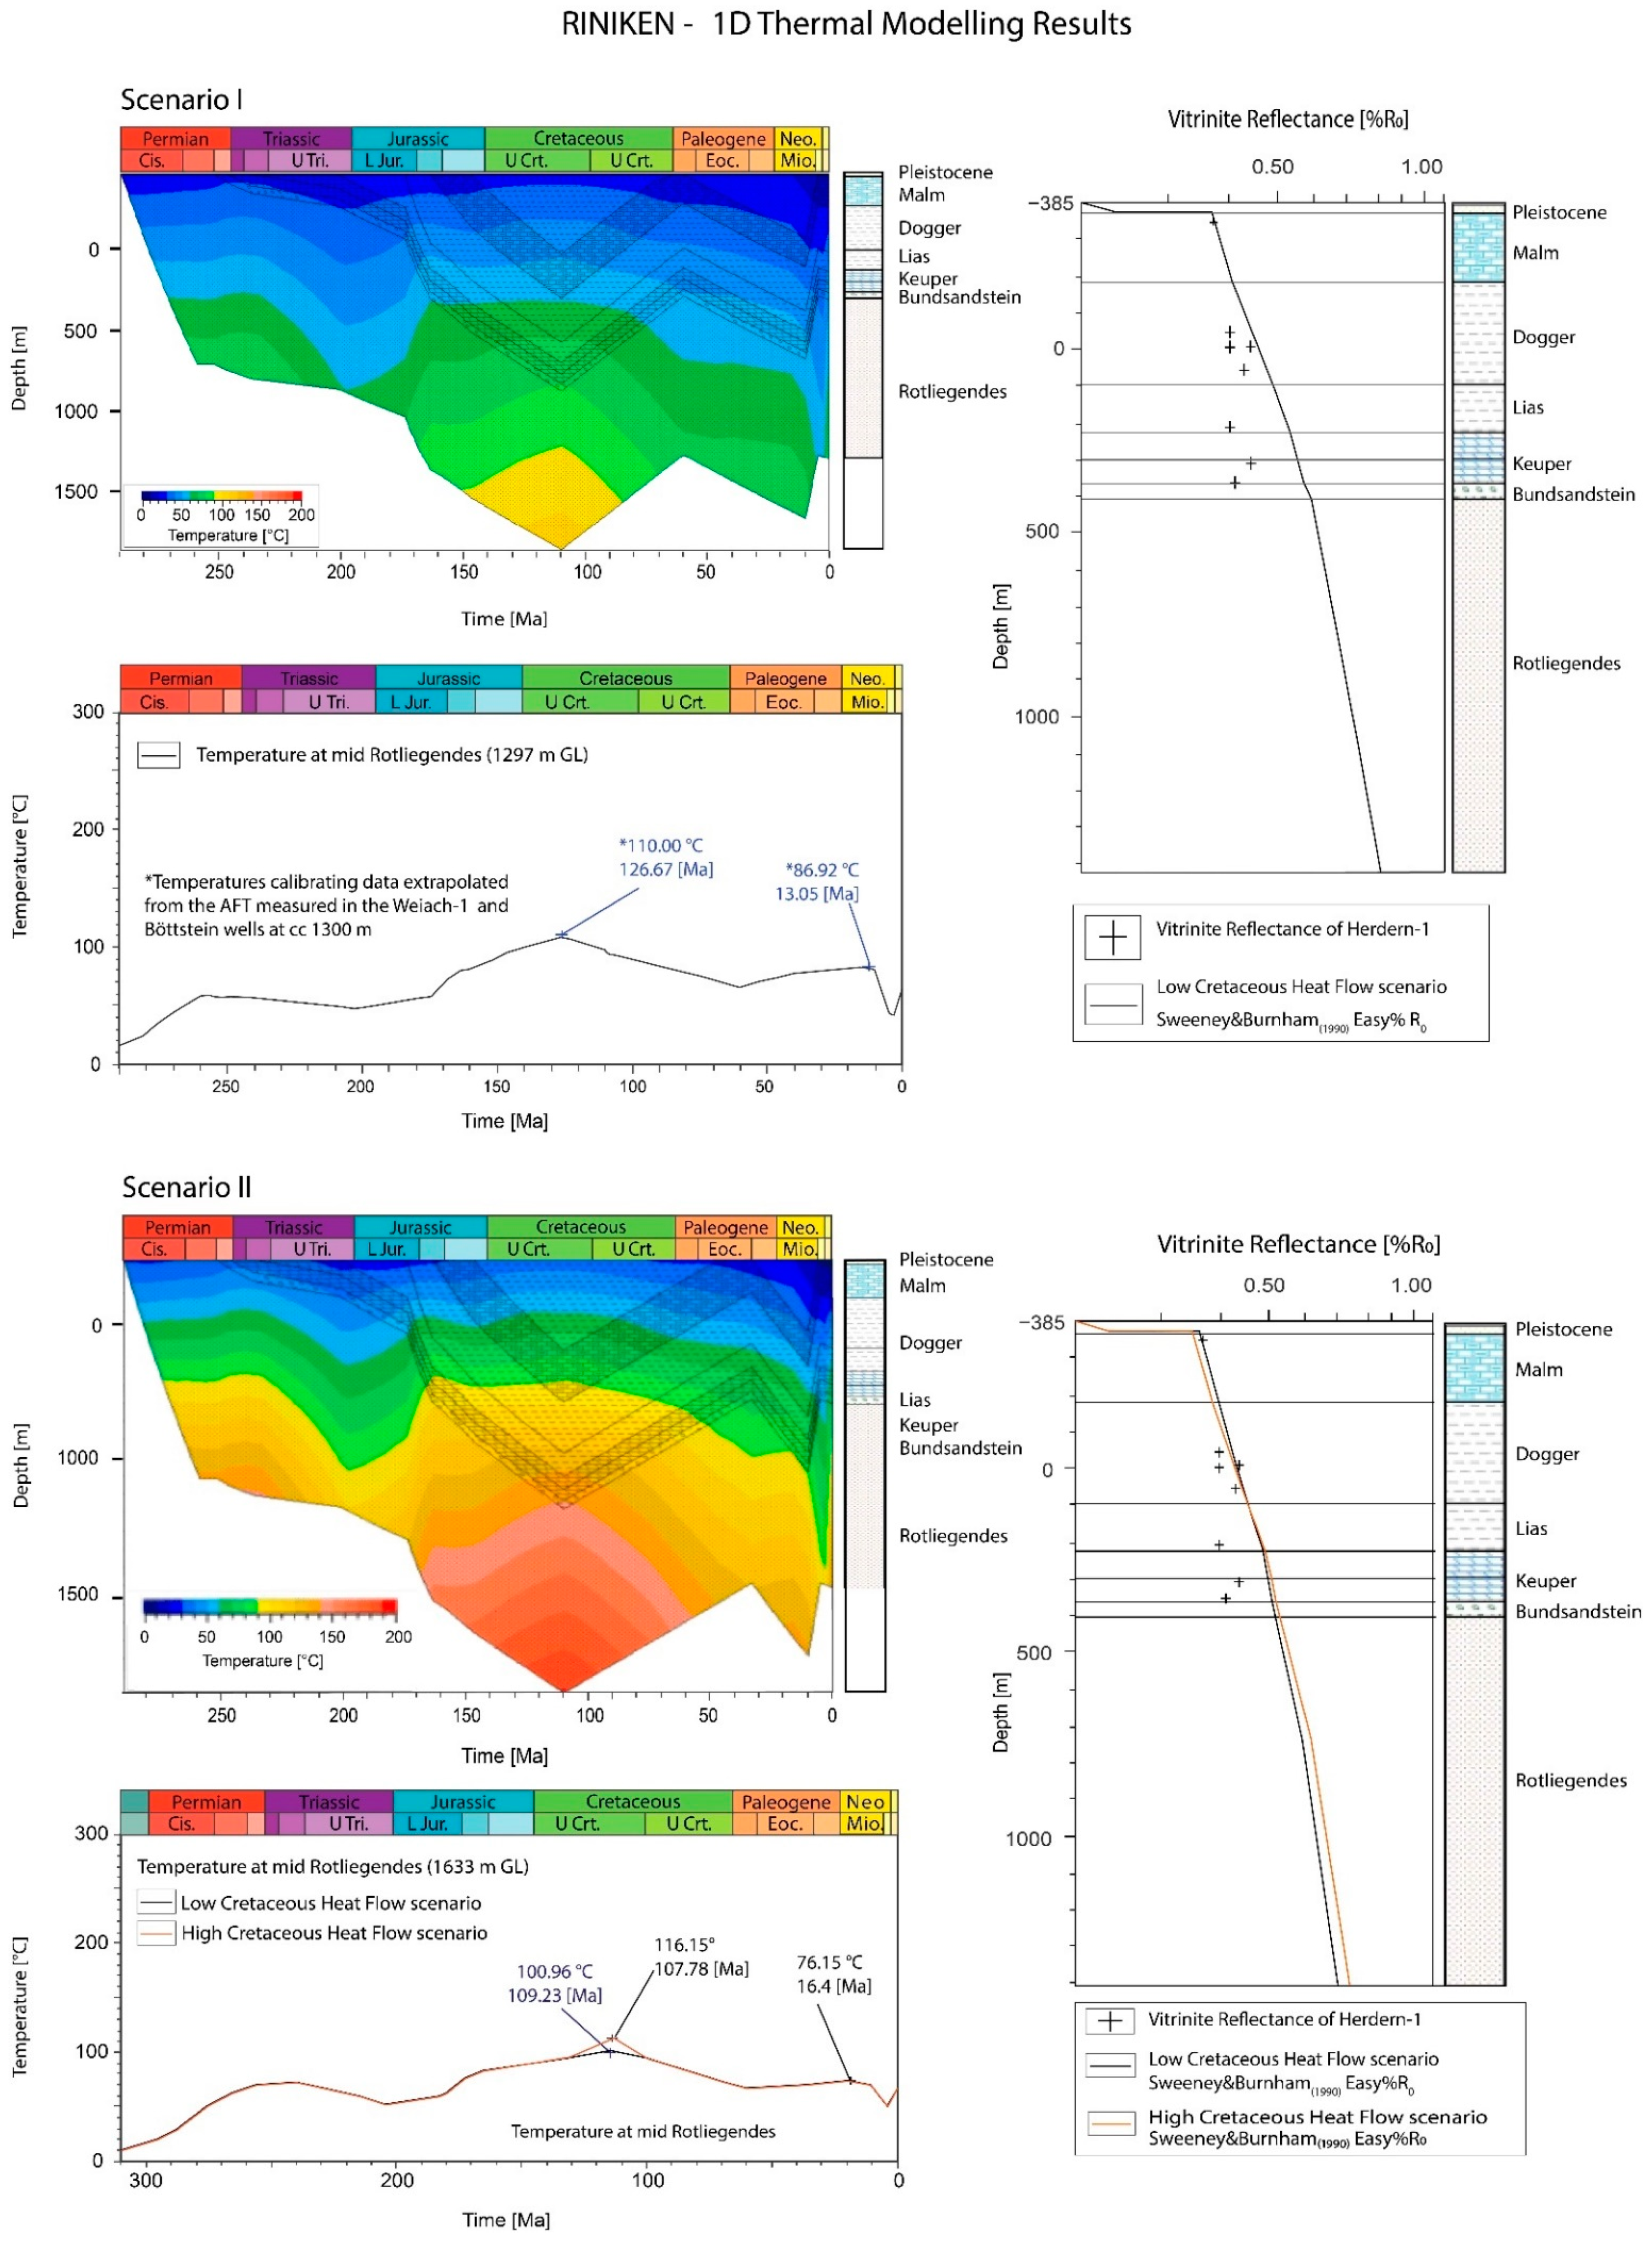
4.3. Riniken-1 Well
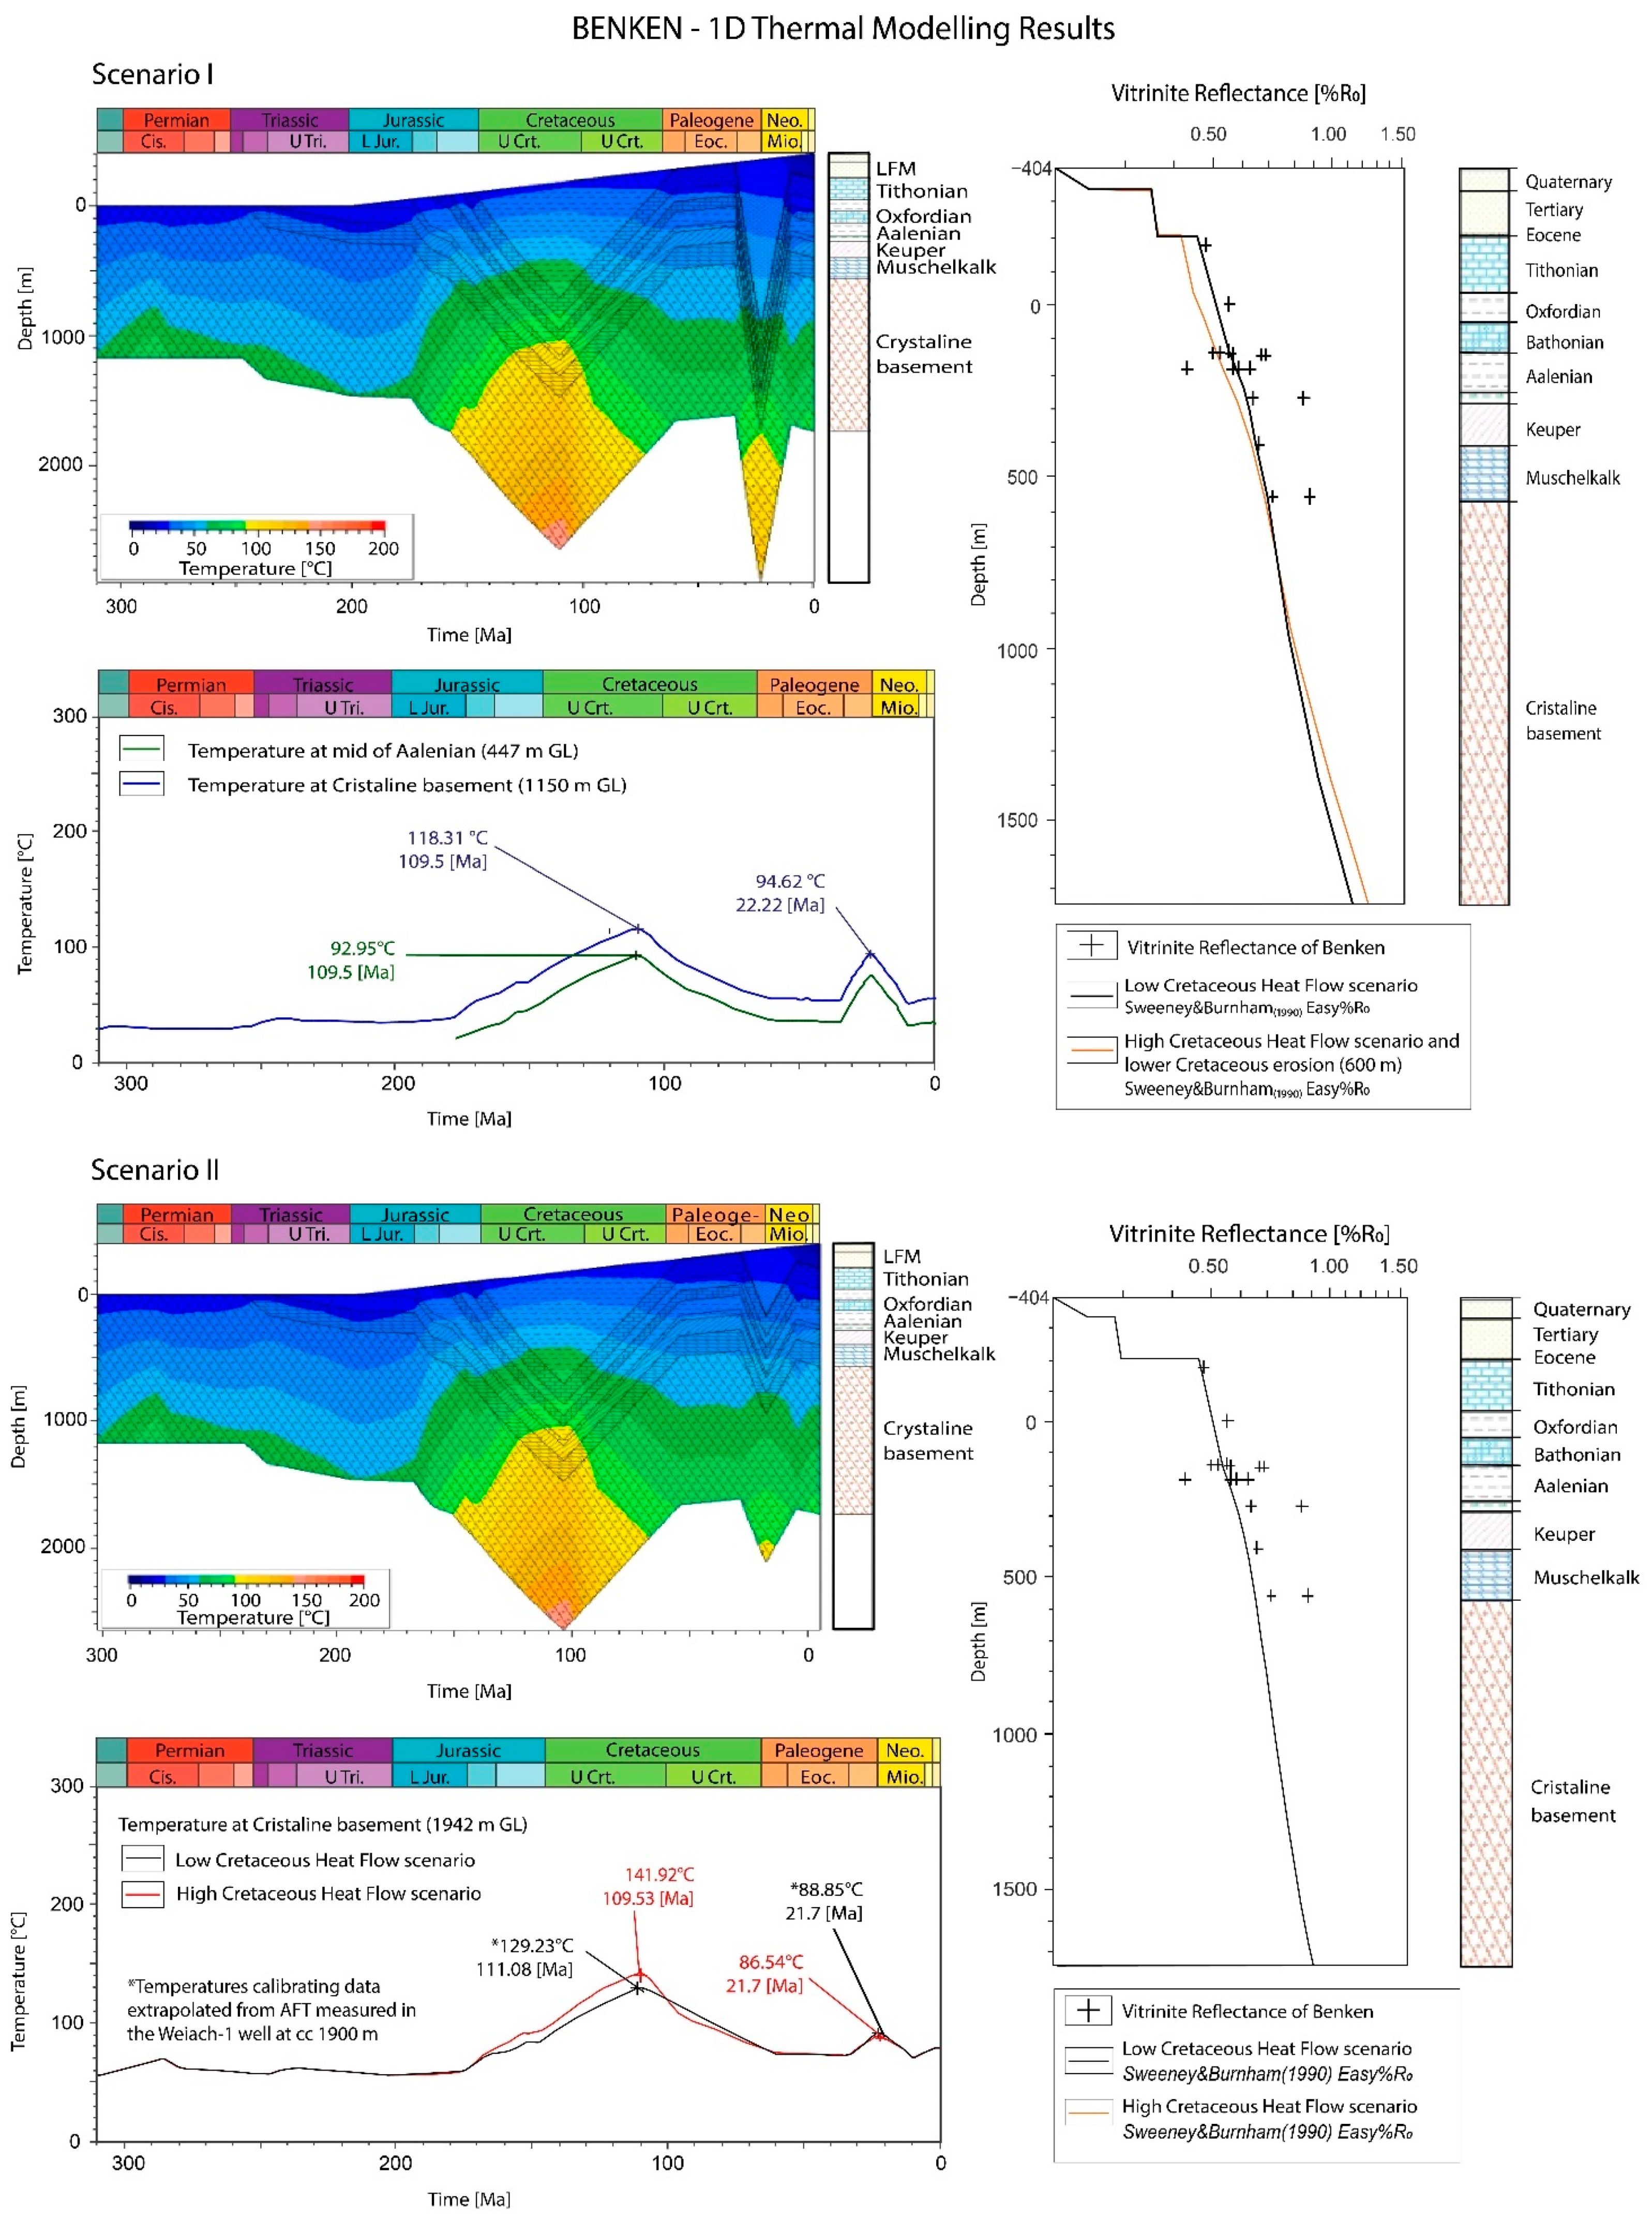
4.4. Benken-1 Well
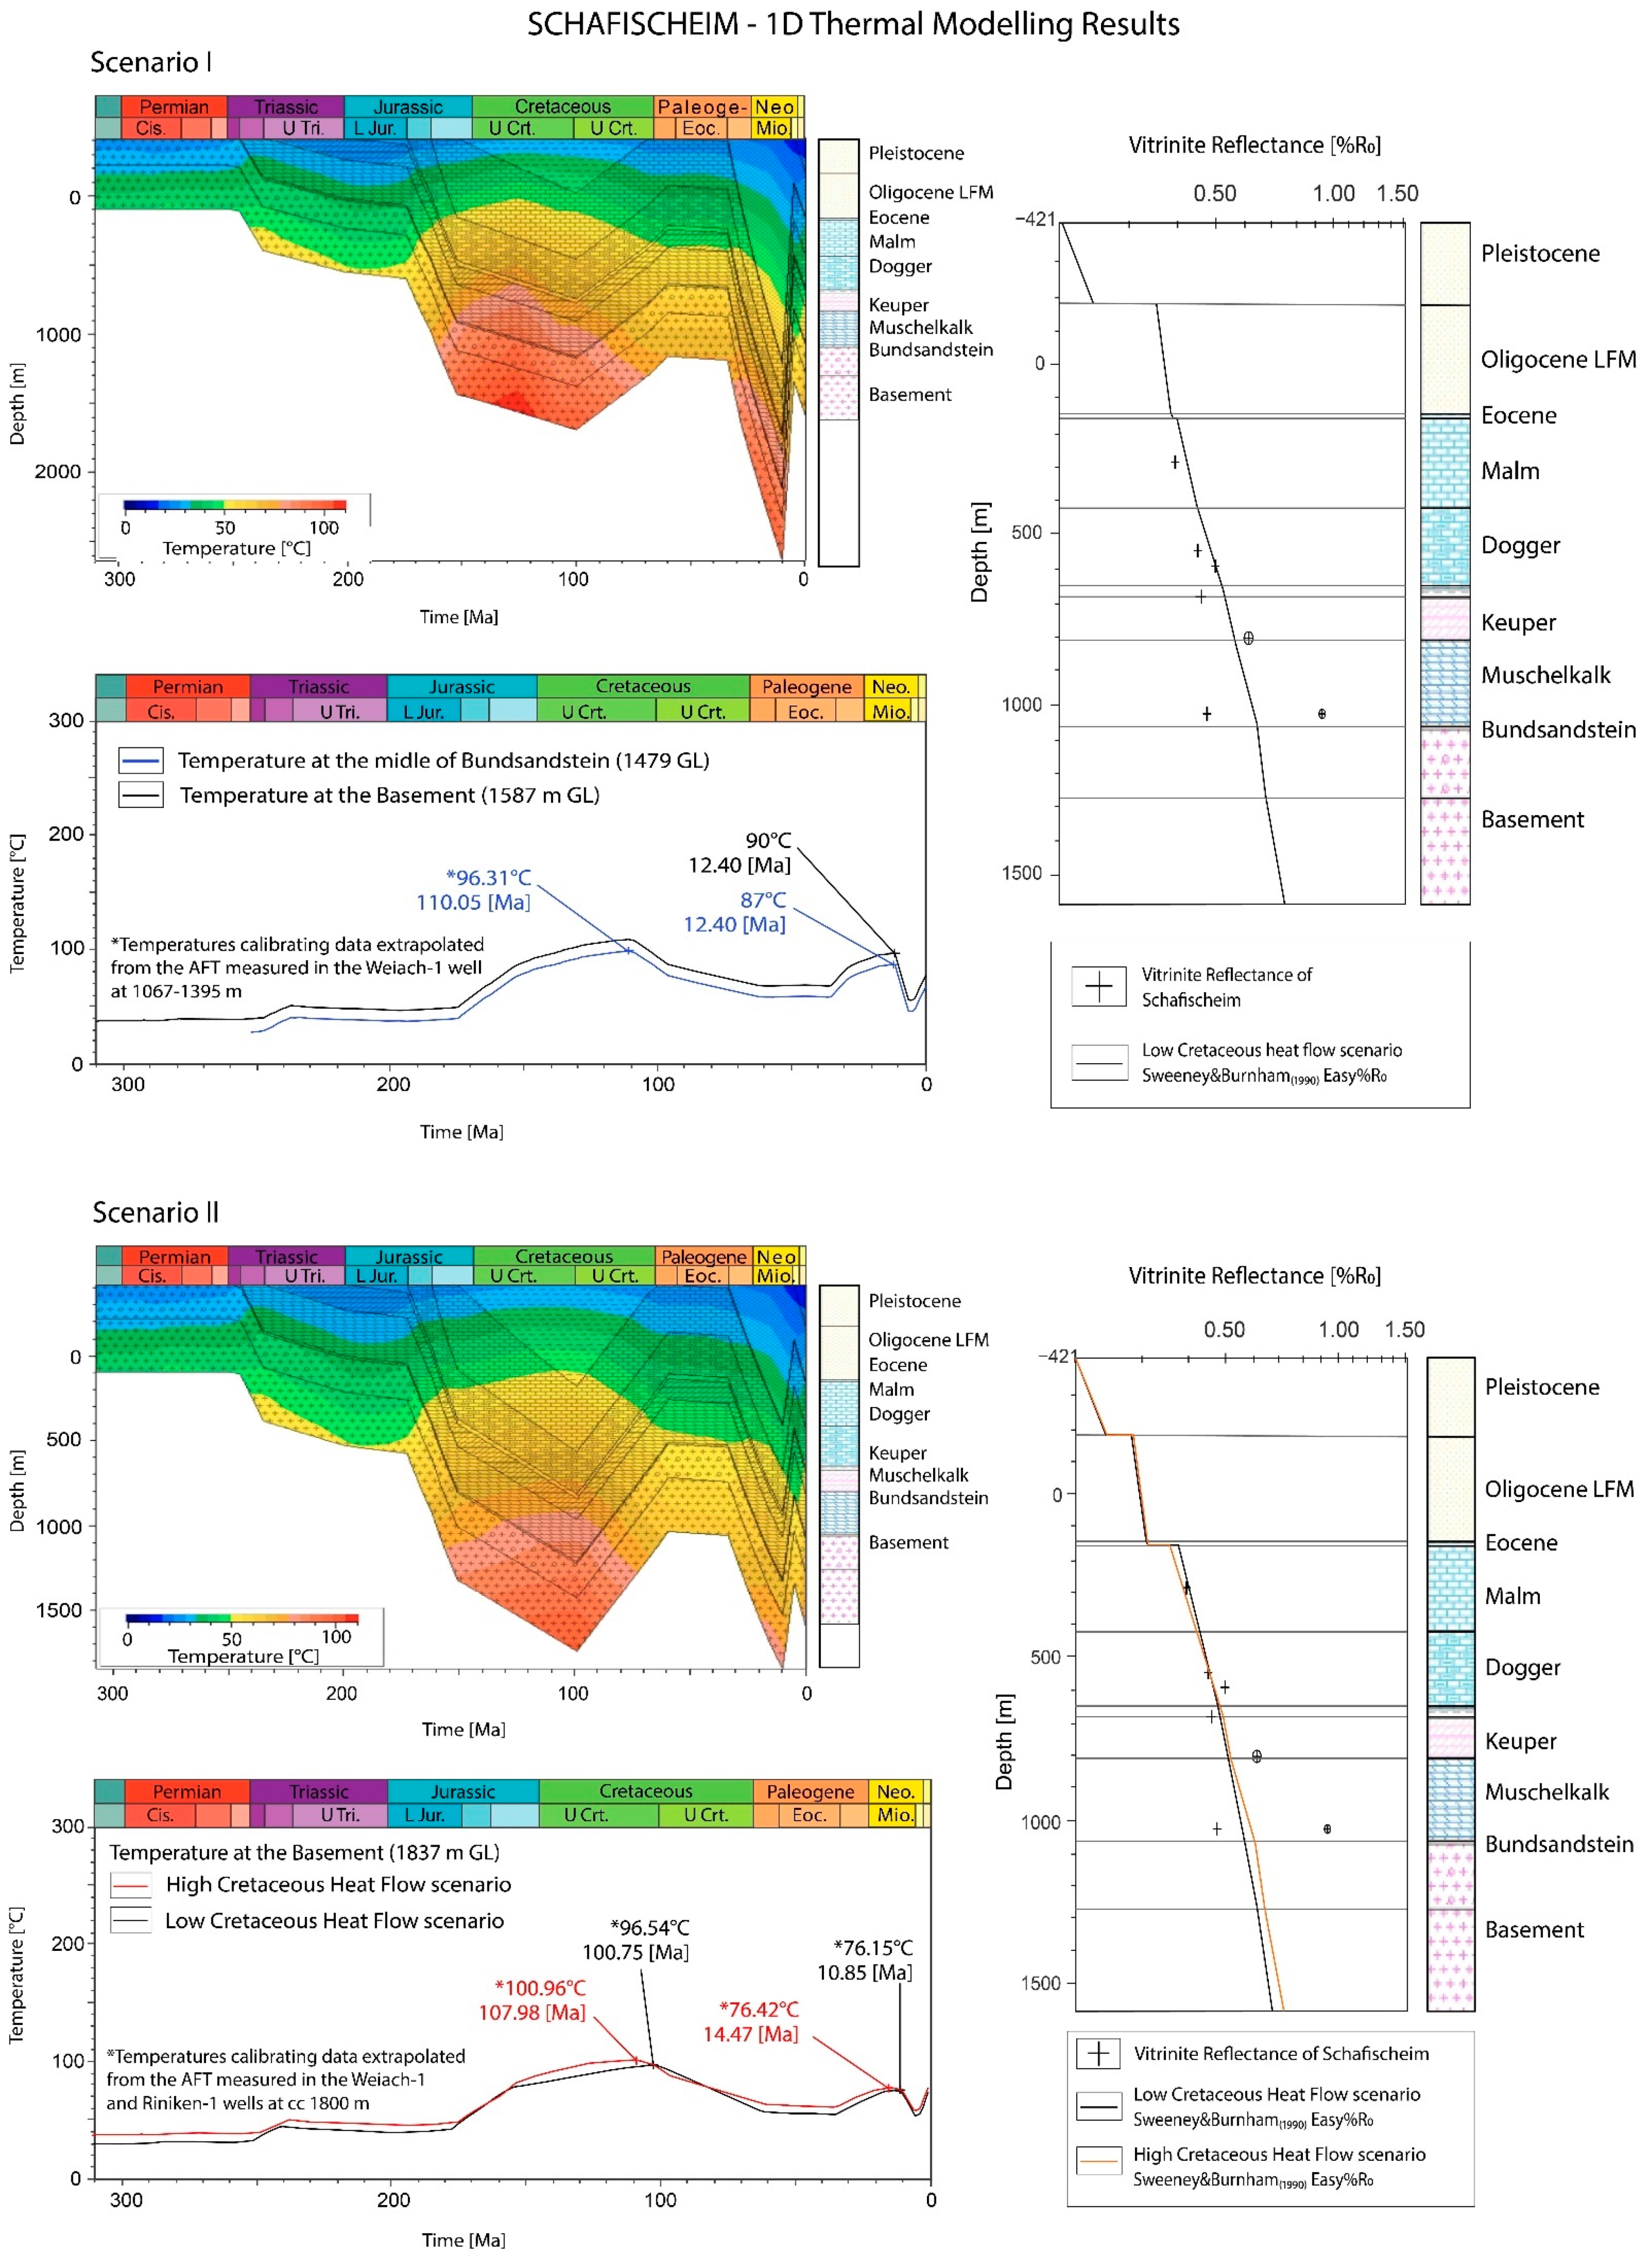
4.5. Schafisheim-1 Well
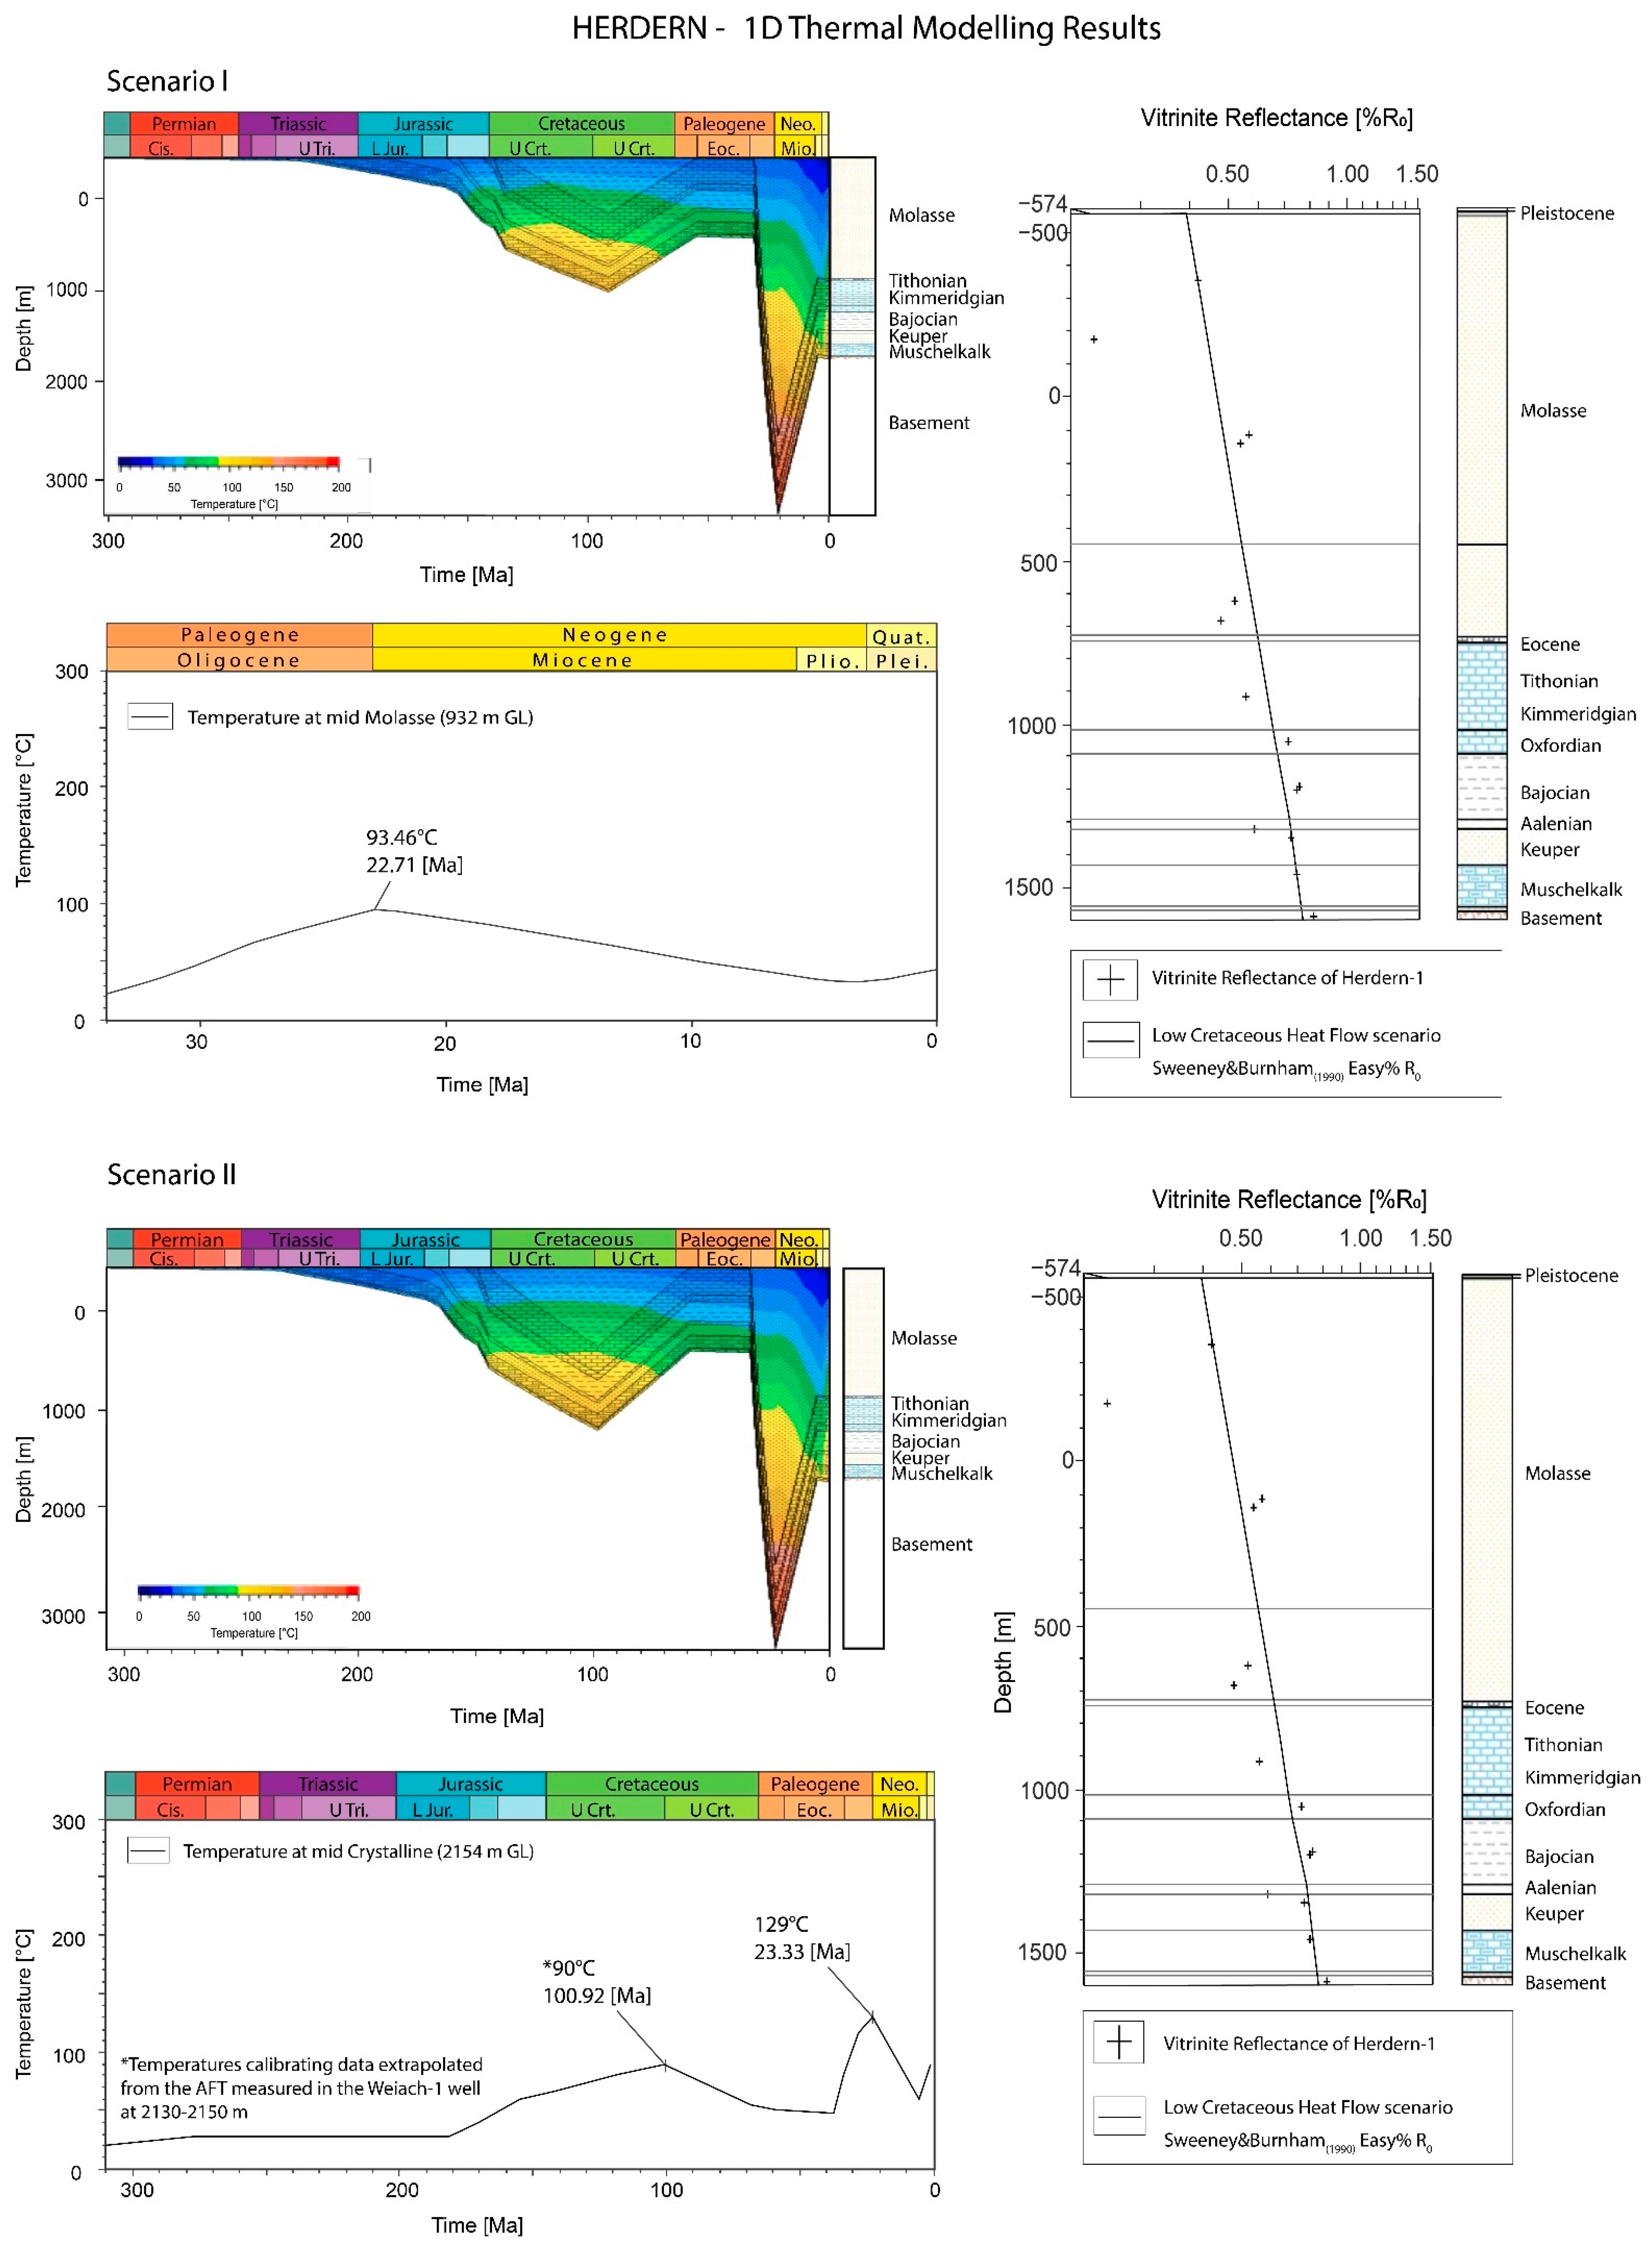
4.6. Herdern-1 Well
5. Discussion
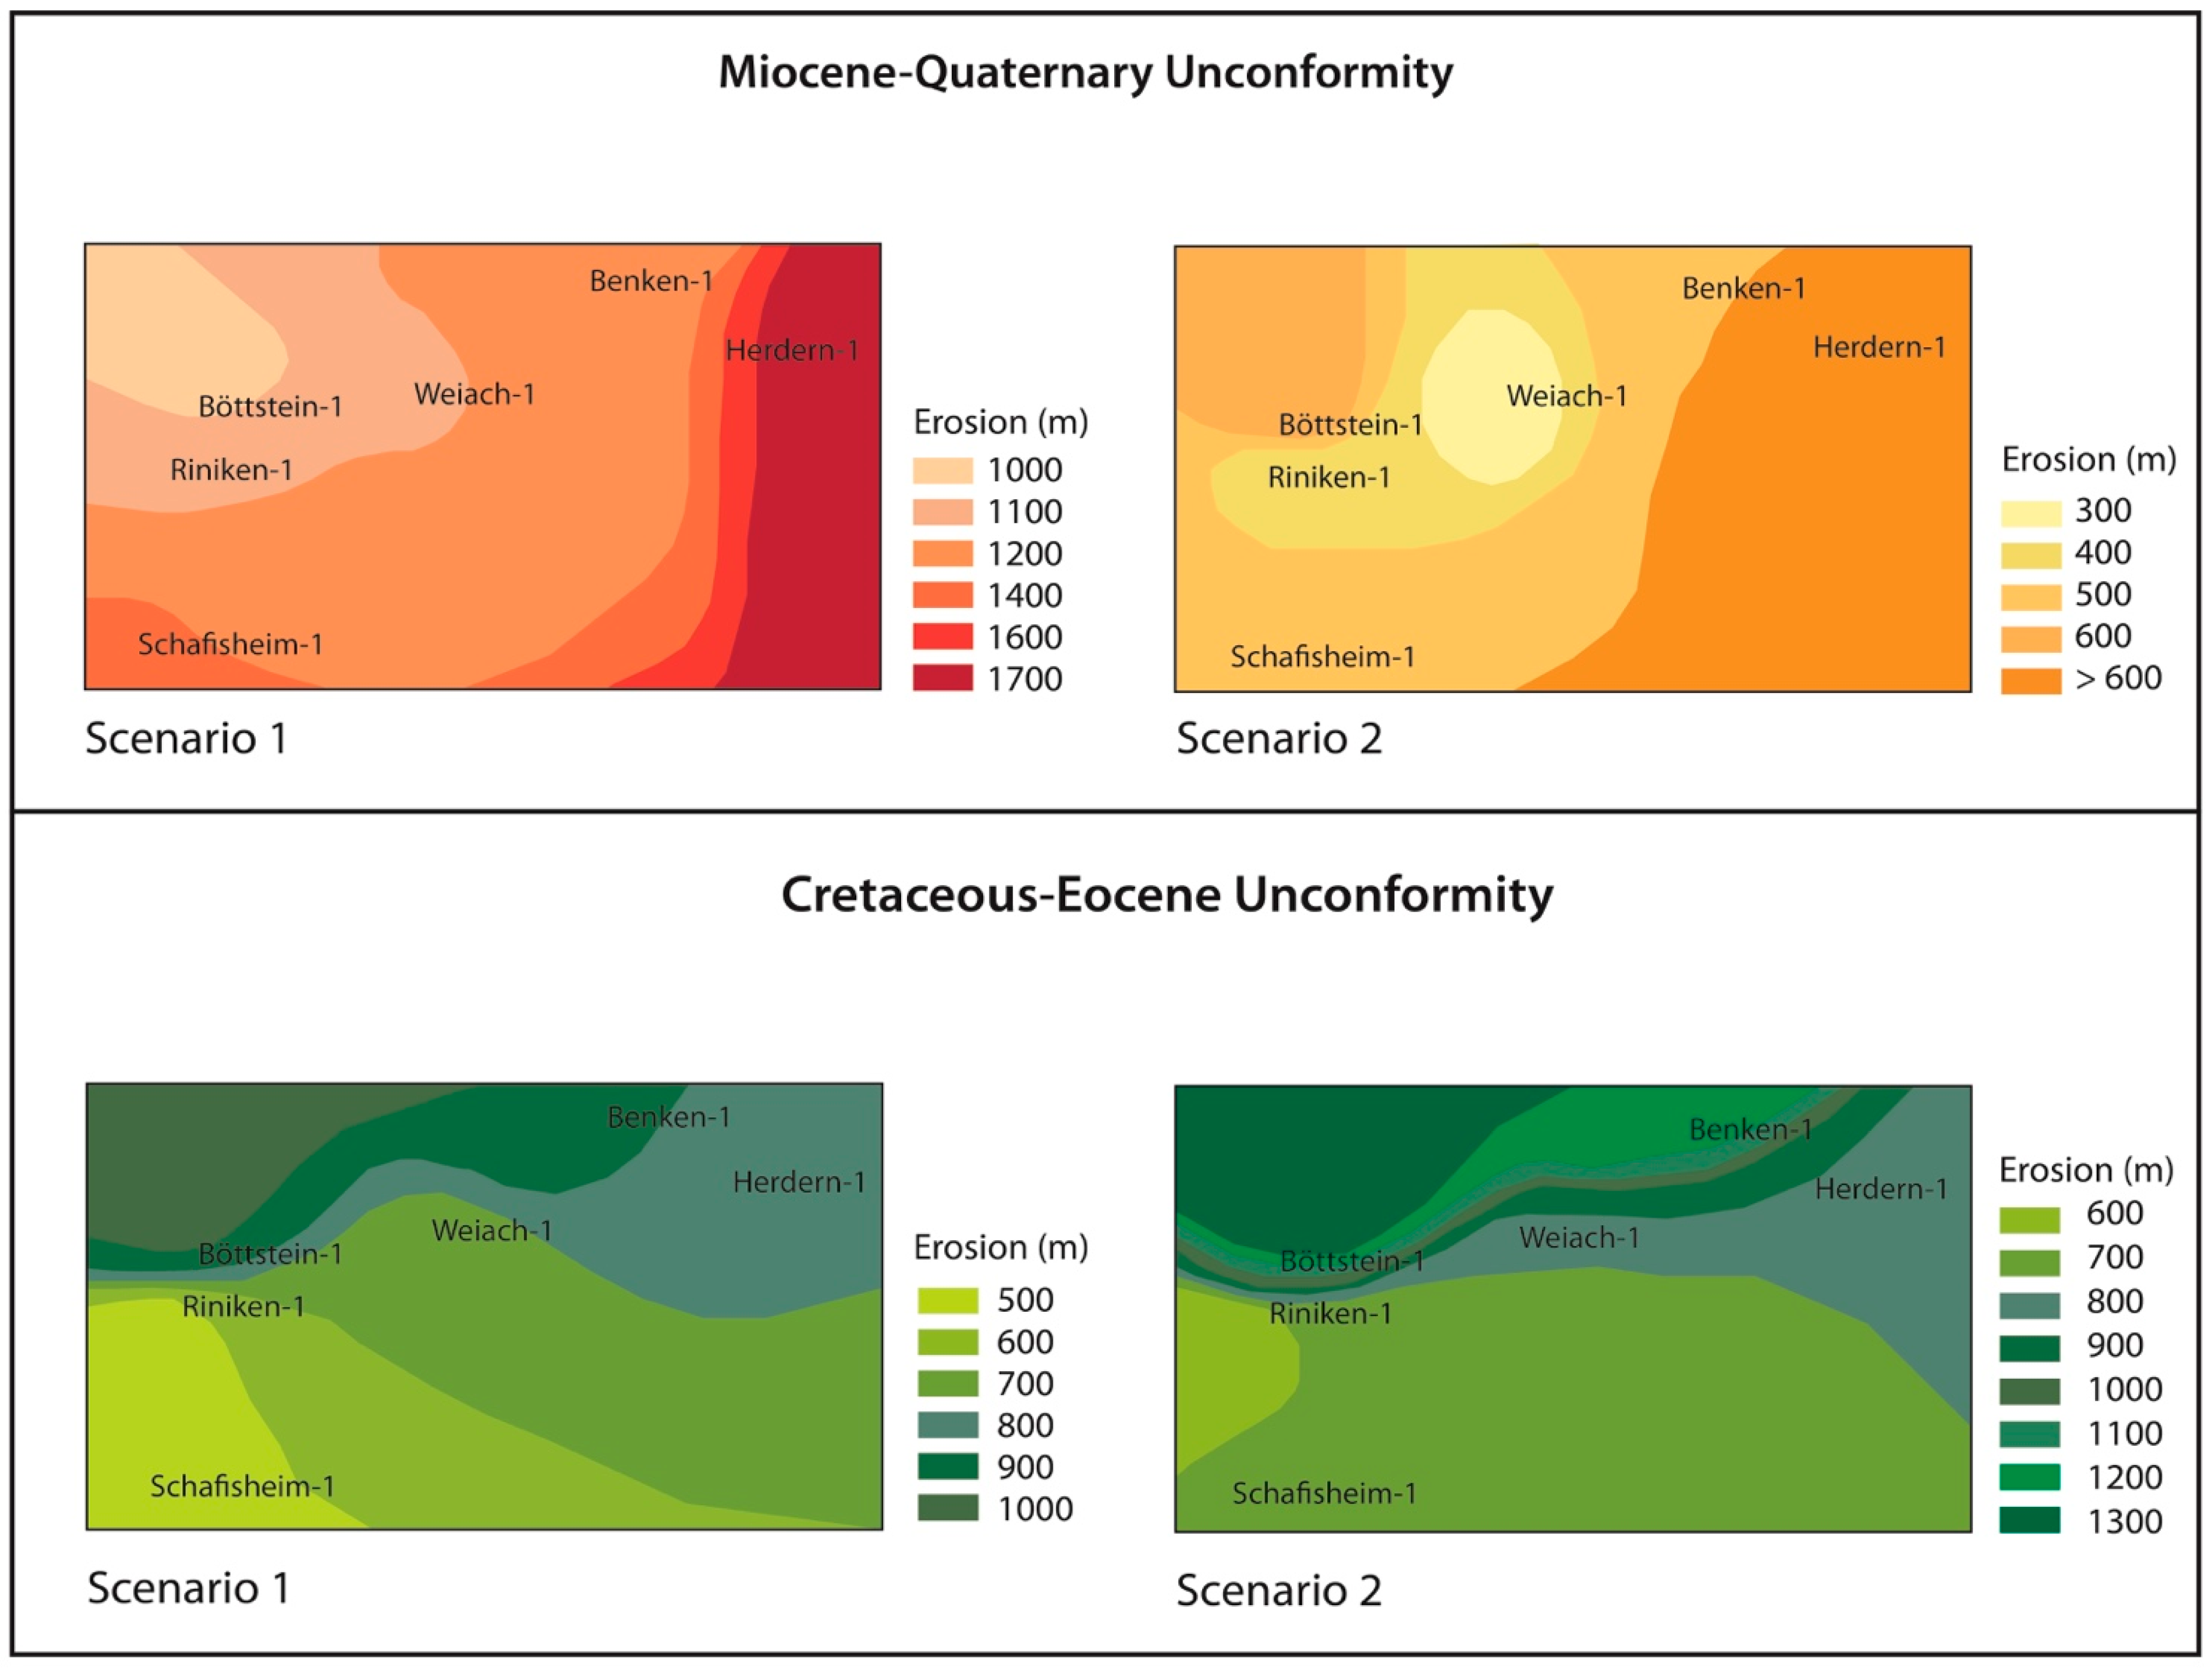
5.1. The Jurassic/Cretaceous-Eocene Unconformity
5.2. The Miocene-Quaternary Molasse Erosion
5.3. Modelling Results Uncertainties
6. Conclusions
Supplementary Materials
Author Contributions
Funding
Data Availability Statement
Acknowledgments
Conflicts of Interest
References
- Diebold, P.; Naef, H.; Ammann, M. Zur Tektonik Der Zentralen Nordschweiz, Nagra Technischer Bericht NTB; NAGRA: Wettingen, Switzerlan, 1991. [Google Scholar]
- SFOE. Energy Strategy 2050 Once the New Energy Act is in Force; Swiss Federal Office Of Energy: Bern, Switzerland, 2018. [Google Scholar]
- Schegg, R. Thermal Maturity of the Swiss Molasse Basin—Indications for Paleogeothermal Anomalies. Eclogae Geol. Helv. 1992, 85, 745–764. [Google Scholar]
- Schegg, R.; Leu, W. Analysis of erosion events and palaeogeothermal gradients in the North Alpine Foreland Basin of Switzerland. Geol. Soc. Lond. Spec. Publ. 1998, 141, 137–155. [Google Scholar] [CrossRef]
- Todorov, I.; Schegg, R.; Wildi, W. Thermal maturity and modelling of Mesozoic and Cenozoic sediments in the south of the Rhine Graben and the eastern Jura (Switzerland). Eclogae Geol. Helv. 1993, 86, 667–692. [Google Scholar]
- Mazurek, M.; Hurford, A.J.; Leu, W. Unravelling the multi-stage burial history of the Swiss Molasse Basin: Integration of apatite fission track, vitrinite reflectance and biomarker isomerisation analysis. Basin Res. 2006, 18, 27–50. [Google Scholar] [CrossRef]
- Brink, H.J.; Burri, J.P.; Lunde, A.; Winhard, H. Hydrocarbon habitat and potential of Swiss and German Molasse Basin: A comparison. Eclogae Geol. Helv. 1992, 85, 715–732. [Google Scholar]
- Lemcke, K. Vertikalbewegungen des vormesozoischen Sockels im nördlichen Alpenvorland vom Perm bis zur Gegenwart. Eclogae Geol. Helv. 1974, 67, 121–133. [Google Scholar]
- Monnier, F. Thermal diagenesis in the Swiss Molasse Basin: Implications for oil generation. Can. J. Earth Sci. 1982, 19, 328–342. [Google Scholar] [CrossRef]
- Timar-Geng, Z.; Fügenschuh, B.; Wetzel, A.; Dresmann, H. The low-temperature thermal history of northern Switzerland as revealed by fission track analysis and inverse thermal modelling. Eclogae Geol. Helv. 2006, 99, 255–270. [Google Scholar] [CrossRef] [Green Version]
- Cederbom, C.E.; Sinclair, H.D.; Schlunegger, F.; Rahn, M.K. Climate-induced rebound and exhumation of the European Alps. Geology 2004, 32, 709–712. [Google Scholar] [CrossRef]
- Cederbom, C.E.; Van Der Beek, P.; Schlunegger, F.; Sinclair, H.D.; Oncken, O. Rapid extensive erosion of the North Alpine foreland basin at 5-4 Ma. Basin Res. 2011, 23, 528–550. [Google Scholar] [CrossRef]
- Von Hagke, C.; Cederbom, C.E.; Oncken, O.; Stöckli, D.F.; Rahn, M.K.; Schlunegger, F. Linking the northern Alps with their foreland: The latest exhumation history resolved by low-temperature thermochronology. Tectonics 2012, 31, 1–25. [Google Scholar] [CrossRef]
- Kuhlemann, J.; Rahn, M. Plio-Pleistocene landscape evolution in Northern Switzerland. Swiss J. Geosci. 2013, 106, 451–467. [Google Scholar] [CrossRef]
- Villagomez, D.; Omodeo-Salé, S.; Ulyanov, A.; Moscariello, A. Insights into the thermal history of north-eastern Switzerland—Apatite fission track dating of deep drill core samples from the Swiss Jura mountains and the Swiss Molasse Basin. Geosciences 2020. In Press. [Google Scholar] [CrossRef]
- Littke, R.; Bayer, U.; Nelskamp, S. Dynamics of Complex Intracontinental Basins: The Central European Basin System; Springer: Berlin, Germany, 2008; ISBN 3540850856. [Google Scholar]
- Tissot, B.P.; Pelet, R.; Ungerer, P.H. Thermal history of sedimentary basins, maturation indices, and kinetics of oil and gas generation. AAPG Bull. 1987, 71, 1445–1466. [Google Scholar]
- Tissot, B.P.; Welte, D.H. Petroleum Formation and Occurrence; Springer Science & Business Media: Berlin, Germany, 2013. [Google Scholar]
- Welte, D.H.; Yukler, M.A. Petroleum origin and accumulation in basin evolution--A quantitative model. Am. Assoc. Pet. Geol. Bull. 1981, 65, 1387–1396. [Google Scholar]
- Welte, D.H.; Horsfield, B.; Baker, D.R. (Eds.) Petroleum and Basin Evolution: Insights from Petroleum Geochemistry, Geology and Basin Modeling; Springer: Berlin, Germany, 1997; ISBN 3540611282. [Google Scholar]
- Burkhard, M.; Sommaruga, A. Evolution of the western Swiss Molasse basin: Structural relations with the Alps and the Jura belt. Geol. Soc. Lond. Spec. Publ. 1998, 134, 279–298. [Google Scholar] [CrossRef]
- Pfiffner, O.A. Geology of the Alps; John Wiley & Sons: Hoboken, NJ, USA, 2014; ISBN 1118708113. [Google Scholar]
- Ziegler, P.A.; Schumacher, M.E.; Dèzes, P.; Van Wees, J.-D.; Cloetingh, S. Post-Variscan evolution of the lithosphere in the Rhine Graben area: Constraints from subsidence modelling. Geol. Soc. Lond. Spec. Publ. 2004, 223, 289–317. [Google Scholar] [CrossRef]
- Schönlaub, H.P. The biogeographic relationships of the Carboniferous of Austria. Ber. Geol. BA 1997, 40, 60–73. [Google Scholar]
- Stampfli, G.M.; Borel, G.D. A plate tectonic model for the Paleozoic and Mesozoic constrained by dynamic plate boundaries and restored synthetic oceanic isochrons. Earth Planet. Sci. Lett. 2002, 196, 17–33. [Google Scholar] [CrossRef]
- Wildi, W.; Funk, H.; Loup, B.F.R.; Amato, E.; Huggenberger, P. Mesozoic subsidence history of the European marginal shelves of the alpine Tethys (Helvetic realm, Swiss Plateau and Jura). Eclogae Geol. Helv. 1989, 82, 817–840. [Google Scholar]
- Dickinson, W.R. Plate tectonics and sedimentation. In Tectonic and Sedimentation; Dickinson, W.R., Ed.; Springer: Berlin/Heidelberg, Germany, 1974; pp. 1–27. [Google Scholar]
- Kuhlemann, J.; Kempf, O. Post-Eocene evolution of the North Alpine Foreland Basin and its response to Alpine tectonics. Sediment. Geol. 2002, 152, 45–78. [Google Scholar] [CrossRef]
- Stampfli, G.M.; Marchant, R.H. Geodynamic evolution of the Tethyan margins of the Western Alps. Deep Struct. Swiss Alps-Results NRP 1997, 20, 223–239. [Google Scholar]
- Allen, P.A.; Crampton, S.L.; Sinclair, H.D. The inception and early evolution of the North Alpine Foreland Basin, Switzerland. Basin Res. 1991, 3, 143–163. [Google Scholar] [CrossRef]
- Turcotte, D.; Schubert, G. Geodynamics; Cambridge University Press: Cambridge, UK, 2014; ISBN 1139915851. [Google Scholar]
- Allen, P.A.; Homewood, P.; Williams, G.D. Foreland basins: An introduction. In Foreland Basins; Blackwall Scientific Pubblication: Oxford, UK, 1986; Volume 8, pp. 3–12. [Google Scholar]
- Bachmann, G.H.; Müller, M.; Weggen, K. Evolution of the Molasse Basin (Germany, Switzerland). Tectonophysics 1987, 137, 77–92. [Google Scholar] [CrossRef]
- Lemcke, K. Das bayerische Alpenvorland vor der Eiszeit. Geologie von Bayern I; E. Schweizerbart’sche Verlagsbuchhandlung: Stuttgart, Switzerland, 1988. [Google Scholar]
- Schlunegger, F.; Jordan, T.E.; Klaper, E.M. Controls of erosional denudation in the orogen on foreland basin evolution: The Oligocene central Swiss Molasse Basin as an example. Tectonics 1997, 16, 823–840. [Google Scholar] [CrossRef] [Green Version]
- Schlunegger, F.; Willett, S. Spatial and temporal variations in exhumation of the central Swiss Alps and implications for exhumation mechanisms. Geol. Soc. Lond. Spec. Publ. 1999, 154, 157–179. [Google Scholar] [CrossRef]
- Burkhard, M. Aspects of the large-scale Miocene deformation in the most external part of the Swiss Alps (Subalpine Molasse to Jura fold belt). Eclogae Geol. Helv. 1990, 83, 559–583. [Google Scholar]
- Laubscher, H.-P. Ein kinematisches Modell der Jurafaltung. Eclogae Geol. Helv. 1965, 58, 232–318. [Google Scholar]
- Philippe, Y.; Colletta, B.; Deville, E.; Mascle, A. The Jura fold-and-thrust belt: A kinematic model based on map-balancing. In Memoires du Museum National d’Histoire Naturelle; Ziegler, P.A., Horvath, F., Eds.; Editions du Muséum: Paris, France, 1996; Volume 170, pp. 235–261. [Google Scholar]
- Willett, S.D.; Schlunegger, F. The last phase of deposition in the Swiss Molasse Basin: From foredeep to negative-alpha basin. Basin Res. 2010, 22, 623–639. [Google Scholar] [CrossRef]
- Diebold, H.P. Der Nordschweizer Permokarbon-Trog und die Steinkohlenfrage der Nordschweiz. Vierteljahrsschr. Nat. Ges. Zürich 1988, 133, 143–174. [Google Scholar]
- Beck, C.; Deville, E.; Blanc, E.; Philippe, Y.; Tardy, M. Horizontal shortening control of Middle Miocene marine siliciclastic accumulation (Upper Marine Molasse) in the southern termination of the Savoy Molasse Basin (northwestern Alps/southern Jura). Geol. Soc. Lond. Spec. Publ. 1998, 134, 263. [Google Scholar] [CrossRef]
- Philippe, Y.; Deville, E.; Mascle, A. Thin-skinned inversion tectonics at oblique basin margins: Example of the western Vercors and Chartreuse Subalpine massifs (SE France). Geol. Soc. Lond. Spec. Publ. 1998, 134, 239–262. [Google Scholar] [CrossRef]
- Thury, M.; Gautschi, A.; Mazurek, M.; Müller, W.H.; Naef, H.; Pearson, F.J.; Vomvoris, S.; Wilson, W. Geology and hydrogeology of the crystalline basement of Northern Switzerland. In Nagra Tech. Ber. NTB 93-01; NAGRA: Wettingen, Switzerland, 1994; pp. 1–93. [Google Scholar]
- Hurford, A.J. Fission Track Analysis of Apatite from the Nagra Boreholes of Büttstein, Weiach, Schafisheim and Riniken, Northern Switzerland; NAGRA Internal Report; NAGRA: Wettingen, Switzerland, 1993. [Google Scholar]
- Timar-Geng, Z.; Fügenschuh, B.; Schaltegger, U.; Wetzel, A. The Impact of the Jurassic Hydrothermal activity on Zircon Fission Track Data from the Southern Upper Rhine Graben Area. Schweizerische Mineralogische und Petrographische Mitteilungen 2004, 84, 257–269. [Google Scholar]
- Matter, A.; Peters, T.; Bläsi, H.R.; Schenker, F.; Weiss, H.P. Sondierbohrung Schafisheim—Geologie. NAGRA Tech. Rep. 1988, NTB 86-03, 348. [Google Scholar]
- Vollmayr, T. Temperaturmessungen in Erdölbohrungen der Schweiz. Bull. Schweiz. Ver. Pet. Geol. Ing. 1983, 49, 15–27. [Google Scholar]
- Peters, T.; Matter, A.; Bläsi, H.R.; Gautschi, A. Sondierbohrung Böttstein—Geologie. NAGRA Tech. Rep. 1987, NTB 85-02, 132. [Google Scholar]
- Thury, M. Sondierbohrung Weiach Untersuchungsbericht. NAGRA Tech. Rep. 1989, NTB-88-08, 243. [Google Scholar]
- Macek, A.; Gassier, W. Sondierbohrung Benken. Bohrtechnik. NAGRA Tech. Rep. 2001, NTB 99-12, 89. [Google Scholar]
- Matter, A.; Peters, T.; Isenschmid, C.; Blaesi, H.R.; Ziegler, H.J. Sondierbohrung Riniken. Geologie. NAGRA Tech. Rep. 1987, NTB 86-02, 211. [Google Scholar]
- Wygrala, B.P. Integrated computer-aided basin modeling applied to analysis of hydrocarbon generation history in a Northern Italian oil field. Org. Geochem. 1988, 13, 187–197. [Google Scholar] [CrossRef]
- Allen, P.A.; Allen, J.R. Basin Analysis: Principles and Applications; Blackwell: Oxford, UK, 2017; ISBN 144430920X. [Google Scholar]
- Royden, L.; Keen, C.E. Rifting process and thermal evolution of the continental margin of eastern Canada determined from subsidence curves. Earth Planet. Sci. Lett. 1980, 51, 343–361. [Google Scholar] [CrossRef]
- Poelchau, H.S.; Baker, D.R.; Hantschel, T.; Horsfield, B.; Wygrala, B. Basin simulation and the design of the conceptual basin model. In Petroleum and Basin Evolution; Welte, D.H., Horsfield, B., Baker, D.R., Eds.; Springer: Berlin/Heidelberg, Germany, 1997; pp. 3–70. ISBN 3540611282. [Google Scholar]
- Yalçin, M.N.; Littke, R.; Sachsenhofer, R.F. Thermal history of sedimentary basins. In Petroleum and Basin Evolution; Welte, D.H., Horsfield, B., Baker, D.R., Eds.; Springer: Berlin/Heidelberg, Germany, 1997; pp. 71–167. ISBN 3540611282. [Google Scholar]
- Loup, B.; Wildi, W. Subsidence analysis in the Paris Basin: A key to Northwest European intracontinental basins? Basin Res. 1994, 6, 159–177. [Google Scholar] [CrossRef]
- Marchant, R.; Ringgenberg, Y.; Stampfli, G.; Birkhäuser, P.; Roth, P.; Meier, B. Paleotectonic evolution of the Zürcher Weinland (northern Switzerland), based on 2D and 3D seismic data. Eclogae Geol. Helv. 2005, 98, 345–362. [Google Scholar] [CrossRef] [Green Version]
- Ziegler, P.A. Late Cretaceous and Cenozoic intra-plate compressional deformations in the Alpine foreland—A geodynamic model. Tectonophysics 1987, 137, 389–420. [Google Scholar] [CrossRef]
- Royden, L. A simple method for analyzing subsidence and heat flow in extensional basins. Therm. Modeling Sediment. Basins Thechnip 1986, 49–73. [Google Scholar]
- Omodeo-Salé, S.; Eruteya, O.E.; Cassola, T.; Beniasad, A.; Moscariello, A. A basin thermal modelling approach to mitigate geothermal energy exploration risks: The St. Gallen study-case (eastern Switzerland). Geothermics 2020, 87, 101876. [Google Scholar] [CrossRef]
- Handy, M.R.; Schmid, S.M.; Bousquet, R.; Kissling, E.; Bernoulli, D. Reconciling plate-tectonic reconstructions of Alpine Tethys with the geological–geophysical record of spreading and subduction in the Alps. Earth Sci. Rev. 2010, 102, 121–158. [Google Scholar] [CrossRef]
- Loup, B. Mesozoic subsidence and stretching models of the lithosphere in Switzerland. Eclogae Geol. Helv. 1992, 85, 541–572. [Google Scholar]
- Stampfli, G.M. Le Briançonnais, terrain exotique dans les Alpes? Eclogae Geol. Helv. 1993, 86, 1–45. [Google Scholar]
- Ziegler, P.A.; Bertotti, G.; Cloetingh, S. Dynamic processes controlling foreland development–the role of mechanical (de) coupling of orogenic wedges and forelands. EGU Stephan Mueller Spec. Publ. Ser. 2002, 1, 17–56. [Google Scholar] [CrossRef]
- Rybach, L.; Eugster, W.; Griesser, J. Die geothermischen Verhältnisse in der Nordschweiz. Eclogae Geol. Helv. 1987, 80, 521–534. [Google Scholar]
- Griesser, J.-C.; Rybach, L. Numerical Thermohydraulic Modeling of Deep Groundwater Circulation in Crystalline Basement: An Example of Calibration. In Hydrogeological Regimes and Their Subsurface Thermal Effects; American Geophysical Union, Geophysical Monograph Series: Washington, WA, USA, 1989; Volume 47, pp. 65–74. [Google Scholar]
- NAGRA. Technischer Bericht 88-11—Sondierbohrung Schafisheim Untersuchungsbericht, Beilagenband; NAGRA: Wettingen, Switzerland, 1992. [Google Scholar]
- NAGRA. Technischer Bericht 02-03—Project Opalinuston, Synthese der Geowissenschaftlichen Unersuchungsergebnisse; NAGRA: Wettingen, Switzerland, 2002. [Google Scholar]
- NAGRA. Technischer Bericht 85-01.Sondierbohrung Böttstein Untersuchungsbericht—Beilagenband A.; NAGRA: Baden, Switzerland, 1985. [Google Scholar]
- NAGRA. Technischer Bericht 00-01—Sondierbohrung Benken Untersuchungsbericht; NAGRA: Wettingen, Switzerland, 2001. [Google Scholar]
- Teichmüller, M.; Teichmüller, R. Fundamentals of Coal Petrology. In Stach’s Textbook of Coal Petrology. Gebrüder Borntraeger, Berlin, 3rd ed.; Stach, E., Mackowsky, M.-T., Teichmüller, M., Taylor, G.H., Chandra, D., Techmüller, R., Eds.; Gebrüder Borntraeger: Stuttgart, Germany, 1982; pp. 5–86. [Google Scholar]
- Taylor, G.H.; Teichmüler, M.; Davis, A.; Diessel, C.F.K.; Littke, R.; Robert, P. Organic Petrology; Gebrüder Borntraeger: Stuttgart, Germany, 1998; ISBN 3-443-01036-9. [Google Scholar]
- Sweeney, J.J.; Burnham, A.K. Evaluation of a Simple Model of Vitrinite Reflectance Based on Chemical Kinetics (1). Am. Assoc. Pet. Geol. Bull. 1990, 74, 1559–1570. [Google Scholar]
- Madritsch, H.; Naef, H.; Meier, B.; Franzke, H.J.; Schreurs, G. Architecture and Kinematics of the Constance-Frick Trough (Northern Switzerland): Implications for the Formation of Post-Variscan Basins in the Foreland of the Alps and Scenarios of Their Neogene Reactivation. Tectonics 2018, 37, 2197–2220. [Google Scholar] [CrossRef]
- De Graciansky, P.-C.; Roberts, D.G.; Tricart, P. The Western Alps, from Rift to Passive Margin to Orogenic Belt: An Integrated Geoscience Overview; Elsevier: Amsterdam, The Netherlands, 2010; Volume 14, ISBN 0444537252. [Google Scholar]
- Stampfli, G.M.; Borel, G.D.; Marchant, R.; Mosar, J. Western Alps geological constraints on western Tethyan reconstructions. J. Virtual Explor. 2002, 8, 75–104. [Google Scholar] [CrossRef] [Green Version]
- Trümpy, R.; Aubert, D.; Bernoulli, D. Geology of Switzerland: Geological Excursions; Interbook: West Hollywood, CA, USA, 1980; Volume 10, ISBN 3859770632. [Google Scholar]
- Weissert, H.J.; Bernoulli, D. A transform margin in the Mesozoic Tethys: Evidence from the Swiss Alps. Geol. Rundsch. 1985, 74, 665–679. [Google Scholar] [CrossRef]
- Rosenbaum, G.; Lister, G.S.; Duboz, C. Relative motions of Africa, Iberia and Europe during Alpine orogeny. Tectonophysics 2002, 359, 117–129. [Google Scholar] [CrossRef]
- Von Tavel, H. Stratigraphie der Balmhorngruppe mit Einschluss des Gemmipasses (Berner Oberland). Mitt. Nat. Ges. Bern 1937, 2, 43–120. [Google Scholar]
- Weidmann, M. Paléokarst éocene dans l’Autochthone chablaisien (VS et VD). Bull. Murithienne 1984, 102, 119–127. [Google Scholar]
- Crampton, S.L.; Allen, P.A. Recognition of forebulge unconformities associated with early stage foreland basin development; example from the North Alpine foreland basin. Am. Assoc. Pet. Geol. Bull. 1995, 79, 1495–1514. [Google Scholar]
- Sinclair, H.D.; Allen, P.A. Vertical versus horizontal motions in the Alpine orogenic wedge: Stratigraphic response in the foreland basin. Basin Res. 1992, 4, 215–232. [Google Scholar] [CrossRef]
- Kempf, O.; Pfiffner, O.A. Early Tertiary evolution of the North Alpine Foreland Basin of the Swiss Alps and adjoining areas. Basin Res. 2004, 16, 549–567. [Google Scholar] [CrossRef]
- Pfiffner, O.A. Evolution of the North Alpine Foreland Basin in the Central Alps. In Foreland Basins; Blackwell Publishing Ltd.: Hoboken, NJ, USA, 1986; pp. 219–228. ISBN 9781444303810. [Google Scholar]
- Schmid, S.M.; Pfiffner, O.A.; Froitzheim, N.; Schönborn, G.; Kissling, E. Geophysical-geological transect and tectonic evolution of the Swiss-Italian Alps. Tectonics 1996, 15, 1036–1064. [Google Scholar] [CrossRef] [Green Version]
- Bachmann, G.H.; Müller, M. Sedimentary and structural evolution of the German Molasse Basin. Eclogae Geol. Helv. 1992, 85, 519–530. [Google Scholar]
- Kälin, B.; Rybach, L.; Kempter, E.H.K. Rates of Deposition, Uplift and Erosion in the Swiss Molasse Basin, Estimated from Sonic- and Density—Logs. Bull. Swiss. Assoc. Pet. Geol. Eng. 1992, 58, 9–22. [Google Scholar]
- Dèzes, P.; Schmid, S.M.; Ziegler, P.A. Evolution of the European Cenozoic Rift System: Interaction of the Alpine and Pyrenean orogens with their foreland lithosphere. Tectonophysics 2004, 389, 1–33. [Google Scholar] [CrossRef]
- Ziegler, P.A. European Cenozoic rift system. Tectonophysics 1992, 208, 91–111. [Google Scholar] [CrossRef]
- Al-Hajeri, M.M.; Al Saeed, M.; Derks, J.; Fuchs, T.; Hantschel, T.; Kauerauf, A.; Neumaier, M.; Schenk, O.; Swientek, O.; Tessen, N. Basin and petroleum system modeling. Oilf. Rev. 2009, 21, 14–29. [Google Scholar]
- Hurford, A.J. An Historical Perspective on Fission-Track Thermochronology. In Fission-Track Thermochronology and its Application to Geology; Springer: Cham, Switzerland, 2019; pp. 3–23. [Google Scholar]
- Gallagher, K. Evolving temperature histories from apatite fission-track data. Earth Planet. Sci. Lett. 1995, 136, 421–435. [Google Scholar] [CrossRef]
- Laslett, G.M.; Green, P.F.; Duddy, I.R.; Gleadow, A.J.W. Thermal annealing of fission tracks in apatite 2. A quantitative analysis. Chem. Geol. Isot. Geosci. Sect. 1987, 65, 1–13. [Google Scholar] [CrossRef]
- Ketcham, R.A.; Donelick, R.A.; Carlson, W.D. Variability of apatite fission-track annealing kinetics: III. Extrapolation to geological time scales. Am. Mineral. 1999, 84, 1235–1255. [Google Scholar] [CrossRef]
- Ketcham, R.A.; Carter, A.; Donelick, R.A.; Barbarand, J.; Hurford, A.J. Improved modeling of fission-track annealing in apatite. Am. Mineral. 2007, 92, 799–810. [Google Scholar] [CrossRef]
- Donelick, R.A. Method of Fission Track Analysis Utilizing Bulk Chemical Etching of Apatite. U.S. Patent 5,267,274, 30 November 1993. [Google Scholar]


| Wells/Formation | Age (My) | Thickness | Lithologies (%) | ||||
|---|---|---|---|---|---|---|---|
| From | To | Sandstone | Shale | Limestone | Evaporite | ||
| Schaffischeim-1 | |||||||
| Molasse | 2.58 | 56 | 575 | 77 | 23 | - | - |
| Upper Jurassic | 152.1 | 157.3 | 264 | - | 20 | 80 | - |
| Lower Jurassic | 163.5 | 166.1 | 266 | - | 59 | 41 | - |
| Keuper | 201.3 | 237 | 122 | - | 35 | 50 | 15 |
| Mushelkalk | 237 | 247.2 | 262 | 4 | 10 | 53 | 33 |
| Bundsandstein | 247.2 | 251.9 | 12 | 100 | - | - | - |
| Riniken-1 | |||||||
| Upper Jurassic | 145 | 163.5 | 185 | 5 | 5 | 90 | - |
| Lower Jurassic | 166.1 | 201.3 | 279 | - | 86 | 14 | - |
| Keuper | 201.3 | 237 | 127 | 4 | 39 | 42 | 15 |
| Mushelkalk | 237 | 247.2 | 200 | 11 | 18 | 44 | 27 |
| Bundsandstein | 247.2 | 251.9 | 12 | 100 | - | - | - |
| Upper Permian | 272 | 298 | - | 90 | 10 | - | - |
| Böttstein | |||||||
| Keuper | 201.3 | 237 | 105 | 14 | 55 | 21 | 10 |
| Mushelkalk | 237 | 247.2 | 185 | 6 | 15 | 59 | 21 |
| Bundsandstein | 247.2 | 251.9 | 8 | 100 | - | - | - |
| Weiach-1 | |||||||
| Molasse | 2.58 | 56 | 186 | 82 | 9 | 9 | - |
| Upper Malm | 152.1 | 157.3 | 130 | - | - | 100 | - |
| Lower Malm | 157.3 | 163.5 | 162 | 1 | 55 | 44 | - |
| Lower Jurassic | 163.5 | 201.3 | 226 | - | 82 | 18 | - |
| Triassic | 201.3 | 251.9 | 278 | - | 20 | 75 | 5 |
| Permian | 251.9 | 298.9 | 483 | 97 | 3 | - | - |
| Carboniferous | 298.9 | 358.9 | 545 | 50 | 50 | - | - |
| Benken-1 | |||||||
| Molasse | 2,58 | 56 | 199 | 75 | 10 | 15 | - |
| Upper Malm | 145 | 152,1 | 162 | 5 | - | 95 | - |
| Lower Malm | 157,3 | 163,5 | 134 | 1 | 55 | 44 | - |
| Bathonian/Bajocian | 166,1 | 170,3 | 87 | 50 | - | 50 | - |
| Aalenian/Lias | 170,3 | 201,3 | 151 | - | 64 | 36 | - |
| Keuper | 201,3 | 237 | 119 | 40 | - | - | 60 |
| Mushelkalk | 237 | 247,2 | 164 | 10 | 30 | 40 | 18 |
| Bundsandstein | 247,2 | 251,9 | 8 | 100 | - | - | - |
| Herdern-1 | |||||||
| Molasse | 2.58 | 56 | 1305 | 75 | 10 | 15 | - |
| Upper Malm | 145 | 157.3 | 272 | 7 | - | 93 | - |
| Lower Malm | 157.3 | 163.5 | 72 | - | 35 | 65 | - |
| Dogger | 168.3 | 174.1 | 198 | - | 85 | 15 | - |
| Lias | 174.1 | 201.3 | 38 | - | 95 | 5 | - |
| Keuper | 201.3 | 237 | 111 | 38 | 24 | 6 | 32 |
| Mushelkalk | 237 | 247.2 | 190 | - | 15 | 65 | 20 |
| Bundsandstein | 247.2 | 251.9 | 13 | 100 | - | - | - |
| Well | Depth | Unit | Temperature (°C) Estimated in the Early Cretaceous (cc 120 Ma) | Temperature (°C) Estimated in the Miocene (cc 20 Ma) |
|---|---|---|---|---|
| Scenario 1 (Mazurek et al., 2006 [6]) | ||||
| Benken | 576.9 | Middle Jurassic | 90–105 | 75–82 |
| 586 | Middle Jurassic | 101–106 | No data | |
| 1002.48 | Basement | 100–108 | 89–94 | |
| Böttstein | 481–671 | Basement | 90–103 | 75–97 |
| 908–1491 | Basement | 100–>120 | 93–109 | |
| Herdern | 635 | Miocene | No data | 87–91 |
| 1225 | Oligo/Miocene | No data | 95–98 | |
| Schafisheim | 300.75 | Oligo/Miocene | No data | 90–92 |
| 1469 | Early Triassic | No data | 88–96 | |
| 1517–2004 | Basement | No data | 95–111 | |
| Weiach | 52 | Oligo–Miocene | No data | 80–82 |
| 735 | Late Triassic | 89–91 | 89–96 | |
| 1067–1395 | Permian | 109–120 | 87–93 | |
| Scenario 2 (Villagomez et al., 2020 [15]) | ||||
| Böttstein | 1035 | Basement | 90–115 | 70–90 |
| Riniken | 1144 | Permian | 80–100 | 70 |
| 1796 | Permian | 85–120 | 70–80 | |
| Weiach | 1899 | Carboniferous | 90–110 | 80 |
| 1944 | Carboniferous | 80–100 | 80 | |
| 2194 | Basement | 90–125 | 80–90 | |
| Well | AFT Scenario | Erosion Estimated for the Jurassic/Cretaceous-Eocene Unconformity (meters) | Erosion Estimated for the Miocene-Quaternary Unconformity (meters) |
|---|---|---|---|
| Weiach-1 | Scenario 1 | 700 | 1100 |
| Scenario 2 | 800 | 300 | |
| Böttstein-1 | Scenario 1 | 1000 | 1000 |
| Scenario 2 | 1000–1300 | 600 | |
| Riniken-1 | Scenario 1 * | 500 * | 1100 * |
| Scenario 2 | 600 | 400 | |
| Benken-1 | Scenario 1 | 900 | 1200 |
| Scenario 2 * | 1200 * | 400–500 * | |
| Schafisheim-1 | Scenario 1 | 500 * | 1400 |
| Scenario 2 * | 700 * | 500 * | |
| Herdern-1 | Scenario 1 | 300–900 * | 1700 |
| Scenario 2 * | 700–800 * | - |
Publisher’s Note: MDPI stays neutral with regard to jurisdictional claims in published maps and institutional affiliations. |
© 2021 by the authors. Licensee MDPI, Basel, Switzerland. This article is an open access article distributed under the terms and conditions of the Creative Commons Attribution (CC BY) license (http://creativecommons.org/licenses/by/4.0/).
Share and Cite
Omodeo-Salé, S.; Hamidi, Y.; Villagomez, D.; Moscariello, A. Quantifying Multiple Erosion Events in the Distal Sector of the Northern Alpine Foreland Basin (North-Eastern Switzerland), by Combining Basin Thermal Modelling with Vitrinite Reflectance and Apatite Fission Track Data. Geosciences 2021, 11, 62. https://0-doi-org.brum.beds.ac.uk/10.3390/geosciences11020062
Omodeo-Salé S, Hamidi Y, Villagomez D, Moscariello A. Quantifying Multiple Erosion Events in the Distal Sector of the Northern Alpine Foreland Basin (North-Eastern Switzerland), by Combining Basin Thermal Modelling with Vitrinite Reflectance and Apatite Fission Track Data. Geosciences. 2021; 11(2):62. https://0-doi-org.brum.beds.ac.uk/10.3390/geosciences11020062
Chicago/Turabian StyleOmodeo-Salé, Silvia, Yanis Hamidi, Diego Villagomez, and Andrea Moscariello. 2021. "Quantifying Multiple Erosion Events in the Distal Sector of the Northern Alpine Foreland Basin (North-Eastern Switzerland), by Combining Basin Thermal Modelling with Vitrinite Reflectance and Apatite Fission Track Data" Geosciences 11, no. 2: 62. https://0-doi-org.brum.beds.ac.uk/10.3390/geosciences11020062