Next Article in Journal
Characterization of Organic Matter of the Laptev Sea Eroded Coastal Sediments: A Case Study from the Cape Muostakh, Bykovsky Peninsula
Next Article in Special Issue
Physics and Modeling of Various Hazardous Landslides
Previous Article in Journal
LLUNPIY Simulations of the 1877 Northward Catastrophic Lahars of Cotopaxi Volcano (Ecuador) for a Contribution to Forecasting the Hazards
Previous Article in Special Issue
Rainfall Flooding in Urban Areas in the Context of Geomorphological Aspects
 
 
Erratum published on 20 May 2021, see Geosciences 2021, 11(5), 221.
Article

A Framework for Risk-Based Cost–Benefit Analysis for Decision Support on Hydrogeological Risks in Underground Construction

1
Department of Architecture and Civil Engineering, Chalmers University of Technology, SE-412 96 Göteborg, Sweden
2
Swedish Transport Administration, 405 33 Gothenburg, Sweden
*
Author to whom correspondence should be addressed.
Submission received: 25 November 2020 / Revised: 27 January 2021 / Accepted: 8 February 2021 / Published: 12 February 2021
(This article belongs to the Special Issue Geo-Hydrological Risks Management)

Abstract

:
Construction below the ground surface and underneath the groundwater table is often associated with groundwater leakage and drawdowns in the surroundings which subsequently can result in a wide variety of risks. To avoid groundwater drawdown-associated damages, risk-reducing measures must often be implemented. Due to the hydrogeological system’s inherent variability and our incomplete knowledge of its conditions, the effects of risk-reducing measures cannot be fully known in advance and decisions must inevitably be made under uncertainty. When implementing risk-reducing measures there is always a trade-off between the measures’ benefits (reduced risk) and investment costs which needs to be balanced. In this paper, we present a framework for decision support on measures to mitigate hydrogeological risks in underground construction. The framework is developed in accordance with the guidelines from the International Standardization Organization (ISO) and comprises a full risk-management framework with focus on risk analysis and risk evaluation. Cost–benefit analysis (CBA) facilitates monetization of consequences and economic evaluation of risk mitigation. The framework includes probabilistic risk estimation of the entire cause–effect chain from groundwater leakage to the consequences of damage where expert elicitation is combined with data-driven and process-based methods, allowing for continuous updating when new knowledge is obtained.

1. Introduction

With increasing global urbanization follows a land-use conflict which results in increased demand for locating infrastructure such as roads and rails below the ground surface [1]. Dewatering of groundwater resources induced by leakage into underground constructions is common to many underground projects around the world, see for example [2,3]. Groundwater drawdown induced by leakage can affect large areas surrounding the underground facility [4,5]. The groundwater drawdown may subsequently cause damaging impacts on groundwater-dependent ecosystems, such as peatlands, streams, springs, and lakes [6,7], damages to groundwater-dependent building foundations [8,9], and land subsidence which subsequently may damage buildings and other facilities [10,11,12]. Other risks associated with groundwater drawdown are changes to groundwater chemistry [13], changes in flow patterns, mobilization of contaminations [14], and crop-yield losses [15,16]. To reduce the risk of costly damages, it is in both the project owner’s and society’s interest to implement risk-reducing measures. Risk-reducing measures constitute sealing (grouting or watertight concrete lining), for example, to reduce leakage [17] and artificial recharge to maintain stable groundwater levels [18,19], often in combination. However, implementing measures are often expensive, and the socioeconomic effects of the measures must be considered for efficient prioritization of society’s limited resources.
The relationships between leakage and various effects and their consequences can be described by a chain of events that need to occur for the leakage to cause damage (see Figure 1. The nature and severity of the consequences of damage is determined by the dynamic interaction between the different components in the cause–effect chains (illustrated with functions and probability-density functions within the circles in the figure). Consider the first example of reduced ecosystem services from water-dependent ecosystems in the figure. Leakage may induce groundwater drawdown in the near surroundings of the underground facility. The magnitude of the drawdown is determined by the characteristics of the hydrogeological system and the amount of leakage. If water bodies, e.g., peatlands, are present within the area of influence and thus exposed to the groundwater level changes, the groundwater-dependent ecosystem may be damaged. The severity of the damage is determined by the magnitude of the groundwater drawdown and the sensitivity of the peatland. As a final event, the damages can result in reduced ecosystem services which can be translated into negative economic consequences (losses) for the society. These dynamic characteristics of the cause–effect chains imply that it is not relevant to define risk as a traditional binary failure–no-failure situation. Risk should rather be defined as an integrated process where the total risk is the integral sum of a number of possible situations with varying probabilities and consequences ranging from those with large probabilities and little-to-no consequences to those with small probabilities and large consequences [20]. Leakage may also result in several impacts simultaneously making the prediction of consequences even more complex.
Uncertainty is a distinctive characteristic of the cause–effect chain since the construction material and the affected hydrogeological system were formed and impacted by a complex geological and anthropogenic process (aleatory uncertainty) [21]. These conditions cannot be fully known due to the large area of the problem as well as the time and financial limitations (epistemic uncertainty) [22,23]. Epistemic uncertainty can only be reduced by gathering additional information. To assess these uncertainties, the interactions and dynamics between all parts of the cause–effect chain must be recognized. Current research for predicting future behavior of the system is to a large extent directed toward the individual parts of the cause–effect chain, which create a research gap for the development of coupled methods as parts of a comprehensive risk-management framework [24].
Uncertainties are present in all stages of a project and must always be considered [25,26]. However, the level of uncertainty is not constant over time [21]. As illustrated by Figure 2, the uncertainty, the accumulated costs, and the possibility to influence the project outcome change with time as the project progresses. The uncertainties (Figure 2a) are typically large in the beginning of the project during the planning and feasibility phase and lower towards the end of the project after excavation when the conditions are better known and epistemic uncertainties are reduced. The spent resources, that is, the accumulated costs (Figure 2b), increase as the project progresses. The room for changes and adjustments (Figure 2c) in the project are larger in the planning and feasibility phase, before the exact location of the facility is determined, compared to the construction phase when there is little room to change the location and thus the hydrogeological conditions. When planning for risk-reducing measures, the dynamic change of uncertainty levels must be recognized. Many risk-reducing measures must be implemented before the conditions are fully known since the possibility to succeed with the measure often decrease with the time and progress of the project [21]. As a simplified example from the construction phase of a project, the preventive measure of pregrouting is often more successful regarding the sealing efficiency than the reactive measure of postgrouting [27]. Pregrouting must be performed before excavation when the uncertainties are large, while postgrouting is performed after excavation when the conditions are better known. The possibility to influence the amount of leakage is therefore higher with preventive measures before excavation when the uncertainties are large. This implies that for some measures there exist critical windows in time (indicated by the colored area in the figure) where the measures must be implemented to be successful. For the example with grouting for sealing, the critical window for succeeding with pregrouting constitutes the time before excavation which occurs at time tx.
The cost of implementing risk-reducing measures can be high. For example, the cost for sealing measures in tunneling can constitute a significant part of the overall project budget [28,29]. There are also external effects in the form of environmental and social effects associated with the implementation of risk-reducing measures. The environmental external effects are due to the usage of energy and the usage of natural resources and emissions, e.g., the usage of freshwater in artificial recharge facilities or carbon dioxide emissions from production of concrete for sealing [30]. Social external effects may, for example, constitute changes in public health due to increased noise pollution or more accidents due to increased traffic during construction [31]. The consequences of negative effects must be balanced against the consequences of positive effects (reduced damage risk) when deciding on implementation. Using a risk-based perspective the purpose is to balance two types of risks:
  • The risk of not implementing necessary measures, resulting in damages and damage costs for the project owner, the society, and the environment.
  • The risk of implementing measures when not needed, resulting in unnecessary implementation costs.
These two risks can be illustrated in accordance with Figure 3 where the x-axis represents increasing risk-mitigation strategies and the y-axis represents costs, both costs for implementing measures and damage costs. Risk type 1 dominates the left part of the graph and risk type 2 dominates the right part of the graph. If these two risks are optimally balanced, an optimal risk level is reached.
In order to balance risk type 1 and risk type 2 and thus find the optimal risk level, it is necessary that risk-reducing measures’ positive and negative consequences are considered and compared. From a socioeconomic perspective, this is preferably done using cost–benefit analysis (CBA) [33,34]. The result from a CBA describes whether an alternative is economically profitable or not to society and can thus be used as support when deciding whether to implement the alternative or not. Both the project’s internal economic consequences and the external environmental and societal consequences must be considered in the CBA for the result to be relevant for societal decisions. The inevitably changing level of uncertainty over time associated with underground construction projects must also be considered in the decision-making process, favoring a probabilistic approach compared to a deterministic approach that is easy to update when new information is available [23,25,32,35].
The socioeconomic effects of implementing risk-reducing measures must be considered in order to use society’s limited resources efficiently. However, there are several difficulties associated with evaluating these effects including: the cause–effect chains describing the dynamics of leakage and damaging impacts are complex; the level of uncertainty changes as the project progresses; and both the project’s internal and external economic, social, and environmental effects must be considered. This calls for guidelines on how to manage hydrogeological risks in a socioeconomically sustainable manner. However, a practical, comprehensive, and systematic procedure for risk management of environmental impact from underground constructions is not available. The overall aim of this paper is, therefore, to present a generic framework for probabilistic cost–benefit analysis (CBA) for decision support on sustainable mitigation of hydrogeological risks in underground constructions. Specific objectives are to (1) conceptualize the difficulties associated with decisions on hydrogeological risk mitigation in underground construction, (2) present existing approaches and methods suitable and commonly used for handling these individual difficulties, (3) present a novel framework in which these methods are combined and incorporated for a sustainable and economically efficient risk management, and (4) exemplify the application of the framework with a synthetic case study. Unlike previous descriptions of the risk-management process and the risk assessment of the stability and safety within the facility, e.g., Choi et al. [36], Nývlt et al. [37], and Spross et al. [38], our framework is developed to handle the complex nature of environmental impact in the surrounding of the facility as well as the evaluation of risk-reducing measures. Additional novelty, compared to Sundell et al. [39], constitutes the usage of a full CBA where both the project’s internal costs and benefits as well as the economic, environmental, and social externalities of implementing risk-reducing measures are included.

2. General Methods

In this chapter, the basis and generic approaches for the developed framework for risk management of hydrogeological risks in underground constructions are introduced. The framework is based on the principles and guidelines on risk-management framework provided by the International Standard Organization (ISO) together with three other approaches, all aiming at handling the various difficulties associated with decisions on hydrogeological risk-mitigation measures. First, the complex dynamics of the cause–effect chain representing the relationship of leakage and various effects and consequences is handled with probabilistic risk analysis describing the nonbinary risk origin from several situations with varying probabilities and consequences. Second, the economic, social, and environmental consequences of risk-reducing measure alternatives must be valued in economic terms and evaluated using cost–benefit analysis. Third, the evaluation of the model inference should be carried out by performing sensitivity analysis on the model results. Fourth and last, the inevitable and changing uncertainties between different project phases associated with underground construction is handled by means of value of information analysis (VOIA), a continuous monitoring and review, and an iterative process following the principles of the observational method. The basic principles of these approaches are described in more detail below.

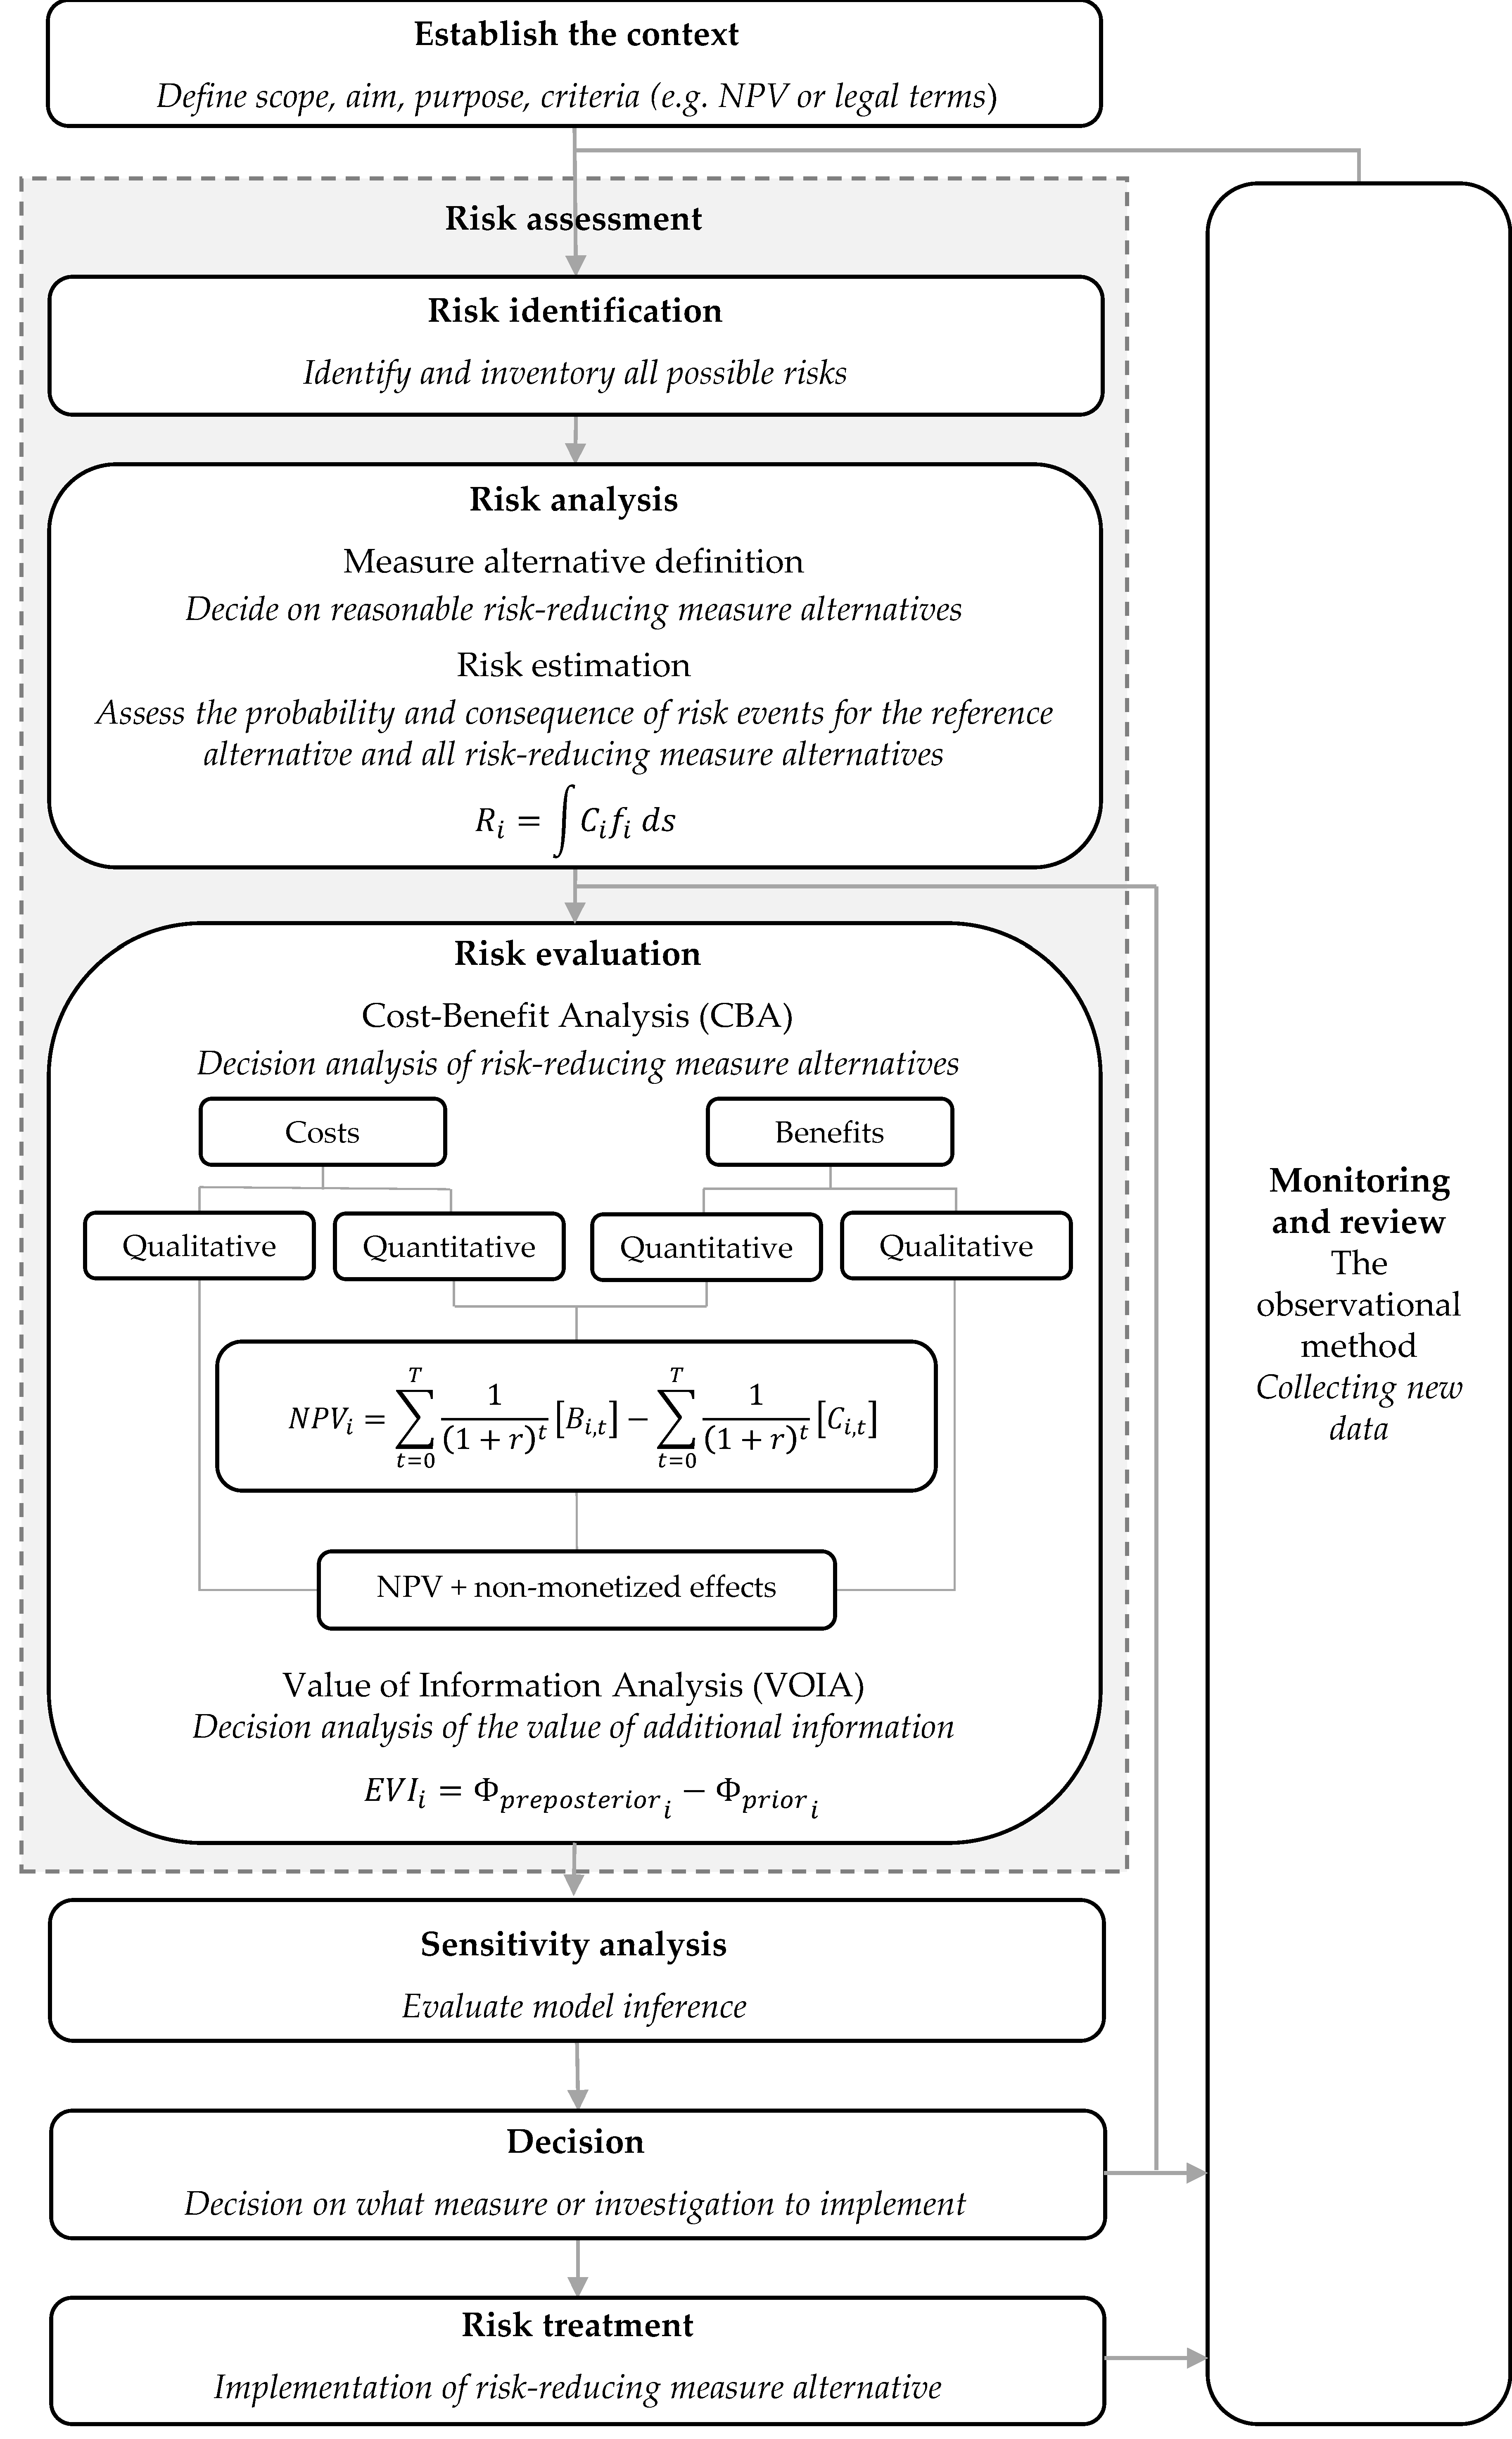
2.1. The Risk-Management Process

The principles and guidelines for risk management provided by the standardization organization (ISO) [40] form the basic structure of the proposed framework. According to ISO, the risk-management process includes both preventive and reactive work and should include the following: the establishment of context (definition of aim and delimitation), risk identification, risk analysis, risk evaluation, risk treatment (implementation of risk-reducing measures), and consultation, communication, monitoring, and review (Figure 4). The establishment of context aims at defining the aim or the purpose of the risk management and thus the possible decision problems. The risk identification is the foundation of the risk analysis and aims at listing all possible risks. Risk identification constitutes inventorying and identifying risk objects and objects at risk. The risk analysis includes the consideration of the causes and sources of the risks and the positive and negative consequences. In the risk-evaluation step, the risks are evaluated based on the risk-acceptability criteria defined early in the risk-management process. The purpose of this process is to identify which risks need treatment and which risks need to be prioritized for treatment implementation. Risk treatment includes the decision and implementation of risk-reducing measures. The consultation and communication include all activities that aim at increasing the understanding of the present risks and that include involvement of stakeholder in the risk-management process. The monitoring and review provide new knowledge to the project.
Both aleatoric and epistemic uncertainties are present in all stages of an underground project, including the planning and designing as well as in the economic, social, and environmental impact assessment of risk-reducing measures. In order to account for these uncertainties, the proposed framework applies a probabilistic approach to risk analysis (see Section 2.3.) and cost–benefit analysis (see Section 2.4.) in accordance with Aven [23] and Bedford and Cooke [41]. This means that input variables to all models included in the quantitative risk analysis and the risk evaluation constituting uncertain quantities are, as far as possible, represented by probability distributions instead of deterministic values (Figure 5). Furthermore, the analysis should use statistical simulation methods (e.g., Monte Carlo simulations) to calculate the uncertainties of output variables. Statistical simulation also allows for sensitivity analyses (see below).

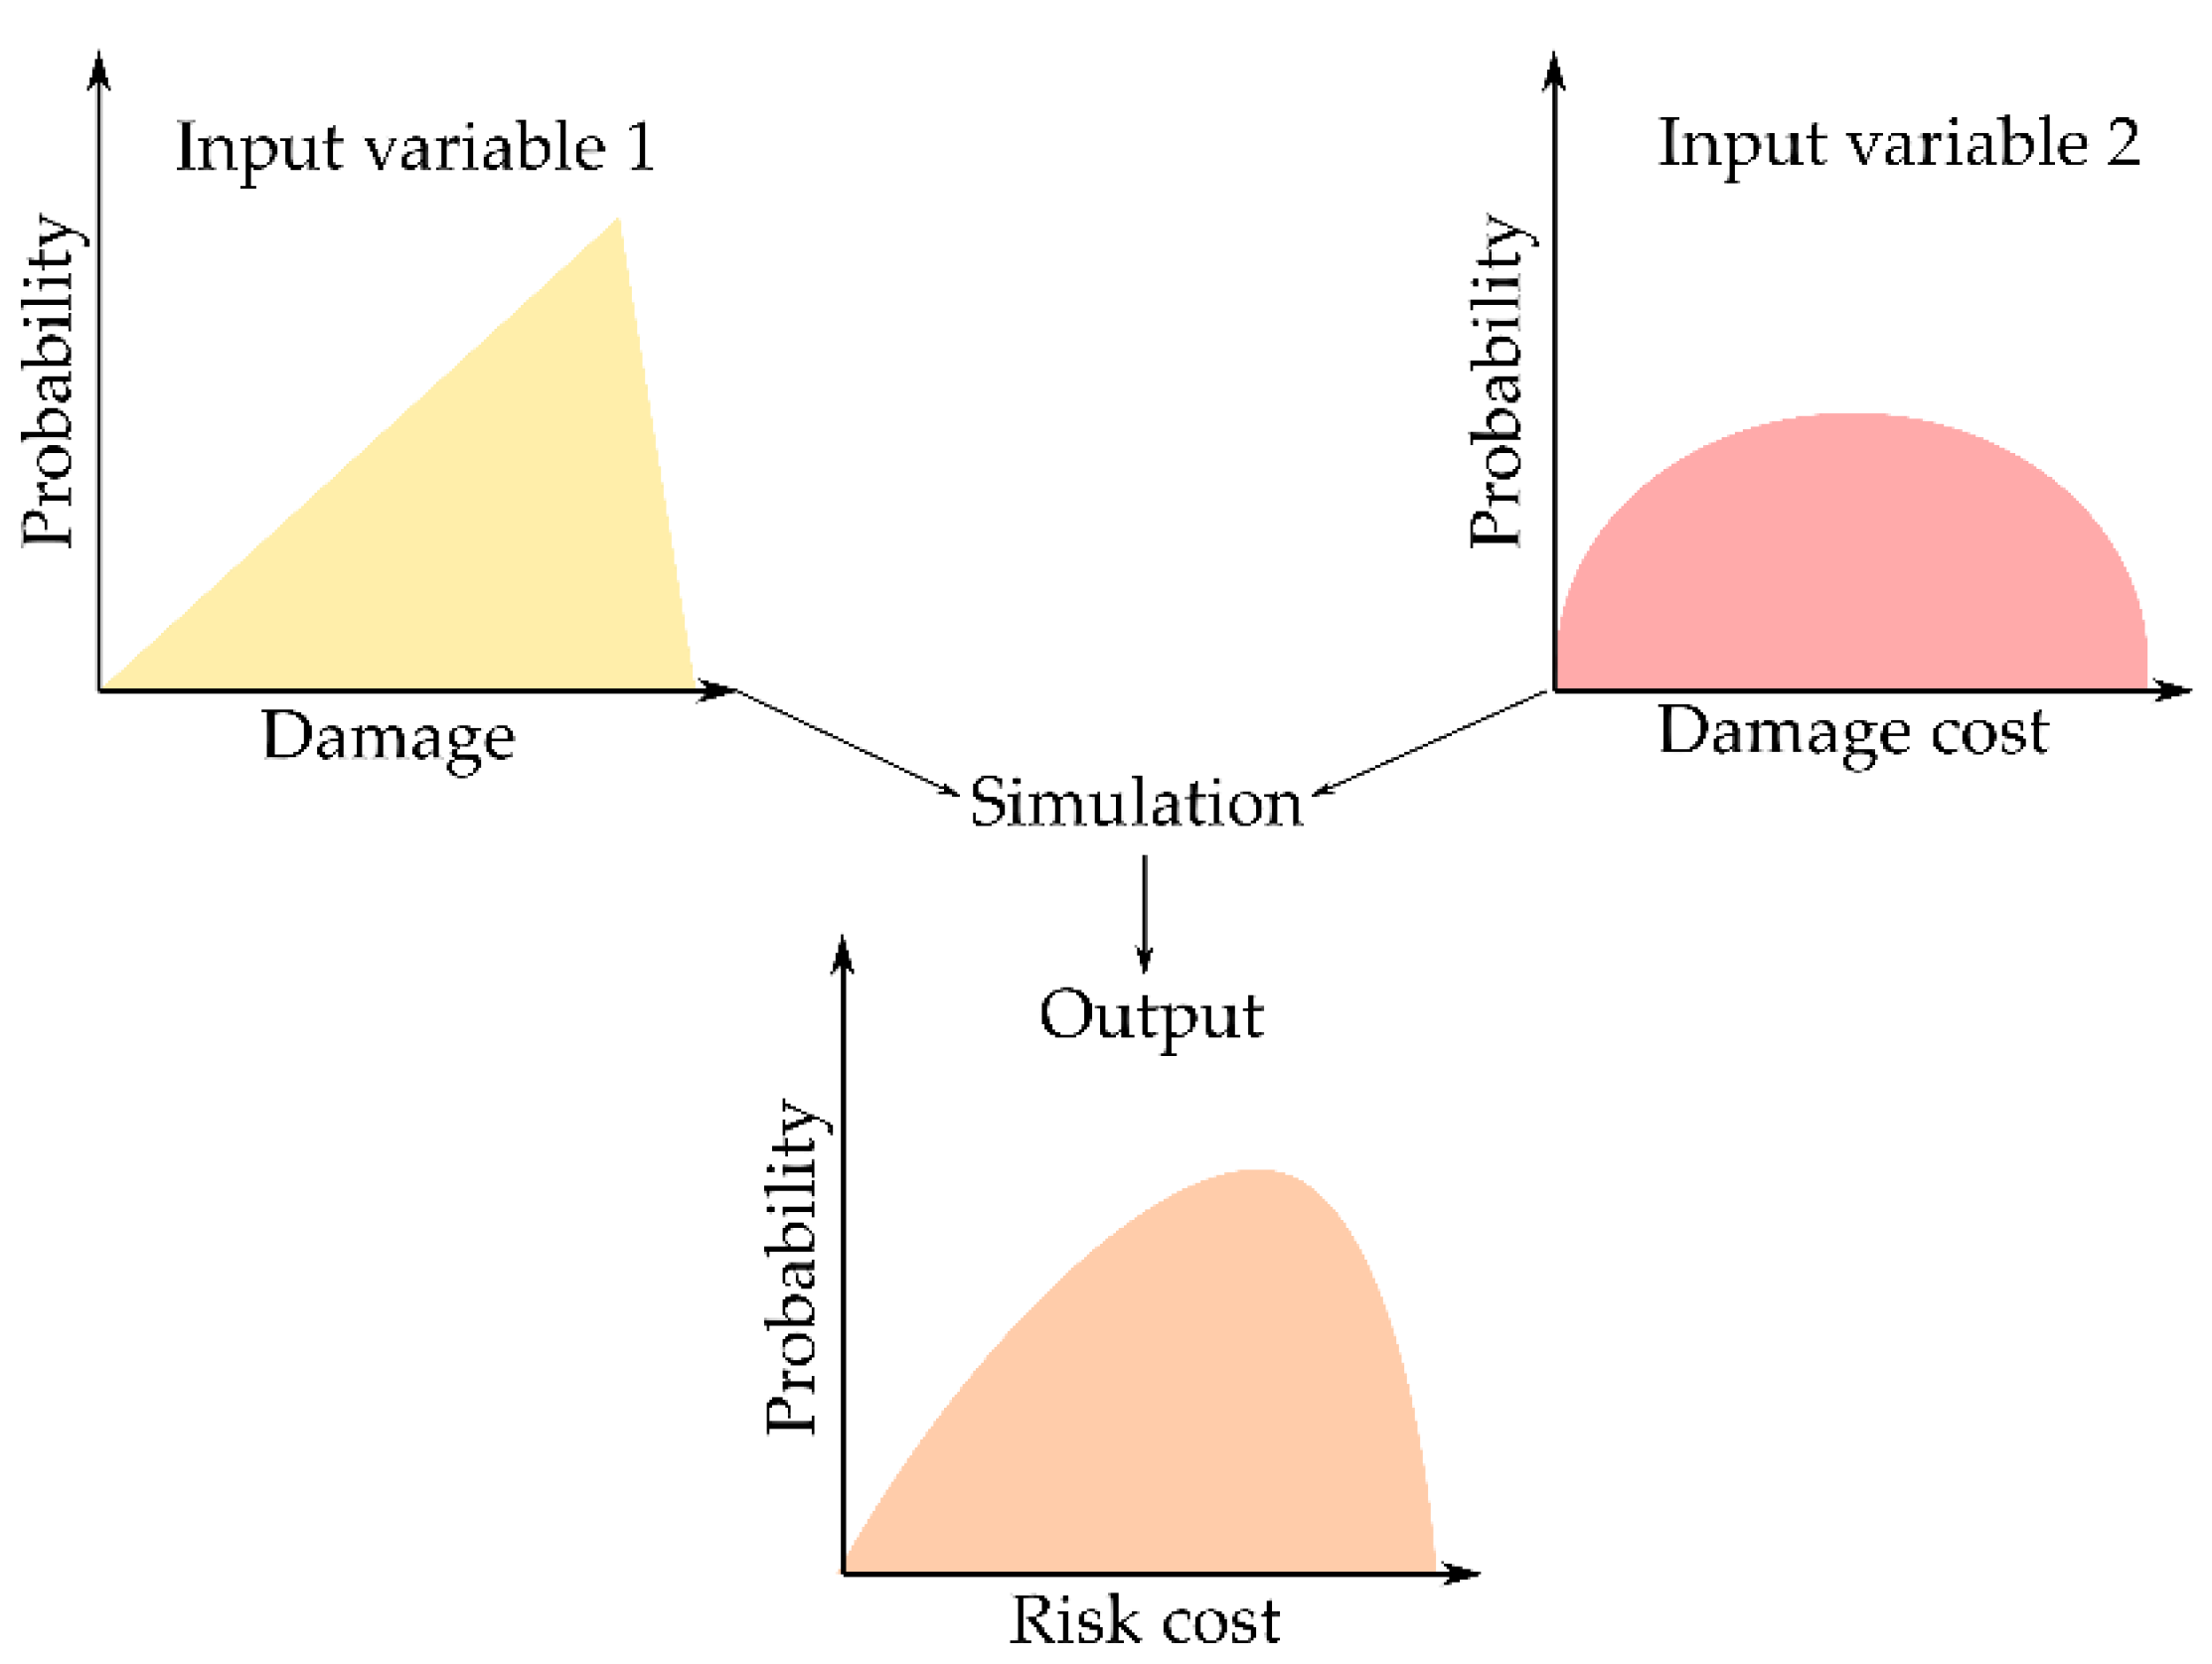
2.2. Probabilistic Risk Analysis

The risk analysis includes the consideration of the causes and sources of the risks and the positive and negative consequences. The causes and sources of risks can be described through a cause–effect chain or by event trees [23,24]. Risk is defined as a function of probability and consequence in accordance with Kaplan and Garrick [42]. The risk Ri is expressed in monetary units and can mathematically be calculated using the probability-density function of an event, fi, and a function representing the consequences of that event, Ci, as follows:
R i =   C i f i   d s
For example, the risk of damage costs on buildings due to subsidence induced by leakage can be described as the economic risk of subsidence, Rs, which is given by the economic cost of damage, Cs, and the probability of a damage to occur, fs. The total risk is given by summing Rs for all buildings within the impact area of the tunnel.
As illustrated by Figure 6a, the risk function includes both high-probability–low-consequence risks (to the left in the graphs) and low-probability–high-consequence risks (to the right in the graphs) and everything in between. In theory, to calculate the total risk, all possible (imaginable) events must be included in the risk analysis. However, all these events are rarely feasible to describe in practice due to their large number. Instead, a staircase function of identified risk categories (illustrated as I-V) is derived, representing a discrete approximation of the continuous reality. In the example of damage costs on buildings, the continuous function can be simplified into a staircase function by using damage categories, e.g., esthetical, functional, and stability damages [20]. The graph in Figure 6a illustrates the original risk at a time when uncertainties are large, and no risk-reducing measures have been implemented. In Figure 6b, the graph illustrates how the uncertainty decreases as the project progresses and new information is collected and processed. In Figure 6c, a risk-reducing measure has been implemented resulting in reduced risk of high-consequence events and a reduced total risk (the area under the risk curve is reduced). For the example of damage costs on buildings, a measure, e.g., artificial infiltration of groundwater to reduce or counteract groundwater drawdown, has been implemented resulting in lower probability of high-consequence damages such as stability problems.

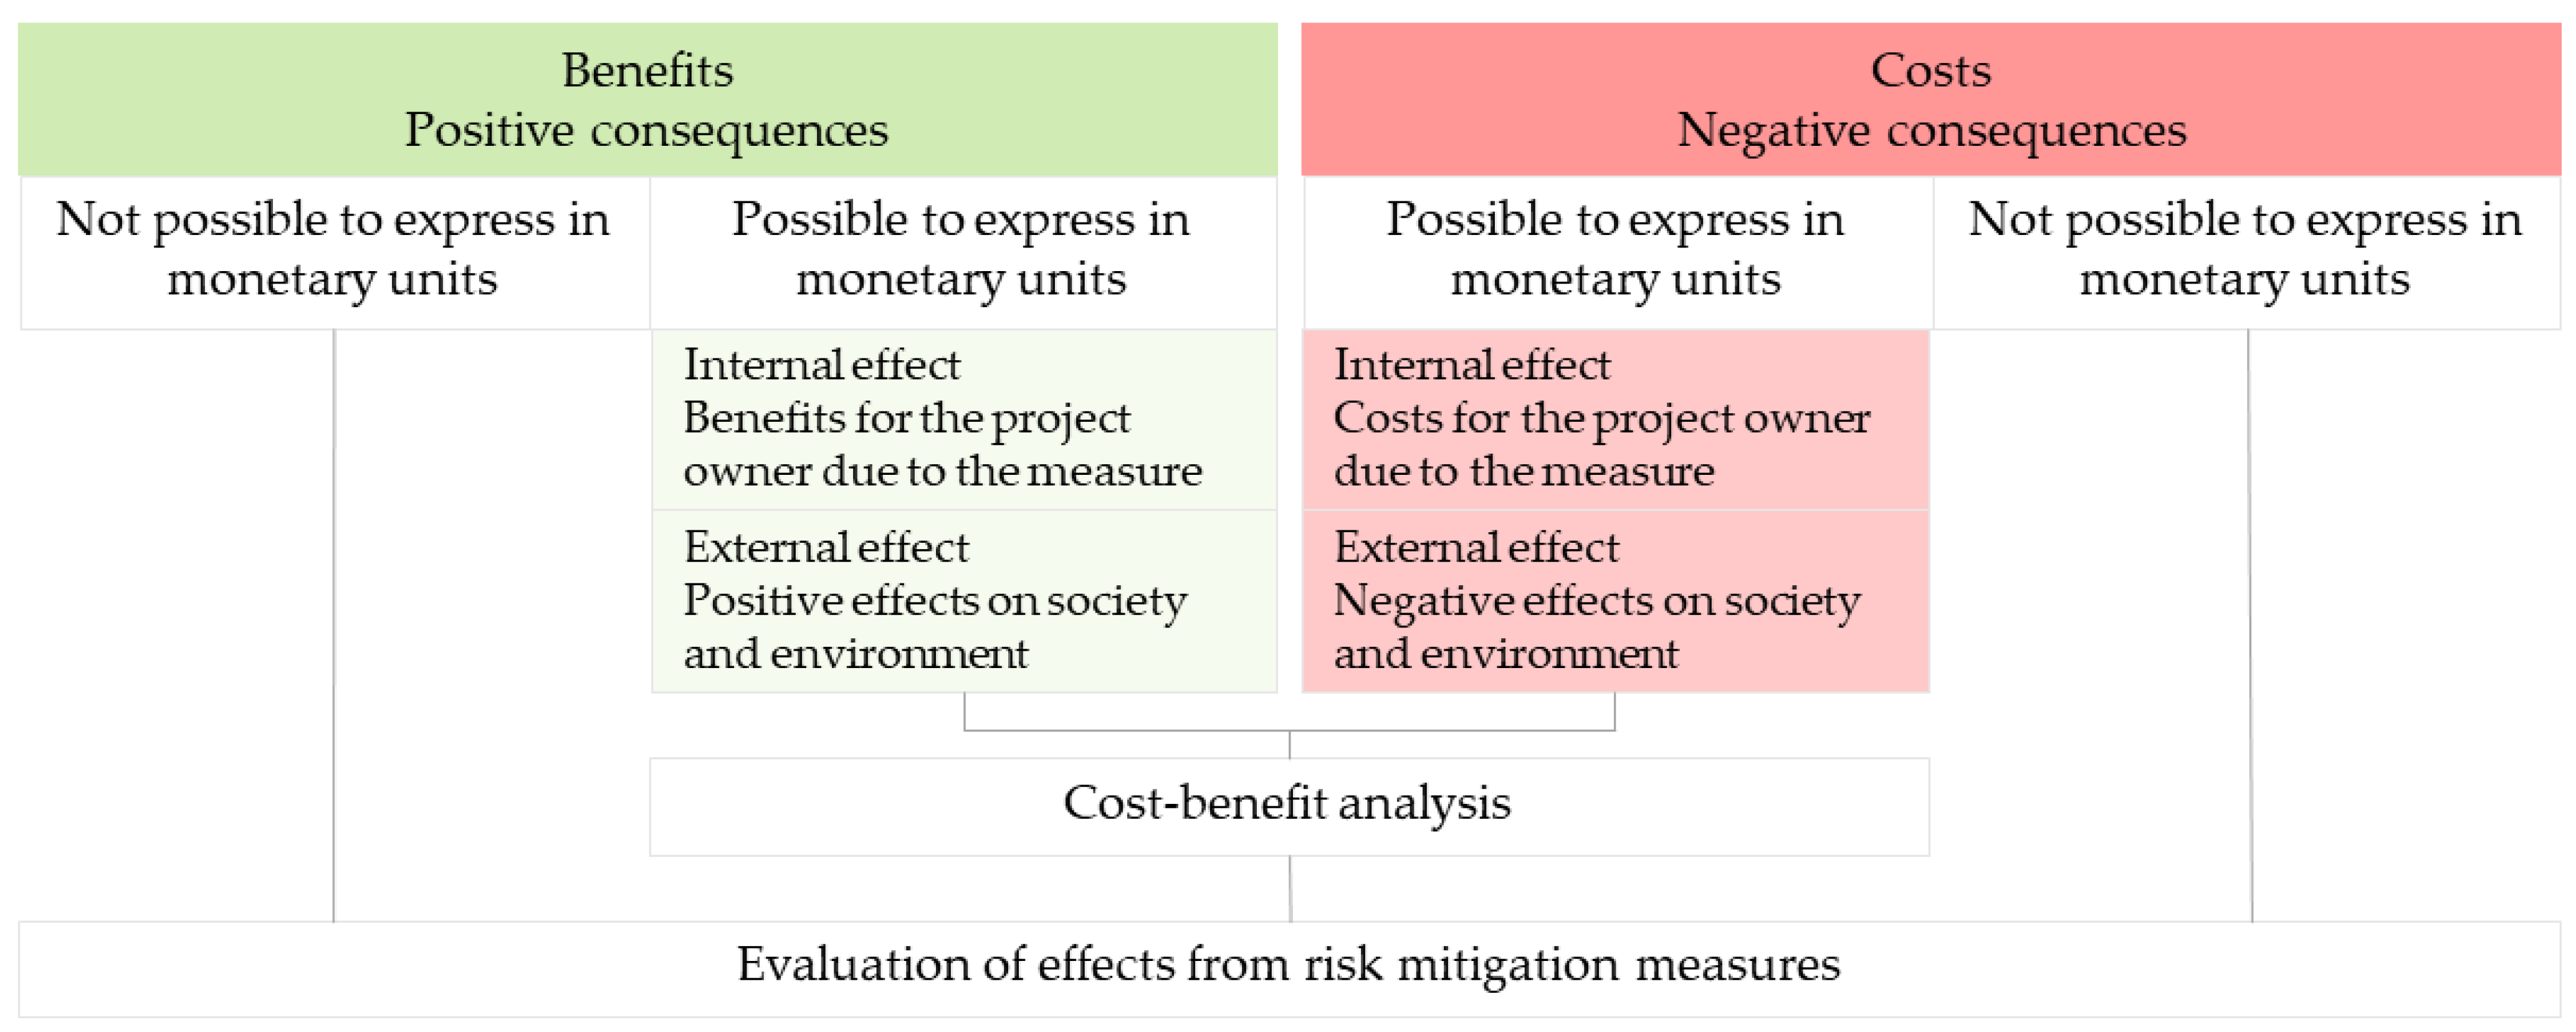
2.3. Cost–Benefit Analysis

The risk in this framework was evaluated using cost–benefit analysis (CBA). CBA is based on an identification of the positive (benefits) and negative consequences (costs) in society of the implementation of a risk-mitigation measure. Benefits and costs are to evaluate whether the measure is profitable to society, i.e., the positive consequences are larger than the negative or not. The analysis is carried out by valuing the positive effects (marginal benefits), e.g., reduced risks, and the negative effects (marginal costs), e.g., implementation and maintenance costs, relative to a reference alternative. A CBA can mathematically be expressed as an objective function that determines the difference between benefits and costs over a specific time horizon. The objective function for risk-reducing measure alternative i and for a time resolution in years can be described as:
N P V i = t = 0 T 1 ( 1 + r ) t [ B i , t ] t = 0 T 1 ( 1 + r ) t [ C i , t ]
where NPVi = net present value expressed in monetary terms, which constitutes the present value of the net benefit (in other words, benefits minus costs) of implementing the measure alternative i; T = time horizon expressed in years including years t(t = 0…T); Bi,t = the benefits in monetary terms of implementing the measure i during year t; Ci,t = costs in monetary terms of implementing the measure i during year t; and r = discount rate. As expressed in the equation, the NPV is be calculated by a conversion of the costs and benefits by a discount rate (unitless). This is carried out in order to consider that costs and benefits may occur at different times. The selection of discount rate is a much-debated topic. It is in general recommended to calculate the NPV with several discount rates in order to analyze how sensitive the NPV and the ranking of alternatives is to a changing discount rate [33].
In addition to evaluating the need for implementing risk-reducing measures, the risk evaluation may also include the analysis of the value of additional information, i.e., value of information analysis (VOIA) [43,44,45,46,47]. VOIA is a CBA where the cost of collecting more information is compared with the expected benefits in terms of reduced risk for making erroneous decisions when choosing between risk-mitigation alternatives. In VOIA, as applied to the context here, additional information has value if it has the potential to change the decision on the risk-reduction alternative. A VOIA can mathematically be expressed as follows:
E V I i = Φ p r e p o s t e r i o r i Φ p r i o r i
where the EVIi = the expected value of information of the data-collection program i expressed in monetary terms; Φpreposteriori = is the calculated net present value (calculated with Equation (2)) based on the information that is expected from the new data-collection program i; and Φpriori = is the net present value calculated similarly but based on the present stage of knowledge. The EVI should be compared with the cost of performing the investigation to calculate the expected net value (ENV). The investigation should only be carried out if the information is more valuable than the cost of collecting it [48].

2.4. The Observational Method

The monitoring and review are essential parts of a successful risk management as they provide new knowledge and can detect changes that are necessary to consider. In the framework developed here (see Section 3), the monitoring and review follow the principle of the observational method [35,49]. The observational method is commonly used to handle the changing level of uncertainty while an underground project progresses. The European standards for construction, Eurocode 7 [50], recommend usage of the observational method when the site conditions are difficult to predict. The method includes identification, confirmation, or rejection of the most probable hydrogeological conditions together with the possibility to adapt the design of risk-reducing measures based on results from investigations performed in later stages of the project. The initial designs should be based on the most probable conditions, but a course of action or modification of the initial design should be at hand for any deviation that can be reasonably anticipated or foreseen. One important part of the observational method is to decide on relevant and observable control parameters that are representative for the hydrogeological conditions [51].

2.5. Sensitivity Analysis

Sensitivity analyses are used to support and validate model inference [52], and they are considered to be an important part of risk management [53]. The sensitivity analysis aims at identifying what input parameters have the largest impact on the output results from the models used for risk analysis and risk evaluation. The identified parameters can then be investigated further in order to reduce the overall uncertainty of the analysis and thus the output results. Thus, the result from the sensitivity analysis constitutes additional important information for decision makers.

3. Results—A Proposed Framework

The proposed framework for decision support on hydrogeological risks in underground construction is illustrated in Figure 7. The framework starts with defining the scope and criteria for the project. The following step is to identify all possible risks that may occur due to the construction of the underground facility given the expected design, i.e., the reference alternative. Once the risks have been identified, reasonable risk-reducing measure alternatives for management of the identified risks are defined. The next step is to estimate the risk for the reference alternative as well as the risk-reduction alternatives. The risk is estimated by means of data, models, and simulations, and expert elicitation. This is followed by the risk evaluation, which by means of CBA, evaluates the positive and negative consequences of the risk-reducing measure alternatives. After the risk evaluation, a sensitivity analysis is carried out. Based on the results from the CBA and the sensitivity analysis, the CBA may be updated by means of VOIA as a basis for a decision on whether to actually implement a measure alternative or, if possible, collect more data and postpone the decision on the alternative selection. Whatever decision is made, more data are continuously collected and processed and used to update the models. This loop of risk analysis, risk evaluation, decision making, and monitoring will continue throughout the whole project allowing for a continuous updating of the models. To be effective, the risk-management process must be implemented into the organization of the project management.

3.1. Establish the Context and Risk Identification

The first step of the proposed framework is the establishment of context which includes defining the aim and purpose. For this proposed framework, the aim is to provide decision makers with support for decisions on hydrogeological risk-mitigation measures. This framework proposes an evaluation of risk-reducing measures based on socioeconomic valuation of costs and benefits where the alternative with the highest net present value is implemented. However, there may be values, beliefs, or legal requirements that are not considered in the utilitarian framework of a pure consequence-based CBA [23]. In Sweden for example, the project owner must abide by the terms and conditions from the legal permit given for water operations by the land and environmental court [54]. These terms and conditions are often formulated as a maximum allowed leakage into the underground facility or restrictions on how the groundwater levels may change due to the water operation [55]. Such circumstances can be accounted for by supplementing the aim with a decision criterion formulated in accordance with the legal terms and conditions. The next step in the framework is to identify all possible risks that exist due to the activity. Risks includes costs for reimbursement of a damaged object such as a building, well, or pipe, delays of the project in days, or injuries and fatalities [56].

3.2. Risk Analysis

As a first step in the risk analysis, the reference alternative and the risk-reducing measure alternatives relevant for investigating and evaluating are defined. If a decision criterion exists, only measure alternatives that abide by the criterion are relevant to include in the analysis. In order to be able to identify the benefits of the identified alternatives, the damage risk must be assessed and compared. In order to assess the damage risk, several models describing the separate event of the dynamic cause–effect chain must often be coupled. These models aim at assessing the probability for separate events in the cause–effect chain (e.g., leakage, groundwater drawdown, subsidence, and damage) to happen. The probability for these events can be determined by data-driven or process-based numerical models and simulations, by extrapolating from experimental studies and available data, or by using expert elicitation. What approach to choose depends on several factors such as time and financial limitation, data availability, level of ambition, and the overall circumstances and nature of the project. These methods can also be combined and used simultaneously. It is beyond the scope of this paper to evaluate in detail what methods to choose when assessing the damage risk. However, in the following paragraphs, some examples of different approaches are presented.
There are several methods available for assessment of the individual parts of the cause–effect chain. Examples include prediction of leakage from discontinuity data and rock-mass quality data [57,58] and numerical models and simulations [59], groundwater drawdown prediction from water balance calculation [60], and numerical groundwater flow models [20,61], prediction of subsidence due to pore pressure decrease using numerical models [62,63,64], and damage models for various groundwater-dependent objects [16,20,65]. These kinds of models must be coupled in order to assess the damage risk from leakage. One example of how coupled models can be used to estimate damage risk is the Varberg-tunnel case study were the probability of groundwater drawdown-induced subsidence damages on buildings was simulated using several coupled numerical models, including a stratigraphy model, a groundwater model, a subsidence model, and a damage model [20]. In another case study, the underground project Bypass Stockholm, leakage and groundwater drawdown induced by leakage were assessed based on groundwater level data, leakage prognoses, and expert elicitation, and was coupled with numerical models for subsidence and damage [66].

3.3. Risk Evaluation

The next step in the framework is the risk evaluation which includes the CBA of the defined risk-reducing measure alternatives. In this step, the results from the risk analysis are used as input into the cost–benefit analysis. More precisely, the difference in risk level of the measure alternatives compared to the reference alternative constitutes the benefits. The benefit of a measure alternative i is given by:
B i = R 0 R i
where Bi = the benefit of the measure alternative expressed in monetary terms; R0 = the economic risk level of the reference alternative; and Ri =the economic risk level of the measure alternative. In order to analyze the social profit (NPV) of measures, the cost for implementing the measure is compared to the gained benefits. All consequences of a measure in society must be considered for the CBA, both a project’s internal consequences for the project owner and external consequences in society, as seen in Figure 8. The project’s internal costs relevant for hydrogeological risk-reducing measures in underground construction include investment costs, operation, and maintenance costs and costs for reinvestment in the measure after its lifespan. External consequences that need to be considered are of economic, social, and environmental character. Examples of costs are risks of accidents associated with the measure, costs for reduced accessibility, reduced provision of ecosystem services, and costs for emissions. The project’s internal benefits of implementing a measure includes reducing the risk for penalties and delays due to violation of terms and conditions and reduced reimbursement costs of a damaged object such as a building, well, or pipe. External benefits include reduced damage risk to objects such as groundwater-dependent ecosystems, buildings, and other installations, e.g., water supplies, archeological remnants, or underground storage facilities.
If possible, consequences are monetized. There are several methods available for economic valuation of consequences, both market goods and non-market goods. What method to choose for each identified consequence depends on the available data and the possibility to collect data [67]. One approach for valuation of consequences is to use standard values applicable for the given context, e.g., the Swedish ASEK-system that are used for decisions on investments in the transport sector [68]. If no suitable standard values are available, valuations from already existing studies (see for example the Environmental Valuation Reference Inventory, EVRI) can be used via benefit transfer [69,70]. Benefit transfer is most often used if it is difficult to conduct primary valuation studies due to time, funding, or data constraints [71]. Another approach is to use expert elicitation to obtain expert knowledge [72,73]. Other methods, constituting conducting primary valuation studies, include market price-based approaches (see for example the developed damage-cost model in Sundell et al. [20]), production function-based approaches, revealed-preference methods, and stated-preference methods [67]. Not all consequences can be expressed quantitatively in monetary units. In order to make sure that these consequences are not overlooked, they must instead be described qualitatively, and their effects on the overall result must be evaluated.

3.4. Sensitivity Analysis

After the risk evaluation, the model inference should be evaluated by performing a sensitivity analysis. The sensitivity analysis can be performed both locally and globally with varying levels of ambition using both simple and more complex methods. One of the simpler methods commonly used is the local one factor at a time approach (OAT). Although this approach saves computation time, it is illicit and unjustified to use unless the analyzed model is proven to be linear [52]. Since Monte Carlo simulations are used for the risk analysis and the risk evaluation within the proposed risk-management framework, it is instead recommended to perform a global sensitivity analysis. A common global approach is to calculate correlation coefficients for the input and output variables [74]. This approach assumes a linear relationship. If the model is nonlinear, the data can be ranked using the Spearman rank [75]. There may also be correlations among input variables. If this is the case than the partial correlation coefficient (PCC) is a better choice compared to ordinary correlation coefficient since this approach accounts for correlation among input variables. Ranking is also applicable for the PCC. Another common approach is to use regression techniques, e.g., the standardized regression coefficient (SRC) or the rank regression coefficient (RRC) [74]. What methods to choose are to a large extent determined by the level of ambition of the project and the computational power available, as well as the model properties (e.g., linear and non-linear).
It is important that the models constituting both the risk analysis and the risk evaluation are considered for the sensitivity analysis since all models contain uncertainties that can have a large impact on the overall result. In Figure 9, a principal illustration of a performed sensitivity analysis using Spearman rank correlation coefficients on six input parameters for the calculation of the NPV is shown. Variable I-VI constitutes input variables used in the risk evaluation (costs, Ci, and benefits, Bi). The variables used for determining the probability, fi, and the consequences, Ci, of damage are also included, because the benefits in the risk evaluation are calculated from the difference in risk level of the measure alternatives compared to the reference alternative obtained from the risk analysis. A positive value of ρ close to 1 indicates a strong positive dependence, while a value of ρ close to −1 indicates a strong inverse dependence. As indicated by the figure, the output result is strongly dependent on variable I suggesting that this parameter should be considered for further investigation in order to reduce the overall model uncertainty. Because groundwater drawdown induced by leakage can affect large areas surrounding the underground facility, the sensitivity analysis for some of the models constituting the risk analysis may be necessary to perform spatially, i.e., in more than one dimension (see for example sensitivity analysis performed on a model for groundwater-induced subsidence in Sundell et al. [63]).

3.5. Decision, Risk Treatment and Monitoring and Review

Based on the results from the CBA and the sensitivity analysis, a decision is taken. The decision can go two ways: Either a risk-reducing measure alternative is selected and implemented, or the selection of an alternative is postponed. If a measure alternative is implemented, the effects of that alternative are monitored and reviewed. If the selection of the risk-reducing measure alternative is postponed, the decision can go two ways: Either the project is carried on and the advancement of the project is monitored and reviewed, or the CBA is updated by means of VOIA. If a VOIA is performed, the result is used together with the result from the CBA and the sensitivity analysis as a basis for a new decision on whether to implement a risk-reducing measure alternative or to postpone it and collect more data.
All decisions eventually end up in monitoring and review which includes the collection of new data. One important part of monitoring and review, when following the principles of the observational method, is to decide on relevant and observable control parameters that are representative for the hydrogeological conditions [51]. These control parameters should be based on the sensitivity of the object at risk. For example, a groundwater-dependent ecosystem such as a wetland or a subsidence-sensitive building that are sensitive to groundwater-level changes should be monitored by measuring the groundwater level regularly. When using the observational method, new knowledge is used iteratively, meaning that the hydrogeological prognosis formed on observations is continually updated, resulting in new input data for the models that form the basis for the probabilistic risk analysis and the risk evaluation (CBA). This way, the risk assessment is continually updated allowing for decisions to be made with the best possible knowledge and support at that time.

4. Framework application

Application of the risk-management framework for decision support on risk-mitigation measures for an underground project is illustrated by a hypothetical case-study example. The example represents a generic real-world situation in an underground project facing several hydrogeological risks. All steps of the framework are included in the example, but emphasis is on the risk analysis and risk evaluation. The application of the various steps of the framework and the application in the case study are presented in Table 1.
The underground project constitutes a railroad tunnel located in an urban area in Sweden. The built environment within the area of influence of the tunnel constitutes residential and commercial buildings, pipes, and roads and other paved surfaces. A church classified as a cultural heritage is also located within the near surroundings of the tunnel and is sensitive to groundwater drawdown in both the upper and lower aquifer. The construction of the tunnel has not yet started. The main part of the tunnel is constructed in bedrock. The hydrogeology in the tunnel area constitutes three main aquifers: a lower aquifer in the fractured gneiss bedrock, a lower confined aquifer in glacial till or glaciofluvial material located on top of the bedrock and below a layer of clay, and an upper unconfined aquifer in course material (often filling in the built-up areas). The two lower aquifers have a high hydraulic connectivity in some areas. The lower aquifer and upper soil aquifers are separated by a layer of impermeable clay but are connected in connection to bedrock outcrop areas. The clay within the area of influence of the tunnel is sensitive for groundwater drawdown, i.e., there is risk for subsidence in case of groundwater drawdown.

5. Concluding Remarks

This paper presents a comprehensive description of the difficulties associated with decisions on hydrogeological risk mitigation in underground construction together with commonly used approaches and methods for handling these. Finally, the paper presents a novel framework for probabilistic risk-based cost–benefit analysis (CBA) for decision support on the mitigation of hydrogeological risks in underground constructions where the presented methods are combined and incorporated for a sustainable and economically efficient risk management process. The novelty constitutes the attempt to facilitate risk management of environmental impact from leakage into underground facilities that considers both the project’s internal costs and benefits as well as the economic, environmental, and social externalities of implementing risk-reducing measures. Furthermore, the framework accounts for the inevitable and changing uncertainties associated with underground constructions by incorporating an iterative process of continuous updating of the risk analysis and the risk evaluation models as new information is retrieved.
Future research on implementing the framework in various hydrogeological settings housing different types of objects at risk is needed. Relevant models, representing the complex dynamics between all parts of the cause–effect chain of leakage to damage must be adapted, integrated, and, when new models are necessary, developed in order to make better predictions of future behavior of the hydrogeological systems and thus improve the risk analysis. Furthermore, both the potential project’s internal costs and benefits as well as externalities associated with risk-reducing measures must be identified, and cost models must be developed for these consequences in order to improve the risk evaluation. Nonetheless, in the meantime, the framework can be used as guidance on how to manage hydrogeological risks in new underground projects.

Author Contributions

Conceptualization, J.M., J.S., and L.R.; Funding acquisition, J.M. and L.R.; Supervision, J.S. and L.R.; Visualization, J.M.; Writing—original draft, J.M.; Writing—review and editing, J.M., J.S., and L.R. All authors have read and agreed to the published version of the manuscript.

Funding

This work is funded by the Swedish Rock Engineering Research Foundation (contract BeFo 414).

Data Availability Statement

Not relevant for this study.

Conflicts of Interest

The authors declare no conflict of interest.

References

  1. Huggenberger, P.; Epting, J. (Eds.) Urban Geology: Process-Oriented Concepts for Adaptive and Integrated Resource Management; Springer: Basel, Switzerland, 2011; pp. 95–191. [Google Scholar]
  2. Kværner, J.; Snilsberg, P. Hydrogeological impacts of a railway tunnel in fractured Precambrian gneiss rocks (south-eastern Norway). Hydrogeol. J. 2013, 21, 1633–1653. [Google Scholar] [CrossRef]
  3. López-Fernández, C.; Prieto, D.A.; Fernández-Viejo, G.; Pando, L.; Fernández, E.C. Surface Subsidence Induced by Groundwater Drainage Tunneling in Granite Residual Soils (Burata Railway Tunnel, Spain). J. Geotech. Geoenviron. Eng. 2013, 139, 821–824. [Google Scholar] [CrossRef]
  4. Burbey, T.J. The influence of faults in basin-fill deposits on land subsidence, Las Vegas Valley, Nevada, USA. Hydrogeol. J. 2002, 10, 525–538. [Google Scholar] [CrossRef]
  5. Gustafson, G. Hydrogeology for Rock Engineers; Rock Engineering Research Foundation: Stockholm, Sweden, 2012. [Google Scholar]
  6. Attanayake, P.M.; Waterman, M.K. Identifying environmental impacts of underground construction. Hydrogeol. J. 2006, 14, 1160–1170. [Google Scholar] [CrossRef]
  7. Kværner, J.; Snilsberg, P. The Romeriksporten railway tunnel—Drainage effects on peatlands in the lake Northern Puttjern area. Eng. Geol. 2008, 101, 75–88. [Google Scholar] [CrossRef]
  8. Vatovec, M.; Kelley, P.L. Biodegradation of Untreated Wood Foundation Piles in Existing Buildings. Structure 2007, 54, 15–17. [Google Scholar]
  9. Elam, J.; Björdal, C. A review and case studies of factors affecting the stability of wooden foundation piles in urban environments exposed to construction work. Int. Biodeterior. Biodegrad. 2020, 148, 104913. [Google Scholar] [CrossRef]
  10. Persson, J. Hydrogeological Methods in Geotechnical Engineering: Applied to Settlements Caused by Underground Construction; Chalmers University of Technology: Gothenburg, Sweden, 2007. [Google Scholar]
  11. Boone, S.J. Ground-Movement-Related Building Damage. J. Geotech. Eng. 1996, 122, 886–896. [Google Scholar] [CrossRef]
  12. Lindskoug, N.-E.; Nilsson, L.-Y. Grundvatten och byggande. In Byggforskningen; R 20; University of Gothenburg: Gothenburg, Sweden, 1974. [Google Scholar]
  13. Mossmark, F.; Hultberg, H.; Ericsson, L.O. Recovery from groundwater extraction in a small catchment area with crystalline bedrock and thin soil cover in Sweden. Sci. Total Environ. 2008, 404, 253–261. [Google Scholar] [CrossRef] [PubMed]
  14. Hernández-Espriú, A.; Reyna-Gutiérrez, J.A.; Sánchez-León, E.; Cabral-Cano, E.; Carrera-Hernández, J.; Martínez-Santos, P.; Marcias-Medrano, S.; Falorni, G.; Colombo, S. The DRASTIC-Sg model: An extension to the DRASTIC approach for mapping groundwater vulnera-bility in aquifers subject to differential land subsidence, with application to Mexico City. Hydrogeol. J. 2014, 22, 1469–1485. [Google Scholar] [CrossRef]
  15. Graffner, O. Miljöuppföljning Bergtunnelsprojekt; Banverket: Borlänge, Sweden, 2007. [Google Scholar]
  16. Lewan, E.; Linnér, H. Simulering av Transpiration Från Jordbruksgrödor vid Grundvattensänkning; Swedish University of Agricultural Sciences: Uppsala, Sweden, 2008. [Google Scholar]
  17. Panthi, K.; Nilsen, B. Significance of grouting for controlling leakage in water tunnels: A case from Nepal. In Proceedings of the 31st ITA General Assembly, Istanbul, Turkey, 7–12 May 2005. [Google Scholar]
  18. Andersson, P.; Sellner, A. Tätning av Bergtunnlar–Förutsättningar, Bedömningsgrunder och Strategi vid Planering och Ut-Formning av Tätningsinsatser; Vägverket: Borlänge, Sweden, 2000. [Google Scholar]
  19. Ilsley, R.C.; Powers, J.P.; Hunt, S.W. Use of recharge wells to maintain groundwater levels during excavation of the Milwaukee deep tunnels. In Proceedings of the 10th Rapid Excavation and Tunneling Conference, Seattle, WA, USA, 16–20 June 1991. [Google Scholar]
  20. Sundell, J.; Haaf, E.; Tornborg, J.; Rosén, L. Comprehensive risk assessment of groundwater drawdown induced subsidence. Stoch. Environ. Res. Risk Assess. 2019, 33, 427–449. [Google Scholar] [CrossRef] [Green Version]
  21. Lundman, P. Cost Management for Underground Infrastructure Projects: A Case Study on Cost Increase and Its Causes. Ph.D. Thesis, Luleå University of Technology, Luleå, Sweden, 2011. [Google Scholar]
  22. Kadefors, A.; Bröchner, J. Observationsmetoden i Bergbyggande: Kontrakt och Samverkan; Swedish Rock Engineering Foundation: Stockholm, Sweden, 2008; p. 28. [Google Scholar]
  23. Aven, T. Foundations of Risk Analysis; John Wiley & Sons: Hoboken, NJ, USA, 2012. [Google Scholar]
  24. Sundell, J. Risk assessment of groundwater drawdown in subsidence sensitive areas. In Architecture and Civil Engineering; Chalmers University of Technology: Gothenburg, Sweden, 2018. [Google Scholar]
  25. Sturk, R. Engineering geological information: Its value and impact on tunnelling. In Division of Soil and Rock Mechanics; Royal Institute of Technology: Stockholm, Sweden, 1998. [Google Scholar]
  26. Einstein, H.H.; Baecher, G.B. Probabilistic and statistical methods in engineering geology. Rock Mech. Rock Eng. 1983, 16, 39–72. [Google Scholar] [CrossRef]
  27. Garshol, K.F. Pre-Excavation Grouting in Rock Tunneling; MBT International Underground Construction Group: Zurich, Switzerland, 2003. [Google Scholar]
  28. Werner, K.; Onkenhout, J.; Löv, Å. Effects on Hydrogeological and Hydrological Conditions Due to Groundwater Diversion from Rock Facilities. Step 1—Pre Study; Swedish Rock Engineering Research Foundation: Stockholm, Sweden, 2012; p. 117. [Google Scholar]
  29. Beitnes, A. Lessons to be Learned from Long Railway Tunnels; Norwegian Tunneling Society: Oslo, Norway, 2002; pp. 51–57. [Google Scholar]
  30. Huang, L.; Bohne, R.A.; Bruland, A.; Jakobsen, P.D.; Lohne, J. Life cycle assessment of Norwegian road tunnel. Int. J. Life Cycle Assess. 2014, 20, 174–184. [Google Scholar] [CrossRef]
  31. Gilchrist, A.; Allouche, E.N. Quantification of social costs associated with construction projects: State-of-the-art review. Tunn. Undergr. Space Technol. 2005, 20, 89–104. [Google Scholar] [CrossRef]
  32. Freeze, R.A.; Massmann, J.; Smith, L.; Sperling, T.; James, B. Hydrogeological Decision Analysis: 1. A Framework. Ground Water 1990, 28, 738–766. [Google Scholar] [CrossRef]
  33. Johansson, P.-O.; Kristrom, B. Cost-Benefit Analysis for Project Appraisal; Cambridge University Press: Cambridge, UK, 2016. [Google Scholar]
  34. Boardman, A.E.; Greenberg, D.H.; Vining, A.R.; Weimer, D. Cost-Benefit Analysis: Concepts and Practice; Cambridge University Press: Cambridge, UK, 2017. [Google Scholar]
  35. Peck, R.B. Advantages and Limitations of the Observational Method in Applied Soil Mechanics. Géotechnique 1969, 19, 171–187. [Google Scholar] [CrossRef] [Green Version]
  36. Choi, H.-H.; Cho, H.-N.; Seo, J. Risk Assessment Methodology for Underground Construction Projects. J. Constr. Eng. Manag. 2004, 130, 258–272. [Google Scholar] [CrossRef]
  37. Nývlt, O.; Prívara, S.; Ferkl, L. Probabilistic risk assessment of highway tunnels. Tunn. Undergr. Space Technol. 2011, 26, 71–82. [Google Scholar] [CrossRef]
  38. Spross, J.; Stille, H.; Johansson, F.; Palmstrøm, A. Principles of Risk-Based Rock Engineering Design. Rock Mech. Rock Eng. 2019, 53, 1129–1143. [Google Scholar] [CrossRef] [Green Version]
  39. Sundell, J.; Schweckendiek, T. A Framework for Risk Assessment of Groundwater Drawdown Induced Subsidence. In Proceedings of the International Symposium on Geotechnical Safety and Risk (ISGSR2015), Rotterdam, The Netherlands, 12–16 October 2015. [Google Scholar]
  40. Risk Management: Principles and Guidelines; ISO 31000; International Organization for Standardization: Geneva, Switzerland, 2009.
  41. Lindley, D.V.; Bedford, T.; Cooke, R. Probabilistic Risk Analysis: Foundations and Methods. Math. Gaz. 2002, 86, 377. [Google Scholar] [CrossRef]
  42. Kaplan, S.; Garrick, B.J. On The Quantitative Definition of Risk. Risk Anal. 1981, 1, 11–27. [Google Scholar] [CrossRef]
  43. James, B.R.; Freeze, R.A. The worth of data in predicting aquitard continuity in hydrogeological design. Water Resour. Res. 1993, 29, 2049–2065. [Google Scholar] [CrossRef]
  44. Back, P.-E. Value of Information Analysis for Site Investigations in Remediation Projects; Chalmers University of Technology: Gothenburg, Sweden, 2006. [Google Scholar]
  45. Zetterlund, M.S.; Norberg, T.; Ericsson, L.O.; Norrman, J.; Rosén, L. Value of information analysis in rock engineering: A case study of a tunnel project in Äspö Hard Rock Laboratory. Georisk Assess. Manag. Risk Eng. Syst. Geohazards 2015, 9, 9–24. [Google Scholar] [CrossRef]
  46. Sundell, J.; Norberg, T.; Haaf, E.; Rosén, L. Economic valuation of hydrogeological information when managing groundwater drawdown. Hydrogeol. J. 2019, 27, 1111–1130. [Google Scholar] [CrossRef] [Green Version]
  47. McNulty, G.; Deshler, B.; Dove, H. Value of Information Analysis-Nevada Test Site; IT Corp: Cincinnati, OH, USA, 1997. [Google Scholar]
  48. Zetterlund, M.; Norberg, T.; Ericsson, L.O.; Rosen, L. Framework for Value of Information Analysis in Rock Mass Characterization for Grouting Purposes. J. Constr. Eng. Manag. 2011, 137, 486–497. [Google Scholar] [CrossRef]
  49. Powderham, A.J. The observational method? Learning from projects. Geotech. Eng. 2002, 155, 59–69. [Google Scholar]
  50. Eurocode 7: Geotechnical Design—Part 1: General Rules; European Committee for Standardization: Brussels, Belgium, 2004.
  51. Holmberg, M.; Stille, H. Observationsmetodens Grunder och Dess Tillämpning På Design av Konstruktioner i Berg; Swedish Rock Engineering Research Foundation: Stockholm, Sweden, 2007; p. 80. [Google Scholar]
  52. Saltelli, A.; Ratto, M.; Tarantola, S.; Campolongo, F. Sensitivity analysis practices: Strategies for model-based inference. Reliab. Eng. Syst. Saf. 2006, 91, 1109–1125. [Google Scholar] [CrossRef]
  53. Burgman, M. Risks and Decisions for Conservation and Environmental Management; Cambridge University Press: Cambridge, UK, 2005. [Google Scholar]
  54. Lewis, J.; Sjöström, J.; Höök, M.; Sundström, B. The Swedish model for groundwater policy: Legal foundations, decision-making and practical application. Hydrogeol. J. 2013, 21, 751–760. [Google Scholar] [CrossRef]
  55. Merisalu, J.; Rosén, L. Formulation of Terms and Condition for Groundwater Diversion When Constructing Below the Ground Surface; Chalmers University of Technology: Gothenburg, Sweden, 2020. [Google Scholar]
  56. Wladis, D.; Rosén, L. Riskhantering för att Undvika Driftstörningar i Byggskedet i Stora Infrastrukturprojekt i Urban Miljö; Chalmers University of Technology: Gothenburg, Sweden, 2018. [Google Scholar]
  57. Panthi, K.K.; Nilsen, B. Uncertainty Analysis for Assessing Leakage Through Water Tunnels: A Case from Nepal Himalaya. Rock Mech. Rock Eng. 2009, 43, 629–639. [Google Scholar] [CrossRef]
  58. Zhang, L.; Franklin, J. Prediction of water flow into rock tunnels: An analytical solution assuming an hydraulic conductivity gradient. Int. J. Rock Mech. Min. Sci. Géoméch. Abstr. 1993, 30, 37–46. [Google Scholar] [CrossRef]
  59. Kitterød, N.-O.; Colleuille, H.; Wong, W.; Pedersen, T. Simulation of groundwater drainage into a tunnel in fractured rock and numerical analysis of leakage remediation, Romeriksporten tunnel, Norway. Hydrogeol. J. 2000, 8, 480–493. [Google Scholar]
  60. Raposo, J.R.; Molinero, J.; Dafonte, J. Quantitative evaluation of hydrogeological impact produced by tunnel construction using water balance models. Eng. Geol. 2010, 116, 323–332. [Google Scholar] [CrossRef]
  61. Molinero, J.; Samper, J.; Juanes, R. Numerical modeling of the transient hydrogeological response produced by tunnel construction in fractured bedrocks. Eng. Geol. 2002, 64, 369–386. [Google Scholar] [CrossRef]
  62. Yoo, C.; Lee, Y.; Kim, S.-H.; Kim, H.-T. Tunnelling-induced ground settlements in a groundwater drawdown environment—A case history. Tunn. Undergr. Space Technol. 2012, 29, 69–77. [Google Scholar] [CrossRef]
  63. Sundell, J.; Haaf, E.; Norberg, T.; Alén, C.; Karlsson, M.; Rosén, L. Risk Mapping of Groundwater-Drawdown-Induced Land Subsidence in Heterogeneous Soils on Large Areas. Risk Anal. 2019, 39, 105–124. [Google Scholar] [CrossRef] [PubMed] [Green Version]
  64. Griffiths, D.V.; Fentont, G.A. The Random Finite Element Method (RFEM) in Steady Seepage Analysis. In Probabilistic Methods in Geotechnical Engineering; Springer: London, UK, 2007; Volume 491, pp. 225–241. [Google Scholar]
  65. Mortellaro, S.; Krupa, S.; Fink, L.; Van Arman, J. Literature Review on the Effects of Groundwater Drawdowns on Isolated Wetlands; South Florida Water Management District: West Palm Beach, FL, USA, 1995.
  66. Merisalu, J.; Sundell, J.; Rosén, L. Cost-Benefit Analysis of Safety Measures for Management of Hydrogeological Risks When Constructing Below Ground—Case Study Förbifart Stockholm; Chalmers University of Technology: Gothenburg, Sweden, 2020. [Google Scholar]
  67. Freeman, A.M.; Herriges, J.A.; Kling, C.L. The Measurement of Environmental and Resource Values: Theory and Methods; Routledge: London, UK, 2014. [Google Scholar]
  68. Analysmetod och Samhällsekonomiska Kalkylvärden för Transportsektorn; ASEK 6.1.; Swedish Transport Administration: Borlange, Sweden, 2018.
  69. Boyle, K.J.; Bergstrom, J.C. Benefit transfer studies: Myths, pragmatism, and idealism. Water Resour. Res. 1992, 28, 657–663. [Google Scholar] [CrossRef]
  70. Boutwell, J.L.; Westra, J.V. Benefit Transfer: A Review of Methodologies and Challenges. Resources 2013, 2, 517–527. [Google Scholar] [CrossRef] [Green Version]
  71. Rolfe, J.; Johnston, R.J.; Rosenberger, R.S.; Brouwer, R. Introduction: Benefit Transfer of Environmental and Resource Values; Springer: London, UK, 2015; Volume 14, pp. 3–17. [Google Scholar]
  72. O’Hagan, A.; Buck, C.E.; Daneshkhah, A.; Eiser, J.R.; Garthwaite, P.H.; Jenkinson, D.J.; Oakley, J.E.; Rakow, T. Uncertain Judgements: Eliciting Experts’ Probabilities; Wiley: Hoboken, NJ, USA, 2006. [Google Scholar]
  73. Gosling, J.P. SHELF: The Sheffield Elicitation Framework. In International Series in Operations Research & Management Science; Springer: London, UK, 2018; pp. 61–93. [Google Scholar]
  74. Hamby, D.M. A review of techniques for parameter sensitivity analysis of environmental models. Environ. Monit. Assess. 1994, 32, 135–154. [Google Scholar] [CrossRef]
  75. Iman, R.L.; Conover, W.J. The use of the rank transform in regression. Technometrics 1979, 21, 499–509. [Google Scholar] [CrossRef]
Figure 1. Event tree illustrating the cause–effect chain for several examples of effects and consequences caused by leakage into an underground facility. The circles represent the complex nonbinary relationship between the different events of the chain. The events can have economic, environmental, and social effects, which in turn result in consequences.
Geosciences 11 00082 g001
Figure 2. (a) level of uncertainty, (b) accumulated costs, and (c) the possibility to influence the outcome of the project in relation to the progress of the project in time. The colored area indicates the critical window where measures can be successfully implemented. At time tx, the project reaches a state where the room to maneuver and the chance to succeed with measures decrease. Modified from Lundman [21].
Geosciences 11 00082 g002
Figure 3. The principles of the relationship between investment costs, damage costs, and the total cost (risk level). Modified from Freeze et al. [32].
Geosciences 11 00082 g003
Figure 4. The risk-management process [40].
Geosciences 11 00082 g004
Figure 5. Schematic illustration of the principles of probabilistic modelling using Monte Carlo simulations and probability distributions on uncertain input variables to retrieve an output result that includes uncertainties. The example illustrates the calculations of the damage-risk cost.
Geosciences 11 00082 g005
Figure 6. Schematic description of staircase and continuous risk functions indicated by red circles and black solid line together with an interval for uncertainty indicated by dashed lines. “P” and “C” indicate probability and consequence, respectively. (a) The risk curve; (b) the risk curve after retrieval of more information resulting in less uncertainty, and (c) the risk curve after implementation of risk-reducing measures resulting in reduced total risk.
Geosciences 11 00082 g006
Figure 7. The hydrogeological risk-management framework for decision support on risk-reducing measure alternatives.
Geosciences 11 00082 g007
Figure 8. The evaluation procedure of positive and negative effects from risk-mitigation measures. The effects possible to express in monetary units are evaluated using cost–benefit analysis. The effects that are not possible to express in monetary units are described qualitatively.
Geosciences 11 00082 g008
Figure 9. Illustration of a sensitivity analysis performed with Spearman rank correlation coefficients for six input variables. The input variables are listed in the y-axis and the ρ value ranging from −1 to 1 is shown on the x-axis.
Geosciences 11 00082 g009
Table 1. Synthetic case-study application of the steps in the hydrogeological risk-management framework for decision support on risk-reducing measure alternatives.
Steps in the FrameworkApplication
Establish the contextThe aim is to identify the socioeconomically most profitable measures for groundwater control. The legal requirements for the project states that the leakage into the tunnel can cause a maximum-allowed groundwater drawdown in the lower aquifer of 1 m below the yearly average. The requirements also state that buildings classified as cultural heritage must not be damaged. Only measures that fulfill these criteria can thus be implemented.
Risk identificationThere are two main risks identified for the project:
  • The risk of damages on the built environment due to subsidence induced by leakage.
  • The risk of delays of the project and penalties due to violation of legal requirements.
The objects at risk of damage constitute buildings, roads, other paved surfaces, and pipes. If the project is delayed, local consequences include longer period of poor accessibility and noise pollution for the residents and visitors of the area. Regional consequences include lost benefits of not opening the tunnel in time. These benefits constitute shorter travel time for public transport commuters and reduced emissions from car traffic when more people choose to go by train instead of car.
Define risk-reducing measure alternativesThe reference alternative is defined as building the tunnel without any strategy for groundwater control. The risk-reducing measure alternatives reasonable to consider for implementation are:
  • pregrouting to reduce leakage,
  • concrete lining on the tunnel walls to reduce leakage,
  • pregrouting to reduce leakage together with artificial recharge to maintain stable groundwater levels in all areas inhabiting subsidence sensitive buildings, and
  • pregrouting to reduce leakage together with artificial recharge to maintain stable groundwater levels at the location of the groundwater dependent church.
Risk estimationThe economic risk of subsidence damages, Rs, is estimated based on the probability of damage induced by subsidence, fs, and the economic consequence, Cs, of that damage, for the reference alternative and all measure alternatives (see Section 2.2). The probability of damage is determined in several steps. First, the leakage into the tunnel for the various alternatives is assessed by eliciting experts on the hydrogeological conditions in the area as well as expected outcomes of pregrouting and concrete lining. All expert assessments include uncertainty. Second, the impact on groundwater levels as a function of the assessed leakage and artificial recharge is determined for all measure alternatives by stochastic groundwater modeling. Third, the magnitude of subsidence induced by groundwater drawdown is calculated based on data on geotechnical properties of the clay in the area, thickness of the clay based on drillings, and the simulated groundwater drawdown. The subsidence calculations are carried out for each node in a 20 × 20 m resolution grid for the area covered with clay. Fourth, damage models describing the relationship between subsidence and damage for the objects at risk are developed by eliciting experts. The economic consequence of subsidence damage is determined by valuation models describing the relationship between damage and costs. The valuation models are developed based on data on reimbursement costs for subsidence damages. References providing examples of all these models are provided in Section 3.2. The economic risk of subsidence is finally calculated by coupling all these models and running Monte Carlo simulations (see Section 2.1).
The risk of delays, Rd, is estimated based on the probability of violating the legal terms, fd, and the economic consequence, Cd, of that violation. The probability of violating the terms is determined in the same manner as the first two steps of the subsidence calculations, thus using the leakage assessments and stochastic groundwater modelling. The cost of violating the terms is determined from valuation models. The valuation model for penalties is developed based on historical records of penalties for similar project. The valuation models for delays are developed based on standard values applicable for the given context.
CBAThe benefits of the risk-reducing measure alternatives constitute the reduced economic risk, Ri, of implementing a measure and are estimated by comparing the economic risk of the measure alternatives with the reference alternative in accordance with Equation 4. The costs of the measure alternatives are estimated by expert elicitation and from data on costs from previous underground projects. The costs include investment costs, operation and maintenance costs, costs for reinvestment in the measure after its lifespan, and costs for air emissions. All measure alternatives have longer expected construction periods compared to the reference alternative. The costs of these longer construction times are estimated by using standard values applicable for the given context.
The result from the CBA is shown as bar charts. The four bars represent the 50th percentile (median) for the measure alternatives, the error bars represent the 5th and 95th percentile, and the two bars for each alternative represents the NPV calculated with two different discount rates (1.4 and 3.5%, respectively). The NPV is highest for measure alternative 3, which makes this alternative the most profitable to society.
Geosciences 11 00082 i001
Sensitivity analysisA sensitivity analysis was carried out for both the risk analysis and the risk evaluation in accordance with the example provided in Section 3.4. The sensitivity analysis indicates that the cost estimates for sealing strategies (grouting and concrete lining) together with the valuation of damage costs for buildings had the largest impact on the NPV. Reducing uncertainties on these variables would thus increase the reliability of the risk evaluation.
DecisionMeasure alternative 3 is the most profitable according to the CBA followed by alternative 1, 4, and 2. The result from the risk analysis indicates that alternative 1 has a high probability of not meeting the legal requirements of a maximum-allowed drawdown and of not causing any damage to cultural heritage. Alternative 4 also has a high probability of not meeting the legal requirement of a maximum-allowed drawdown in a few parts of the influence area. Based on the CBA and the sensitivity analysis, it is decided that more data need to be collected and the models in the risk assessment should be updated before any final decision is made regarding what risk mitigation strategy to apply. The data collection would focus on reducing the uncertainties of the cost estimates for the sealing strategies in order to reduce the overall uncertainty in the risk evaluation.
Risk treatmentAfter updating the models with new data, the decision makers decide to design the risk-reducing measures in accordance with alternative 3.
Monitoring and reviewAs the construction of the tunnel starts and the project progresses, more data are collected. The data collection focuses on information that can be of use in the design and implementation of the risk-reducing measures. Once the measures have been implemented, the data collection focuses on monitoring and reviewing the effects of the implemented measures.
Publisher’s Note: MDPI stays neutral with regard to jurisdictional claims in published maps and institutional affiliations.

