
Intermittent but Rapid Changes to Coastal Landscapes: The Tsunami and El Niño Wave-Formed Sea Arch at Laie Point, Oahu, Hawaii, U.S.A.

Faculty of Science, Brigham Young University-Hawaii, BYUH #1967, 55-220 Kulanui Street, Laie, HI 96762, USA
Geosciences 2021, 11(3), 147; https://0-doi-org.brum.beds.ac.uk/10.3390/geosciences11030147
Submission received: 12 February 2021
/
Revised: 5 March 2021
/
Accepted: 9 March 2021
/
Published: 23 March 2021
(This article belongs to the Special Issue Natural and Environmental Hazards of Cultural Heritage)
Abstract
:Kukuiho’olua Island is an islet that lies 164 m due north of Laie Point, a peninsula of cemented, coastal, Pleistocene and Holocene sand dunes. Kukuiho’olua Island consists of the same dune deposits as Laie Point and is cut by a sea arch, which, documented here for first time, may have formed during the 1 April 1946 “April Fools’s Day Tsunami.” The tsunami-source of formation is supported by previous modeling by other authors, which indicated that the geometry of overhanging sea cliffs can greatly strengthen and focus the force of tsunami waves. Additional changes occurred to the island and arch during the 2015–2016 El Niño event, which was one of the strongest on record. During the event, anomalous wave heights and reversed wind directions occurred across the Pacific. On the night of 24–25 February 2016, large storm waves, resulting from the unique El Niño conditions washed out a large boulder that had lain within the arch since its initial formation, significantly increasing the open area beneath the arch. Large waves also rose high enough for seawater to flow over the peninsula at Laie Point, causing significant erosion of its upper surface. These changes at Laie Point and Kukuio’olua Island serve as examples of long-term, intermittent change to a coastline—changes that, although infrequent, can occur quickly and dramatically, potentially making them geologic hazards.
1. Introduction
1.1. Overview
The documentation of coastal change is important at a time of rising eustatic sea levels [1,2]. Rising sea levels can lead to greater inundation and erosion of shorelines [3] and thus greater impacts from storm and tsunami waves, which can be significant hazards to coastal communities. Understanding the history of coastal change at a given location is important for correctly interpreting future hazards at the location and can serve as a proxy for understanding similar hazards and change at other locations. Such documentation is also critical for correctly interpreting the geologic history of islands and coasts [4]. This paper documents the evolution and change of a sea arch in a small island off of the northeast coast of the larger Hawaiian Island of Oahu, as well as other changes to the nearby coastal peninsula—changes caused by short-duration, but high energy events related to storms and tsunamis.
1.2. Geographical and Geological Setting
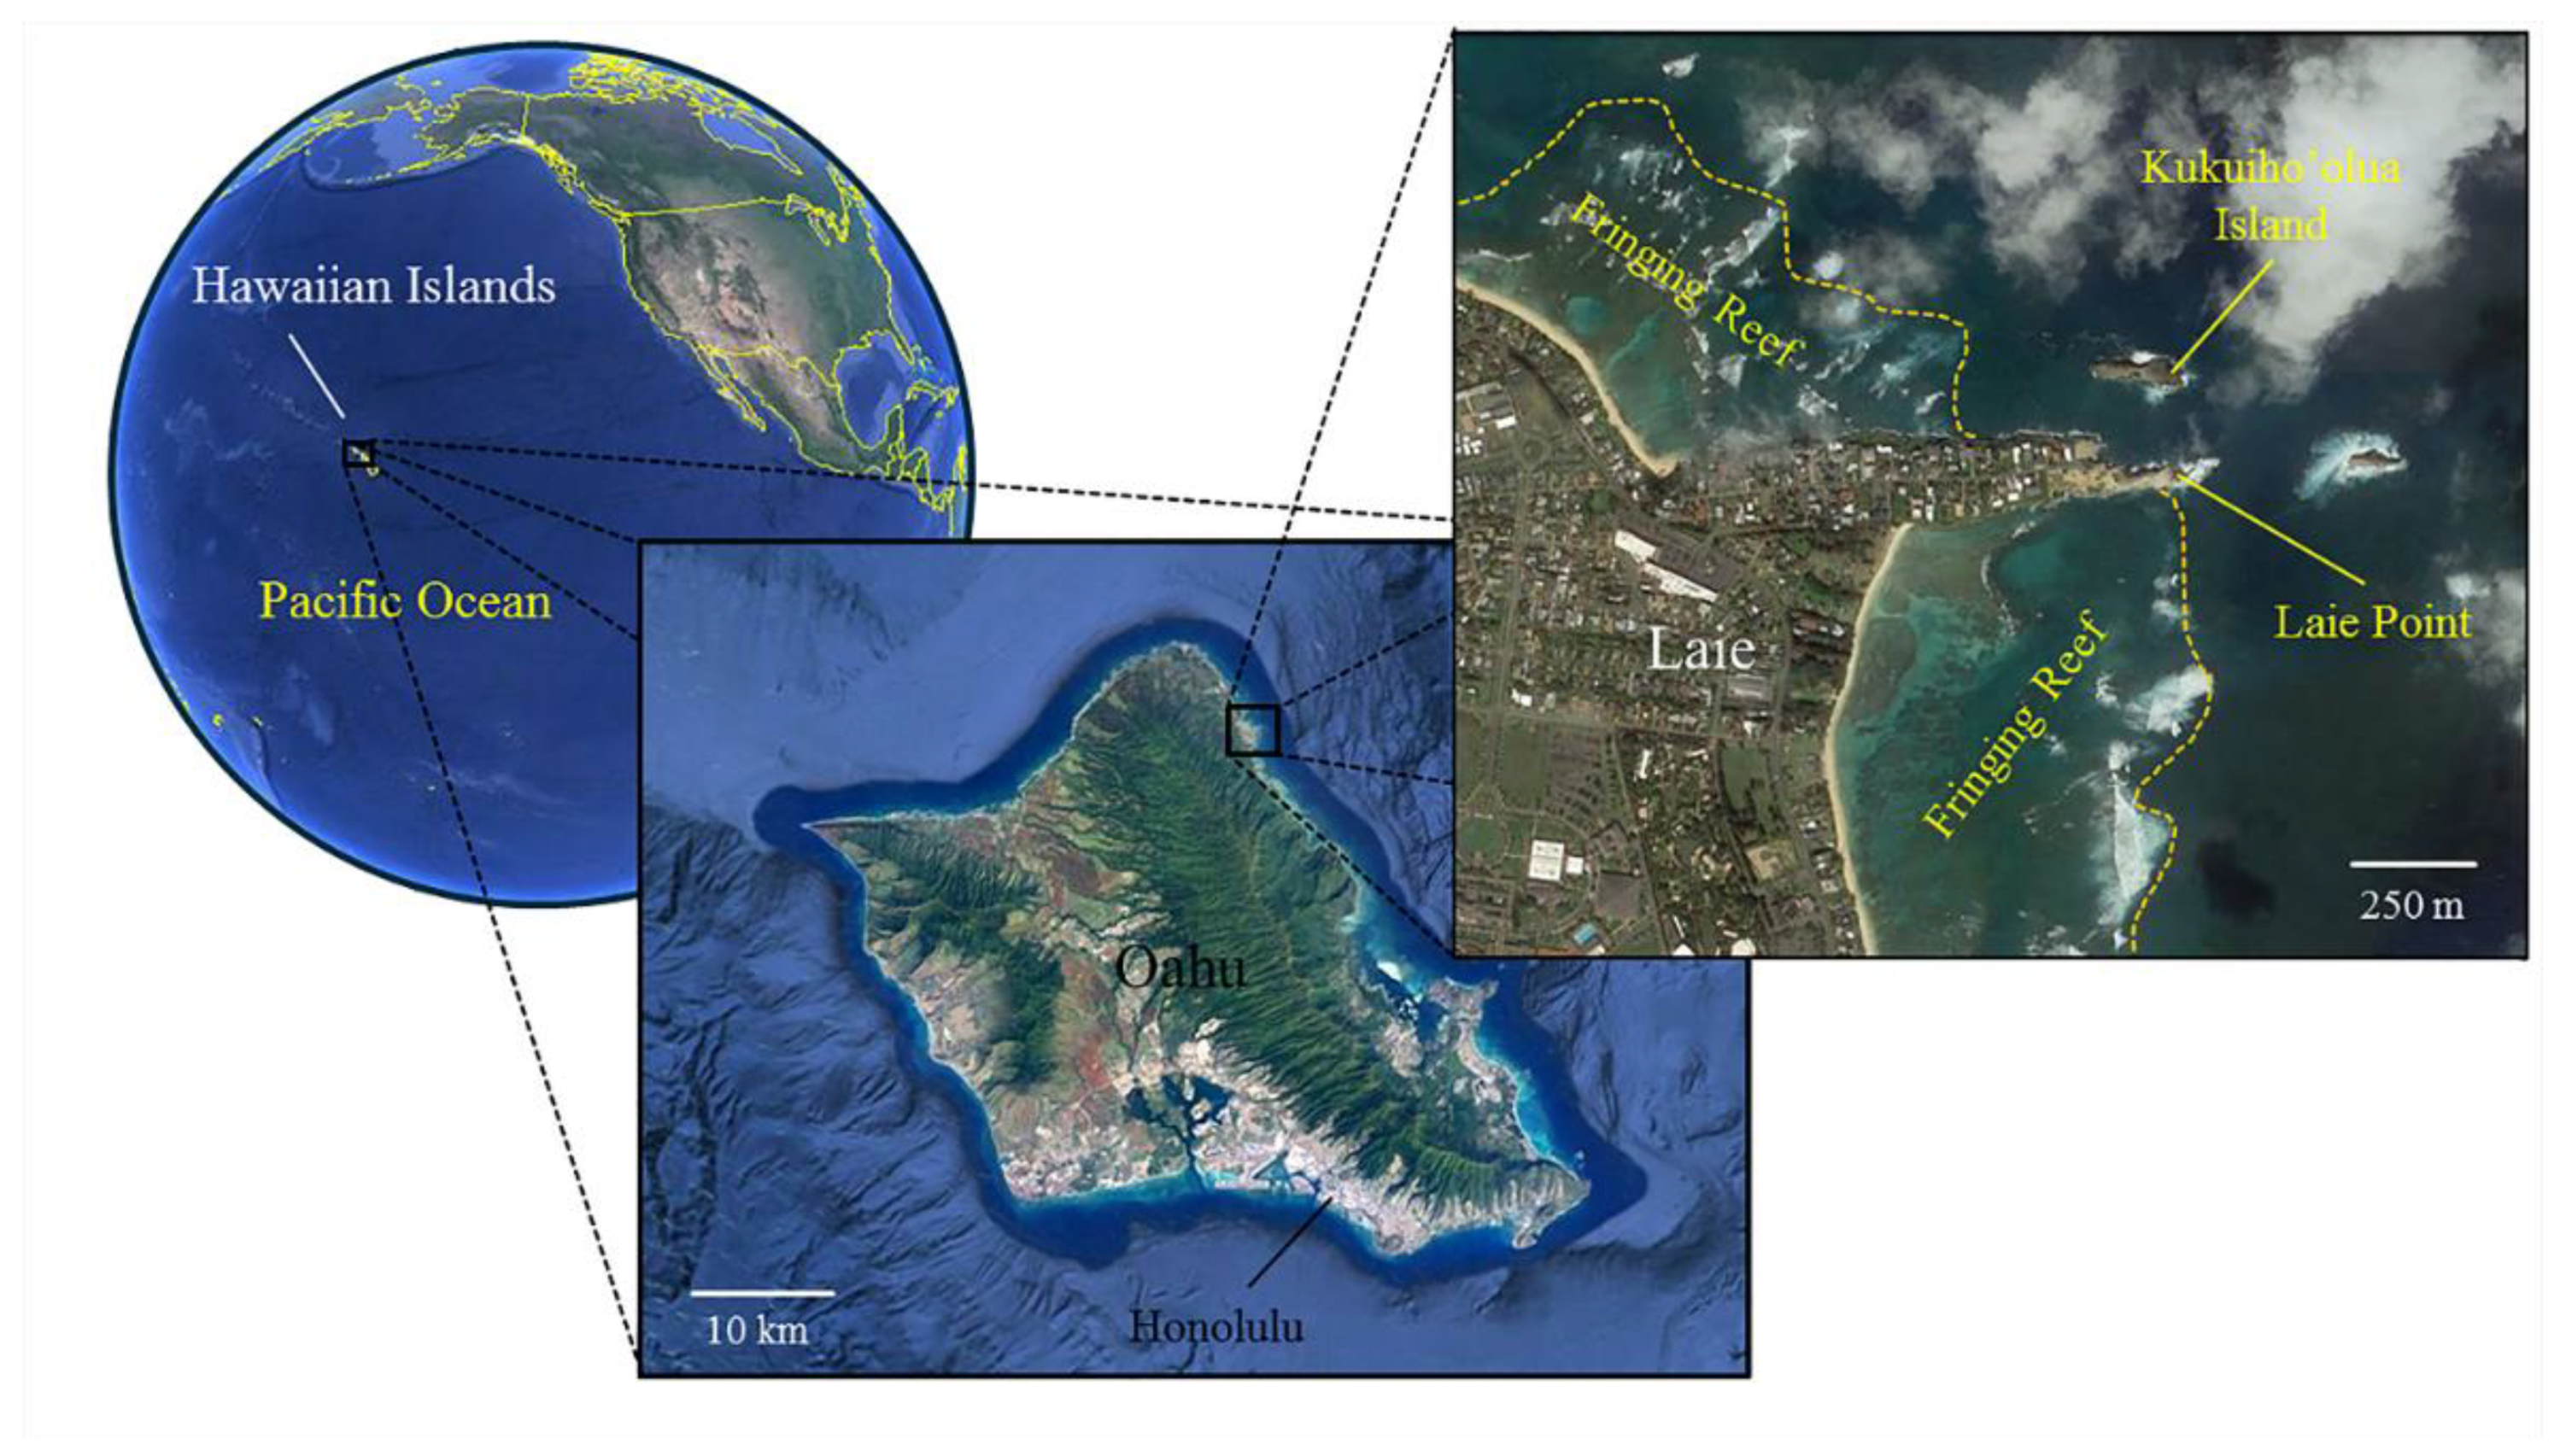
Kukuiho’olua Island is a small, islet that lies 164 m due north of Laie Point (traditionally called Laniloa Point), a peninsula of cemented, coastal, Pleistocene and Holocene sand dunes [5] on the northeastern coast of the Hawaiian Island of Oahu (Figure 1). Kukuiho’olua Island consists of the same dune deposits as Laie Point. The island is 173.75 m in length at its longest, with its eastern area having a width of 47 m, which is the widest part, and a width of 27.5 m on its western side. The island runs due east–west, with a narrow, eroded, center that forms a sea arch [6]. The opening of the arch is perpendicular to the length of the island. The width of this central area that forms the arch is 8.6 m. In addition to Kukuho’olua, there are four other small islands in the vicinity of Laie Point. To the north, the northernmost island is Kihewamoku, with Mokuaia Island (locally known as “Goat Island”) and Pulemoku Island lying between Kihewamoku and Kukuiho’olua. To the southeast of Kukuiho’olua and directly east of Laie Point is another islet named Mokualai Island. The bathymetry around Laie Point, Mokualai Island, and Kukuiho’olua has not been definitively mapped due to dangerous wave and current regimes that are formed when swells generated by the easterly Trade Winds interact with the relatively shallow sea bottom of the area. It is these nearly continuous easterly waves that are the source for the overall erosion of the coastline in this area. Despite the lack of high-quality bathymetric data, it is estimated from satellite data that the area between Laie Point and the nearest islands ranges in depth from 1 m to 3 m. On the outer, open-ocean side of the point and islands, running north and south, the depth increases fairly consistently to depths of 10 m at 300 m from the land. To the east, the depths increase gradually to 20 m at 200 m from land, then the depth increases dramatically as the sides of the island slope into the deep ocean (Figure 1).
Today, although little known compared to other attractions on the Island of Oahu, Laie Point is visited by thousands of tourists each year and is considered by some to be among the most picturesque locations on Oahu—this is mostly due to the sea arch of Kukuiho’olua Island just to the north of the Point. Prior to this work, there has been no scientifically documented account of the changes that have occurred due to coastal erosion at Kukuiho’olua Island and Laie Point, or even the fact that the sea arch exists. The coastal erosion at Kukuiho’olua Island also represents an example of the dramatic coastal changes that can occur, even in lithified sediments, during tsunami and large storm surge events, which often result from El Niño Southern Oscillation (ENSO) conditions.
The Hawaiian Islands are the product of the moving Pacific Plate over a stationary mantle heat source, now called the Hawaiian Hot Spot [7], which has produced numerous volcanoes, each of which extend from the seafloor to its surface [8,9,10,11]. The island of Oahu consists of three, large, shield volcanoes: The newly discovered Kaena Volcano [12], along with the Wainae and Ko’olau volcanoes. Kaena, the oldest, is estimated to be 3.5–4.9 Ma [13]. The Wainae Volcano was active between 3.08 and 3.93 Ma [14]. The Ko’olau Volcano is the youngest and was active between at least 2.1 and 3.3 Ma [15].
Oahu is surrounded by modern and fossil fringing reefs that likely began forming shortly after the onset of the erosional stage of volcanic island evolution [6].
It has long been noted that local sea levels have varied widely over the geologic history of the Hawaiian Islands [16,17,18,19]. As each island formed during its time over the Hawaiian Hotspot, lithospheric loading due to the eruption and solidification of flows caused significant subsidence and local sea level rise. Subsequent erosion and mass wasting reduced the mass of the islands and led to isostatic readjustment and uplift as the various islands moved away from the hot spot [20,21,22]. This uplift has led to the subaerial exposer of the reefs. In addition, over the entire time of its formation and erosion, the island of Oahu has been impacted by eustatic sea level changes brought on by intermittent glacial and interglacial periods that have been occurring over the last few Ma, since the beginning of the Pleistocene [19,23].
The fossil reefs, and carbonate sediments that subsequently formed from them, underlie and form the bulk rock of Laie Point and Kukuiho’olua Island. As mentioned above, the majority of the rock in the subaerially exposed part of the Point and the island consist of lithified Holocene and Pleistocene beach dunes, all of which are considered to be less than 150 ka. These dunes are thinly bedded and are thought to have resulted from sand being blown and concentrated from off of the reef flat during a glacial low stand in sea level [24,25]. The smaller islands of Kihewamoku, Pulemoku, and Mokualai are formed from the same dune deposits. The largest island, Mokuaia, instead consists of late Pleistocene to recent reef, 11 ka or younger, and is capped by even more recently formed sand (Figure 2) [5,26]. It is thought that all of the islands are sea stacks that were once connected to headlands. Kihewamoku was connected to a point south of the present-day Kahuku Golf Course, in an area known as Adams Field, while Mokuaia and Pulemoku were connected to a point at the Malaekahana State Recreation Area. Kukuiho’olua and Mokualai were connected to Laie Point (Figure 2).
1.3. Kukuiho’olua Island in Human History
In Hawaiian mythology, Laie Point and the nearby islands formed when a great warrior, named Kana, set out to kill a mo’o or giant lizard, which had killed many people in the area. Kana easily defeated the mo’o and chopped it into five pieces and tossed them into the sea [27]. Kukuiho’olua Island as considered the head because it had large sea caves on the north and south sides that resembled eye sockets.
In 1865, the area of Lai’e was purchased by the Church of Jesus Christ of Latter-day Saints (LDS) as a place for new Mormon converts to gather and form a community [28]. In 1868 the area of Lai’e, in order to become self-sufficient, was turned into a large sugar plantation with a sugar mill [28]. However, although Laie Point is mentioned from time to time, there is little to no descriptive record of the offshore islets in the plantation records. Even early geologists such as J. B. Pollock and H.T. Stearns say almost nothing about the islands at Laie Point. Stearns [18] only mentions the Point as a type area for one of the glacial-interglacial sea level stands and gives a very brief description of the rock-type.
2. Materials and Methods
Analysis was conducted by examination of archival images of Kukuiho’olua Island relative to its current state, with particular focus on images taken just prior to and just after the events of 24–25 February 2016. Images were collected the morning of 25 February using a Canon Powershot SX500 IS digital camera on auto settings. Archival images were taken from the Brigham Young University-Hawaii Archives, which did not include camera information.
Basic field measurements of erosion were taken using a standard field tape and photo scale. Google Earth, with its built-in ruler tool, and aerial images taken with a Mavic 2 Pro UAS were used to make an estimate of the size and volume of the boulder dislodged from the sea arch. The mass was calculated by extrapolating the density of a sample of Laie Point sandstone to the volume of the boulder.
3. Results
3.1. 1946 Tsunami
On 1 April 1946, a large tsunami was generated when a Ms = 7.4 earthquake, and likely (but controversial) subsequent, underwater landslide occurred in the Aleutian Trench south of Alaska [31,32,33,34,35,36,37,38]. This earthquake and tsunami have come to be known as the “April Fools Earthquake and Tsunami.” The April Fools Tsunami of 1946 reached Laie sometime between 5:55 am local time, which is when its arrival was recorded at the island of Kauai, and 6:30 am, when is when it was recorded at Honolulu, on the south side of Oahu (Figure 1) [39].
3.2. 2015–2016 El Niño-Generated Waves
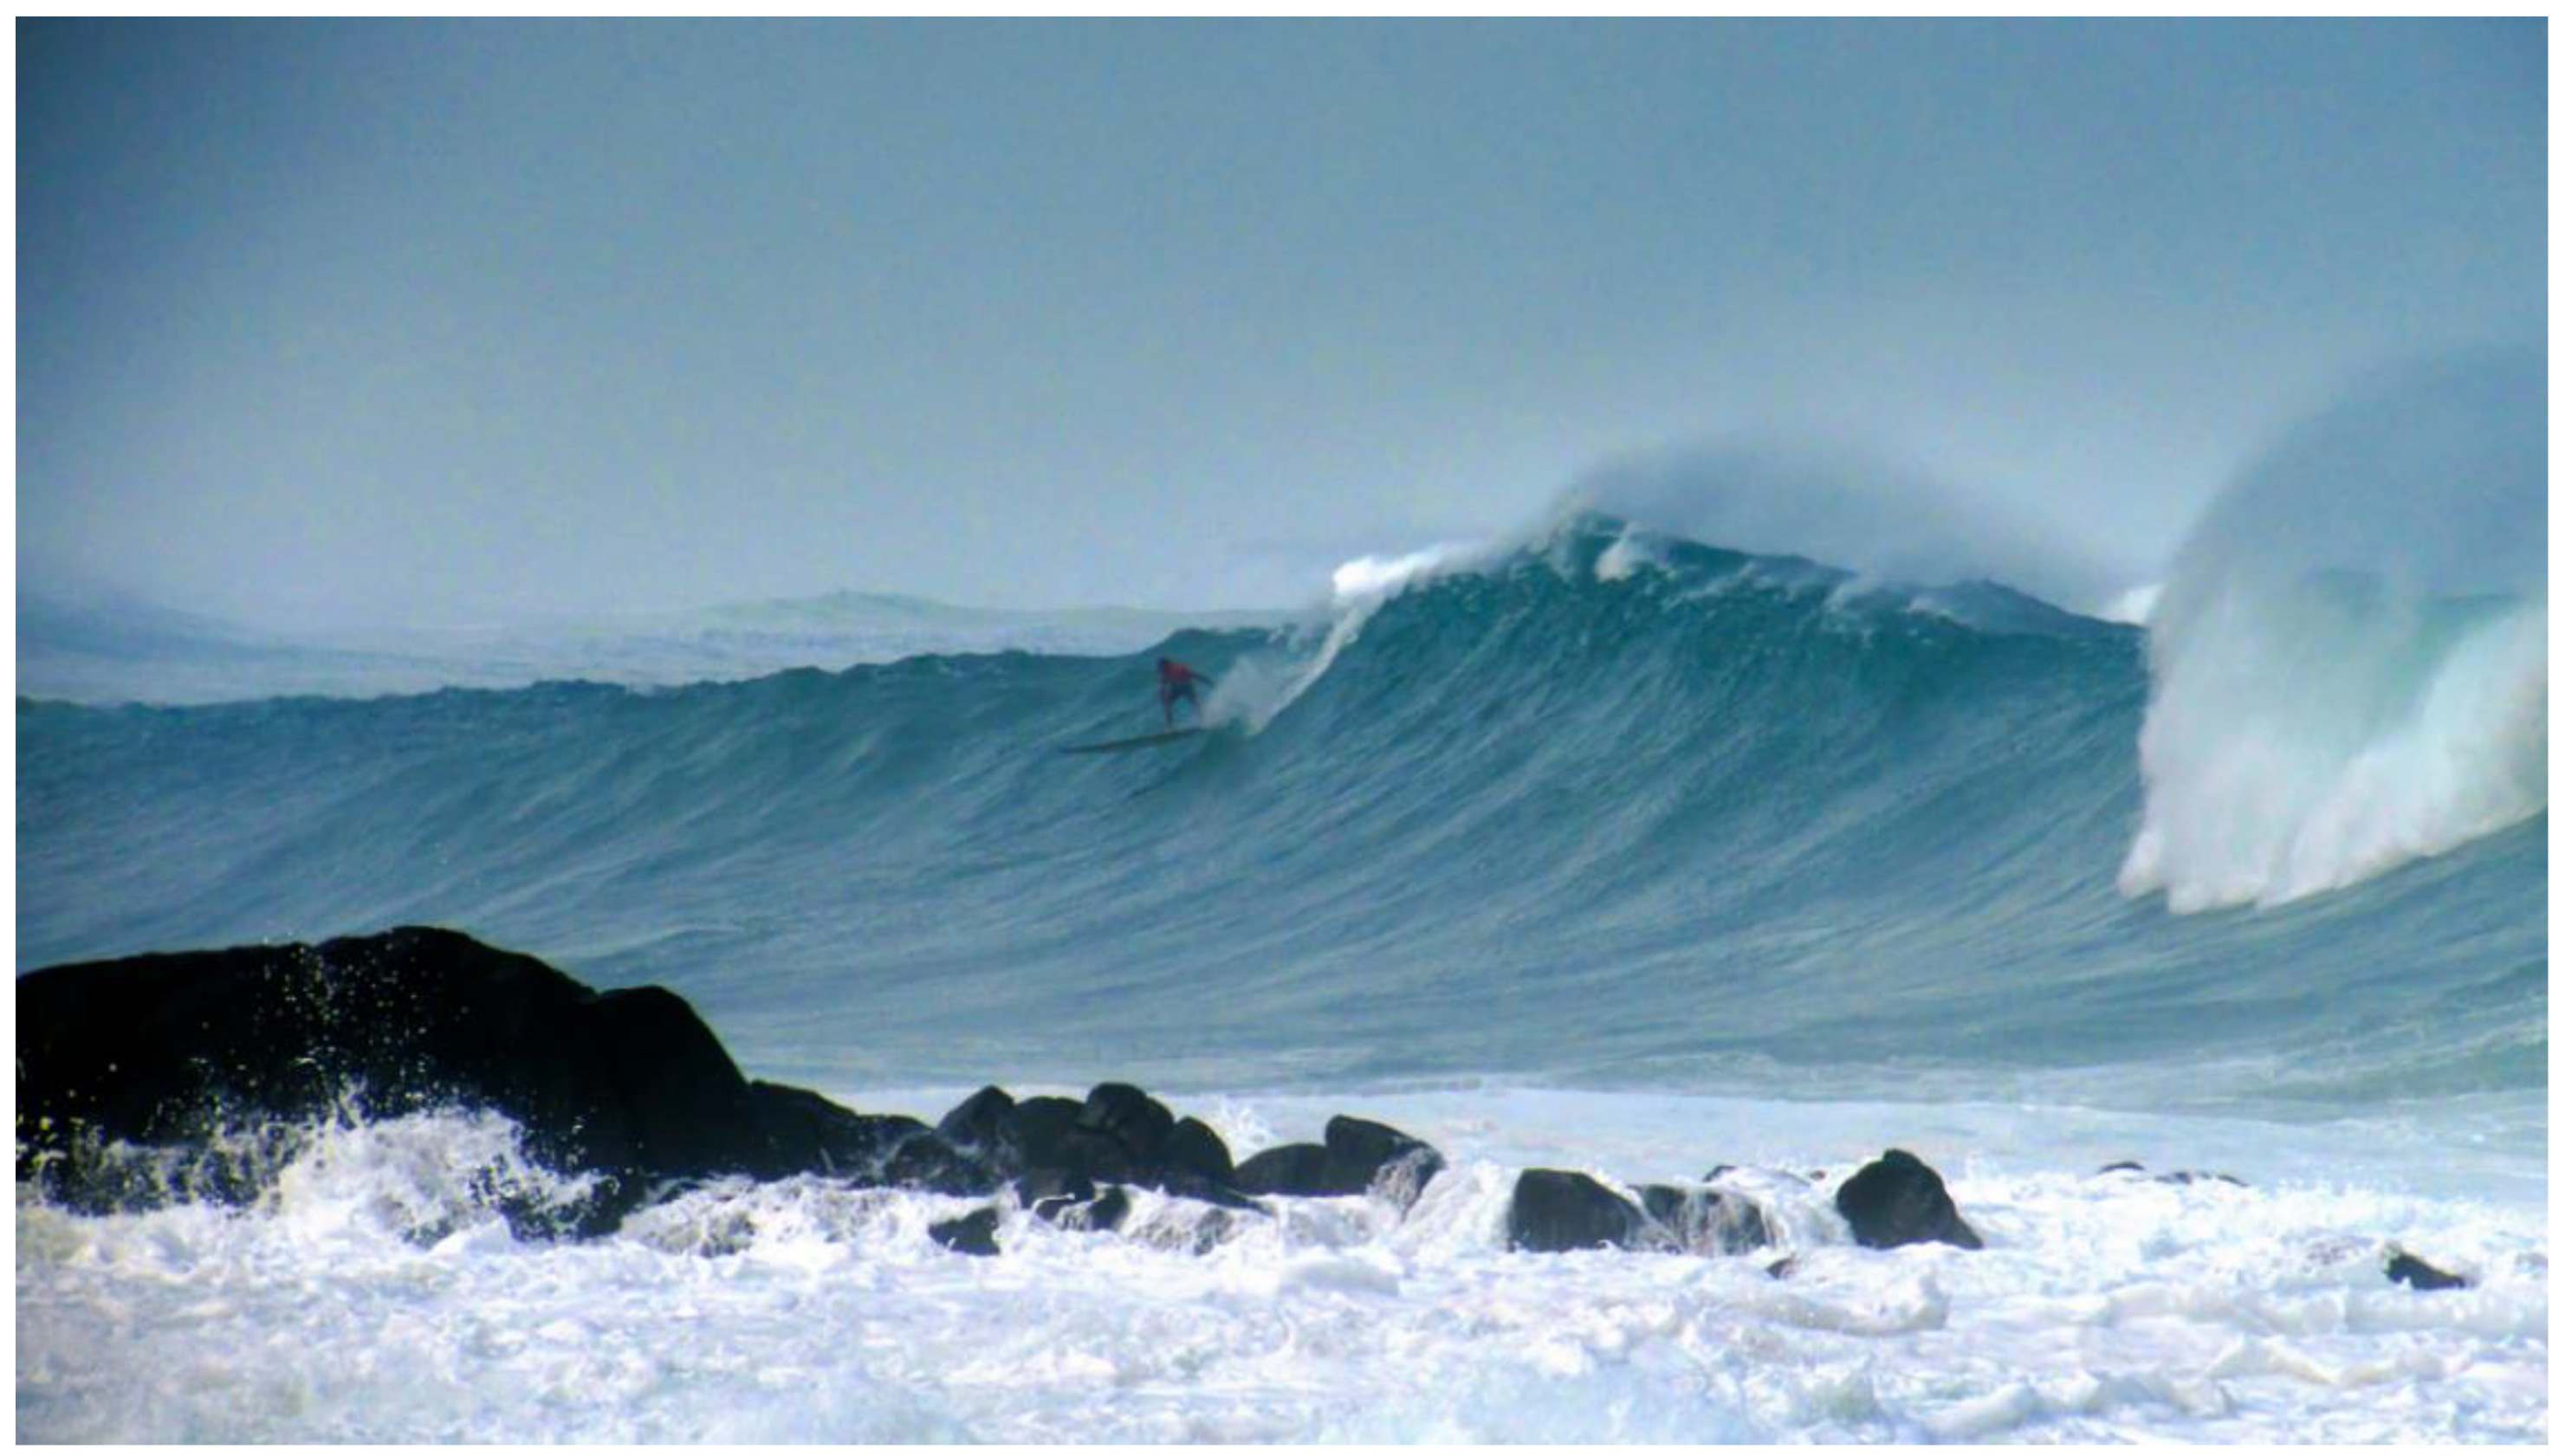
During the evening of 24–25 February 2016, a low-pressure system in the North Pacific generated large swells that approached Oahu from the northwest and reached the North Shore and Laie beginning around 22:00 local time on the 24th, peaking in the late morning, but continuing through the next two days [40]. These waves coincided with high tide in Laie around 04:00 (Table 1) [29]. Breaking wave heights along the North Shore during this period were as much as 20 m in height (Figure 3) [41].
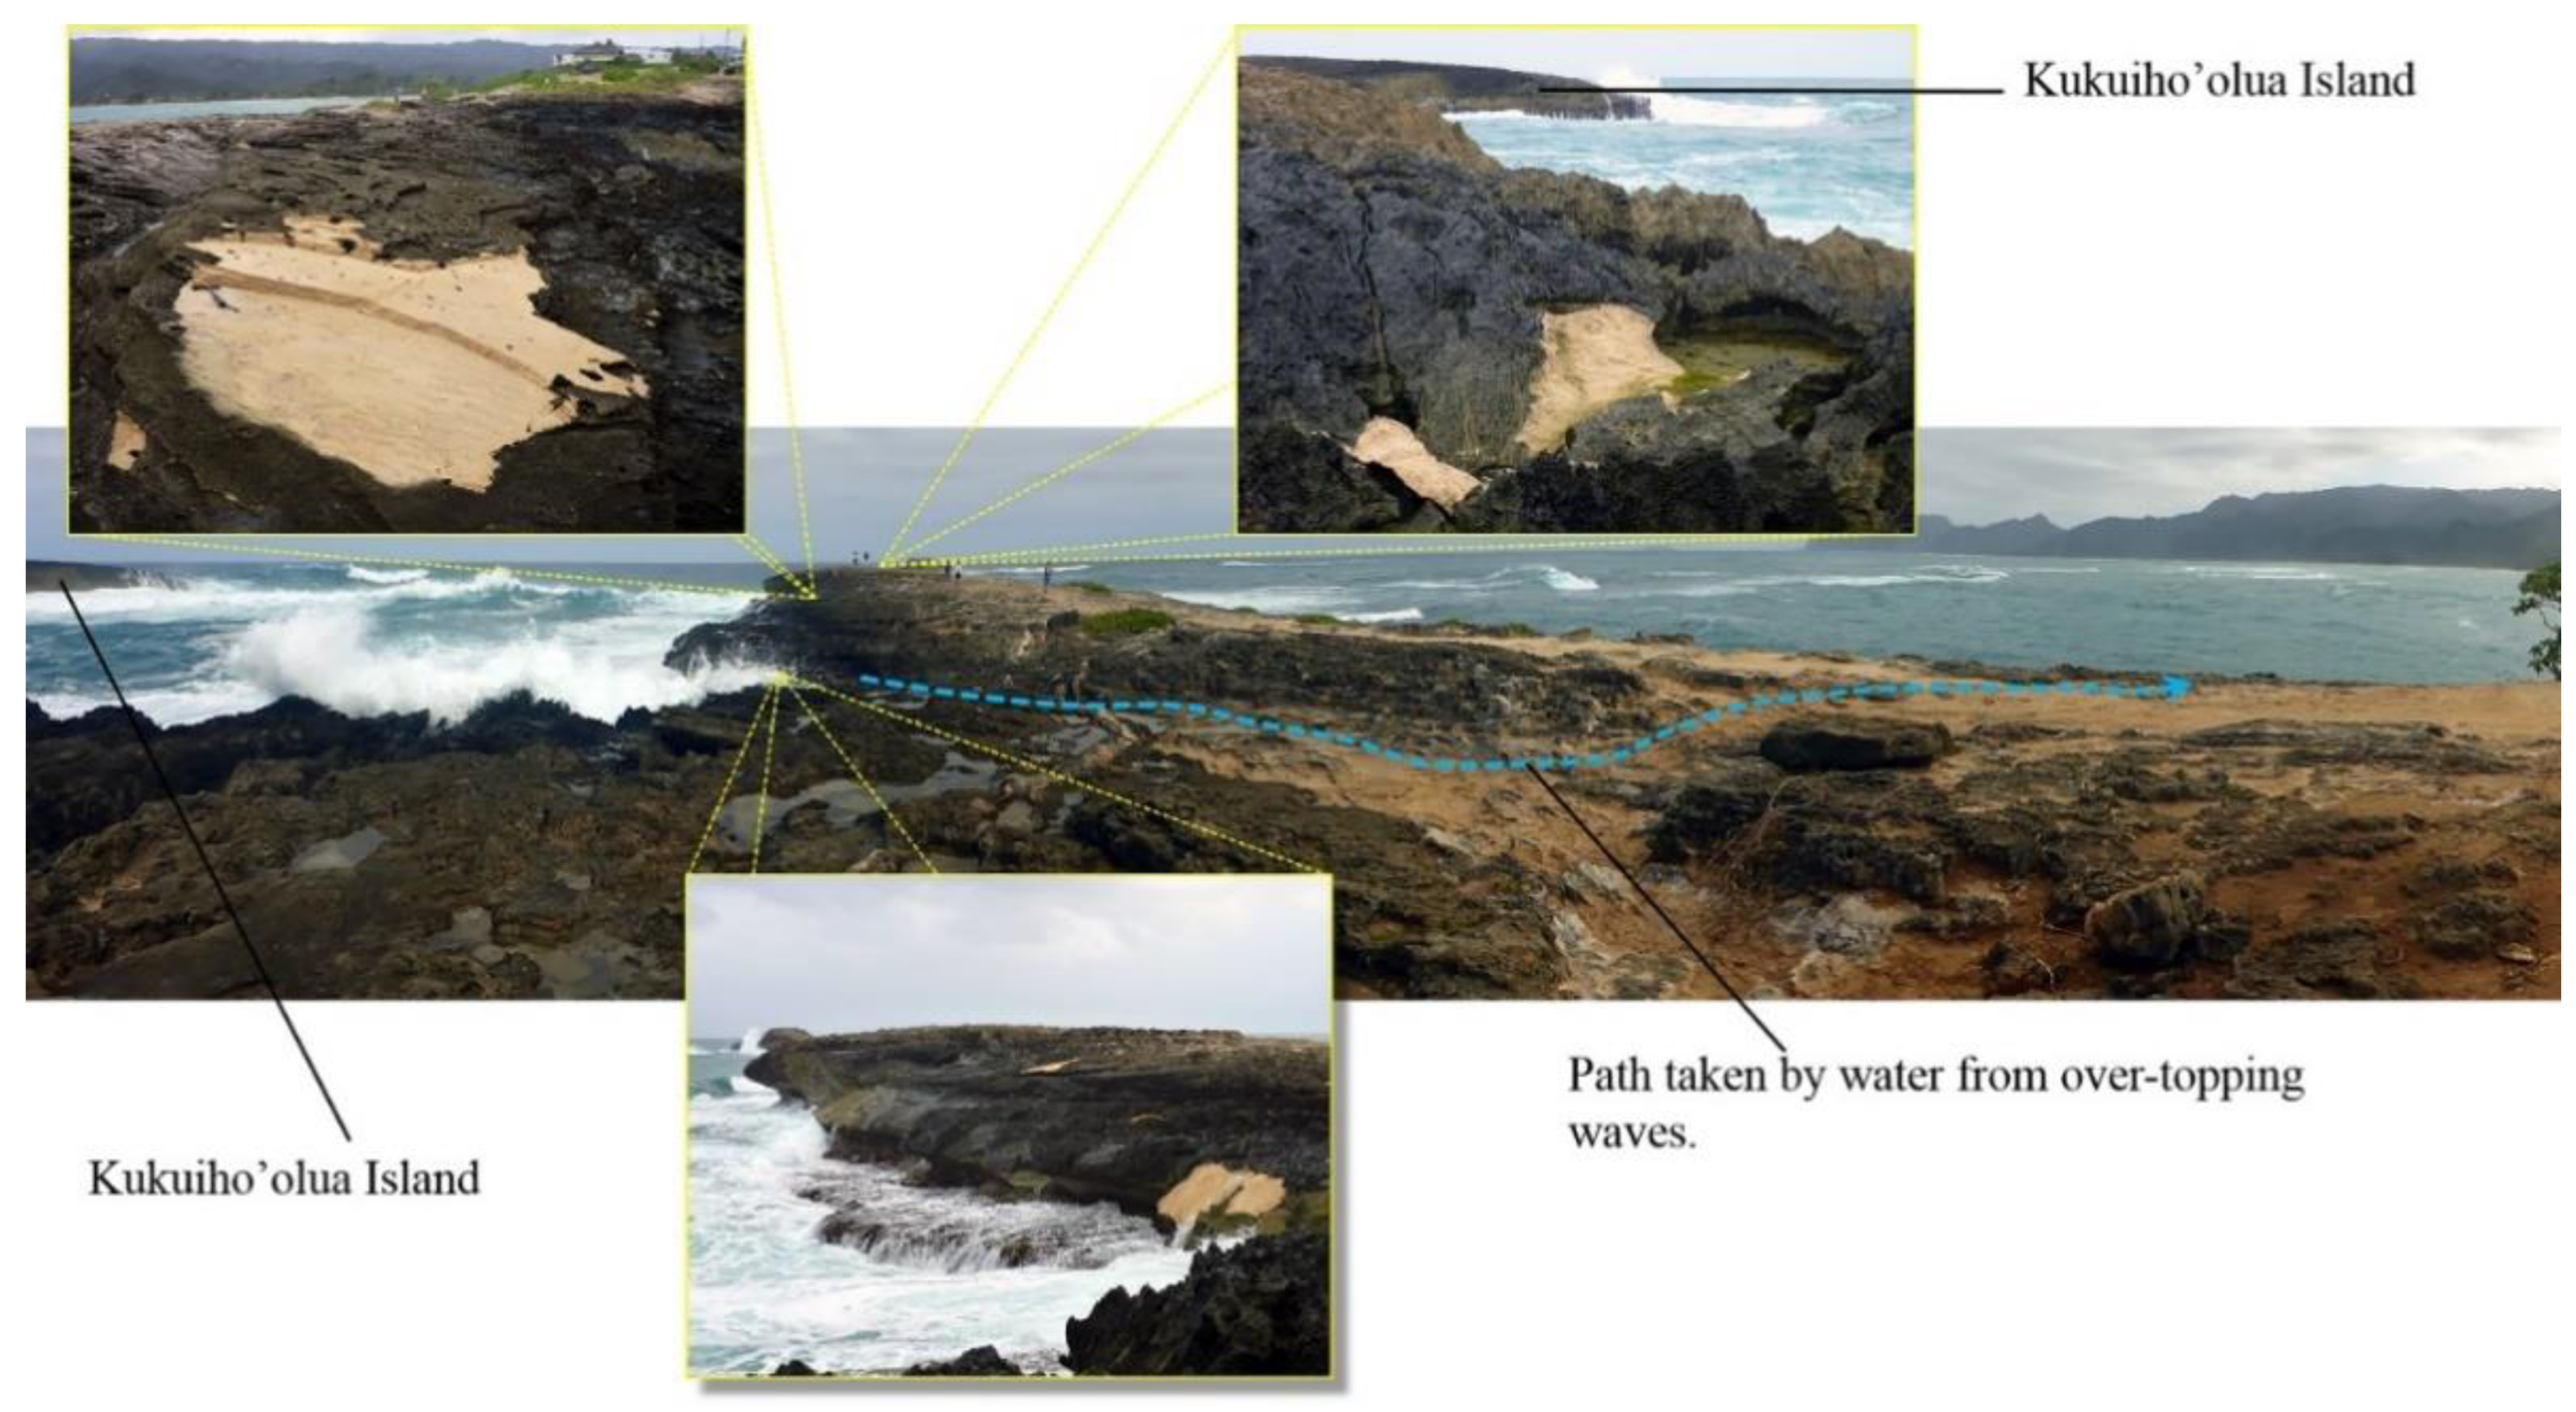
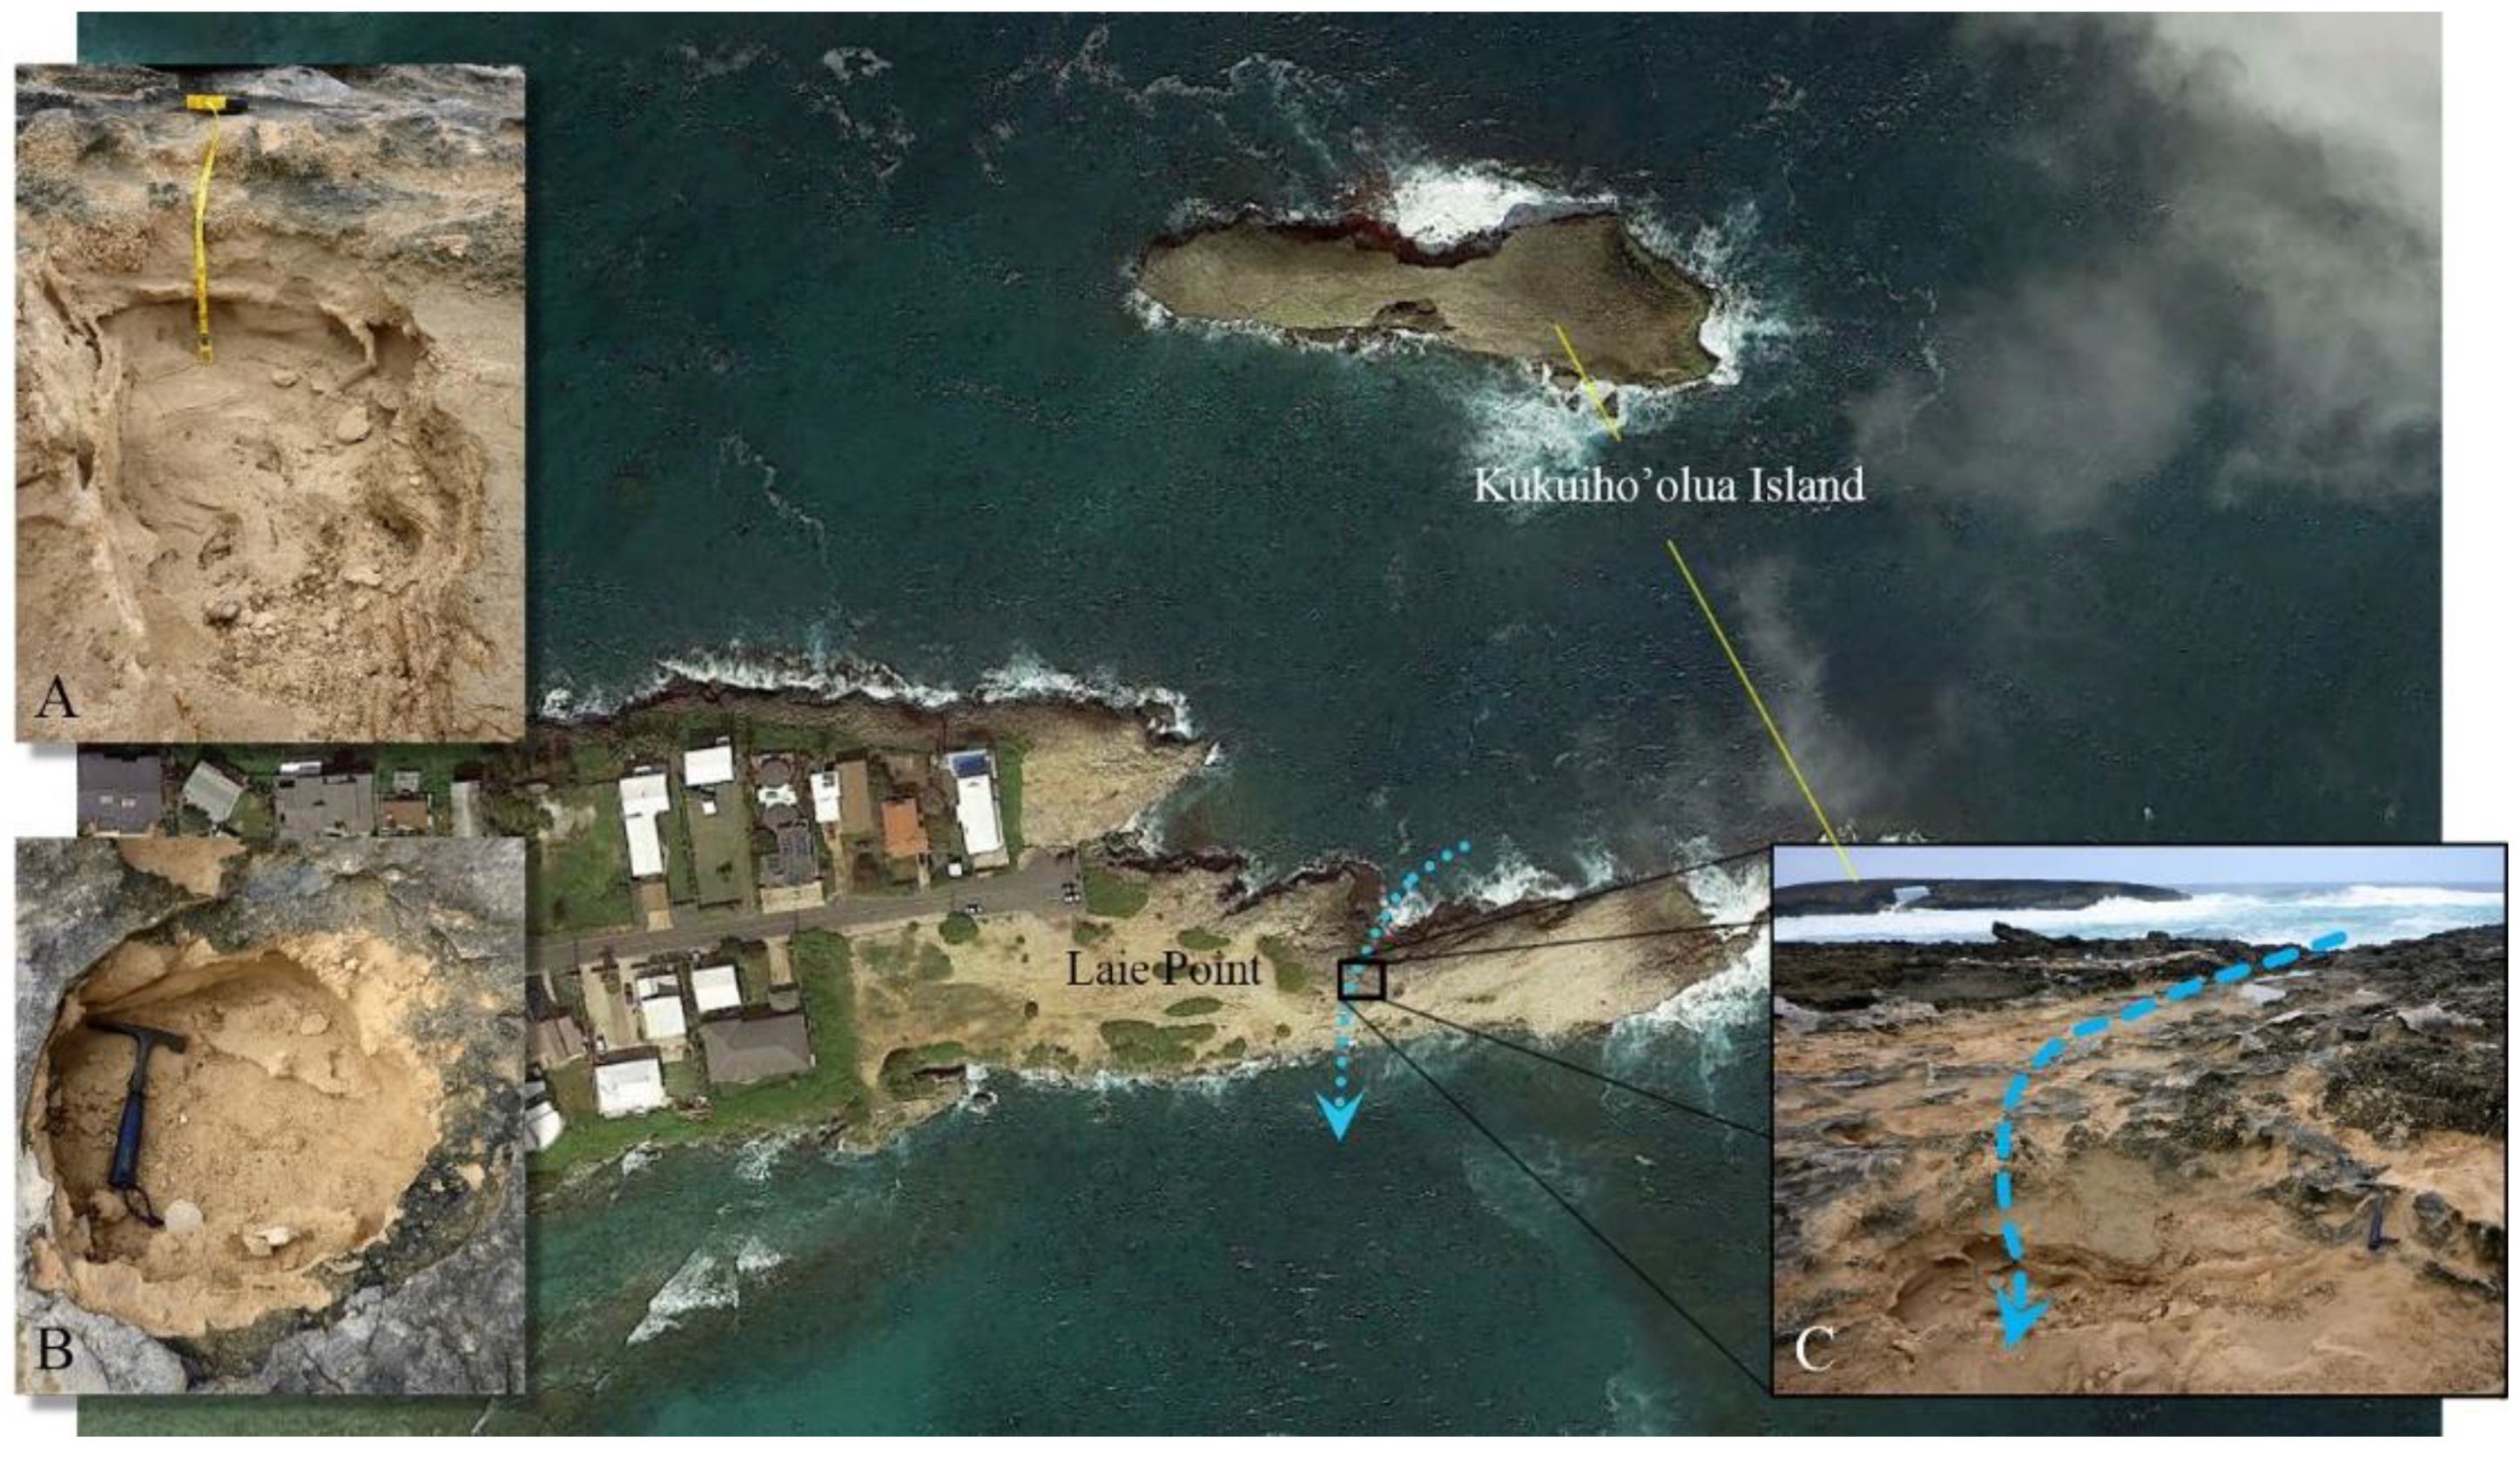
Observations later in the day provided evidence for significant removal of rock and sand from Laie Point (Figure 4). In addition, there was significant evidence that the largest waves may have overtopped the middle-part of the Point and that water likely flowed across the peninsula. This is evidenced from erosion pits lying along a path of freshly eroded sand and rock running from the north side of the peninsula to its southern edge (Figure 5). In addition to the pits and fresh surfaces, there were multiple standing pools of sea water on the upper platform of Laie Point.
4. Discussion
Although Kukuiho’olua Island lies near the mainland of Oahu, it still lies on the outside edge of Oahu’s surrounding, fringing reef (Figure 1), which means that there would have likely been little to no dampening effect on the size and energy of the tsunami when it arrived at the island during the 1946 tsunami. Dampening was observed at other locations lying within the reefs [42]. The run-up on the north side of Laie Point, where the island lies, was 8.2 m, which was higher than in any other area along the 20 km of coast running north and south from the Point. In fact, this height was one of the highest run-ups on the whole of Oahu [32].
As described above, local witnesses state that prior to the 1946 tsunami, no sea arch existed at Kukuiho’olua Island. Instead, two large, but shallow, sea caves existed on either side of the island. They all state that the arch formed during the 1946 tsunami. The traditional way of describing sea arch formation almost always refers to gradual erosion over time as incoming, wind-generated waves refract around some coastal point or headland, concentrating their energy in an area behind the most seaward point of the land, which leads to the formation of opposing, semi-symmetrical sea caves. Continued erosion at the back of the caves leads to collapse and a joining of the caves to form a sea arch. The process has been specifically mentioned in conjunction with the sea arch at Kukuiho’olua Island [6]. The initial sea caves on either side of Kukuiho’olua Island likely formed in this way.
Although the rocky shorelines of Hawaii have been poorly studied [43] and no scientific record of the tsunami impacts to Kukuiho’olua Island exist, some models support the possibility that the final formation of the arch resulted from the 1946 tsunami. In models designed and run by Zhao et al. [39], the force of a tsunami wave becomes more concentrated at sea cliffs which have over hanging (>90°) slopes. They determined that a “pressure peak,” of concentrated force is very frequent in coastal areas with undercut sea cliffs. This is especially true if the submarine slope leading up to the cliff is short. All such conditions exist at Laie Point and Kukuiho’olua Island. Their models support the idea that when the 1946 tsunami reached Kukio’olua Island, given the overhanging nature of the sea cave and the abrupt shallowing of the ocean at the foot of the island, the pressure force generated by the wave hitting the island would have been concentrated within the cave. This intense force is what would have caused the breakthrough and collapse at the back of the cave, leading to the formation of the present-day arch.
The work by Zhao et al. [44] and the accounts of eyewitnesses referred to above, suggest that tsunami waves, while not necessarily significant over time when compared with wind-generated waves, can play a larger role in coastal evolution and sea arch formation than previously considered, even in lithified sediments.
In addition to the example above, others have demonstrated that erosion of coastal cliffs is often intermittent and can be very localized in nature and that short-term erosion rates can be very different from long-term ones [45,46]. Such rates of erosion and changes to coastal topography are also often heavily influenced by storm-generated waves [45].
The El Niño that occurred during the 2015–2016 northern hemisphere winter was one of the strongest El Niño events in the last 65 years [47,48,49], and the largest since the 1997–1998 El Niño [50]. This El Niño led to large, slow, and steady-moving storms, which generated large, consistent wave trains that moved outward from winter storm systems in the North Pacific, where they impacted coastal areas thousands of kilometers from the source area. These storms resulted from the baroclinic instabilities created by the convergence of strong, El Niño-generated, horizontal, temperature gradients and strong pressure gradients, especially in the Equatorial Pacific [50]. There was a very strong reversal in sea surface pressure gradient (Figure 6) that resulted in a change from the usual, easterly Trade Winds to form a new wind regime that came from the west and northwest (Figure 7) [43,44]. The waves from these storm systems approached the North Shore of Oahu from the west and northwest throughout the 2015–2016 El Niño event.
Sunrise in Laie that morning was at 06:56 local time, nearly three hours after the highest tide, which is likely why there were no direct witnesses to the changes that occurred at the Kukuiho’olua sea arch and across Laie Point. Sunrise viewers and other visitors to Laie Point that morning noted that the large boulder, consisting of the same cemented dune material as the Kukuiho’olua Island sea arch and lying beneath it had been moved from beneath the arch and had fallen into the sea (Figure 8). Aerial surveys by a Mavic 2 Pro sUAV were used to approximate the size of the boulder as being roughly 25 m3 in volume (4.4 m × 2.4 m × 2.4 m). The aerial images combined with a density analysis of sandstone collected from Laie Point, suggests that the boulder had an approximate mass of 135,000 kg. Given the tides and the wave heights, it is most likely that that the boulder was moved sometime around 04:00, when the power of the waves concentrated around the point would likely have been greatest.
The large erosion pits and pools of standing water on Laie Point itself support the likelihood that the wave heights were significant. These observations are important because Laie Point, as mentioned, is a popular location for many locals and tourists. It is especially popular as a night fishing location. Unwary individuals could face an unexpected wave hazard and the possibility of being swept off and into the sea if a similar combination of waves and tides occurs in the future.
On a day to day scale, little change is apparent at Laie Point and Kukuio’olua Island. However, a comparison of images over time, coupled with the significant changes in 1946 and 2016 illustrated that although changes may be intermittent (Figure 9), when changes do happen, they can occur quickly and dramatically. This is true even when the erosion is not associated with extreme, local weather events, such as a hurricane, but rather because of distant earthquakes or waves generated by the overall climate system within the Pacific.
5. Conclusions
While being one small location in the Pacific Ocean, the changes that have occurred at Laie Point and Kukuiho’olua Island, during both the 1946 “April Fools’ Tsunami” and the 2015–2016 El Niño, serve as dramatic examples of the rapidity at which coastal changes can occur after long periods of seeming stasis. The recent impacts of the waves at Laie Point were significant and dramatic. By eroding a 25 m3-sized boulder from within the arch, they changed a well-known and popular landmark (some would say for the better) in a single night or morning. These changes suggest that additional events of similar magnitude produced during tsunamis or El Niño conditions, and possibly coinciding with high tide, can lead to rapid, unexpected, and possibly hazardous changes to areas that are often taken for granted to be relatively unchanging on human timescales. Coastal monitoring, especially during extreme El Niño years, should be of a high priority for local communities as much as it is for larger regions.
Author Contributions
All work related to this research was done by B.R.J. All authors have read and agreed to the published version of the manuscript.
Funding
This research received no external funding.
Institutional Review Board Statement
Not applicable.
Informed Consent Statement
Not applicable.
Data Availability Statement
All data is found within the text of the article.
Acknowledgments
The author is especially grateful to Wei Shi, meteorologist at the Climate Prediction Center (NCEP/NWS/NOAA) for his help with the ENSO condition plots, and Dale Hammond, emeritus professor at Brigham Young University-Hawaii, for his 1959 photograph. The archives at BYU-Hawaii were also valuable in locating other, historical photographs.
Conflicts of Interest
The author declares no conflict of interest.
References
- Gehrels, R. Sea-level changes since the Last Glacial Maximum: An appraisal of the IPCC Fourth Assessment Report. J. Quat. Sci. 2009, 25, 26–38. [Google Scholar] [CrossRef]
- Gehrels, W.R.; Woodworth, P.L. When did modern rates of sea-level rise start? Glob. Planet. Chang. 2013, 100, 263–277. [Google Scholar] [CrossRef]
- Lokier, S.W.; Court, W.M.; Onuma, T.; Paul, A. Implications of sea-level rise in a modern carbonate ramp setting. Geomorphology 2018, 304, 64–73. [Google Scholar] [CrossRef]
- Felton, E. Sedimentology of rocky shorelines: 1. A review of the problem, with analytical methods, and insights gained from the Hulopoe Gravel and the modern rocky shoreline of Lanai, Hawaii. Sediment. Geol. 2002, 152, 221–245. [Google Scholar] [CrossRef]
- Sherrod, D.R.; Sinton, J.M.; Watkins, S.E.; Brunt, K.M. Geologic Map of the State of Hawaii; Open-File Report; U.S. Geological Survey: Hilo, HI, USA, 2007. [Google Scholar] [CrossRef] [Green Version]
- Macdonald, G.A.; Abbott, A.T.; Peterson, F.L. Volcanoes in the Sea: The Geology of Hawaii, 2nd ed.; University of Hawaii Press: Honolulu, HI, USA, 1983; pp. 267–275. [Google Scholar]
- Zhao, D.; Ochi, F.; Takahashi, E.; Lipman, P.W.; Garcia, M.O.; Naka, J.; Aramaki, S. Seismic images of hotspots and mantle plumes. In Sea Ice; American Geophysical Union (AGU): Washington, DC, USA, 2002; Volume 128, pp. 349–364. [Google Scholar]
- Jackson, E.D.; Silver, E.A.; Dalrymple, G.B. Hawaiian-Emperor Chain and Its Relation to Cenozoic Circumpacific Tectonics. GSA Bull. 1972, 83, 601–618. [Google Scholar] [CrossRef]
- Clague, D.A.; Dalrymple, G.B.; Moberly, R. Petrography and K-Ar Ages of Dredged Volcanic Rocks from the Western Hawaiian Ridge and the Southern Emperor Seamount Chain. GSA Bull. 1975, 86, 991–998. [Google Scholar] [CrossRef]
- Jackson, E.; Koisumi, I.; Dalrymple, G.; Clague, D.; Kirkpatrick, J.; Greene, H. Introduction and Summary of Results from DSDP Leg 55, the Hawaiian-Emperor Hot-Spot Experiment. In Initial Reports of the Deep Sea Drilling Project; International Ocean Discovery Program (IODP): College Station, TX, USA, 1980; Volume 55, pp. 5–31. [Google Scholar]
- Cox, R. Hawaiian volcanic propagation and Hawaiian swell asymmetry: Evidence of northwestward flow of the deep upper mantle. Tectonophysics 1999, 310, 69–79. [Google Scholar] [CrossRef]
- Sinton, J.M.; Eason, D.; Tardona, M.; Pyle, D.; Van Der Zander, I.; Guillou, H.; Clague, D.A.; Mahoney, J.J. Ka’ena Volcano—A precursor volcano of the island of O’ahu, Hawai’i. GSA Bull. 2014, 126, 1219–1244. [Google Scholar] [CrossRef]
- Sinton, J.M.; Eason, D.E. Growth history of Kaena Volcano, the isolated, dominantly submarine, precursor volcano to Oahu, Hawaii. In Proceedings of the American Geophysical Union Fall Meeting 2014, San Francisco, CA, USA, 15–19 December 2014. [Google Scholar]
- Guillou, H.; Sinton, J.; Laj, C.; Kissel, C.; Szeremeta, N. New K–Ar ages of shield lavas from Waianae Volcano, Oahu, Hawaiian Archipelago. J. Volcanol. Geotherm. Res. 2000, 96, 229–242. [Google Scholar] [CrossRef]
- Yamasaki, S.; Sawada, R.; Ozawa, A.; Tagami, T.; Watanabe, Y.; Takahashi, E. Unspiked K–Ar dating of Koolau lavas, Hawaii: Evaluation of the influence of weathering/alteration on age determinations. Chem. Geol. 2011, 287, 41–53. [Google Scholar] [CrossRef]
- Hitchcock, C.H.; Dall, W.H. Geology of Oahu. GSA Bull. 1900, 11, 15–60. [Google Scholar] [CrossRef]
- Pollock, J.B. Fringing and fossil coral reefs of Oahu. Bernice P. Bish. Mus. Bull. 1928, 55, 1–56. [Google Scholar]
- Stearns, H.T. Pleistocene shore lines on the islands of Oahu and Maui, Hawaii. GSA Bull. 1935, 46, 1927–1956. [Google Scholar] [CrossRef]
- Stearns, H.T. Geology of the State of Hawaii, 2nd ed.; Pacific Books: Palo Alto, CA, USA, 1985; p. 335. [Google Scholar]
- Smith, J.R.; Wessel, P. Isostatic Consequences of Giant Landslides on the Hawaiian Ridge. Pure Appl. Geophys. PAGEOPH 2000, 157, 1097–1114. [Google Scholar] [CrossRef]
- Moore, J.G.; Clague, D.A.; Takahashi, E.; Lipman, P.W.; Garcia, M.O.; Naka, J.; Aramaki, S. Mapping the Nuuanu and Wailau landslides in Hawaii. Sea Ice 2002, 128, 223–244. [Google Scholar] [CrossRef]
- Yokose, H.; Takahashi, E.; Lipman, P.W.; Garcia, M.O.; Naka, J.; Aramaki, S. Landslides on the windward flanks of Oahu and Molokai, Hawaii: Shinkai 6500 submersible investigations. In Sea Ice; American Geophysical Union (AGU): Washington, DC, USA, 2002; Volume 128, pp. 245–261. [Google Scholar]
- Lum, D.; Stearns, H.T. Pleistocene Stratigraphy and Eustatic History Based on Cores at Waimanalo, Oahu, Hawaii. GSA Bull. 1970, 81, 1–16. [Google Scholar] [CrossRef]
- Snow, P.; Stearns, H.T. Geology of the State of Hawaii and Road Guide to Points of Geologic Interest in the Hawaiian Islands. Geogr. J. 1967, 133, 236. [Google Scholar] [CrossRef]
- Macdonald, G.A.; Kyselka, W. Anatomy of an Island: A Geological History of Oahu; Bishop Museum Press: Honolulu, HI, USA, 1967; pp. 29–31. [Google Scholar]
- Stearns, H.T. Geologic Map and Guide of the Island of Oahu, Hawaii; Hawaii Division of Hydrography: Honolulu, HI, USA, 1939. [Google Scholar]
- Rice, W.H. Laniloa—The Mo’o: A Legend of Oahu, in Hawaiian Legends. Bernice P. Bish. Mus. Bull. 1923, 3, 112. [Google Scholar]
- Britsch, R.L. Moramona: The Mormons in Hawai’i; The Institute for Polynesian Studies: Laie, HI, USA, 1989; p. 240. [Google Scholar]
- Tides and Currents. Available online: https://tidesandcurrents.noaa.gov/ (accessed on 18 May 2017).
- ESRL Sunrise/Sunset Calculator. Available online: https://www.esrl.noaa.gov/gmd/grad/solcalc/sunrise.html (accessed on 10 February 2021).
- Jaggar, T.A. The Great Tidal Wave of 1946. Nat. Hist. 1946, 55, 262–268. [Google Scholar]
- Macdonald, G.A.; Shepard, F.P.; Cox, D.C. The tsunami of April 1, 1946 in the Hawaiian Islands. Pac. Sci. 1947, 1, 21–37. [Google Scholar]
- Shepard, F.P.; Macdonald, G.A.; Cox, D.C. The tsunami of April 1, 1946. Bull. Scripps Inst. Oceanogr. 1950, 5, 391–470. [Google Scholar]
- Johnson, J.M.; Satake, K. Estimation of seismic moment and slip distribution of the April 1, 1946, Aleutian tsunami earthquake. J. Geophys. Res. Space Phys. 1997, 102, 11765–11774. [Google Scholar] [CrossRef]
- Okal, E.A.; Synolakis, C.E.; Fryer, G.J.; Heinrich, P.; Borrero, J.C.; Ruscher, C.; Arcas, D.; Guille, G.; Rousseau, D. A Field Survey of the 1946 Aleutian Tsunami in the Far Field. Seism. Res. Lett. 2002, 73, 490–503. [Google Scholar] [CrossRef]
- Fryer, G.J.; Watts, P.; Pratson, L.F. Source of the great tsunami of 1 April 1946: A landslide in the upper Aleutian forearc. Mar. Geol. 2004, 203, 201–218. [Google Scholar] [CrossRef]
- López, A.M.; Okal, E.A. A seismological reassessment of the source of the 1946 Aleutian ‘tsunami’ earthquake. Geophys. J. Int. 2006, 165, 835–849. [Google Scholar] [CrossRef]
- Von Huene, R.; Kirby, S.; Miller, J.; Dartnell, P. The destructive 1946 Unimak near-field tsunami: New evidence for a submarine slide source from reprocessed marine geophysical data. Geophys. Res. Lett. 2014, 41, 6811–6818. [Google Scholar] [CrossRef]
- Dudley, W.; Stone, C.S. The Tsunami of 1946 and 1960 and the Devastation of Hilo Town; The Donning Company: Virginia Beach, VA, USA, 2000; p. 5. [Google Scholar]
- National Data Buoy Center. Available online: https://www.ndbc.noaa.gov/ (accessed on 18 May 2017).
- Di Liberto, T. Huge Waves Mean it’s Time to Surf in Hawaii. 4 March 2016. Available online: https://www.climate.gov/news-features/event-tracker/huge-waves-means-it%E2%80%99s-time-surf-hawai%E2%80%99i (accessed on 18 May 2017).
- Shepard, P.P.; MacDonald, G.A.; Cox, D.C. Recent Tsunami in the Hawaiian Islands. Bull. Geol. Soc. Am. 1946, 57, 1230. [Google Scholar]
- Felton, E.; Crook, K.A. Evaluating the impacts of huge waves on rocky shorelines: An essay review of the book ‘Tsunami—The Underrated Hazard’. Mar. Geol. 2003, 197, 1–12. [Google Scholar] [CrossRef]
- Zhao, X.; Chen, Y.; Huang, Z.; Gao, Y. A numerical study of tsunami wave run-up and impact on coastal cliffs using a CIP-based model. Nat. Hazards Earth Syst. Sci. 2017, 17, 641–655. [Google Scholar] [CrossRef] [Green Version]
- Shen, S. Geomorphological and Tectonic Controls on Coastal Erosion, Huatung, Eastern Taiwan. Ph.D. Thesis, University of London, London, UK, 2000. [Google Scholar]
- Limber, P.W. Beach and Sea Cliff Dynamics as a Driver of Rocky Coastline Evolution. Ph.D. Thesis, Earth and Ocean Sciences, Duke University Graduate School, Durham, NC, USA, 2012. [Google Scholar]
- Climate Prediction Center. Monthly Atmospheric and SST Indices. Available online: https://www.cpc.ncep.noaa.gov/data/indices/ (accessed on 17 May 2017).
- Xue, Y.; Kumar, A. Evolution of the 2015/16 El Niño and historical perspective since 1979. Sci. China Earth Sci. 2017, 60, 1572–1588. [Google Scholar] [CrossRef] [Green Version]
- Lian, T.; Chen, D.; Tang, Y. Genesis of the 2014–2016 El Niño events. Sci. China Earth Sci. 2017, 60, 1589–1600. [Google Scholar] [CrossRef]
- PODAAC. Waves and Satellites: Effect of El Niño on Big Wave Surfing. Available online: https://podaac.jpl.nasa.gov/OceanEvents/2016_01_25_WavesSatellites_ElNino (accessed on 17 May 2017).
Figure 1.
Location of Kukuiho’olua Island, off of the northeastern coast of Oahu, U.S.A. Base map from Google Earth.
Figure 1.
Location of Kukuiho’olua Island, off of the northeastern coast of Oahu, U.S.A. Base map from Google Earth.

Figure 2.
Geologic map of the Laie, Hawaii area, including Kukuiho’olua Island (after Sherrod et al., 2007). Compare to Figure 1. Insert (A) illustrates the cross-bedded nature of the Pleistocene-age sandstone that makes up Laie Point and Kukuiho’olua Island. Insert (B) is a close-up view of the sandstone.

Figure 3.
Example of large amplitude coastal waves that occurred on 25 February 2016, due to a strong ENSO-induced low-pressure system.
Figure 3.
Example of large amplitude coastal waves that occurred on 25 February 2016, due to a strong ENSO-induced low-pressure system.

Figure 4.
Examples of fresh sandstone surfaces (light-colored) exposed by removal of rock by extreme, ENSO-induced waves at Laie Point on 24–25 February 2016. View of center image is looking east. Compare to Figure 5.
Figure 4.
Examples of fresh sandstone surfaces (light-colored) exposed by removal of rock by extreme, ENSO-induced waves at Laie Point on 24–25 February 2016. View of center image is looking east. Compare to Figure 5.

Figure 5.
Evidence for waves over-topping the peninsula at Laie Point, Oahu. Examples include oxidized surface removal (C) and erosion pits (A,B). View in C is looking north. Arrow indicates likely flow path of seawater. Base map from Google Earth.
Figure 5.
Evidence for waves over-topping the peninsula at Laie Point, Oahu. Examples include oxidized surface removal (C) and erosion pits (A,B). View in C is looking north. Arrow indicates likely flow path of seawater. Base map from Google Earth.

Figure 6.
Variation in the Southern Oscillation Index (SOI) during the 2015–2016 ENSO. The 2015–2016 ENSO period is bracketed by the red dotted lines. SOI is a measurement of the intensity of the ENSO. Plots courtesy of the U.S. National Weather Service Climate Prediction Center.
Figure 6.
Variation in the Southern Oscillation Index (SOI) during the 2015–2016 ENSO. The 2015–2016 ENSO period is bracketed by the red dotted lines. SOI is a measurement of the intensity of the ENSO. Plots courtesy of the U.S. National Weather Service Climate Prediction Center.

Figure 7.
Variation in the surface wind direction and tropospheric temperatures of the central Pacific Ocean during the 2015–2016 ENSO. The 2015–2016 ENSO period is bracketed by the black dotted lines. The 200-hPa zonal winds are winds at the sea surface. The 500—hPa temperature is the temperature of the Troposphere. The strong negative anomaly in the wind indicates a strong westerly wind direction. Plots courtesy of the U.S. National Weather Service Climate Prediction Center.

Figure 8.
Historical images showing Kukuio’olua Island both before (A) and after (B) the formation of its modern sea arch. Formation of the arch occurred sometime between 1919 and 1959. The bottom image (C), shows the arch after its more recent change.
Figure 8.
Historical images showing Kukuio’olua Island both before (A) and after (B) the formation of its modern sea arch. Formation of the arch occurred sometime between 1919 and 1959. The bottom image (C), shows the arch after its more recent change.

Figure 9.
Sequence of images showing evolution of the sea arch on Kukuiho’olua Island, near Laie Point, Hawaii. Images taken from approximately the same location. Image (A) is the earliest known image of the island, showing no arch. Image (B) is the second earliest-known image of the island and the first to show the arch, indicating that the arch formed sometime between 1919 and 1959. Images (C–E) show the arch in a fairly steady-state for several decades. Image (F) shows the dramatic change after the large waves of 2016.


Table 1.
Wave height data for the North Shore of Oahu (NOAA Buoy #51202) and local tide data at Laie Point (NOAA Station #1612480) for 24–25 February 2016. High tide and extreme wave heights coincided around 04:00 local time, which is the most likely time for extreme erosion at Laie Point and Kukuiho’olua Island (shaded rows). LST = Local Standard Time. MLS = Mean Sea Level.
| Date (2016) | Time (LST) | Wave Height (m) | Estimated Tide (MSL) |
|---|---|---|---|
| 24 February | 21:00 | 3.66 | −0.23 |
| 24 February | 22:00 | 3.49 | −0.24 |
| 24 February | 23:00 | 3.86 | −0.18 |
| 25 February | 00:00 | 4.06 | −0.08 |
| 25 February | 01:00 | 4.36 | 0.04 |
| 25 February | 02:00 | 4.66 | 0.16 |
| 25 February | 03:00 | 5.49 | 0.25 |
| 25 February * | 04:00 | 5.57 | 0.28 |
| 25 February | 05:00 | 5.12 | 0.25 |
| 25 February | 06:00 | 6.12 | 0.17 |
| 25 February | 07:00 | 5.77 | 0.05 |
| 25 February | 08:00 | 5.52 | −0.07 |
| 25 February | 09:00 | 6.37 | −0.16 |
* High tide occurred at 04:01, but sunrise was at 06:56.
Publisher’s Note: MDPI stays neutral with regard to jurisdictional claims in published maps and institutional affiliations. |
© 2021 by the author. Licensee MDPI, Basel, Switzerland. This article is an open access article distributed under the terms and conditions of the Creative Commons Attribution (CC BY) license (http://creativecommons.org/licenses/by/4.0/).
Share and Cite
MDPI and ACS Style
Jordan, B.R. Intermittent but Rapid Changes to Coastal Landscapes: The Tsunami and El Niño Wave-Formed Sea Arch at Laie Point, Oahu, Hawaii, U.S.A. Geosciences 2021, 11, 147. https://0-doi-org.brum.beds.ac.uk/10.3390/geosciences11030147
AMA Style
Jordan BR. Intermittent but Rapid Changes to Coastal Landscapes: The Tsunami and El Niño Wave-Formed Sea Arch at Laie Point, Oahu, Hawaii, U.S.A. Geosciences. 2021; 11(3):147. https://0-doi-org.brum.beds.ac.uk/10.3390/geosciences11030147
Chicago/Turabian StyleJordan, Benjamin R. 2021. "Intermittent but Rapid Changes to Coastal Landscapes: The Tsunami and El Niño Wave-Formed Sea Arch at Laie Point, Oahu, Hawaii, U.S.A." Geosciences 11, no. 3: 147. https://0-doi-org.brum.beds.ac.uk/10.3390/geosciences11030147
Note that from the first issue of 2016, this journal uses article numbers instead of page numbers. See further details here.