Article

Climate Variability in Central Europe during the Last 2500 Years Reconstructed from Four High-Resolution Multi-Proxy Speleothem Records

by
Sarah Waltgenbach
1,*,
Dana F. C. Riechelmann
1,
Christoph Spötl
2,
Klaus P. Jochum
3,
Jens Fohlmeister
4,5,
Andrea Schröder-Ritzrau
6 and
Denis Scholz
1
1
Institute for Geosciences, Johannes Gutenberg University Mainz, Johann-Joachim-Becher-Weg 21, 55128 Mainz, Germany
2
Institute for Geology, University of Innsbruck, Innrain 52, 6020 Innsbruck, Austria
3
Climate Geochemistry Department, Max Planck Institute for Chemistry, Hahn-Meitner-Weg 1, 55128 Mainz, Germany
4
Potsdam Institute for Climate Impact Research, Telegrafenberg A31, 14473 Potsdam, Germany
5
Building C, Section ‘Climate Dynamics and Landscape Development’, GFZ German Research Centre for Geosciences, Telegrafenberg, 14473 Potsdam, Germany
6
Institute for Environmental Physics, Ruprecht-Karls-University Heidelberg, Im Neuenheimer Feld 229, 69120 Heidelberg, Germany
*
Author to whom correspondence should be addressed.
Submission received: 30 January 2021 / Revised: 26 March 2021 / Accepted: 31 March 2021 / Published: 6 April 2021

Abstract

:
The Late Holocene was characterized by several centennial-scale climate oscillations including the Roman Warm Period, the Dark Ages Cold Period, the Medieval Warm Period and the Little Ice Age. The detection and investigation of such climate anomalies requires paleoclimate archives with an accurate chronology as well as a high temporal resolution. Here, we present 230Th/U-dated high-resolution multi-proxy records (δ13C, δ18O and trace elements) for the last 2500 years of four speleothems from Bunker Cave and the Herbstlabyrinth cave system in Germany. The multi-proxy data of all four speleothems show evidence of two warm and two cold phases during the last 2500 years, which coincide with the Roman Warm Period and the Medieval Warm Period, as well as the Dark Ages Cold Period and the Little Ice Age, respectively. During these four cold and warm periods, the δ18O and δ13C records of all four speleothems and the Mg concentration of the speleothems Bu4 (Bunker Cave) and TV1 (Herbstlabyrinth cave system) show common features and are thus interpreted to be related to past climate variability. Comparison with other paleoclimate records suggests a strong influence of the North Atlantic Oscillation at the two caves sites, which is reflected by warm and humid conditions during the Roman Warm Period and the Medieval Warm Period, and cold and dry climate during the Dark Ages Cold period and the Little Ice Age. The Mg records of speleothems Bu1 (Bunker Cave) and NG01 (Herbstlabyrinth) as well as the inconsistent patterns of Sr, Ba and P suggests that the processes controlling the abundance of these trace elements are dominated by site-specific effects rather than being related to supra-regional climate variability.

1. Introduction

Even if short-lived phases and events of extreme climate conditions occur rarely, they often have serious consequences for the ecosystem and the civilization of the affected region. Due to global warming, extreme climate events are assumed to become more frequent in the future [1]. Such phases and events, which are characterized by extreme meteorological parameters (e.g., low temperatures or extreme amounts of rainfall), may have different causes and triggers. Their duration can range from seasonal to centennial time scales. Especially during the last 2500 years, several centennial-scale climate anomalies have occurred. These include the Roman Warm Period (RWP, 2.3–1.6 ka BP, [2,3,4,5]), the Dark Ages Cold Period (DACP, 1.6–1.25 ka BP, [6,7]) with the temporally overlapping Late Antique Little Ice Age (LALIA, 1.48–1.36 ka BP, [8]), the Medieval Warm Period (MWP, 1.1–0.6 ka BP, also known as Medieval Climate Anomaly, [9,10,11]) and the Little Ice Age (LIA, 0.6–0.2 ka BP, [12,13]). The latter was probably the coldest multidecadal to multicentennial climate oscillation since the prominent 8.2 ka cooling event [13,14,15]. Such climate oscillations had a large effect on the agricultural productivity, health and conflict level of preindustrial civilizations [3,16]. This has been suggested by comparison of abrupt climate changes (in particular, in case of changes to dry and/or cold climate conditions) and the rise and fall of past civilizations (e.g., [3,16,17,18]). For example, during phases of Roman and medieval prosperity, humid and warm summers prevailed, whereas the demise of the western Roman Empire as well as the turmoil of the Migration Period (MP, 1.75–1.6 ka BP, [19,20]) coincided with increased climate variability between 1.75 and 1.4 ka BP [3,13].
A better understanding of the causes and boundary conditions of phases with extreme climate conditions may even enable an improved prediction of the occurrence of future extreme events. The detection and investigation of phases with extreme climate conditions requires archives with an accurate chronology as well as a high temporal resolution. Since speleothems can be precisely dated with the 230Th/U-method, they provide both. In addition, various proxies (e.g., stable isotopes and trace elements) can be used for the reconstruction of past climate variability. Thus, stalagmites have a high potential as archives of short-term phases of extreme climate conditions.
Several climate records from Europe indicate that some of the climate oscillations of the Late Holocene (e.g., the MWP and the LIA) were associated with the North Atlantic Oscillation (NAO), which is the dominant atmospheric pressure mode in the Northern Hemisphere and influences the weather and climate conditions in the North Atlantic as well as the surrounding areas [21,22,23,24,25]. The NAO index is defined by the sea-level pressure difference between the Azores High and the Icelandic Low, with a positive winter NAO index during humid and warmer winter months and a negative NAO index during dry and colder winter months in central and northern Europe [21,25]. Baker et al. [26] presented a composite annual growth-rate record based on five stalagmites from Uamh an Tartair Cave, NW Scotland, and identified low growth rates during the RWP, the MWP and the MP, reflecting a positive state of the NAO with humid and warm winter months, as well as high growth rates during the end of the DACP and the LIA, reflecting a negative NAO with dry and cold winter months.
In this study, we present high-resolution δ18O and δ13C as well as trace element records for the last 2500 years based on four stalagmites (Bu1, Bu4, NG01 and TV1) from Bunker Cave and Herbstlabyrinth cave system in Germany. At both cave sites, temperature and precipitation during winter months are influenced by the NAO [25,27,28. Thus, the speleothems from Bunker Cave and the Herbstlabyrinth cave system are well suited for the detection of past climate oscillations, such as the MWP or the LIA, and investigation of their potential relationship with the NAO. Furthermore, the multi-proxy comparison of the four speleothems provides the potential to recognize regional similarities and differences of specific climate anomalies, such as the MWP and the LIA. In addition, the comparison of individual speleothem records from the same cave should enable to determine the sensitivity of the different samples and proxies to specific climate conditions.

2. Sites and Samples

Bunker Cave is part of the 3.5 km-long Bunker-Emst Cave system in the Rhenish Slate Mountains near Iserlohn in western Germany (51°22’03” N, 7°39’53” E; Figure 1) and developed in upper Middle Devonian limestone hosting thin dolomite veins [12,28,29,30]. The southern entrance of the cave is located 184 m above sea level (a.s.l.) and the bedrock above Bunker Cave is about 15 to 30 m thick and is covered by up to 70 cm of brown and loamy soil as well as a C3 vegetation [12,29,30,31]. In total, six stalagmites (Bu1, Bu2, Bu3, Bu4, Bu5 and Bu6) were removed from the cave, but only speleothems Bu1 and Bu4 grew during the last 2500 years and are, thus, included in this study. Stalagmite Bu1 has a hiatus at approximately 17 cm distance from top, and the top most section covers only the last 1500 years.
The Herbstlabyrinth cave system is located 435 m a.s.l. in the Rhenish Slate Mountains (Figure 1) and is also developed in Devonian limestone [27,32]. The cave system is covered by a 60 cm-thick Cambisol (Terra fusca) and a patchy vegetation of meadow and deciduous forest [27]. Two (NG01 and TV1) of the three Holocene speleothems that were removed from the cave grew during the last 2500 years and are included in this study.
All four speleothems (Bu1, Bu4, NG01 and TV1) were already analyzed at lower resolution [12,32]. In speleothems Bu1 and Bu4 from Bunker Cave, the resolution of the previous δ18O and δ13C records is relatively high for the Late Holocene section (ca. 3–5 years). In contrast, the average temporal resolution of the previous records from the Herbstlabyrinth cave system was only approximately 88 (NG01) and 109 years (TV1). A detailed description of stalagmites Bu1 and Bu4 from Bunker Cave can be found in Fohlmeister et al. [12] and in Mischel et al. [32] for speleothems NG01 and TV1 from the Herbstlabyrinth cave system. In both caves, a monitoring program was conducted in and above the cave systems [27,28,29,32,33,34,35]. These data contribute to a better understanding of the site-specific processes and effects and, thus, support the interpretation of the different proxy records.

3. Methods

3.1. 230Th/U-Dating

230Th/U-dating of the speleothems NG01 and TV1 from the Herbstlabyrinth cave system was performed with a multicollector inductively coupled plasma mass spectrometer (MC-ICP-MS) from Nu Instruments (Wrexham, UK) at the Max Planck Institute for Chemistry (MPIC), Mainz, and the results are published in Mischel et al. [32]. In contrast, speleothems Bu1 and Bu4 from Bunker Cave were analyzed at the Heidelberg Academy of Sciences with thermal ionization mass spectrometry (TIMS; [12]). Because of the relatively large uncertainties of these TIMS ages, both speleothems were re-dated by MC-ICP-MS 230Th/U-dating. For this purpose, several sub-samples were drilled from the growth axis of Bu1 and Bu4 using a hand-held dental drill (MICROMOT 50/E, Proxxon, Wecker, Luxembourg). Because of the relatively low U content of the speleothems, the mass of most of the individual samples was about 300 mg and, thus, comparatively high. The results of the dating of stalagmite Bu4 were recently published by Waltgenbach et al. [36] and the seven new ages for Bu1 are listed in Chapter 4.1.
For separation of Th und U, an ion exchange resin was used [37,38]. The samples were dissolved in 7N HNO3 and a mixed 229Th-233U-236U spike [39] was added. Then, the samples were dried down and organic matter was removed by the addition of concentrated HNO3, HCl and H2O2. Then, the samples were dried down again. After dissolving in 6N HCl, the individual solutions were passed through three Bio-Rad AG1-X8 columns to separate Th and U. The Th and U fractions were then dried down again and afterwards dissolved in 2 mL of 0.8N HNO3 for the measurements by MC-ICP-MS. The dissolved Th and U fractions were measured separately using a standard-sample bracketing procedure [37]. For U measurements, the reference material CRM 112-A (New Brunswick Laboratory, Argonne, IL, USA) and for Th measurements an in-house standard with previously calibrated ratios of 232Th, 230Th and 229Th were used. Analytical details are described in Obert et al. [40]. The activity ratios and 230Th/U-ages were calculated using the half-lives of Cheng et al. [41], and the correction for the detrital contamination assumes a bulk Earth 232Th/238U weight ratio of 3.8 ± 1.9 [42] as well as a secular equilibrium between 230Th, 234U and 238U. The 230Th/U-ages are given in BP (BP = before present, AD 1950) and we used StalAge for the calculation of an age model of speleothem Bu1 [43].

3.2. δ18O and δ13C Values

For δ18O and δ13C measurements, all four speleothems were sampled at very high resolution along the respective growth axis using a computer-controlled MicroMill (Merchantek, New Wave, Fremont, CA, USA). Depending on the growth rate of each speleothem, the spatial resolution is either 50 (Bu4, NG01 and TV1) or 100 µm (Bu1). This results in a temporal resolution between 0.8 and 5.4 years for all four speleothem records. In total, 4046 stable isotope measurements (Bu1: 1396, Bu4: 1370, NG01: 848, TV1: 432) were carried out at the University of Innsbruck with a Thermo Fisher DeltaplusXL (Thermo Fisher, Waltham, MA, USA) isotope ratio mass spectrometer linked to a GasBench II (Thermo Fisher, Waltham, MA, USA). The 1σ-precision is 0.08 ‰ for δ18O and 0.06 ‰ for δ13C [44]. Isotope ratios are reported relative to the Vienna PeeDee Belemnite standard (VPDB).

3.3. Trace Elements

The Mg data of stalagmites Bu1 and Bu4 from Bunker Cave were already published by Fohlmeister et al. [12]. For stalagmites NG01 and TV1 from the Herbstlabyrinth cave system, low-resolution single-spot analyses of Mg, Sr, P, Ba and U with a spatial resolution of 500 µm corresponding to a temporal resolution of approximately 100–200 years were published by Mischel et al. [32]. These previously published trace element records were either restricted to a single element (Bunker Cave: only Mg) or did not provide the required resolution (Herbstlabyrinth cave system). Thus, we re-analyzed the trace element data of all four speleothems by laser-ablation inductively coupled plasma mass spectrometry (LA-ICPMS) at the Max Planck Institute for Chemistry (MPIC), Mainz. A Nd:YAG UP-213 nm laser (New Wave Research, Fremont, CA, USA) was coupled to an ELEMENT 2 single-collector sector-field mass spectrometer from Thermo Scientific (Waltham, MA, USA) [45,46]. Since the line-scan method was used, the temporal resolution of the new trace element data is higher than that of the stable oxygen and carbon isotope records. The measurement settings were a spot size of 100 µm, a repetition rate of 10 Hz and a scan speed of 10 µm s−1. The synthetic reference glass NIST SRM 612 and the reference material MACS-3 were used for calibration (http://georem.mpch-mainz.gwdg.de/ (accessed on 13 June 2019)). Furthermore, calcium was used as an internal standard.

3.4. Correlation and Principal Component Analysis

For a better comparison of the multi-proxy records of the four different speleothems, the different temporal resolution of the respective stable isotope and trace element data was adapted to a temporal resolution of 10 years for every speleothem record. For this purpose, the mean value of all data points in the time interval of 10 years was determined. Then, the stable isotope and trace element records of all four stalagmites show the same temporal resolution, and correlation coefficients can be calculated for different proxies of the same speleothem. Pearson correlation coefficients (r) were calculated, and p values are given to indicate the significance of the r values. To obtain further information about these proxies and to determine the main controlling processes, a principal component analysis (PCA) was applied to the stable isotope and trace element data of each speleothem. The PCA was performed using the software PAST3 (PAleontological STatistics: http://folk.uio.no/ohammer/past/ (accessed on 17 June 2019)).

4. Results

4.1. 230Th/U-Dating of Bu1

The results of 230Th/U-dating of stalagmite Bu1 are listed in Table 1. The 238U-content varies between 0.04 µg g−1 (Bu1-3.1) and 0.06 µg g−1 (Bu1-3.4) and is, thus, relatively low. The 232Th-content of the stalagmite is also relatively low (<1 ng g−1). The values are similar to the Th and U concentrations of speleothem Bu4 from Bunker Cave [12,36]. The (230Th/232Th) activity ratio, which is an indicator of the degree of detrital contamination, is between 6 and 20. Thus, a correction for the detrital contamination was performed for all samples of Bu1. The new 230Th/U-ages of stalagmite Bu1 are between 0.43 ± 0.11 ka BP and 1.58 ± 0.14 ka BP and show 2σ-age uncertainties between 85 (Bu1-3.3) and 130 years (Bu1-2.3). The age-depth model of stalagmite Bu1 includes seven new MC-ICP-MS 230Th/U-ages as well as four of the previous TIMS 230Th/U-ages [12]. The revised age model shows several periods with changes of the growth rate (Figure 2).
For stalagmite Bu4, Waltgenbach et al. ([36], see their Figure 4) recently presented an updated version of the previous age model [12]. Here we use the section corresponding to the last 2.5 ka BP. For stalagmites TV1 and NG01, the age models from Mischel et al. [32] were used (see their Figure 1). Note that the age model of stalagmite TV1 only includes a single 230Th/U-age during the last 2.5 ka BP (Figure 3). The whole age model and the corresponding 95%-confidence limits, however, is based on 12 230Th/U-ages in total [32].

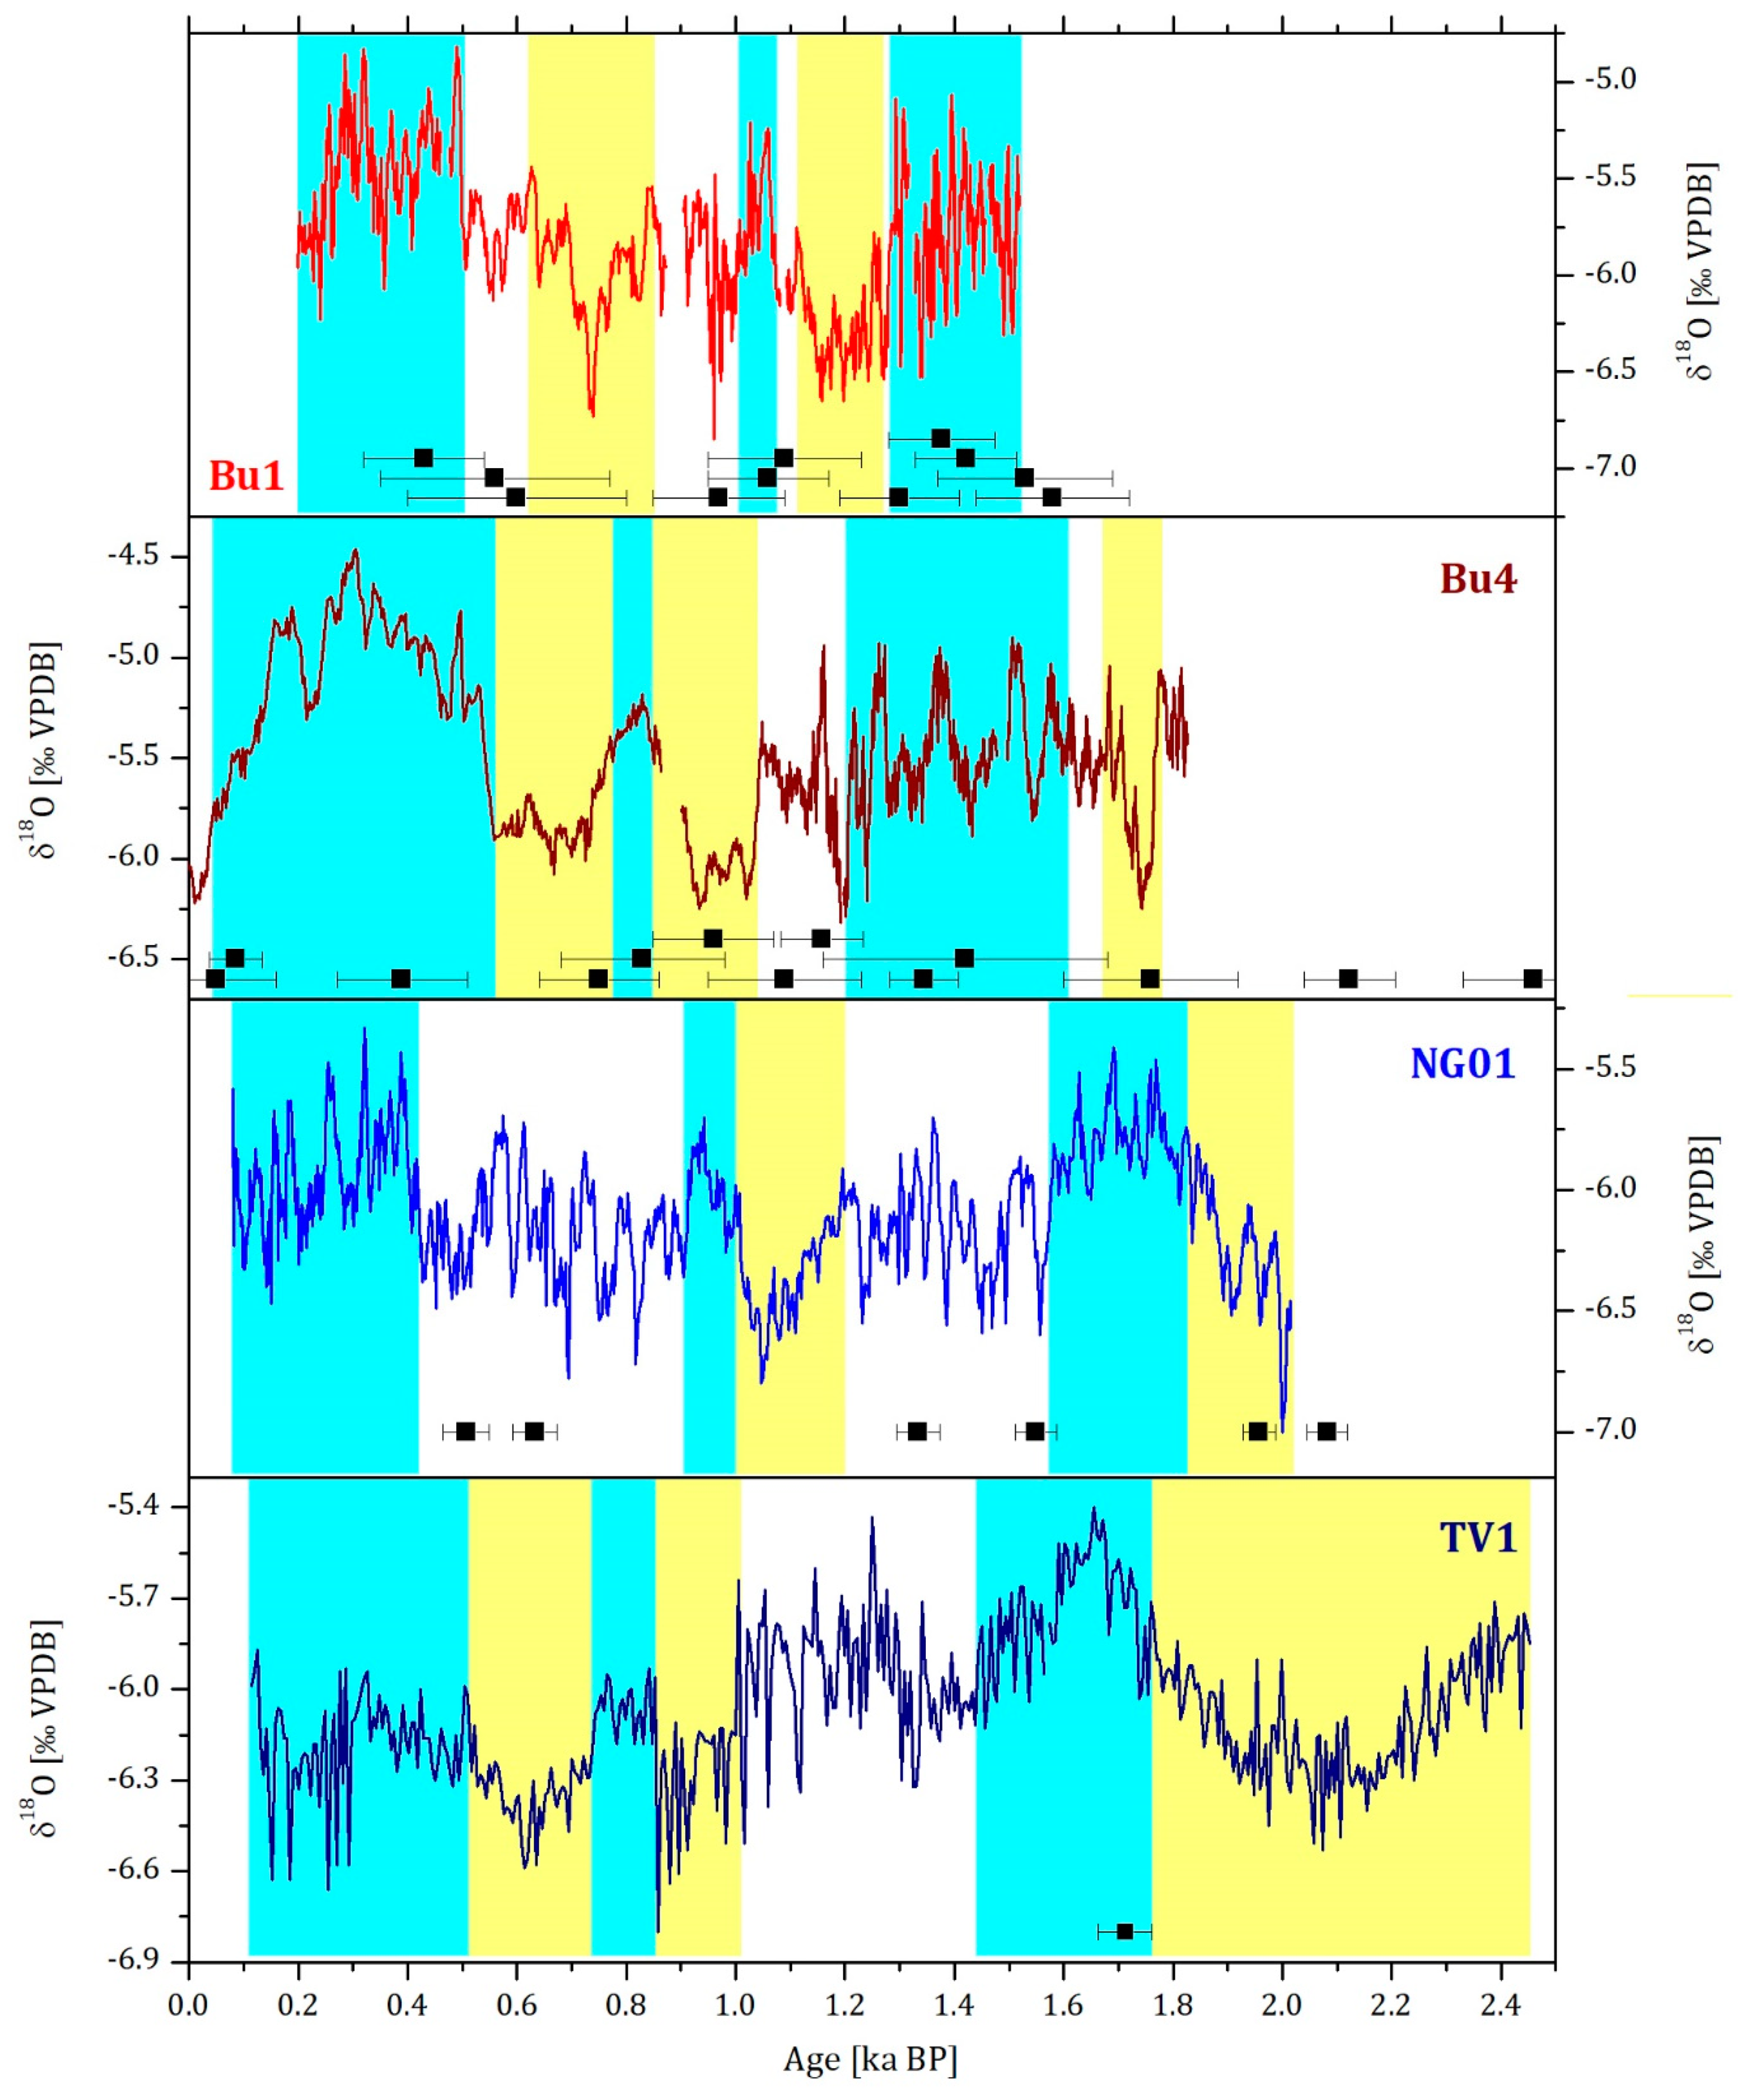
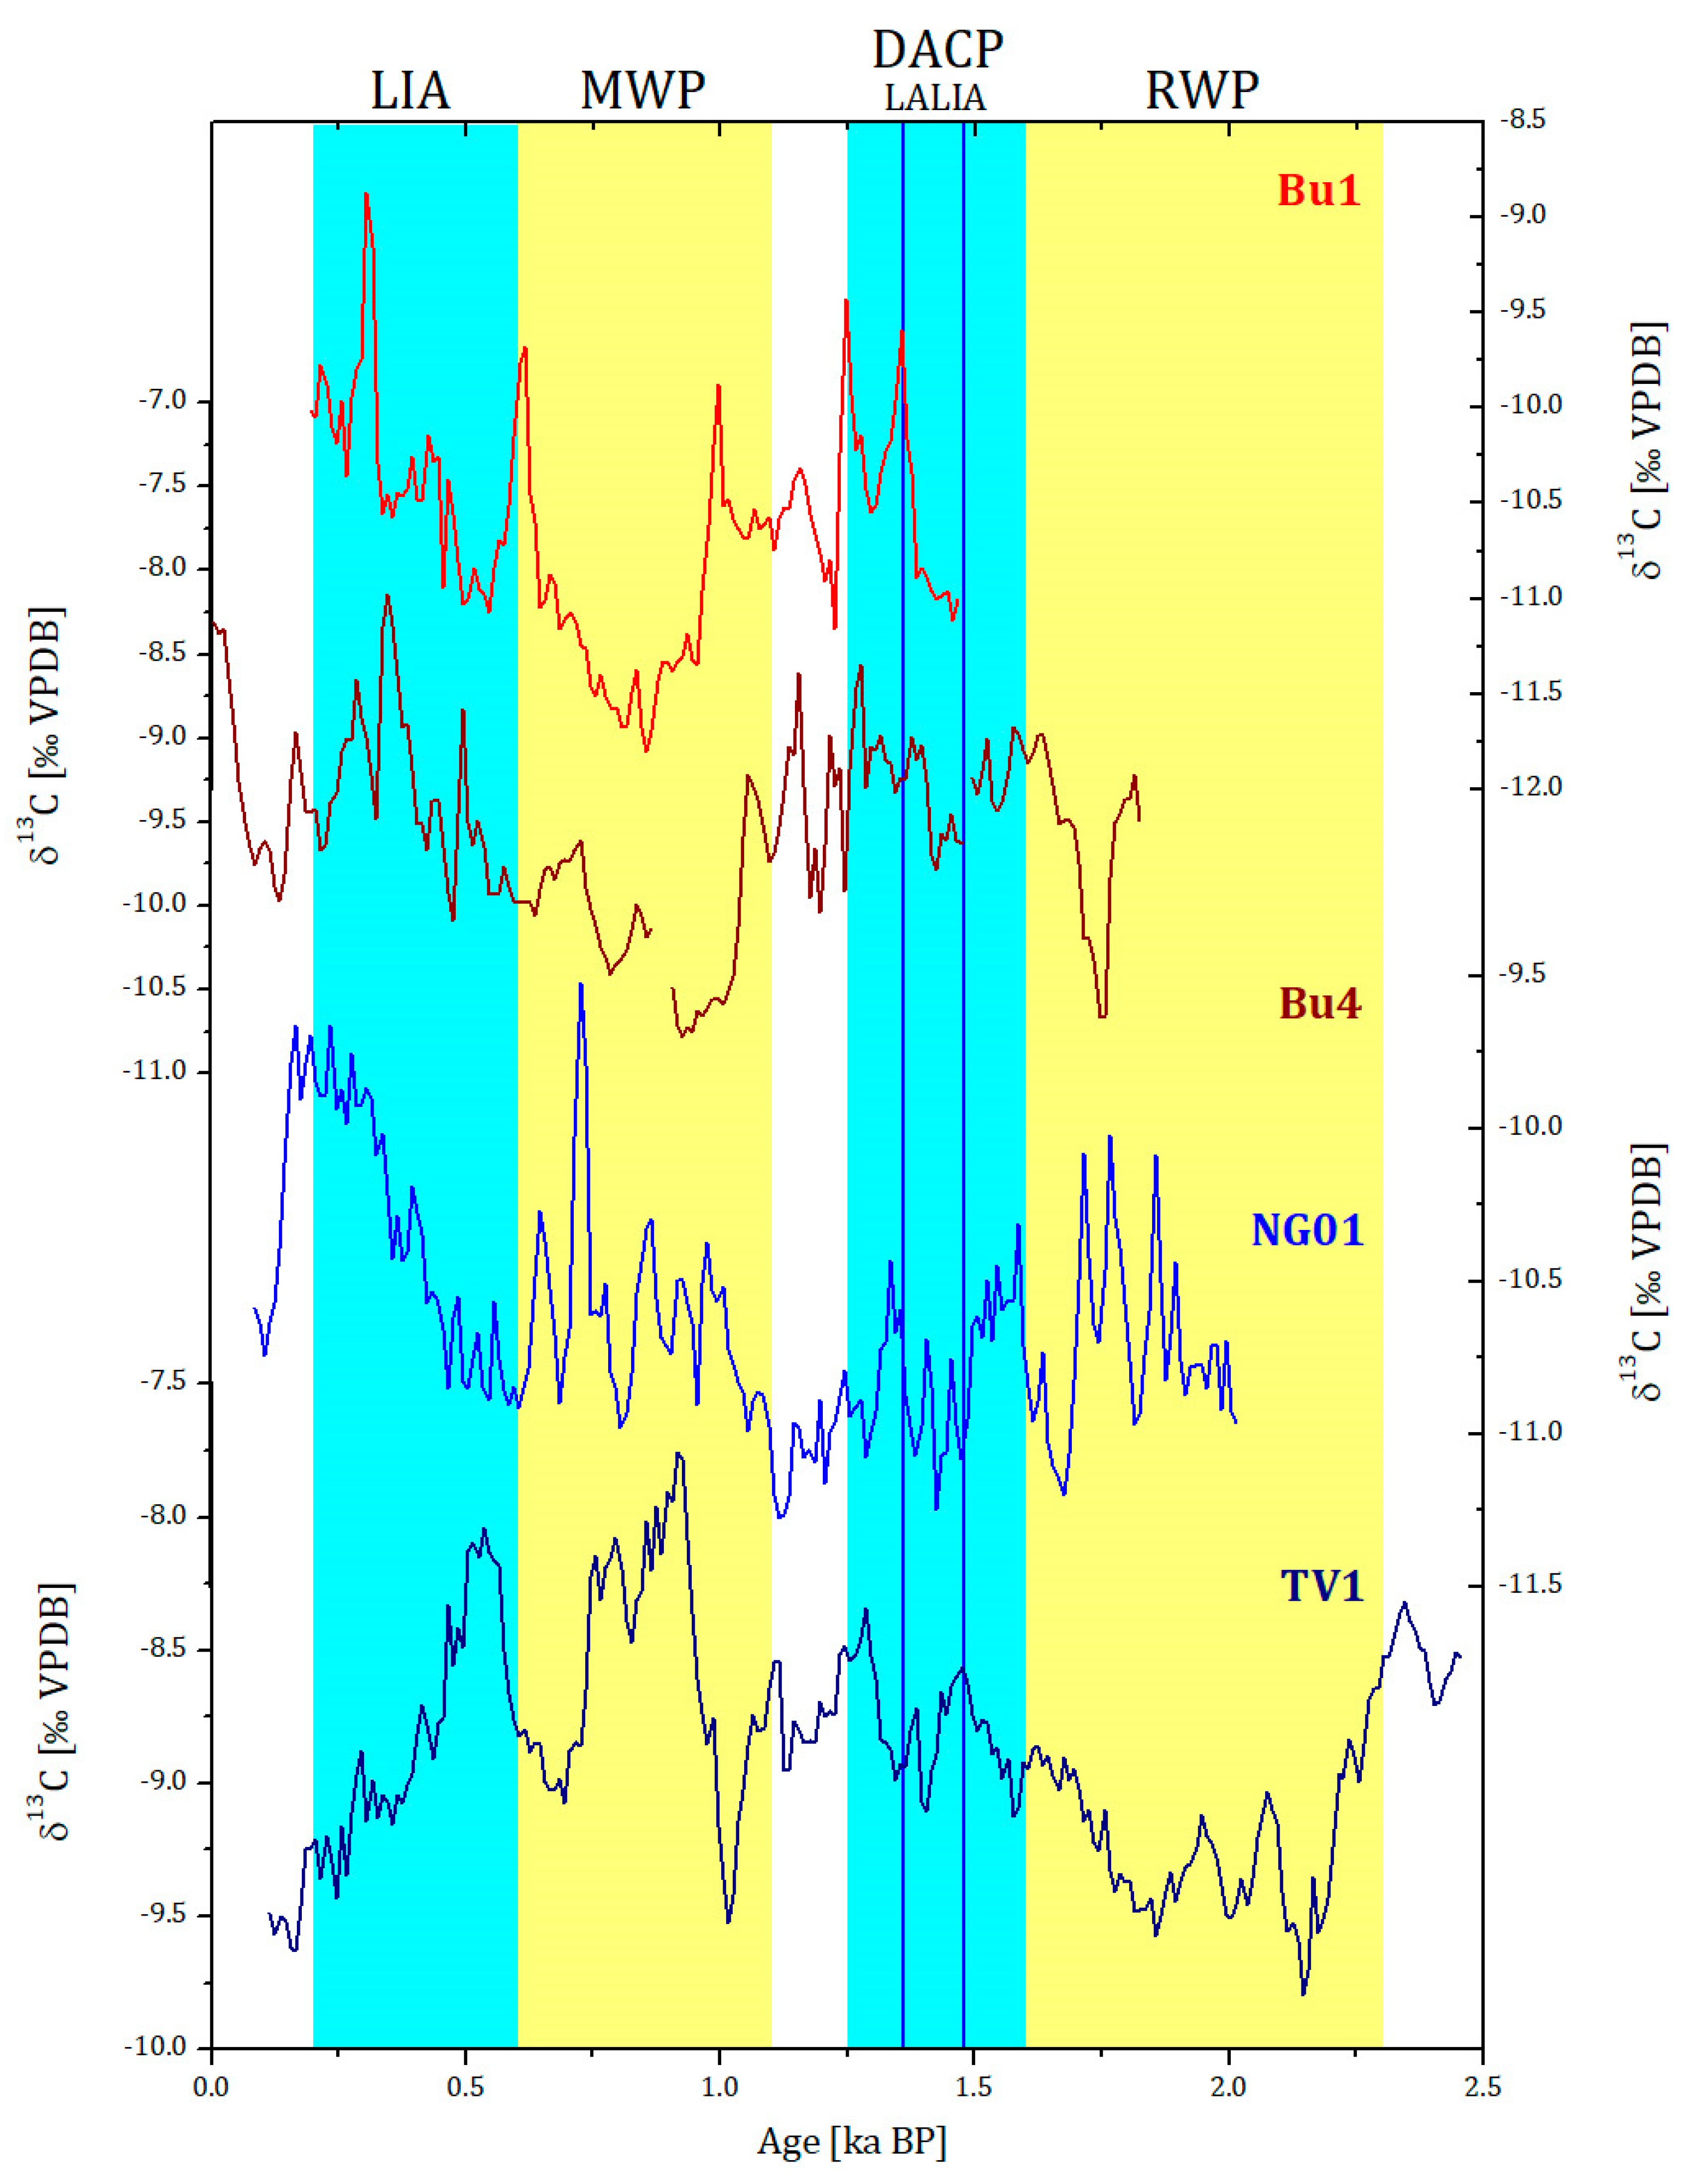
4.2. Stable Isotopes
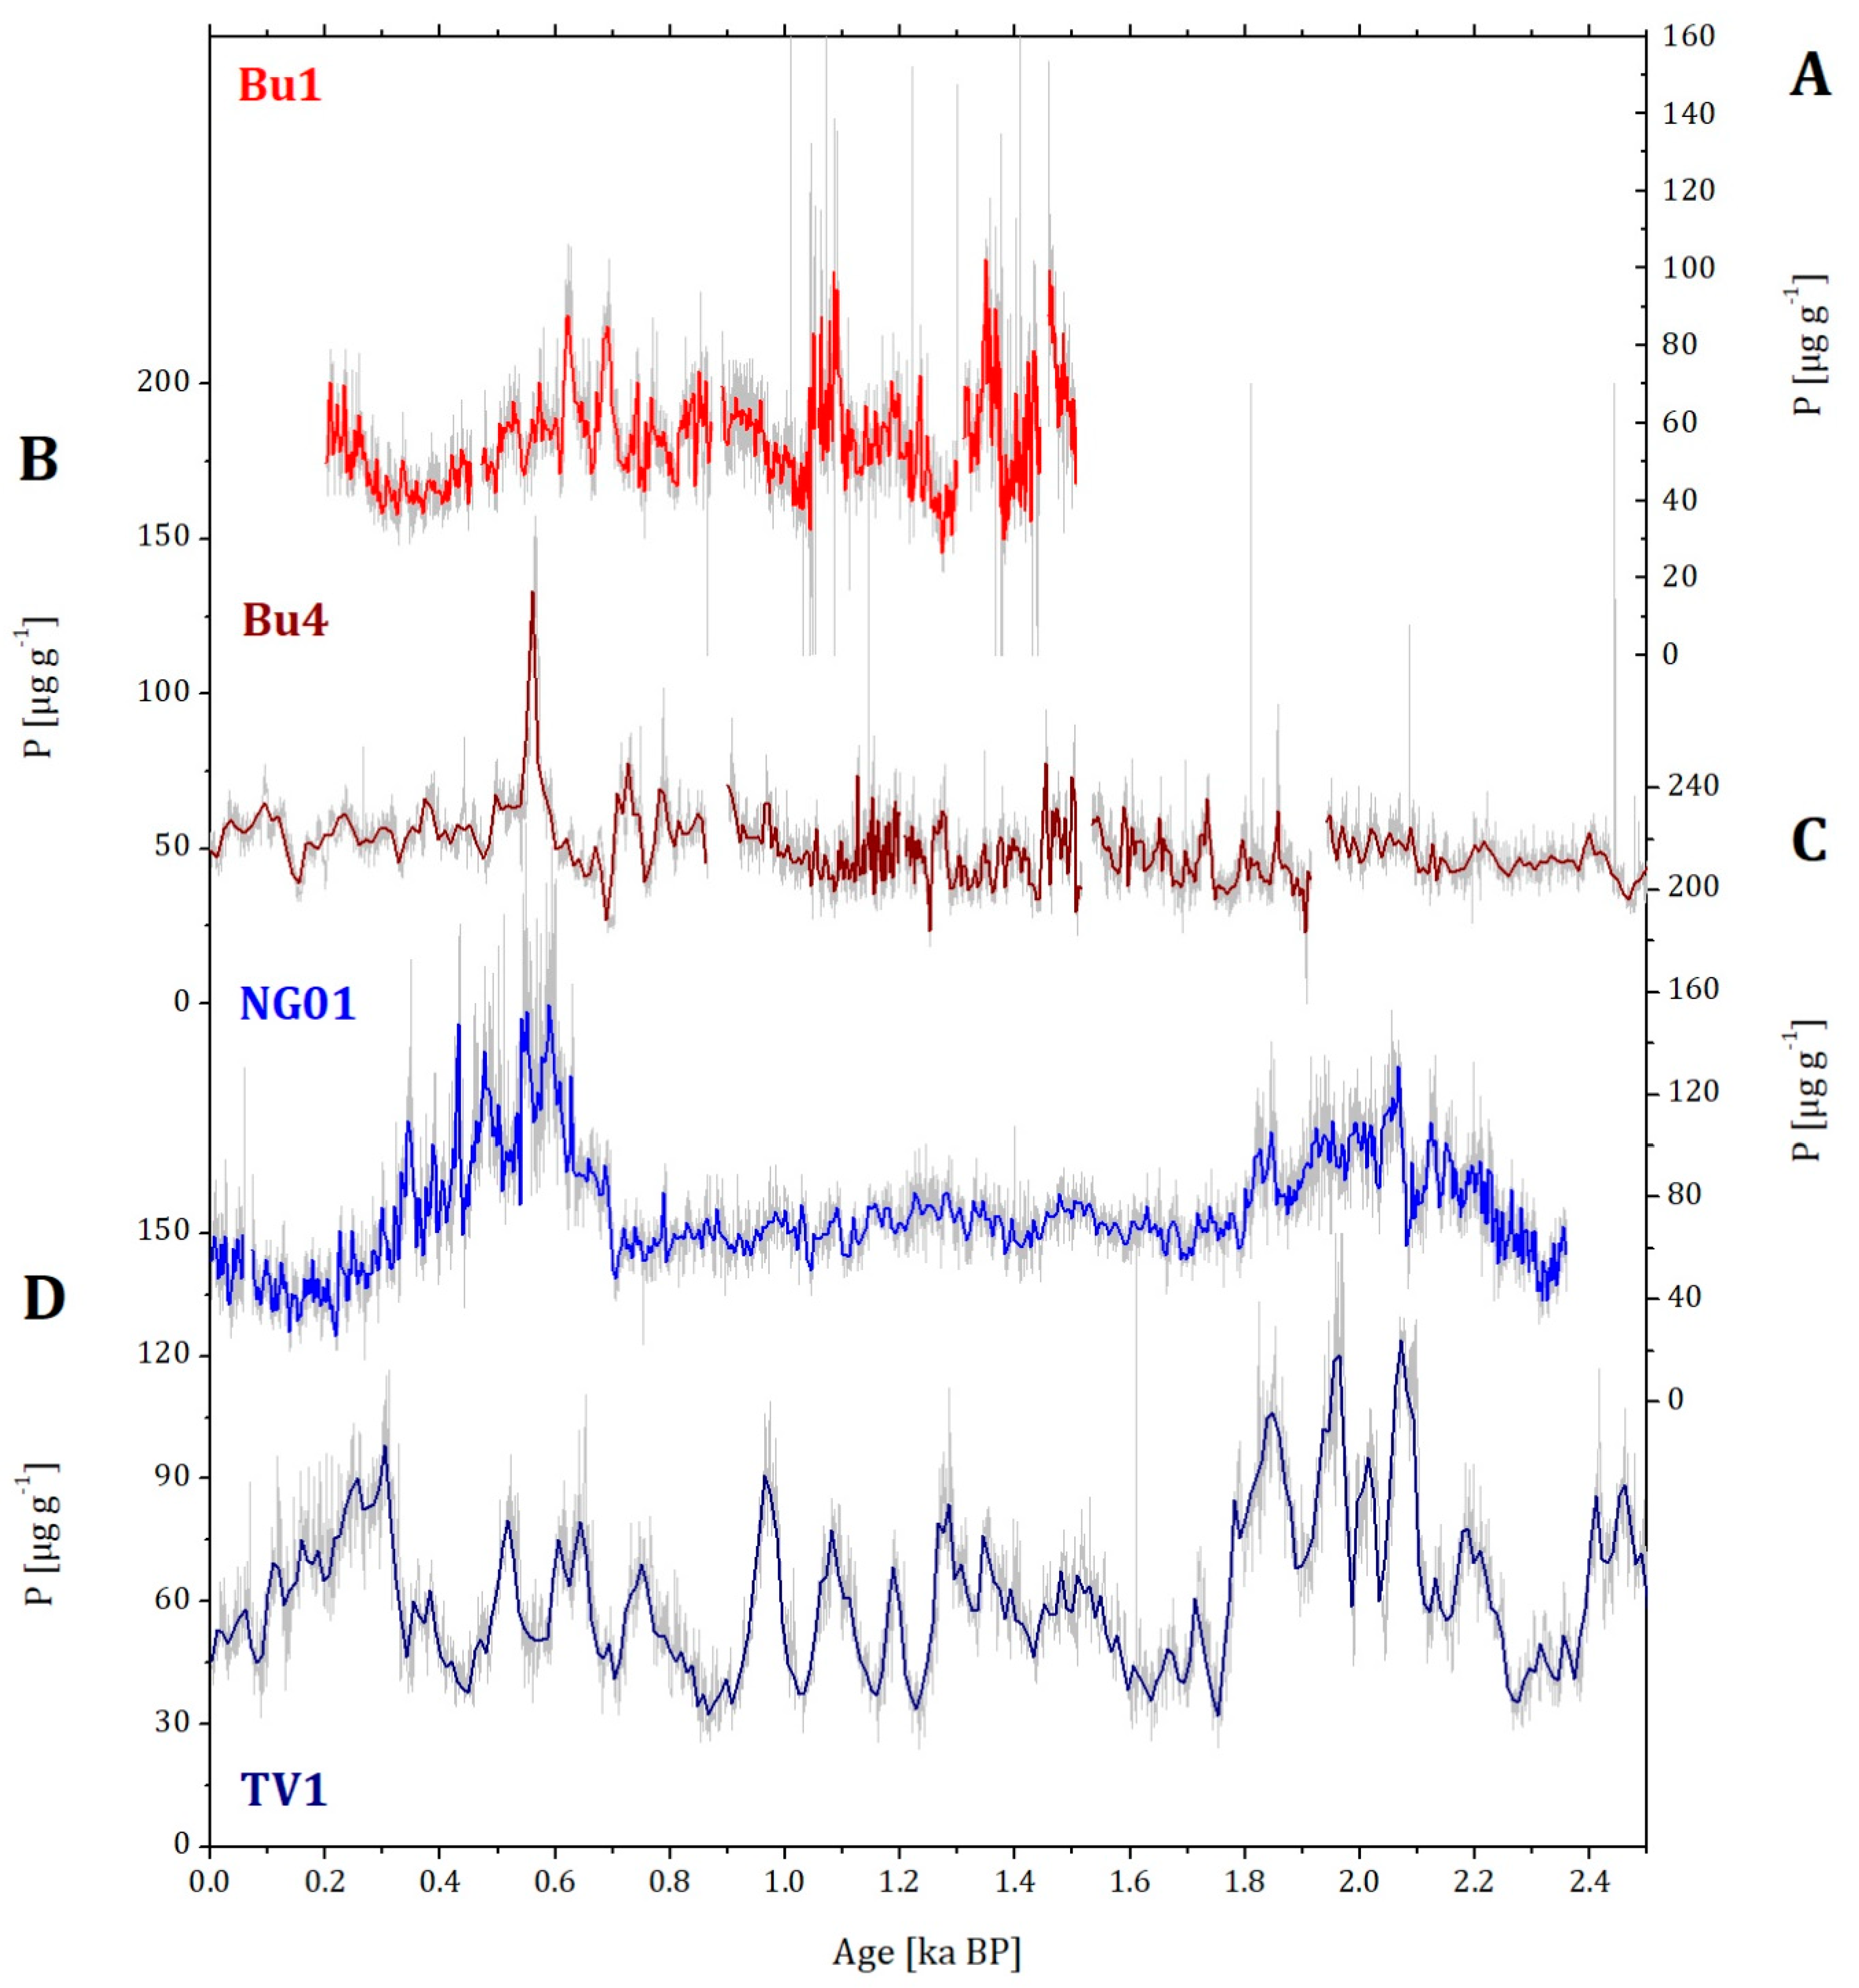
The results of the stable isotope analyses are shown in Figure 3 and Figure 4. The δ18O and δ13C records have an average temporal resolution of 0.9 years for stalagmite Bu1, 1.4 years for stalagmite Bu4 as well as 2.3 and 5.4 years for speleothems NG01 and TV1 from the Herbstlabyrinth cave system, respectively. The range of the δ18O values of stalagmite Bu1 (−6.8 to −4.8‰) is slightly lower than for stalagmite Bu4 (−6.3 to −4.5‰) from the same cave. The range of the oxygen isotope values of samples NG01 (−7.0 to −5.3‰) and TV1 (−6.8 to −5.4‰) from the other cave system are also similar.
The δ13C values of the two speleothems from Bunker Cave are between −11.9 and −8.4‰ for Bu1 and between −10.8 and −8.0‰ for Bu4. The δ13C range of the speleothems from the Herbstlabyrinth cave system is slightly smaller (−11.3 to −9.3‰ for NG01 and −9.9 to −7.7‰ for TV1).
A comparison of the mean δ18O and δ13C values, their standard deviations as well as the corresponding minimum and maximum values of all four stalagmites is shown in Table 2. The mean δ18O values of the two stalagmites from the Herbstlabyrinth cave system are with values of −6.1‰ (NG01) and −6.1‰ (TV1) identical. In contrast, the mean δ18O values of stalagmites Bu1 (−5.9‰) and Bu4 (−5.5‰) from Bunker Cave are higher. This is consistent with the mean δ18O values of the 8.2 ka cooling event [36], which are also lower at the Herbstlabyrinth cave system than at Bunker Cave.

4.3. Trace Elements

For the two stalagmites Bu1 and Bu4 from Bunker Cave and stalagmite NG01 from the Herbstlabyrinth cave system, the measured Mg, Ba and P concentrations are shown in Figure 5, Figure 6 and Figure 7. For stalagmite TV1 from the Herbstlabyrinth cave system, only the Mg and P concentrations are included in Figure 5 and Figure 7. The results of the trace element measurements for the individual stalagmites were smoothed with a 10- or 20-point running median. Since the Bunker Cave speleothems Bu1 and Bu4 have a higher temporal resolution than NG01 and TV1 from the Herbstlabyrinth cave system, they were smoothed with a 20-point running median. The Mg concentration of speleothem Bu1 from Bunker Cave varies throughout the record between 200 and 400 µg g−1 and reaches values >400 µg g−1 around 0.6–0.2 ka BP. In contrast, the Mg content of the other stalagmite from Bunker Cave varies between 300 and 1200 µg g−1 with lower values (<750 µg g−1) at around 1.7–1.6 ka BP, 1.2–0.6 ka BP and 0.2–0 BP ka as well as higher values (>750 µg g−1) at 2.5–1.7 ka BP, 1.6–1.2 ka BP and 0.6–0.2 ka BP. Thus, the Mg content of Bu4 shows a greater variability than the Mg content of Bu1. The Mg content of stalagmite NG01 from the Herbstlabyrinth cave system varies between 50 and 350 µg g−1 with higher values (>200 µg g−1) at 1.8–0.7 ka BP and 0.2–0 ka BP and lower values (<200 µg g−1) at 2.4–1.8 ka BP and 0.7–0.2 ka BP. The Mg concentration of TV1 varies at the beginning of the record (2.5–2.2 ka BP) between 400 and 650 µg g−1. After two distinct decreases at around 2.05 ka BP and 1.9 ka BP, the Mg content remains relatively constant (300–500 µg g−1) throughout the rest of the record except for two negative peaks around 1.0 and 0.6 ka BP.
Figure 6 shows the Ba content of the three stalagmites Bu1, Bu4 and NG01. In stalagmite Bu1, the Ba content is relatively constant (1–5 µg g−1) and shows a similar pattern as the Sr content of the sample. This is also the case for stalagmites Bu4 and NG01. Thus, the Sr concentration is not included in the following figures. The Ba concentration of the other Bunker Cave speleothem varies between 0 and 4 µg g−1, and shows higher values at 2.5–1.0 ka BP and a distinct increase during the last ca. 100 years. In stalagmite NG01 from the Herbstlabyrinth cave system, the Ba content varies throughout the record between 0 and 8 µg g−1, only at 2.4–2.2 ka BP the concentration reached 12 µg g−1.
The P concentration of all four stalagmites is shown in Figure 7. In stalagmite Bu1, the P content reaches the highest values of around 100 µg g−1 at the beginning of the record at 1.5–1.3 ka BP and at about 1.1–1.0 ka BP. Afterwards, the P content varies between 30 and 80 µg g−1. The P content in stalagmite Bu4 is relatively constant at around 50 µg g−1 with the exception of one peak at 0.6 ka BP (~130 µg g−1). In speleothem NG01 from the Herbstlabyrinth cave system, P also shows relatively constant values between 40 and 100 µg g−1, but at 2.2–1.8 and 0.7–0.2 ka BP, the P content is higher than 100 µg g−1. These higher values in the P content are reached at the same time as the lower values in the Mg concentration (r(Mg/P) = −0.18) of the sample. The P content of the other stalagmite TV1 from the Herbstlabyrinth cave system varies between 30 and 90 µg g−1, with slightly higher values at 2.2–1.8 ka BP (~120 µg g−1), which is similar to the P content of stalagmite NG01.

4.4. Correlation and PCA

In both samples Bu1 and Bu4 from Bunker Cave, the δ13C and δ18O values and the Mg concentration are positively correlated with each other (Table 3). Furthermore, the highest positive correlation in speleothems Bu1 and Bu4 is observed between Sr and Ba (Bu1: r(Sr/Ba) = 0.64; Bu4: r(Sr/Ba) = 0.65). In stalagmite NG01 from the other cave system, a positive correlation is observed between the stable isotope records. The highest positive correlation is also observed between Sr and Ba (r(Sr/Ba) = 0.51).
Figure 8 shows the results of the PCA. In Figure 8A, the positive correlation between δ18O, δ13C and Mg in speleothem Bu 1 is shown by their clustering with moderate loadings on the first principal component and low to moderate loadings on the second principal component. In addition, the high positive correlation of Sr and Ba (r = 0.64) is illustrated by their clustering with moderate negative loadings on PC 1 and moderate positive loadings on PC 2. Phosphorus has the highest negative loading on PC 2.
In the PCA of stalagmite Bu4, the high correlation between Sr and Ba (r = 0.65) is also illustrated by their clustering with moderate loadings on PC 1 and very low negative loadings on PC 2 (Figure 8B). The stable isotopes and Mg are the only proxies with positive loadings on PC 1 and PC 2. Phosphorus has moderate negative loading on PC 1 and moderate loading on PC 2.
The highest loadings on PC 1 in the PCA of stalagmite NG01 (Figure 8C) from the Herbstlabyrinth cave system are observed for Mg, Sr and Ba. The stable isotopes have low to moderate negative loadings on PC 1 and moderate positive loadings on PC 2. Similar to the PCA of speleothem Bu1, P has the highest negative loading on PC 2 and a low positive loading on PC1.
The PCA of the other speleothem from the Herbstlabyrinth cave system (TV1) shows no strong clustering at all (Figure 8D). The highest loading on PC 1 is observed for Mg, followed by δ13C, δ18O and P. Mg has also the highest loading on PC 2, followed by P, δ13C and δ18O, which is the only proxy with a negative loading on PC 2.

5. Discussion

5.1. δ18O and δ13C Values

Speleothem δ18O and δ13C signals are affected by several processes and their interpretation is thus not always straightforward. Environmental controls and processes in the ocean, atmosphere, soil zone, epikarst as well as in the cave system may lead to variations in the δ18O values [47] and the δ13C values [48]. The investigation of the site-specific processes by monitoring caves can contribute to a better understanding and interpretation of these proxy records [27,28,29,32].
Fohlmeister et al. [12] interpreted the variations in the δ18O values of the speleothems from Bunker Cave as changes in winter temperature and the amount of winter precipitation, with higher δ18O values during cold and dry winter months and lower δ18O values during warmer and more humid winter months. Following this interpretation, higher δ18O values at about 1.52–1.28, 1.15–1.1 and 0.5–0.2 ka BP in stalagmite Bu1 and at about 1.61–1.2, 0.85–0.78 and 0.56–0.05 ka BP in stalagmite Bu4 indicate cold and dry climate at Bunker Cave. Furthermore, lower δ18O values during 1.27–1.11 and 0.85–0.62 ka BP in stalagmite Bu1 and during 1.78–1.67, 1.04–0.85 and 0.78–0.56 ka BP in stalagmite Bu4 suggest warm and humid climate conditions. These phases with different climate conditions are indicated in Figure 3 by yellow bars for periods with warm and humid climate and blue bars for periods with cold and dry climate. The variations in the δ18O values of speleothems NG01 and TV1 from the Herbstlabyrinth cave system are also mainly influenced by winter precipitation [32], even if precipitation during summer months has been shown to have a significant effect on the δ18O values of the drip water [27]. Nevertheless, both cave systems are sensitive to large-scale climate variations of the North Atlantic region, which is also confirmed by monitoring studies in both caves [12,27,28,32]. The δ18O records of speleothems NG01 and TV1 show a similar pattern. In stalagmite TV1, the δ18O values decrease during 2.5–2.1 ka BP. Afterwards, the δ18O records of both stalagmites show an increasing trend with maximum values between 1.8 and 1.6 ka BP. In the following centuries, the δ18O values decrease again and reach their minima at around 1.1 ka BP in NG01 and at 1.0–0.85 as well as 0.7–0.5 ka BP in TV1, which is similar to the stable isotope records of the Bunker Cave speleothems. Higher δ18O values can be observed after 0.42 ka BP in NG01 and after 0.51 ka BP in TV1. Due to the similarities of the four δ18O records for the last ca. 2.0 ka and following the previous interpretation [12,32], lower δ18O values in the δ18O records from both cave systems are interpreted as warmer and more humid conditions and higher δ18O values as colder and drier conditions. Overall, the δ18O records of the four speleothems show common general patterns within their dating uncertainties (Figure 3), indicating the δ18O records as proxies for supra-regional climate variability.
The δ13C values of Bu1 and Bu4 are, similar to their δ18O values, also lower during 1.0–0.6 ka BP in both speleothems and slightly higher during 1.5–1.3 and 0.5–0.2 ka BP in stalagmite Bu1 as well as during 1.7–1.0, 0.5–0.15 and after 0.05 ka BP in stalagmite Bu4. This is also reflected by their positive correlation (Table 3). The δ13C values of Bunker Cave speleothems are interpreted as changes in winter precipitation and vegetation density [12]. Speleothem NG01 from the other cave system shows lower δ13C values between 1.7 and 1.0 ka BP and slightly higher values between 1.0 and 0.6 ka BP. Furthermore, at about 0.4–0.2 ka BP, the δ13C record of NG01 shows significantly higher values. The δ13C and δ18O records of stalagmite NG01 are positively correlated (Table 3). The pattern of the δ13C record of the other sample (TV1) from the Herbstlabyrinth cave system shows lower values between 2.2 and 1.6 ka BP, at around 1.0 ka BP, and during 0.75–0.55 ka BP. Furthermore, a decreasing trend is visible from 0.5 ka BP until recent times. Higher δ13C values are observed at about 2.4–2.2 ka BP, 0.95–0.7 ka BP and around 0.5 ka BP (Figure 4). There is no significant correlation between the δ13C and the δ18O record of TV1 (Table 3). However, both proxies have a low to moderate loading on PC1 (Figure 8D), indicating a weak common signal.
Stalagmite δ13C values are influenced by several environmental and isotope fractionation processes and strongly related to the vegetation type (C3 or C4 plants) and productivity above the individual cave system [48,49]. Further factors influencing the δ13C values are processes in the soil zone, such as root respiration and the decomposition of organic material [32,49], and prior calcite precipitation (PCP) in air-filled cavities above the cave and on stalactites [50]. Fohlmeister et al. [12] concluded that at Bunker Cave, periods with low drip rates, more PCP and less active or less dense vegetation, potentially due to less precipitation, result in higher δ13C values. Thus, the lower δ13C values during 1.0–0.6 ka BP indicate higher drip rates, less PCP and a well-developed/active vegetation due to more humid conditions at the cave site. In contrast, the slightly higher δ13C values during 1.5–1.3 and 0.5–0.2 ka BP in speleothem Bu1 as well as during 1.7–1.0 and 0.5–0.15 ka BP in speleothem Bu4 suggest lower drip rates, more PCP and a less active or dense vegetation because of drier climate conditions. The interpretation of the δ13C signal in the stalagmites from the Herbstlabyrinth cave system is similar to the interpretation of the δ13C values in the Bunker Cave speleothems. Mischel et al. [32] concluded that lower δ13C values reflect a higher vegetation productivity due to more precipitation. Following this interpretation and the assumption that at the Herbstlabyrinth cave system the climate conditions during cold phases, e.g., at 0.6–0.1 ka BP, were also drier as described for Bunker Cave, we would expect higher δ13C values in the speleothems from the Herbstlabyrinth cave system. However, whereas sample NG01 shows higher δ13C values during 0.4–0.2 ka BP, indicating drier conditions with a less active and less dense vegetation, stalagmite TV1 from the same cave system shows lower δ13C values during this time period, indicating wetter conditions with a denser and more active vegetation. This discrepancy between the δ13C records of the two speleothems from the Herbstlabyrinth may result from chronological uncertainties, in particular since the age model of TV1 is only constrained by a single 230Th/U-age during this time period (Figure 3). Furthermore, site-specific effects, such as different flow routes within the aquifer or changes in drip rates, may have a strong effect on speleothem δ13C values (e.g., [51]). In the case of TV1, an increase in drip rate could result in lower δ13C values during the last 0.5 ka BP (Figure 4). Overall, most patterns are visible in all four δ13C records. Thus, we interpret them as records of supra-regional precipitation changes.

5.2. Trace Elements

Although trace element records of stalagmites are less commonly used for climate reconstruction than δ18O and δ13C records, they can provide important information about past climate variations, such as precipitation variability and their effect on soil and vegetation (e.g., [52,53]). The trace element values (Figure 5, Figure 6 and Figure 7) vary significantly between the speleothems of the two cave systems and also within the same cave. This suggests a strong influence of site-specific effects, which may not necessarily be related to climate change.
Trace elements in speleothems are influenced by the atmosphere, vegetation and soil, karst aquifer, speleothem mineralogy, growth rate as well as possible diagentic effects [49,52]. Previous studies utilizing speleothem trace elements often focused on Mg to reconstruct past changes in precipitation (e.g., [25,54,55]. Magnesium is primarily derived from the carbonate host rock and is thought to be controlled by hydrological processes [52,55]. During dry times, the residence time in the karst is longer resulting in more PCP, and the prolonged contact of water and host rock leads to the incongruent dissolution of more Mg. Both processes increase the Mg concentration of the drip water and, thus, of the speleothem calcite [52,56,57]. Thus, the Mg content of a speleothem may reflect changes in the residence time, which is related to the amount of infiltrating water and precipitation [52]. Barium and Sr are also derived from the carbonate host rock and may also be sensitive to periods with a longer residence time of the seepage water as well as faster growth rates (more incorporation of Ba and Sr during phases of higher growth rate; [52,55]. Furthermore, several studies suggested that the Mg and Sr concentrations (as well as the δ13C values) of speleothems increase due to prior calcite precipitation (PCP), sensitive to dry conditions [49,50,52,58,59]. Cave monitoring at Bunker Cave has indeed shown that the Mg/Ca ratio of stalagmite Bu4 is influenced by PCP with higher Mg/Ca ratios during drier periods and vice versa [12,29].
The Mg content of stalagmite Bu1 is generally lower than that of stalagmite Bu4. This is consistent with the studies of Riechelmann et al. [29] and Fohlmeister et al. [12], in which lower Mg/Ca ratios are attributed to a faster drip rate resulting in less PCP or as a result of a shorter residence time in the karst aquifer with less Mg content derived from host rock dissolution. Therefore, only the Mg concentration of Bu4 can be interpreted as a proxy of past precipitation due to PCP occurring at the drip site of Bu4 [29]. Speleothem Bu4 has higher concentrations between 0.6 and 0.1 ka BP, whereas sample NG01 from the Herbstlabyrinth cave system shows significantly lower and sample TV1 quite constant concentrations during this period. Furthermore, the Mg content of speleothem Bu4 is also higher between 1.55 and 1.2 ka BP and shows similar values as during 0.6–0.1 ka BP. Following the interpretation of Fohlmeister et al. [12] and Wassenburg et al. [25], the higher Mg concentrations during these two phases indicate drier conditions at Bunker Cave, which is consistent with the δ18O and δ13C values of the Bunker Cave speleothems. The Mg records of Bu4 and TV1 show some common patterns, such as the two minima at ca. 1.0 and 0.6 ka BP in TV1, which correspond with the phase of lower values in Bu4 during 1.0–0.5 ka BP. NG01 does not show a similar pattern, and the Mg values are relatively low in comparison to TV1. This is comparable with Bu1 that shows lower Mg concentrations than Bu4 and may indicate that NG01 is—asBu1—not influenced by PCP. In this case, the Mg content of NG01 would be mainly influenced by local processes. Thus, we only interpret the Mg records of Bu4 and TV1 as a proxy for past precipitation variability.
As mentioned above, δ18O values are higher during phases of cold and dry climate and lower during phases with warmer and more humid conditions. However, a distinct negative peak in the Mg content of speleothem Bu4 at around 1.39 ka BP interrupts this dry phase. In contrast to the high Mg content during dry periods in stalagmite Bu4, the Mg concentration of Bu4 is substantially lower during phases with more humid climate conditions, e.g., at around 2.1–1.55 and 1.2–0.6 ka BP. The higher (1.55–1.2 and 0.6–0.1 ka BP) as well as the lower Mg concentration (1.2–0.6 ka BP) of Bu4 correlates with higher δ18O values (1.61–1.2 and 0.56–0.05 ka BP) and lower δ18O values (1.04–0.85 ka BP and 0.78–0.56 ka BP), which is shown in Figure 5 by yellow bars for warm and humid periods and blue bars for cold and dry periods. Thus, during dry (more humid) phases with a high (low) Mg concentration, the δ18O records show higher (lower) values, which is in agreement with the results of Fohlmeister et al. [12].
Most of the other trace elements show no distinctive features during the cold and warm periods highlighted in Figure 3. In Mischel et al. [32], the Ba as well as the P concentrations of the stalagmites from the Herbstlabyrinth cave system were interpreted as vegetation proxies with higher values indicating a more productive vegetation cover. Barium and Sr show positive correlations in speleothems Bu1, Bu4, and NG01 (Table 3). As described above, Sr and Ba can be influenced by PCP, which is indicated by a positive correlation between Mg, Sr and Ba. This is not the case for the stalagmites Bu1, Bu4 and NG01 (Table 3), which excludes PCP as a dominant influencing factor. Another process resulting in a positive correlation between Sr and Ba is growth rate. The growth rate of Bu1 is relatively constant with two phases with lower growth rate around 1.3 and 1.0 ka BP (Figure 2). This is reflected in the relatively constant Ba concentrations with lower values around 1.3 ka BP and 1.0 ka BP. In addition, lower values occur around 0.2 ka BP, which cannot be related to lower growth rate based on the age model. However, since Bu1 stopped growing at 0.15 ka BP, a decrease in growth rate can be assumed (Figure 6). The Ba concentration of Bu4 is relatively constant between 2.5 and 0.9 ka BP without a distinct trend. In addition, the growth rate of Bu4 is quite constant during this time period. It decreases at 1.0 ka BP, which is visible in the lower Ba concentrations between 0.9 and 0.1 ka BP [36]. The strong increase in the Ba concentration of Bu4 in the last 100 years is due to an increased growth rate, which is induced by the opening of the cave around AD 1860. This dramatically changed cave ventilation, the CO2 concentration in the cave air decreased, and resulted in enhanced calcite precipitation [60]. This opening of the cave is also visible in the δ13C values of Bu4 in the most recent time (Figure 4-Bu4). The relation with growth rate is also visible for stalagmite NG01 from the Herbstlabyrinth cave system with fast growth around ca. 2.4 and 2.0 ka BP [32], which is reflected in high Ba concentrations during the same time span (Figure 6). Afterwards, growth rate decreased in two steps, which is also visible in the Ba concentration. To conclude, Ba and Sr are strongly influenced by the growth rate, which is strongly affected by the corresponding drip site. Thus, Ba and Sr are mainly affected by site-specific processes and cannot be used as supra-regional climate proxies.
Treble et al. [55] described P as a surface bioproductivity proxy as well as a proxy for soil activity and wetness (rainfall). Due to a more productive vegetation cover, the P concentration of a speleothem is, thus, higher during humid times [32]. However, as described above for δ13C, P can also be influenced by site-specific processes. Therefore, P is probably more influenced by local processes than supra-regional climate.
The different behavior of the trace elements in the four stalagmites is also evident in the PCAs (Figure 8). Thus, the processes influencing the various proxies are obviously, at least for some proxies (P, Sr and Ba), dominated by site-specific effects rather than climate variability. The correlation coefficients between the different proxies, with exception of Mg and the stable isotopes, show no specific pattern, and during the cold and warm phases mentioned above, only the δ18O and δ13C values as well as the Mg content (Bu4, TV1) of the stalagmites show common features (Figure 9, Figure 10 and Figure 11). Therefore, only these proxy signals of the four speleothems are further investigated below.

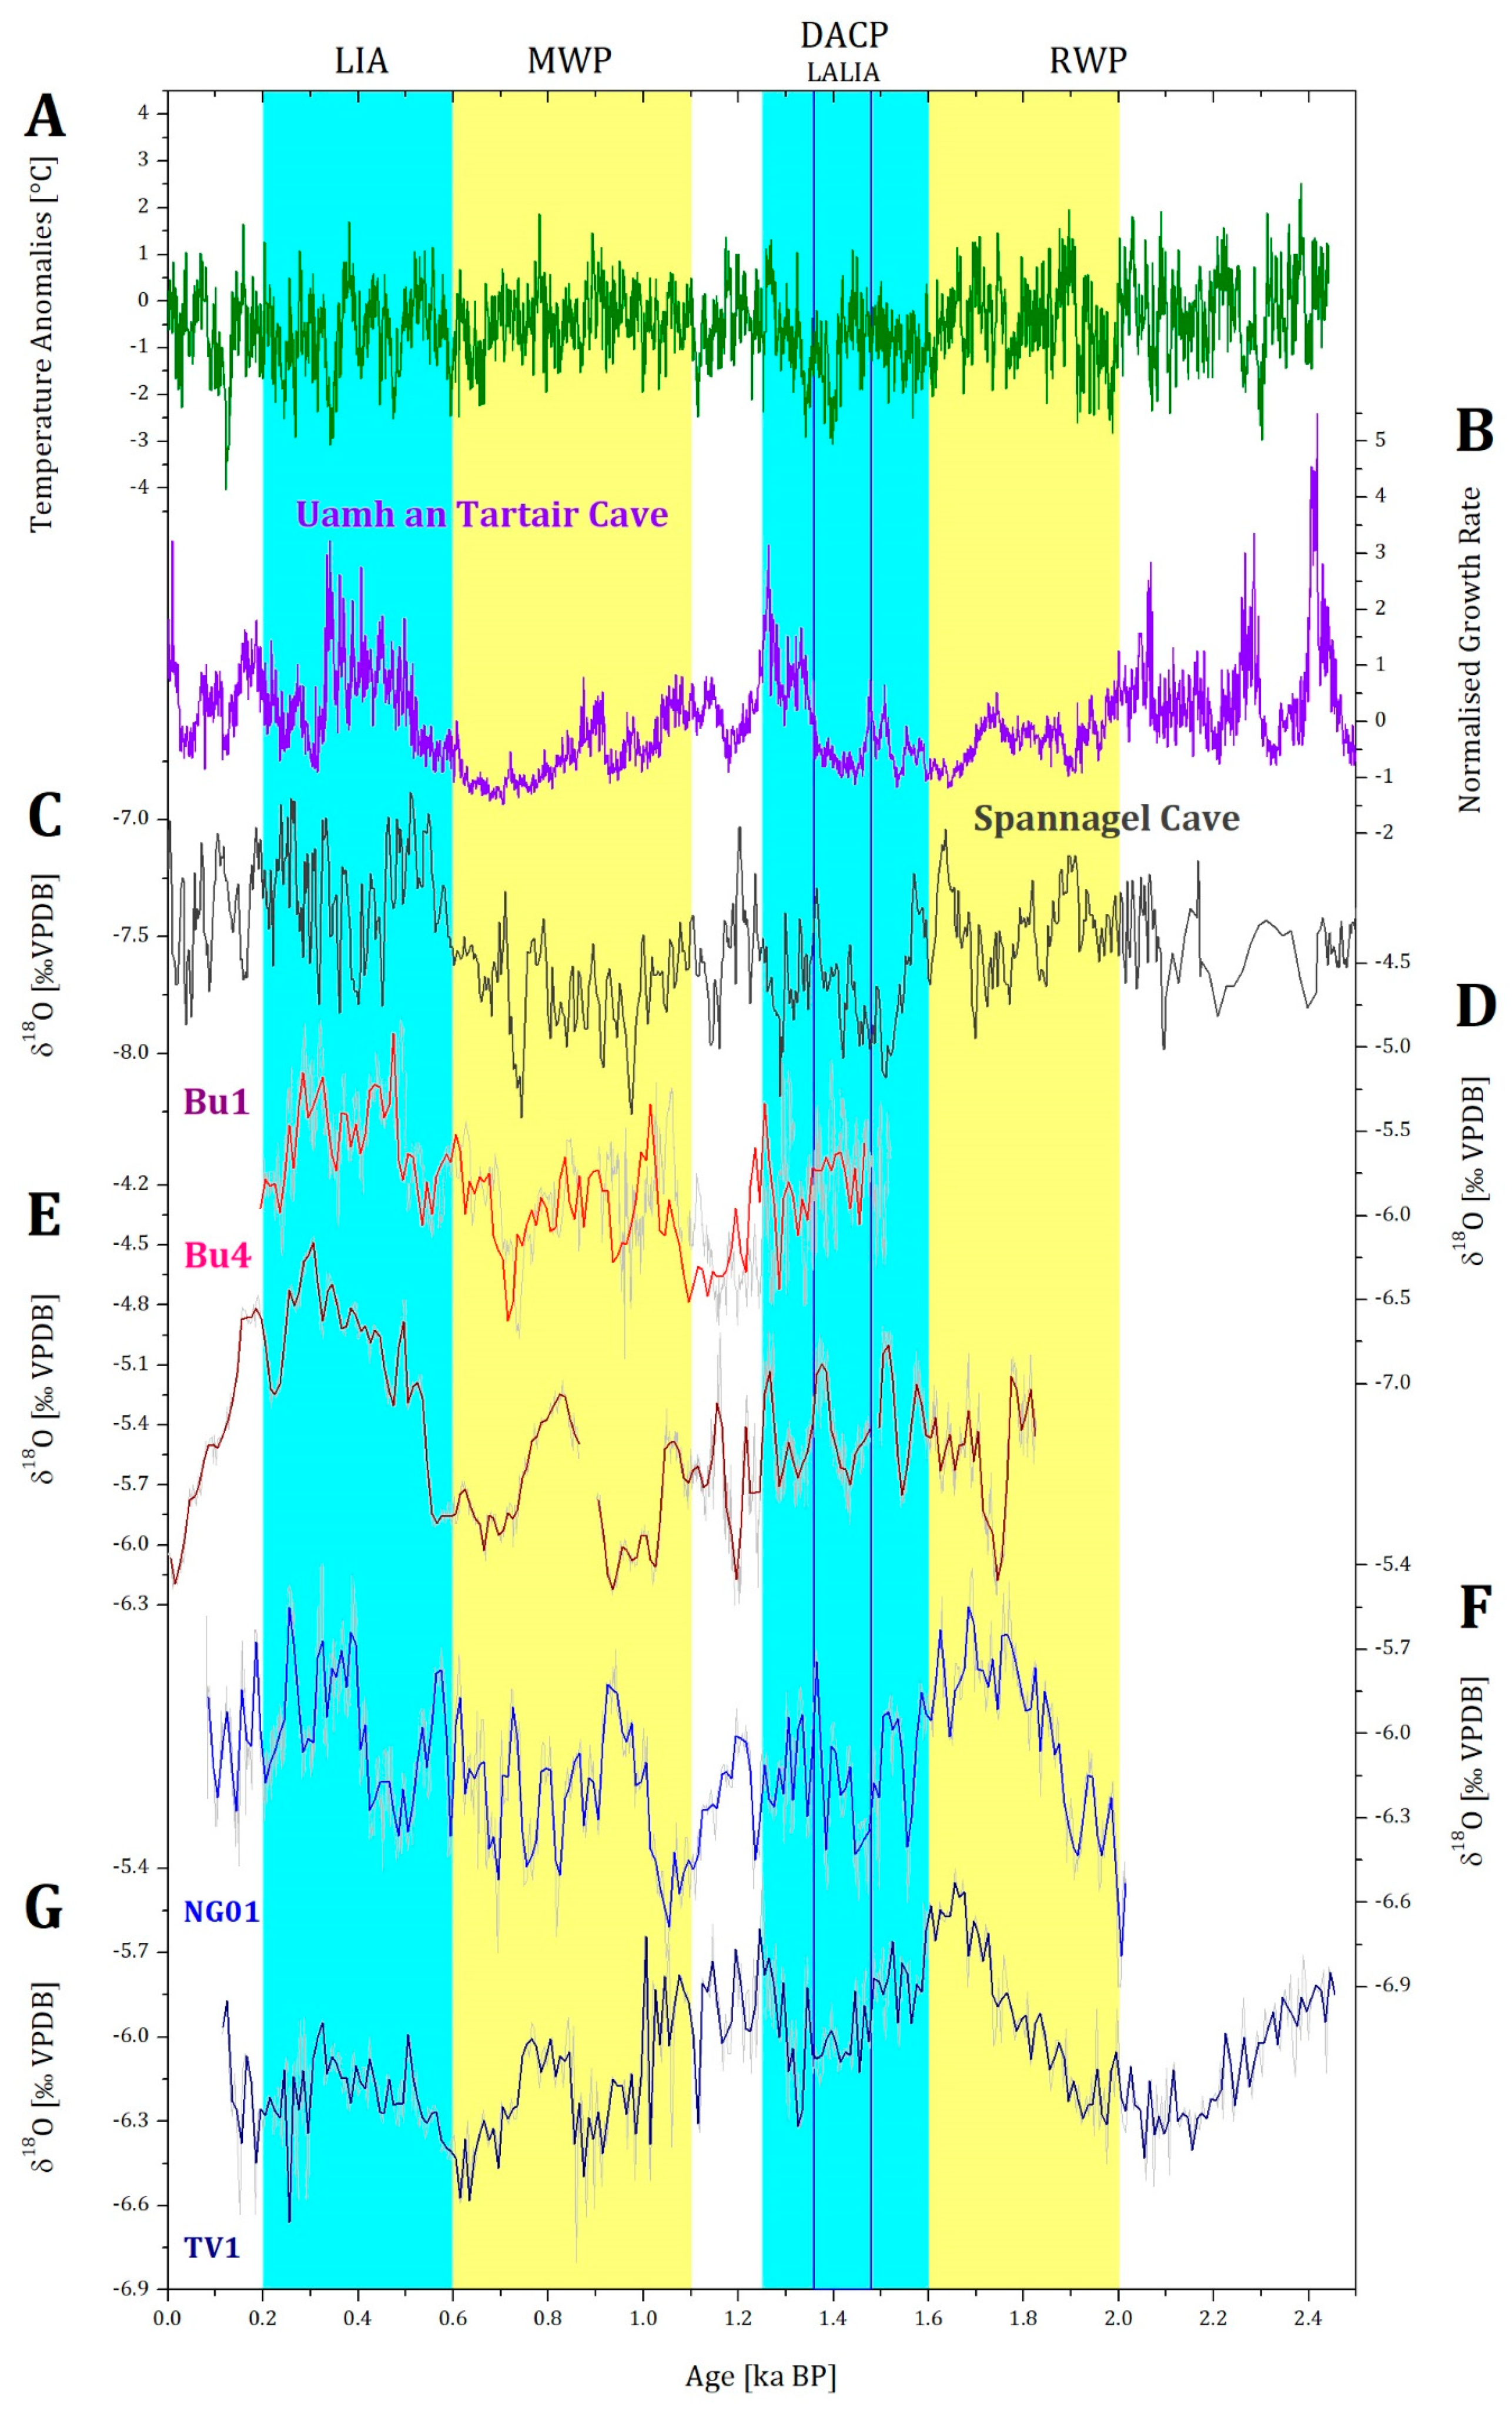
5.3. Cold/Dry and Warm/Humid Phases during the Late Holocene in Germany

The δ18O records of the four speleothems are considered as the most sensitive proxies for climate variability. Figure 11 shows a comparison of the δ18O records with other palaeoclimate records, such as a δ18O record from the alpine Spannagel Cave with higher δ18O values indicating colder temperatures and vice versa [62], a summer temperature reconstruction from alpine tree-rings [3] and the growth rate record from Uamh an Tartair Cave (Scotland) indicating a negative NAO index during times of higher growth rate and vice versa [26]. In general, all these records show periods of agreement with the four δ18O records from this study. The records indicate colder and drier climate for the DACP and the LIA, most probably induced by a negative NAO index, as well as more humid and warmer climate for the RWP and the MWP are indicated by all four records, induced by a positive NAO index. This has an influence on temperature and precipitation, which is recorded in the proxy signals in the speleothems as indicated by the monitoring studies from Bunker Cave and Herbstlabyrinth cave system [27,28].

5.3.1. Cold/Dry Periods

The δ18O and δ13C values of all four stalagmites (Bu1, Bu4, NG01, TV1) as well as the Mg concentration of stalagmites Bu4 and TV1 indicate predominantly cold and dry climate conditions during the DACP (1.6–1.25 ka BP) and the LIA (0.6–0.1 ka BP) (Figure 9, Figure 10 and Figure 11). The DACP was characterized by cold climate conditions between 1.6 and 1.25 ka BP in the Northern Hemisphere [6]. The mean Northern Hemisphere cooling was −0.5 °C, and climate conditions in the Alps were cold and wet [3]. Helama et al. [6] also reported wet conditions for some regions, but also described dry conditions for the Mediterranean region. Potential triggers for the DACP were a North Atlantic ice-rafting event at around 1.4 ka BP or a connection to the North Atlantic Oscillation (NAO) and/or El Niño–Southern Oscillation [6]. In contrast to the higher δ13C and δ18O values of the Bunker Cave speleothems Bu1 and Bu4 and the higher δ13C values of TV1, which indicate cold and dry climate, the decreasing δ13C and δ18O values of speleothem NG01 and the δ18O values of TV1 from the Herbstlabyrinth cave system indicate a warmer and more humid climate (Figure 9 and Figure 11). However, NG01 and TV1 show a trend towards higher δ18O values a bit earlier, which indicates a colder and drier climate. This earlier occurrence of higher δ18O values is most probably due to the uncertainties of the age models of the two stalagmites (Figure 3). As discussed above, δ13C values are also influenced by vegetation density and activity, which could also explain the difference between the two stalagmites from the Herbstlabyrinth cave system. These two stalagmites are from two different parts of the cave, which are some hundreds of meters away from each other. It cannot be excluded that the vegetation cover above the different cave parts was different during this time. Another, more likely, reason could be site-specific changes in the flow routes and drip rate resulting in lower δ13C values. The Mg concentrations of Bu4 and TV1 confirm this interpretation with higher values during this phase, indicating a drier climate (Figure 10).
Büntgen et al. [8] analyzed tree-ring chronologies from the Russian Altai and the European Alps and found a long-lasting cooling, which was identified as the Late Antique Little Ice Age (LALIA, AD 536–660). A minimum in Mg concentration and δ13C values of speleothem Bu4 indicating more humid conditions at Bunker Cave coincides with this cold period, which occurred after several volcanic eruptions and was sustained by a solar minimum as well as ocean and sea-ice feedbacks [8].
The second cold phase mentioned above can be identified as the Little Ice Age (LIA), which was probably the coldest multidecadal to multicentury long climate oscillation during the Late Holocene and was characterized by a strong cooling over the extratropical continents of the Northern Hemisphere [13,61]. The timing and duration of the LIA varies between the individual proxy records [63]. For instance, the LIA was already recorded in the Mg/Ca and stable isotope records of the speleothems from Bunker Cave between 0.7 to 0.2 ka BP [12], whereas Mann et al. [61] described a distinct cooling during 0.6 to 0.3 ka BP. A lower summer insolation in the Northern Hemisphere as well as a solar activity minimum and several volcanic eruptions have been assumed as possible triggers for the cold conditions [17]. In addition, Miller et al. [64] presented records of ice-cap growth in Arctic Canada and Iceland which showed that ice growth and cold summer conditions of the LIA began abruptly between 0.7 and 0.65 ka BP, followed by an intensification around 0.5 ka BP. They also indicate that intervals of ice growth coincided with two of the most volcanically perturbed intervals of the past millennium, and that the onset of the LIA can be linked to an unusual 50-year-long episode with four large Sulphur-rich explosive eruptions [64]. The mean cooling in the Northern Hemisphere was around −0.7 °C [65], and Boch and Spötl [2] described that the LIA in the Alps was marked by cold and wet summers as well as very cold winter months with a phase of increased precipitation between 0.3 and 0.14 ka. The cold phase was also recorded in a multi-archive, multi-proxy summer temperature reconstruction for the European Alps based on tree-rings and lake sediment data [66]. In the speleothem records from Bunker Cave, the LIA is reflected by higher δ18O, δ13C and Mg values (Bu4) indicating cold and dry climate. In addition, both speleothems from the Herbstlabyrinth cave system show a slight increase of the δ18O values during the cold phase. Speleothem NG01 shows substantially higher δ13C values, whereas TV1 shows slightly higher Mg concentrations. As discussed above, the different pattern of the δ13C values of TV1 is attributed to changes in local vegetation, drip rate or changes in flow routes in the karst system. Thus, the majority of the proxy records indicate cold and dry climate conditions during the Dark Ages Cold period and the Little Ice Age (Table 4), which is in a very good correspondence to the paleoclimate records from Spannagel Cave indicating colder climate with higher δ18O values especially during the LIA [62]; further reconstructed summer temperatures from alpine tree-rings show colder temperatures during the DACP and the LIA. Further, the growth rate record from Uamh an Tartair cave (Scotland) indicates negative NAO during the end of the DACP and the LIA.

5.3.2. Warm/Humid Periods

Our multi-proxy data also suggest two warm phases during the last 2500 years (Figure 9, Figure 10 and Figure 11), which coincide with the RWP and MWP. The RWP is a moderately warm phase during 2.3–1.6 ka BP with relatively humid conditions [67,68]. During this phase, both stable oxygen isotope records from the Herbstlabyrinth cave system show a similar pattern with lower δ18O values and an increase of the δ18O values at the end of the RWP. The δ13C values of speleothem TV1 are also lower during the RWP and reflect a higher vegetation productivity due to more precipitation at the cave site. However, NG01 only shows lower δ13C values at the end of the record, whereas TV1 shows increasing values around 2.25 ka BP. Dating uncertainties as well as local vegetation or drip rate effects may account for this inconsistent pattern.
The second warm phase recorded in the high-resolution stable isotope and Mg concentration data can be identified as the MWP. This period between 1.1 and 0.6 ka BP was relatively warm and humid [2,9,10,61,65]. A temperature reconstruction from several climate proxies on the extratropical continents of the northern Hemisphere indicated the highest temperatures during the MWP and the Twentieth Century [7]. Furthermore, Martín-Chivelet et al. [68] suggested that climate during the MWP was warmer than during the RWP and temperatures of both warm periods were higher than present-day temperatures.
In the speleothem records from Bunker Cave, lower δ18O and δ13C values correlate with a lower Mg content (Bu4) during the MWP indicating warm and humid climate conditions. The δ18O records of the two speleothems from the Herbstlabyrinth cave system reach their minimum values during the MWP within dating uncertainties, which is similar to the stable isotope records of the Bunker Cave stalagmites. The two speleothems NG01 and TV1 also show lower δ13C values during the MWP indicating humid climate conditions at the Herbstlabyrinth cave system. In all four stalagmites, these warm and humid conditions were interrupted by a short phase with cold and dry climate conditions (1.0–0.8 ka BP). This cold and dry period is also obvious in the normalized growth rate record from Scotland (Figure 11).
A comparison of the four δ18O records from this study, indicating a warm and humid RWP and MWP, with other records, show a consistent picture (Figure 11). The Spannagel record also shows a warm and humid MWP, even if higher δ18O values prevailed during the RWP (Figure 11) [62]. The NAO reconstruction from Uamh an Tartair Cave suggests a positive NAO during the MWP and the RWP with warm and humid climate indicated by a low growth rate of the speleothems [26]. Furthermore, the temperature reconstruction from alpine tree-rings shows warm summer temperatures during the MWP and the RWP [3].

6. Conclusions

High-resolution multi-proxy records of four precisely dated speleothems (Bu1, Bu4, NG01 and TV1) from two thoroughly monitored cave systems (Bunker Cave and Herbstlabyrinth cave system) enable the reconstruction of climate variability during the last 2500 years. The records show evidence for several centennial-scale climate anomalies during the Late Holocene.
In a first step, the proxy signals were subdivided into proxies influenced by site-specific effects and proxies reflecting supra-regional climate variability by searching for common patterns in all four speleothems. This suggests that Sr, Ba and P are mainly influenced by growth rate (Sr, Ba) and local soil-related processes (P) and therefore, reflect site-specific effects. Similarly, the Mg concentration of Bu1 and TV1 cannot be considered as a proxy for supra-regional climate, because both stalagmites were not influenced by PCP. Therefore, their Mg concentration is not related to precipitation. On the other hand, the δ18O and δ13C values of all four speleothems and the Mg concentration of Bu4 and TV1 show common patterns for most parts of the records suggesting that they are proxies for supra-regional climate variability.
The δ18O records of all four speleothems show higher values during DACP and LIA indicating cold and dry climate as well as lower values during RWP and MWP indicating warm and humid climate. The four δ18O records show a good agreement with other paleoclimate records indicating that the speleothems from Bunker Cave and the Herbstlabyrinth cave system are influenced by the NAO and preserve centennial-scale temperature and precipitation information.
The δ13C records show a consistent pattern between Bu1, Bu4 and NG01 and agree well with the pattern of the δ18O records and the other paleoclimate records. This indicates that they record precipitation and vegetation activity. The δ13C record of TV1 shows a different pattern during some time periods, suggesting that it is not only influenced by supra-regional climate variability, but by site-specific effects, such as local changes in vegetation or drip rate. The Mg concentration of Bu4 and TV1 is controlled by PCP, which is related to precipitation, and also agrees with the patterns of the other climate proxies.
Thus, the δ18O, δ13C and Mg signals show a consistent pattern reflecting a cold and dry DACP and LIA, and a warm and humid RWP and MWP. This documents the influence of the NAO at both cave sites.

Author Contributions

Conceptualization, D.S.; Formal analysis, S.W. and J.F.; Funding acquisition, D.S.; Investigation, S.W.; Methodology, C.S., K.P.J. and D.S.; Project administration, D.S.; Resources, C.S., K.P.J. and D.S.; Supervision, D.S.; Validation, D.F.C.R., J.F. and D.S.; Visualization, D.F.C.R.; Writing – original draft, S.W.; Writing – review & editing, S.W., D.F.C.R., C.S., K.P.J., J.F., A.S.-R. and D.S. All authors have read and agreed to the published version of the manuscript.

Funding

This research was funded by the DFG (SCHO 1274/9-1, 10-1, and 11-1).

Data Availability Statement

Data are available on request.

Acknowledgments

S.W. and D.S. are thankful to the DFG for funding (SCHO 1274/9-1, 10-1, and 11-1). In addition, we thank B.S., B.S. and U.W. for assistance in the laboratory.

Conflicts of Interest

The authors declare no conflict of interest.

References

  1. IPCC. Climate Change 2014: Synthesis Report. Contribution of Working Groups I, II and III to the Fifth Assessment Report of the Intergovernmental Panel on Climate Change; Core Writing Team, Pachauri, R.K., Meyer, L.A., Eds.; IPCC: Geneva, Switzerland, 2014; 151p. [Google Scholar]
  2. Boch, R.; Spötl, C. Reconstructing palaeoprecipitation from an active cave flowstone. J. Quat. Sci. 2011, 26, 675–687. [Google Scholar] [CrossRef]
  3. Büntgen, U.; Tegel, W.; Nicolussi, K.; McCormick, M.; Frank, D.; Trouet, V.; Kaplan, J.O.; Herzig, F.; Heussner, K.-U.; Wanner, H.; et al. 2500 years of European climate variability and human susceptibility. Science 2011, 331, 578–582. [Google Scholar] [CrossRef] [Green Version]
  4. Hass, H.C. Northern Europe climate variations during late Holocene: Evidence from marine Skagerrak. Palaeogeogr. Palaeoclimatol. Palaeoecol. 1996, 123, 121–145. [Google Scholar] [CrossRef]
  5. Vollweiler, N.; Scholz, D.; Mühlinghaus, C.; Mangini, A.; Spötl, C. A precisely dated climate record for the last 9 kyr from three high alpine stalagmites, Spannagel Cave, Austria. Geophys. Res. Lett. 2006, 33, L20703. [Google Scholar] [CrossRef] [Green Version]
  6. Helama, S.; Jones, P.D.; Briffa, K.R. Dark Ages Cold Period: A literature review and directions for future research. Holocene 2017, 27, 1600–1606. [Google Scholar] [CrossRef] [Green Version]
  7. Ljungqvist, F.C. A new reconstruction of temperature variability in the extra-tropical Northern Hemisphere during the last two millennia. Geogr. Ann. 2010, 92, 339–351. [Google Scholar] [CrossRef]
  8. Büntgen, U.; Myglan, V.S.; Ljundqvist, F.C.; McCormick, M.; Di Cosmo, N.; Sigl, M.; Jungclaus, J.; Wagner, S.; Krusic, P.J.; Esper, J.; et al. Cooling and societal change during the Late Antique Little Ice Age from 536 to around 660 AD. Nat. Geosci. 2016, 9, 231–236. [Google Scholar] [CrossRef]
  9. Crowley, T.J.; Lowery, T.S. How warm was the Medieval Warm Period? AMBIO J. Hum. Environ. 2000, 29, 51–54. [Google Scholar] [CrossRef]
  10. Goosse, H.; Arzel, O.; Luterbacher, J.; Mann, M.E.; Renssen, H.; Riedwyl, N.; Timmermann, A.; Xoplaki, E.; Wanner, H. The origin of the European “Medieval Warm Period”. Clim. Past 2006, 2, 93–113. [Google Scholar] [CrossRef] [Green Version]
  11. Hughes, M.K.; Diaz, H.F. Was there a ‘Medieval Warm Period’, and if so, where and when? Clim. Chang. 1994, 26, 109–142. [Google Scholar] [CrossRef]
  12. Fohlmeister, J.; Schröder-Ritzrau, A.; Scholz, D.; Spötl, C.; Riechelmann, D.F.C.; Mudelsee, M.; Wackerbarth, A.; Gerdes, A.; Riechelmann, S.; Immenhauser, A.; et al. Bunker Cave stalagmites: An archive for central European Holocene climate variability. Clim. Past 2012, 8, 1751–1764. [Google Scholar] [CrossRef] [Green Version]
  13. Wanner, H.; Solomina, O.; Grosjean, M.; Ritz, S.P.; Jetel, M. Structure and origin of Holocene cold events. Quat. Sci. Rev. 2011, 30, 3109–3123. [Google Scholar] [CrossRef]
  14. Alley, R.B.; Ágústsdóttir, A.M. The 8k event: Cause and consequences of a major Holocene abrupt climate change. Quat. Sci. Rev. 2005, 24, 1123–1149. [Google Scholar] [CrossRef]
  15. Rohling, E.J.; Pälike, H. Centennial-scale climate cooling with a sudden cold event around 8200 years ago. Nature 2005, 434, 975–979. [Google Scholar] [CrossRef] [PubMed]
  16. deMenocal, P.B. Cultural responses to climate change during the late Holocene. Science 2001, 292, 667–673. [Google Scholar] [CrossRef] [PubMed] [Green Version]
  17. Wanner, H.; Beer, J.; Bütikofer, J.; Crowley, T.J.; Cubasch, U.; Flückiger, J.; Goosse, H.; Grosjean, M.; Joos, F.; Kaplan, J.O.; et al. Mid- to Late Holocene climate change: An overview. Quat. Sci. Rev. 2008, 27, 1791–1828. [Google Scholar] [CrossRef]
  18. Zhang, D.D.; Brecke, P.; Lee, H.F.; He, Y.-Q.; Zhang, J. Global climate change, war, and population decline in recent human history. Proc. Natl. Acad. Sci. USA 2007, 104, 19214–19219. [Google Scholar] [CrossRef] [PubMed] [Green Version]
  19. Duncan-Jones, R.P. Economic change and the transition to Late Antiquity. In Approaching Late Antiquity: The Transformation from Early to Late Empire; Swain, S., Edwards, M., Eds.; Oxford Univ. Press: Oxford, UK, 2004; pp. 20–52. [Google Scholar]
  20. Witschel, C. Re-evaluating the Roman West in the 3rd c. A.D. J. Rom. Archaeol. 2004, 17, 251–281. [Google Scholar] [CrossRef]
  21. Fohlmeister, J.; Plessen, B.; Dudashvili, A.S.; Tjallingii, R.; Wolff, C.; Gafurov, A.; Cheng, H. Winter precipitation changes during the Medieval Climate Anomaly and the Little Ice Age in arid Central Asia. Quat. Sci. Rev. 2017, 178, 24–36. [Google Scholar] [CrossRef] [Green Version]
  22. Trouet, V.; Esper, J.; Graham, N.E.; Baker, A.; Scourse, J.D.; Frank, D.C. Persistent positive North Atlantic Oscillation Mode dominated the Medieval Climate Anomaly. Science 2009, 324, 78–80. [Google Scholar] [CrossRef] [Green Version]
  23. Trouet, V.; Scourse, J.D.; Raible, C.C. North Atlantic storminess and Atlantic Meridional Overturning Circulation during the last Millennium: Reconciling contradictory proxy records of NAO variability. Glob. Planet. Chang. 2012, 84–85, 48–55. [Google Scholar] [CrossRef]
  24. Wang, T.; Surge, D.; Walker, K.J. Seasonal climate change across the Roman Warm Period/Vandal Minimum transition using isotope sclerochronology in archaeological shells and otoliths, southwest Florida, USA. Quat. Int. 2012, 308–309, 230–241. [Google Scholar] [CrossRef]
  25. Wassenburg, J.A.; Dietrich, S.; Fietzke, J.; Fohlmeister, J.; Jochum, K.P.; Scholz, D.; Richter, D.K.; Sabaoui, A.; Spötl, C.; Lohmann, G.; et al. Reorganization of the North Atlantic Oscillation during early Holocene deglaciation. Nat. Geosci. 2016, 9, 602–605. [Google Scholar] [CrossRef]
  26. Baker, A.; Hellstrom, J.C.; Kelly, B.F.J.; Mariethoz, G.; Trouet, V. A composite annual-resolution stalagmite record of North Atlantic climate over the last three millennia. Sci. Rep. 2015, 5, 10307. [Google Scholar] [CrossRef] [Green Version]
  27. Mischel, S.A.; Scholz, D.; Spötl, C. δ18O values of cave drip water: A promising proxy for the reconstruction of the North Atlantic Oscillation? Clim. Dyn. 2015, 45, 3035–3050. [Google Scholar] [CrossRef]
  28. Riechelmann, S.; Schröder-Ritzrau, A.; Spötl, C.; Riechelmann, D.F.C.; Richter, D.K.; Mangini, A.; Frank, N.; Breitenbach, S.F.M.; Immenhauser, A. Sensitivity of Bunker Cave to climatic forcings highlighted through multi-annual monitoring of rain-, soil-, and dripwaters. Chem. Geol. 2017, 449, 194–205. [Google Scholar] [CrossRef] [Green Version]
  29. Riechelmann, D.F.C.; Schröder-Ritzrau, A.; Scholz, D.; Fohlmeister, J.; Spötl, C.; Richter, D.K.; Mangini, A. Monitoring Bunker Cave (NW Germany): A prerequisite to interpret geochemical proxy data of speleothems from this site. J. Hydrol. 2011, 409, 682–695. [Google Scholar] [CrossRef]
  30. Riechelmann, S.; Buhl, D.; Schröder-Ritzrau, A.; Spötl, C.; Riechelmann, D.F.C.; Richter, D.K.; Kluge, T.; Marx, T.; Immenhauser, A. Hydrogeochemistry and fractionation pathways of Mg isotopes in a continental weathering system: Lessons from field experiments. Chem. Geol. 2012, 300–301, 109–122. [Google Scholar] [CrossRef]
  31. Grebe, W. Die Bunkerhöhle in Iserlohn-Letmathe (Sauerland). Mitt. Verb. Dtsch. Höhlen Karstforscher 1993, 39, 22–23. [Google Scholar]
  32. Mischel, S.A.; Scholz, D.; Spötl, C.; Jochum, K.P.; Schröder-Ritzrau, A.; Fiedler, S. Holocene climate variability in Central Germany and a potential link to the polar North Atlantic: A replicated record from three coeval speleothems. Holocene 2017, 27, 509–525. [Google Scholar] [CrossRef]
  33. Immenhauser, A.; Buhl, D.; Richter, D.; Niedermayr, A.; Riechelmann, D.; Dietzel, M.; Schulte, U. Magnesium-isotope fractionation during low-Mg calcite precipitation in a limestone cave—Field study and experiments. Geochim. Cosmochim. Acta 2010, 74, 4346–4364. [Google Scholar] [CrossRef]
  34. Riechelmann, S.; Schröder-Ritzrau, A.; Wassenburg, J.A.; Schreuer, J.; Richter, D.K.; Riechelmann, D.F.C.; Terente, M.; Constantin, S.; Mangini, A.; Immenhauser, A. Physicochemical characteristics of drip waters: Influence on mineralogy and crystal morphology of recent cave carbonate precipitates. Geochim. Cosmochim. Acta 2014, 145, 13–29. [Google Scholar] [CrossRef]
  35. Wackerbarth, A.; Langebroek, P.M.; Werner, M.; Lohmann, G.; Riechelmann, S.; Borsato, A.; Mangini, A. Simulated oxygen isotopes in cave drip water and speleothem calcite in European caves. Clim. Past 2012, 8, 1781–1799. [Google Scholar] [CrossRef] [Green Version]
  36. Waltgenbach, S.; Scholz, D.; Spötl, C.; Riechelmann, D.F.C.; Jochum, K.P.; Fohlmeister, J.; Schröder-Ritzrau, A. Climate and structure of the 8.2 ka event reconstructed from three speleothems from Germany. Glob. Planet. Chang. 2020, 193, 103266. [Google Scholar] [CrossRef]
  37. Hoffmann, D.L.; Prytulak, J.; Richards, D.A.; Elliott, T.; Coath, C.D.; Smart, P.L.; Scholz, D. Procedures for accurate U and Th isotope measurements by high precision MC-ICPMS. Int. J. Mass Spectrom. 2007, 264, 97–109. [Google Scholar] [CrossRef]
  38. Yang, Q.; Scholz, D.; Jochum, K.P.; Hoffmann, D.L.; Stoll, B.; Weis, U.; Schwager, B.; Andreae, M.O. Lead isotope variability in speleothems—A promising new proxy for hydrological change? First results from a stalagmite from western Germany. Chem. Geol. 2015, 396, 143–151. [Google Scholar] [CrossRef]
  39. Gibert, L.; Scott, G.R.; Scholz, D.; Budsky, A.; Ferrandez, C.; Martin, R.A.; Ribot, F.; Leria, M. Chronology for the Cueva Victoria fossil site (SE Spain): Evidence for Early Pleistocene Afro-Iberian dispersals. J. Hum. Evol. 2016, 90, 183–197. [Google Scholar] [CrossRef]
  40. Obert, J.C.; Scholz, D.; Felis, T.; Brocas, W.M.; Jochum, K.P.; Andreae, M.O. 230Th/U dating of Last Interglacial brain corals from Bonaire (southern Caribbean) using bulk and theca wall material. Geochim. Cosmochim. Acta 2016, 178, 20–40. [Google Scholar] [CrossRef]
  41. Cheng, H.; Edwards, R.L.; Hoff, J.; Gallup, C.D.; Richards, D.A.; Asmerom, Y. The half-lives of uranium-234 and thorium-230. Chem. Geol. 2000, 169, 17–33. [Google Scholar] [CrossRef]
  42. Wedepohl, K.H. The composition of the continental crust. Geochim. Cosmochim. Acta 1995, 59, 1217–1232. [Google Scholar] [CrossRef]
  43. Scholz, D.; Hoffmann, D.L. StalAge—An algorithm designed for construction of speleothem age models. Quat. Geochronol. 2011, 6, 369–382. [Google Scholar] [CrossRef]
  44. Spötl, C. Long-term performance of the Gasbench isotope ratio mass spectrometry system for the stable isotope analysis of carbonate microsamples. Rapid Commun. Mass Spectrom. 2011, 25, 1683–1685. [Google Scholar] [CrossRef] [PubMed]
  45. Jochum, K.P.; Stoll, B.; Herwig, K.; Willbold, M. Validation of LA-ICP-MS trace element analysis of geological glasses using a new solid-state 193 nm Nd:YAG laser and matrix-matched calibration. J. Anal. At. Spectrom. 2007, 22, 112–121. [Google Scholar] [CrossRef]
  46. Jochum, K.P.; Scholz, D.; Stoll, B.; Weis, U.; Wilson, S.A.; Yang, Q.; Schwalb, A.; Börner, N.; Jacob, D.E.; Andreae, M.O. Accurate trace element analysis of speleothems and biogenic calcium carbonates by LA-ICP-MS. Chem. Geol. 2012, 318–319, 31–44. [Google Scholar] [CrossRef]
  47. Lachniet, M.S. Climatic and environmental controls on speleothem oxygen-isotope values. Quat. Sci. Rev. 2009, 28, 412–432. [Google Scholar] [CrossRef]
  48. McDermott, F. Palaeo-climate reconstruction from stable isotope variations in speleothems: A review. Quat. Sci. Rev. 2004, 23, 901–918. [Google Scholar] [CrossRef]
  49. Fairchild, I.J.; Smith, C.L.; Baker, A.; Fuller, L.; Spötl, C.; Mattey, D.; McDermott, F. Modification and preservation of environmental signals in speleothems. Earth-Sci. Rev. 2006, 75, 105–153. [Google Scholar] [CrossRef] [Green Version]
  50. Fairchild, I.J.; Borsato, A.; Tooth, A.F.; Frisia, S.; Hawkesworth, C.J.; Huang, Y.; McDermott, F.; Spiro, B. Controls on trace element (Sr-Mg) compositions of carbonate cave waters: Implications for speleothem climatic records. Chem. Geol. 2000, 166, 255–269. [Google Scholar] [CrossRef]
  51. Dreybrodt, W.; Scholz, D. Climatic dependence of stable carbon and oxygen isotope signals recorded in speleothems: From soil water to speleothem calcite. Geochim. Cosmochim. Acta 2011, 75, 734–752. [Google Scholar] [CrossRef]
  52. Fairchild, I.J.; Treble, P.C. Trace elements in speleothems as recorders of environmental change. Quat. Sci. Rev. 2009, 28, 449–468. [Google Scholar] [CrossRef]
  53. Warken, S.F.; Fohlmeister, J.; Schröder-Ritzrau, A.; Constantin, S.; Spötl, C.; Gerdes, A.; Esper, J.; Frank, N.; Arps, J.; Terente, M.; et al. Reconstruction of late Holocene autumn/winter precipitation variability in SW Romania from a high-resolution speleothem trace element record. Earth Planet. Sci. Lett. 2018, 499, 122–133. [Google Scholar] [CrossRef]
  54. Huang, Y.; Fairchild, I.J.; Borsato, A.; Frisia, S.; Cassidy, N.J.; McDermott, F.; Hawkesworth, C.J. Seasonal variations in Sr, Mg and P in modern speleothems (Grotta di Ernesto, Italy). Chem. Geol. 2001, 175, 429–448. [Google Scholar] [CrossRef]
  55. Treble, P.; Shelley, J.M.G.; Chappell, J. Comparison of high resolution sub-annual records of trace elements in a modern (1911–1992) speleothem with instrumental climate data from southwest Australia. Earth Planet. Sci. Lett. 2003, 216, 141–153. [Google Scholar] [CrossRef]
  56. Hellstrom, J.C.; McCulloch, M.T. Multi-proxy constraints on the climatic significance of trace element records from a New Zealand speleothem. Earth Planet. Sci. Lett. 2000, 179, 287–297. [Google Scholar] [CrossRef]
  57. McDonald, J.; Drysdale, R.; Hill, D. The 2002-2003 El-Niño recorded in Australian cave drip waters: Implications for reconstructing rainfall histories using stalagmites. Geophys. Res. Lett. 2004, 31, L22202. [Google Scholar] [CrossRef]
  58. Fairchild, I.J.; Baker, A. Speleothem Science; Wiley-Blackwell: Oxford, UK, 2012. [Google Scholar]
  59. Wassenburg, J.A.; Immenhauser, A.; Richter, D.K.; Jochum, K.P.; Fietzke, J.; Deininger, M.; Goos, M.; Scholz, D.; Sabaoui, A. Climate and cave control on Pleistocene/Holocene calcite-to-aragonite transitions in speleothems from Morocco: Elemental and isotopic evidence. Geochim. Cosmochim. Acta 2012, 92, 23–47. [Google Scholar] [CrossRef]
  60. Riechelmann, S.; Breitenbach, S.F.M.; Schröder-Ritzrau, A.; Mangini, A.; Immenhauser, A. Ventilation and cave air pCO2 in the Bunker-Emst Cave System (NW Germany): Implications for speleothem proxy data. J. Cave Karst Stud. 2019, 81, 98–112. [Google Scholar] [CrossRef]
  61. Mann, M.E.; Zhang, Z.; Rutherford, S.; Bradley, R.S.; Hughes, M.K.; Shindell, D.; Ammann, C.; Faluvegi, G.; Ni, F. Global signatures and dynamical origins of the Little Ice Age and Medieval Climate Anomaly. Science 2009, 326, 1256. [Google Scholar] [CrossRef] [PubMed] [Green Version]
  62. Fohlmeister, J.; Vollweiler, N.; Spötl, C.; Mangini, A. COMNISPA II: Update of a mid-European isotope climate record, 11 ka to present. Holocene 2013, 23, 749–754. [Google Scholar] [CrossRef]
  63. Neukom, R.; Steiger, N.; Gómez-Navarro, J.J.; Wang, J.; Werner, J.P. No evidence for globally coherent warm and cold periods over the preindustrial Common Era. Nature 2019, 571, 550–554. [Google Scholar] [CrossRef]
  64. Miller, G.H.; Geirsdóttir, Á.; Zhong, Y.; Larsen, D.J.; Otto-Bliesner, B.L.; Holland, M.M.; Bailey, D.A.; Refsnider, K.A.; Lehman, S.J.; Southon, J.R.; et al. Abrupt onset of the Little Ice Age triggered by volcanism and sustained by sea-ice/ocean feedbacks. Geophys. Res. Lett. 2012, 39, L02708. [Google Scholar] [CrossRef] [Green Version]
  65. Moberg, A.; Sonechkin, D.M.; Holmgren, K.; Datsenko, N.M.; Karlén, W. Highly variable Northern Hemisphere temperatures reconstructed from low- and high-resolution proxy data. Nature 2005, 433, 613–617. [Google Scholar] [CrossRef] [PubMed]
  66. Trachsel, M.; Kamenik, C.; Grosjean, M.; McCarroll, D.; Moberg, A.; Brázdil, R.; Büntgen, U.; Dobrovolný, P.; Esper, J.; Frank, D.C.; et al. Multi-archive summer temperature reconstruction for the European Alps, AD 1053-1996. Quat. Sci. Rev. 2012, 46, 66–79. [Google Scholar] [CrossRef]
  67. Goudeau, M.-L.S.; Reichart, G.-J.; Wit, J.C.; de Nooijer, L.J.; Grauel, A.-L.; Bernasconi, S.M.; de Lange, G.J. Seasonality variations in the Central Mediterranean during climate change events in the Late Holocene. Palaeogeogr. Palaeoclimatol. Palaeoecol. 2015, 418, 304–318. [Google Scholar] [CrossRef]
  68. Martín-Chivelet, J.; Muñoz-García, M.B.; Edwards, R.L.; Turrero, M.J.; Ortega, A.I. Land surface temperature changes in Northern Iberia since 4000 yr BP, based on δ13C of speleothems. Glob. Planet. Chang. 2011, 77, 1–12. [Google Scholar] [CrossRef] [Green Version]
Figure 1. Location of Bunker Cave (Bu1 and Bu4) and Herbstlabyrinth cave system (NG01 and TV1). (A) The rectangle marks the location of the detailed map (B) in Europe. The location of Uamh an Tartair and Spannagel Cave are also indicated, and the green ellipse shows the region of alpine trees studied by [3]. The grey areas in map (B) indicate Devonian limestone outcrops.
Geosciences 11 00166 g001
Figure 2. Age-depth model for speleothem Bu1 from Bunker Cave. Red dots indicate the ages measured with TIMS [12], the black dots indicate the new MC-ICP-MS 230Th/U-ages measured in this study, and the dashed red lines show the upper and lower 95%-confidence limits of the age model.
Geosciences 11 00166 g002
Figure 3. Stable isotope records of all four speleothems (Bu1, Bu4, NG01 and TV1) for the last 2.5 ka BP. Blue bars indicate phases of higher δ18O values and yellow bars phases of lower δ18O values. 230Th/U ages are indicated in the lower part of each panel.
Geosciences 11 00166 g003
Figure 4. Stable carbon isotope records of speleothems Bu1 and Bu4 from Bunker Cave as well as stalagmites NG01 and TV1 from the Herbstlabyrinth cave system. Blue bars indicate periods of higher δ18O values and yellow bars periods of lower δ18O values (cf. Figure 3).
Geosciences 11 00166 g004
Figure 5. Mg concentration of four speleothems Bu1 and Bu4 from Bunker Cave as well as NG01 and TV1 from the Herbstlabyrinth cave system. The trace element data were smoothed with a 10-point (NG01 and TV1) and 20-point (Bu1 and Bu4) running median and, thus, have an average temporal resolution between 1.6 and 9.7 years. The raw data are shown in light grey and the respective running medians as colored lines. Blue bars indicate phases of higher δ18O values and yellow bars phases of lower δ18O values in the individual stalagmites (cf. Figure 3).
Geosciences 11 00166 g005
Figure 6. Ba concentration of the two speleothems Bu1 (A) and Bu4 (B) from Bunker Cave as well as NG01 (C) from the Herbstlabyrinth cave system. The data were smoothed with a 10-point (NG01) or 20-point (Bu1 and Bu4) running median. The raw data are shown in light grey and the respective running medians as colored lines.
Geosciences 11 00166 g006
Figure 7. The P concentration of all four speleothems Bu1 (A), Bu4 (B), NG01 (C) and TV1 (D). The data were smoothed with a 10-point (NG01 and TV1) or 20-point (Bu1 and Bu4) running median. The raw data are shown in light grey and the running medians as colored lines.
Geosciences 11 00166 g007
Figure 8. Results of the principal component analysis (PCA) of stalagmites Bu1 (A) and Bu4 (B) from Bunker Cave as well as NG01 (C) and TV1 (D) from the Herbstlabyrinth cave system.
Geosciences 11 00166 g008
Figure 9. δ13C records of all four speleothems with a temporal resolution of 10 years. Yellow bars indicate the Medieval Warm Period (MWP) and the Roman Warm Period (RWP) as periods with warm and humid climate, and blue bars indicate the Little Ice Age (LIA), the Dark Ages Cold Period (DACP) and the Late Antique Little Ice Age (LALIA) as periods with cold and dry climate. Timing and duration of these cold and warm phases are shown as described in the literature [2,6,8,12,61].
Geosciences 11 00166 g009
Figure 10. Mg records of speleothems Bu4 and TV1 with a temporal resolution of 10 years. Yellow bars indicate the MWP and the RWP as periods with warm and humid climate and blue bars indicate the LIA, the DACP and the LALIA as periods with cold and dry climate. Timing and duration of these cold and warm phases are shown as described in the literature [2,6,8,12,61].
Geosciences 11 00166 g010
Figure 11. δ18O records of all speleothems (Bu1, Bu4, NG01 and TV1) in comparison with other climate records. (A) Summer temperature anomalies with respect to AD 1901–2000 reconstructed from alpine tree-rings [3], (B) normalized growth rate of five stalagmites from Uamh an Tartair Cave (Scotland, [26]), (C) composite δ18O record from Spannagel Cave (Austria, [62]), (D) δ18O record of speleothem Bu1 from Bunker Cave, (E) δ18O record of speleothem Bu4 from Bunker Cave, (F) δ18O record of stalagmite NG01 from the Herbstlabyrinth cave system and (G) δ18O record of stalagmite TV1 from the Herbstlabyrinth cave system. The original δ18O records of Bu1, Bu4, NG01 and TV1 are shown in light grey and the δ18O records with a temporal resolution of 10 years are shown as coloured lines. Yellow bars indicate the MWP and the RWP as periods with warm and humid climate, and blue bars indicate the LIA, the DACP and the LALIA as periods with cold and dry climate. Timing and duration of these cold and warm phases are shown as described in the literature [2,6,8,12,61].
Geosciences 11 00166 g011
Table 1. U and Th isotopic compositions as well as uncorrected and corrected 230Th/U-ages for Bu1 (Bunker Cave). Errors are 2σ analytical uncertainties, and activity ratios are indicated by parentheses. All ages refer to BP (BP = before present, AD 1950).
Sample
ID
Depth
[cm]
238U
[µg g−1]
232Th
[ng g−1]
(234U/238U)(230Th/238U)(230Th/232Th)(234U/238U)initialAgeuncorrected
[ka BP]
Agecorrected
[ka BP]
Bu1-3.11.40.04014 ± 0.000280.0606 ± 0.00231.3494 ± 0.00570.0061 ± 0.001413.2 ± 2.81.3499 ± 0.00570.46 ± 0.110.43 ± 0.11
Bu1-3.24.40.04178 ± 0.000290.1193 ± 0.00421.3417 ± 0.00570.0138 ± 0.001315.6 ± 1.51.3428 ± 0.00571.12 ± 0.111.06 ± 0.11
Bu1-3.36.30.04589 ± 0.000280.3399 ± 0.00351.3425 ± 0.00340.0127 ± 0.00146.02 ± 0.431.3435 ± 0.00341.127 ± 0.0850.97 ± 0.12
Bu1-3.410.10.06136 ± 0.000440.1745 ± 0.00561.3444 ± 0.00540.0182 ± 0.001120.3 ± 1.31.3458 ± 0.00551.482 ± 0.0901.421 ± 0.093
Bu1-2.111.80.05373 ± 0.000310.1453 ± 0.00351.3410 ± 0.00250.0167 ± 0.001319.7 ± 1.51.3423 ± 0.00251.36 ± 0.101.30 ± 0.11
Bu1-2.212.90.05177 ± 0.000300.1479 ± 0.00361.3396 ± 0.00290.0176 ± 0.001119.6 ± 1.21.3410 ± 0.00281.438 ± 0.0861.377 ± 0.097
Bu1-2.3160.03663 ± 0.000210.2516 ± 0.00451.3297 ± 0.00300.0200 ± 0.00179.68 ± 0.691.3312 ± 0.00301.73 ± 0.131.58 ± 0.14
Table 2. Mean δ18O and δ13C values, standard deviations, minima and maxima as well as the temporal resolution and the time range of the stable isotope records of Bu1 and Bu4 from Bunker Cave as well as NG01 and TV1 from the Herbstlabyrinth.
Bu1Bu4NG01TV1
Mean δ18O [‰]−5.9−5.5−6.1−6.1
Std. dev. δ18O0.40.40.30.2
Min. δ18O [‰]−6.9−6.3−7.0−6.8
Max. δ18O [‰]−4.8−4.5−5.3−5.4
Mean δ13C [‰]−10.6−9.5−10.6−8.9
Std. dev. δ13C0.60.60.40.4
Min. δ13C [‰]−11.9−10.9−11.3−9.9
Max. δ13C [‰]−8.4−8.0−9.3−7.7
Resolution [years]0.91.42.35.4
Time range [ka BP]0.20–1.520–1.830.08–2.020.11–2.45
Table 3. Correlation coefficients of the stable isotope and trace element data of all four speleothems. Only significant correlations are shown. Numbers in bold indicate p values < 0.001, numbers in italics p values < 0.01 and underlined numbers p values < 0.05.
Bu1δ13Cδ18OMgPSrBa
δ13C 0.370.41−0.24−0.36−0.60
δ18O 0.51−0.27
Mg −0.30−0.28−0.34
P −0.22
Sr 0.64
Ba
Bu4δ13Cδ18OMgPSrBa
δ13C 0.520.47−0.12
δ18O 0.54 −0.15−0.34
Mg 0.350.29
P −0.13−0.23
Sr 0.65
Ba
NG01δ13Cδ18OMgPSrBa
δ13C 0.37−0.54−0.31−0.33−0.47
δ18O −0.13
Mg −0.180.440.36
P
Sr 0.51
Ba
TV1δ13Cδ18OMgP
δ13C 0.38−0.40
δ18O −0.25
Mg −0.37
P
Table 4. Summary of the climate conditions at the two studied cave sites during the cold (Dark Ages Cold Period (DACP) and Little Ice Age (LIA)) and warm phases (Roman Warm Period (RWP) and Medieval Warm Period (MWP)).
Bunker CaveHerbstlabyrinth Cave System
RWP warm/humid
DACPcold/drycold/dry
MWPwarm/humidwarm/humid
LIAcold/drycold/dry
Publisher’s Note: MDPI stays neutral with regard to jurisdictional claims in published maps and institutional affiliations.

