Article

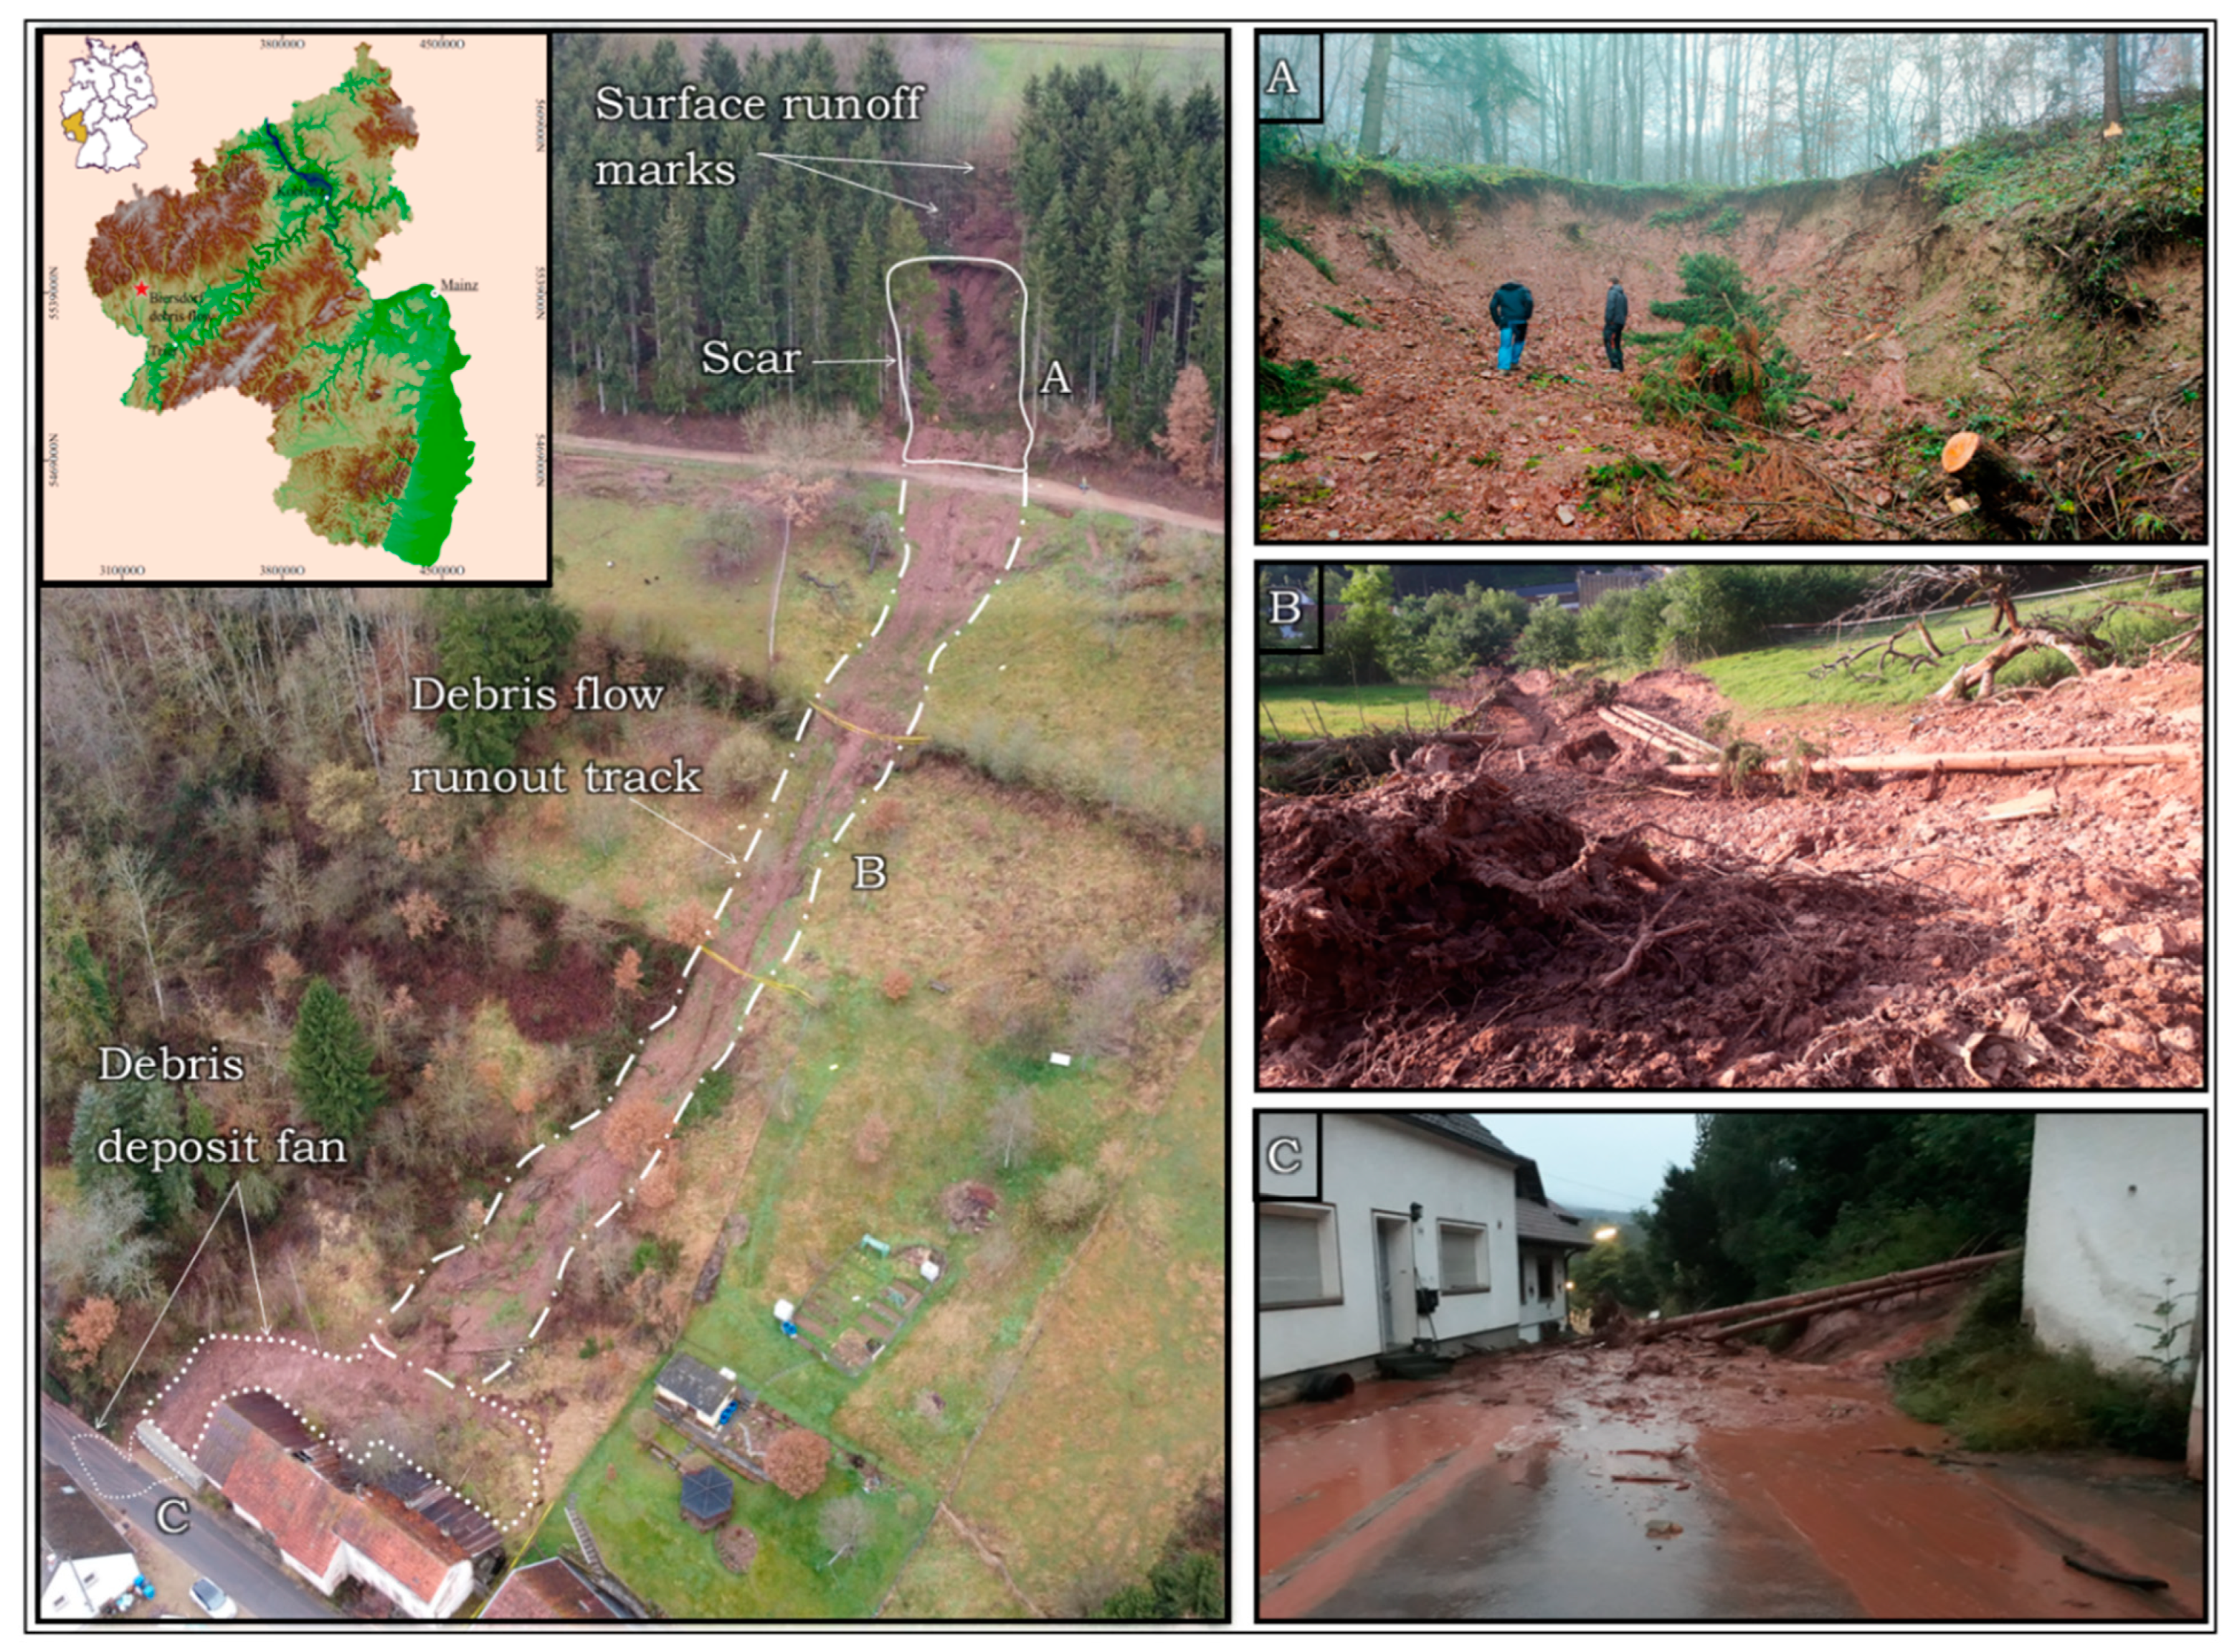
Multi-Methodological Investigation of the Biersdorf Hillslope Debris Flow (Rheinland-Pfalz, Germany) Associated to the Torrential Rainfall Event of 14 July 2021

1
Institute of Geoscience, Johannes Gutenberg-University Mainz, 55128 Mainz, Germany
2
Institute of Geography, Johannes Gutenberg-University Mainz, 55128 Mainz, Germany
3
Geological Survey and Mining Authority of Rheinland-Pfalz, 55129 Mainz, Germany
*
Author to whom correspondence should be addressed.
Submission received: 14 April 2022 / Revised: 9 June 2022 / Accepted: 10 June 2022 / Published: 14 June 2022

Abstract

:
The investigation of mass movements is of major interest in mountain regions as these events represent a significant hazard for people and cause severe damage to crucial infrastructure. The torrential rainfall event that mainly occurred on the 14 July 2021 in western Central Europe not only led to severe flooding catastrophes (e.g., Meuse, Ahr and Erft rivers) but also triggered hundreds of mass movements in the low mountain range. Here, we investigate a hillslope debris flow that occurred in Biersdorf in the Eifel area (Rhenish Massif, Rheinland-Pfalz) using a comprehensive geomorphological–geophysical approach in order to better understand the triggering mechanisms and process dynamics. We combined field studies by means of Electrical Resistivity Tomography (ERT), Direct Push Hydraulic Profiling (HPT) and sediment coring with UAV-generated photogrammetry, as well as debris flow runout modelling. Our results show that for the Biersdorf hillslope debris flow, the geomorphological and geotectonic position played a crucial role. The hillslope debris flow was triggered at a normal fault separating well-draining limestones of the Lower Muschelkalk, from dense weathered clay and sandstones of the Upper Buntsandstein. The combination of a large surface runoff and strong interflow at the sliding surface caused a transformation from an initial translational slide into the high-energy and widespread hillslope debris flow. We further created and validated a stand-alone model of the debris flow on a local scale achieving promising results. The model yields a 97% match to the observed runout area as well as to deposition spreads and heights. Thus, our study provides a pathway for analyzing hillslope debris flows triggered by torrential rainfall events in low mountain ranges. General knowledge on hillslope debris flows, risk assessment and hazard prevention were improved, and results can be transferred to other regions to improve risk assessment and hazard prevention.

1. Introduction

The devastating torrential rainfall event over western Central Europe in July 2021, among others entailing the catastrophic flood in the Ahr valley (Rheinland-Pfalz, Germany), also triggered various slope-related mass movements [1,2,3]. As such, numerous hillslope debris flows with a major hazard potential, occurred in this area [2]. According to [4], hillslope debris flows are defined as unconfined flows of unconsolidated granular soil material at steep slopes. They normally originate from shallow failures whereby the rainfall-induced water content and pore water pressure of the unconsolidated slope deposits critically increase due to infiltration and interflow processes. Although exact trigger mechanisms are still under debate and require validation case by case, the common estimation is that high infiltration rates and enhanced interflow results in a critical reduction in shear stress. In association with the loss of cohesion, granular soil material is then suddenly mobilized [5,6,7,8]. Following a liquefaction mechanism supplied by the immense pore water pressure and drag force of the surface runoff, the liquefied material can rapidly evolve into high-energy downhill flows, transporting suspended mud, gravel and wooden debris [9,10,11,12]. The exact location and extent of these phenomena are, however, difficult to predict, leading to insufficient protective measures and severe damage to the adjacent infrastructure in mountain ranges [4,13,14,15,16].
This study focuses on an event in the western Eifel region in Rheinland-Pfalz (near the village of Biersdorf), as an exemplary case of heavy rain-triggered hillslope debris flows in the low mountain range of western Germany.
Several hours of torrential rainfall during the evening from 14 to 15 July 2021 caused the Biersdorf hillslope debris flow producing a scar of about 6 m in depth and 15 m in width. The incipient muddy debris flow moved 150 m down the slope into a small valley, overflowing a fortunately abandoned house and the local road with depositing fan sediments up to 3 m thick (Figure 1).
In the transitional and depositional area, large grain size differences, ranging from fine granular soil material to large mobilized blocks and wooden material, occur. Based on the field traces and depositional characteristics, the investigated event could also be classified as a muddy debris avalanche [8]. The traces of the event are still visible today, indicating long-lasting effects on the slope morphology. Although abandoned, the property is uninhabitable and in danger of collapsing, and the road had to be secured, reflecting noticeable economic damage.
Investigations and descriptions of similar events in alpine terrain have already been carried out by a significant number of authors, e.g., [4,10,13,14,17,18]. These studies include, for example, empirical analyses, the determination of rainfall thresholds, numerical modelling and hazard assessment. Based on these studies, such events in the high mountain area are relatively well understood, but for the European low mountain ranges, these phenomena have not been intensively investigated so far, which is especially true for western Germany. In recent years, however, similar events have occurred with partly high damage to the infrastructure, which shows the need for intensified research on these phenomena in the low mountain range [19,20,21].
Here, we present an approach combining geomorphological, geophysical and remote sensing methods to investigate the composition of the shallow subsurface upslope of the fissure zone in order to identify the trigger mechanisms of the hillslope debris flow. In addition, we use detailed mapping of the local morphology, weather data and carried out field investigations to determine rheological parameters as a base for a simple debris flow runout and deposition simulation. Overall, the major objective of this study is to find a pathway for analyzing hillslope debris flows in the context of the geological and geomorphological conditions in low mountain ranges that favor the generation of such events. Furthermore, we test and validate a simple and fast modelling framework against the background of field observations. In doing so we aim to contribute to a better understanding of such events and to set up an approach allowing the identification of potential risk sites at an early stage in order to develop preventive measures for similar events in lower mountain ranges.

2. Regional Setting

The small village of Biersdorf is located in the western Eifel region (Rheinland-Pfalz, Germany). It is divided into two districts, one is located on the hillslope plateau and the second one in the Kannenbach stream valley (Figure 2E). The stream flows into a reservoir lake, which dams the river Prüm, the local erosional base for the Kannenbach stream. The area around Biersdorf consists of moderately steep hills under agricultural use and steep and deeply incised valleys. The geomorphological situation is typical of this region, characterized by valley deepening throughout the Quaternary [22]. The hillslope debris flow occurred on a steep (28% inclination in average), extensively used, south exposed slope that is located directly behind a few houses near the Kannenbach stream (Figure 2E). The study area contains the slope section with the associated catchment area upslope. Three pathways cross parallel to the slope in its upper third and mark anthropogenic impacts on the hillslope morphology (Figure 2E). Right underneath the second pathway, the initial scar edge is located.

2.1. Geological Situation

The geology around Biersdorf is dominated by Lower Triassic clay and sandstones as well as limestones, gently dipping southeast [25]. The hillslope debris flow itself is located on the stratigraphic boundary between the Upper Buntsandstein (upB), consisting mainly of heavily weathered fine grained red clay and sandstones in the west, and the Lower Muschelkalk (lowM), comprising light grey clays, marls and limestones in the east (Figure 2D). In the south of Biersdorf, the Middle and Upper Muschelkalk (midM, upM) follow concordantly. The geological map also shows a set of north–south striking normal faults in the study area [25]. A normal fault dipping towards the east is located right underneath the examined hillslope debris flow (Figure 2D) marking the boundary between the Upper Buntsandstein and Lower Muschelkalk. The boundary is also visible by distinct color changes in the field at the scarped edge (Figure 1A).

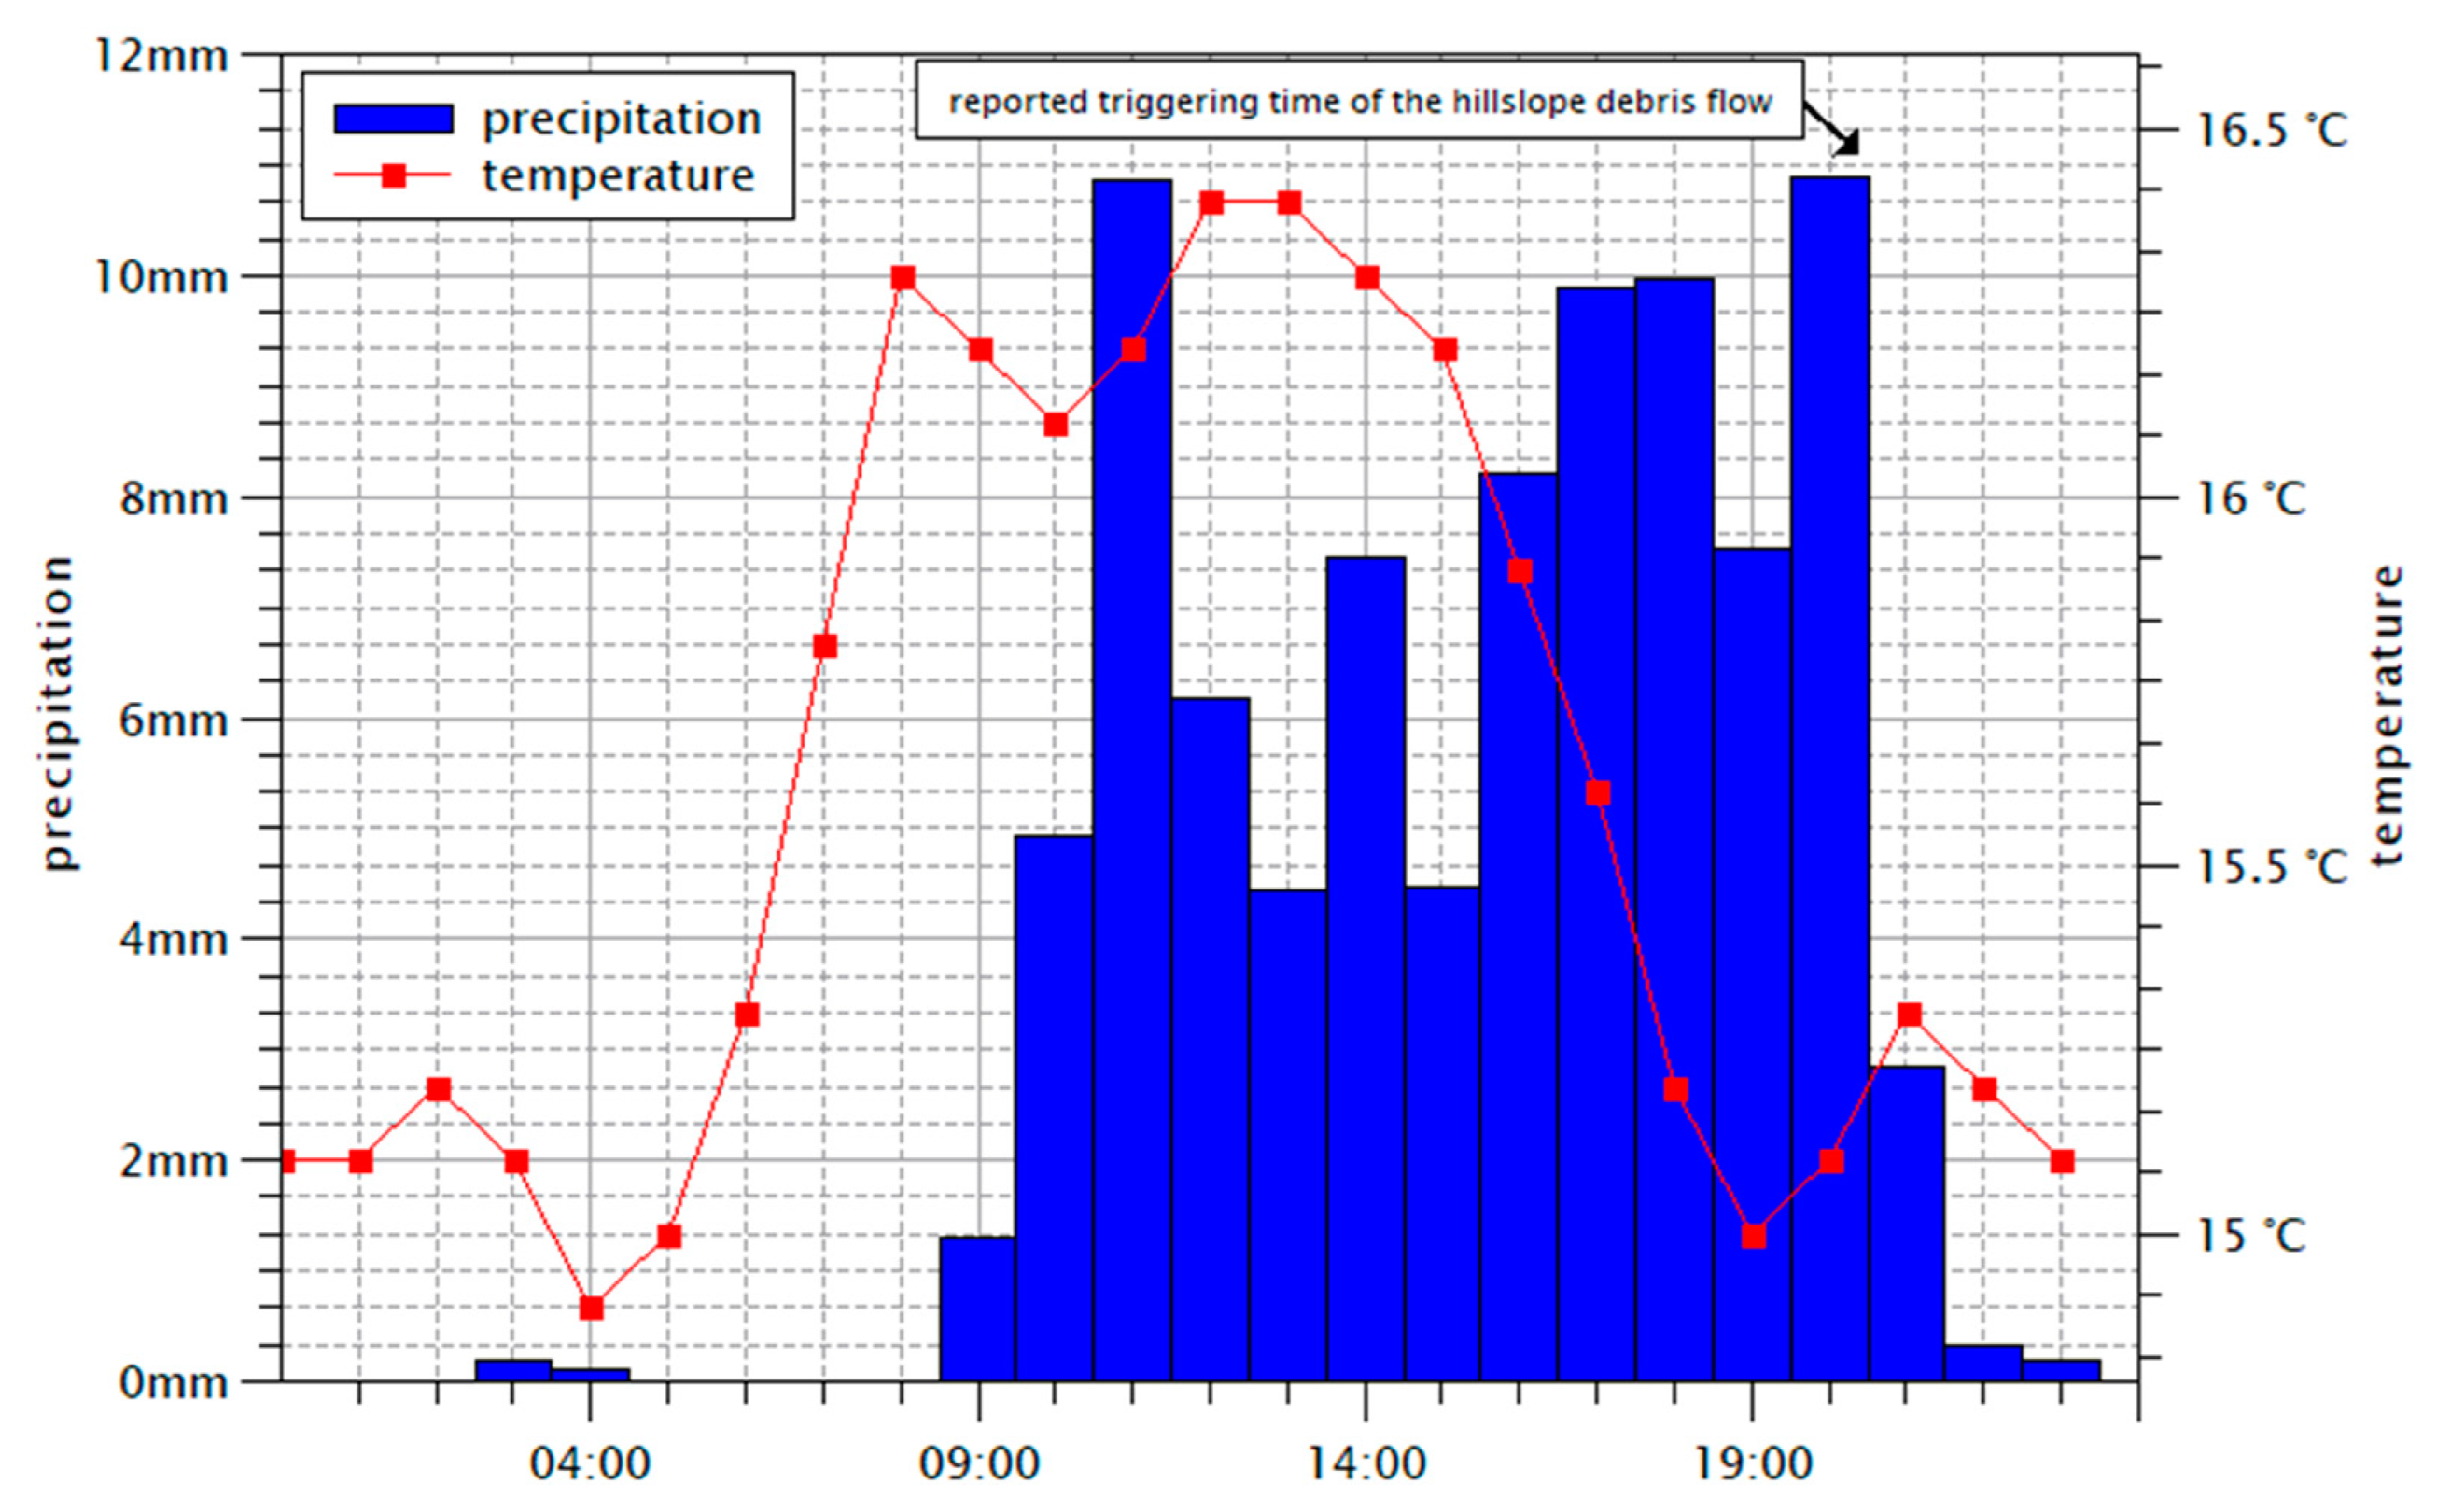
2.2. Weather Situation during 14 July 2021

Low air pressure dominated the weather conditions on the days from 12 to 14 July 2021 over central Europe. In association with a high-level depression slowly approaching from France, the tropospheric situation was stratified with increasing instability. Warm and very humid air masses reached western Germany from the Mediterranean region in a rotary motion around a distinctive low-pressure zone. Due to forced uplift (orographic and dynamic) and slight damming effects in the western low mountain ranges (e.g., Sauerland, Westerwald, Eifel, Ardennes), recurrent or persistent heavy rainfall first occurred regionally and later extensively [26]. On the 14 July, the focus of heavy rainfall extended in an area from southern Nordrhein-Westfalen to the southern Eifel region (Figure 2A) with more than 100 L/m2 precipitation. Regionally, more than 150 L/m2 was recorded in this period. The local weather station in Wiersdorf (approximately 4 km southwest of Biersdorf) recorded 90 L/m2 on that day, by far the highest value of the year and the highest daily precipitation value in the station’s 20-year history [27]. Figure 3 show the hourly precipitation distribution for the 14 July 2021.
Recurring precipitation events throughout Germany and in the Eifel region occurred over three weeks before 14 July, already saturating the soil in some regions [26]. According to the published saturation model of the German Weather Service (DWD), the soils around Biersdorf were already heavily pre-saturated by the failure day (Figure 2C) [28]. Further rainfall under these pre-conditions lead to a strong increase in pore water pressure and forced surface runoff [29,30].

3. Methods

In this study, we used a comprehensive geomorphological–geophysical approach in combination with UAV-generated photogrammetry and modelling to identify the specific trigger and runout mechanisms of the hillslope debris flow.

3.1. UAV Photogrammetry

In order to accurately measure the runout, scarp and deposits, and calculate the mass balance of the hillslope debris flow, we took 237 drone-supported (DJI Air 2) aerial photographs during 2 February 2022. These were photogrammetrically assembled using Agisoft Metashape (www.agisoft.com/features/professional-edition accessed on 4 January 2022). Following the approach described in [31], a local high-resolution digital terrain model with a spatial resolution of 20 cm was calculated and compared with an earlier ALS-generated DEM from 2018 (spatial resolution 20 cm) to determine the change in slope morphology over time.

3.2. Electrical Resitivity Tomography (ERT)

ERT measurements were conducted parallel with DP HPT logging in mid December 2021 to investigate the stratigraphic composition of the shallow subsurface using a multi-electrode device (Syscal R1 Plus Switch 48, Iris Instruments) and a Wenner-Schlumberger electrode array with 48 electrodes and 2 m spacing. This combination provided subsurface penetration to approx. 10 m depth. ERT inversion was carried out in 2D by applying Res2Dinv (Geotomo Software, [32]).

3.3. Direct Push Hydraulic Profiling Tool (DP HPT)

Direct Push techniques were applied to collect stratigraphic data with a resolution of 2 cm using a Geoprobe K6050 HPT probe in combination with a Geoprobe 540 MT system mounted on a Nordmeyer drill rig (RS 0/2.3). The probe is equipped with a small screened injection port where water is pumped into the sediment through a trunk line by an HPT controller module with a constant flow rate into the sediment. The hydraulic pressure (HP), which is mostly influenced by grain size and bulk density, is measured by a downhole pressure transducer (www.geoprobe.com/HPT accessed on 4 January 2022). High permeable sediments are thus characterised by low values of hydraulic pressure and vice versa. In addition to hydraulic screening, the probe is equipped with four electrodes in a linear arrangement where electrical conductivity (EC) is measured at 2 cm intervals using a Wenner electrode array [33,34,35]. EC values are not only dependent on grain sizes but also on the chemical composition of the pore water and the ionic contaminants. Thus, a combination of both parameters helps to overcome ambiguities of the logging results [35]. During prospection, all the logging data are transferred to the FI6000 data acquisition instrument in real-time and are displayed in the Direct Image Acquisition software (www.geoprobe.com/software accessed on 4 January 2022).

3.4. Sediment Coring

Sediment coring was conducted at the beginning of February 2022. Cores were retrieved in order to calibrate ERT and DP HPT measurements and to gain detailed stratigraphic information. Three sediment cores (BIE 1, 2, 3) were drilled at the DP HPT logs using open auger heads (80, 60 and 50 mm diameter) in combination with a handheld percussion hammer (type Atlas Copco Cobra MK 1) (Figure 2F; 5). After cleaning and photo documentation, cores were described according to macroscopic sedimentary and pedogenic features following the FAO guidelines for soil description [36]. The position and elevation of each electrode, DP HPT log and coring site were determined using a Topcon HiPer Pro DGPS device (handheld type FC-250).

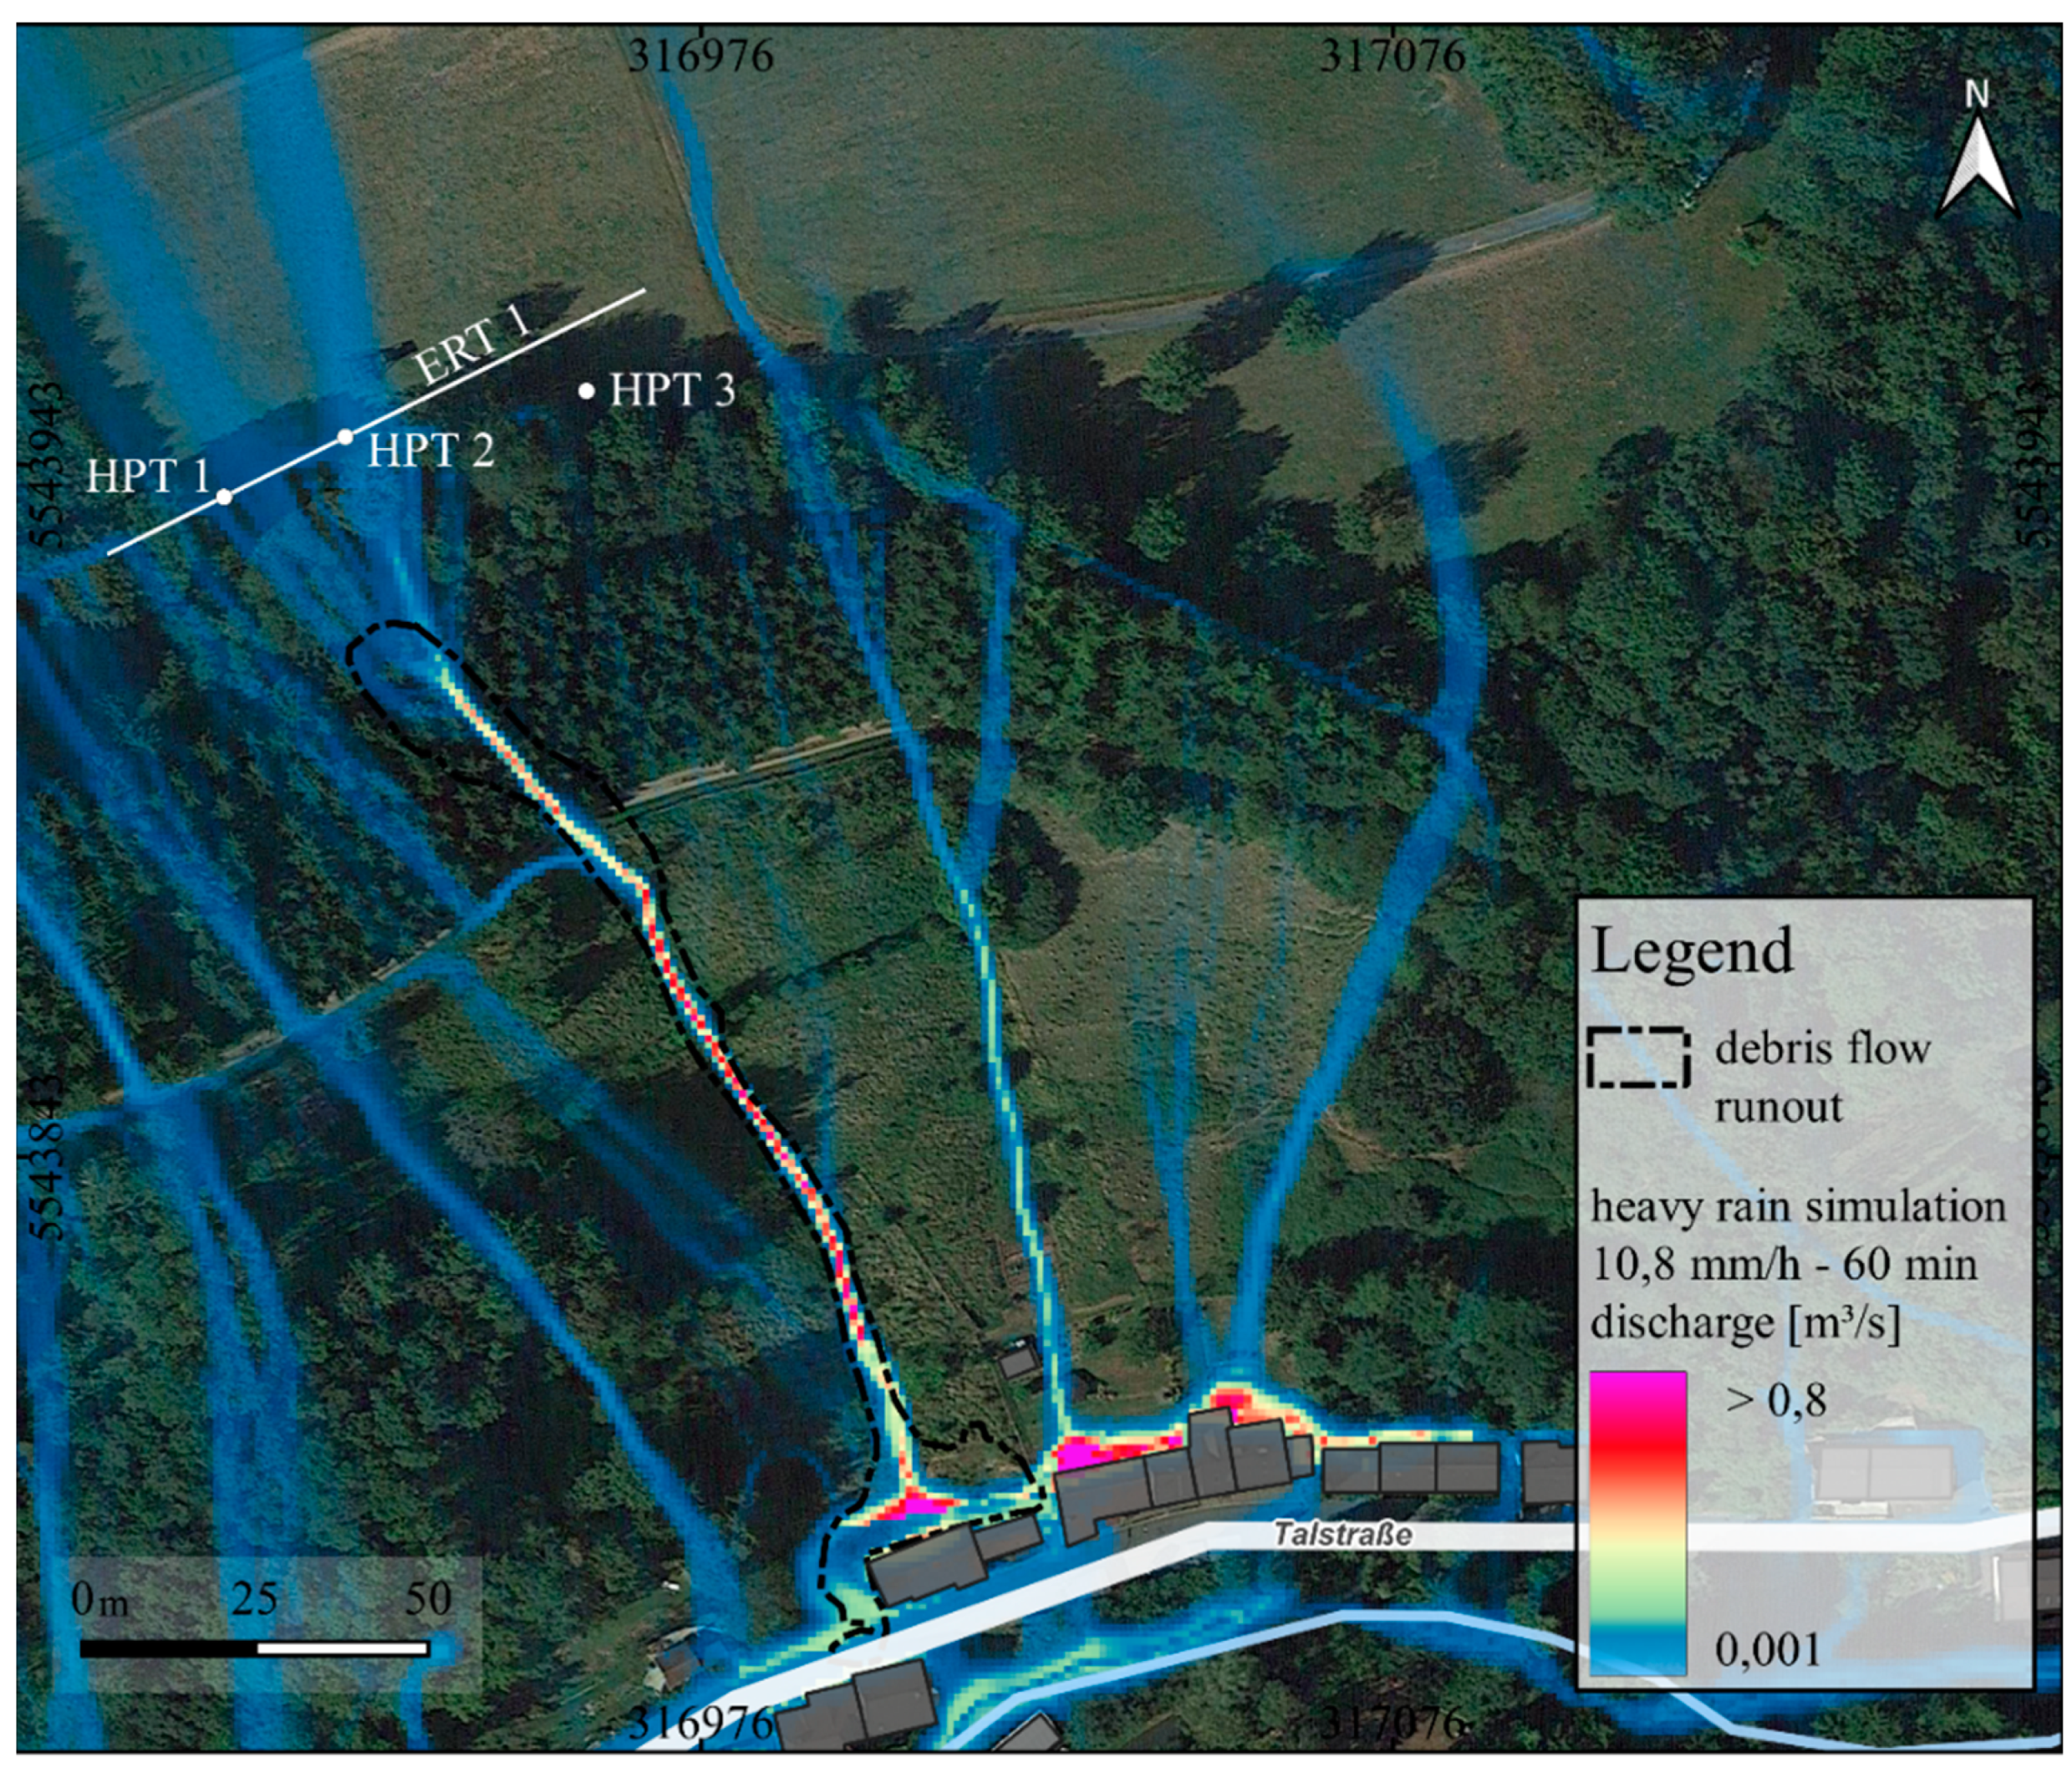
3.5. Surface Runoff Simulation

We calculated a local surface runoff model for the precipitation event using the r.sim.water module included in GrassGis (www.grass.osgeo.org accessed on 4 January 2022, [37]). The base for the simulation was a 1 × 1 m LiDAR-DEM from 2018 and local data from the weather station of Wiersdorf (cf. Figure 3, [27]). For the calculations, the bivariate form of Saint Venant equations describes a 2D shallow water flow. The numerical solution is based on the concept of duality between the field and particle representation and solved via Green’s function Monte Carlo method, which provided the robustness necessary for spatially variable conditions and high resolutions. The detailed mathematical functionality of the framework can be found in [38,39]. The influence of surface runoff associated with the hillslope debris flow is investigated by modelling the peak discharge of the last hour before the event was triggered. By implementing the rainfall excess rate (precipitation-infiltration) of the last hour before the reported trigger of the event and the land use-based spatially distributed surface roughness, the simulation results can provide information about the hydrological conditions during the failure period in the catchment area. Normally, the infiltration rate can be estimated using constant saturated hydraulic conductivity rates [39]. In this extreme case, however, we assume that the soil was strongly oversaturated due to the described pre-saturation, 10 h of heavy precipitation before the event was triggered, and in combination with siltation processes of the loamy soil. Therefore, we used a low infiltration rate in the catchment area (Table 1).

3.6. Debris Flow Runout Simulation

We created an initial stand-alone model of the observed debris flow that was subsequently validated in the field in order to estimate the potential of hazard modelling at local scale. Simplified numerical modelling of runout, velocity and deposition dynamics was performed using the optimized random walk-based, two-parameter friction model (PCM) integrated in the open source Gravitational Process Path (GPP) framework in SAGA GIS (https://saga-gis.sourceforge.io/, accessed on 4 January 2022 [41]). The detailed mathematical functionality of the framework can be found in [42,43]. The random walk spreading parameters were set as suggested by [42]. To pinpoint the required initial source areas, the hillslope debris flow disposition index (HDI) approach [44] was calculated. The thickness of the mobilized unconsolidated material was derived from the UAV-generated mass balance and spatially integrated into the model. The two parameters, which primarily control the velocity and runout behaviour, the mass to drag ratio m/d (internal friction) and the sliding friction coefficient μ (basal friction), usually have to be calibrated to model specific flow events [42,43,45,46]. We approximated the values for the Biersdorf hillslope debris flow based on own field investigations by means of analysing the flow length, mass balance, significant shifts in grain size in the scar and transition track, and optimized it by soil data provided by the Geological Survey of Rheinland-Pfalz (LGB, [40]) and the approach presented by [43], to reach the best fitting model composition (Table 2).

4. Results

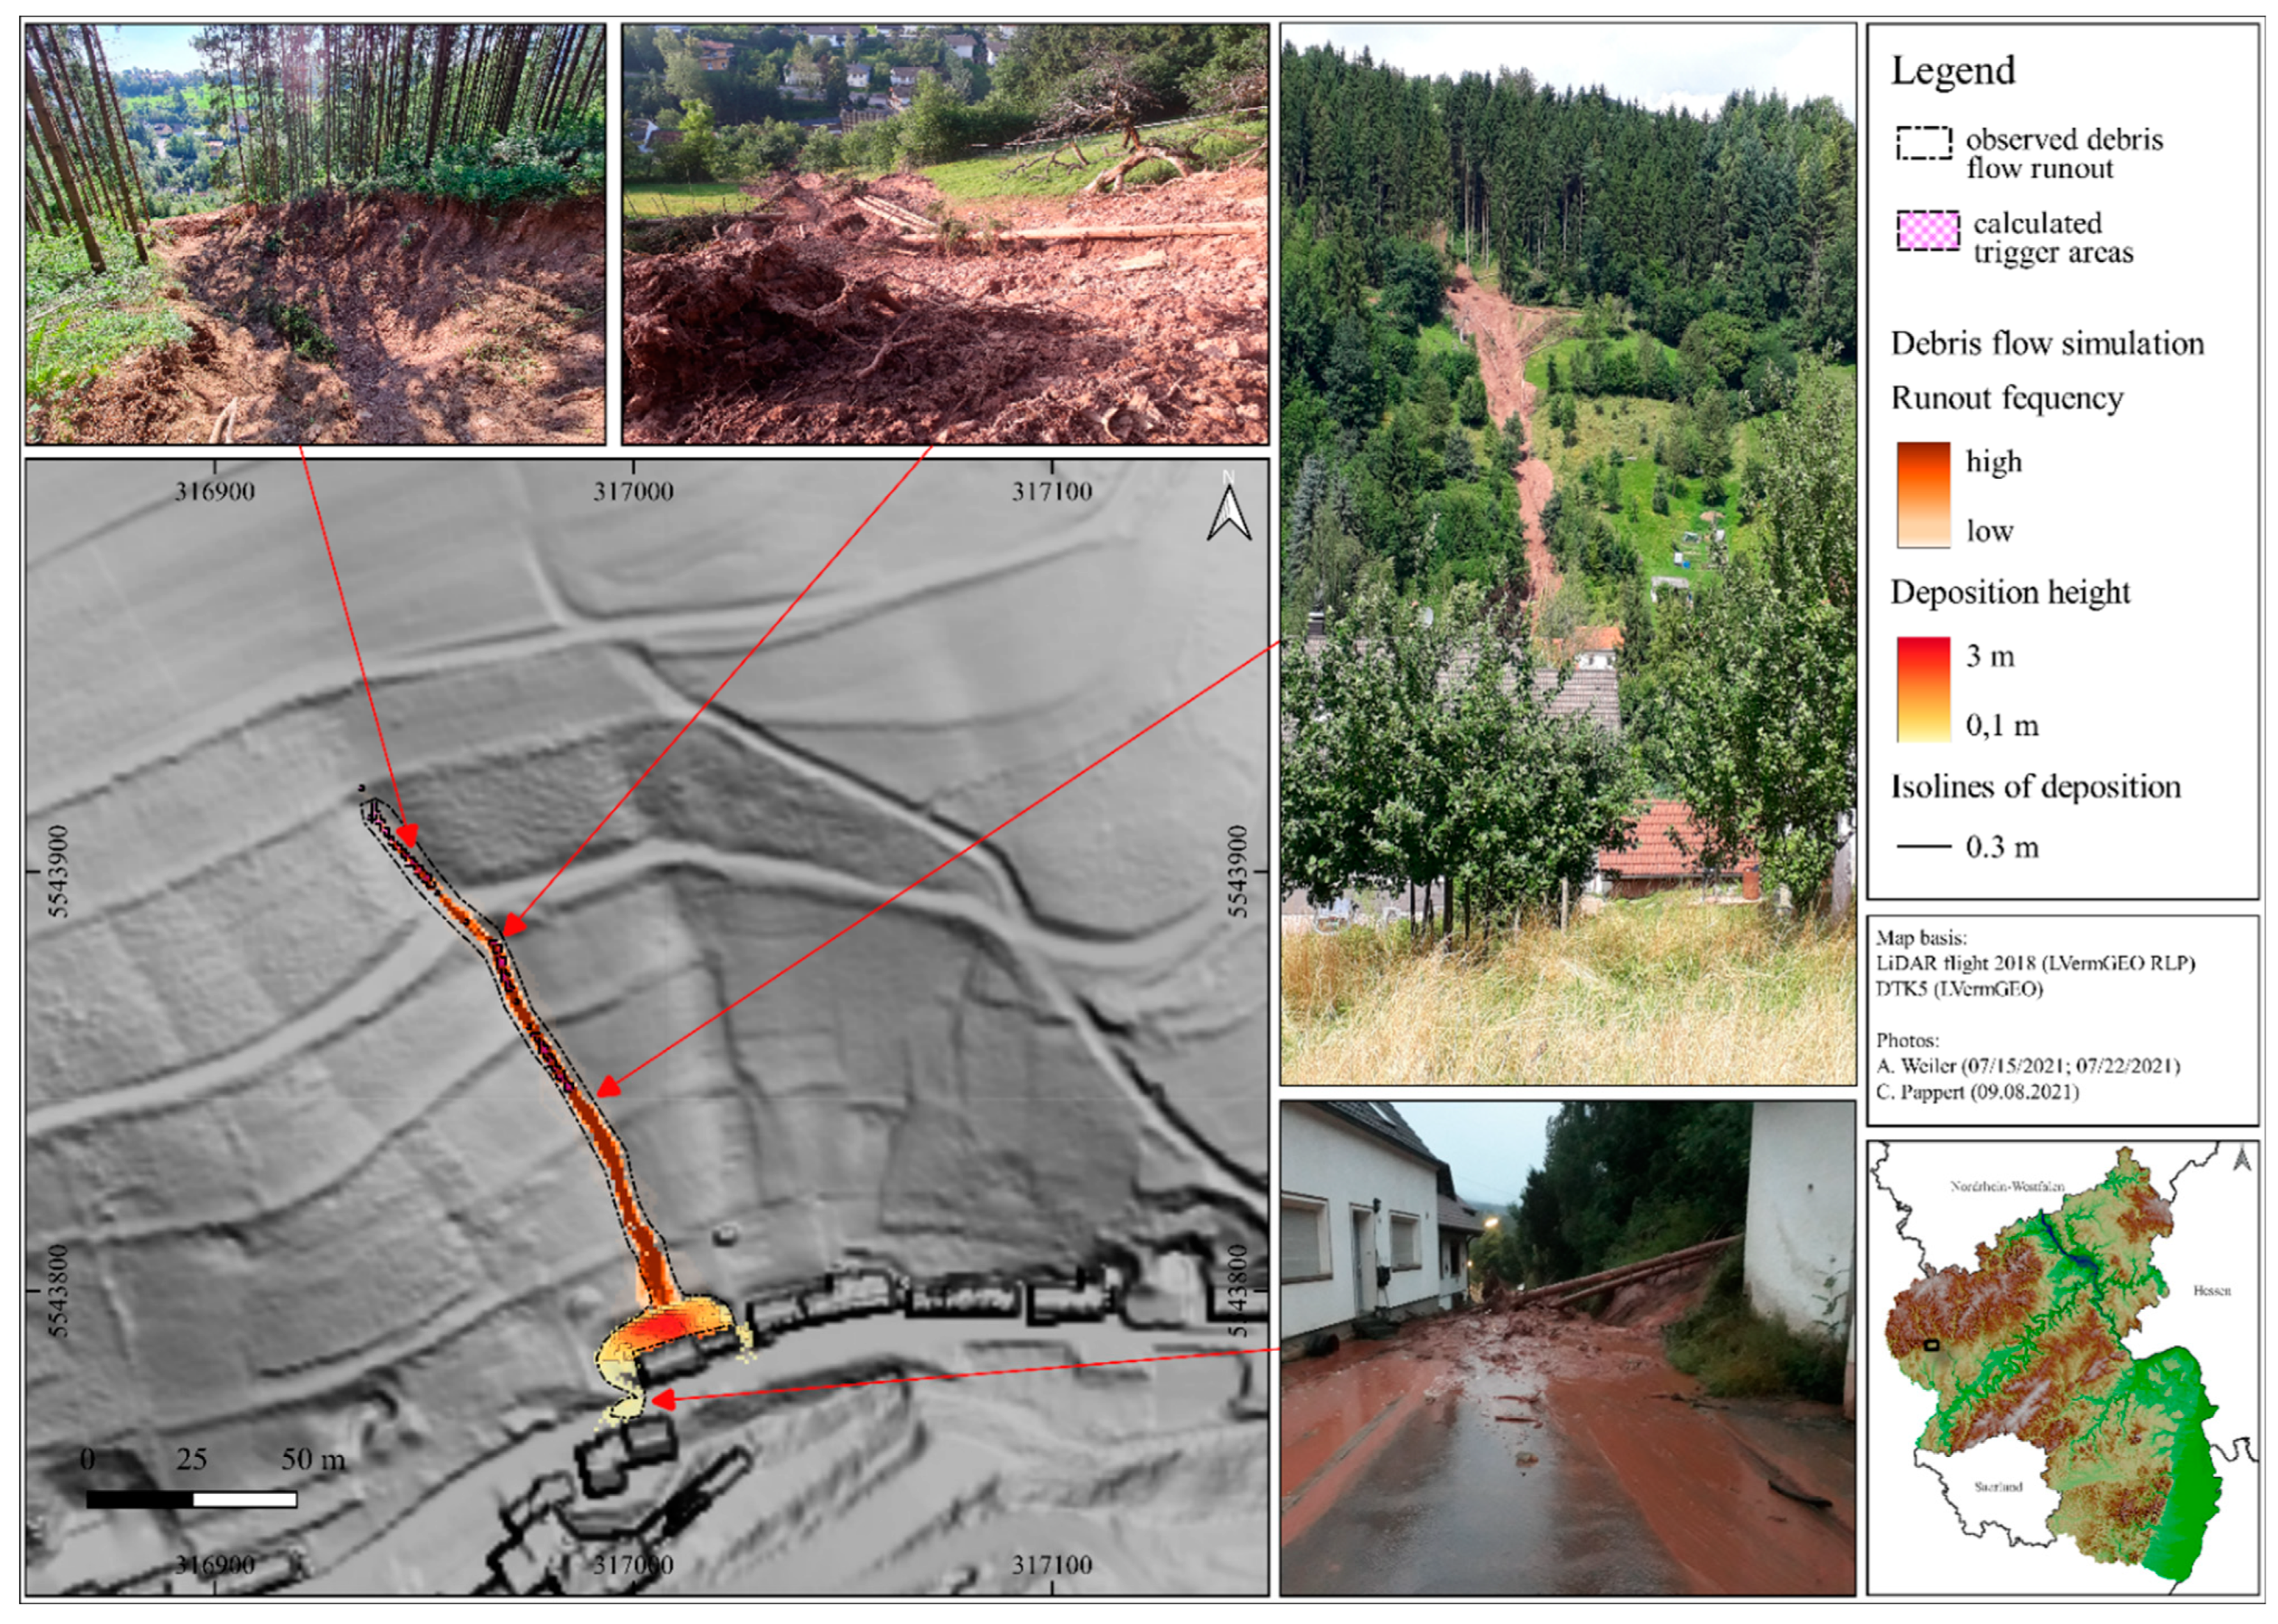
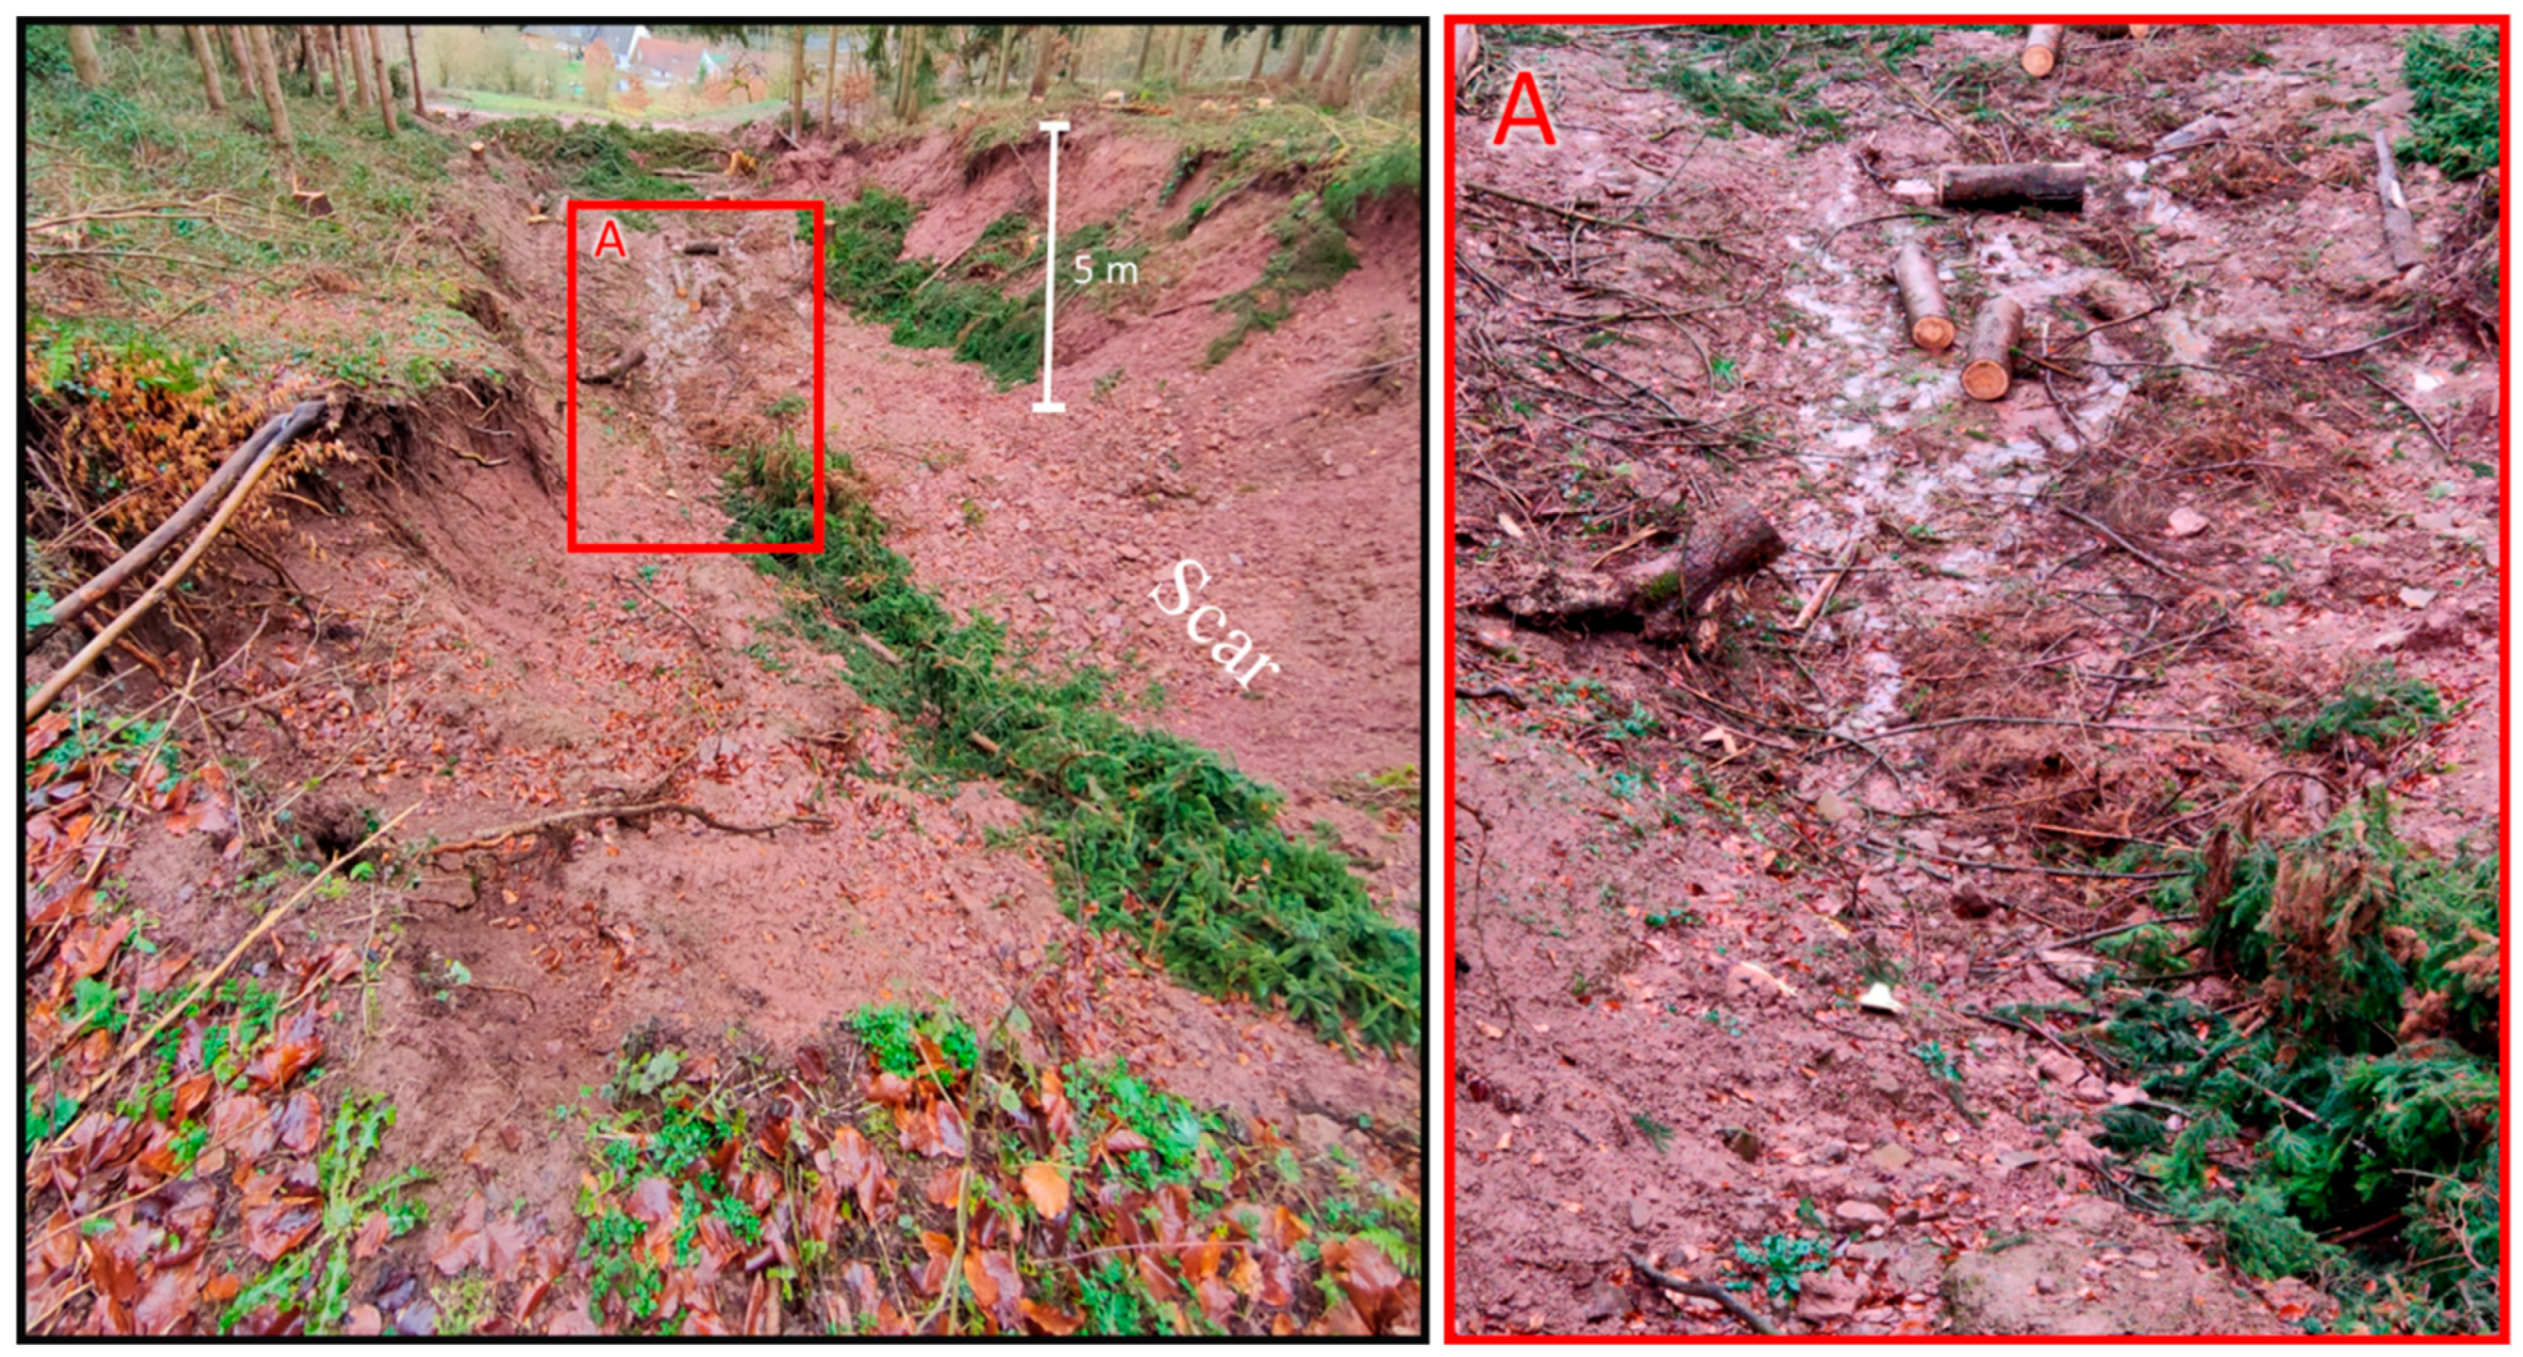
4.1. Photogrammetry and Mass Balance

The photogrammetrically calculated model of the hillslope debris flow is shown in Figure 3. The model allows measuring the precise runout and displaced masses (Figure 4b). Since photogrammetrically-created DEM cannot be effectively filtered for vegetation, densely vegetated areas were discarded in order to solely compare real ground points (Figure 4a; vegetation marked in grey). Security measures and clean-up work were carried out at various locations compared to the in situ photos immediately taken after the debris flow (Figure 1). Nevertheless, the fissure, runout and deposits were mostly unaltered and are clearly recognizable in the model, showing a lasting effect on slope morphology.
The total length of the hillslope debris flow from the initiation point to the outermost deposition layer is 184 m. The resulting scar in the initiation area is 15 m wide on average with a maximum depth of 6 m. This widely exceeds the assumed depth for unconsolidated parent material (or sediment cover) at this location. Such underestimated sediment covers are a typical feature that was observed to be associated with numerous mass movements triggered by the torrential rainfall event of 14 July 2021 in the Eifel region [2].
Based on a comparison with the airborne LiDAR Survey (ALS) from 2018, we can show that approximately 1350 m3 of material moved downslope in the scar. In order to stabilize the forest path, an earth wall with a height of 2.50 m was built at the end of the scar, partially using debris flow material. Below the path, material was re-dumped into the erosion channel on an area of 87 m2.
The runout track is 130 m long with a maximum incision of 1.5 m (Figure 4C; cf Figure 1B). For an event of this magnitude, this incision throughout the runout track is relatively low and could be attributed to a moderate flow velocity. The deposition area behind the affected house is 238 m2 in size. In the course of shoring works, it was leveled up to 2 m above the original ground surface. In total, the mass balance of the whole debris flow runout suggests that 1090 m3 of material was relocated during the event, including post-event anthropogenic measures.

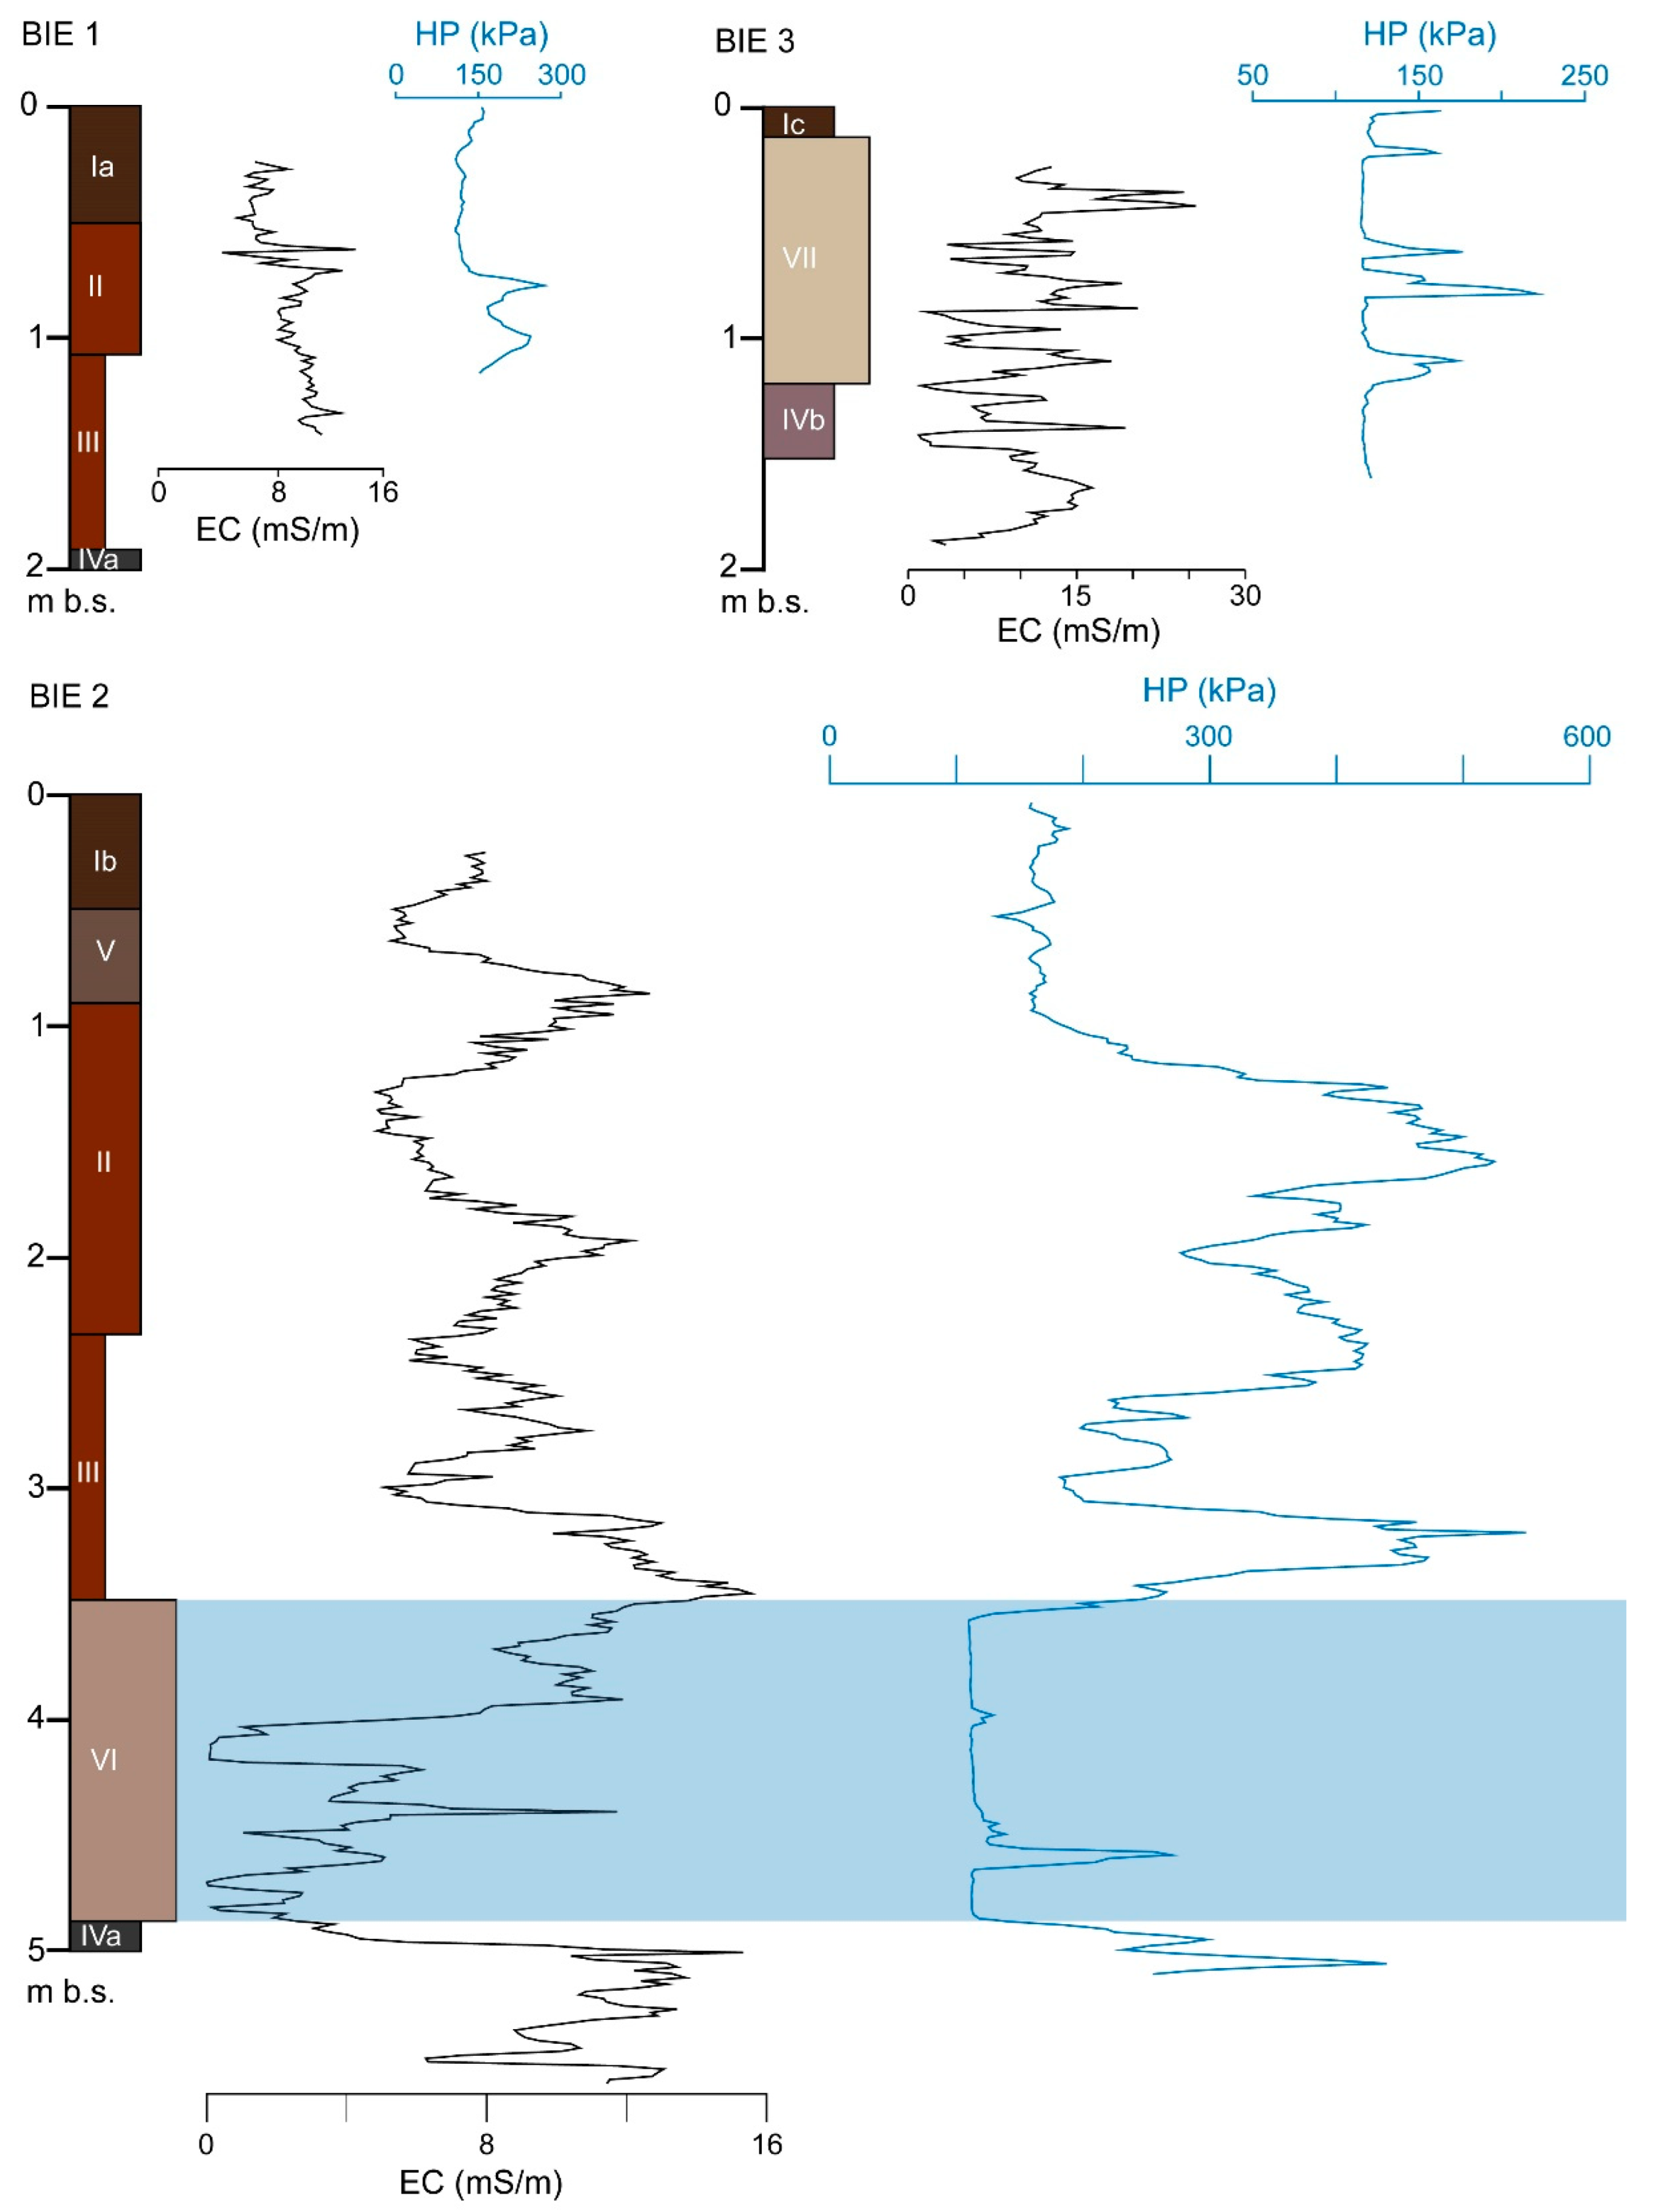
4.2. Results of Combined ERT, DP HPT and Sediment Coring

To gain detailed information on the stratigraphic composition of the shallow subsurface, we conducted ERT measurements followed by DP HPT logging. To finally calibrate the geophysical and DP results and to receive stratigraphical sequences, we retrieved sediment cores at the DP positions. ERT transect BIE ERT 1 (Figure 5) was conducted 25 m above the scar of the hillslope debris flow on a total length of 94 m in a southwest–northeast direction. Overall, apparent resistivity values range from 18 to 364 ohm.m. The inversion model shows a tripartite structure. The first part ranges from 0 to c. 40 m with high resistivities at the top followed by generally lower values and a further high resistivity unit below log location BIE HPT 1. A second part is visible until 64 m, characterised by higher values reaching the greatest thickness at DP site BIE HPT 2, intercalated by a unit of significantly lower resistivity emerging upward towards the northeast. The third part from 64 m until the end of the transect is characterised by high resistivities at the top followed by low values towards the base.
All the DP HPT logs and sediment cores were drilled as deep as possible (Figure 6 and Figure 7). Overall, 10 sediment units (SU) were described (Table 3). All cores show colluvial and/or periglacial slope deposits of different characteristics below the topsoil and above strongly weathered bedrock material. While reworked and weathered clay and sandstones dominate BIE 1 and BIE 2, BIE 3 contains reworked and weathered limestone material.
DP log BIE HPT 1 is characterised by very low EC values in SU Ia and II, which slightly increase towards SU III. The weathered bedrock of SU IVa, which we reached by sediment coring, could not be penetrated with the HPT probe. HPT values show a distinct increase from SU II to SU III. In BIE HPT 2 and BIE 2 we reached the greatest depth with 5.58 m and 5.00 m, respectively. Both EC and HPT data trace coarser or more porous layers in the sedimentary sequence by low EC and low HPT values. The most significant decrease in EC occurs in SU VI, which is accompanied by the lowest HPT values of all three DP HPT logs. In sediment core BIE 2, SU VI is characterised by a dominance of sand and sandstone debris in a silty matrix. Towards the base, EC and HPT increase again. Compared to BIE HPT 1 and BIE HPT 2, BIE HPT 3 shows significantly differing characteristics. EC values show intensive fluctuations between 0 and 30 mS/min; HPT values are constantly low apart from some clayey layers in SU VII.

4.3. Simulation Results and Field Evidence

The modelled hillslope debris flow runout and deposition behavior are shown in Figure 8. We use photos taken by local residents immediately after the event and our terrain surveys as reference to compare the simulation results with real conditions. The initial source areas in the upslope position, determined by the hillslope debris flow disposition index, represent plausible locations with nearly identical dimensions compared to the actual scar. For the modelling framework we estimated the mass to drag ratio (m/d) based on a combination of field observations. We integrated the relatively large mobilized mass (~1350 m3) calculated by the mass balance of the DEM difference, the high amount of fine material as observed in the scar and, based on stratigraphical evidence derived from sediment coring, the relatively low incision rate in the runout track as an indication of a moderate flow rate as well as the measured flow length. The sliding friction coefficient μ is highly dependent on the land cover, and therefore we used spatially distributed friction values based on the land cover type in comparison with the literature values [42,43,45,46]. The downstream flow calculated from these input parameters (c.f. Table 2) is largely consistent with the real runout behavior (Figure 8).
The accordance between the generated model and the observed runout is about 97%. In agreement with the real event, the model shows moderate erosion along the slope and high deposition rates (up to 3 m, anthropogenically leveled after the event) at the foot slope, where the house functions as a barrier. In addition, the accumulation of material on the road coincides with the real event as documented (Figure 8).

5. Discussion

5.1. Debris Flow Trigger Mechanism

ERT measurements in combination with DP HPT logging and sediment coring have provided detailed insights of subsurface structures upslope of the fissure zone. We assume that the potential interflow lens at a 3 m depth below the surface that is characterized by significantly low resistivity values (Figure 5, lower) plays a crucial role for the trigger mechanism of the event. At a comparable depth, DP log BIE HPT 2 shows the lowest HPT values of all the logs, indicating high permeability in sand-dominated SU VI (blue shading in Figure 6) framed by significantly higher pressure values, indicating dense, clayey (impermeable) periglacial slope deposits (base of SU III) and weathered bedrock (SU IVa), respectively. In addition, slope deposits reach their greatest thickness of 4.9 m within the investigated transect. In comparison to DP log BIE HPT 1, where permeability significantly decreases in 0.8 m b.s., DP log BIE HPT 3 shows an overall higher permeability related to lose limestone debris in SU VII. These observations are in accordance with reports from the late evening of 14 July by local residents who observed disappearing water masses in the field upslope to the northeast of the scar and a concentration of surface runoff in the depth line where site BIE HPT 2/BIE 2 is located. In addition, during sediment coring in February 2022, we observed continuous water discharge within the scar at a depth that corresponds to the position of the assumed interflow (Figure 9).
The described phenomena of different permeability and surface runoff are directly connected to the normal fault, separating the Lower Muschelkalk in the east from the Upper Buntsandstein in the west, which is also indicated in ERT transect BIE ERT 1 (cf. Figure 5). The hillslope debris flow was triggered exactly in the position of the normal fault. One may assume that the material in this tectonic position was already characterized by less stability.
Overall, we hypothesize that the strongly increased pore water pressure and the enhanced interflow during the tremendous rainfall event led to a severe loss of cohesiveness and, finally, to a sudden movement of the substrate as an initial landslide movement with the sliding surface below the interflow layer. In addition, strong surface runoff with the associated drag force further liquefied and mobilized the initial landslide mass, accelerating the downslope movement. The surface runoff modelled with r.sim.water is shown in Figure 10, indicating that the largest amount of surface runoff was concentrated in the depth line prior to the mass movement. To sum up, all factors lead to a development from an initial translational slide into the high-energy and widespread hillslope debris flow.
As well as the described potential trigger mechanisms, one has to assume that the forest path just upslope of the scar also played an important role (Figure 2e). Compaction in the course of such infrastructural measures reduces the infiltration capacities and rates. In addition, the morphological change between the path and slope leads to the formation of an artificial convex embankment in a downslope direction. The risk of hillslope debris flows increases if the surface runoff concentrates on these embankments with significantly steep artificial slopes [49].

5.2. Modelling Hazard Potential and Transferability

The proposed modeling concept based on source zone identification and runout calculation is a common and valuable approach for predicting the hazard of debris flow prediction [10,13,14,43,50]. The plain open source approach presented here yields promising results simulating the hillslope debris flow in Biersdorf at a local scale (Figure 7). The modelling results yield a 97% match to the observed runout area as well as true-to-life deposition spreads and heights. The required input parameters were determined using open sources in combination with geophysical measurements and UAV-generated photogrammetry. This allows for the quick (one to two days of fieldwork) and accurate acquisition of subsurface and morphometric slope composition. Our model correctly identified the sliding area along the slope, while correctly disregarding the numerous others in the area as possible source and hazard zones. This is probably due to the accuracy of the surface runoff simulations and the corresponding identification of the initial debris flow starting points. The simulation of the runout and deposition behavior by the GPP enables simple and fast modeling for different scenarios. The consistent modelling results are strongly related to the high resolution of the input DEM. The success of the deposition modeling also depends on the appropriate determination of the initial thickness of the unconsolidated material incorporated into the mass movement.
In general, the transferability of hazard models from local to regional spatial scales is of great importance. In this context, [43] presented promising results for regional modeling in higher mountain ranges by optimizing the model parameters and estimation of the input data of the GPP. We have already partially included the optimized sliding friction and the mass to drag ratio, and their effect for the local modelling behavior is visible in the realistic results (cf. Figure 8). Overall, we are striving to implement our approach at the regional scale for further cases in the Central European low mountain ranges.

6. Conclusions

The torrential rainfall event of 14 July 2021 did not only lead to the devastating floods of several western Central European rivers but also to hundreds of mass movements in the low mountain range. Here, we investigated one of such mass movements, the Biersdorf hillslope debris flow, using a multi-methodological approach combining remote sensing with geophysical measurements, DP techniques and sediment coring. We examined the geomorphological slope structure and the composition of the shallow subsurface around the fissure zone in detail to determine the specific triggering mechanism.
Based on the photogrammetric model, we quantified geomorphological changes and the mass balance of the hillslope debris flow. Along with the geophysical measurements in combination with DP HPT logging and sediment coring, the following main conclusions can be drawn:
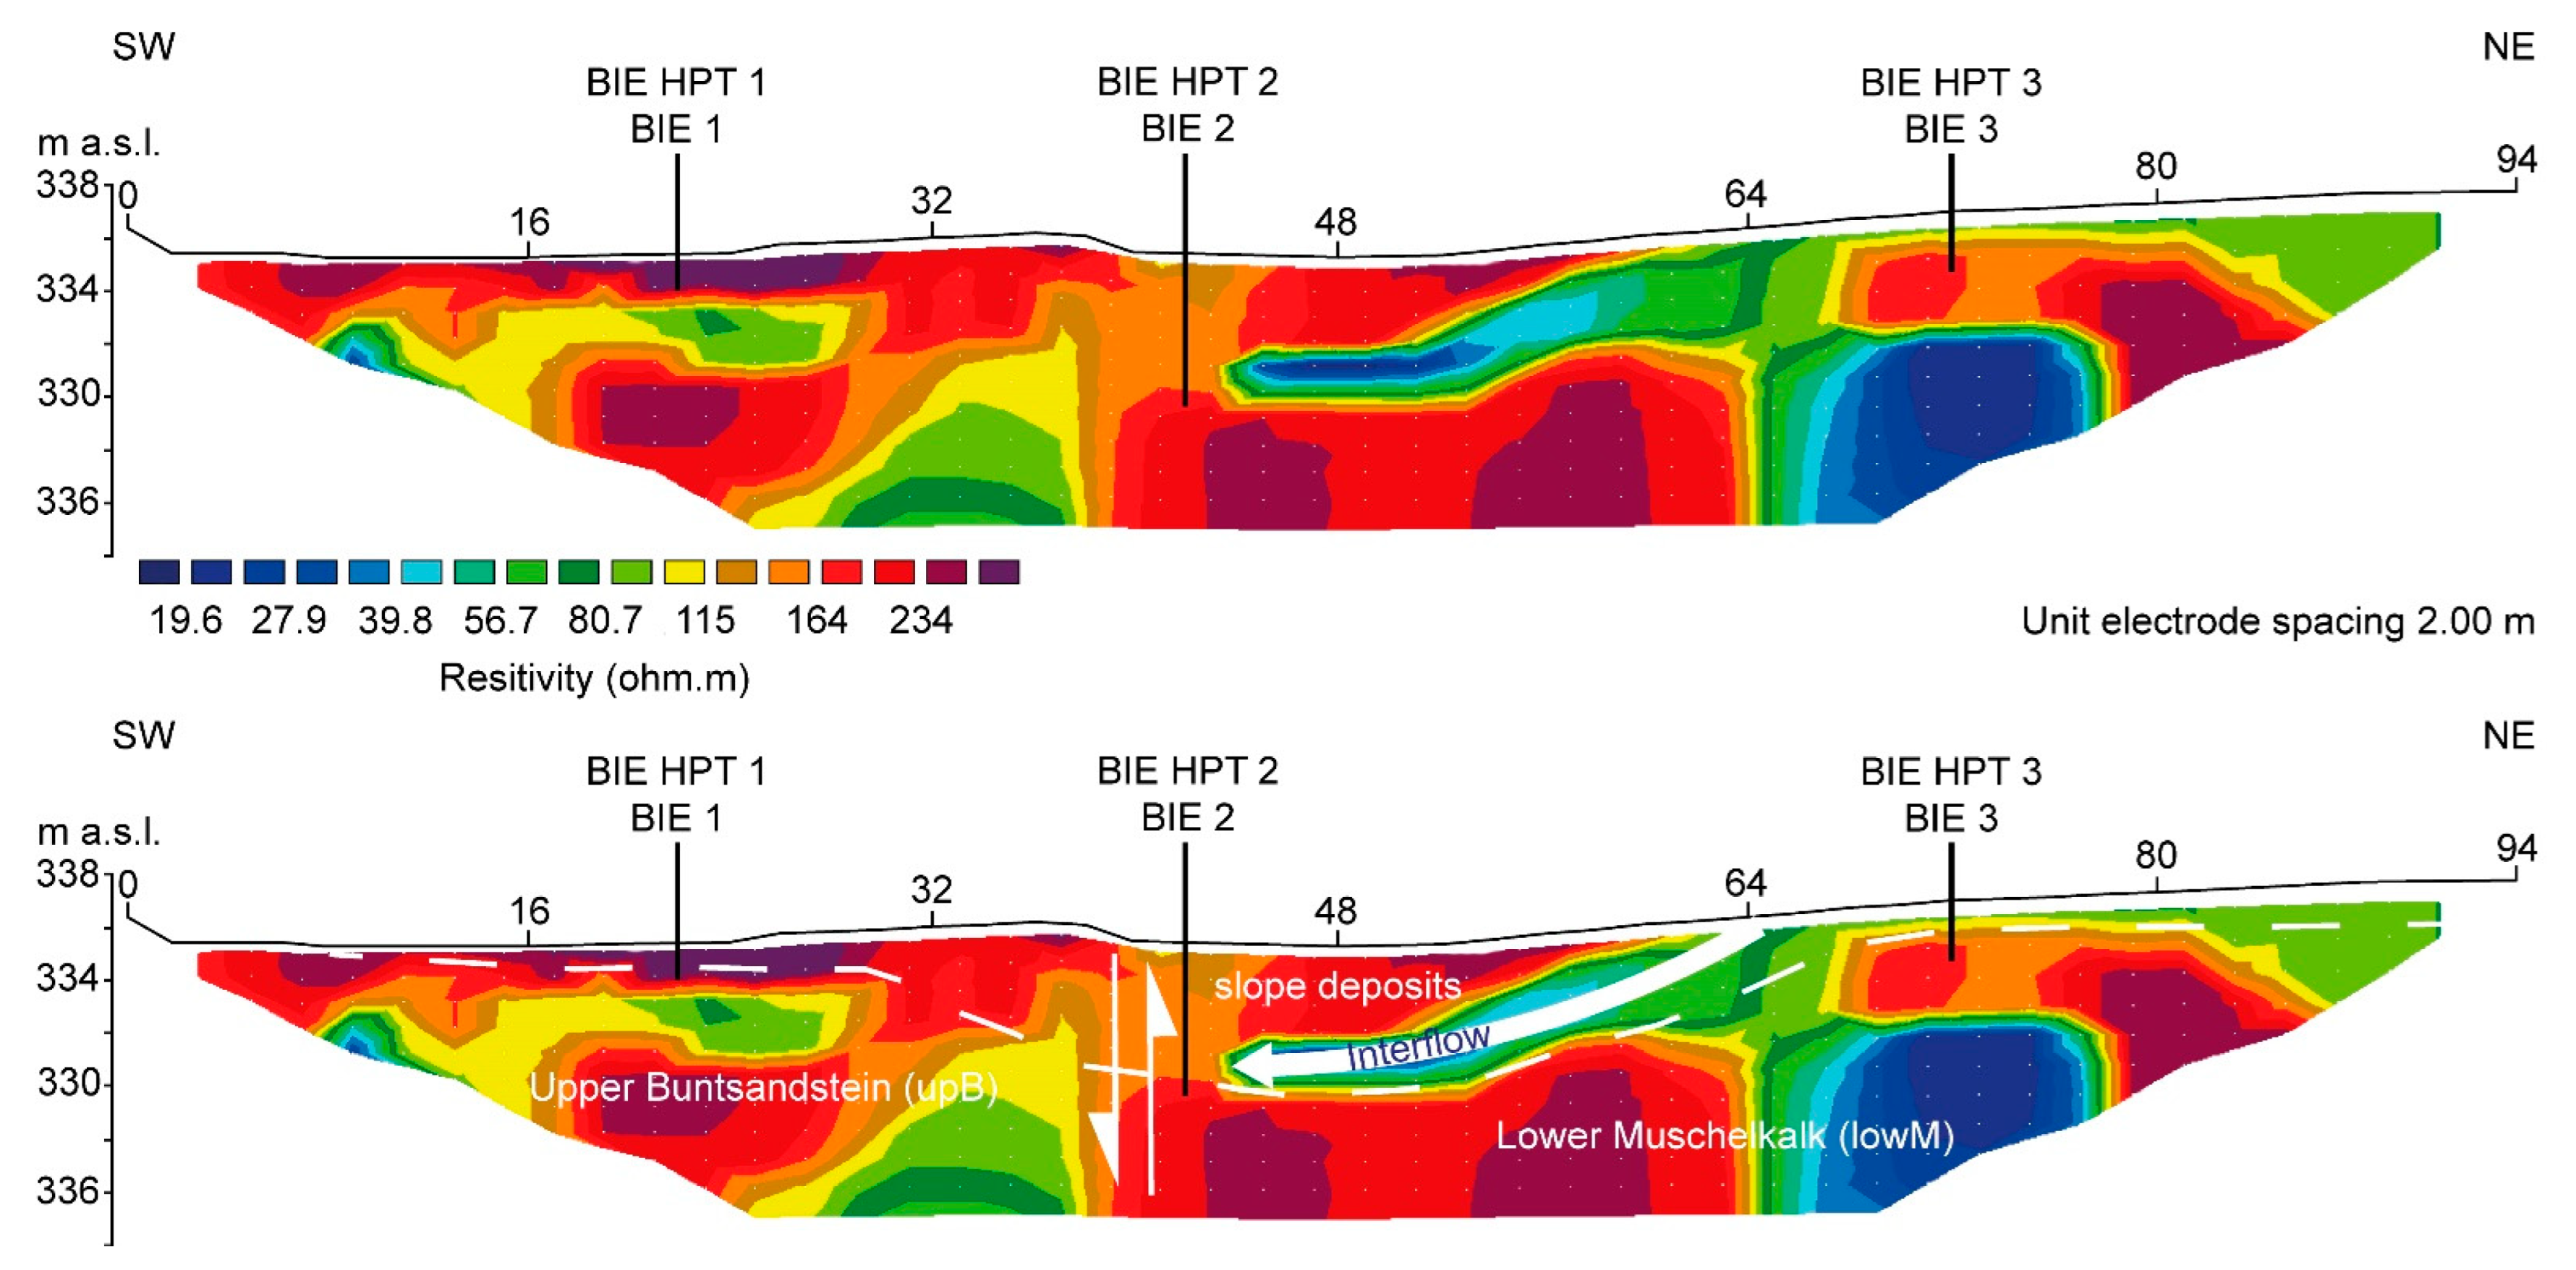
  • The Biersdorf hillslope debris flow was generated in the area of a normal fault separating the Upper Buntsandstein in the west from the Lower Muschelkalk in the east.
  • Unconsolidated slope deposits reach their greatest thickness above the fault zone.
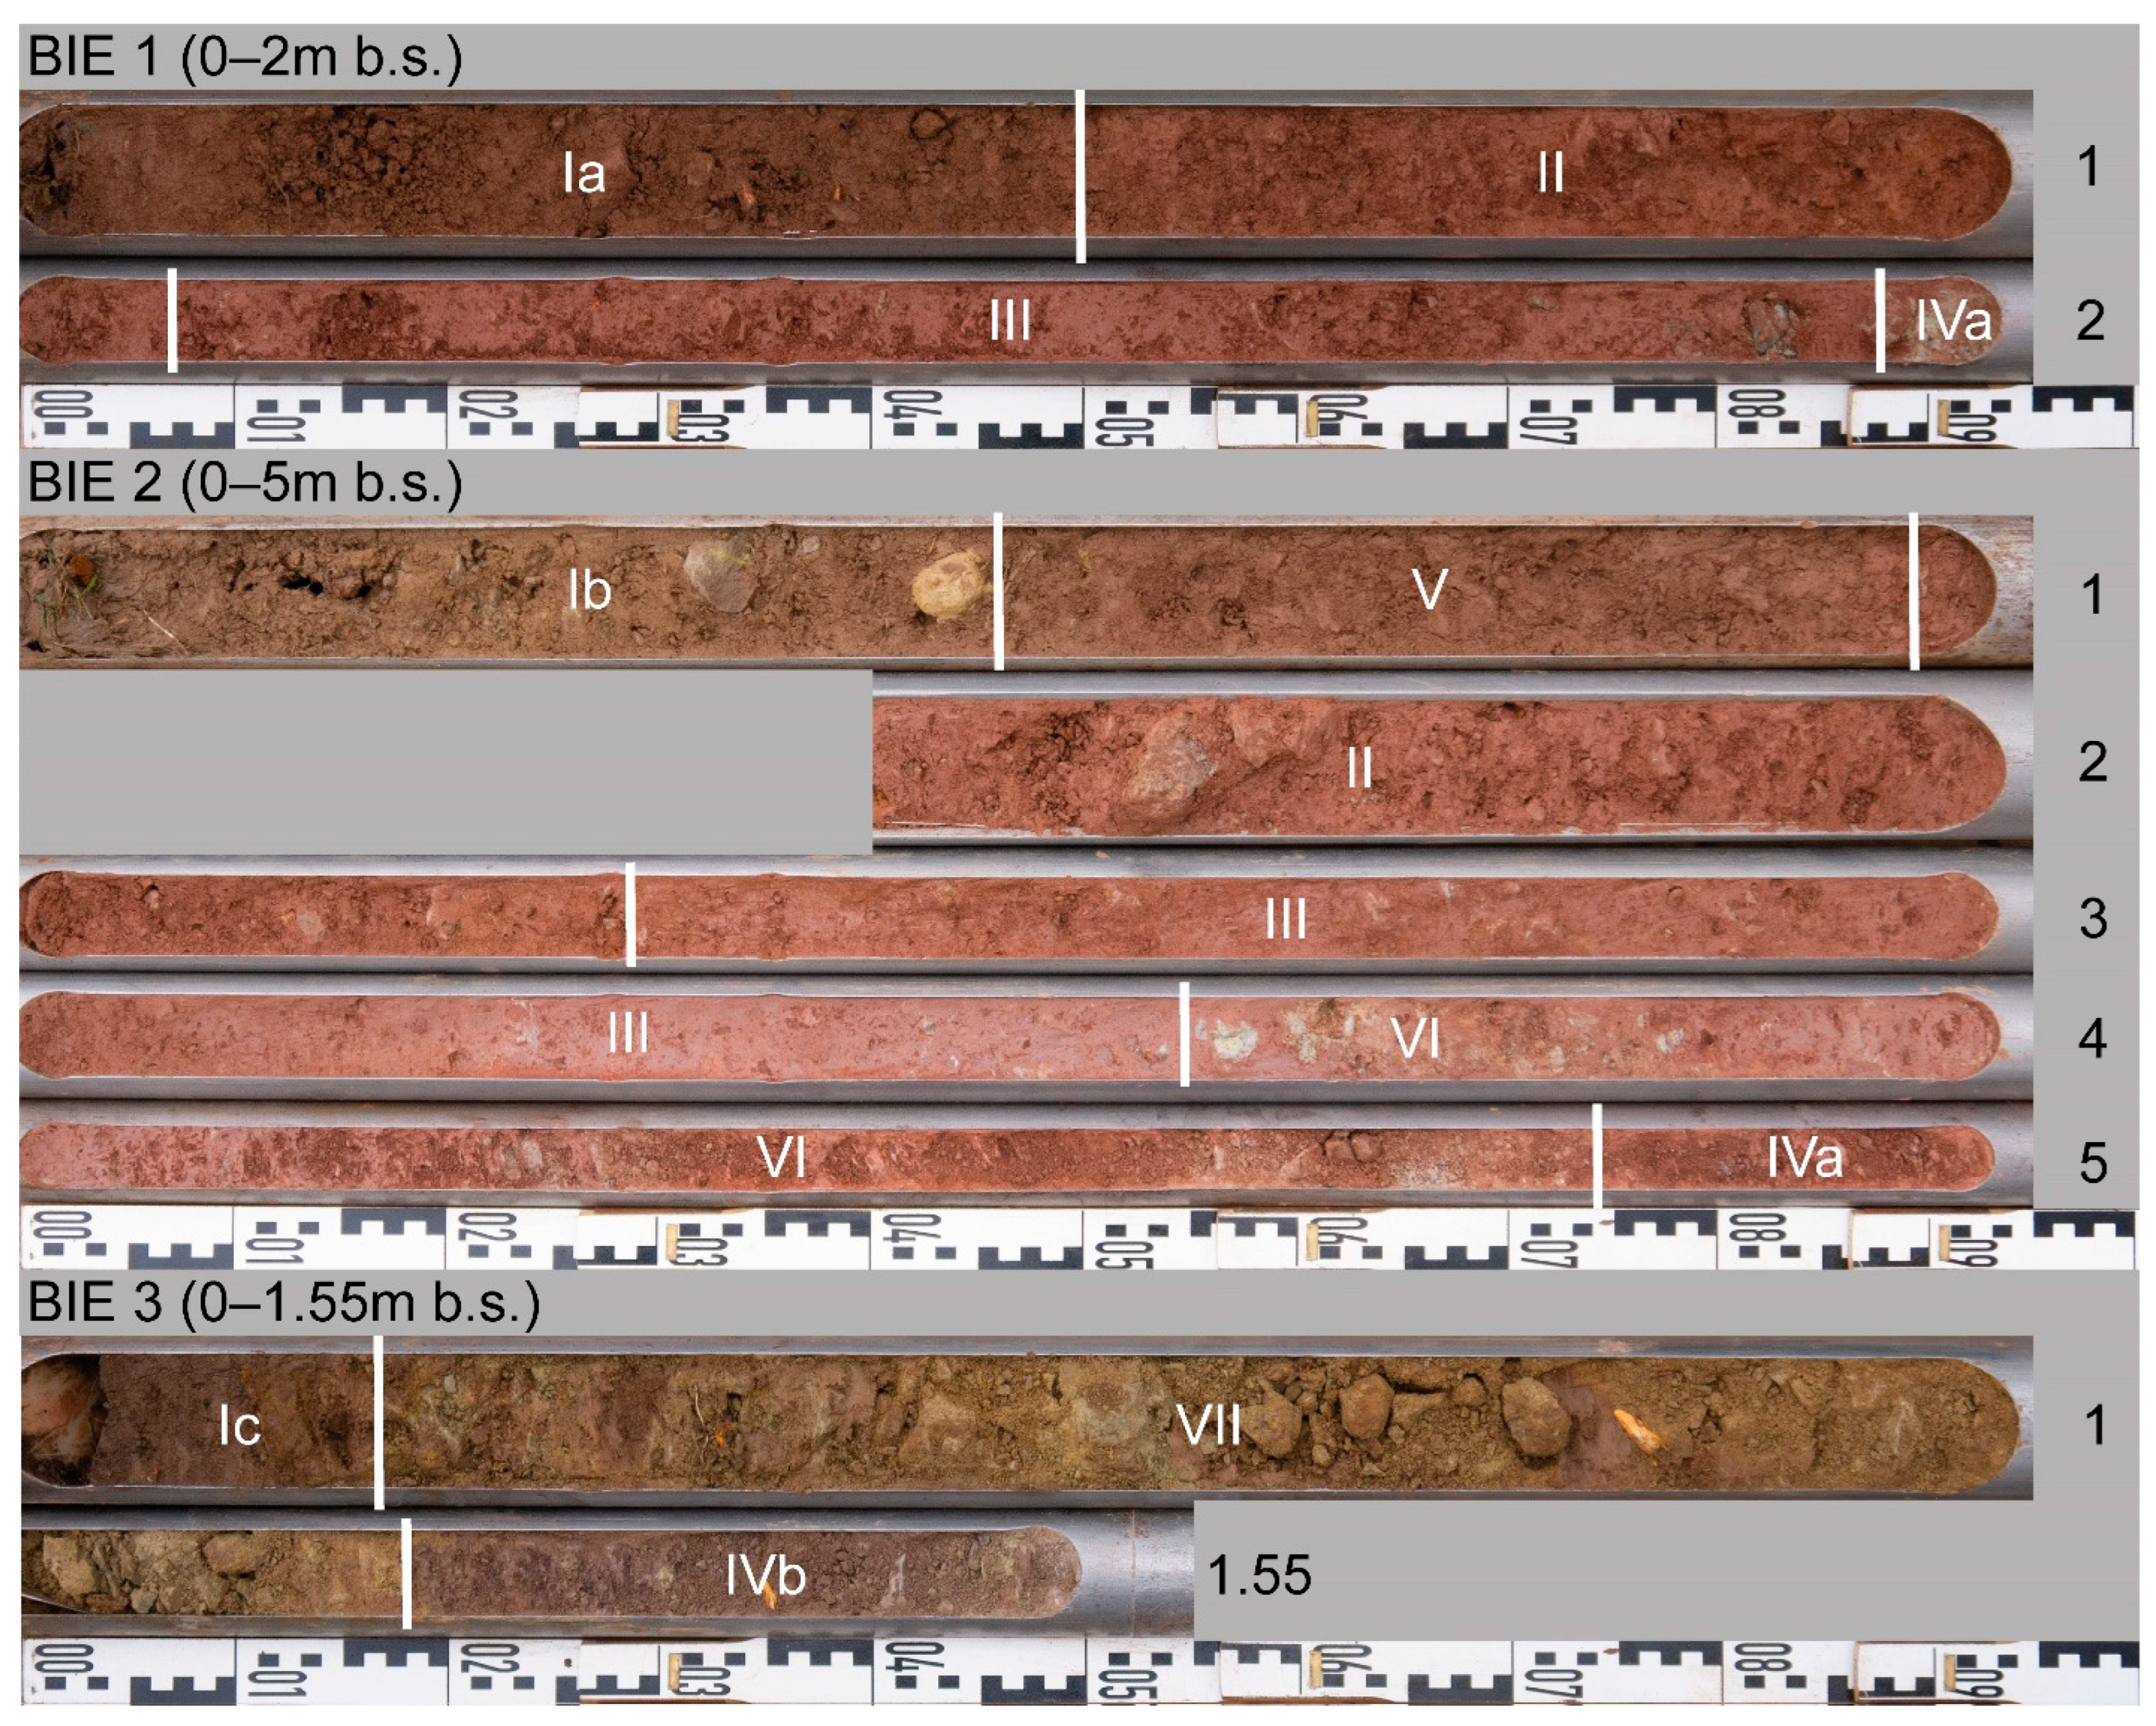
  • In the same position, DP HPT logs clearly show a layer of enhanced permeability framed by overlying impermeable periglacial slope deposits and underlying weathered bedrock.
  • Based on ERT depth sections, an interflow zone was detected, which is characterized by high infiltration rates east of the fault zone.
  • The combination of heavy rainfall, increasing pore water pressure and strong interflow led to destabilization of the sediment cover.
  • Surface runoff additionally liquefied the material, transforming the initial translational slide into a widespread hillslope debris flow.
Based on the results of our study, we created an initial stand-alone model of the observed debris flow, which we subsequently validated in the field. The modeling results yield a 97% match to the observed runout area as well as true-to-life deposition spreads and heights, while rightly disregarding other possible source and hazard zones. The model results indicate a possible transferability to a larger spatial scale and a potential use for hazard zoning at the regional level.
Finally, our case study provides a pathway for analyzing hillslope debris flows triggered through heavy rain events in low mountain ranges. Our findings increase our knowledge concerning hillslope debris flows and may contribute to improved risk assessment and hazard prevention measures for other regions.

Author Contributions

Conceptualization, T.H.-K. and P.F.; methodology, P.F.; validation, T.H.-K., P.S. and P.F.; resources, A.V. and F.E.; data curation, T.H.-K. and P.F.; writing—original draft preparation, T.H.-K., P.S., P.F. and P.R.; writing—review and editing, A.V., F.E. and A.W.; visualization, T.H.-K. and P.F.; project administration, F.E. and A.W.; All authors have read and agreed to the published version of the manuscript.

Funding

This research is funded by the MABEIS-Project (https://www.researchgate.net/project/MABEIS-Mass-movement-Information-System accessed on 12 January 2022).

Institutional Review Board Statement

Not applicable.

Informed Consent Statement

Not applicable.

Data Availability Statement

DWD Climate Data Center (CDC): Sum of Daily Precipitation Grids for Germany, https://opendata.dwd.de/climate_environment/CDC/grids_germany/daily/radolan/historical/bin/2021/ accessed on 28 March 2022. DWD Climate Data Center (CDC): Daily Grids of Soil Moisture under Grass and Sandy Loam for Germany, https://opendata.dwd.de/climate_environment/CDC/grids_germany/daily/soil_moist/ accessed on 28 March 2022. Wetterstation Wiersdorf. Hourly Values from 14 July 2021, https://www.wetter.rlp.de/Internet/AM/NotesAM.nsf/cc619a07ed6c4634c1257800003dca56/aa9e20fdb31309e4c1257171002e8a4e?OpenDocument accessed on 28 March 2022.

Acknowledgments

We would like to thank the local resident Weiler for the informative reports and provision of pictures.

Conflicts of Interest

The authors declare no conflict of interest.

References

  1. Dietze, M.; Ozturk, U. A Flood of Disaster Response Challenges. Science 2021, 373, 1317–1318. [Google Scholar] [CrossRef] [PubMed]
  2. Wehinger, A. Hochwasser und Starkregen an der Ahr. Ingenieurgeologen im Einsatz. In Jahresheft des Landesamtes für Geologie und Bergbau Rheinland-Pfalz; ISSN National Centre: Mainz, Germany, 2021; pp. 6–19. [Google Scholar]
  3. Dietze, M.; Bell, R.; Ozturk, U.; Cook, K.; Andermann, C.; Beer, A.R.; Damm, B.; Lucia, A.; Fauer, F.S.; Nissen, K. More than Heavy Rain Turning into Fast-Flowing Water—A Landscape Perspective on the 2021 Eifel Floods. Nat. Hazards Earth System Sci. 2022, 22C, 1845–1856. [Google Scholar] [CrossRef]
  4. Hürlimann, M.; McArdell, B.W.; Rickli, C. Field and Laboratory Analysis of the Runout Characteristics of Hillslope Debris Flows in Switzerland. Geomorphology 2015, 232, 20–32. [Google Scholar] [CrossRef] [Green Version]
  5. Du, J.; Fan, Z.; Xu, W.; Dong, L. Research Progress of Initial Mechanism on Debris Flow and Related Discrimination Methods: A Review. Front. Earth Sci. 2021, 9, 132. [Google Scholar] [CrossRef]
  6. Carey, J.M.; Cosgrove, B.; Norton, K.; Massey, C.I.; Petley, D.N.; Lyndsell, B. Debris Flow-Slide Initiation Mechanisms in Fill Slopes, Wellington, New Zealand. Landslides 2021, 18, 2061–2072. [Google Scholar] [CrossRef]
  7. BAFU. Schutz vor Massenbewegungsgefahren—Vollzugshilfe Für Das Gefahrenmanagement von Rutschungen, Steinschlag Und Hangmuren; BAFU: Bern, Switzerland, 2016; pp. 1–98. [Google Scholar]
  8. Hungr, O.; Leroueil, S.; Picarelli, L. The Varnes Classification of Landslide Types, an Update. Landslides 2014, 11, 167–194. [Google Scholar] [CrossRef]
  9. Ahmed Bazai, N.; Jiang, H.; Shunyu, Y.; Jinbo, T.; Hu, J.; Shujian, Y.; Qiang, Z.; Ahmed, T.; Jian, G. Dynamic Process of a Typical Slope Debris Flow: A Case Study of the Wujia Gully, Zengda, Sichuan Province, China. Nat. Hazards 2022, 112, 565–586. [Google Scholar] [CrossRef]
  10. Zimmermann, F.; McArdell, B.W.; Rickli, C.; Scheidl, C. 2D Runout Modelling of Hillslope Debris Flows, Based on Well-Documented Events in Switzerland. Geosciences 2020, 10, 70. [Google Scholar] [CrossRef] [Green Version]
  11. Iverson, R.M.; Vallance, J.W. New Views of Granular Mass Flows. Geology 2001, 29, 115. [Google Scholar] [CrossRef]
  12. Gao, Y.; Yin, Y.; Li, B.; Wei, T.; Li, Z.; Gao, H. The Role of Fluid Drag Force in the Dynamic Process of Two-Phase Flow-like Landslides. Landslides 2022, 19, 1791–1805. [Google Scholar] [CrossRef]
  13. Loup, B.; Egli, T.; Stucki, M.; Bartelt, P.; Mcardell, B.W.; Baumann, R. Impact Pressures of Hillslope Debris Flows. In Proceedings of the 12th Congress INTERPRAEVENT, Grenoble, France, 23–26 April 2012; pp. 225–236. [Google Scholar]
  14. Albaba, A.; Schwarz, M.; Wendeler, C.; Loup, B.; Dorren, L. Numerical Modeling Using an Elastoplastic-Adhesive Discrete Element Code for Simulating Hillslope Debris Flows and Calibration against Field Experiments. Nat. Hazards Earth Syst. Sci. 2019, 19, 2339–2358. [Google Scholar] [CrossRef] [Green Version]
  15. Hirschberg, J.; Badoux, A.; Mcardell, B.W.; Leonarduzzi, E.; Molnar, P. Limitations of Rainfall Thresholds for Debris-Flow Prediction in an Alpine Catchment. Nat. Hazards Earth Syst. Sci. 2021, 1–26. [Google Scholar] [CrossRef]
  16. Turconi, L.; Tropeano, D.; Savio, G.; Bono, B.; De, S.K.; Frasca, M.; Luino, F. Torrential Hazard Prevention in Alpine Small Basin through Historical, Empirical and Geomorphological Cross Analysis in NW Italy. Land 2022, 11, 699. [Google Scholar] [CrossRef]
  17. Pasculli, A.; Cinosi, J.; Turconi, L.; Sciarra, N. Learning Case Study of a Shallow-Water Model to Assess an Early-Warning System for Fast Alpine Muddy-Debris-Flow. Water 2021, 13, 750. [Google Scholar] [CrossRef]
  18. Luino, F.; de Graff, J.; Roccati, A.; Biddoccu, M.; Cirio, C.G.; Faccini, F.; Turconi, L. Eighty Years of Data Collected for the Determination of Rainfall Threshold Triggering Shallow Landslides and Mud-Debris Flows in the Alps. Water 2019, 12, 133. [Google Scholar] [CrossRef] [Green Version]
  19. Hänsel, P.; Kaiser, A.; Buchholz, A.; Böttcher, F.; Langel, S.; Schmidt, J.; Schindewolf, M. Mud Flow Reconstruction by Means of Physical Erosion Modeling, High-Resolution Radar-Based Precipitation Data, and UAV Monitoring. Geosciences 2018, 8, 427. [Google Scholar] [CrossRef] [Green Version]
  20. Ozturk, U.; Wendi, D.; Crisologo, I.; Riemer, A.; Agarwal, A.; Vogel, K.; López-Tarazón, J.A.; Korup, O. Rare Flash Floods and Debris Flows in Southern Germany. Sci. Total Environ. 2018, 626, 941–952. [Google Scholar] [CrossRef]
  21. Hagge-Kubat, T.; Wehinger, A.; Enzmann, F. Simulation von Abfluss und Sedimenttransport bei Starkregenereignissen im Oberen Mittelrheintal. Mainz. Geowiss. Mitt. 2020, 48, 7–32. [Google Scholar]
  22. Meyer, W.; Stets, J. Quaternary Uplift in the Eifel Area. In Mantle Plumes: A Multidisciplinary Approach; Spinger: Berlin/Heidelberg, Germany, 2007; pp. 369–378. [Google Scholar] [CrossRef]
  23. DWD Climate Data Center (CDC): Sum of Daily Precipitation Grids for Germany. Available online: https://opendata.dwd.de/climate_environment/CDC/grids_germany/daily/radolan/historical/bin/2021/ (accessed on 28 March 2022).
  24. DWD. RCC Node-CM Product Description Sheet Soil Moisture; DWD: Offenbach, Germany, 2019.
  25. Dittrich, D. Geologische Karte der Trierer Bucht; Landesamt Für Geologie und Bergbau Rheinland-Pfalz: Mainz, Germany, 2011.
  26. Junghänel, T.; Bissolli, P.; Daßler, J.; Fleckenstein, R.; Imbery, F.; Janssen, W.; Kaspar, F.; Lengfeld, K.; Leppelt, T.; Rauthe, M. Hydro-Klimatologische Einordnung Der Stark-Und Dauerniederschläge in Teilen Deutschlands im Zusammenhang Mit Dem Tiefdruckgebiet “Bernd” Vom 12. Bis 19. Juli 2021; DWD: Offenbach, Germany, 2021.
  27. Wetterstation Wiersdorf. Hourly Values from 14 July 2021. Available online: https://www.wetter.rlp.de/Internet/AM/NotesAM.nsf/cc619a07ed6c4634c1257800003dca56/aa9e20fdb31309e4c1257171002e8a4e?OpenDocument&TableRow=2.1.1,2.3#2.1 (accessed on 28 March 2022).
  28. DWD Climate Data Center (CDC): Daily Grids of Soil Moisture under Grass and Sandy Loam for Germany. Available online: https://opendata.dwd.de/climate_environment/CDC/grids_germany/daily/soil_moist/ (accessed on 28 March 2022).
  29. Kirkby, M.J. Infiltration, through Flow, and Overland Flow. Introd. Fluv. Processes 2019, 3, 85–97. [Google Scholar] [CrossRef]
  30. Rahardjo, H.; Lee, T.T.; Leong, E.C.; Rezaur, R.B. Response of a Residual Soil Slope to Rainfall. Can. Geotech. J. 2005, 42, 340–351. [Google Scholar] [CrossRef]
  31. Cucchiaro, S.; Maset, E.; Fusiello, A.; Cazorzi, F. 4D-SFM Photogrammetry for Monitoring Sediment Dynamics in a Debris-Flow Catchment: Software Testing and Results Comparison. Int. Arch. Photogramm. Remote Sens. Spat. Inf. Sci. ISPRS Arch. 2018, 42, 281–288. [Google Scholar] [CrossRef] [Green Version]
  32. Loke, M.H.; Barker, R. RES2Dinv Software; Geotomo Software Company: Huston, TX, USA, 2004. [Google Scholar]
  33. Obrocki, L.; Vött, A.; Wilken, D.; Fischer, P.; Willershäuser, T.; Koster, B.; Lang, F.; Papanikolaou, I.; Rabbel, W.; Reicherter, K. Tracing Tsunami Signatures of the AD 551 and AD 1303 Tsunamis at the Gulf of Kyparissia (Peloponnese, Greece) Using Direct Push in Situ Sensing Techniques Combined with Geophysical Studies. Sedimentology 2020, 67, 1274–1308. [Google Scholar] [CrossRef]
  34. Fischer, P.; Jöris, O.; Fitzsimmons, K.E.; Vinnepand, M.; Prud’homme, C.; Schulte, P.; Hatté, C.; Hambach, U.; Lindauer, S.; Zeeden, C.; et al. Millennial-Scale Terrestrial Ecosystem Responses to Upper Pleistocene Climatic Changes: 4D-Reconstruction of the Schwalbenberg Loess-Palaeosol-Sequence (Middle Rhine Valley, Germany). Catena 2021, 196, 104913. [Google Scholar] [CrossRef]
  35. Wunderlich, T.; Fischer, P.; Wilken, D.; Hadler, H.; Erkul, E.; Mecking, R.; Günther, T.; Heinzelmann, M.; Vött, A.; Rabbel, W. Constraining Electric Resistivity Tomography by Direct Push Electric Conductivity Logs and Vibracores: An Exemplary Study of the Fiume Morto Silted Riverbed (Ostia Antica, Western Italy). Geophysics 2018, 83, B87–B103. [Google Scholar] [CrossRef]
  36. Jahn, R.; Blume, H.P.; Asio, V.B.; Spaargaren, O.; Schad, P. Guidelines for Soil Description; FAO: Rome, Italy, 2006. [Google Scholar]
  37. Neteler, M.; Mitasova, H. Open Source GIS: A GRASS GIS Approach; Springer: Berlin/Heidelberg, Germany, 2013. [Google Scholar]
  38. Mitasova, H.; Thaxton, C.; Hofierka, J.; McLaughlin, R.; Moore, A.; Mitas, L. Path Sampling Method for Modeling Overland Water Flow, Sediment Transport, and Short Term Terrain Evolution in Open Source GIS. Dev. Water Sci. 2004, 55, 1479–1490. [Google Scholar] [CrossRef]
  39. Hofierka, J.; Knutová, M. Simulating Spatial Aspects of a Flash Flood Using the Monte Carlo Method and GRASS GIS: A Case Study of the Malá Svinka Basin (Slovakia). Open Geosci. 2015, 7, 118–125. [Google Scholar] [CrossRef]
  40. LGB Soil Data: BFD 5. Available online: https://mapclient.lgb-rlp.de/?app=lgb&view_id=19 (accessed on 28 March 2022).
  41. Conrad, O.; Bechtel, B.; Bock, M.; Dietrich, H.; Fischer, E.; Gerlitz, L.; Wehberg, J.; Wichmann, V.; Böhner, J. System for Automated Geoscientific Analyses (SAGA) v. 2.1.4. Geosci. Model Dev. 2015, 8, 1991–2007. [Google Scholar] [CrossRef] [Green Version]
  42. Wichmann, V. The Gravitational Process Path (GPP) Model (v1.0)—A GIS-Based Simulation Framework for Gravitational Processes. Geosci. Model Dev. 2017, 10, 3309–3327. [Google Scholar] [CrossRef] [Green Version]
  43. Goetz, J.; Kohrs, R.; Parra Hormazábal, E.; Bustos Morales, M.; Araneda Riquelme, M.B.; Henríquez, C.; Brenning, A. Optimizing and Validating the Gravitational Process Path Model for Regional Debris-Flow Runout Modelling. Nat. Hazards Earth Syst. Sci. 2021, 21, 2543–2562. [Google Scholar] [CrossRef]
  44. Wyss, R.; Strickler, B. Aspekte der Beurteilung spontaner Rutschungen und Hangmuren. Ingenieurbiologie. 2020, 3, 29–36. [Google Scholar]
  45. Haas, F.; Heckamnn, T.; Hilger, L.; Becht, M. Quantification and Modelling of Debris Flows in the Proglacial Area of the Gepatschferner/Austria Using Ground-Based LIDAR. In Erosion and Sediment Yields in the Changing Environment: Proceedings of an IAHS International Commission on Continental Erosion Symposium Chengdu, China, 11–15 October 2012; IAHS: Wallingford, UK, 2012; pp. 293–302. [Google Scholar]
  46. Kofler, C.; Mair, V.; Comiti, F.; Zebisch, M.; Schneiderbauer, S.; Steger, S. Towards a Sediment Transfer Capacity Index of Rock Glaciers: Examples from Two Catchments in South Tyrol, (Eastern Italian Alps). Catena 2022, 216, 106329. [Google Scholar] [CrossRef]
  47. Gamma, P. Ein Murgang-Simulationsprogramm zur Gefahrenzonierung. Ph.D. Thesis, University of Bern, Bern, Switzerland, 2000. [Google Scholar]
  48. Perla, R.; Cheng, T.T.; McClung, D.M. A Two–Parameter Model of Snow–Avalanche Motion. J. Glaciol. 1980, 26, 197–207. [Google Scholar] [CrossRef] [Green Version]
  49. Rickli, C.; Kamm, S.; Bucher, H. Flachgründige Rutschungen. Projektbericht Ereignisanalyse Hochwasser 2005 Zuhanden des Bundesamtes Für Umwelt BAFU; BAFU: Bern, Switzerland, 2008; pp. 1–114. [Google Scholar]
  50. Rickenmann, D. Runout Prediction Methods. In Debris-Flow Hazards and Related Phenomena; Springer: Berlin/Heidelberg, Germany, 2005; pp. 305–324. [Google Scholar]
Figure 1. Aerial view of the hillslope debris flow of Biersdorf that occurred on 14 July 2021 with the associated location in Rheinland-Pfalz (Photo taken on 2 February 2022). (A) View into the scar. (B) Downhill view of the runout track. (C) Debris deposits on the municipal road (Photos taken on 15 July 2021).
Geosciences 12 00245 g001
Figure 2. (A) Precipitation distribution in Rheinland-Pfalz from 14 July 2021. Derived from the RADOLAN weather data of the DWD [23]. (B) Section of the precipitation distribution around Biersdorf with the unit of measurement changed for visualization. (C) DWD soil saturation model around Biersdorf from 13 July 2021 with the following units: dark blue = oversaturated (≥100% usable field capacity), blue = saturated, at the beginning of oversaturation (80 to <100%; DWD 2022, [24]). (D) Geological structure and lithologic distribution in the study area (upB = Upper Buntsandstein, lowM = Lower Muschelkalk, midM = Middle Muschelkalk, upM = Upper Muschelkalk). (E) Slope of the study area including downhill track of the debris flow. (F) Aerial view of the study area with the realized geomorphological prospects marked.
Geosciences 12 00245 g002
Figure 3. Hourly precipitation distribution for the torrential rainfall event from 14 July 2021 derived from the weather station of Wiersdorf with the approximately reported triggering time of the hillslope debris flow [27].
Geosciences 12 00245 g003
Figure 4. (A) Photogrammetrically-calculated model of the hillslope debris flow with overlying true-color mesh; densely vegetated areas marked in grey. (B) Elevation difference between the photogrammetrically-generated DEM from 2 February 2022 and an ALS-generated DEM from 2018. (C) Elevation change in the drawn transect (yellow line in B) with distinct morphological markers shown as 2D graph.
Geosciences 12 00245 g004
Figure 5. Upper: depth section of ERT transect BIE ERT 1 (iteration 6, absolute error 1.4%) and position of DP HPT logs and sediment cores retrieved from right above the scarped ridge (cp. Figure 1). Lower: depth section with interpretation according to field observation and geological data (see discussion in Section 5).
Geosciences 12 00245 g005
Figure 6. Photo of sediment cores BIE 1 (upper), BIE 2 (middle) and BIE 3 (lower). Ground surface upper left, coring base lower right of each core. Sediment units are described in Table 3.
Geosciences 12 00245 g006
Figure 7. Sediment cores BIE 1 to 3 with DP HPT data (electrical conductivity, EC and hydraulic pressure (HP). Sediment units Ia–VII refer to description in Table 3 (see also Figure 5).
Geosciences 12 00245 g007
Figure 8. Modeled runout and deposition behavior of the debris flow with calculated trigger areas and photographic comparison to the in situ situation.
Geosciences 12 00245 g008
Figure 9. Spring water discharge in the scar of the hillslope debris flow at the depth and assumed location of the observed interflow lens.
Geosciences 12 00245 g009
Figure 10. Comparison of the observed debris flow runout with the results of surface runoff modeling for the study area. The heavy rain simulation is based on weather data from the Wiersdorf station [27] during the hour before the mass movement occurred. The time of the triggering was assumed by local residents’ reports.
Geosciences 12 00245 g010
Table 1. Crucial model input parameters used with r.sim.water.
Input ParametersSpecifications/ValuesData Source
DEM1 × 1 mALS flight mission 2018
Rainfall intensity10.8 mm/hWiersdorf weather data [27]
Infiltration rate0.5 mm/hsaturation model [28], estimation
Manning’s
roughness coefficient
Landcover based-
spatially distributed
Orthophotography, [40]
Iterations60 minWiersdorf weather data [27]
Walkers10,000-
Table 2. Crucial model input parameters used in GPP.
Input ParametersSpecifications/ValuesData Source
DEM1 × 1 mALS flight mission 2018
Process path modelRandom walk[47]
Slope threshold40[42]
Lateral spreading exponent2[42]
Persistence factor1.5[42]
Runout modelPCM[48]
Source areasIndex gridHDI [44]
Initial material thickness
source areas
3–5 mBK 50 (Soil Data, LGB [40])
and Field Investigation
SF coefficient (μ)0.22–0.46Field Investigation and [43,46]
Mass to drag ratio (m/d)60 mField Investigation and [43]
Initial velocity0.5 m/s-
Iterations1000-
Table 3. Sediment units described for the Biersdorf sediment cores.
Sediment Unit (SU)Description
Iatopsoil, clayey silt, dark brown, soft, non-calcareous, humous, charcoal and root fragments, sand- and claystone debris
Ibtopsoil, clayey silt, greyish brown, soft, non-calcareous, weakly humous, charcoal and root fragments, sand- and limestone debris
Ictopsoil, clayey silt, dark greyish brown, soft, non-calcareous, humous, root fragments
IIperiglacial slope deposits, clayey silt to silty clay, reddish brown, slightly hard, non-calcareous, rich in sandstone debris
IIIperiglacial slope deposits, clayey silt to silty clay, reddish brown, hard (dense), non-calcareous, including little sandstone debris
Ivaweathered bedrock, clay, reddish brown, extremely hard, non-calcareous
Ivbweathered bedrock, clay, purple grey, extremely hard, slightly calcareous, solid limestone at its base
Vcolluvial deposits, clayey silt, reddish grey-brown, soft, non-calcareous, weakly humous, including little sandstone debris, charcoal and root fragments
VIperiglacial slope deposits, clayey to silty sand, reddish grey, loose to slightly hard (porous), non-calcareous, sandstone debris
VIIperiglacial slope deposits, limestone debris (yellowish-grey) and intercalated, thin clayey silt layers (brown), loose (porous) to slightly hard (clayey silt layers), slightly calcareous
Publisher’s Note: MDPI stays neutral with regard to jurisdictional claims in published maps and institutional affiliations.

