
Petrological Monitoring of the AD 2011–2012 Volcanic Ash from Sakurajima Volcano, Southern Kyushu, Japan


Abstract
:
1. Introduction
2. Experimental Section
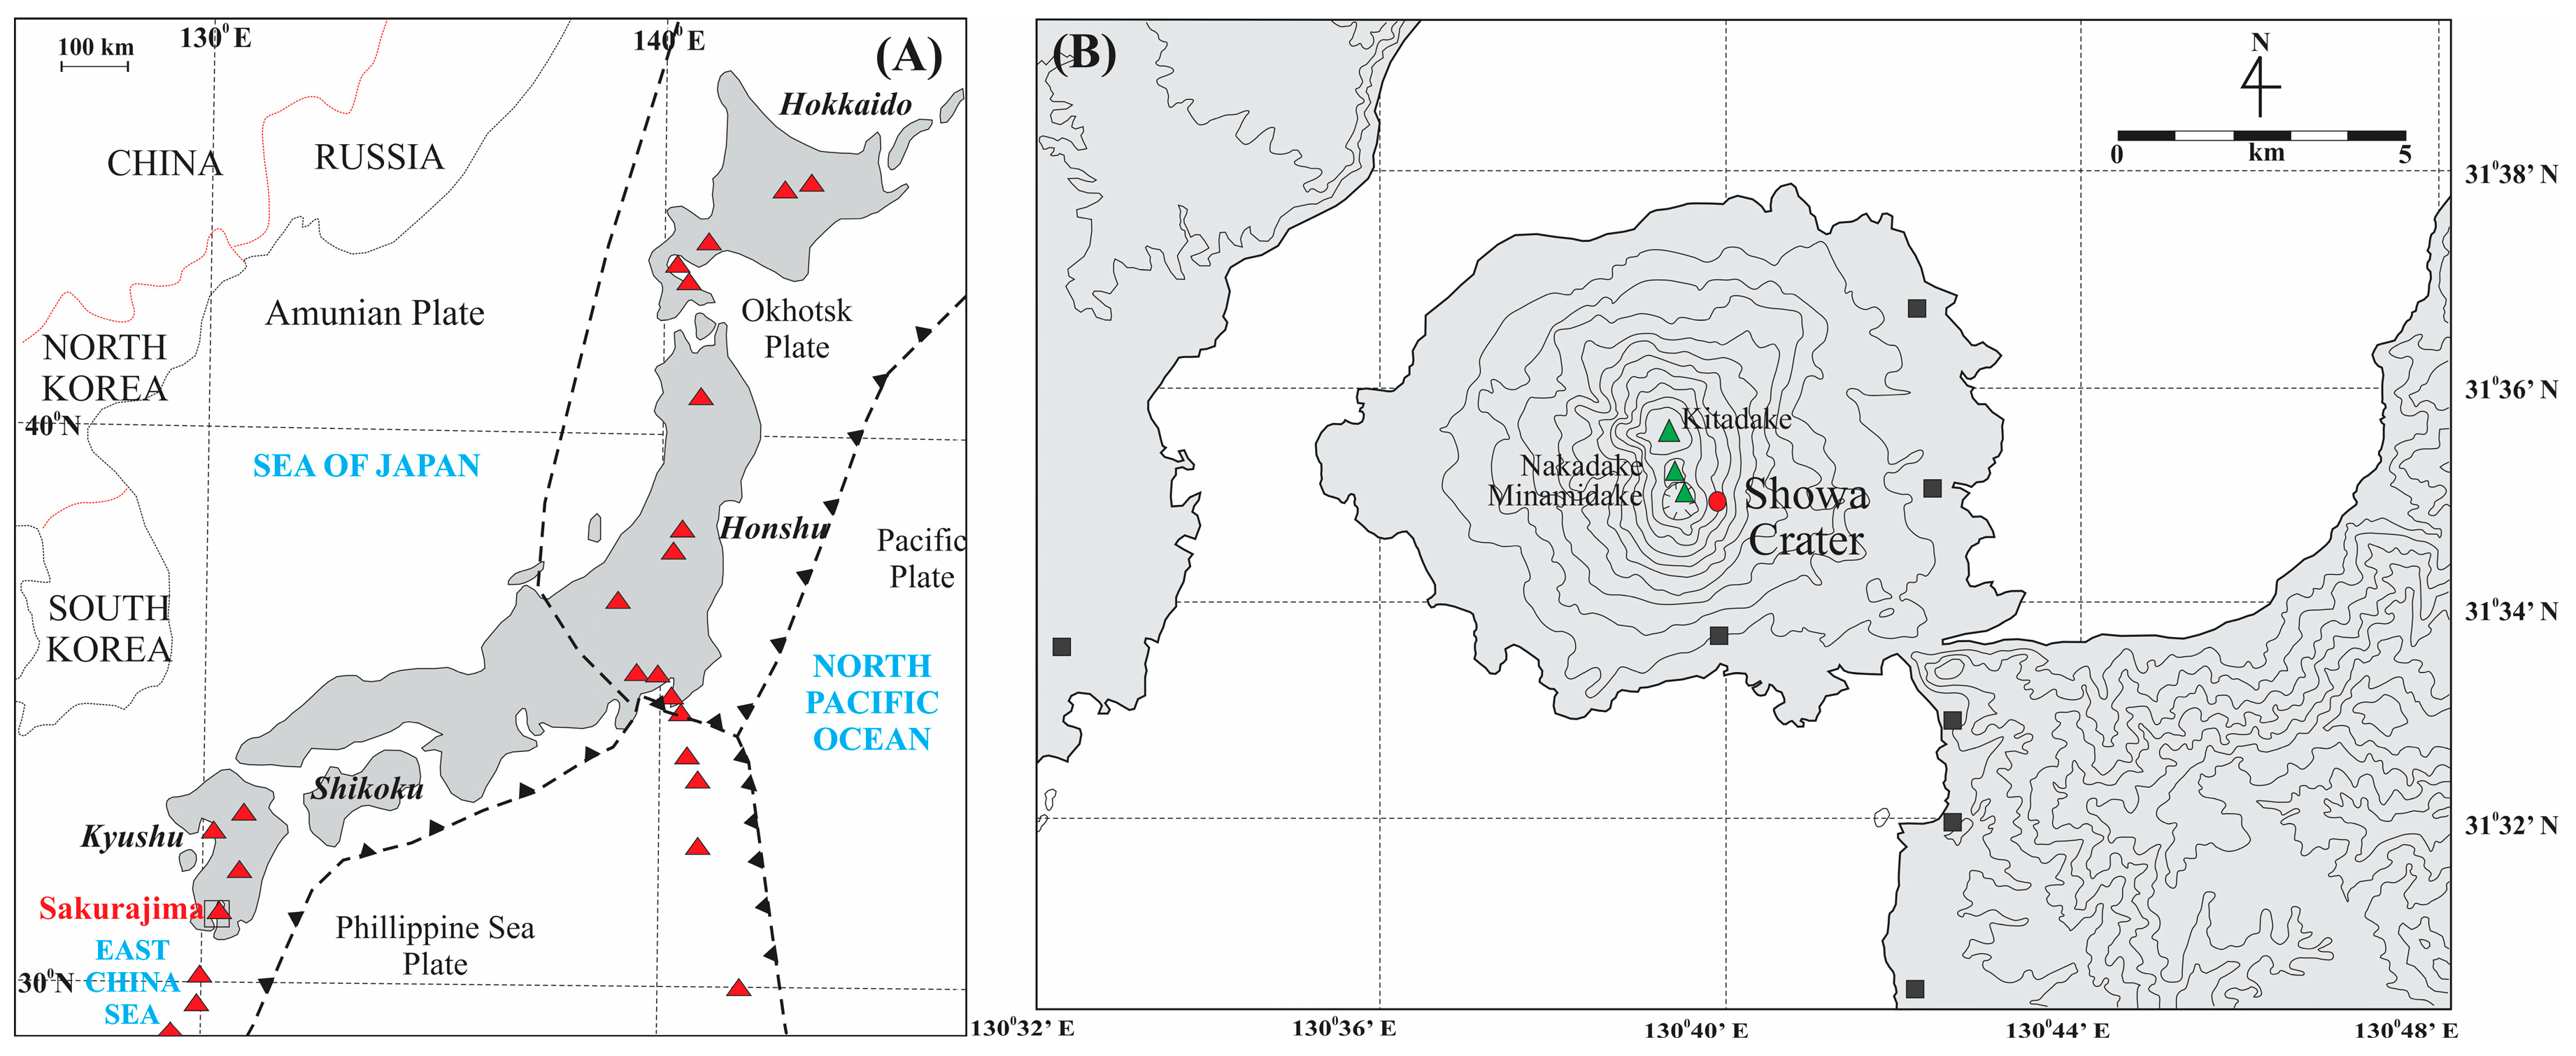
2.1. Materials
2.2. Methods
3. Results
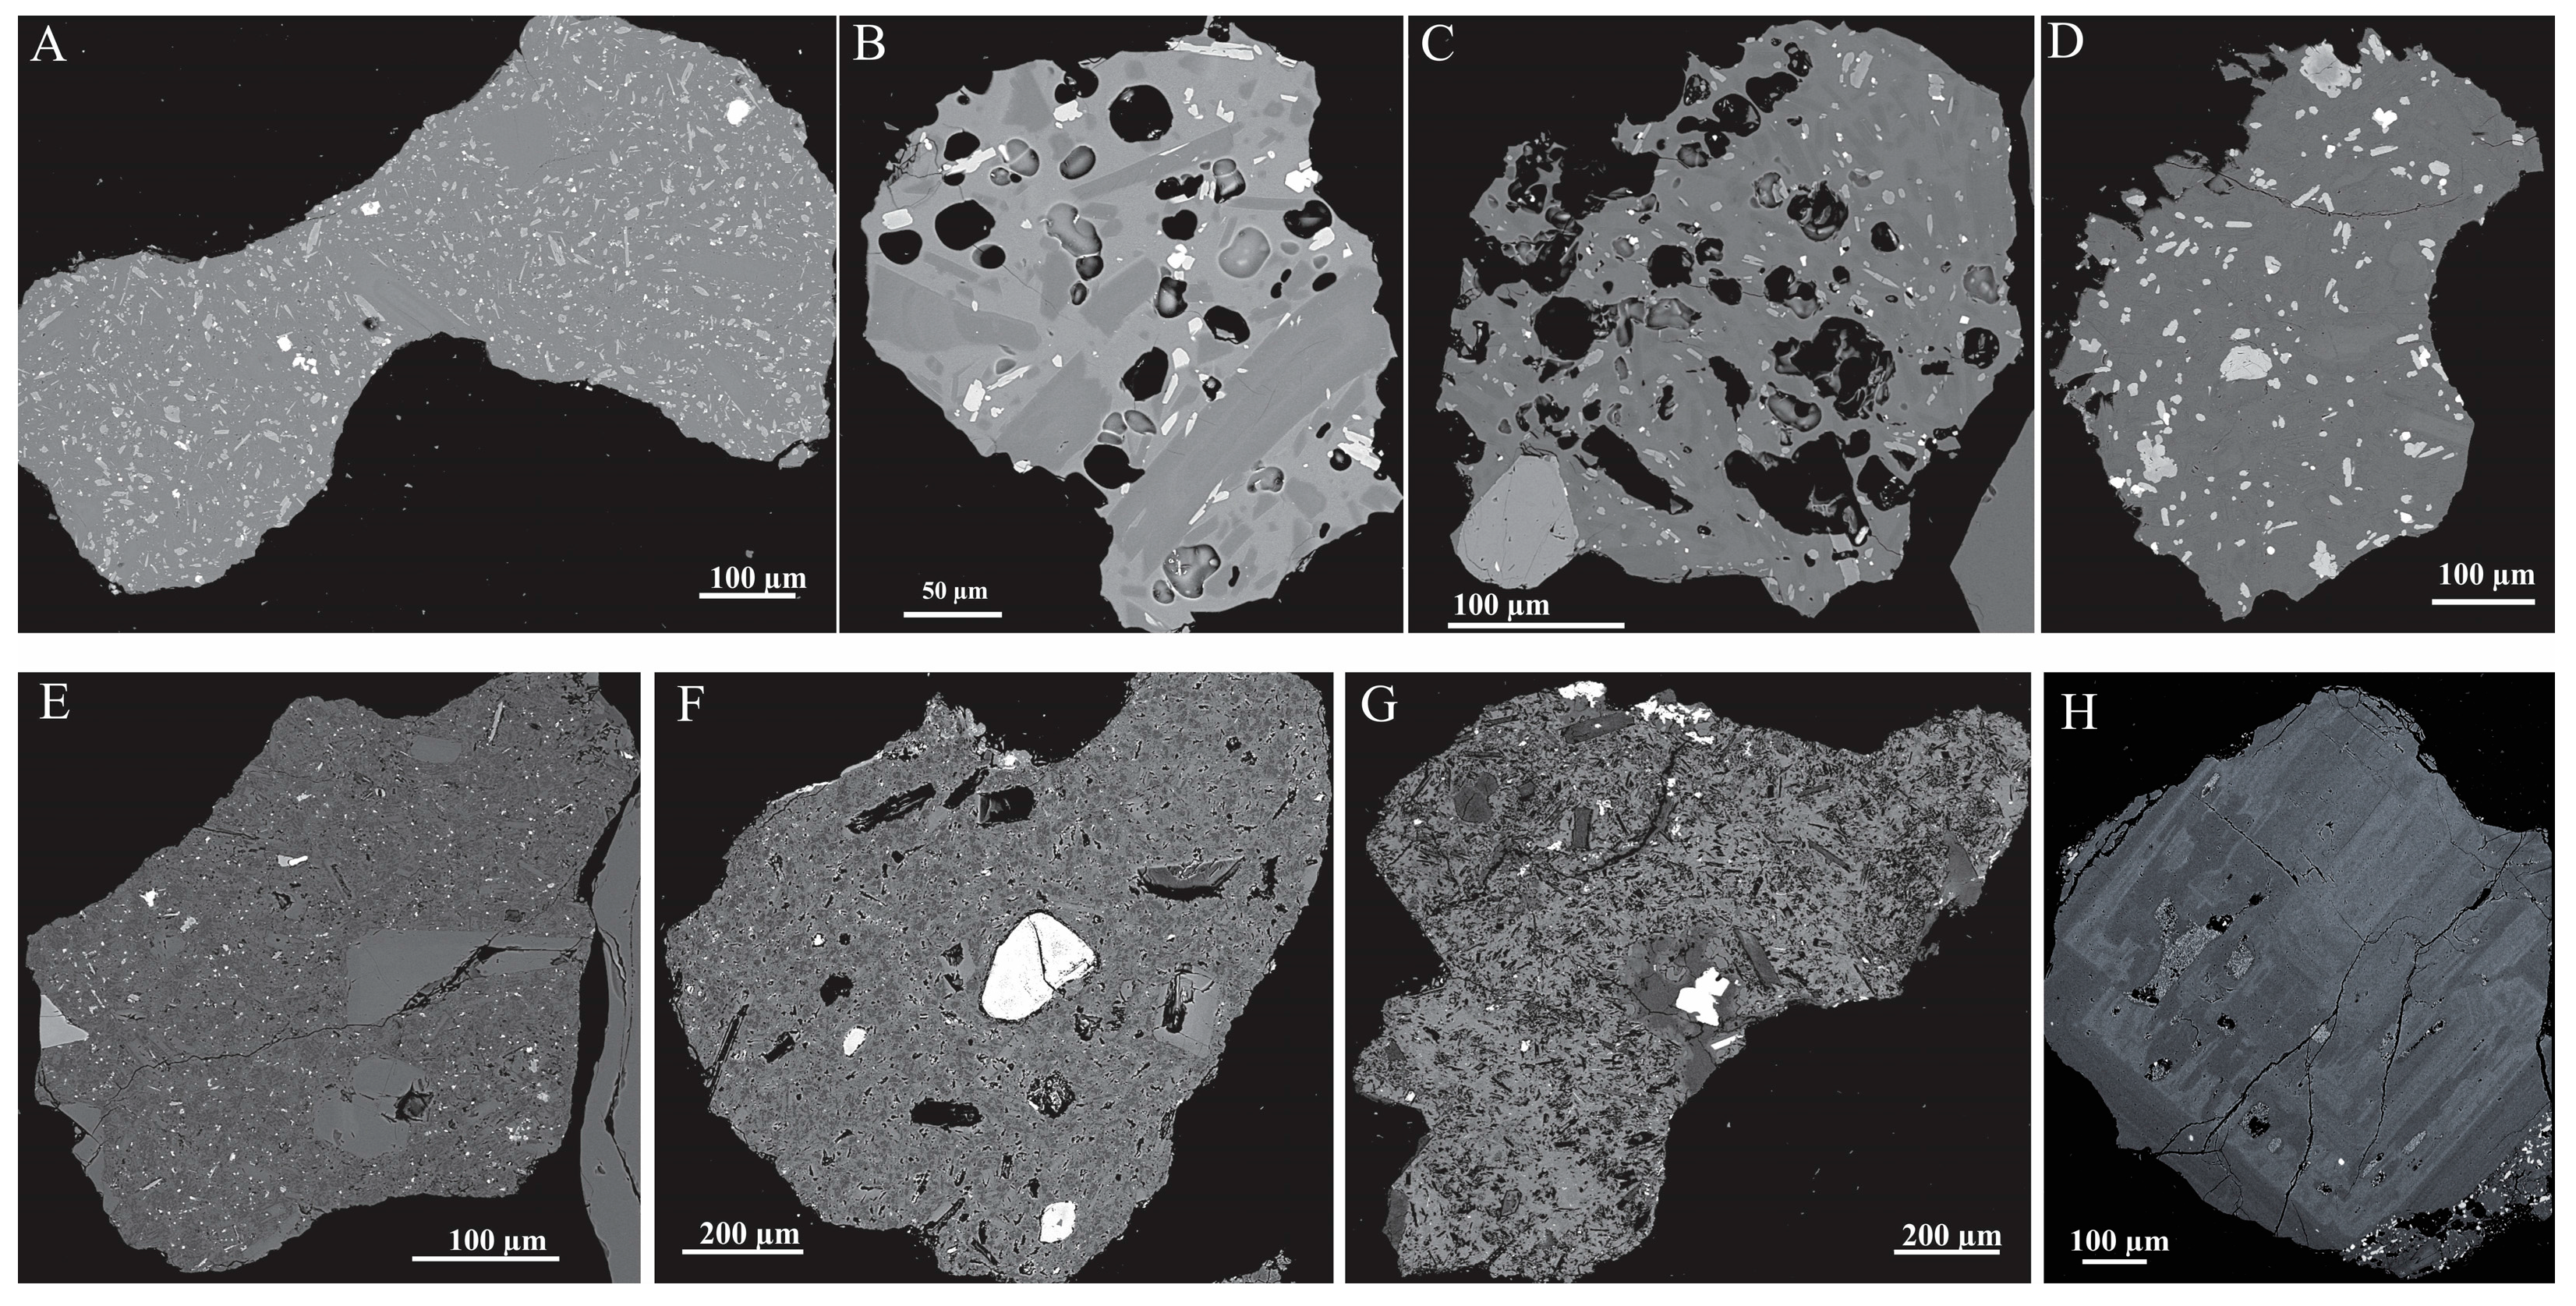
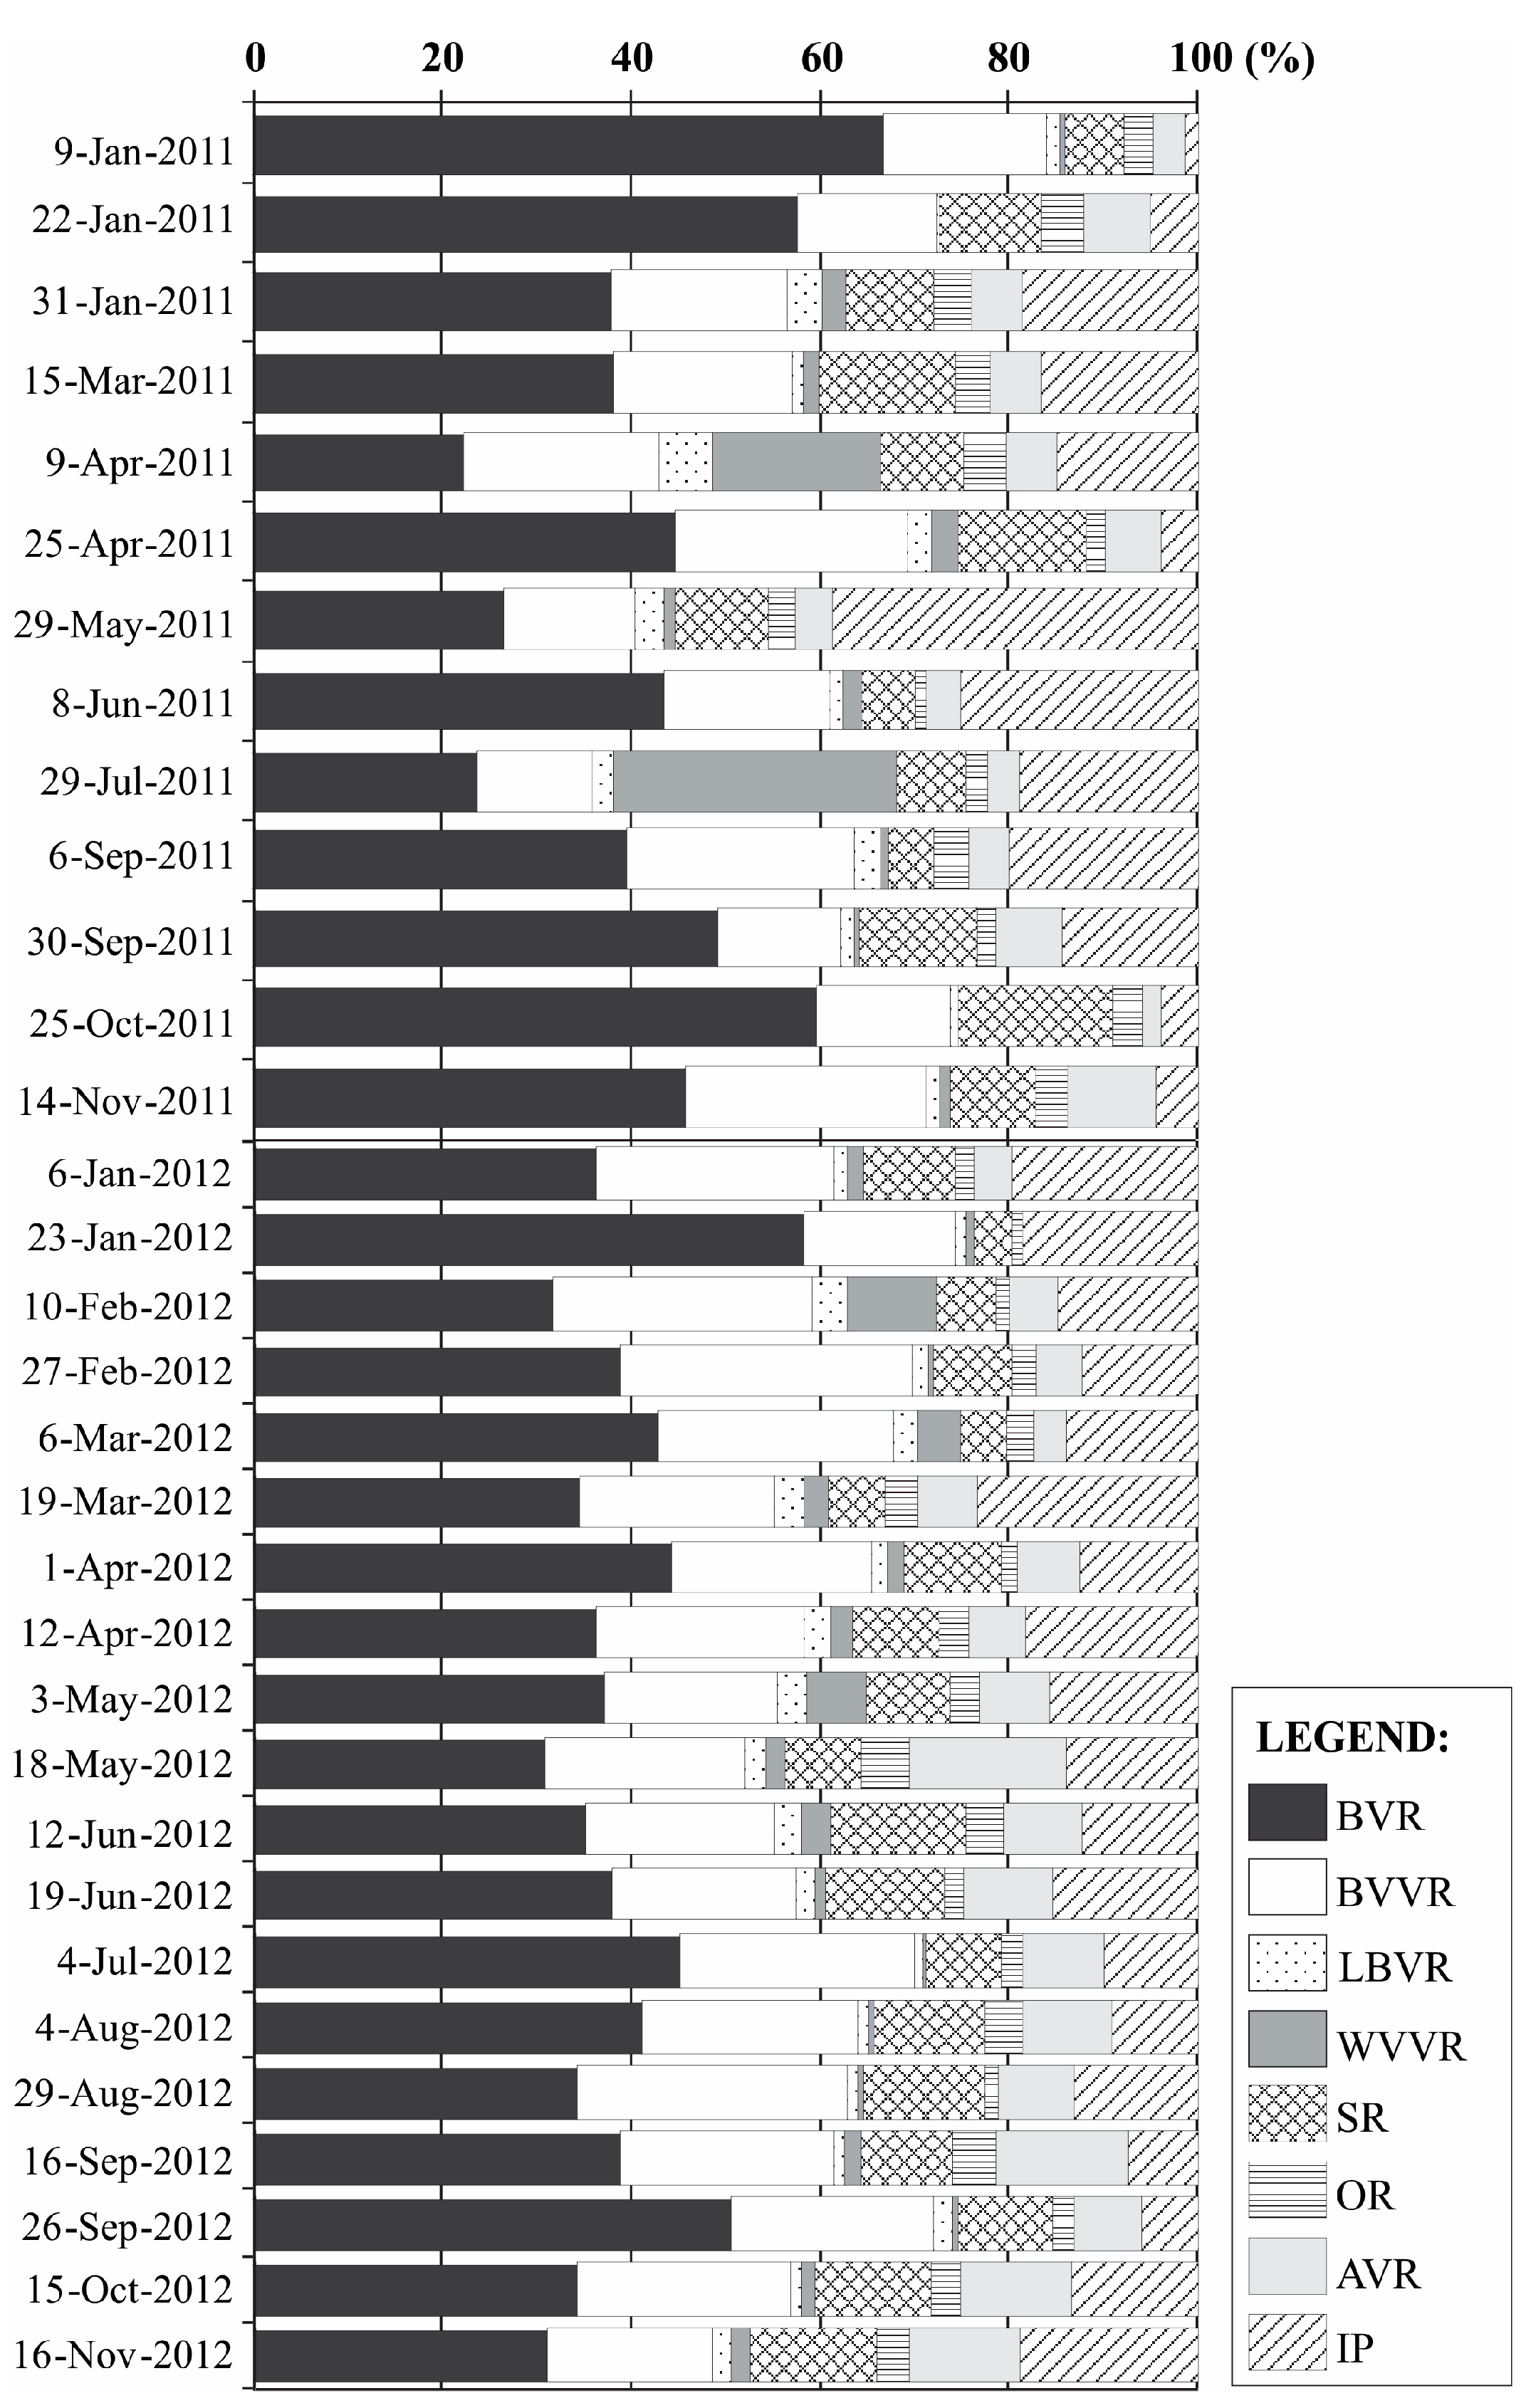
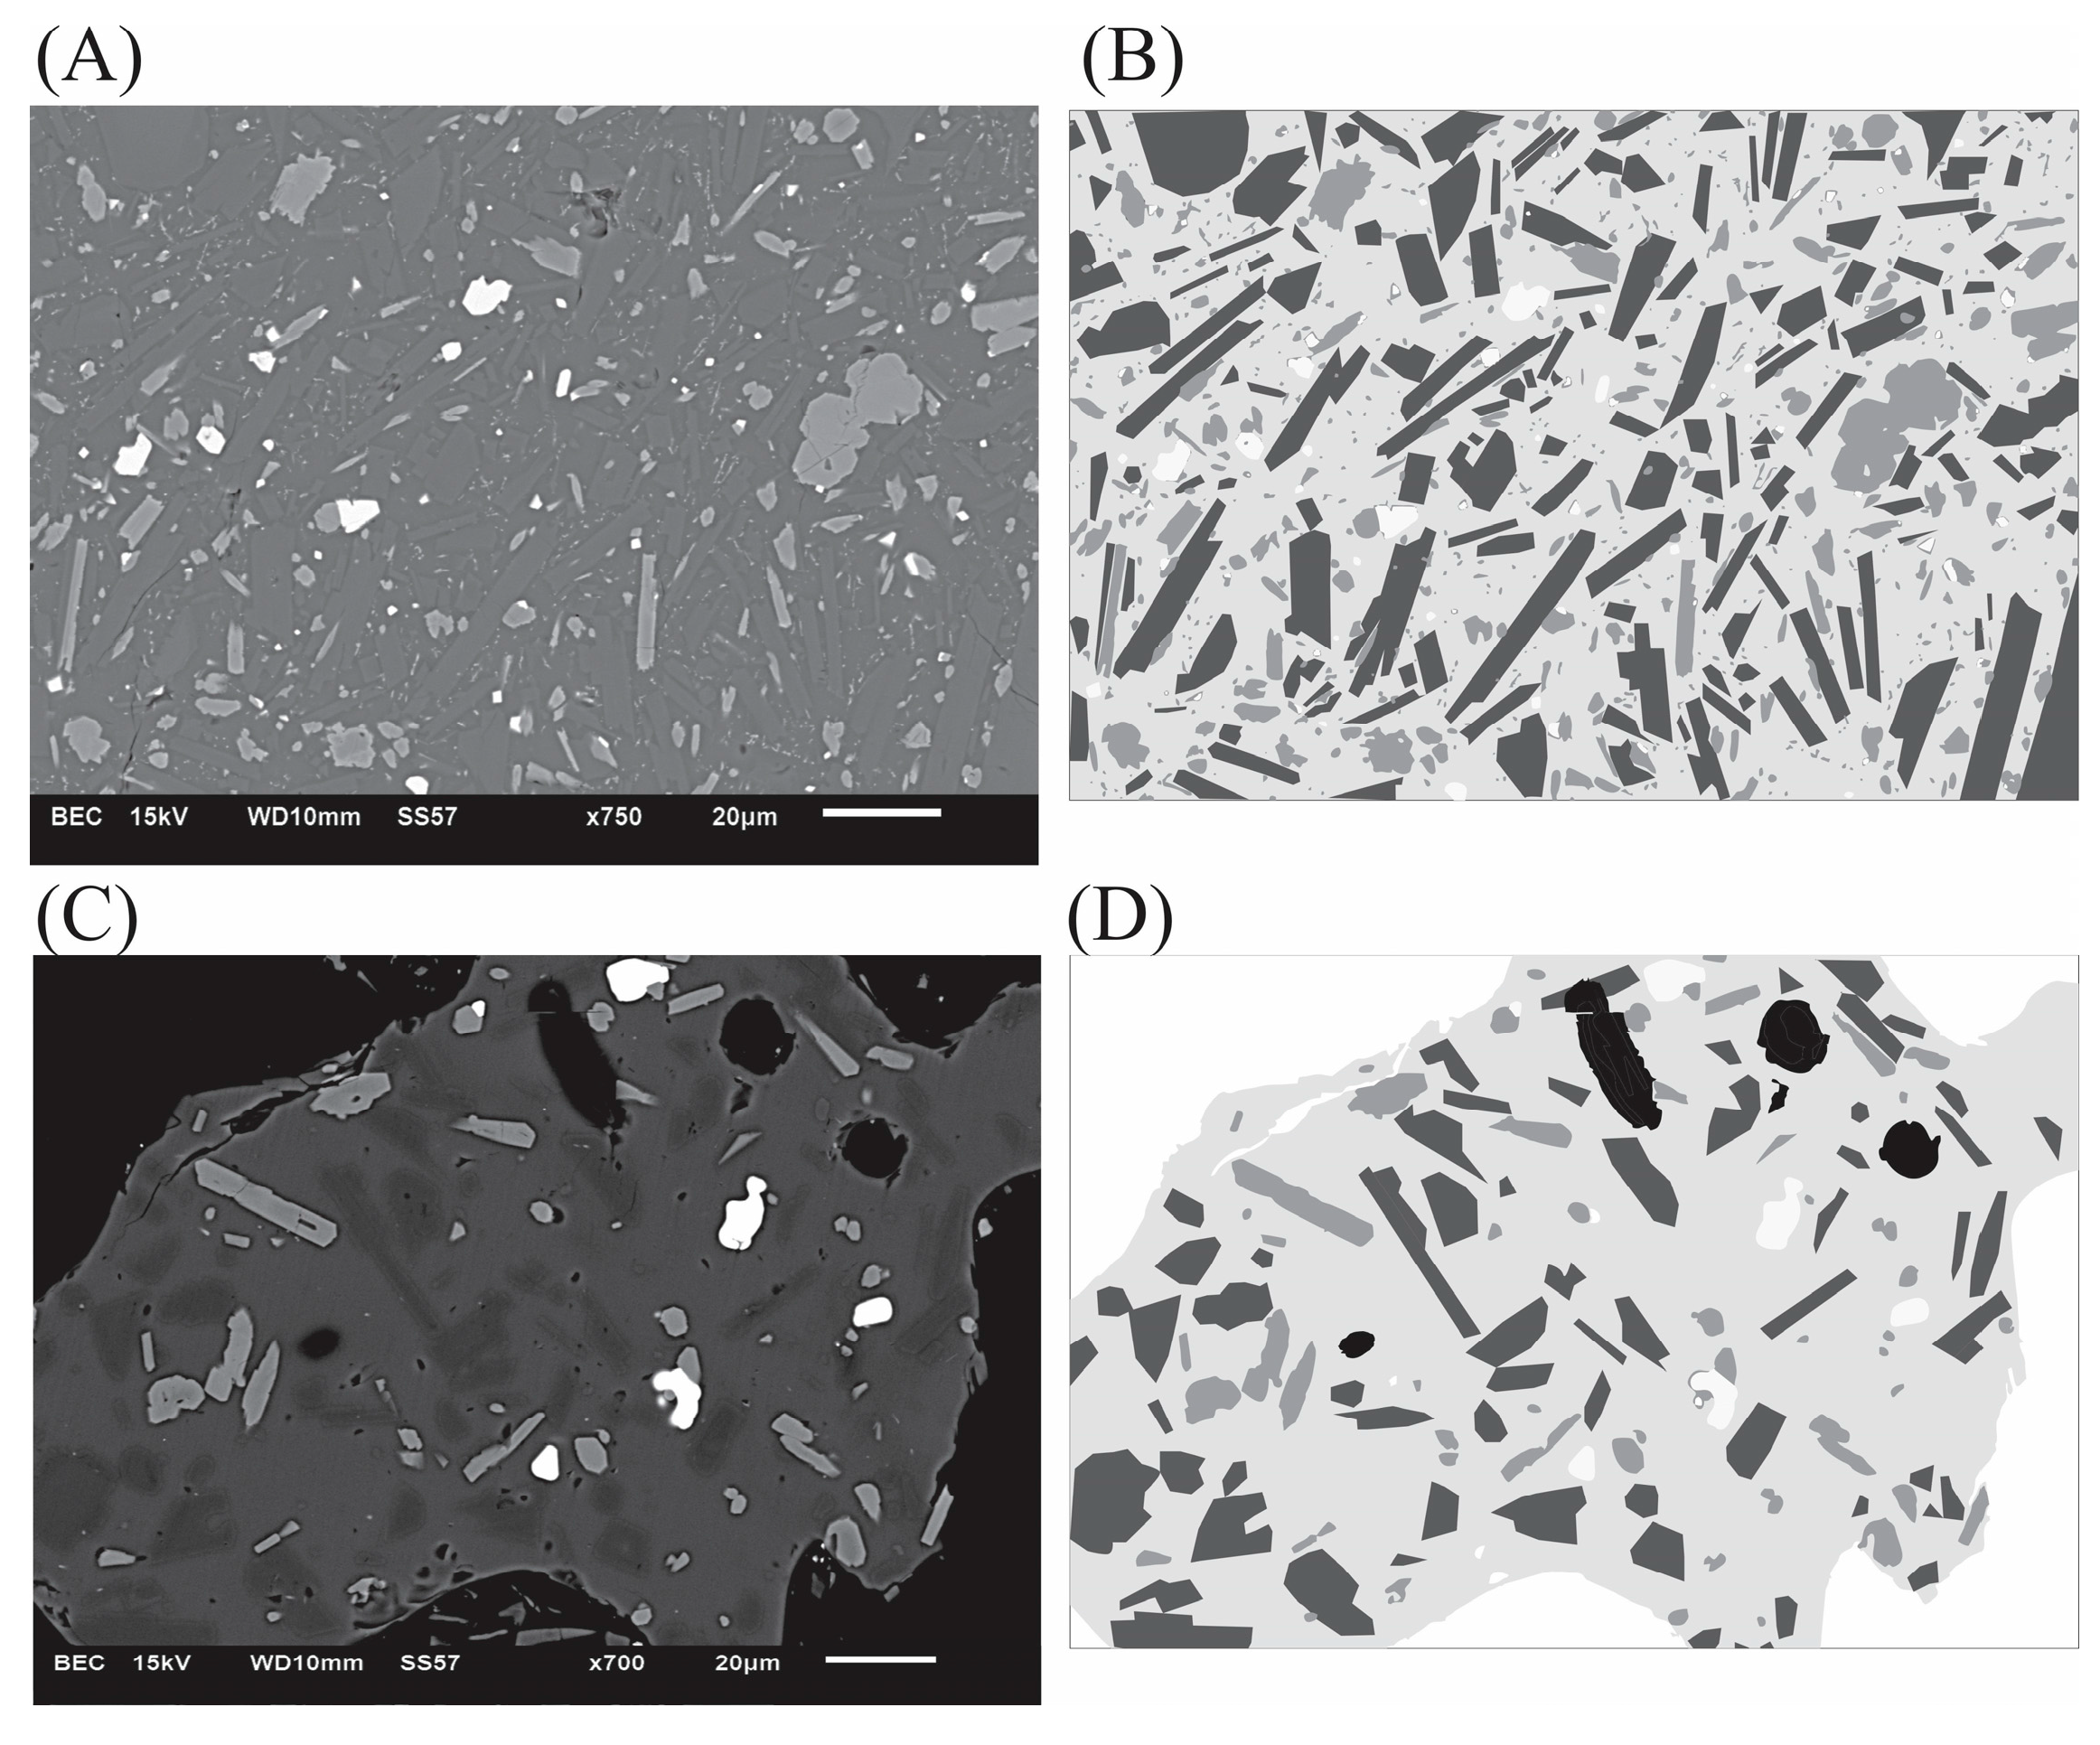
3.1. Ash Component
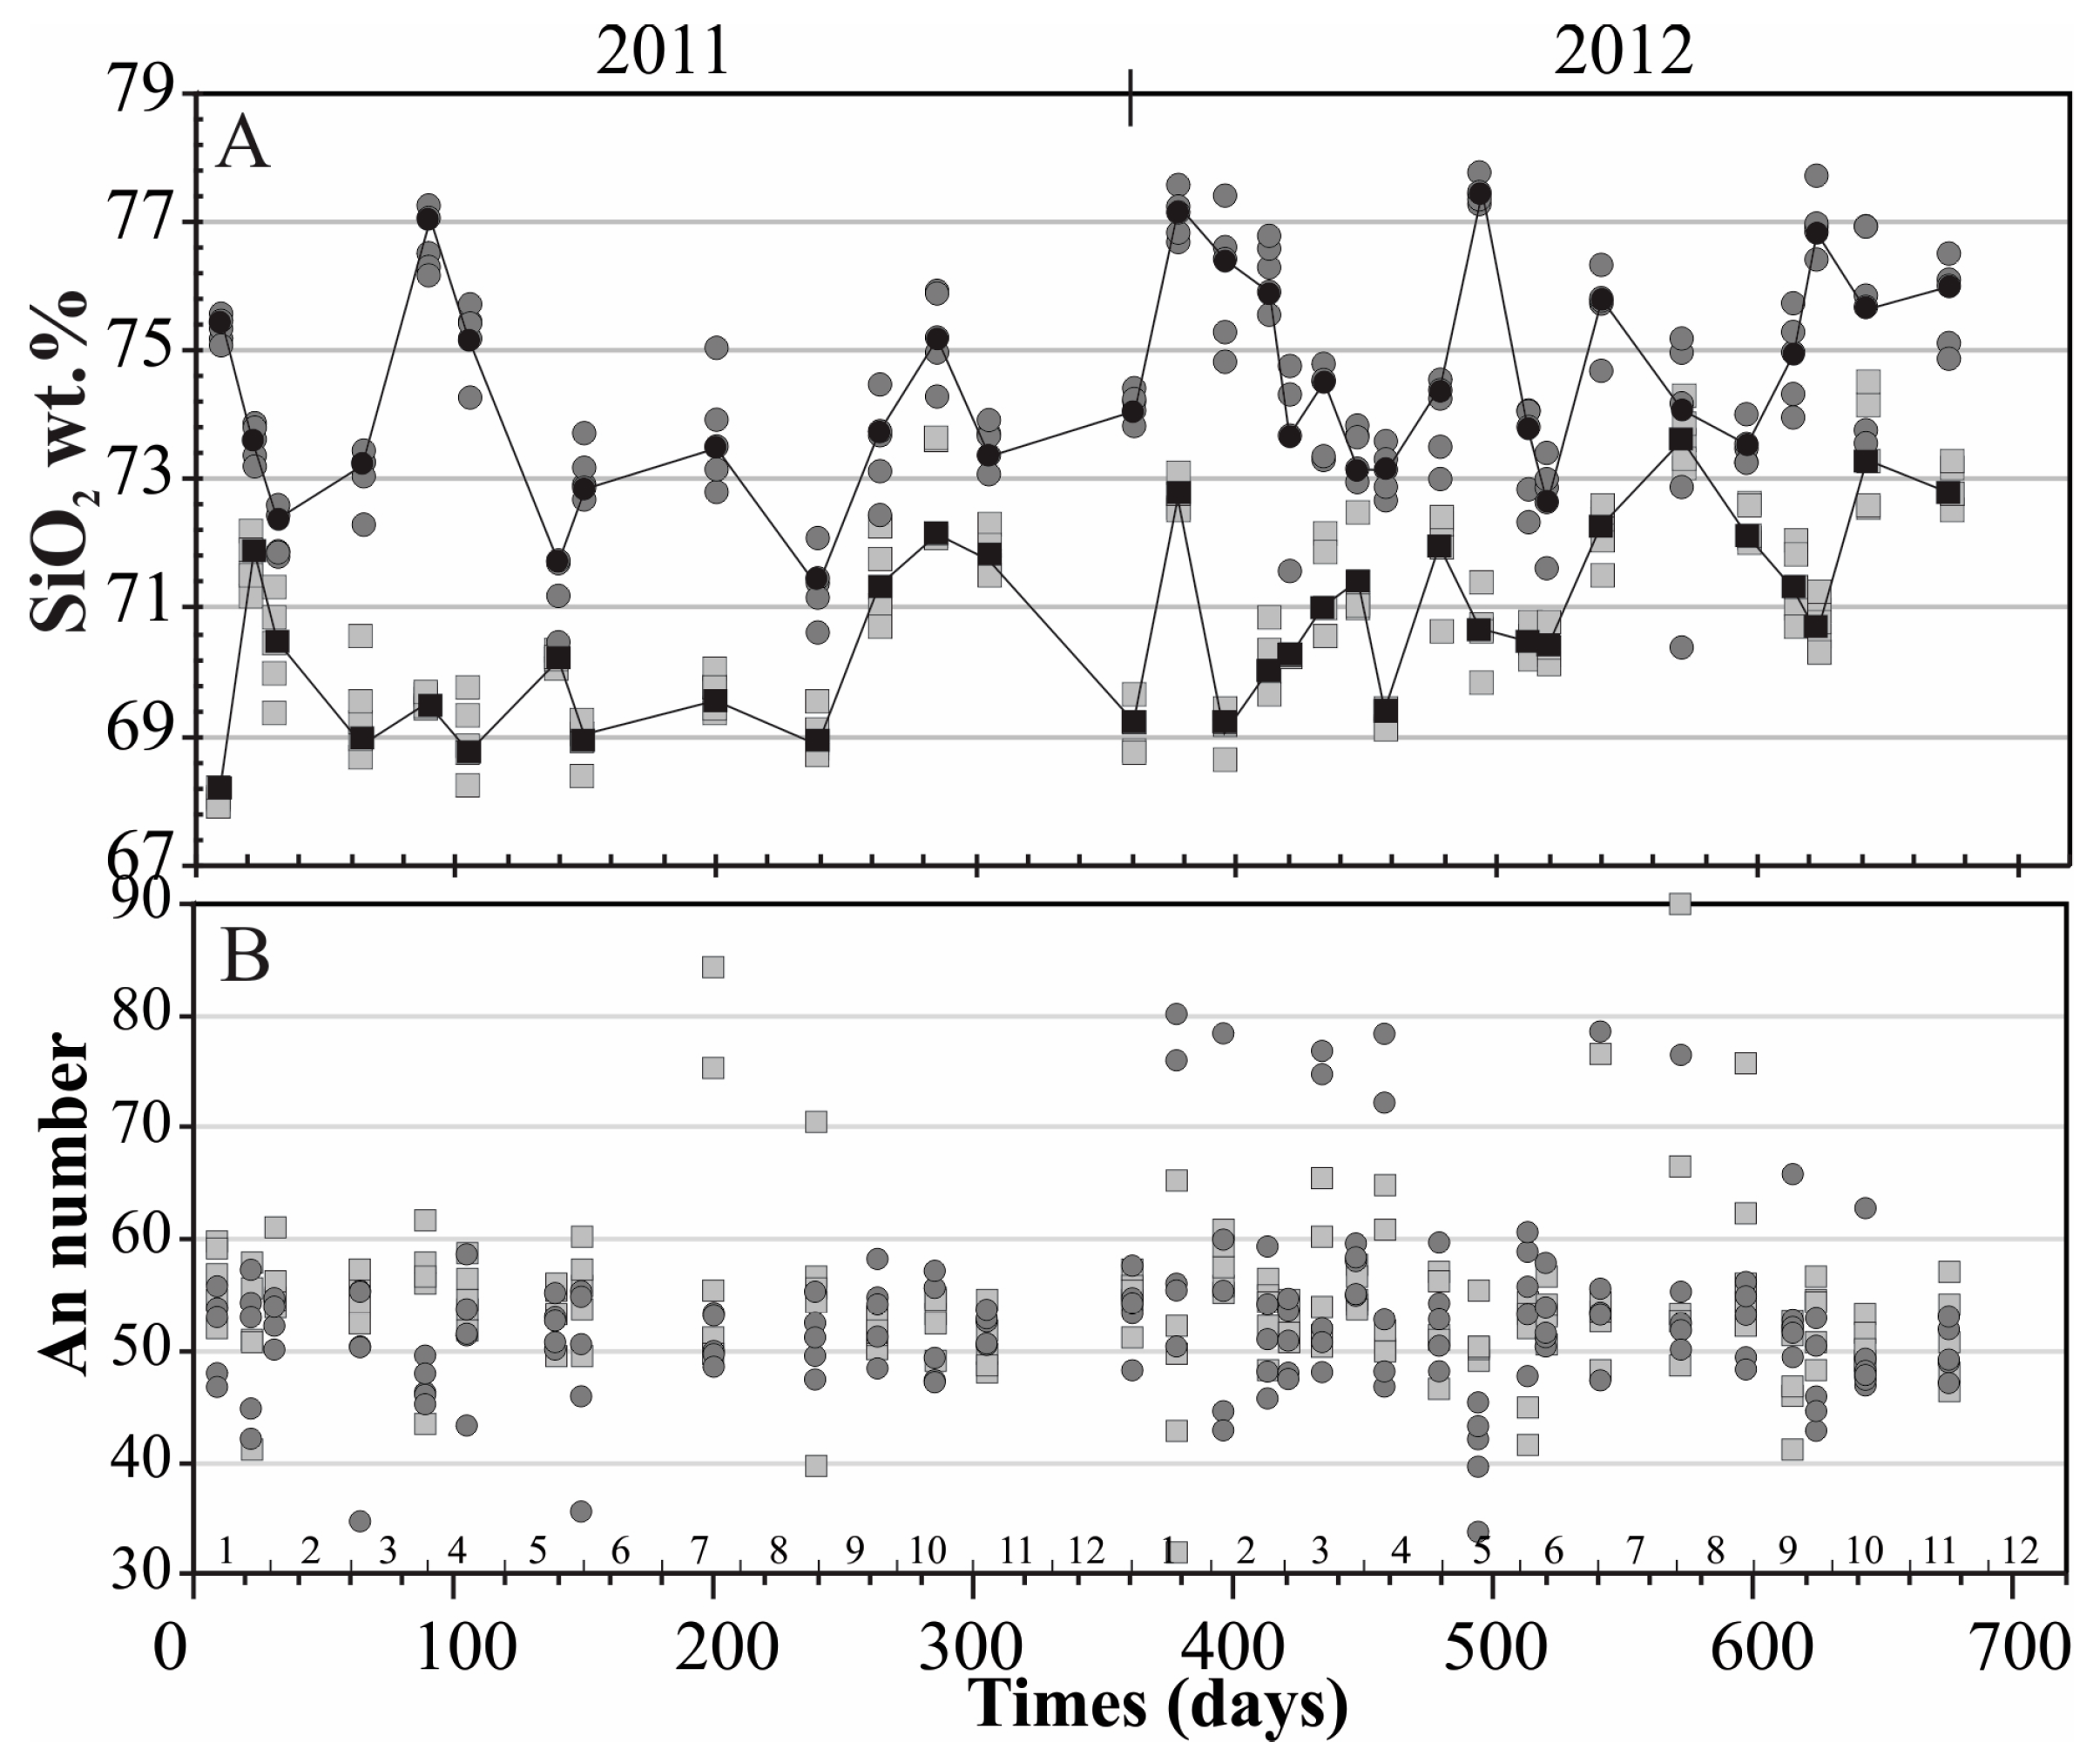
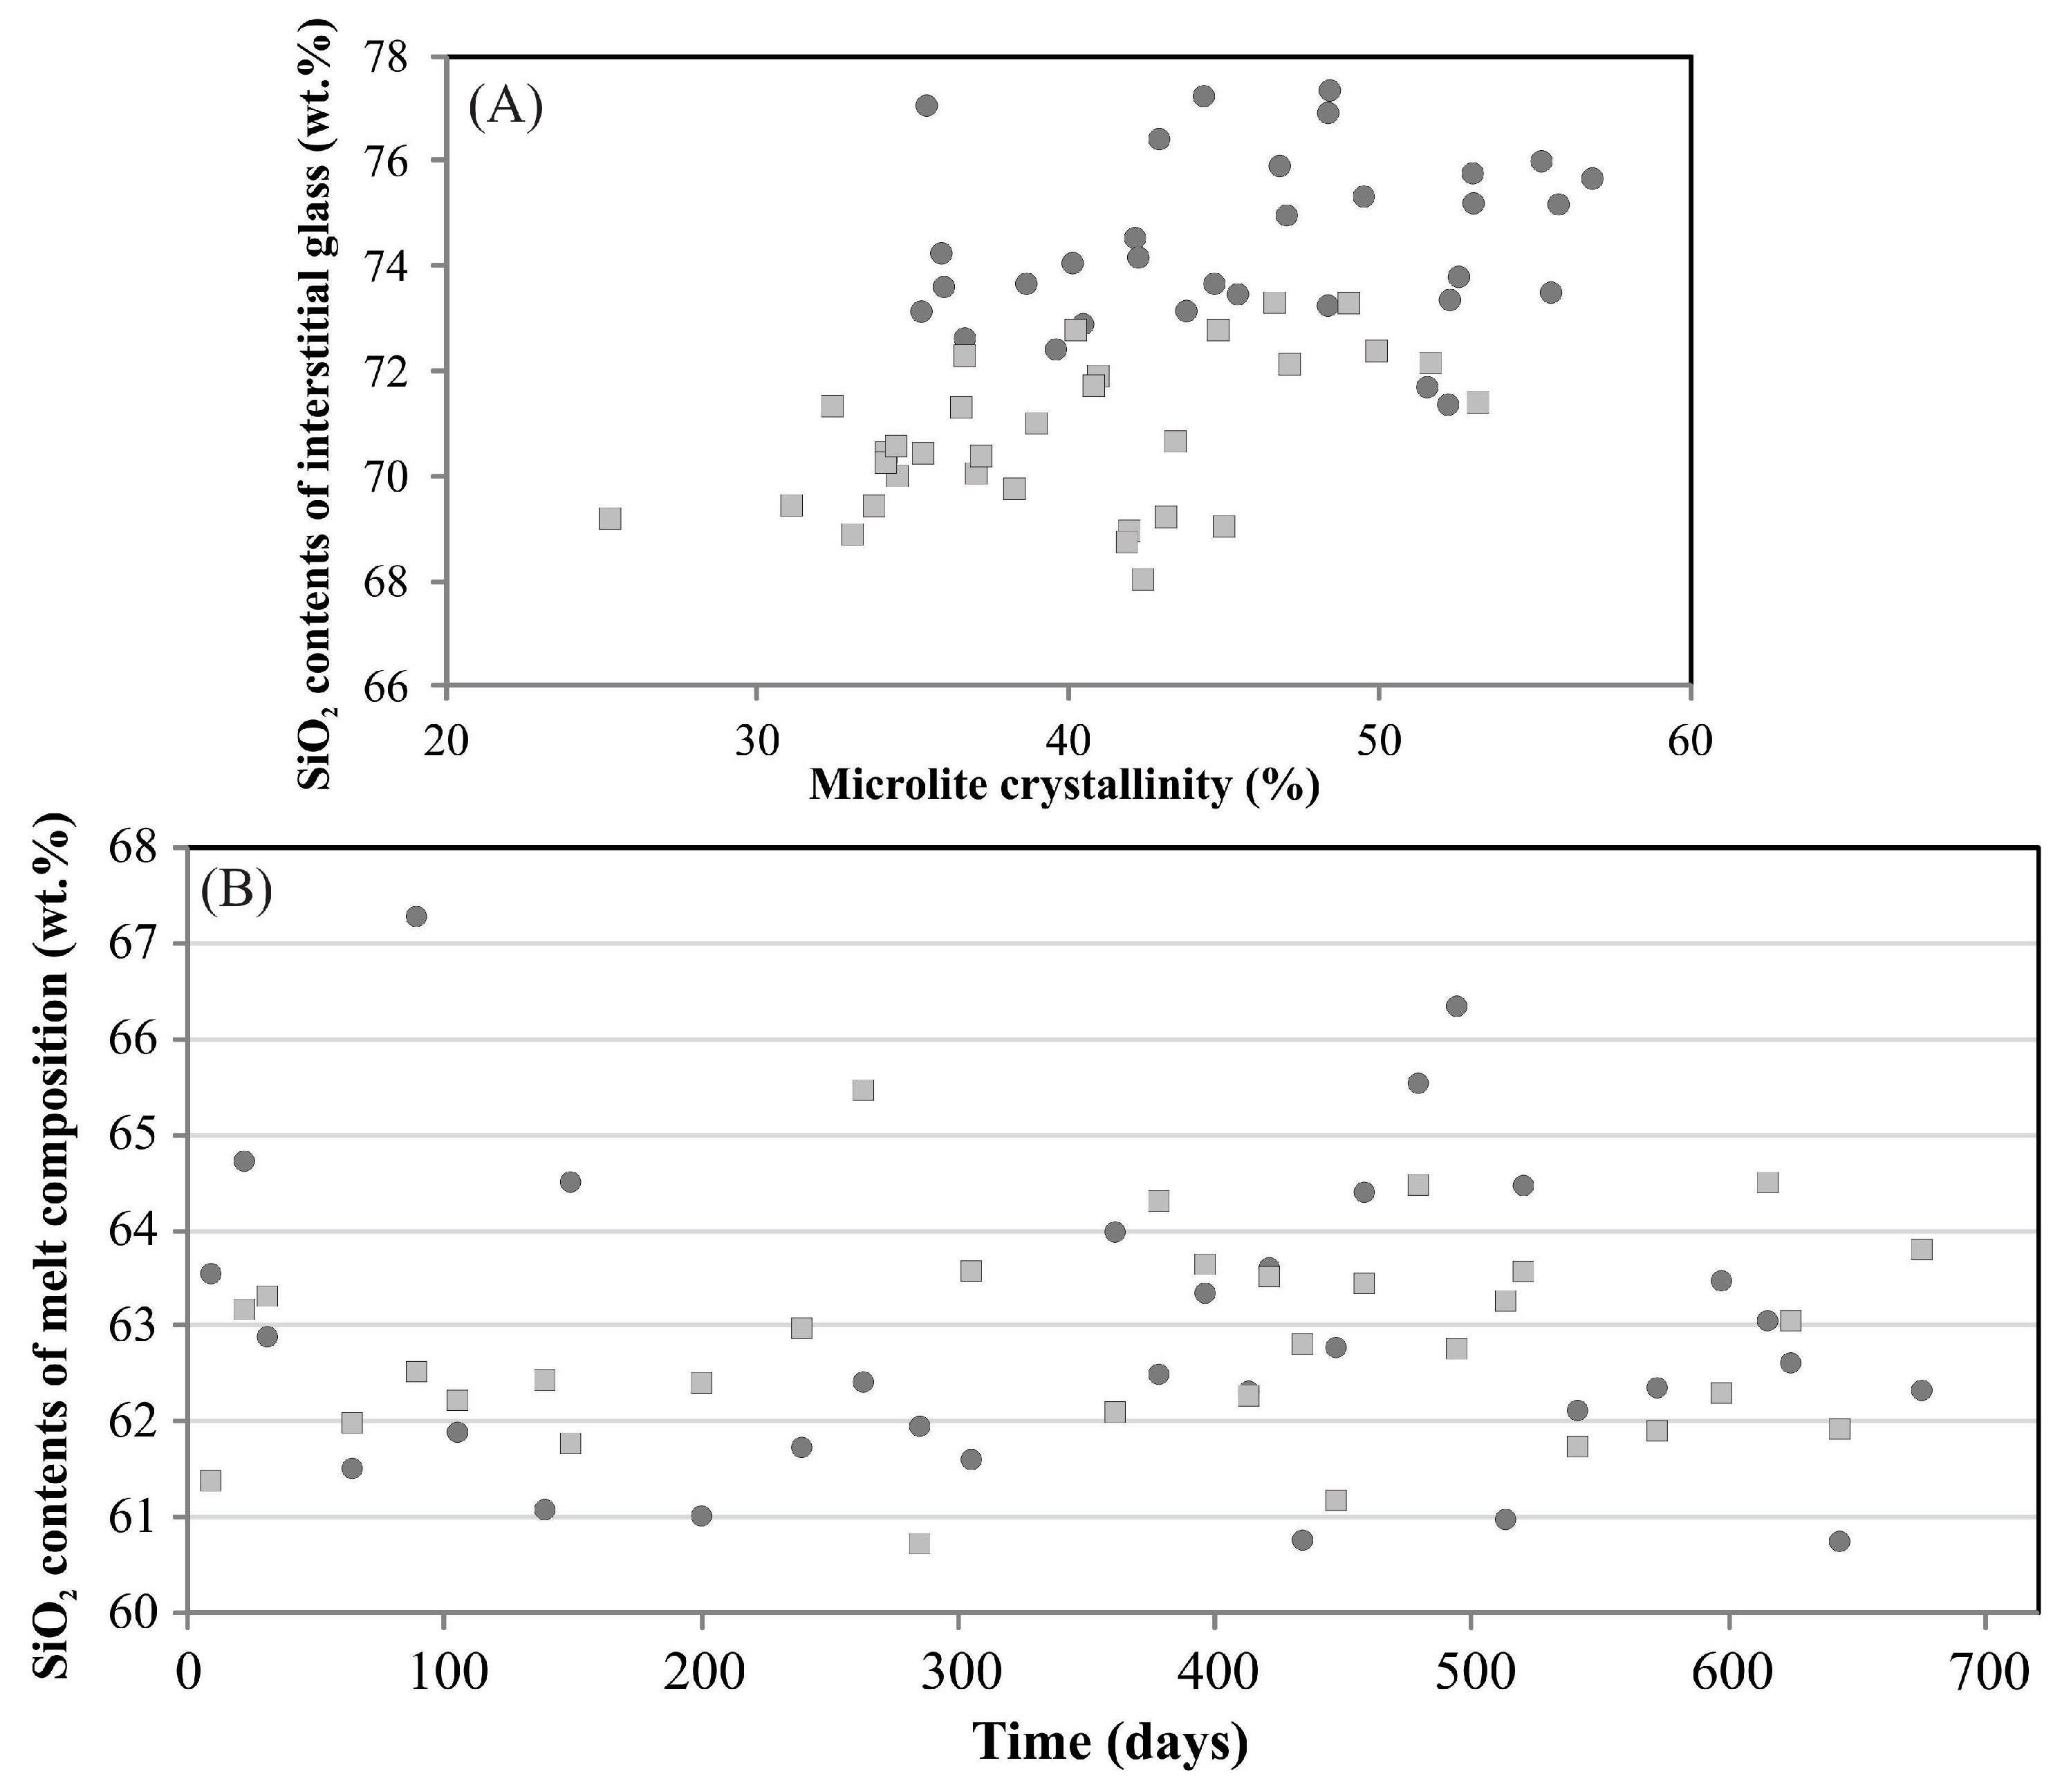
3.2. Geochemical Differences among Ash Components
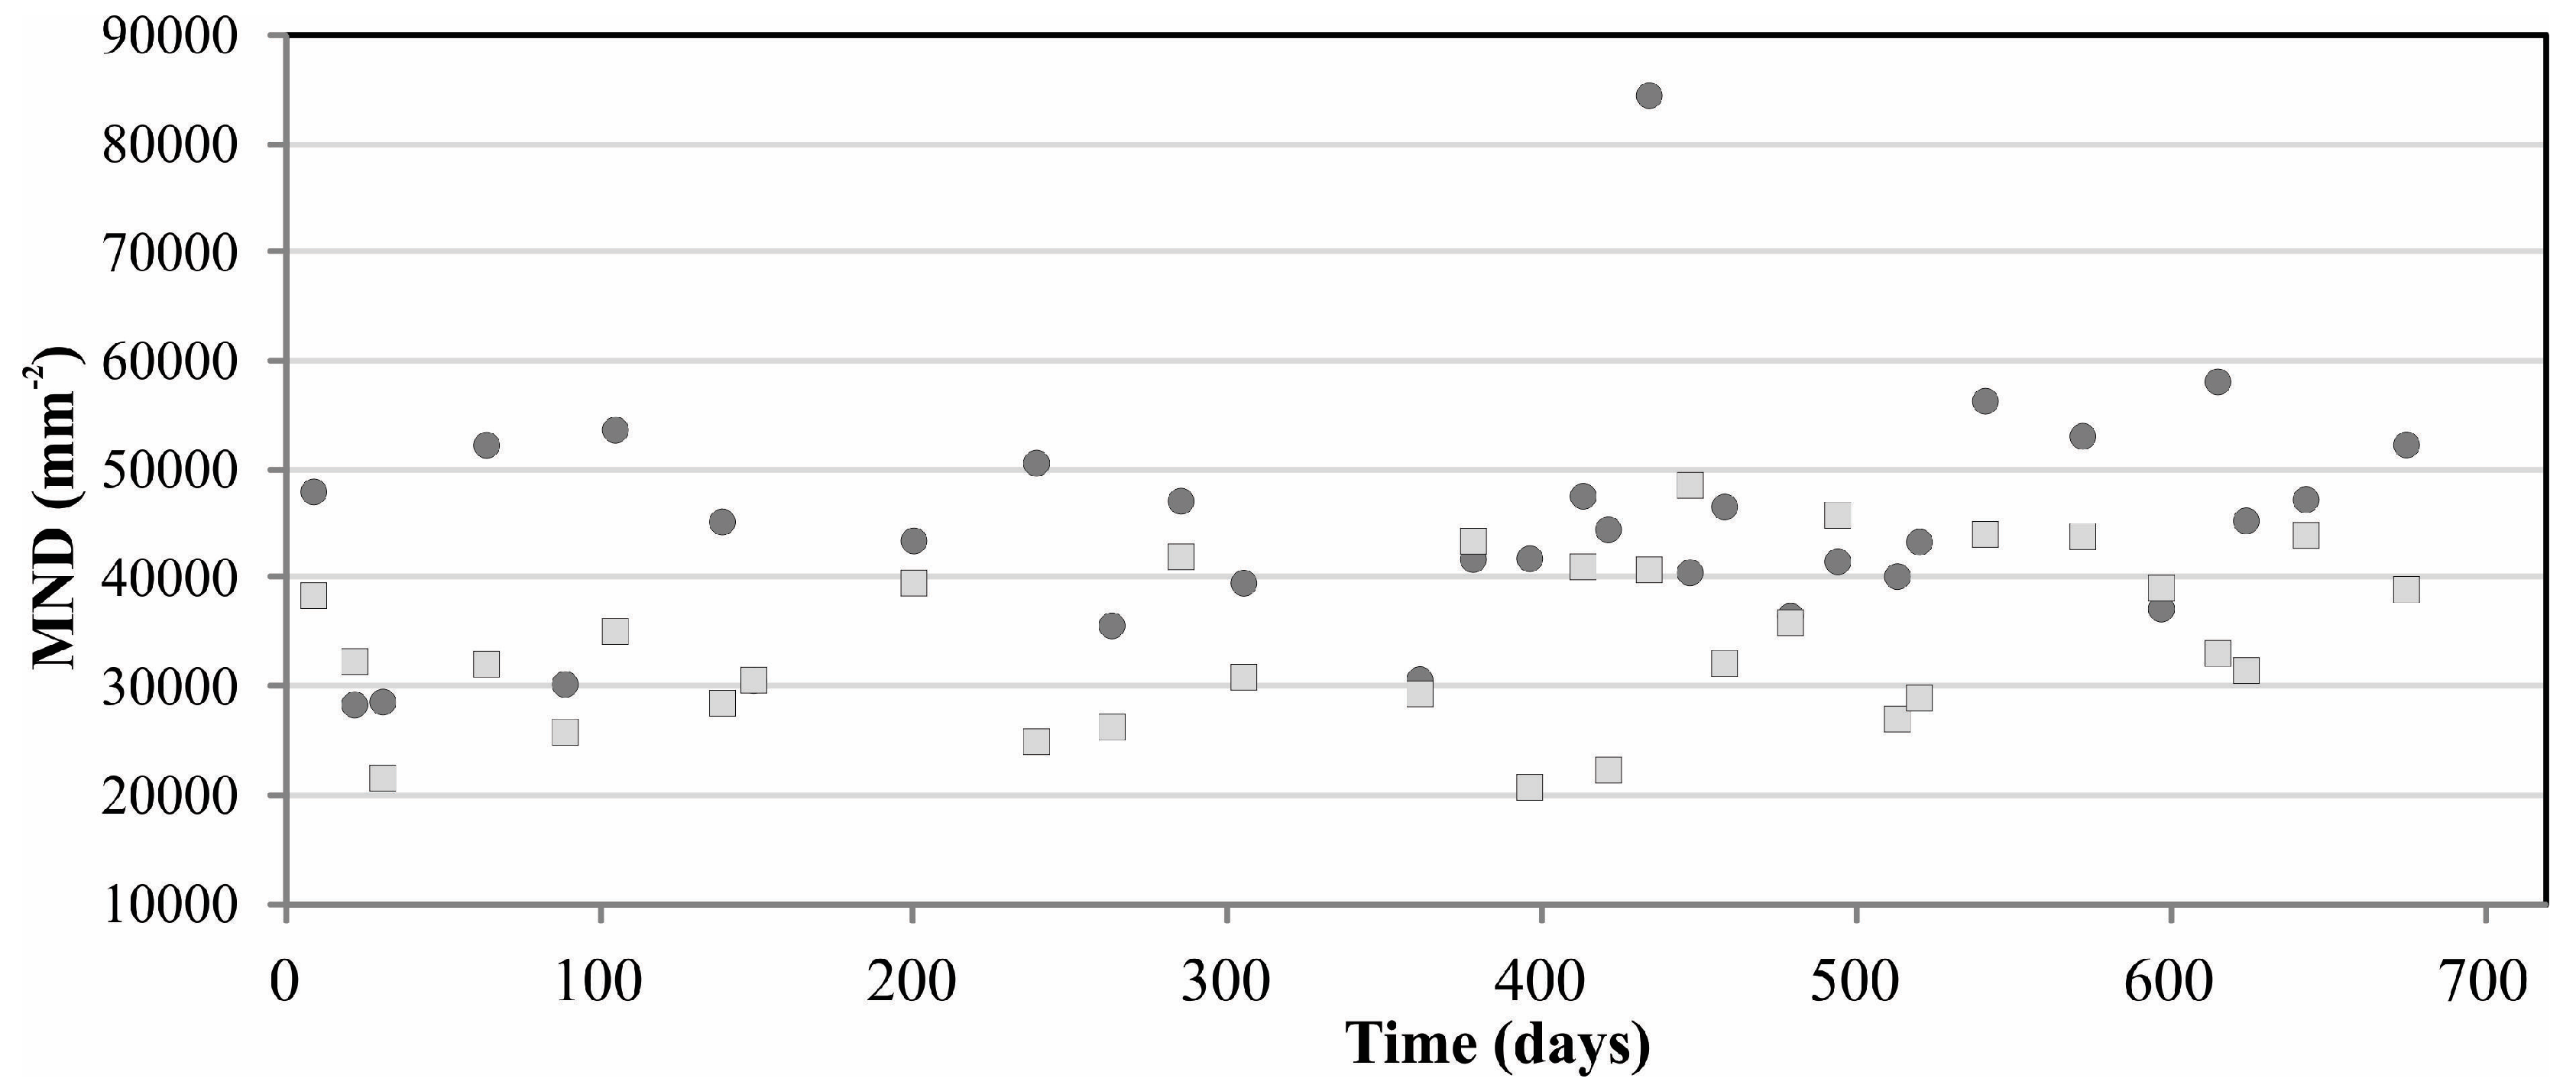
3.3. Plagioclase Microlite Textural Data
4. Discussion
4.1. Melt Composition
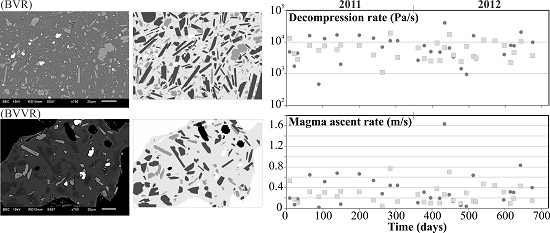
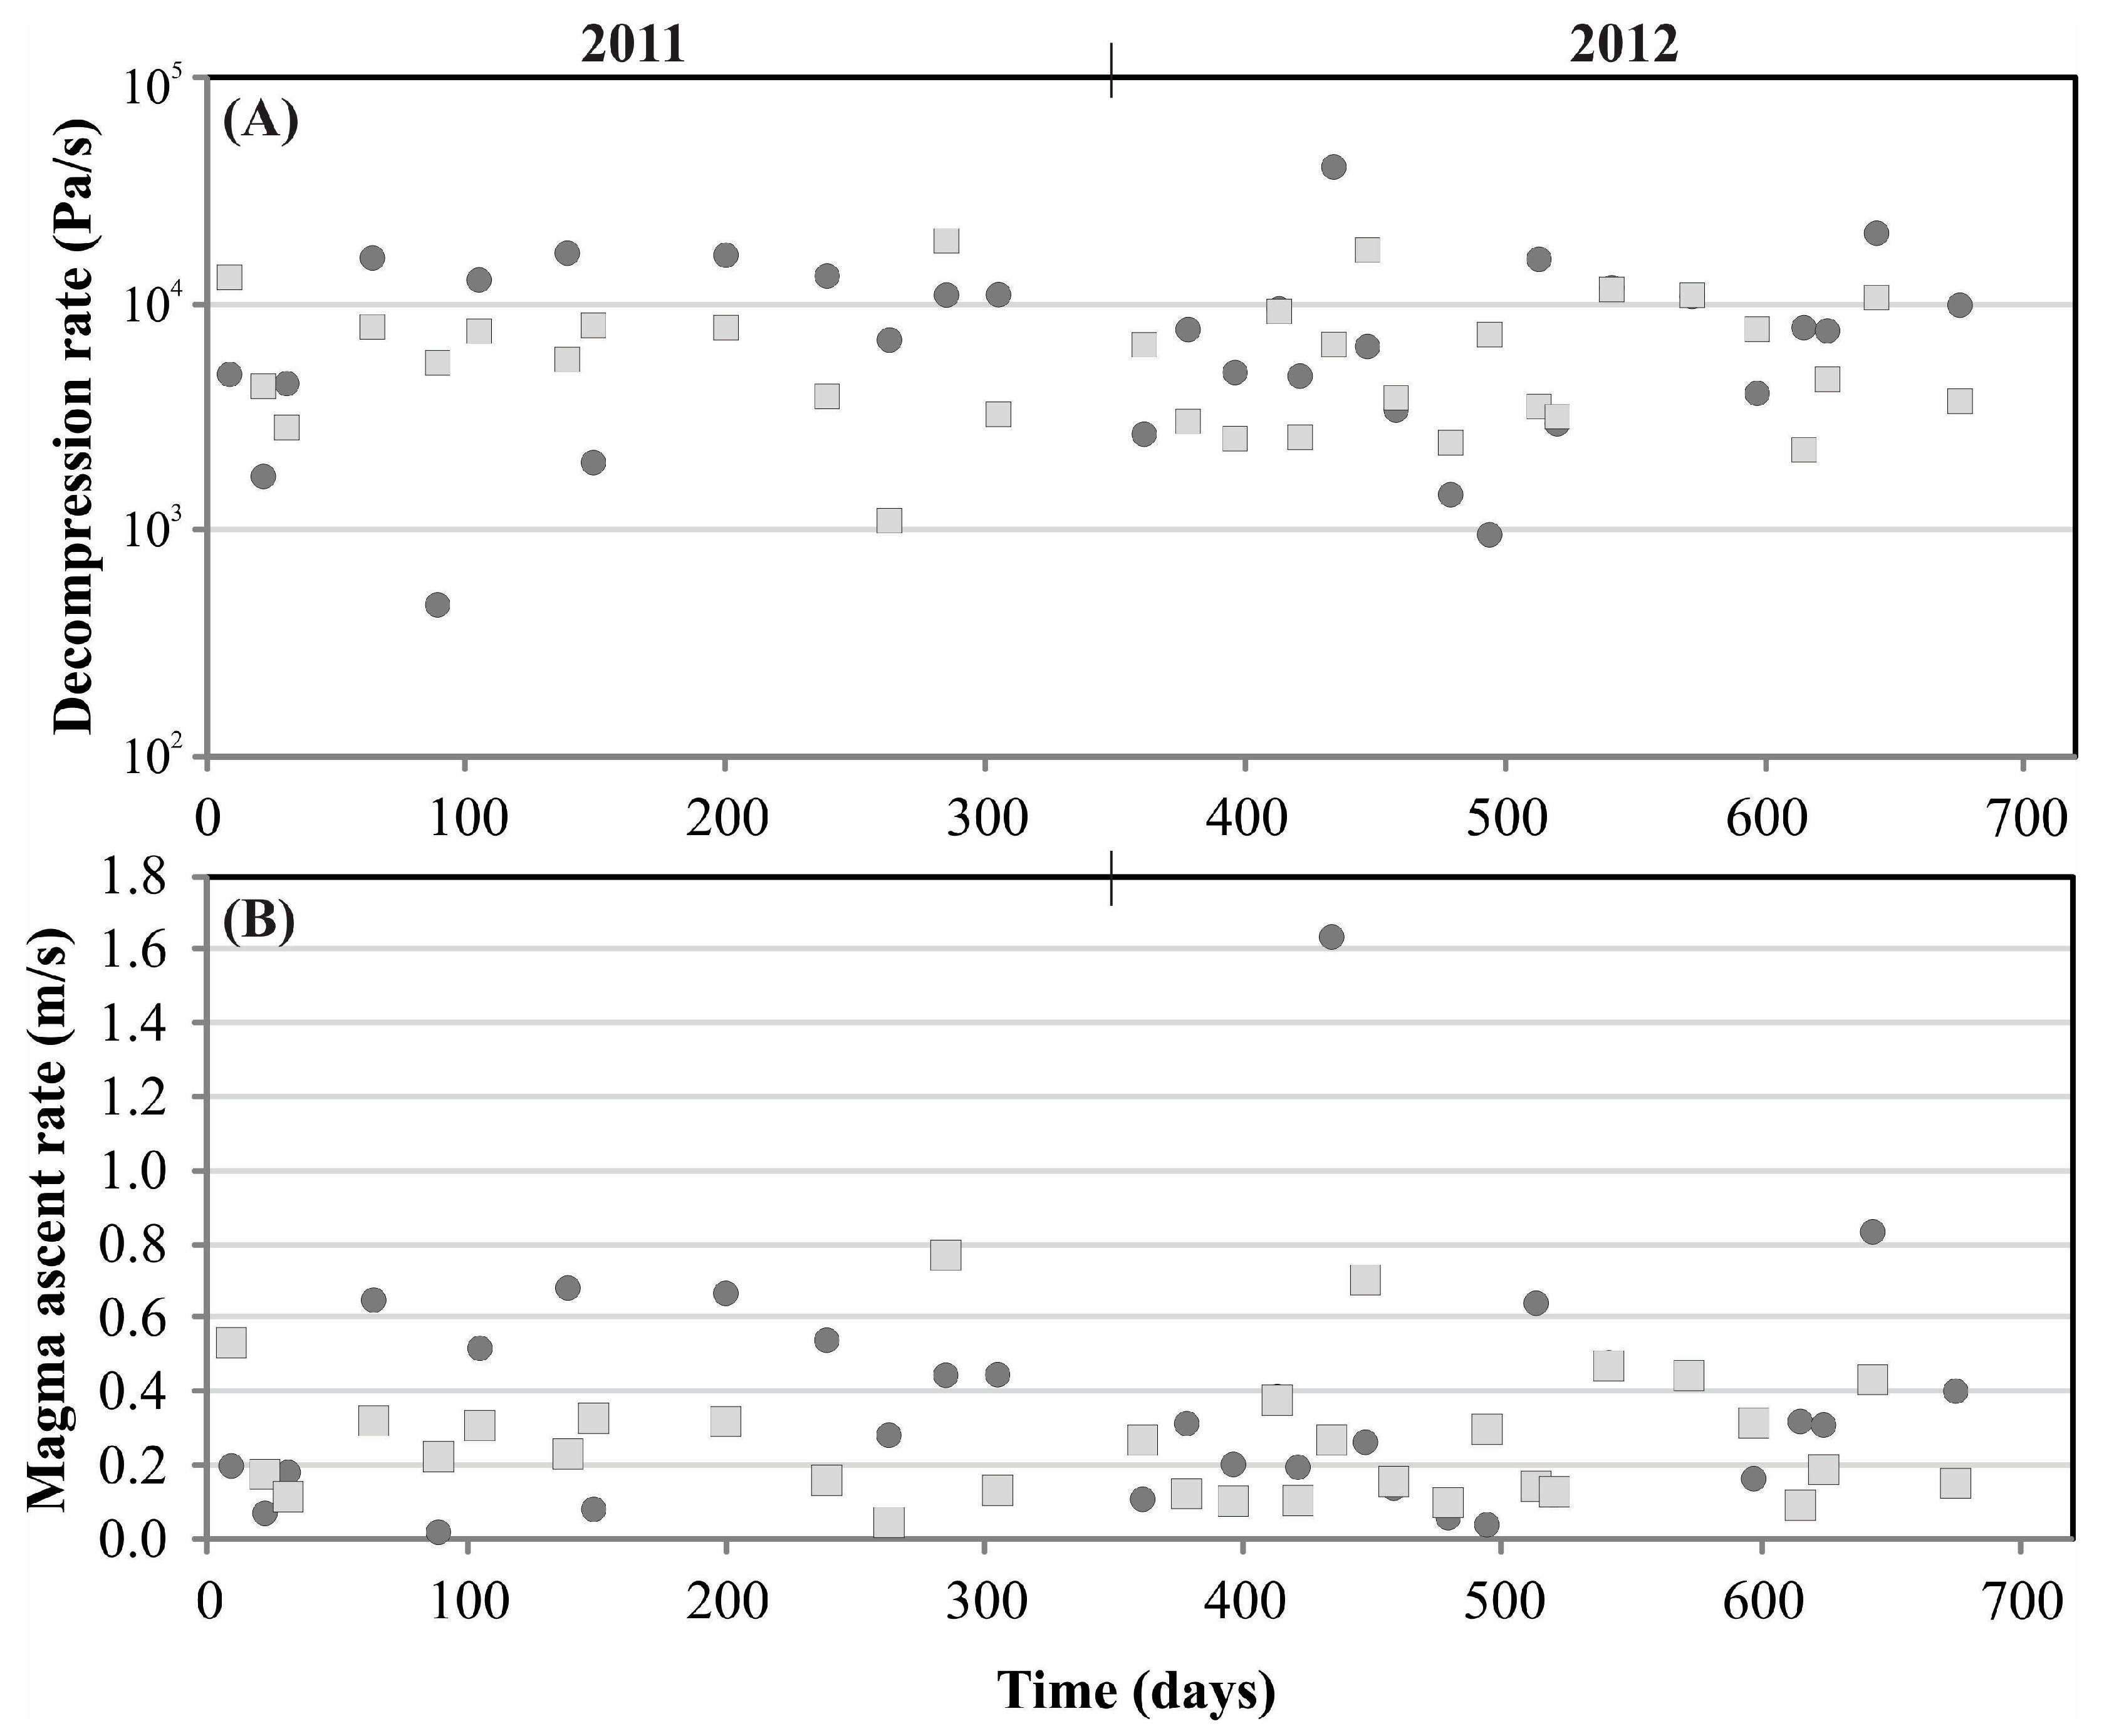
4.2. Magma Ascent Rate
5. Conclusions
Supplementary Materials
Acknowledgments
Author Contributions
Conflicts of Interest
References
- Morrissey, M.; Mastin, L. The Encyclopedia of Volcanoes, 2nd ed.; Elsevier Inc.: Amsterdam, Netherlands, 2000. [Google Scholar]
- Cassidy, M.; Cole, P.D.; Hicks, K.E.; Varley, N.R.; Peters, N.; Lerner, A.H. Rapid and Slow: Varying Magma Ascent Rates as a Mechanism for Vulcanian Explosions. Earth Planet. Sci. Lett. 2015, 420, 73–84. [Google Scholar] [CrossRef]
- Marsh, B.D. Dynamics of Magmatic Systems. Elements 2006, 2, 287–292. [Google Scholar] [CrossRef]
- Blundy, J.; Cashman, K. Petrologic Reconstruction of Magmatic System Variables and Processes. Rev. Mineral. Geochem. 2008, 69, 179–239. [Google Scholar] [CrossRef]
- Rutherford, M. Magma ascent rates. Rev. Mineral. Geochem. 2008, 69, 241–271. [Google Scholar] [CrossRef]
- Sparks, R.S. J.; Tait, S.R.; Yanev, Y. Dense welding caused by volatile resorption. J. Geol. Soc. Lond. 1999, 156, 217–225. [Google Scholar] [CrossRef]
- Tuffen, H.; Dingwell, D.B.; Pinkerton, H. Repeated fracture and healing of silicic magma generate flow banding and earthquakes. Geology 2003, 31, 1089–1092. [Google Scholar] [CrossRef]
- Kennedy, B.; Spieler, O.; Scheu, B.; Kueppers, U.; Taddeucci, J.; Dingwell, D.B. Conduit implosion during Vulcanian eruptions. Geology 2005, 33, 581–584. [Google Scholar] [CrossRef]
- Edmonds, M.; Herd, R.A. A volcanic degassing event at the explosive-effusive transition. Geophys. Res. Lett. 2007, 34, L21310. [Google Scholar] [CrossRef]
- Varley, N.; Arambula-Mendoza, R.; Reyes-Davila, G.; Sanderson, R.; Stevenson, J. Generation of Vulcanian activity and long-period seismicity at Volcán de Colima, Mexico. J. Volcanol. Geotherm. Res. 2010, 198, 45–46. [Google Scholar] [CrossRef]
- Druitt, T.H.; Costa, F.; Deloule, E.; Dungan, M.; Scaillet, B. Decadal to monthly timescales of magma transfer and reservoir growth at a Caldera Volcano. Nature 2012, 482, 77–80. [Google Scholar] [CrossRef] [PubMed] [Green Version]
- Matsumoto, A.; Nakagawa, M.; Aiyasaka, M.; Iguchi, M. Temporal variations of the petrological features of the juvenile materials during 2006 to 2010 from Showa Crater, Sakurajima Volcano, Kyushu, Japan. Bull. Volcanol. Soc. Jpn. 2013, 58, 191–212. [Google Scholar]
- Miwa, T.; Geshi, N.; Shinohara, H. Temporal variation in volcanic ash texture during a Vulcanian eruption at the Sakurajima Volcano, Japan. J. Volcanol. Geotherm. Res. 2013, 260, 80–89. [Google Scholar] [CrossRef]
- Sakakibara, M.; Uenosono, R.; Takakura, S. Temporal cycles in glass composition within volcanic ash from Showa Crater, Sakurajima Volcano, Southern Kyushu, Japan. In Proceedings of the 2013 Abstract IAVCEI, Kagoshima, Japan, 20–24 July 2013.
- Suzuki, Y.; Yasuda, A.; Hokanishi, N.; Kaneko, T.; Nakada, S.; Fujii, T. Syneruptive deep magma transfer and shallow magma remobilization during the 2011 eruption of Shinmoe-Dake, Japan—Constraints from melt inclusions and phase equilibria experiments. J. Volcanol. Geotherm. Res. 2013, 257, 184–204. [Google Scholar] [CrossRef]
- Wright, H.M.N.; Cashman, K.V.; Mothes, P.A.; Hall, M.L.; Ruiz, A.G.; le Pennec, J.-L. Estimating rates of decompression from textures of erupted ash particles produced by 1999–2006 eruptions of Tungurahua Volcano, Ecuador. Geology 2012, 40, 619–622. [Google Scholar] [CrossRef]
- Hammer, J.E.; Cashman, K.V.; Hoblitt, R.P.; Newman, S. Degassing and microlite crystallization during pre-climactic events of the 1991 eruption of Mt. Pinatubo, Philippines. Bull. Volcanol. 1999, 60, 355–380. [Google Scholar] [CrossRef]
- Toramaru, A.; Noguchi, S.; Oyoshihara, S.; Tsune, A. MND(Microlite Number Density) water exsolution rate meter. J. Volcanol. Geotherm. Res. 2008, 175, 156–167. [Google Scholar] [CrossRef]
- Miwa, T.; Toramaru, A.; Iguchi, M. Correlations of volcanic ash texture with explosion earthquakes from Vulcanian eruptions at Sakurajima Volcano, Japan. J. Volcanol. Geotherm. Res. 2009, 184, 473–486. [Google Scholar] [CrossRef]
- Moriizumi, M.; Nakashima, S.; Okumura, S.; Yamanoi, Y. Color-change processes of a plinian pumice and experimental constraints of color-change kinetics in air of an obsidian. Bull. Volcanol. 2008, 71, 1–13. [Google Scholar] [CrossRef]
- Miwa, T.; Geshi, N. Decompression rate of magma at fragmentation: Inference from broken crystals in pumice of vulcanian eruption. J. Volcanol. Geotherm. Res. 2012, 227–228, 76–84. [Google Scholar] [CrossRef]
- Mori, T.; Shinohara, H.; Kazahaya, K.; Hirabayashi, J.I.; Matsushima, T.; Mori, T.; Ohwada, M.; Odai, M.; Iino, H.; Miyashita, M. Time-averaged SO2 fluxes of subduction-zone volcanoes: Example of a 32-Year exhaustive survey for Japanese volcanoes. J. Geophys. Res. Atmos. 2013, 118, 8662–8674. [Google Scholar] [CrossRef]
- Miyagi, I.; Shinohara, H.; Itoh, J. Variations of color and leachate contents of volcanic ashes from Sakurajima Volcano, Japan. Bull. Volcanol. Soc. Jpn. 2013, 58, 213–226. [Google Scholar]
- Higgins, M.D. Measurement of crystal size distributions. Am. Mineral. 2000, 85, 1105–1116. [Google Scholar] [CrossRef]
- Couch, S.; Sparks, R.S.J.; Carroll, M.R. The kinetics of degassing-induced crystallization at Soufriere Hills Volcano, Montserrat. J. Petrol. 2003, 44, 1477–1502. [Google Scholar] [CrossRef]
- Okumura, S. The H2O content of andesitic magmas from three volcanoes in Japan, inferred from the infrared analysis of clinopyroxene. Eur. J. Mineral. 2011, 23, 771–778. [Google Scholar] [CrossRef]
- Shea, T.; Hammer, J.E. Kinetics of cooling- and decompression-induced crystallization in hydrous mafic-intermediate magmas. J. Volcanol. Geotherm. Res. 2013, 260, 127–145. [Google Scholar] [CrossRef]


| No. | Eruption Date | Collection Point (Distance and Direction from Crater) |
|---|---|---|
| 1 | 9 January 2011 | 6.7 km; SE |
| 2 | 22 January 2011 | 6.7 km; SE |
| 3 | 31 January 2011 | 6.7 km; SE |
| 4 | 15 March 2011 | 6.7 km; SE |
| 5 | 9 April 2011 | 6.7 km; SE |
| 6 | 25 April 2011 | 5.7 km; SE |
| 7 | 29 May 2011 | 2.8 km; S |
| 8 | 8 June 2011 | 5.7 km; SE |
| 9 | 29 July 2011 | 5.7 km; SE |
| 10 | 6 September 2011 | 5.7 km; SE |
| 11 | 30 September 2011 | 5.7 km; SE |
| 12 | 25 October 2011 | 5.7 km; SE |
| 13 | 14 November 2011 | 5.7 km; SE |
| 14 | 6 January 2012 | 2.8 km; S |
| 15 | 23 January 2012 | 5.7 km; SE |
| 16 | 10 February 2012 | 5.7 km; SE |
| 17 | 27 February 2012 | 5.7 km; SE |
| 18 | 6 March 2012 | 5.7 km; SE |
| 19 | 19 March 2012 | 5.7 km; SE |
| 20 | 1 April 2012 | 2.8 km; S |
| 21 | 12 April 2012 | 2.8 km; S |
| 22 | 3 May 2012 | 10 km; SSE |
| 23 | 18 May 2012 | 10 km; SSE |
| 24 | 12 June 2012 | 11.7 km; SW * |
| 25 | 19 June 2012 | 11.7 km; SW * |
| 26 | 4 July 2012 | 11.7 km; SW * |
| 27 | 4 August 2012 | 11.7 km; SW * |
| 28 | 29 August 2012 | 11.7 km; SW * |
| 29 | 16 September 2012 | 11.7 km; SW * |
| 30 | 26 September 2012 | 11.7 km; SW * |
| 31 | 15 October 2012 | 11.7 km; SW * |
| 32 | 16 November 2012 | 11.7 km; SW * |
| Year | Type | Decompression Rate (Pa/s) | Magma Ascent Rate (m/s) | |
|---|---|---|---|---|
| 2011 | BVVR | max | 18879 | 0.77 |
| min | 1100 | 0.04 | ||
| BVR | max | 16689 | 0.68 | |
| min | 468 | 0.02 | ||
| 2012 | BVVR | max | 17227 | 0.70 |
| min | 2257 | 0.09 | ||
| BVR | max | 40019 | 1.63 | |
| min | 954 | 0.04 | ||
| -- | Ascent Rate (m/s) | Method and Reference |
|---|---|---|
| Sakurajima (explosive) | 1.1 × 10⁻¹–3.5 × 10⁻¹ | MND water exsolution rate meter [19] |
| Colima (effusive/explosive) | 1 × 10⁻⁴ dense magma; 6.8 × 10⁻² vesicular magma | MND water exsolution rate meter [2] |
| Sakurajima (explosive 2011∓2012) | 2.7 × 10⁻¹ vesicular magma; 3.7 × 10⁻¹ dense magma | MND water exsolution rate meter [18]; this study |
© 2016 by the authors; licensee MDPI, Basel, Switzerland. This article is an open access article distributed under the terms and conditions of the Creative Commons by Attribution (CC-BY) license (http://creativecommons.org/licenses/by/4.0/).
Share and Cite
Kurniawan, I.A.; Sakakibara, M.; Suparka, E. Petrological Monitoring of the AD 2011–2012 Volcanic Ash from Sakurajima Volcano, Southern Kyushu, Japan. Geosciences 2016, 6, 12. https://0-doi-org.brum.beds.ac.uk/10.3390/geosciences6010012
Kurniawan IA, Sakakibara M, Suparka E. Petrological Monitoring of the AD 2011–2012 Volcanic Ash from Sakurajima Volcano, Southern Kyushu, Japan. Geosciences. 2016; 6(1):12. https://0-doi-org.brum.beds.ac.uk/10.3390/geosciences6010012
Chicago/Turabian StyleKurniawan, Idham Andri, Masayuki Sakakibara, and Emmy Suparka. 2016. "Petrological Monitoring of the AD 2011–2012 Volcanic Ash from Sakurajima Volcano, Southern Kyushu, Japan" Geosciences 6, no. 1: 12. https://0-doi-org.brum.beds.ac.uk/10.3390/geosciences6010012