An Analysis Applying InSAR of Subsidence Caused by Nearby Mining-Induced Earthquakes


The Department of Mining Surveying and Environmental Engineering, AGH University of Science and Technology, 30-059 Kraków, Poland
*
Author to whom correspondence should be addressed.
Geosciences 2019, 9(12), 490; https://0-doi-org.brum.beds.ac.uk/10.3390/geosciences9120490
Submission received: 16 October 2019
/
Revised: 17 November 2019
/
Accepted: 18 November 2019
/
Published: 21 November 2019
(This article belongs to the Section Geophysics)
Abstract
:Earthquake occurrence is usually unpredictable apart from sites in the vicinity of volcanoes. It is not easy to measure displacements caused by seismic phenomena using classical geodetic methods, which are based on point survey. Therefore, the surveying of ground movements caused by seismic events should be carried out continuously. Nowadays, remote sensing data and InSAR are often applied to monitor ground displacements in areas affected by seismicity. The effects of severe nearby mining-induced earthquakes have been discussed in the paper. The earthquakes occurred in 2017 and had a magnitude of 4.7 and 4.8. The distance between the epicenters of the mining-induced earthquakes was around 1.6 km. The aim of the investigation has been to analyze the spatio-temporal distribution of ground movements caused by the two tremors using the InSAR technique. Superposition of surface displacement has been studied in time and space. The main scientific aim has been to prove that in the areas where high-energy tremors occur, ground movements overlap. Due to proximity between the epicenters, the mining-induced earthquakes caused the formation of a large subsidence trough with the dimension of approximately 1.2 km × 4.2 km and total subsidence of ca. 116 mm. Two-time phases of subsidence were determined with temporal overlapping. The subsidence analysis has enhanced the cognition of the impact of mining-induced seismicity on the kinematics of surface changes. Moreover, the present work supports the thesis that InSAR is a valuable and adequately accurate technique to monitor ground displacements caused by mining induced earthquakes.
1. Introduction
In the period between 2009 and 2018, 623 seismic events with a magnitude greater than or equal to 3.0 were recorded in Poland. Over 90% of these tremors occurred in mining areas of copper ore and hard coal, with 82 tremors exceeding the magnitude of 4.0 [1,2]. Seismic tremors with a magnitude greater than 4.0 could be compared to classic earthquakes. Although the occurrence of these tremors does not directly threaten the lives of people, they can cause serious damage to the infrastructure [2,3]. The anthropogenic origin of tremors, which occur in areas of underground mineral extraction, limits their duration. Even though this is favorable, as far as the threatened technical infrastructure and buildings on the surface are concerned, a question has to be posed about other consequences which may be the outcome of such phenomena [4]. Mining-induced earthquakes cause faster movement of the rock mass in the hypocenter and accelerated compaction of rock strata in these areas. Surface displacements caused by mining-induced earthquakes may lead to incorrect conclusions on other, more interpretable phenomena, e.g., subsidence connected with underground mineral extraction, damaged buildings, damaged roads and highways or railroads, instability of slopes, and geodetic benchmarks, etc.
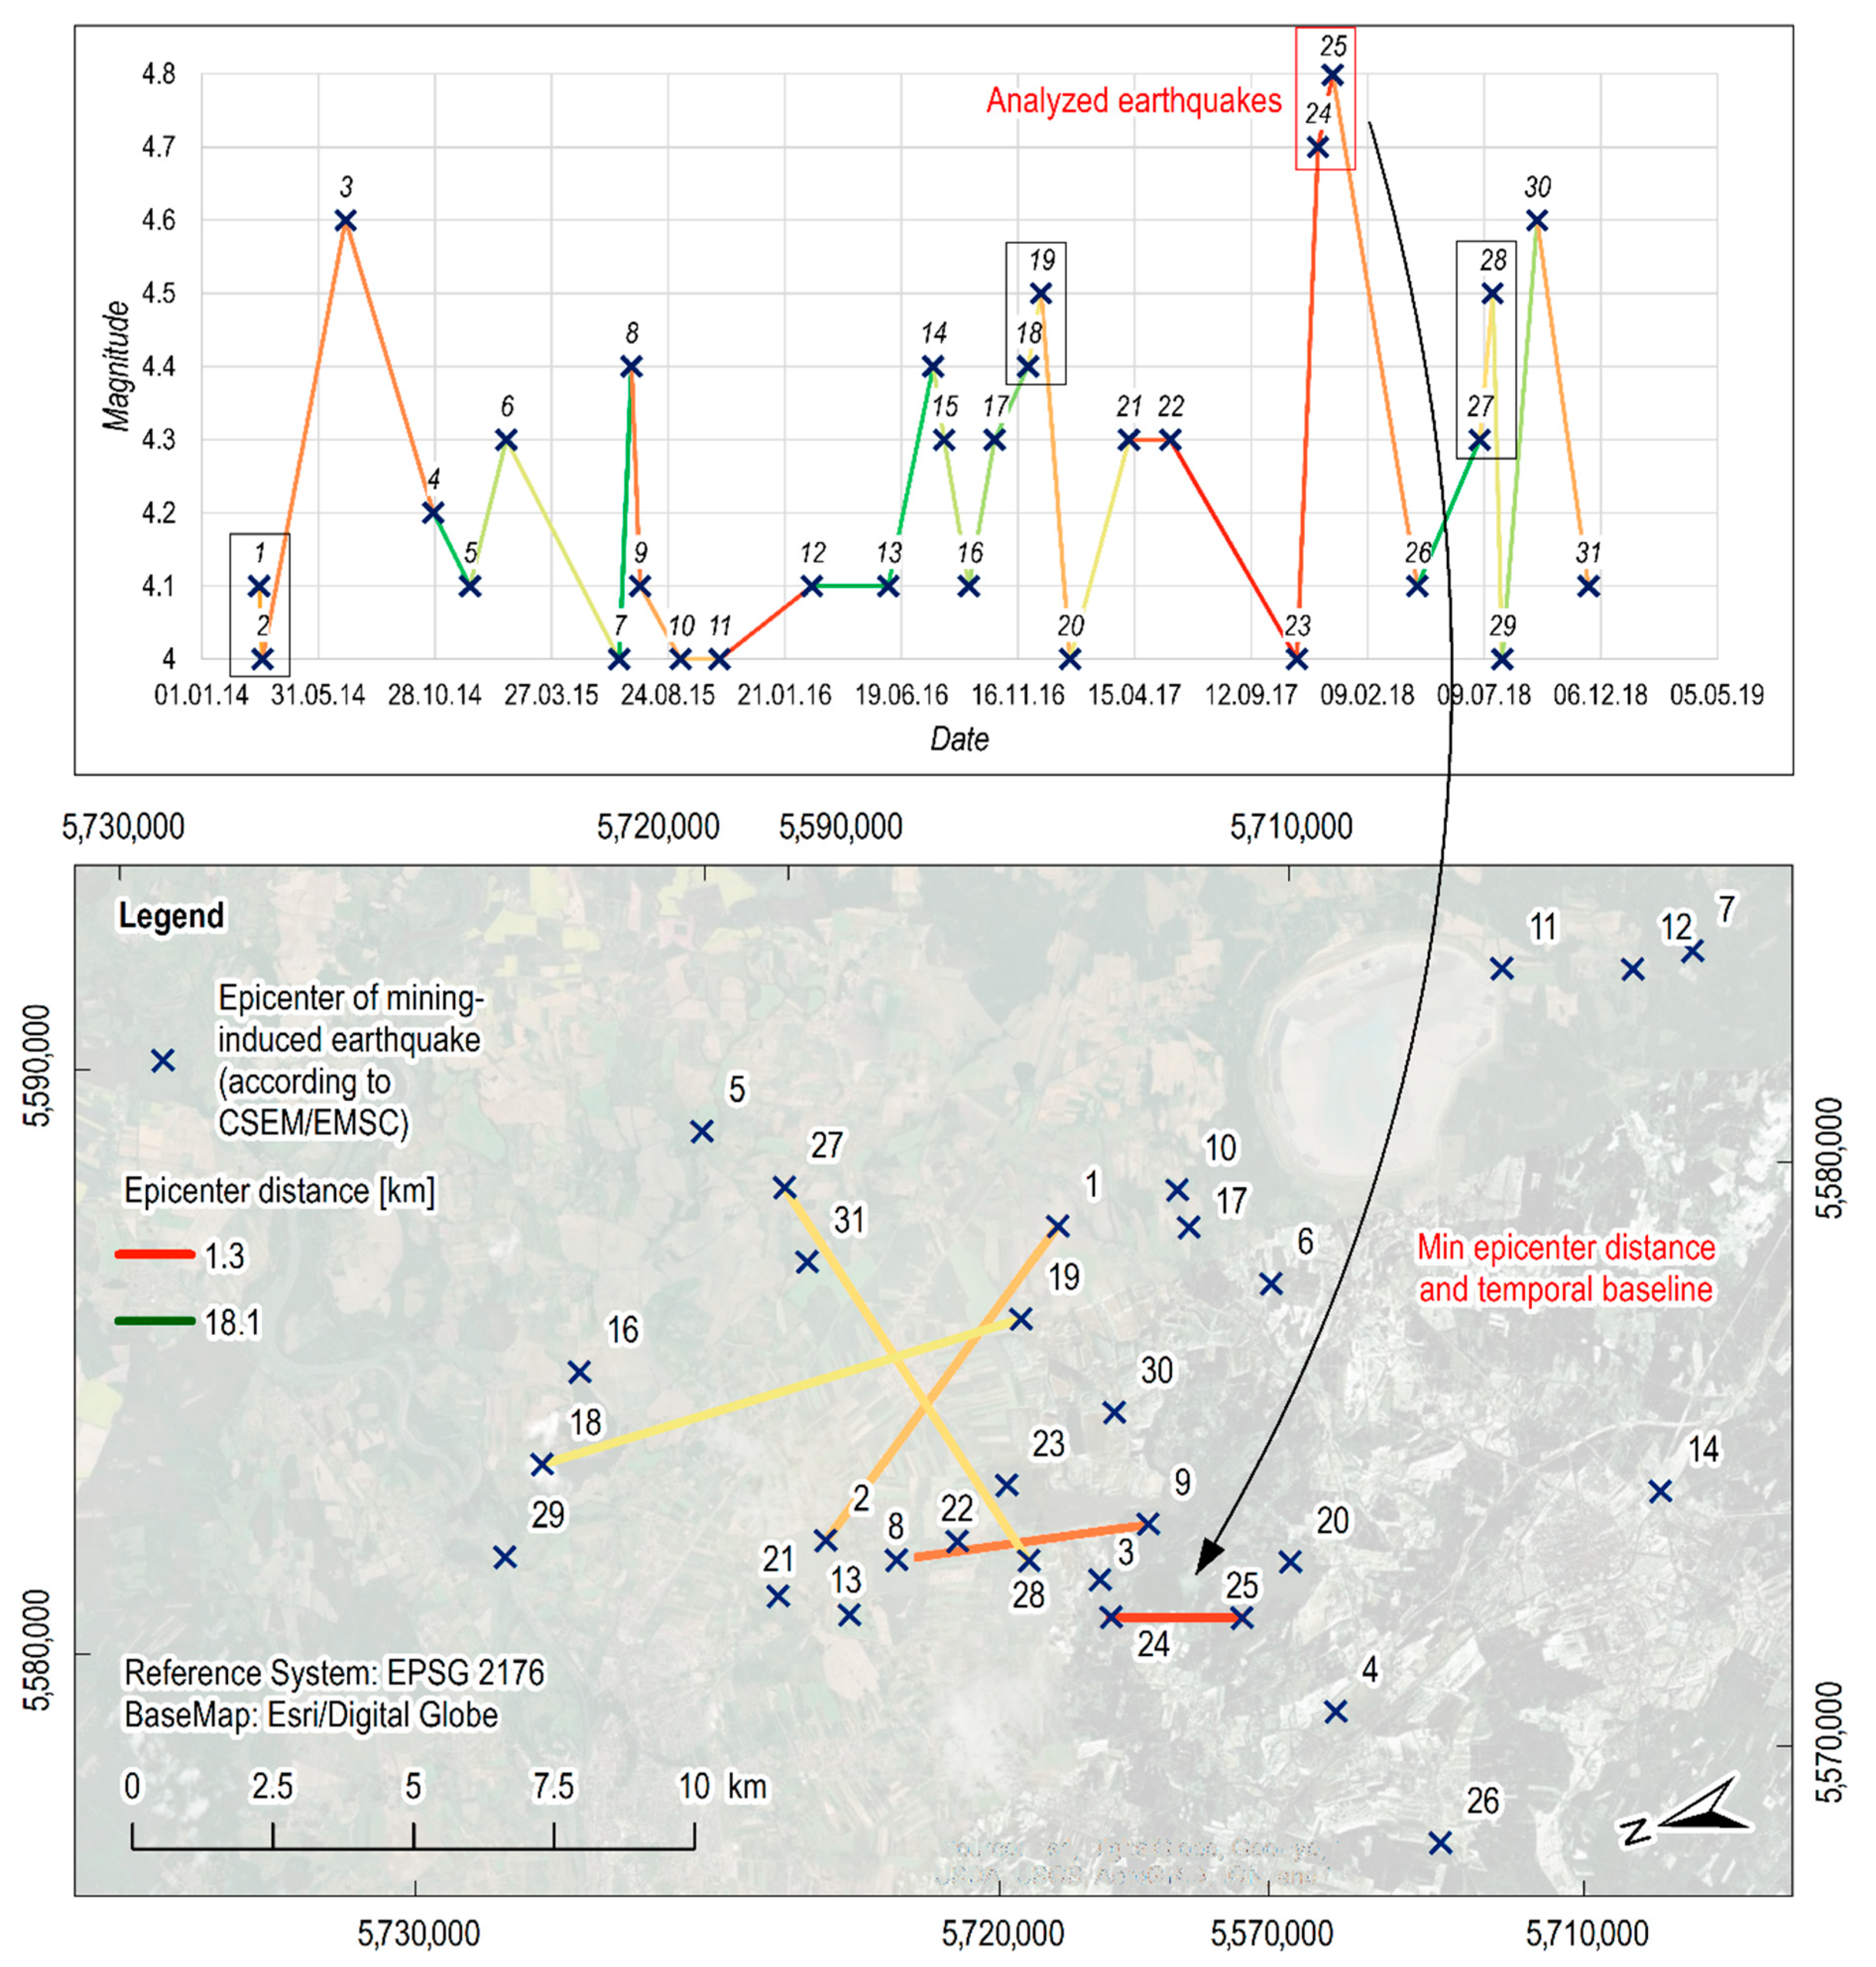
Monitoring of the impact of mining-induced tremors on surface movements is most frequently carried out using classical geodetic methods [5] and GNSS measurements [6,7]. However, the use of these methods is time-consuming, costly and difficult to plan as the time of tremor occurrence cannot be easily predicted. For this reason, only continuous and quasi-continuous observations may increase monitoring reliability. Recently, remote sensing technologies, especially Radar Satellite Interferometry (InSAR) have been used more frequently to observe such phenomena, also by monitoring surface movements caused by earthquakes [8]. Although monitoring of surface movements caused by earthquakes attracts a lot of attention, there are not many papers devoted to the displacements resulting from mining-induced seismicity. However, in recent years, several works concerning the impact of mining-induced earthquakes on surface movements have been published [9,10,11,12]. Owczarz and Blachowski analyzed the surface movements induced by the occurrence of mining tremors with a magnitude of 4.8, 4.5 and 3.9 in ‘Legnica-Glogow’ Copper District (LGOM) [9]. Based on the analyses carried out using the Differential Interferometric Synthetic Aperture Radar (DInSAR) technique, the authors determined the satellite Line of Sight (LOS) displacement for the two tremors with the highest magnitude. They measured approximately 0.08 m and 0.07 m, respectively. The DInSAR processing method was also used by Milczarek to determine the surface movements in an area affected by the tremors induced by underground mining operations [10]. In addition, the Small Baseline Subset technique (SBAS) was also used to monitor the impact of mining-induced tremors on surface movements. The research conducted by Milczarek focused on the use of the Mogi model. Implementation of this model allowed to detect sudden, rapid changes of surface movements in the image of the component of atmospheric phase delay of the radar wave [11]. Moreover, our study conducted following a 4.5-magnitude tremor which occurred on the 29th November 2016 indicates some basic features of such movements [12]. First, the tremor was preceded by very small or no surface movements caused by on-going mining activity. They usually did not exceed a few millimeters per day. Approximately 24 hours after the tremor, the main subsidence of about 70–80 mm took place. Afterward, in the subsequent 4–5 days, the surface movements stopped. Thus, the formed local subsidence trough was elliptical, reaching 2.8 km × 1.7 km in size [12]. Investigations conducted so far have revealed that a single mining-induced tremor generates surface displacements if its magnitude is greater than or equal to 4.0. However, there are areas affected by many tremors. It has not yet been investigated whether a single tremor completely saturates the compaction susceptibility of soil near the epicenter. If another tremor occurred in a given place after some time, would the surface still undergo some additional subsidence? Therefore, it is not known what the distribution of displacements may look like in the vicinity of two tremor epicenters which are near each other (Figure 1). Due to that fact, cumulative surface movements should be expected. The aim of the present research has been to analyze the spatio-temporal distribution of ground movements caused by 2 tremors located close to each other. Special emphasis was paid to the kinematics of surface movements just after the seismic event.
The concept of surface displacement superposition has been studied in time and space. The main scientific aim has been to prove that in the areas where high-energy tremors occur, ground movements overlap. In the areas where mining-induced tremors occur in the vicinity of premises, they may be of high importance, particularly in the build-up areas where surface structures are vulnerable to displacements.
2. Research Area
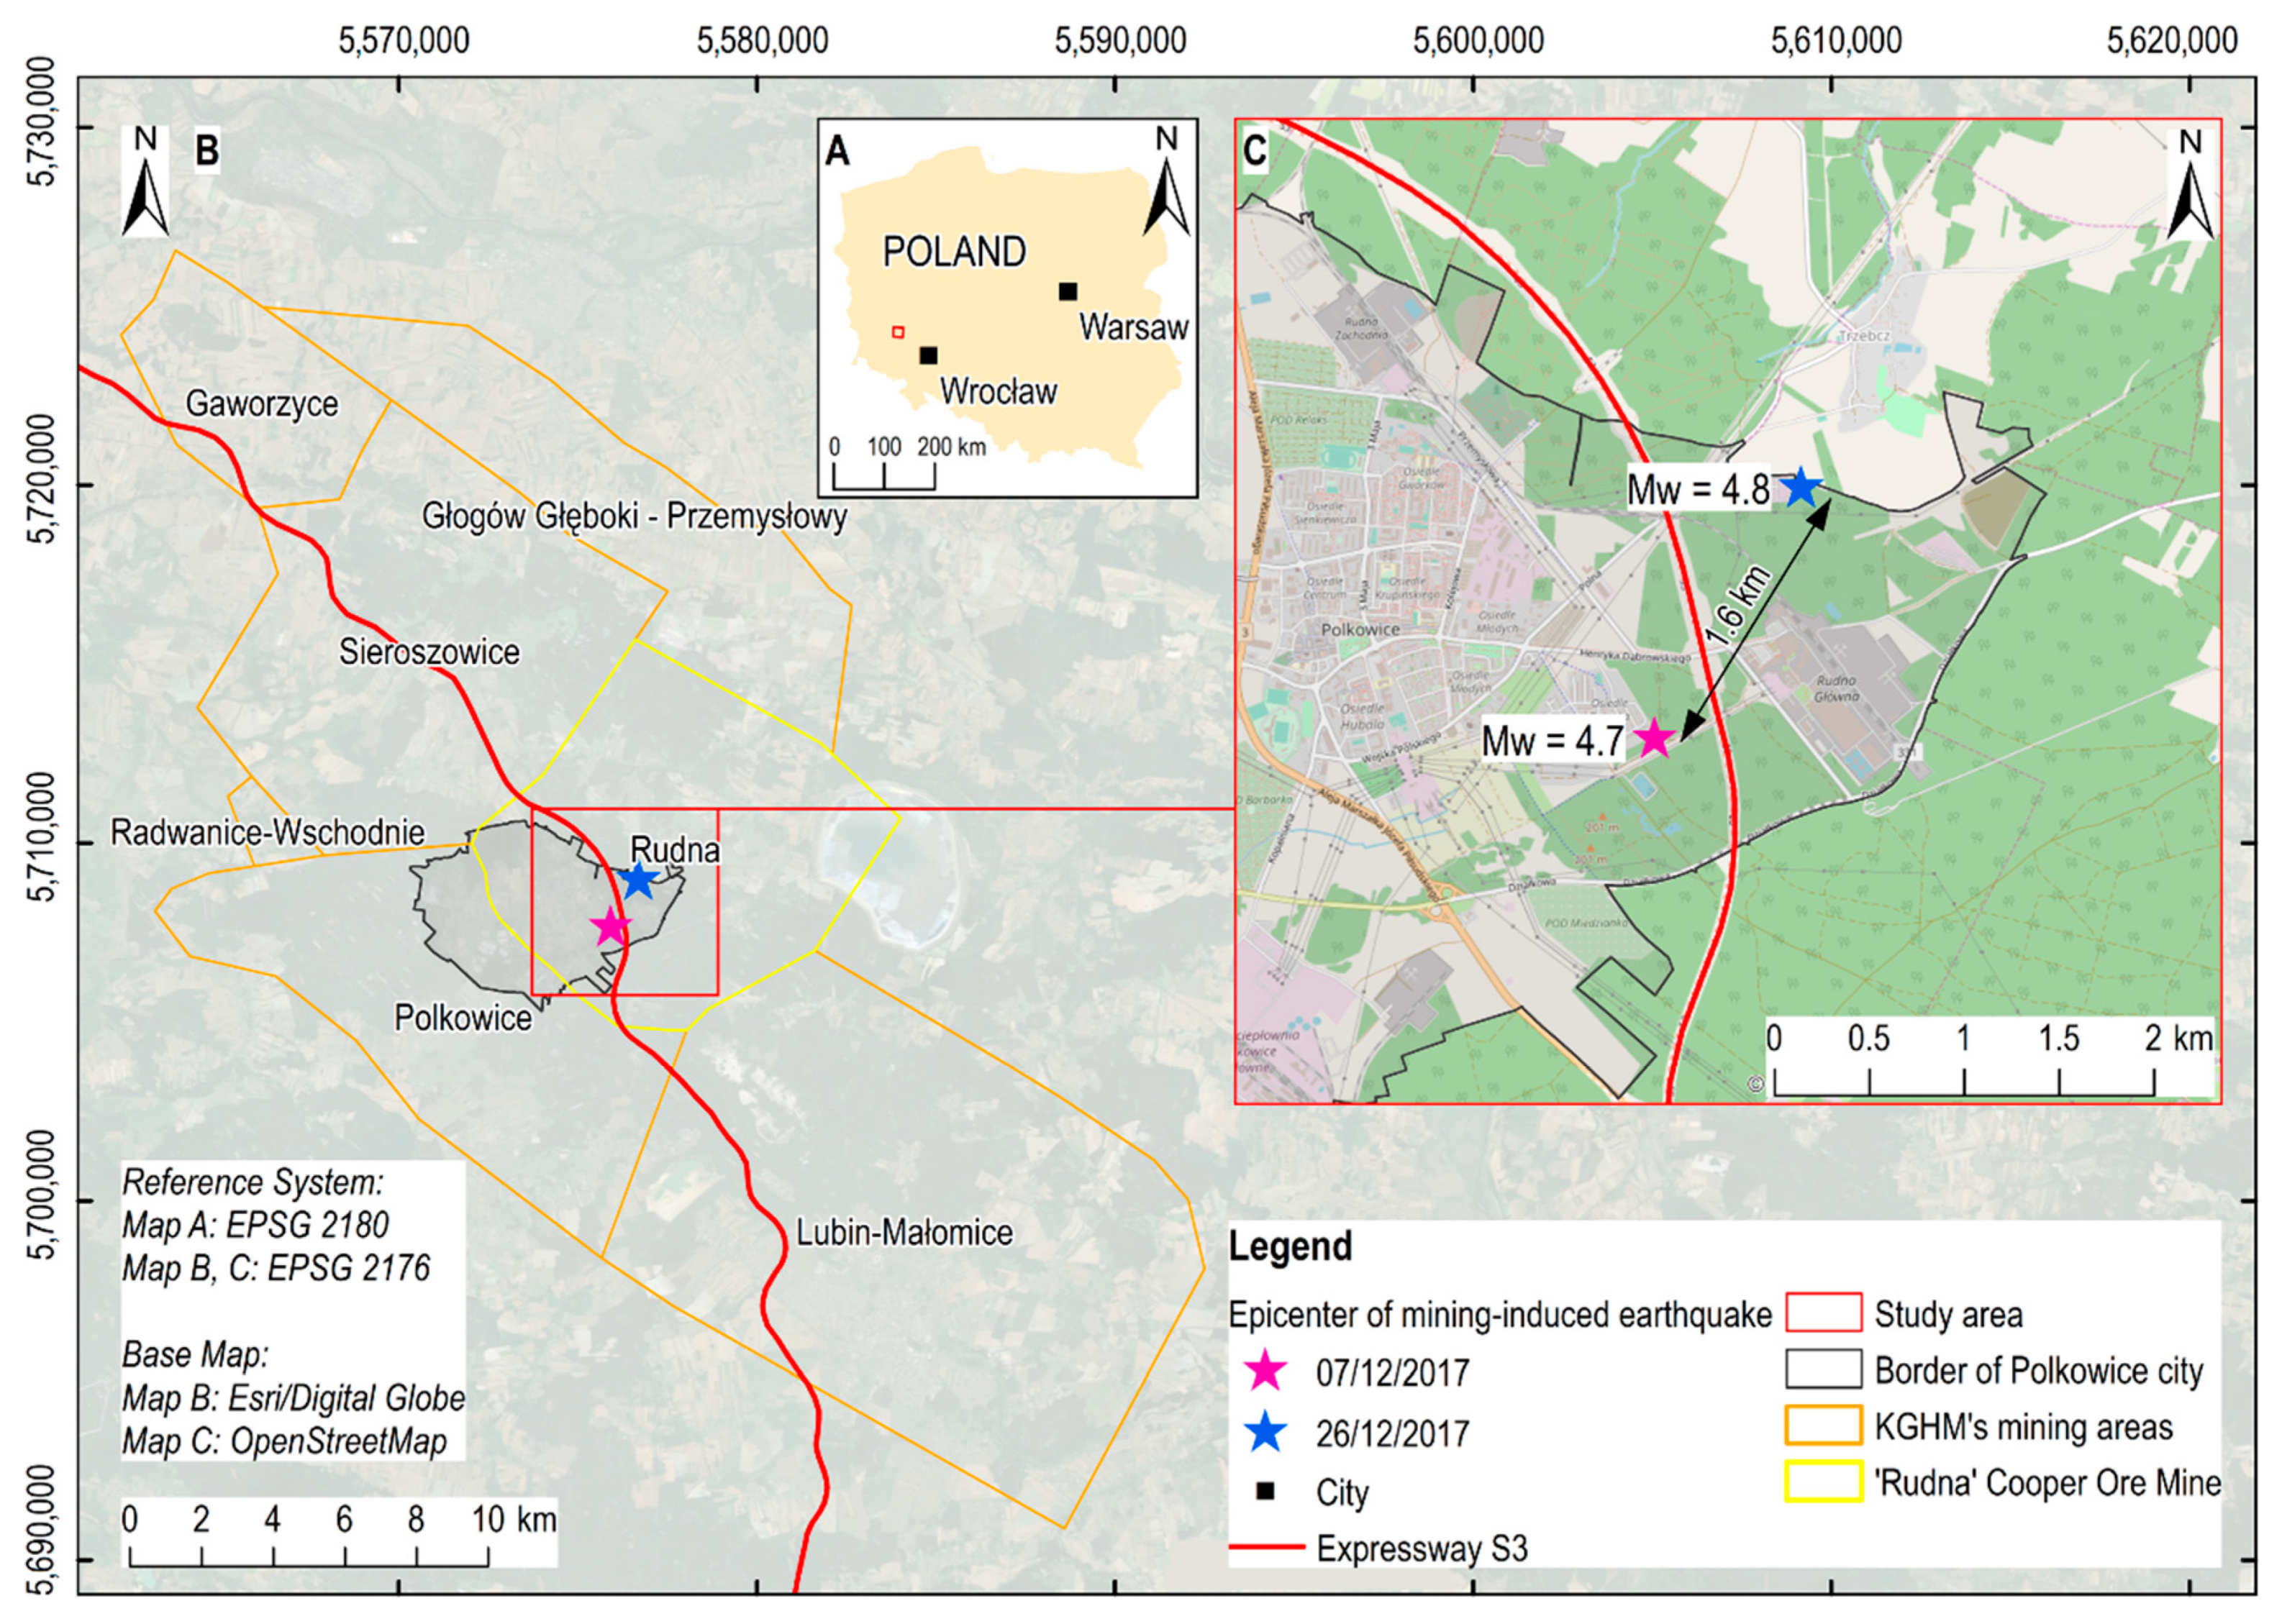
According to the data provided by the European Mediterranean Seismological Centre (EMSC) and KGHM Company (Lower Silesian Voivodeship, Poland) the analyzed earthquakes occurred on 7th December 2017 at 17:42:50.4 UTC and on 26th December 2017 at 11:15:30.9 UTC and had a magnitude of 4.7 and 4.8, respectively.
The epicenters of the analyzed earthquakes occurred in the eastern part of “Rudna” Copper Ore Mine belonging to KGHM Company, in the LGOM area (Figure 2A,B). The analyses performed in this study revealed that the centers of the subsidence troughs generated by the earthquakes were located about 1.5 km east and 1.8 km north-east of Polkowice town center for the 4.7 and 4.8 magnitude earthquakes (Figure 2C; [1,13]). Furthermore, the distance between the epicenters of the analyzed earthquakes was ca. 1.6 km. The research covered a part of “Rudna” Copper Ore Mine area (about 25 km2) in the immediate vicinity of the local subsidence troughs identified by the analyses presented in this paper (Figure 2C).
The LGOM is in the central part of the Fore-Sudetic Monocline. The base of this geological formation is made of Proterozoic crystalline rocks and Carboniferous sandstones. These strata are overlain by Paleozoic sediments of Permian age, dipping down in the northeastern direction at an angle of about 1–6°. They are represented by the Rotliegend and Zechstein strata covered by a deep series of Tertiary sediments. The youngest rock strata are formed by loose Neogene and Paleogene sediments (Figure 3; [13,14]).
Cupriferous reservoir rocks have the form of copper sulfides deposited at a depth of 1000 m, formed on the boundary of the Rotliegend and Zechstein beds. The lowermost layers of the deposit series are made of light gray Rotliegend quartz. The sandstones overlaying that strata consist of black silty-dolomite shale, cryptocrystalline dolomite, and laminated dolomite. The copper ore deposit varies in thickness from 7.5 m to 13 m. Mining was carried out at a depth of ca. 1000 m, with roof protection systems. It dips at an angle of about 2° to 4° towards the northeast [13].
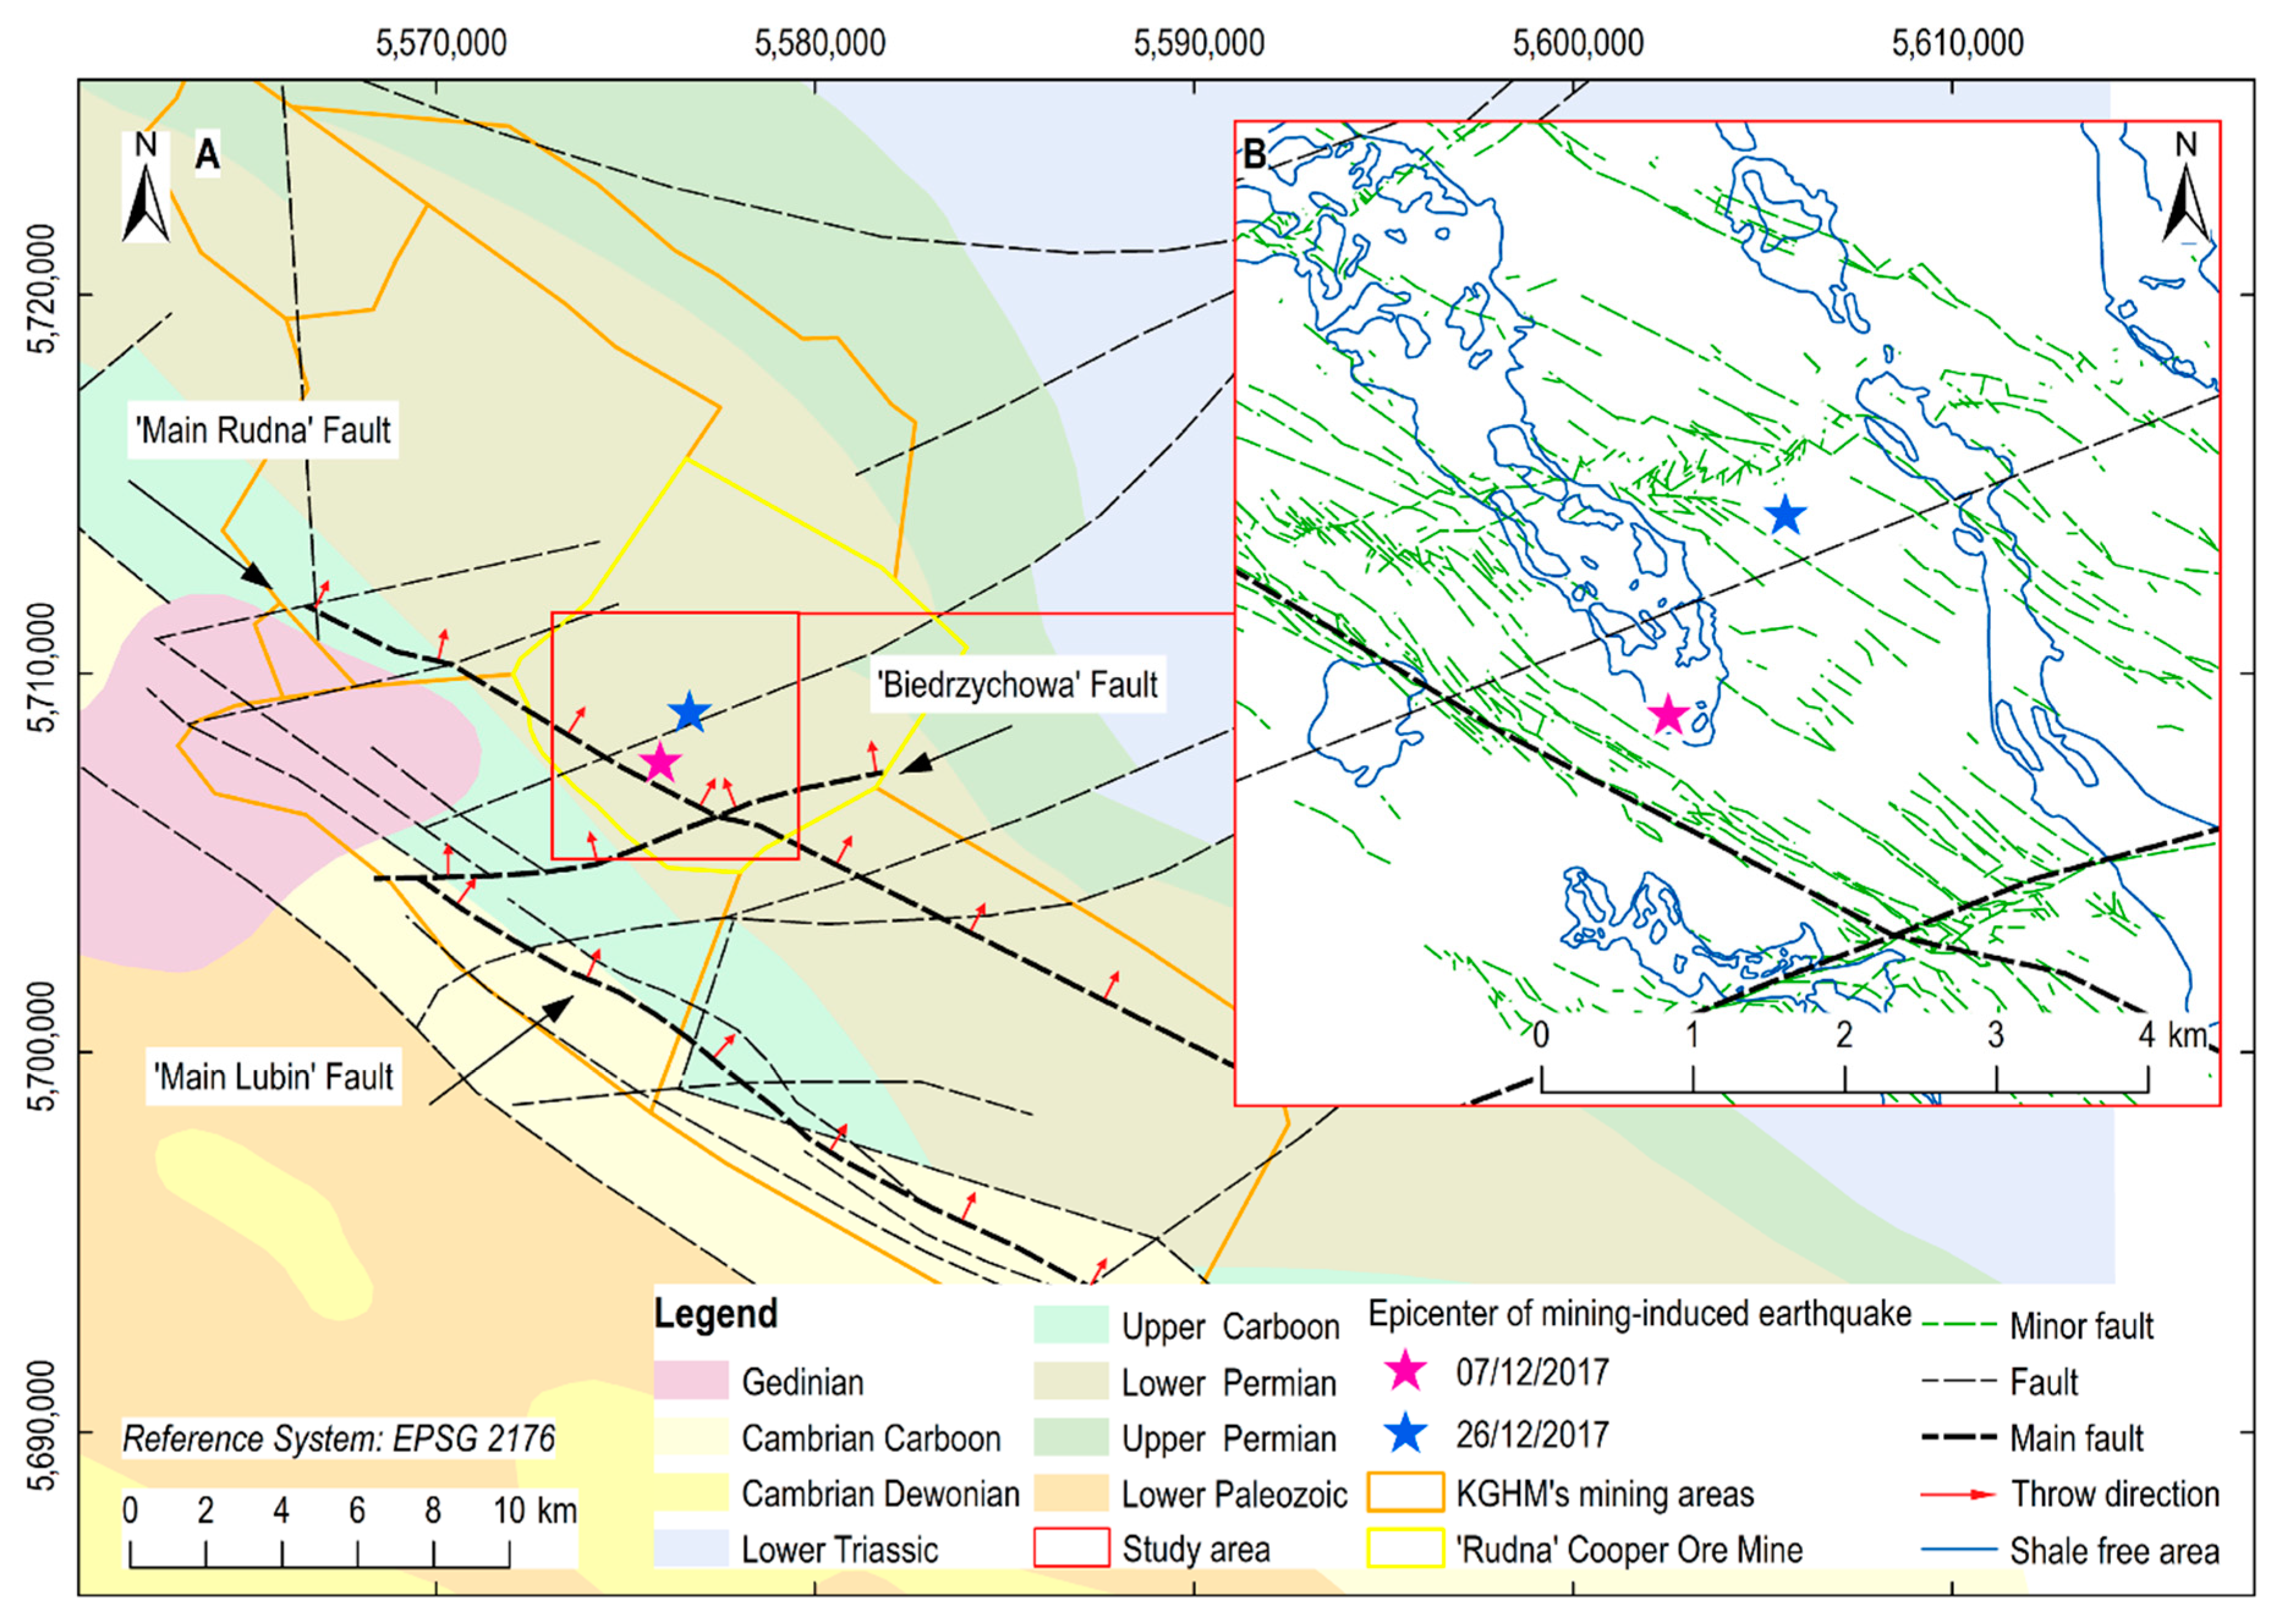
The geological-tectonic conditions in the investigated area are complex. There are numerous displacement zones. The origin of displacement zones relates to various stages of sedimentation and rock mass movements. The fault zones in that area have northwestern to southeastern course. The inclination of the main faults is from 30° to 90°. Among these fault systems the most significant ones are the “Main Rudna” fault, “Biedrzychowa” fault, and “Main Lubin” fault (Figure 3A,B; [15,17,18,19,20,21]).
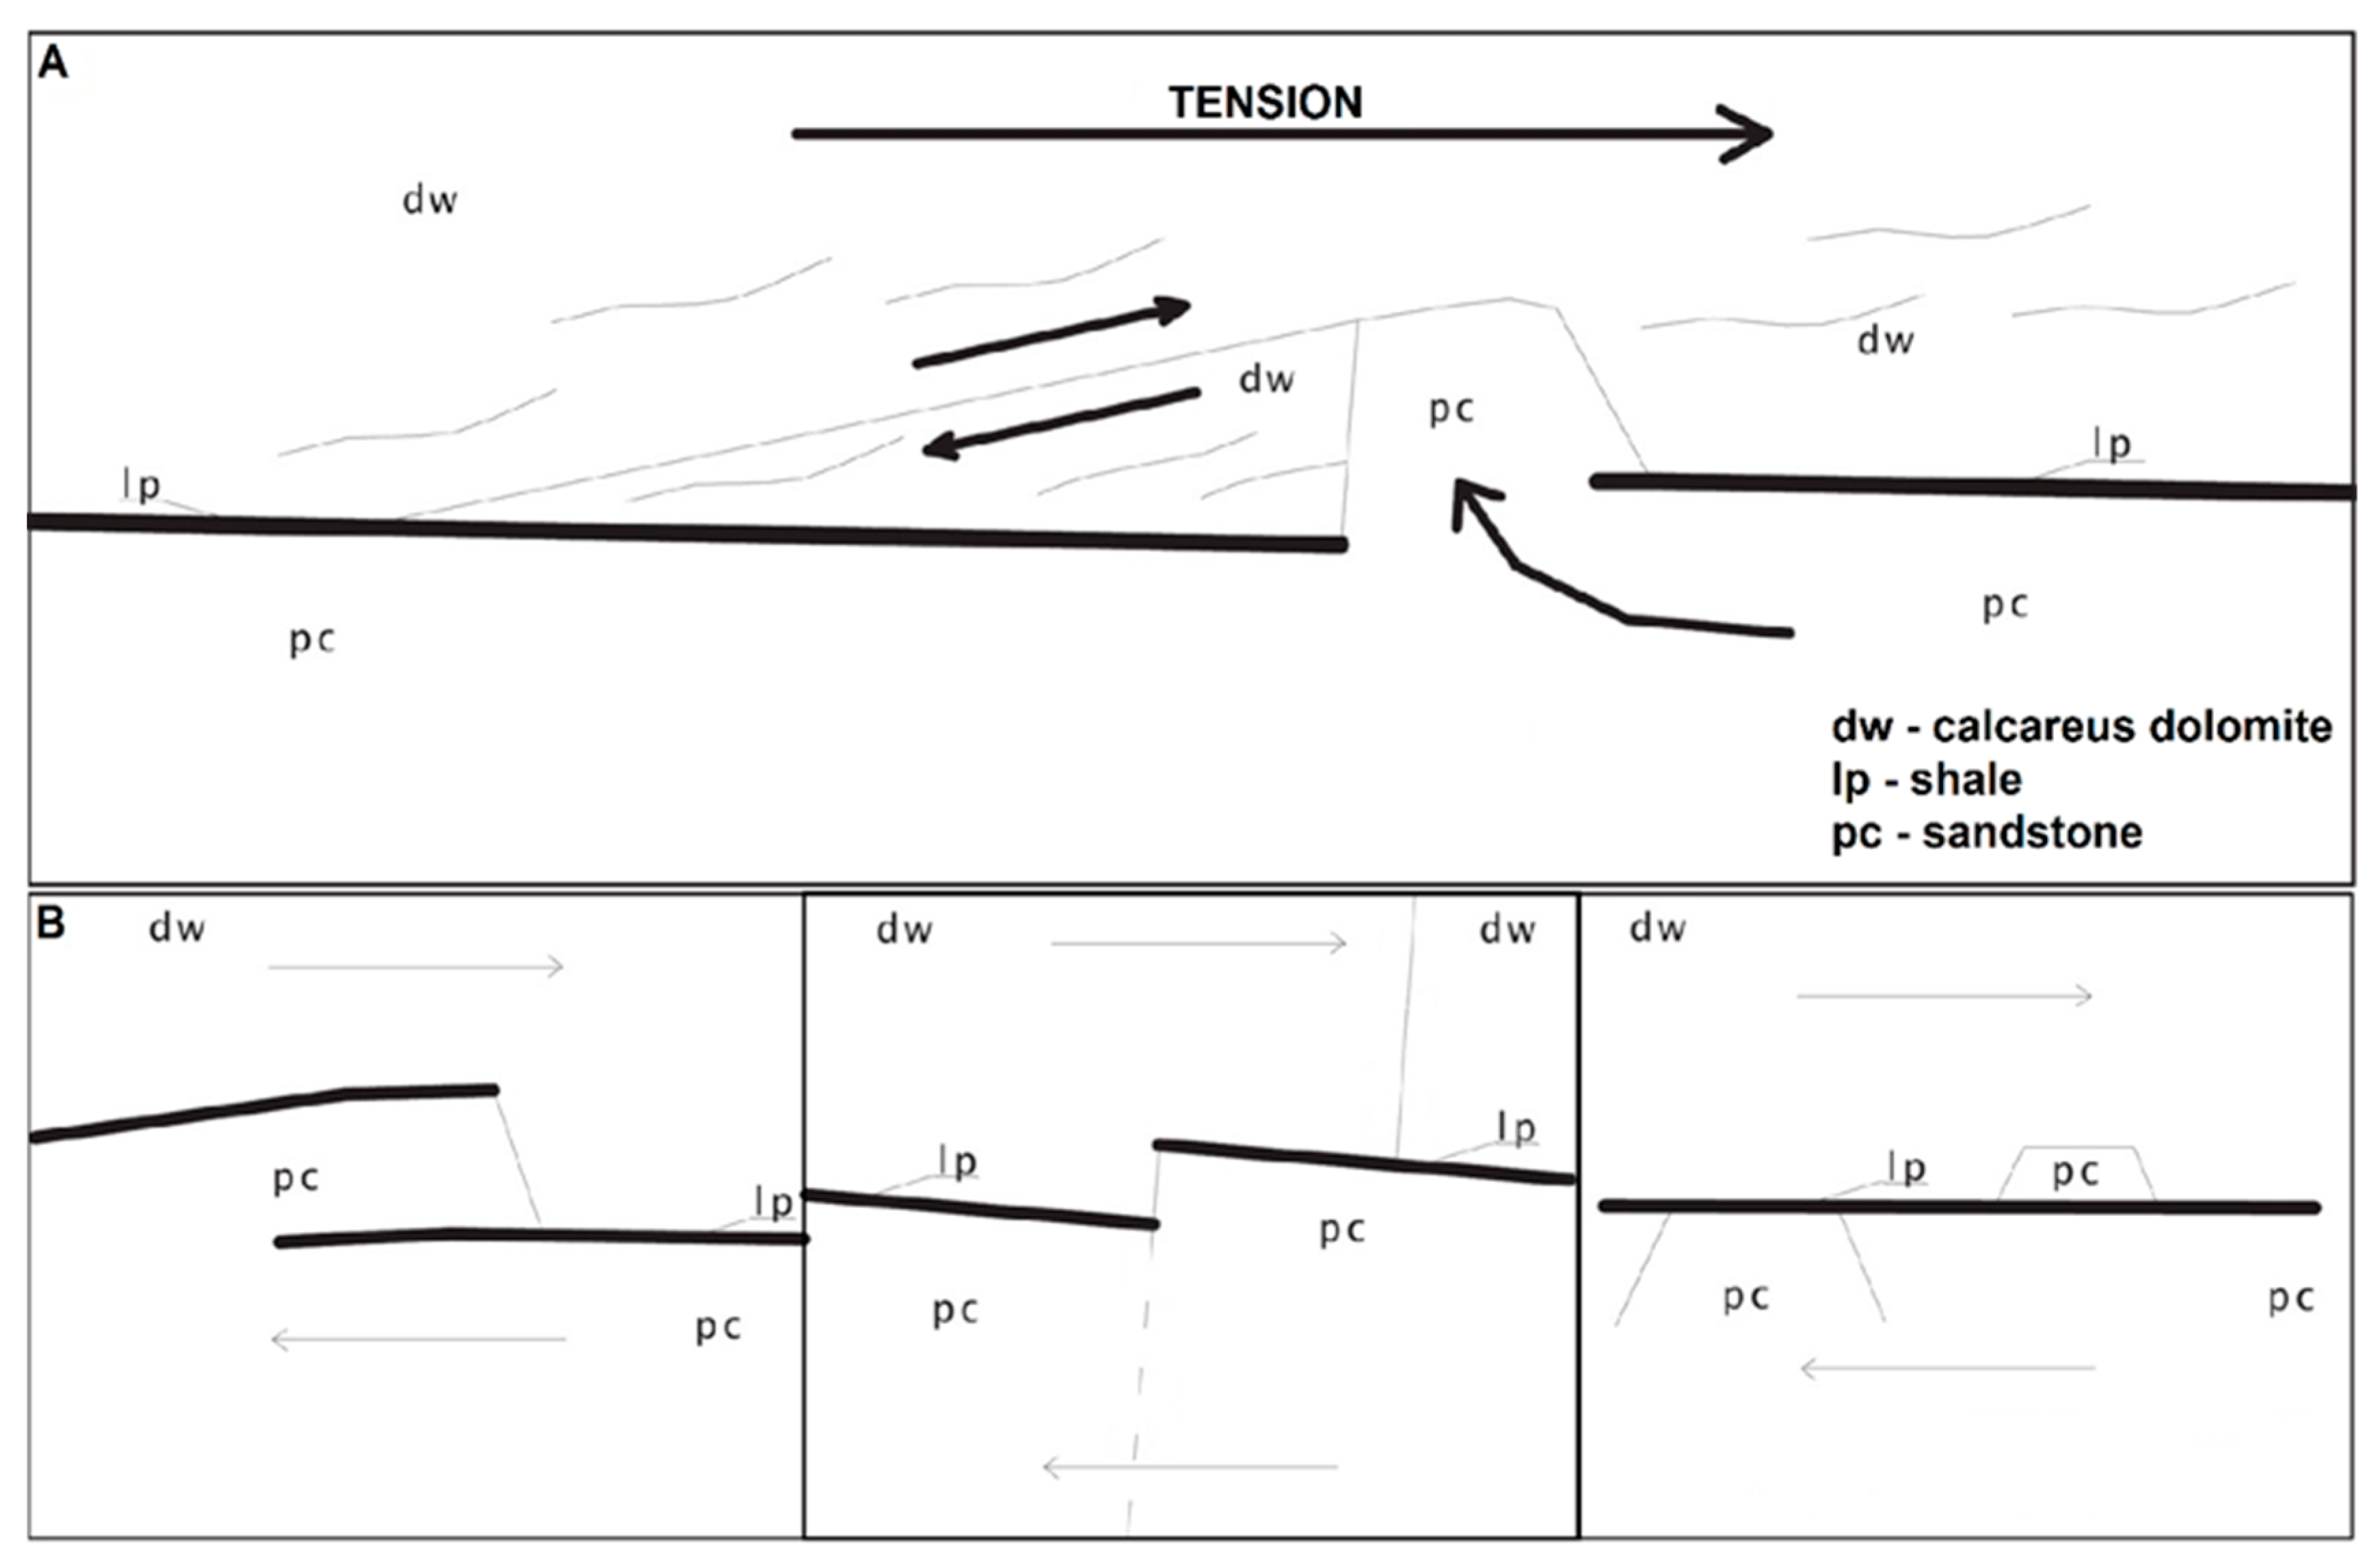
Vertical displacements along the fault plains result in higher strains in the rock masses at considerable depth. They have the form of multilevel and multidirectional microfractures. A variety of interlayer strains on the boundary of the Lower and Upper Permian may be observed. There are numerous tectonic xenoliths, accompanied by a horst belt in the forefield (Figure 4A). The horsts consist of dolomite packages with shale cut troughs in the sandstone and displacement of accompanying faults on the surface of the Zechstein bed, as seen in Figure 4B. The main problem stemming from the occurrence of alternating Triassic rock layers of different geomechanical properties is to maintain stability of the underground workings (Figure 3B; [22,23,24]).
A high seismicity level in the analyzed area is mainly due to complex geological conditions. Moreover, geomechanical parameters cause greater strains in rock masses, which are directly connected with thick package of stiff rock strata. These strains are caused mainly by sandstone and dolomite location in the neighborhood of copper ores, which leads to the accumulation of considerable amounts of potential energy. The seismicity is additionally induced by on-going mining operations on a very thick deposit [25]. The stresses in the rock mass also increase due to the technical parameters of extraction. In the area of “Rudna” Copper Ore Mine, the extraction has been carried out using the pillar-and-chamber method since the 1980s, from the west to the east. The experience from former mining operations reveals that the hazard of high-energy mining tremors remained high in the course of the whole production period. Each year at least several earthquakes with energy exceeding 10E7 J are recorded. A large number of earthquakes in that area strongly correlate with displacements of fault zones and areas of intensive mining extraction [17,19,26,27,28].
3. Research Method
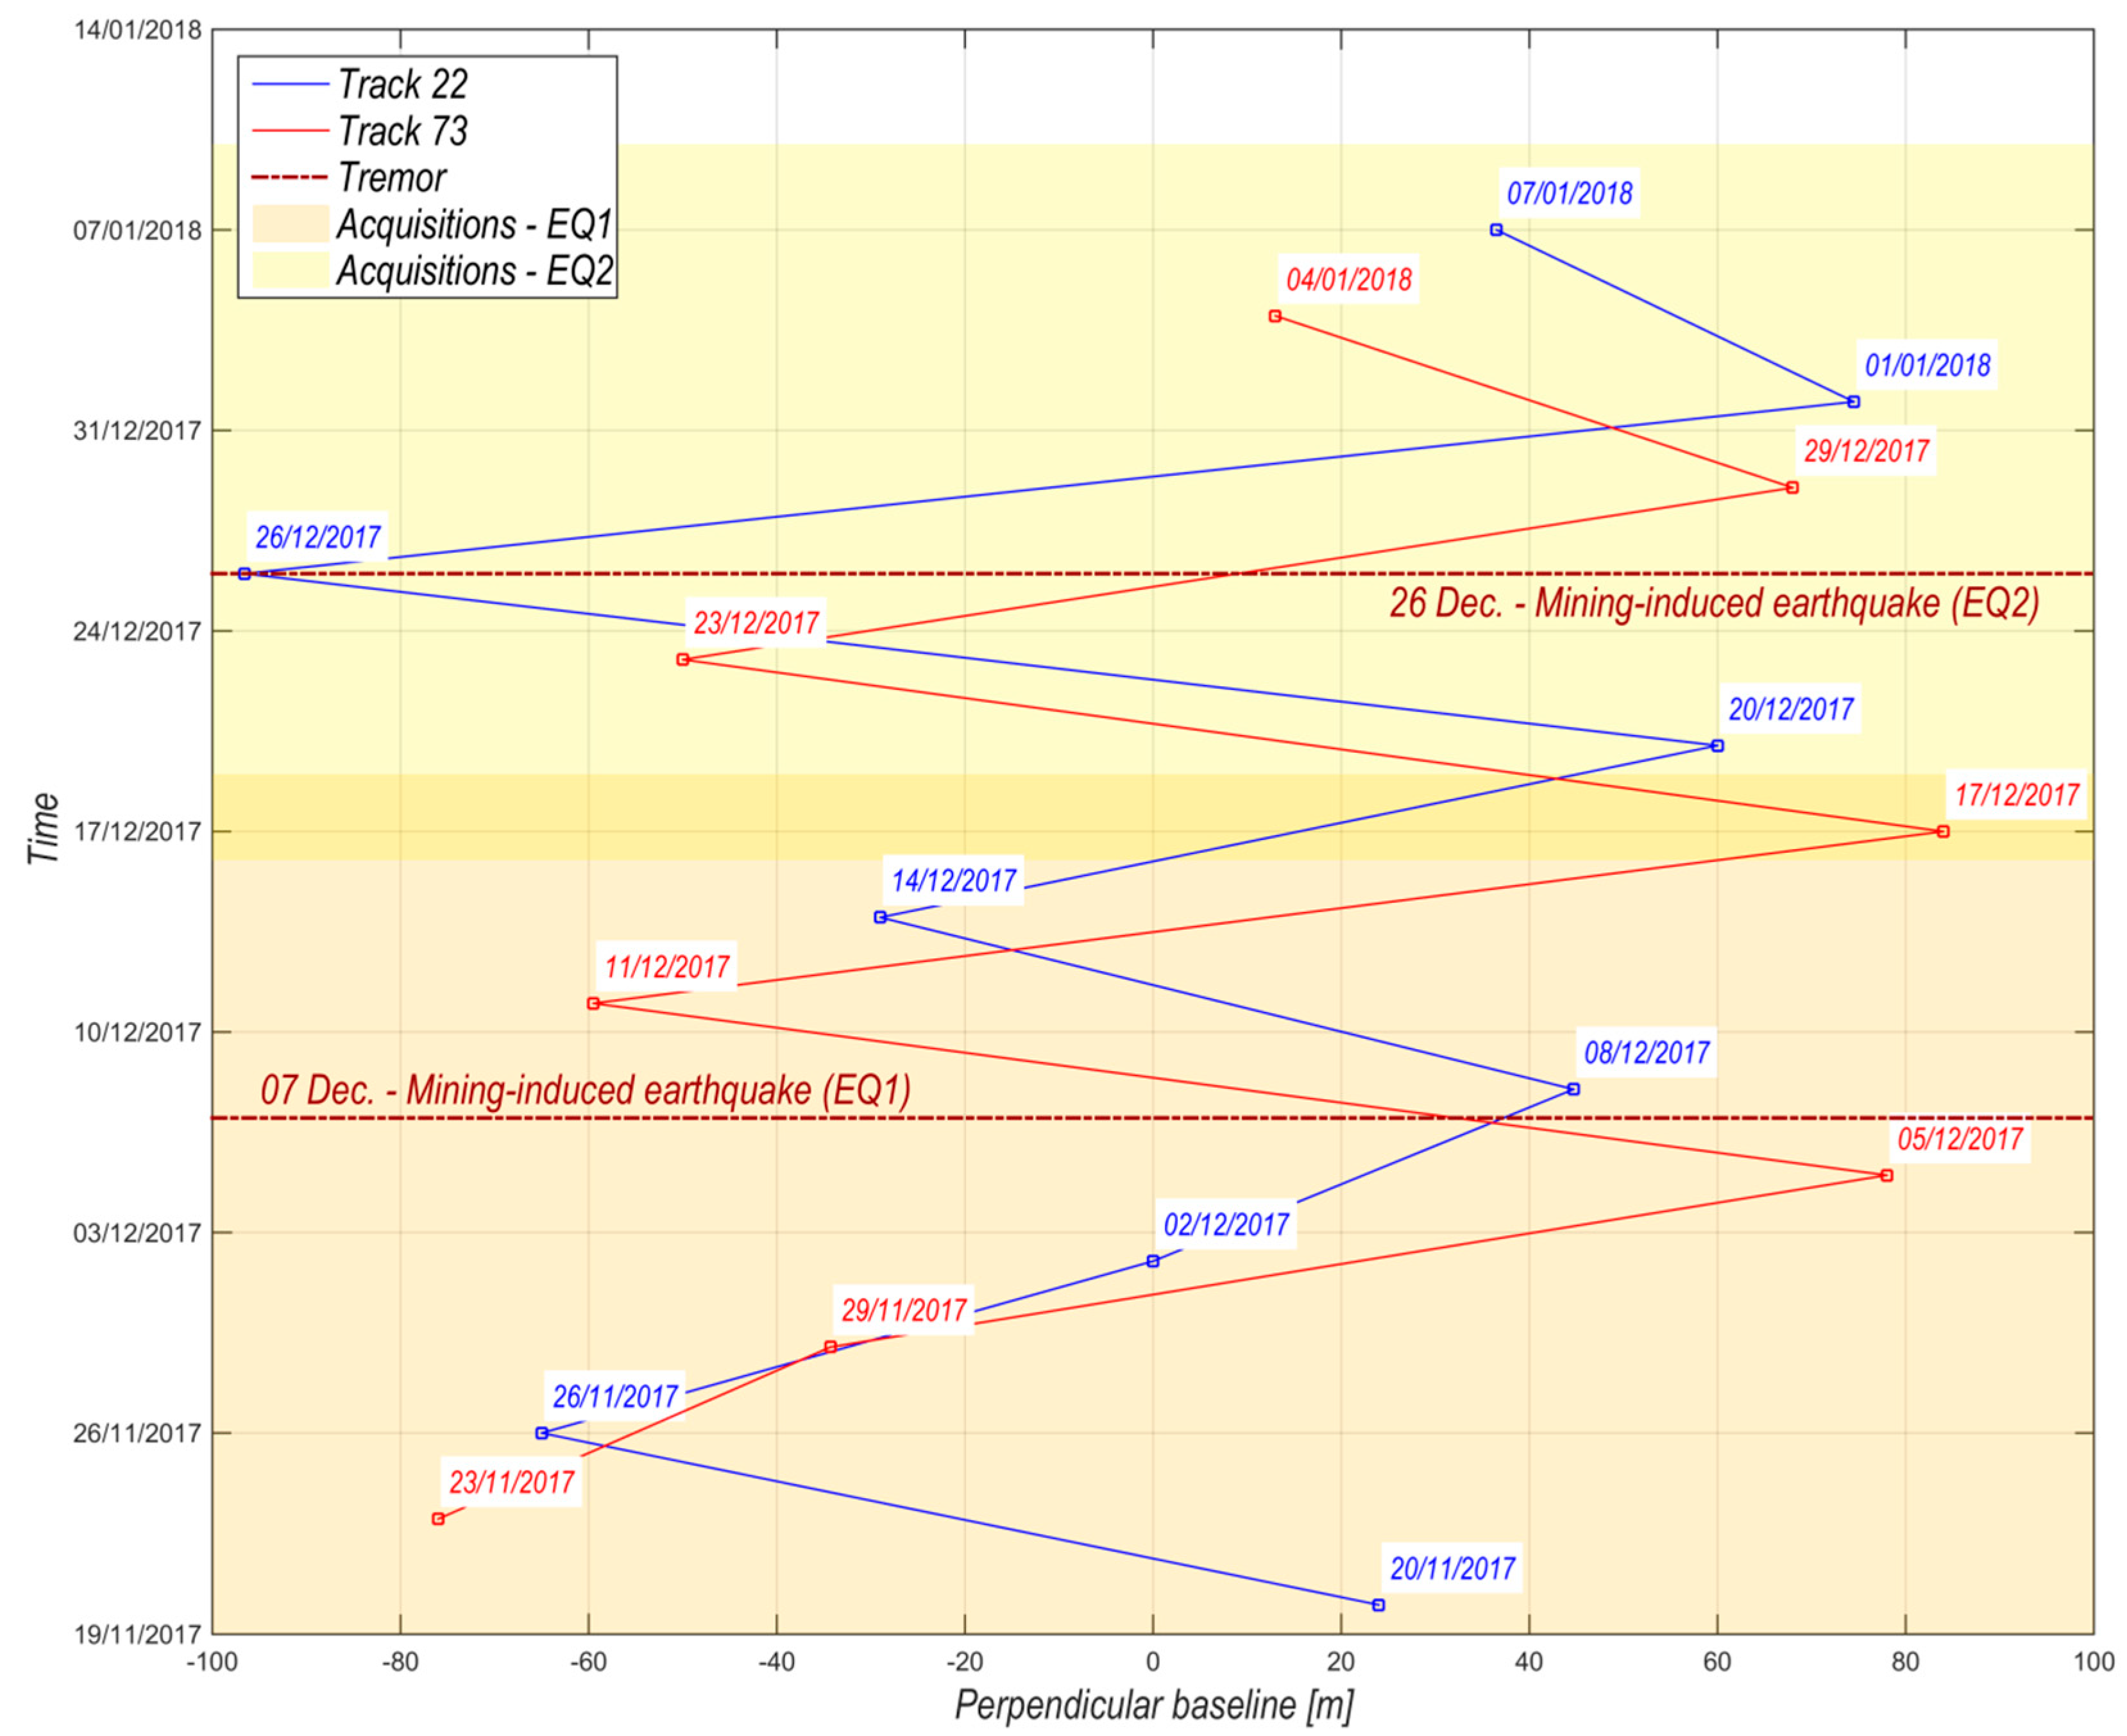
The ground movements were analyzed with the use of data provided by Sentinel-1 satellites. The Sentinel-1 acquisitions were obtained from descending (track 22) and ascending (track 73) satellite orbits (Figure 5).
The ground surface subsidence was worked out with DInSAR ([29,30,31,32]). This method consists of processing radar images into the form of interferograms showing the phase difference of radar waves ∆φ Equation (1) is the sum of components responsible for the curvature of the Earth , topography , surface movement , the impact of atmospheric factors , and observation noise . Component should be determined for the analysis of surface subsidence [30]. It consists of reducing the impact of the other components of the Equation (1) on the
value.
The first two components (,
) are reduced during interferogram generation. Based on the orbits of the satellites and a mathematical earth model, the value of () is removed from the interferograms. A digital elevation model, e.g., SRTM 1’’, is used to estimate the second component (). A different atmospheric delay at the two acquisition times is observed by the component. This effect is called an atmospheric phase screen (APS) and it is different for
each of the interferograms. The impact of the APS may be eliminated by using the stacking method, which assumes spatial correlation and no time correlation of the effects at the interferograms [30,32]. Nevertheless, it averages the values of the movements [31]. In the study, the APS individuals were estimated at all the interferograms. The atmospheric component () was removed by selecting a stable reference region [33]. Based on this characteristic, the APS pattern was estimated and reduced from the equation (1). The additional phase effects may be assigned to the noise value . In addition, the effectiveness of the estimation of all the components affects the accuracy of the deformation value. Therefore, a component of phase responsible for ground deformation ()
towards LOS is obtained from the equation (1), which was recalculated for metric values proportionally to the radar wavelength [30,34].
Furthermore, the root mean square error values (RMS) were used to assess the accuracy of the obtained results as well. The accuracy estimation in determining LOS displacements was carried out by calculating the mean value of LOS displacement and the RMSLOS error. Computations were carried out for the reference area. The reference area was determined assuming that the maximum range of land subsidence resulting from mining-induced tremors in LGOM with a magnitude of over 4.0 is 3 km (refer to Section 1). For this reason, it was assumed that the reference area is outside the radius of 3 km from the epicenter of the analyzed earthquakes. The average values of land surface displacements were similar and oscillating around zero mm in this area. These assumptions were confirmed by examining the distribution of the surface displacement values in the reference area and compliance of their average values in the subsequent measurement periods. Therefore, chi-square tests and significance tests for the mean were carried out at the significance level α = 0.10. The final RMSLOS error was determined as the arithmetic mean of RMSLOS errors over individual measurement periods. It amounted to 3.1 mm. In order to determine the estimation accuracy of the vertical displacements in the terrain surface, the RMSV value was defined. It was calculated during the conversion of LOS terrain surface displacement into vertical movement by using RMSLOS values and the propagation of error theory. The RMSV value was 4.3 mm. In the course of further analysis, we assumed the significance level of the movements at 0.05. Thus, statistically significant values of RMSLOS were higher than 6.2 mm and the values of RMSV higher than 8.6 mm. Further analyses were carried out taking into consideration only statistically significant movements.
The seismic events occurred on 7th and 26th December 2017, respectively, and terrain surface movements were analyzed for over seven weeks. Radar images were collected from a descending satellite orbit for the period from 20th November 2017 to 7th January 2018 and from an ascending satellite orbit for a period from 23rd November 2017 to 4th January 2018 (Figure 5). In total, 19 interferograms were generated in the course of the research. Based on the data obtained from the ascending and descending satellite orbit, seven and eight interferograms were initially created, respectively. Each of these interferograms covered a period of six consecutive days starting from 23rd and 20th November. Subsequently, a series of interferograms was generated, based on which it was possible to analyze LOS movements of the terrain surface over time.
In addition, based on the analysis of LOS movements of the terrain surface retrieved from the interferograms covering a 6-day period, it was found that the impact of mining-induced earthquakes on the terrain surface resulting in subsidence occurred up to about 7–10 days after the earthquake took place (see Section 4). Therefore, in order to determine the total values of surface displacements caused by the occurrence of a given mining-induced earthquake, two additional interferograms were generated for each geometry of Sentinel-1 satellites. Each of the interferograms covered a period of 12 days. For the earthquake of 7th December 2017, the interferograms were generated for the period from 2nd to 14th December 2017 (descending orbit) and for the period from 5th to 17th December 2017 (ascending orbit). For the earthquake of 26th December 2017, the interferograms for the period from 23rd December 2017 to 1st January 2018 and from 26th December 2017 to 7th January 2018 were generated, respectively.
To determine the vertical component of surface movement, double geometry of Sentinel-1 acquisition (ascending and descending) in the analyzed area was used [30,34]. Interferograms with a period of 12 days were used for these calculations. Furthermore, in the tremor epicenter, vertical movements of surface subsidence in a 3-day interval were obtained. This was based on the assumption of lack of horizontal components in the area of maximum subsidence [34].
Lastly, maps of subsidence due to the occurrence of the analyzed mining-induced earthquakes were obtained by interpolating the values of vertical movements of the terrain surface, which were retrieved with the use of DInSAR. Interpolation was carried out using geostatistics and kriging algorithm with a semivariogram analysis of input data. Afterward, rasters depicting the values of subsidence caused by the analyzed earthquakes were integrated into the Geographic Information System (GIS). As a result, the final map of subsidence induced by mining-induced earthquakes which occurred on 7th and 26th December 2017 was generated.
4. Results
The ground surface movements in LOS directions for ascending and descending orbits of Sentinel-1 satellites were analyzed in the periods preceding the earthquakes, i.e., 20th November–5th December 2017 for the 7th December 2017 seismic event and 11th December–26th Dec. 2017 for the 26th December 2017 seismic event. The maximum movements in LOS direction in those periods did not exceed ±10 mm (Figure 5 and Figure 6). This scale of displacement may be associated with mining subsidence. The value of RMSLOS ±3.1 mm was determined for all the interferograms as well. Nevertheless, no significant subsidence was observed before the earthquakes took place.
The analysis of surface subsidence at the time of the tremors was based on interferograms generated in the periods 2nd December–8th December 2017, 8th December–14th December 2017, 5th December–11th December 2017, and 11th December–17th December 2017 for the 7th December 2017 tremor and 23rd December–29th December 2017, 29th December, 2017–4th January 2018, 26th December 2017–1st January 2018, 1st January–7th January 2018 for the 26th December 2017 tremor.
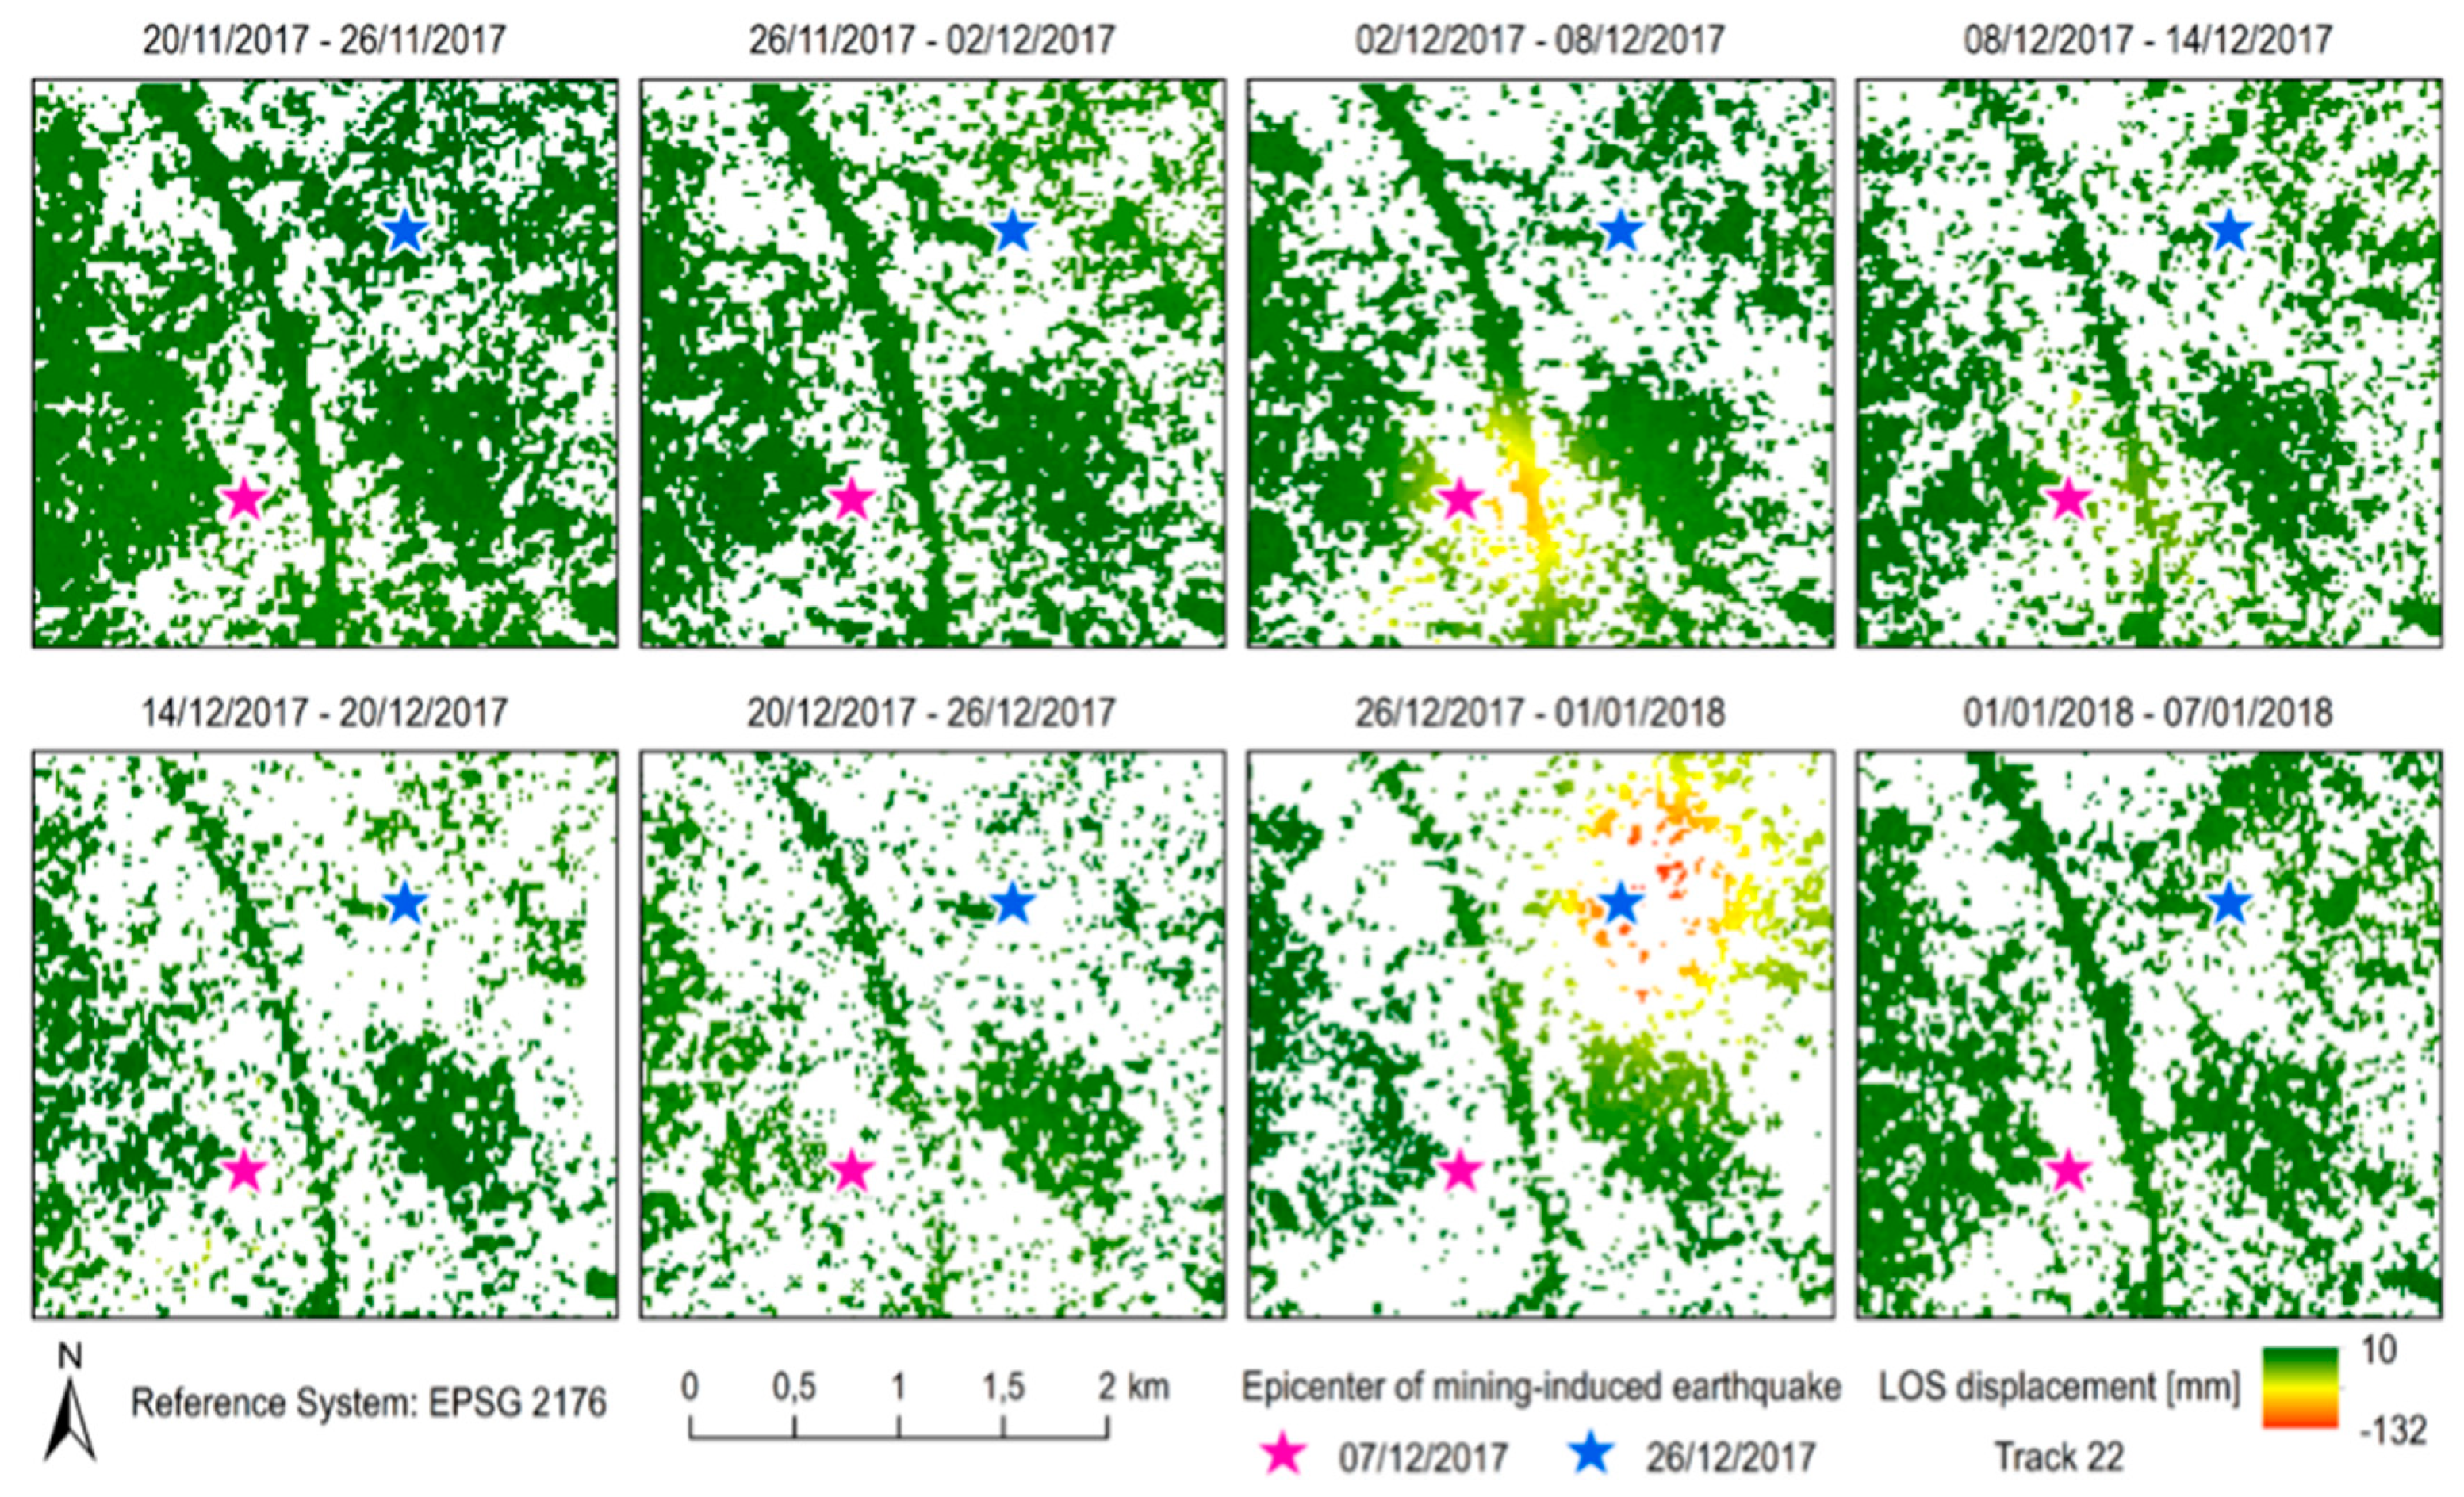
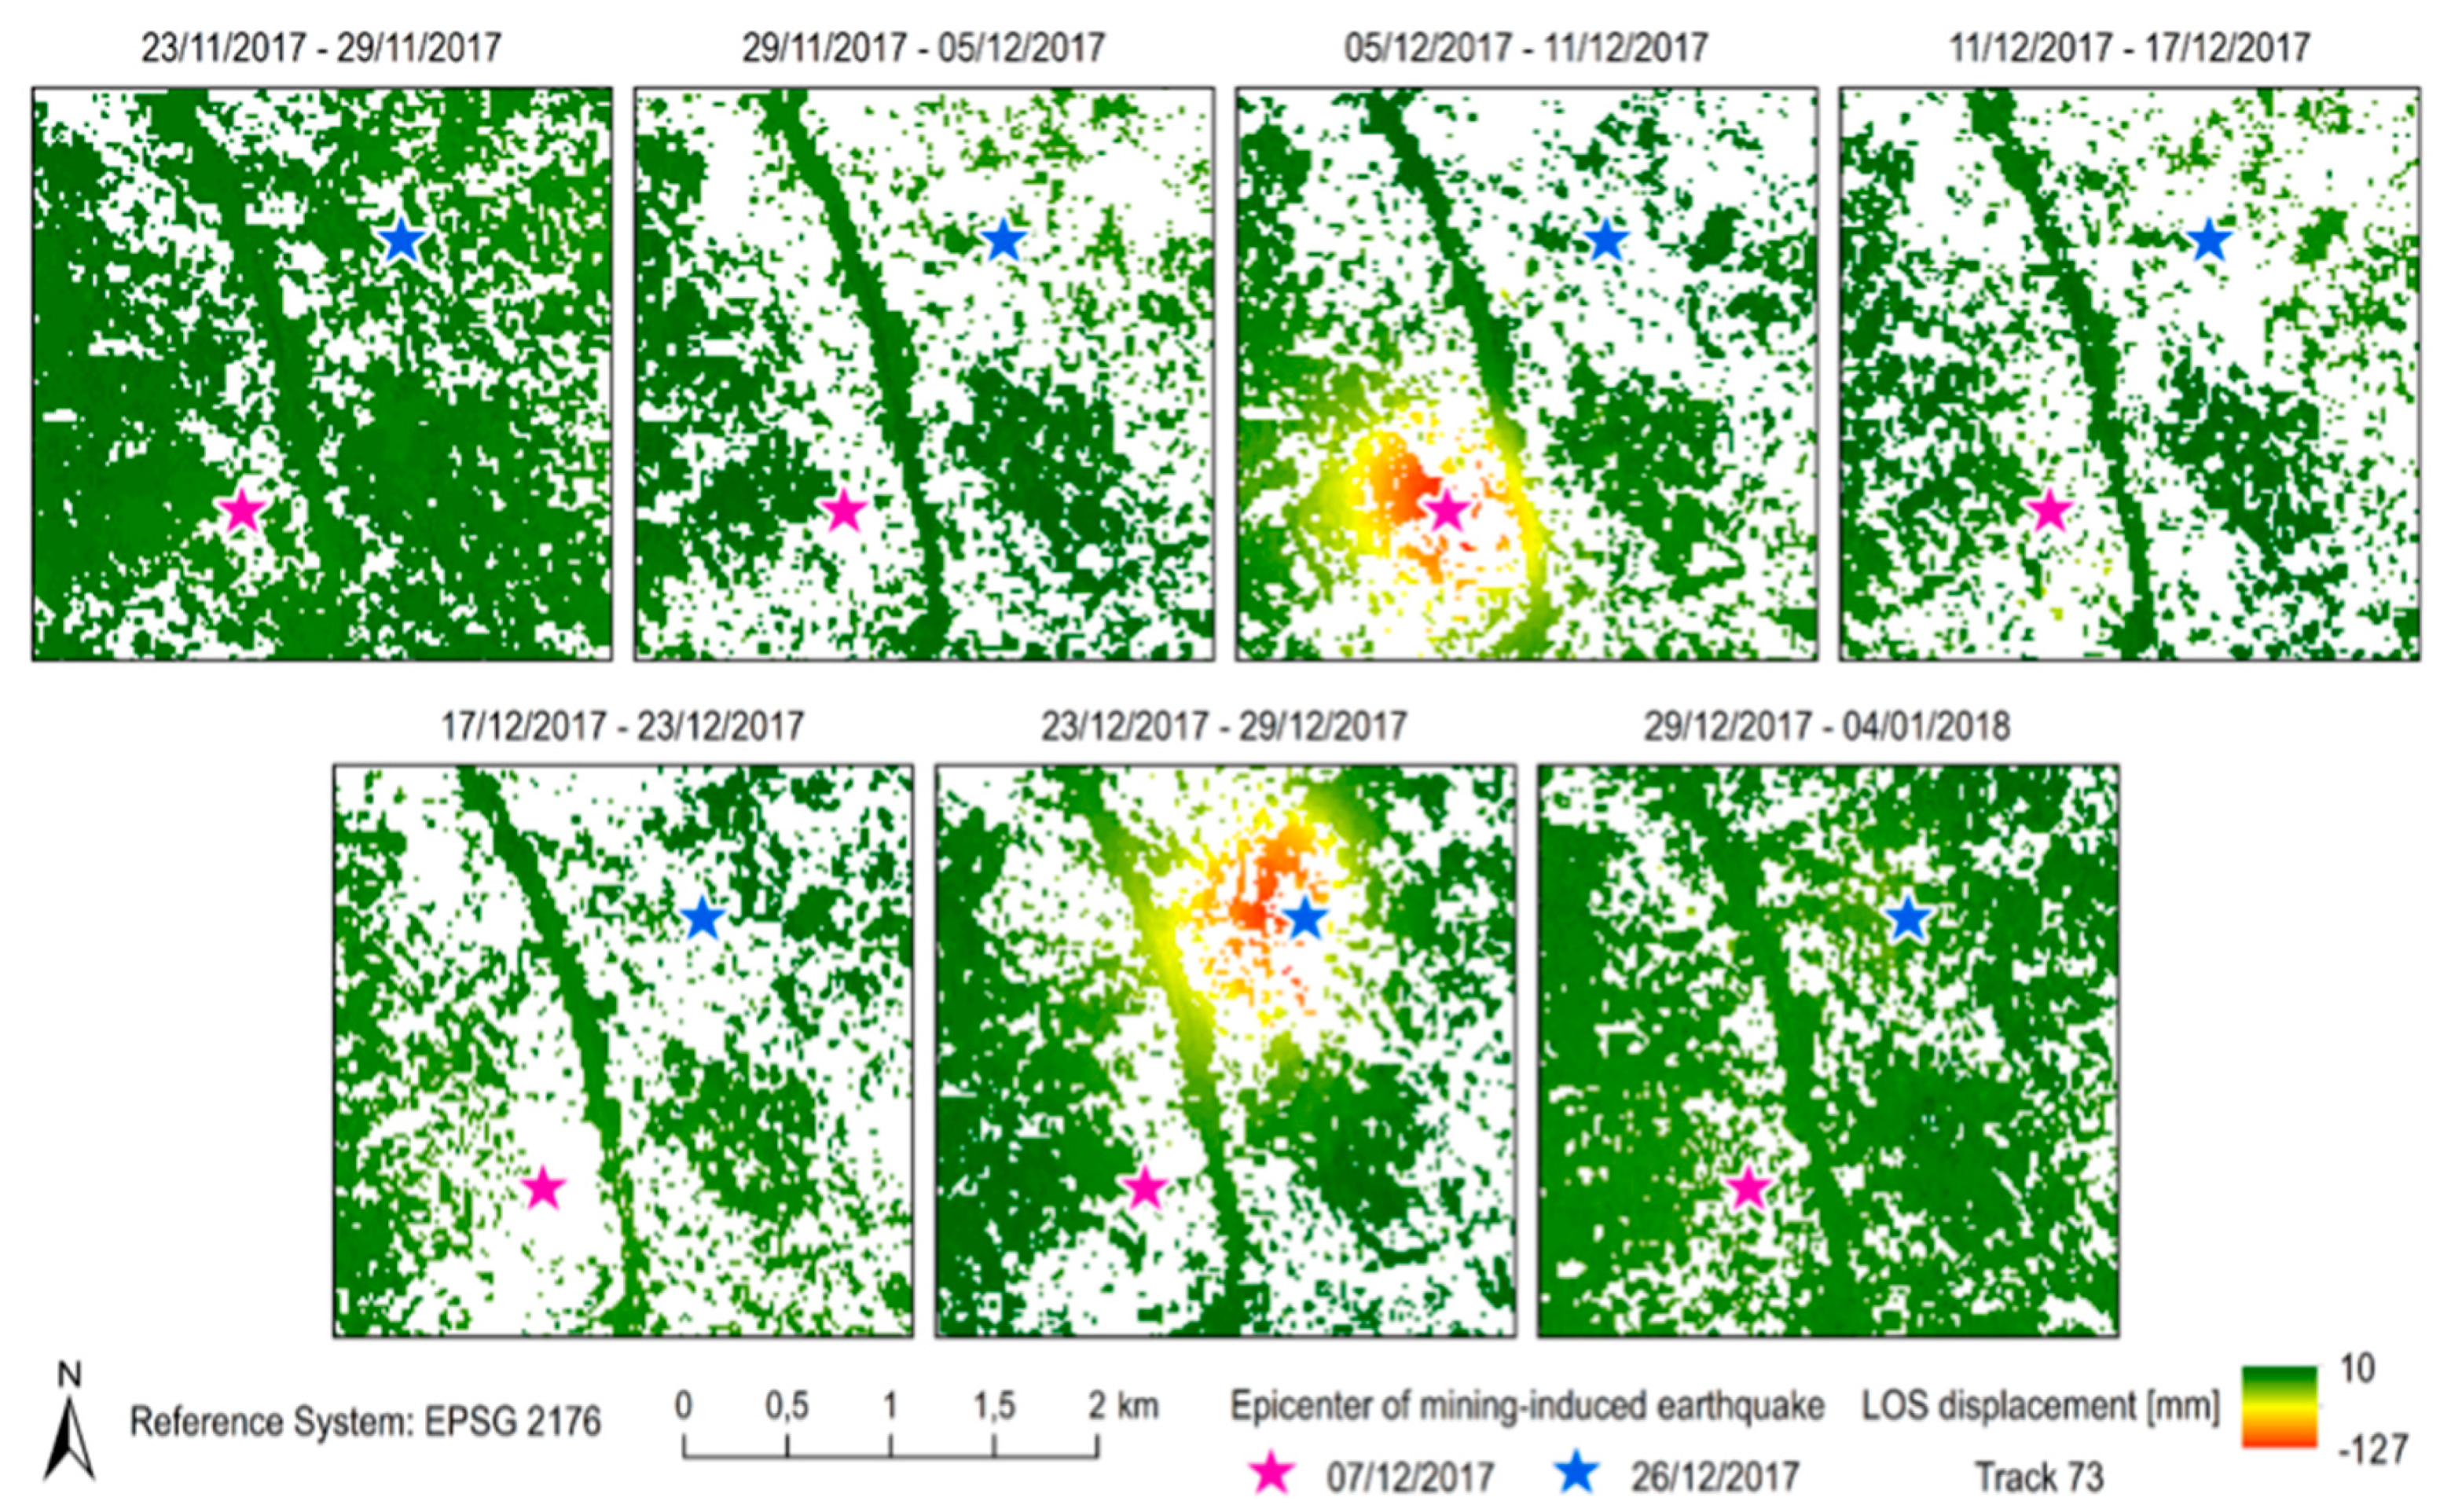
For the mining-induced tremor that occurred on 7th December 2017, subsidence in LOS obtained from a descending satellite orbit even reached −75 mm in the period from 2nd December–8th December 2017 (Figure 6). This value was determined with an accuracy defined by RMSLOS ±6.2 mm. These movements appeared on the surface for five days before the tremor and one day afterwards. Prior to the analyzed tremor, no significant movements were observed, therefore the results from the descending satellite prove that subsidence accelerated considerably one day after the tremor. An analysis of images helped estimate the epicenter (asterisk in the figures). A distinct local subsidence trough is visible (Figure 6). In the period from 8th December to 14th December 2017 the dynamics of surface movements decreased, and LOS displacements of the surface reached −49 mm at most (Figure 6). A dynamic phase of ground surface movements was confirmed by the ascending satellite imaging. In the period from 5th December–11th December 2017, surface subsidence in LOS was −102 mm at most (Figure 7). The dynamics of surface movements in the period from 11th December–17th December 2017 was observed to decrease and subsidence at that time reached −46 mm (Figure 7). The image of the subsidence trough in the epicenter was very distinct for the results obtained in the period from 5th December–11th December 2017, i.e., four days after the tremor. This indicates that seismic processes are the secondary cause of the subsidence, while underground copper ore mining is the primary cause of ground movements.
For the second analyzed mining-induced tremor, LOS subsidence obtained from Sentinel-1 satellite descending orbit in the period from 26th December 2017–1st Jan. In 2018, it reached −132 mm at most in LOS with RMSLOS ±6.2 mm (Figure 6). It should be taken into account that the analyzed tremor occurred on 26th December 2017 at 17:42 UTC [1] whereas imaging radar acquisition was performed on 26th December 2017 at 05:08 UTC, about 12 hours before the occurrence of the tremor. Furthermore, during the following sensing period, i.e., from 1st January–7th January 2018, LOS subsidence in the analyzed area amounted to approx. 10 mm at most (Figure 6). If insignificant values of LOS displacement retrieved from the interferogram computed for the previous period, i.e., 20th December–26th December 2017 are taken into account, LOS subsidence in the period from 26th December 2017–1st January 2018 almost entirely corresponds to the impact of the analyzed mining-induced tremor (Figure 6). Similarly, to the 7th December 2017 tremor, the dynamic phase of surface movements occurring within a few days after the mining-induced tremor of 26th December 2017 is confirmed by LOS subsidence observed on the interferograms retrieved from the second geometry of Sentinel-1 satellites (ascending orbit). In the period between 23rd December–29th December 2017, the observed LOS subsidence amounted to a maximum of −128 mm (Figure 7). If no substantial surface movements are taken into account in the period between 20th December–26th December 2017 (Figure 6), it may be assumed that LOS displacements of −128 mm took place within three days after the occurrence of the tremor, i.e., from 26th December to 29th December 2017. In the following sensing period, i.e., between 29th December 2017–4th January 2018, the dynamics of surface movements started to decelerate noticeably. LOS subsidence in this period reached –22 mm at most (Figure 7).
Beginning on the 7th and 10th day after the 7th December 2017 tremor, the observed LOS subsidence started to attenuate as proved by the interferograms retrieved from the descending satellite imaging in the period between 14th December–20th December and the ascending satellite in the period between 17th December–23rd December 2017 (Figure 6 and Figure 7). Similarly, starting from the 7th day after the mining-induced tremor of 26th December 2017, reduced surface movements were observed on the interferogram retrieved from the descending Sentinel-1 satellite orbit (Figure 6).
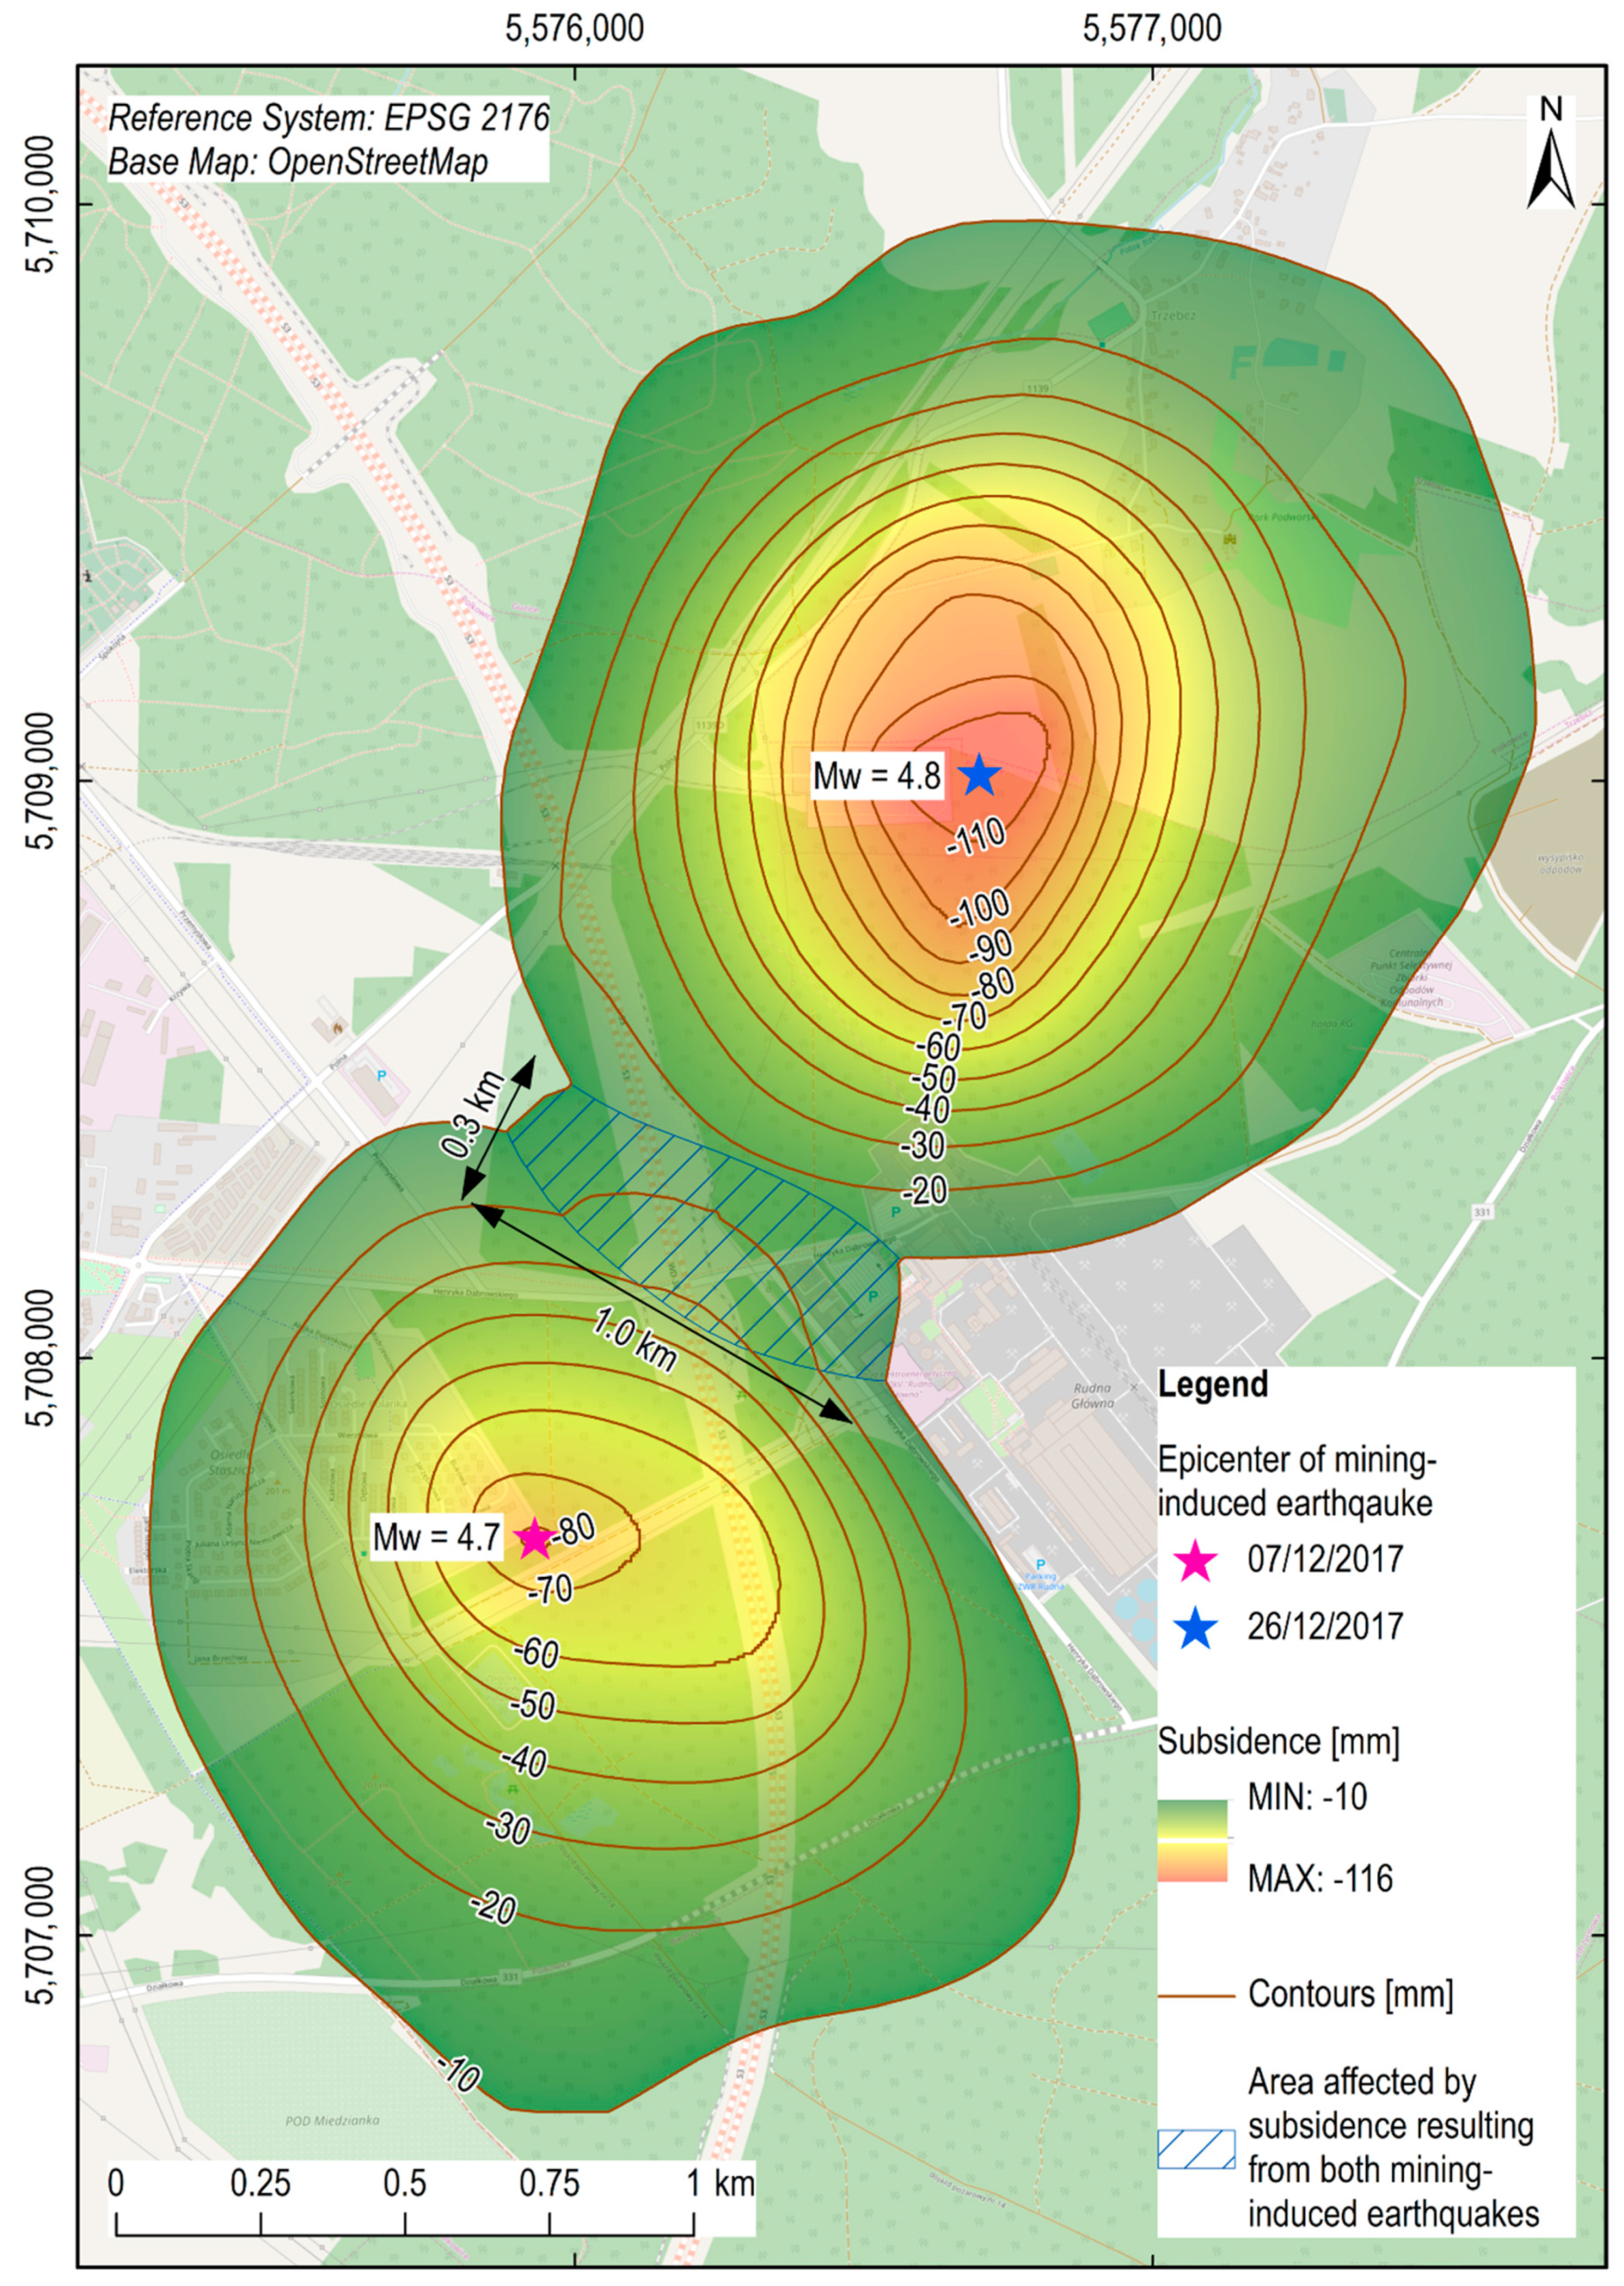
The 12-days interferograms give the bases for delineating the whole subsidence troughs formed in that area (see Section 3, Figure 5). A geostatistical method based on kriging was used to carry out interpolation. An analysis of the semivariogram was done as well. The nugget effect obtained at the level of 4 mm confirms the calculated RMSv value at a significance level α = 0.10 (see Section 3). Maximum vertical displacements generated through the interpolation eventually reached −84 mm and −116 mm for mining-induced tremors of 7th and 26th December 2017, respectively. For these values, RMSv ±8.6 mm has been determined, which confirms the reliability of maximum vertical displacements. The size of the subsidence trough generated by the first analyzed tremor was about 1.8 km to 2.2 km, with a surface of about 2.1 km2, and a volume of ca. 41,000 m3. The subsidence trough induced by the second analyzed tremor was about 2.0 km to 2.4 km, with a surface of ca. 2.8 km2, and a volume of approx. 50,000 m3. The total area affected by both mining-induced tremors analyzed in this paper reached about 4.5 km2, had a volume of approximately 91,000 m3, and spatial dimension of ca. 1.2 km to 4.2 km (Figure 8).
5. Discussion
Unfortunately, one cannot prejudge the accuracy of the ranges and volumes of the subsidence troughs discussed above. Only the so-called internal accuracy resulting directly from the InSAR method must be regarded as sufficient to evaluate the above results. The location of the epicenter cannot be predicted, so it is difficult, or in practice, impossible to monitor displacements caused by earthquakes by other measuring methods. The area of the accumulating impact of the two analyzed mining-induced earthquakes was observed at the outline of the subsidence troughs. The dimension was approx. 0.3 km to 1.2 km, it had a surface of ca. 0.17 km2, a volume of about 3000 m3 and the maximum values of vertical ground movements amounted up to −30 mm. There was a superposition of subsidence resulting from the occurrence of the two tremors in the analysed area. This may indicate that mining-induced earthquakes with a magnitude of 4.7–4.8 cause only partial compaction of the rock mass. Furthermore, the subsidence troughs are regular in shape and the center might correspond with the epicenter of mining-induced earthquakes estimated by EMSC [1]. The algorithms used to determine the earthquake epicenter are mainly based on the analysis of seismograms obtained from various field stations. Such analysis is mostly carried out with the use of the combined resection method with surplus data [1,2,3]. For this reason, such methods are ambiguous and do not allow to determine the earthquake epicenter. Moreover, the accuracy of the mining-induced earthquake epicenter estimation depends mainly on the earthquake energy. It may even be estimated with an accuracy of tens of kilometers. Therefore, the presented method can be used for epicenter estimation of such a type of seismic event.
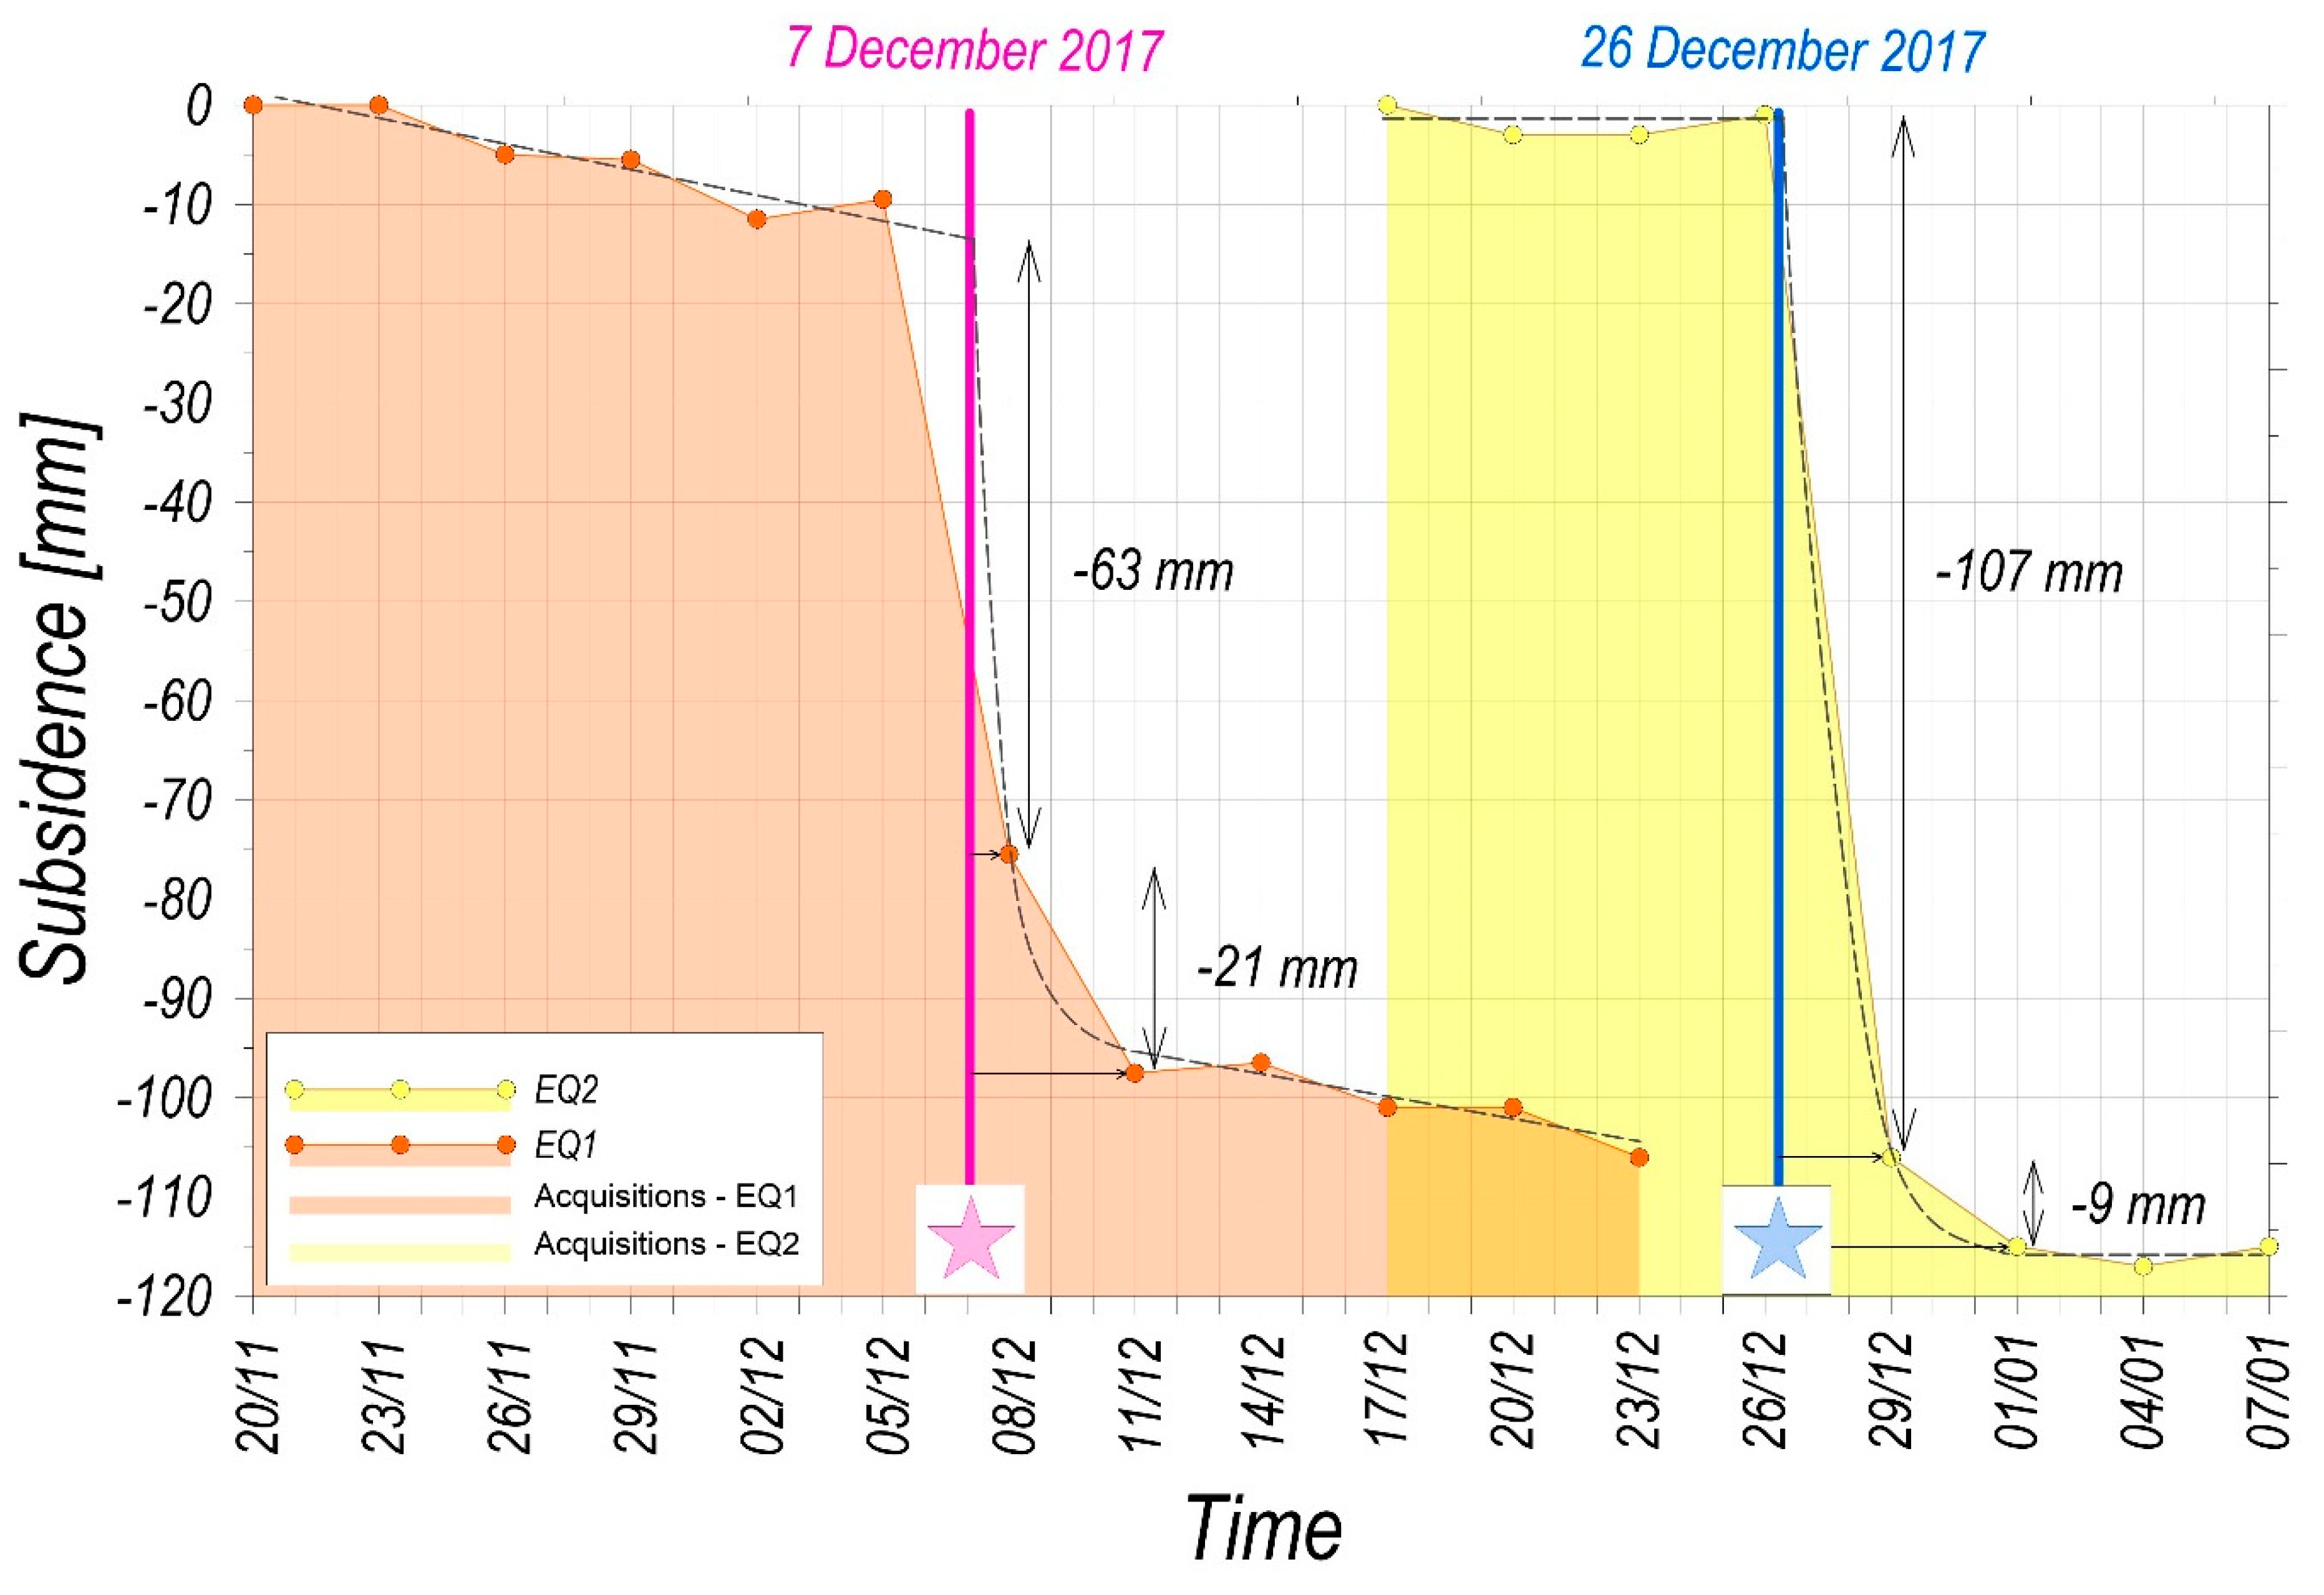
Subsidence in the centers of the two forming local troughs was analyzed considering the dynamics of vertical movements (Figure 9). Based on the assumption that horizontal displacement equals 0.0 m in the center of the deformation field, the vertical movements of ground surface at a 3-day interval were analyzed [34]. The linear trend of deformation was fitted in the time series of vertical movements before the earthquakes and one week afterwards. A non-linear function for the value of subsidence directly following the tremors was used. Subsidence values of −63 mm and −21 mm for the tremor of 7th December 2017 and −107 mm and −9 mm for the tremor of 26th December 2017 were estimated. Vertical displacement up to one day after the mining-induced earthquake (7th December 2017) reached 75% of the maximum subsidence. After three days, up to 92% of maximum subsidence was observed (tremor of 26th December 2017).
It should be emphasized that the daily subsidence rate in the dynamic phase of movements was 20 to 35 mm. Such daily subsidence rates can pose a serious threat to some sensitive technical infrastructure or buildings [35]. However, that problem has not been the subject of the present investigation.
6. Conclusions
Satellite radar interferometry helps to detect ground surface movements caused by mining-induced seismic tremors. The analyses performed with SAR images obtained from Sentinel-1 satellites were used to monitor the vertical movements caused by the tremor of 7th December 2017 and the tremor of 26th December 2017. Local dynamic subsidence troughs of a regular shape and a range of about 2 km induced by these tremors were identified. The maximum vertical displacement in these areas reached −84 mm (7th December 2017) and −116 mm (26th December 2017). The area affected by subsidence resulting from the two mining-induced earthquakes reached approximately 1.2 km by 4.2 km, with the maximum value of subsidence up to −116 mm. Surface movement up to −10 mm with RMSV ±8.6 mm was observed before the tremors occurrence. Satellite imaging was used to delineate surface transformations immediately after the tremors occurred. The stage of dynamic movements lasted for about a week in both cases. The subsidence occurred between the data acquisitions immediately before and after the seismic event. After one week, the surface movements completely attenuated. Accordingly, the daily rate of surface subsidence in the dynamic stage can be estimated as measuring between twenty and thirty-five millimeters. The exact values may only be determined based on permanent surveys, but they were not conducted in that area. Considering a very similar characteristic of surface movements observed in the case of the analyzed tremors and the tremor of 26th November 2016 [12], it can be concluded that there is a relationship between surface displacements and the mining induced tremor magnitude. The study revealed that there is a correlation between the origin of dynamic troughs and the time and location of 3.5–5.0-magnitude earthquake epicenters. Moreover, the maximum dynamic subsidence increments in such troughs was 80–110 mm.
The aim of the present investigation has been to apply SAR to analyze ground movements caused by mining-induced earthquakes. The InSAR data indicated the occurrence of two local subsidence troughs. Those troughs were in a proximity to the epicenter. An analysis of the spatial distribution of the subsidence proved that in the areas where high-energy tremors occur, ground movements could overlap. The spatial pattern of the ground movements reveled superposition of surface displacement in time and space.
Author Contributions
Research concept, R.H., A.A.M.; methodology, W.T.W.; validation, W.T.W., A.G.; formal analysis, W.T.W.; investigation, W.T.W., A.G., A.A.M., R.H.; resources, A.G.; data curation, W.T.W.; writing—original draft preparation, R.H., A.G., W.T.W.; writing—review and editing, R.H., A.A.M.; visualization, A.G.; supervision, A.A.M.; project administration, R.H.; funding acquisition, R.H., A.A.M.
Funding
This research was funded by the Grant for Statutory Research at AGH-University of Science and Technology in Kraków, No. 16.16.150.545.
Acknowledgments
The authors acknowledge the European Space Agency for providing S1 radar images. SAR interferometric analyses were performed using SNAP Software by European Space Agency. Figures and graphs were produced with QGIS.
Conflicts of Interest
The authors declare no conflict of interest.
References
- European Mediterranean Seismological Centre. Available online: www.emsc-csem.org (accessed on 10 May 2019).
- IRIS Incorporated Research Institutions for Seismology. Available online: www.iris.edu (accessed on 10 May 2019).
- Bormann, P.; Wendt, S.; Di Giacomo, D. Seismic Sources and Source Parameters. In New Manual of Seismological Observatory Practice 2 (NMSOP-2); Bormann, P., Ed.; IASPEI; GFZ German Research Centre for Geosciences: Potsdam, Germany, 2013. [Google Scholar]
- Marcak, H.; Pilecki, Z. Assessment of the subsidence ration based on seismic noise measurements in mining terrain. Arch. Min. Sci. 2019, 64, 197–212. [Google Scholar]
- Popiolek, E.; Ostrowski, J.; Czaja, J.; Mazur, J. The Impact of a Strong Mining Tremor on the Subsidence of the Area Surface in the Legnica-Glogow Copper Area. In Proceedings of the 10th FIG International Symposium on Deformation Measurements, International Federation of Surveyors, Orange, CA, USA, 19–22 March 2001; pp. 77–80. [Google Scholar]
- O’Rourke, T.D.; Jeon, S.-S.; Toprak, S.; Cubrinovski, M.; Hughes, M.; van Ballegooy, S.; Bouziou, D. Earthquake Response of Underground Pipeline Networks in Christchurch, NZ. Earthq. Spectra 2014, 30, 183–204. [Google Scholar] [CrossRef]
- Szczerbowski, Z.; Jura, J. Mining induced seismic events and surface deformations monitored by GPS permanent stations. Acta Geodyn. Geomater. 2015, 12, 237–248. [Google Scholar] [CrossRef]
- Fujiwara, S.; Nishimura, T.; Murakami, M.; Nakagawa, H.; Tobita, M.; Rosen, P.A. 2.5-D surface deformation of M6.1 earthquake near Mt Iwate detected by SAR interferometry. Geophys. Res. Lett. 2000, 27, 2049–2052. [Google Scholar]
- Owczarz, K.; Blachowski, J. Analysis of surface displacements caused by mining tremors based on satellite radar interferometry, case study of the Legnica-Glogow Copper District. Przegląd Górniczy 2019, 1, 53–61. (In Polish) [Google Scholar]
- Milczarek, W. Application of a Small Baseline Subset Time Series Method with Atmospheric Correction in Monitoring Results of Mining Activity on Ground Surface and in Detecting Induced Seismic Events. Remote Sens. 2019, 11, 1108. [Google Scholar]
- Milczarek, W. Investigation of post inducted seismic deformation of the 2016 MW 4.2 Tarnovek Poland mining tremor based on DInSAR and SBAS method. Acta Geodyn. Geomater. 2019, 2, 183–193. [Google Scholar] [CrossRef]
- Malinowska, A.A.; Witkowski, W.T.; Guzy, A.; Hejmanowski, R. Mapping ground movements caused by mining-induced earthquakes applying satellite radar interferometry. Eng. Geol. 2018, 246, 402–411. [Google Scholar]
- KGHM Polska Miedź S.A. Available online: www.kghm.com (accessed on 10 May 2019).
- Kaczmarek, W.; Rożek, R. Geology and mining development of the Głogów Głęboki-Przemysłowy deposits (KGHM Polska Miedź S.A.). Gospod. Surowcami Miner. 2008, 24, 1–13. (In Polish) [Google Scholar]
- Goszcz, A. Elements of Rock Mechanics and Rock Burst in Polish Coal and Copper Mines; Polska Akademia Nauk, Instytut Gospodarki Surowcami Mineralnymi i Energią: Kraków, Poland, 1999. (In Polish) [Google Scholar]
- Polish Geological Institute—Central Geological Database. Available online: www.geoportal.pgi.gov.pl (accessed on 10 May 2019).
- Gogolewska, A.; Kaźmierczak, M. Seismic Activity in Chosen Mining Fields in KGHM Polska Miedź S.A. O/ZG Rudna Copper Ore Mine. In CUPRUM—Czasopismo Naukowo-Techniczne Górnictwa Rud; KGHM Cuprum Spółka z o.o. Centrum Badawczo-Rozwojowe: Wrocław, Poland, 2014; Volume 4, pp. 35–54. (In Polish) [Google Scholar]
- Czarny, R.; Pilecki, Z.; Nakata, N.; Pilecka, E.; Krawiec, K.; Harba, P.; Barnas, M. 3D S-wave velocity imaging of a subsurface disturbed by mining using ambient seismic noise. Eng. Geol. 2019, 251, 115–127. [Google Scholar] [CrossRef]
- Burtan, Z. Seismic hazard in the copper mining area adjacent to the faulty zone in RudnaGłówna. Górnictwo i Geoinżynieria 2010, 34, 131–140. (In Polish) [Google Scholar]
- Salski, W. Tectonics of Lubin region. Biul. Inst. Geol. 1975, 24, 61–193. (In Polish) [Google Scholar]
- Salski, W. Tectonic Development of the Area between Lubin and Sieroszowice; Polskie Towarzystwo Geologiczne: Kraków1, Poland, 1977; Volume 1, pp. 27–48. (In Polish) [Google Scholar]
- Dumicz, M.; Don, J. Analysis of the pre-Sudetian monocline structure in the Polkowice region. Acta Univ. Wratislav. 1978, 378, 279–302. (In Polish) [Google Scholar]
- Oberc, J.; Salski, W. Folds and fractures in the Lower Zechstein rocks near the eastern shaft of the Lubin mine. Geol. Quart. 1968, 12, 519–538. (In Polish) [Google Scholar]
- Markiewicz, A.; Suchan, J.; Tomanik, R. Mining exploitation and the tectonic dislocation of Lower/Upper Permian rocks boundary in “Rudna” Mine, the KGHM Polish Copper, S.A. Górnictwo Geoinżynieria 2007, 31, 395–407. (In Polish) [Google Scholar]
- Laskowski, M.; Smokar, Z.; Wróbel, J. The impact of dynamic regional phenomena on underground workings in mines and surface terrain subsidence, based on the example of a rock burst which occurred 19 March 2013 in the operation fields G-/34 of the Rudna Mine. In Zeszyty Naukowe Instytutu Gospodarki Surowcami Mineralnymi i Energią Polskiej Akademii Nauk; Bulletin of The Mineral and Energy Economy Research Institute of the Polish Academy of Sciences: Kraków, Poland, 2014; Volume 86, pp. 83–96. (In Polish) [Google Scholar]
- Butra, J. Cooper ore Deposit Exploitation in Danger of Mining Tremors and Rock Mass Collapsing; Cuprum Centrum Badawczo-Rozwojowe: Wrocław, Poland, 2010. (In Polish) [Google Scholar]
- Dubiński, J.; Konopko, W. Mining Tremors: Evaluation, Prognosis, Elimination; Główny Instytut Górnictwa: Katowice, Poland, 2000. (In Polish) [Google Scholar]
- Zembaty, Z. Rockburst induced ground motion—A comparative study. Soil Dyn. Earthq. Eng. 2004, 24, 11–23. [Google Scholar] [CrossRef]
- Burgmann, R.; Rosen, P.A.; Fielding, E.J. Synthetic aperture radar interferometry to measure Earth’s surface topography and its deformation. Annu. Rev. Earth Planet. Sci. 2000, 28, 169–209. [Google Scholar] [CrossRef]
- Hanssen, R.F. Radar Interferometry: Data Interpretation and Error Analysis; Springer: Dordrecht, The Netherlands, 2001. [Google Scholar]
- Massonet, D.; Feigl, K.L. Radar interferometry and its application to changes in the earth’s surface. Rev. Geophys. 1998, 36, 441–500. [Google Scholar] [CrossRef]
- Zebker, H.A.; Rosen, P.A.; Hensley, S. Atmospheric effects in interferometric synthetic aperture radar surface deformation and topographic maps. J. Geophys. Res. 1997, 102, 7547–7563. [Google Scholar] [CrossRef]
- Samsonov, S.; van der Kooij, M.; Tiampo, K. A simultaneous inversion for deformation rates and topographic errors of DInSAR data utilizing linear least square inversion technique. Comput. Geosci. 2011, 37, 1083–1091. [Google Scholar] [CrossRef]
- Samieie-Esfahany, S.; Hanssen, R.F.; van Thienen-Visser, K.; Muntendam-Bos, A. On the effect of horizontal deformation on InSAR subsidence estimates. In Proceedings of the Fringe 2009 Workshop, Frascati, Italy, 30 November–4 December 2009. [Google Scholar]
- Sroka, A. The impact of highly efficient longwall mining on the ground movements. Glückauf Forsch. 2003, 64, 76–93. (In Germany) [Google Scholar]
Figure 1.
Spatial distribution of mining-induced tremor epicenters versus the time and magnitude of tremor occurrence. The investigated tremor base was indicated with an arrow.
Figure 1.
Spatial distribution of mining-induced tremor epicenters versus the time and magnitude of tremor occurrence. The investigated tremor base was indicated with an arrow.

Figure 2.
(A) Area of interest; (B) location of the area of interest, KGHM Company mining areas and expressway S3; (C) map of study area illustrating the epicenters of mining-induced earthquakes against the background of the town of Polkowice.
Figure 2.
(A) Area of interest; (B) location of the area of interest, KGHM Company mining areas and expressway S3; (C) map of study area illustrating the epicenters of mining-induced earthquakes against the background of the town of Polkowice.

Figure 3.
(A) Geological conditions in the analyzed area at the shearing level of 1000 m; (B) minor faults and shale-free areas in the Zechstein formation above mine workings, according to [15,16].

Figure 4.
(A) Origin of the xenolith and tectonic horst; (B) examples of horizontal deformations in tectonic structures, according to [24].
Figure 4.
(A) Origin of the xenolith and tectonic horst; (B) examples of horizontal deformations in tectonic structures, according to [24].

Figure 5.
The spatial and temporal baselines of Sentinel-1 Synthetic Aperture Radar (SAR) images used in the investigation (ascending orbit—red, descending orbit—blue, data of acquisition is labeled). The red and blue lines represent the analyzed interferograms with the dates of their acquisitions. The dates of mining-induced earthquake occurrence have been indicated by dashed brown lines. The time period of the SAR image acquisition for the two tremors has been shown using light yellow (EQ1) and light orange (EQ2).

Figure 6.
Line of Sight (LOS) terrain surface displacements maps retrieved from Sentinel-1 descending orbit (track 22) in the period between 20th November 2017–7th January 2018.
Figure 6.
Line of Sight (LOS) terrain surface displacements maps retrieved from Sentinel-1 descending orbit (track 22) in the period between 20th November 2017–7th January 2018.

Figure 7.
LOS terrain surface displacements maps retrieved from Sentinel-1 ascending orbit (track 73) in the period between 23rd November 2017–4th January 2018.
Figure 7.
LOS terrain surface displacements maps retrieved from Sentinel-1 ascending orbit (track 73) in the period between 23rd November 2017–4th January 2018.

Figure 8.
Final subsidence bowls caused by mining-induced earthquakes in the period between 5th December 2017–7th January 2018.
Figure 8.
Final subsidence bowls caused by mining-induced earthquakes in the period between 5th December 2017–7th January 2018.

Figure 9.
The surface subsidence (vertical displacement) in the epicenters of mining-induced local subsidence troughs in the period between 20th November 2017–7th January 2018.
Figure 9.
The surface subsidence (vertical displacement) in the epicenters of mining-induced local subsidence troughs in the period between 20th November 2017–7th January 2018.

© 2019 by the authors. Licensee MDPI, Basel, Switzerland. This article is an open access article distributed under the terms and conditions of the Creative Commons Attribution (CC BY) license (http://creativecommons.org/licenses/by/4.0/).
Share and Cite
MDPI and ACS Style
Hejmanowski, R.; Malinowska, A.A.; Witkowski, W.T.; Guzy, A. An Analysis Applying InSAR of Subsidence Caused by Nearby Mining-Induced Earthquakes. Geosciences 2019, 9, 490. https://0-doi-org.brum.beds.ac.uk/10.3390/geosciences9120490
AMA Style
Hejmanowski R, Malinowska AA, Witkowski WT, Guzy A. An Analysis Applying InSAR of Subsidence Caused by Nearby Mining-Induced Earthquakes. Geosciences. 2019; 9(12):490. https://0-doi-org.brum.beds.ac.uk/10.3390/geosciences9120490
Chicago/Turabian StyleHejmanowski, Ryszard, Agnieszka A. Malinowska, Wojciech T. Witkowski, and Artur Guzy. 2019. "An Analysis Applying InSAR of Subsidence Caused by Nearby Mining-Induced Earthquakes" Geosciences 9, no. 12: 490. https://0-doi-org.brum.beds.ac.uk/10.3390/geosciences9120490
Note that from the first issue of 2016, this journal uses article numbers instead of page numbers. See further details here.