Vulnerability of Coastal Beach Tourism to Flooding: A Case Study of Galicia, Spain


1
Department of Business Organization, Business Administration and Tourism School, University of Vigo, 32004 Ourense, Spain
2
School of Business and Economics, Linnaeus University, 39182 Kalmar, Sweden
3
Service Management and Service Studies, Lund University, 25108 Helsingborg, Sweden
4
Western Norway Research Institute, 6851 Sogndal, Norway
5
Department of Management, Marketing & Entrepreneurship, University of Canterbury, Christchurch 8140, New Zealand
6
Department of Geography and Environmental Management, University of Waterloo, Waterloo, ON N2L 3G1, Canada
*
Author to whom correspondence should be addressed.
Environments 2017, 4(4), 83; https://0-doi-org.brum.beds.ac.uk/10.3390/environments4040083
Submission received: 27 September 2017
/
Revised: 6 November 2017
/
Accepted: 11 November 2017
/
Published: 16 November 2017
(This article belongs to the Special Issue Sustainable Territorial Management)
Abstract
:Flooding, as a result of heavy rains and/or storm surges, is a persistent problem in coastal areas. Under scenarios of climate change, there are expectations that flooding events will become more frequent in some areas and potentially more intense. This poses a potential threat to coastal communities relying heavily on coastal resources, such as beaches for tourism. This paper develops a methodology for the assessment of coastal flooding risks, based on an index that compares 16 hydrogeomorphological, biophysical, human exposure and resilience indicators, with a specific focus on tourism. The paper then uses an existing flood vulnerability assessment of 724 beaches in Galicia (Spain) to test the index for tourism. Results indicate that approximately 10% of tourism beaches are at high risk to flooding, including 10 urban and 36 rural beaches. Implications for adaptation and coastal management are discussed.
1. Introduction
Coastal and marine environments attract hundreds of millions of tourists every year and are a mainstay of the economy for many coastal communities [1]. Mediterranean countries attract almost a third of international tourist arrivals and, including domestic tourism, coastal zones in the Mediterranean receive an estimated 250 million visitors each year [2]. Tourism also has great economic significance in the majority of small island developing states (SIDS) [3]. Coastal zones are central features of these islands and are used for a wide range of tourism and leisure activities including fishing, swimming, snorkeling, windsurfing, water skiing, jet skiing, boating and yachting [1].
Coastal resources are increasingly threatened. External and tourism-related pressures on coastal zones include urbanization and industrial developments, water pollution, loss of mangroves, as well as overuse of fresh water and marine resources [4]. Climate change exacerbates existing problems in coastal zones, as it affects resources of central value to tourism [5] and can lead to more extreme weather events, increased run-off and sedimentation, sea level rise, salinity and acidification [4]. Fresh water stress is projected to affect many coastal regions in the world, with summer water flows being expected to decline by up to 80% in southern Europe and sea level rise leading to the loss of up to 20% of coastal wetlands in many parts of the Mediterranean [6,7]. The temporal patterns and interactions between these impacts, as well as tourist responses to these compounding impacts remain insufficiently understood [8].
Flood events can negatively affect beach resources through erosion, but have so far received only limited attention in the literature. Globally, the frequency of coastal flooding is expected to double in lower latitudes within decades due to sea-level rise [9], causing significant economic damage [10]. Floods can be caused by rivers, as a result of changing rainfall patterns, as well as by storm surges linked to wave patterns, tides and coastal features [11]. Where storm surges and river floods coincide, this can have negative consequences for beaches and recreational areas, in particular those located in estuaries and river mouths [12].
To provide new insights into these processes and their consequences for tourism, this paper develops a method for the assessment of coastal beach vulnerability to flooding, based on a case study of Galicia, Spain. Droughts and floods have been identified as a specific threat for the region that is located in the north of the country and heavily dependent on tourism [13].
2. Flooding and Tourism in Spain
Floods are the most prevalent and economically significant natural disaster in Europe [14]. For example, in the summer of 2002, floods in central Europe affected 4.2 million people and caused economic losses in excess of €18 billion [15], an estimate that excludes the social cost of disrupted health care or schooling [16]. In Spain, torrential rains and drought are the two major natural hazards [17]. Floods kill on average 20 people per year and lead to economic losses in the order of €800 million [18,19].
Climate change is anticipated to increase the frequency and intensity of rainfall events that will, correspondingly, cause more intense and frequent river flooding [20,21,22]. The IPCC [11] emphasizes that Europe faces significant risks of river and coastal flooding related to changes in land use, sea level rise, coastal erosion and extreme rainfall events (see also [23,24]). In Galicia exposure risks are also exacerbated by [25]:
- Infrastructure that limits channeling capacity;
- Drainage systems with insufficient capacity;
- Lack of maintenance of drainage systems;
- Ecosystem modification;
- Inappropriate land management and land use, including development in flood zones;
- Forest fires that reduce forest water storage capacity as a result of vegetation loss.
Tourism is a sector of central economic importance in Spain, a country that is ranked third in the world for international tourist arrivals (65 million) and second in tourism revenues ($65.2 billion) [26]. The sector accounts for 11.1% of Spain’s GDP and 13.0% of its total employment [27]. In Galicia, the sector contributes 11.1% to GDP and employs 12.0% of the workforce [28].
Impacts of climate change on tourism in Spain have been addressed in various studies (e.g., [29,30,31]), with most focusing on demand responses under scenarios of warming [32,33,34,35,36,37]. There is only one study of tourism in Galicia that has focused on the main market for the region: domestic visitors from Madrid [35]. The results of this survey (n = 430) suggest that travel motives of a significant share of tourists (35%) are not influenced by climate variables. For visitors with weather-related motives, mild temperatures are the most attractive and risk of rain is the most aversive. Vazquez and Prada [35] conclude that climate change will actually lead to an increase in arrivals, as a result of a concentration of rainfall events in autumn and increasing temperatures in spring and summer. The study does not consider other vulnerabilities, however. Against this background, this paper seeks to present additional insights regarding the assessment of in particular flood events for tourism in the region.
3. Methodology for the Assessment of Beach Vulnerability
Indicator-based flood vulnerability indices are applicable over different spatial scales, including river basins, sub-catchments and urban areas [38,39,40] and have been used in a growing number of publications focusing on coastal flood vulnerability analysis [41,42,43,44,45]. Coastal tourism is at risk of flooding, which can be compounded by seasonal river discharges in combination with waves and storm surges [44,46,47,48]. The first part of this paper is consequently focused on the development of a methodology for beach vulnerability assessments in the context of tourism.
The methodology is set up as follows: The first part of the paper presents data to be included in a compound index for flooding risks. This index includes hydrological, geomorphological-historical, hydraulic as well as exposure indicators and thus goes beyond the use of indicators as outlined in the European Directive 2007/60/EC for the assessment and management of flood risks. The paper then summarizes available data for the different indicators, as these apply to Galicia, Spain. Given the scarcity of data for several areas, the paper then relies on an existing flood risk assessment for the region as provided by Aguas de Galicia [25]. Based on this identification of at-risk beaches, a specific assessment of tourism vulnerabilities is based on three indicators: Level of visitation, tourism facilities and beach width. These are assessed in terms of being at low, medium, or high risk and assigned a corresponding score on a scale from 1 to 3. Although most floods currently occur in the tourist low season, the analysis is relevant for tourism because infrastructure damage may be difficult to repair in time for the high season. Floods can also change coast morphology or erode beaches and lead to the loss of quality certifications (Blue Flag). Flood risks also need to be seen in light of plans to promote tourism in spring and autumn, when flooding risks are greater. Analysis shows the areas in which such flood risks are particularly high.
3.1. Vulnerability Analysis
Vulnerability is the degree to which geophysical, biological and socio-economic systems are susceptible to and unable to cope with, adverse impacts originating out of environmental, social or territorial elements [6]. Floods are caused by extreme weather phenomena and exacerbated by human activities such as urbanization, land clearance and alterations of coastlines that lead to flood susceptibility. Nicholls et al. [46] identified three key drivers of coastal floods:
- Climate change, which affects sea levels, as well as rainfall and storm frequencies and intensities;
- Sediment supply, which influences flood pathways, coastal geomorphology and ecosystems;
- Socio-economic change, which can alter the type and extent of human activities and behaviors within the floodplain.
To assess beach flood vulnerability at the local scale, relevant variables need to be included in a theoretical framework covering exposure, susceptibility and resilience [42] with regard to hydro-geomorphological, socio-economic & administrative and institutional subsystems [44]. Hydro-geomorphological subsystems comprise exposure indicators that represent coast or catchment basin characteristics, including storm surges, rainfall, sea level rise, river discharge, soil subsidence and elevation above sea. Specific beach structures can make coastlines more resilient. Socio-economic subsystems consider elements that increase the instability of beaches or increase adverse impacts of flooding. Political-administrative subsystems refer to legal and regulatory context, preparedness, coping and recovering strategies, as well as contingency plans and nourishment actions.
3.2. Exposure Indicators for the Hydro-Geomorphological Subsystem
This subsystem’s vulnerability is characterized by fluvial and costal characteristics (morphology), elevation above sea level, frequency of storms/rainfall events, sea level rise, as well as wave energy (Table 1). Exposure is proportional to the length of the coast and the number and density of beaches along the coast. Bays provide greater protection against storms, but they are also preferred human settlement areas. Estuaries host a wide variety of ecosystems and are sensitive to variations in sea level or changes in river flows [51].
3.3. Exposure Indicators of Flood Characteristics
Coastal floods are caused by the combined action of tides, storm surges and wave run-up [52]. Flood-tides are related to a region’s tidal range, wave energy, sediment supply and back barrier setting [53]. Astronomical tide plays an important role in high sea levels, but is predictable, in contrast to storm surges [52]. For some beaches and coastal areas, river discharge can influence flooding, especially when heavy rainfall coincides with extreme ocean conditions [12]. Indicators are shown in Table 2.
3.4. Indicators for Socio-Economic and Political-Administrative Systems
Governance is increasingly recognized as a key factor for adaptive capacity [11]. The analysis of legal and regulatory contexts is an essential part of flood risk assessments [54], including administrative organization, legal frameworks, protected areas, contingency or crisis management plans [46,48,55,56,57] (Table 3).
3.5. Resilience Indicators
Flood resilience describes the systemic ability to experience flooding with minimum damage and rapid recovery [46]. Aspects that can increase resilience include flood-proof infrastructure, dykes and dams, natural coastal morphology and habitat features. Factors such as sediment supply, wind action, or changes in the wave regime can help to prevent beach erosion and contribute to recovery [58,59,60]. Previous exposure to flooding may contribute to learning effects [61]. Resilience indicators are shown in Table 4.
3.6. Uncertainties
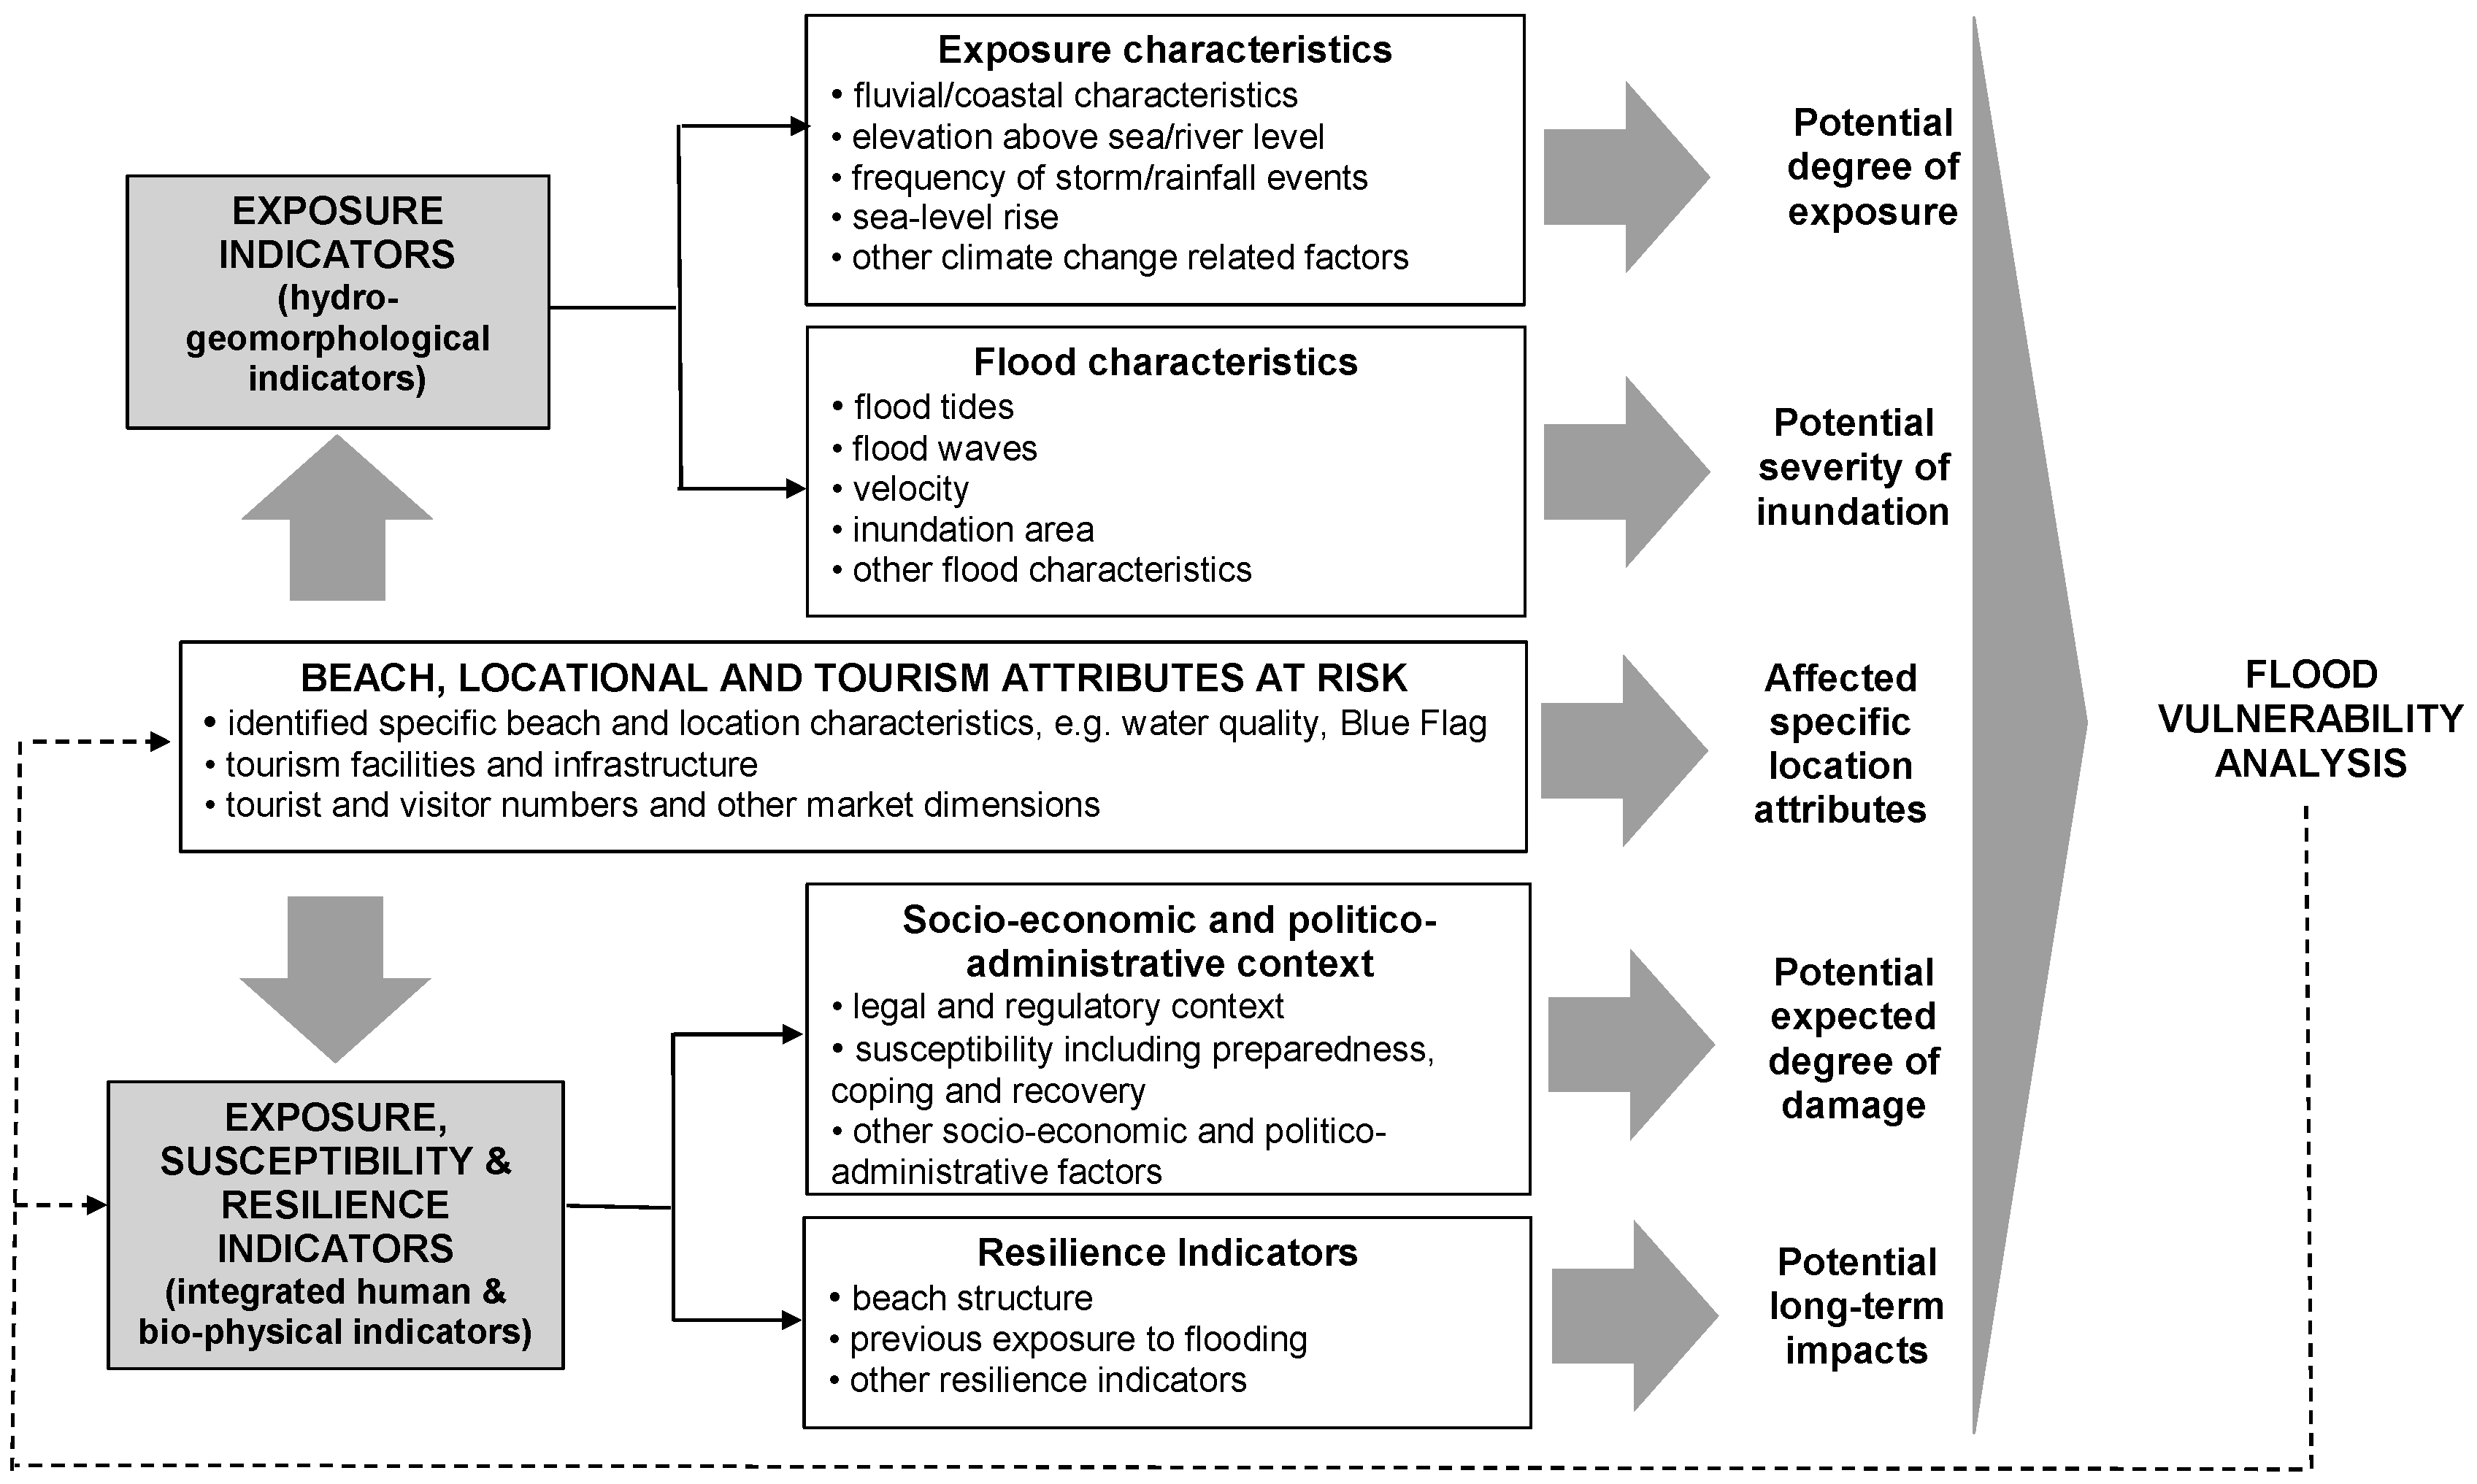
Various uncertainties characterize any assessment of indicators. Data on precipitation, waves, surges or sea level rise is increasingly accurate, but it remains difficult to assess flooding probabilities, specifically under different scenarios of climate change [47]. Even more difficult is the assessment of demand side implication, i.e., as to how flooding events will affect tourist responses [8]. In acknowledging these uncertainties, an index for flood vulnerability assessment has been developed (Figure 1). The figure considers the various indicators, at the center of which are risks for tourism.
3.7. Scaling and Weighting Indicators
In a final step, vulnerability assessments seek to integrate different indicators into a compound index, for which averages or weighted averages may be used [50]. Two main procedures can be distinguished to integrate indicators [42]: Raw values can be used, in which case indicators are presented independently; or values are transformed into homogeneous units. The first method provides data of the selected indicators directly, without manipulation, but is more subjective in its interpretation. The second method provides quantifiable and comparable indices as it standardizes the different measurement variables, but is strongly influenced by outlier observations and the unique value that is derived can hide divergences [50]. Here, weighting is also an issue, as indicators are often weighted based on expert judgment [44,49,62] and hence implying a degree of subjectivity [42,43,63]. In this analysis, the compound index is based on raw values, which has advantages of simplicity [64,65] and is considered sufficient given the tool’s primary function of raising awareness.
4. Beach Vulnerability Assessment: Galicia
Beach tourism has considerable importance in Galicia with its 724 beaches in the North of Spain [66]. A total of 436 marine beaches and 68 river beaches are surveyed regarding water clarity, jellyfish, tar, floating materials, organic waste and other waste [67,68]. As of 2016 three-quarters (75.6%) of beaches were rated excellent for bathing, 16.5% good, 5.8% sufficient and 2.2% poor; 123 beaches are Blue Flag certified [69]. Two coastal areas, Rias Altas and Rias Baixas, receive most of the tourist arrivals (53.7%) and account for most overnight stays (63.2%). Tourism in coastal areas is concentrated in summer (64%), with most overnight stays in June (9.6%), July (18.7%), August (25%) and September (10.7%) [70,71].
4.1. Hydrogeomorphology—Fluvial/Coastal Characteristics
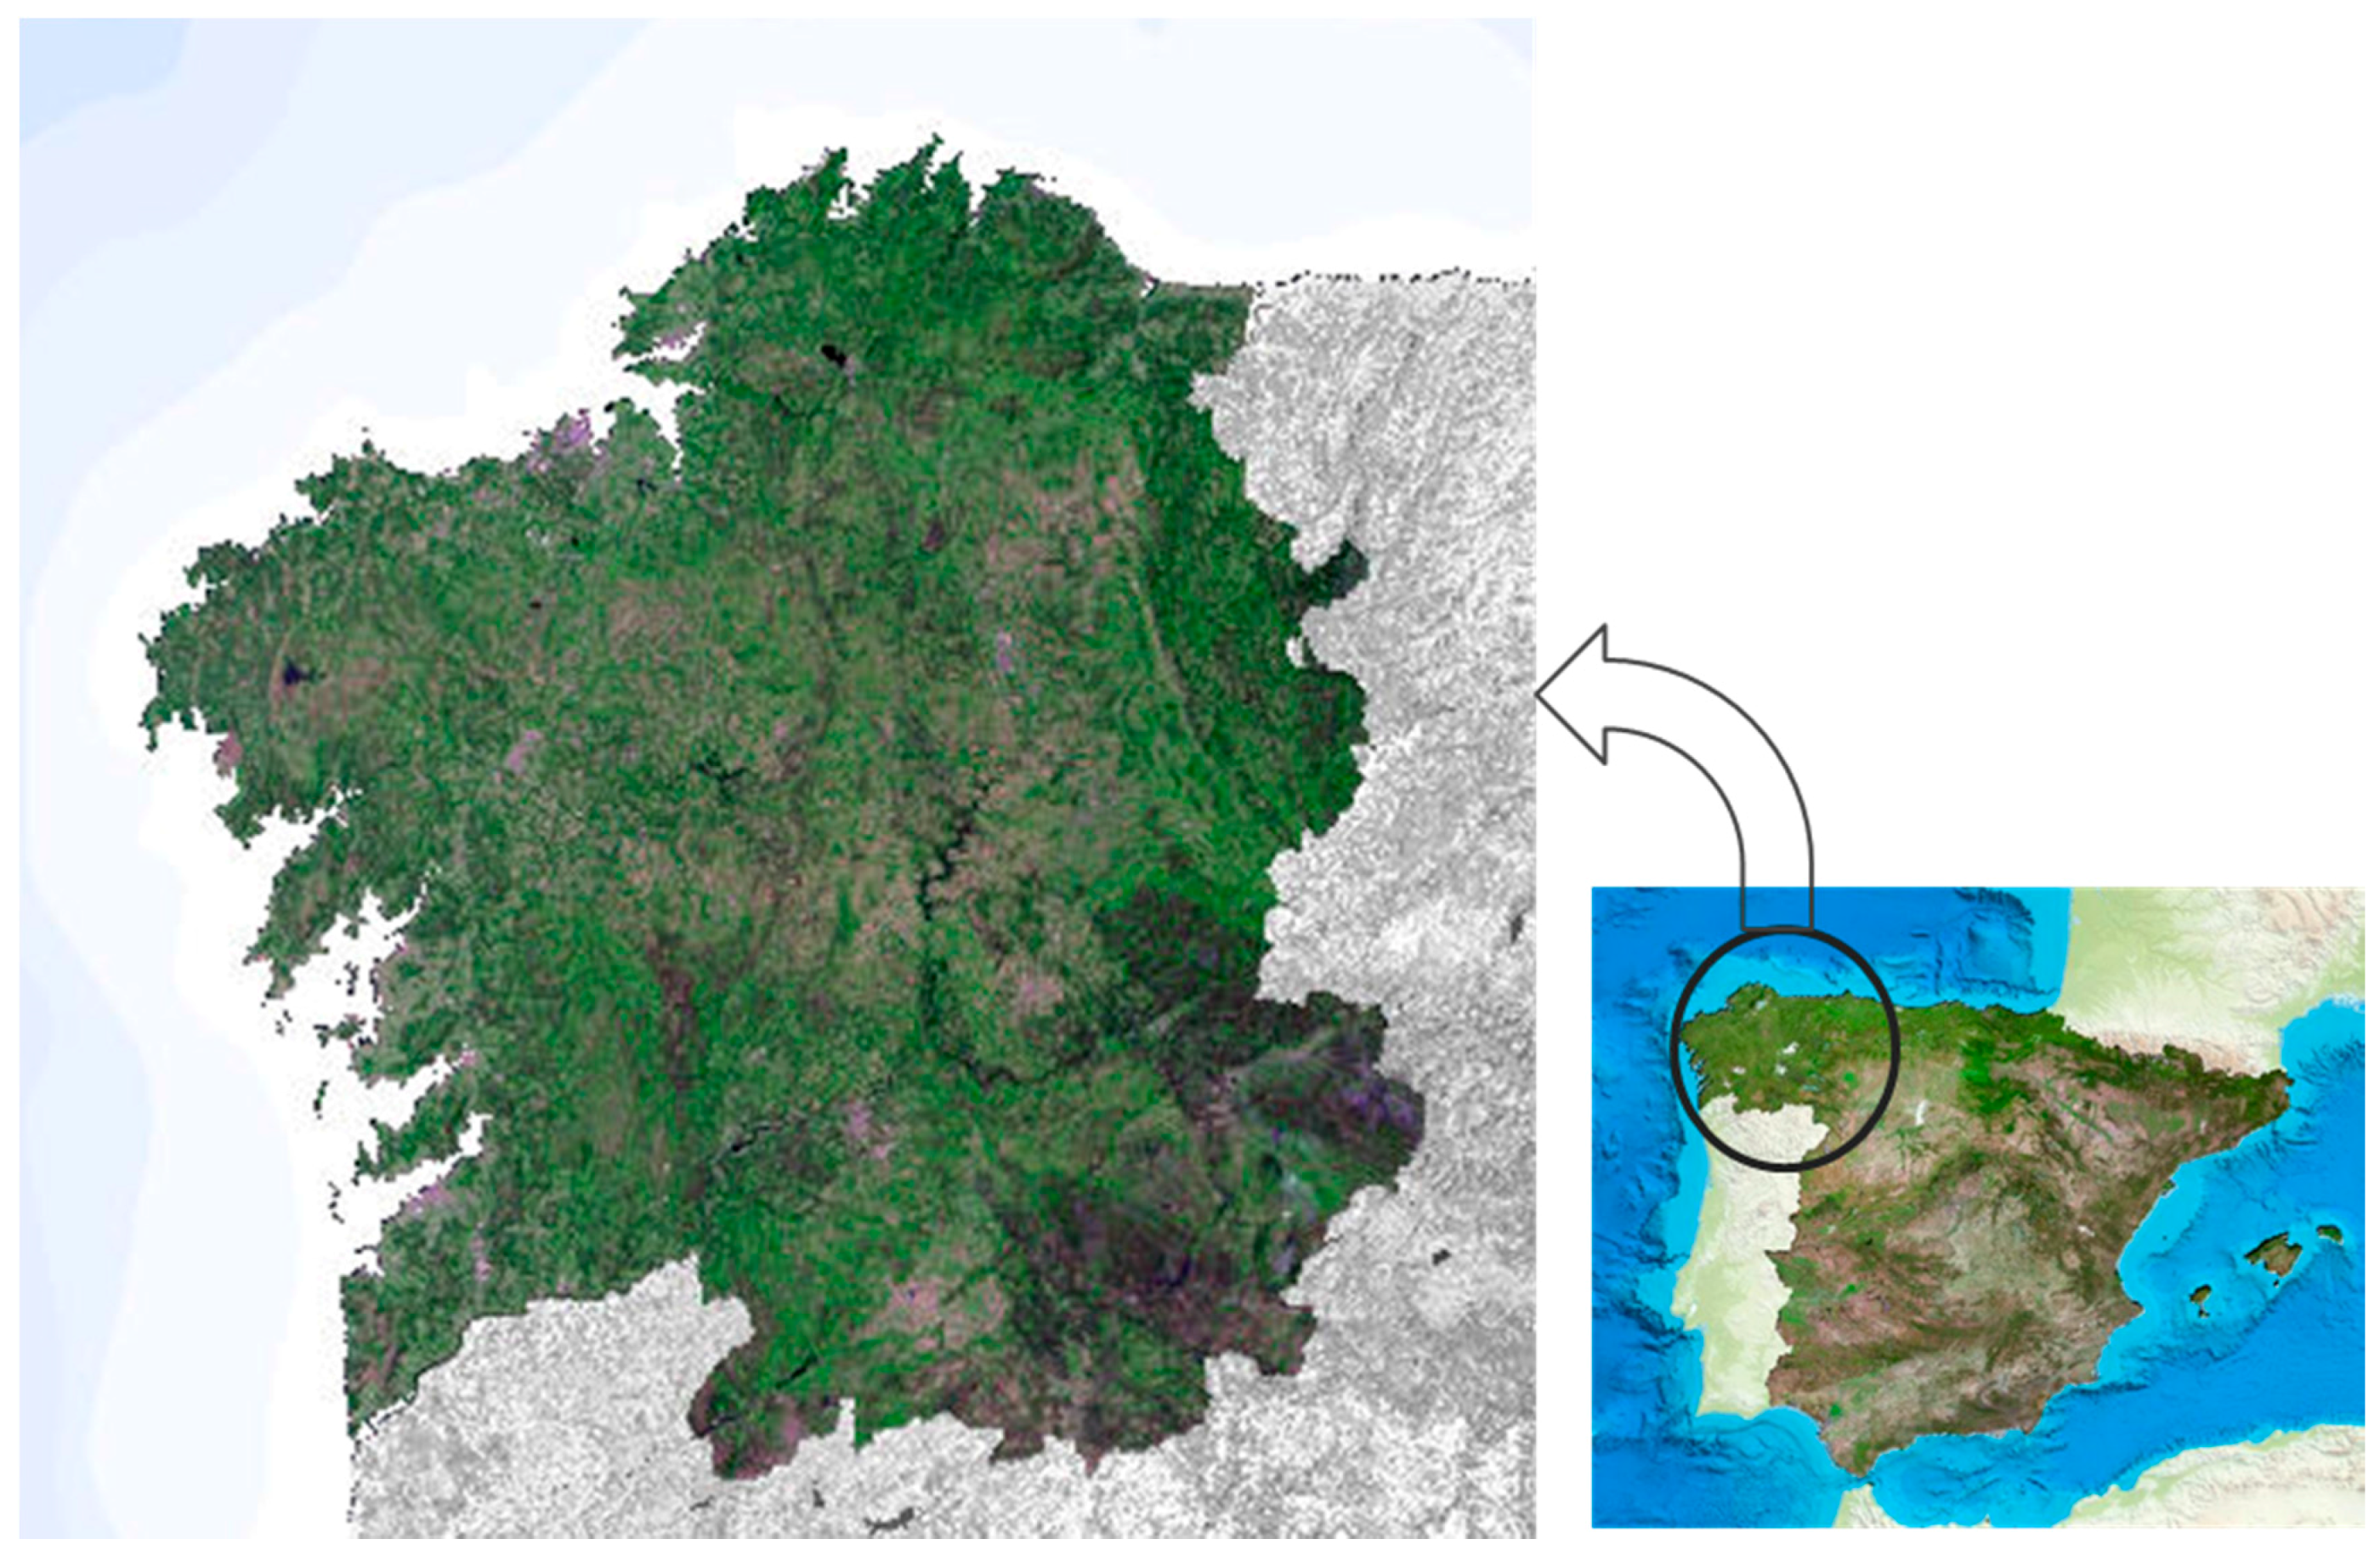
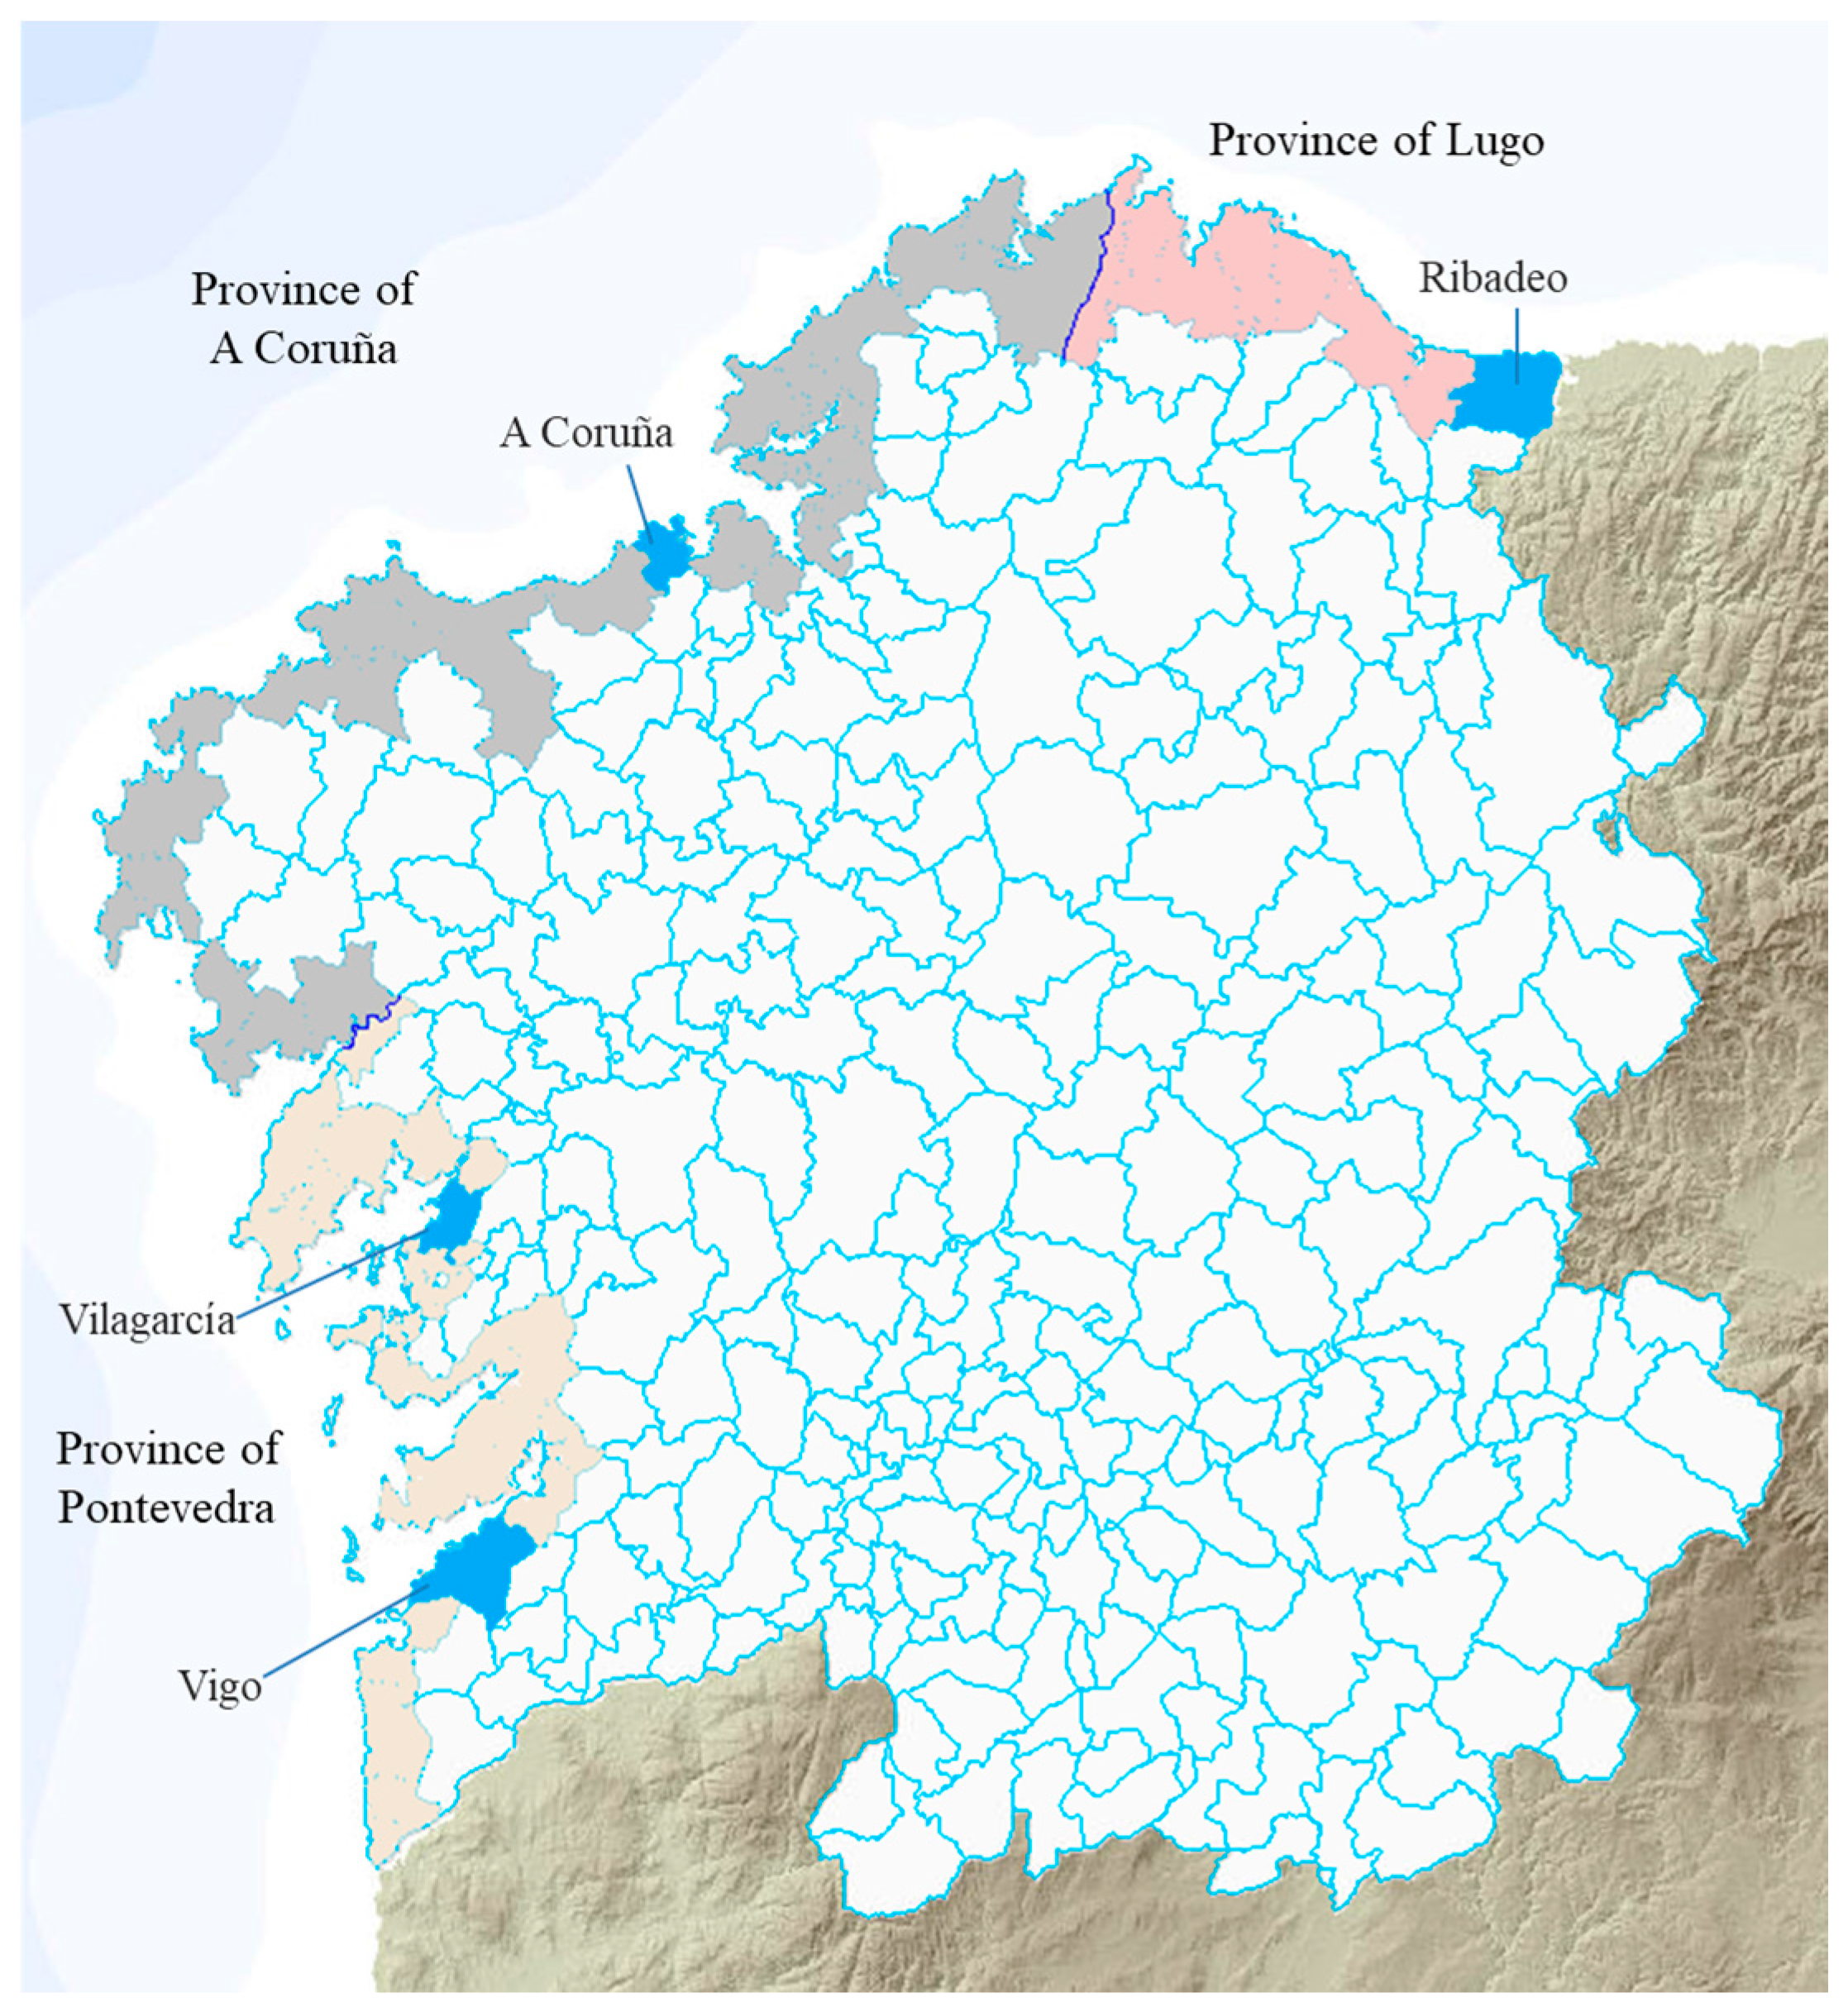
Galicia has an exceptionally long coastline (1720 km), corresponding to about 22% of the national total. A great part of the coast are cliffs (858.8 km), while beaches occupy over 180 km of the coast (17.2 km2). The Atlantic coast has the highest density of beaches; 120 km from the border with Portugal to Cape Finisterre [72]. Figure 2 provides an overview of the coastline and its location within Spain.
The entire region is prone to flooding for interrelated hydrographical and meteorological reasons. Rivers in Galicia are generally short and the region’s river network is very dense. There are 8150 km of waterways representing 39.9% of Spain’s total hydraulic network, in comparison to 5.9% of the country’s surface area.
4.2. Hydrogeomorphology—Elevation above Sea Level
Low Elevation Coastal Zones (LECZ) are land areas including the coastline up to a 10-metre elevation. The extension of the LECZ area in Spain is 5953 km2 (1.19% of the country). In Galicia, the Muros-Noia estuary is the lowest area [73]. The majority of the population in LECZ live in urban areas (84.9%). Throughout the country, the share of the population living in LECZ is expected to rise from 7.7% to 8.1% by 2100 [73].
4.3. Hydrogeomorphology—Frequency of Rainfall Events
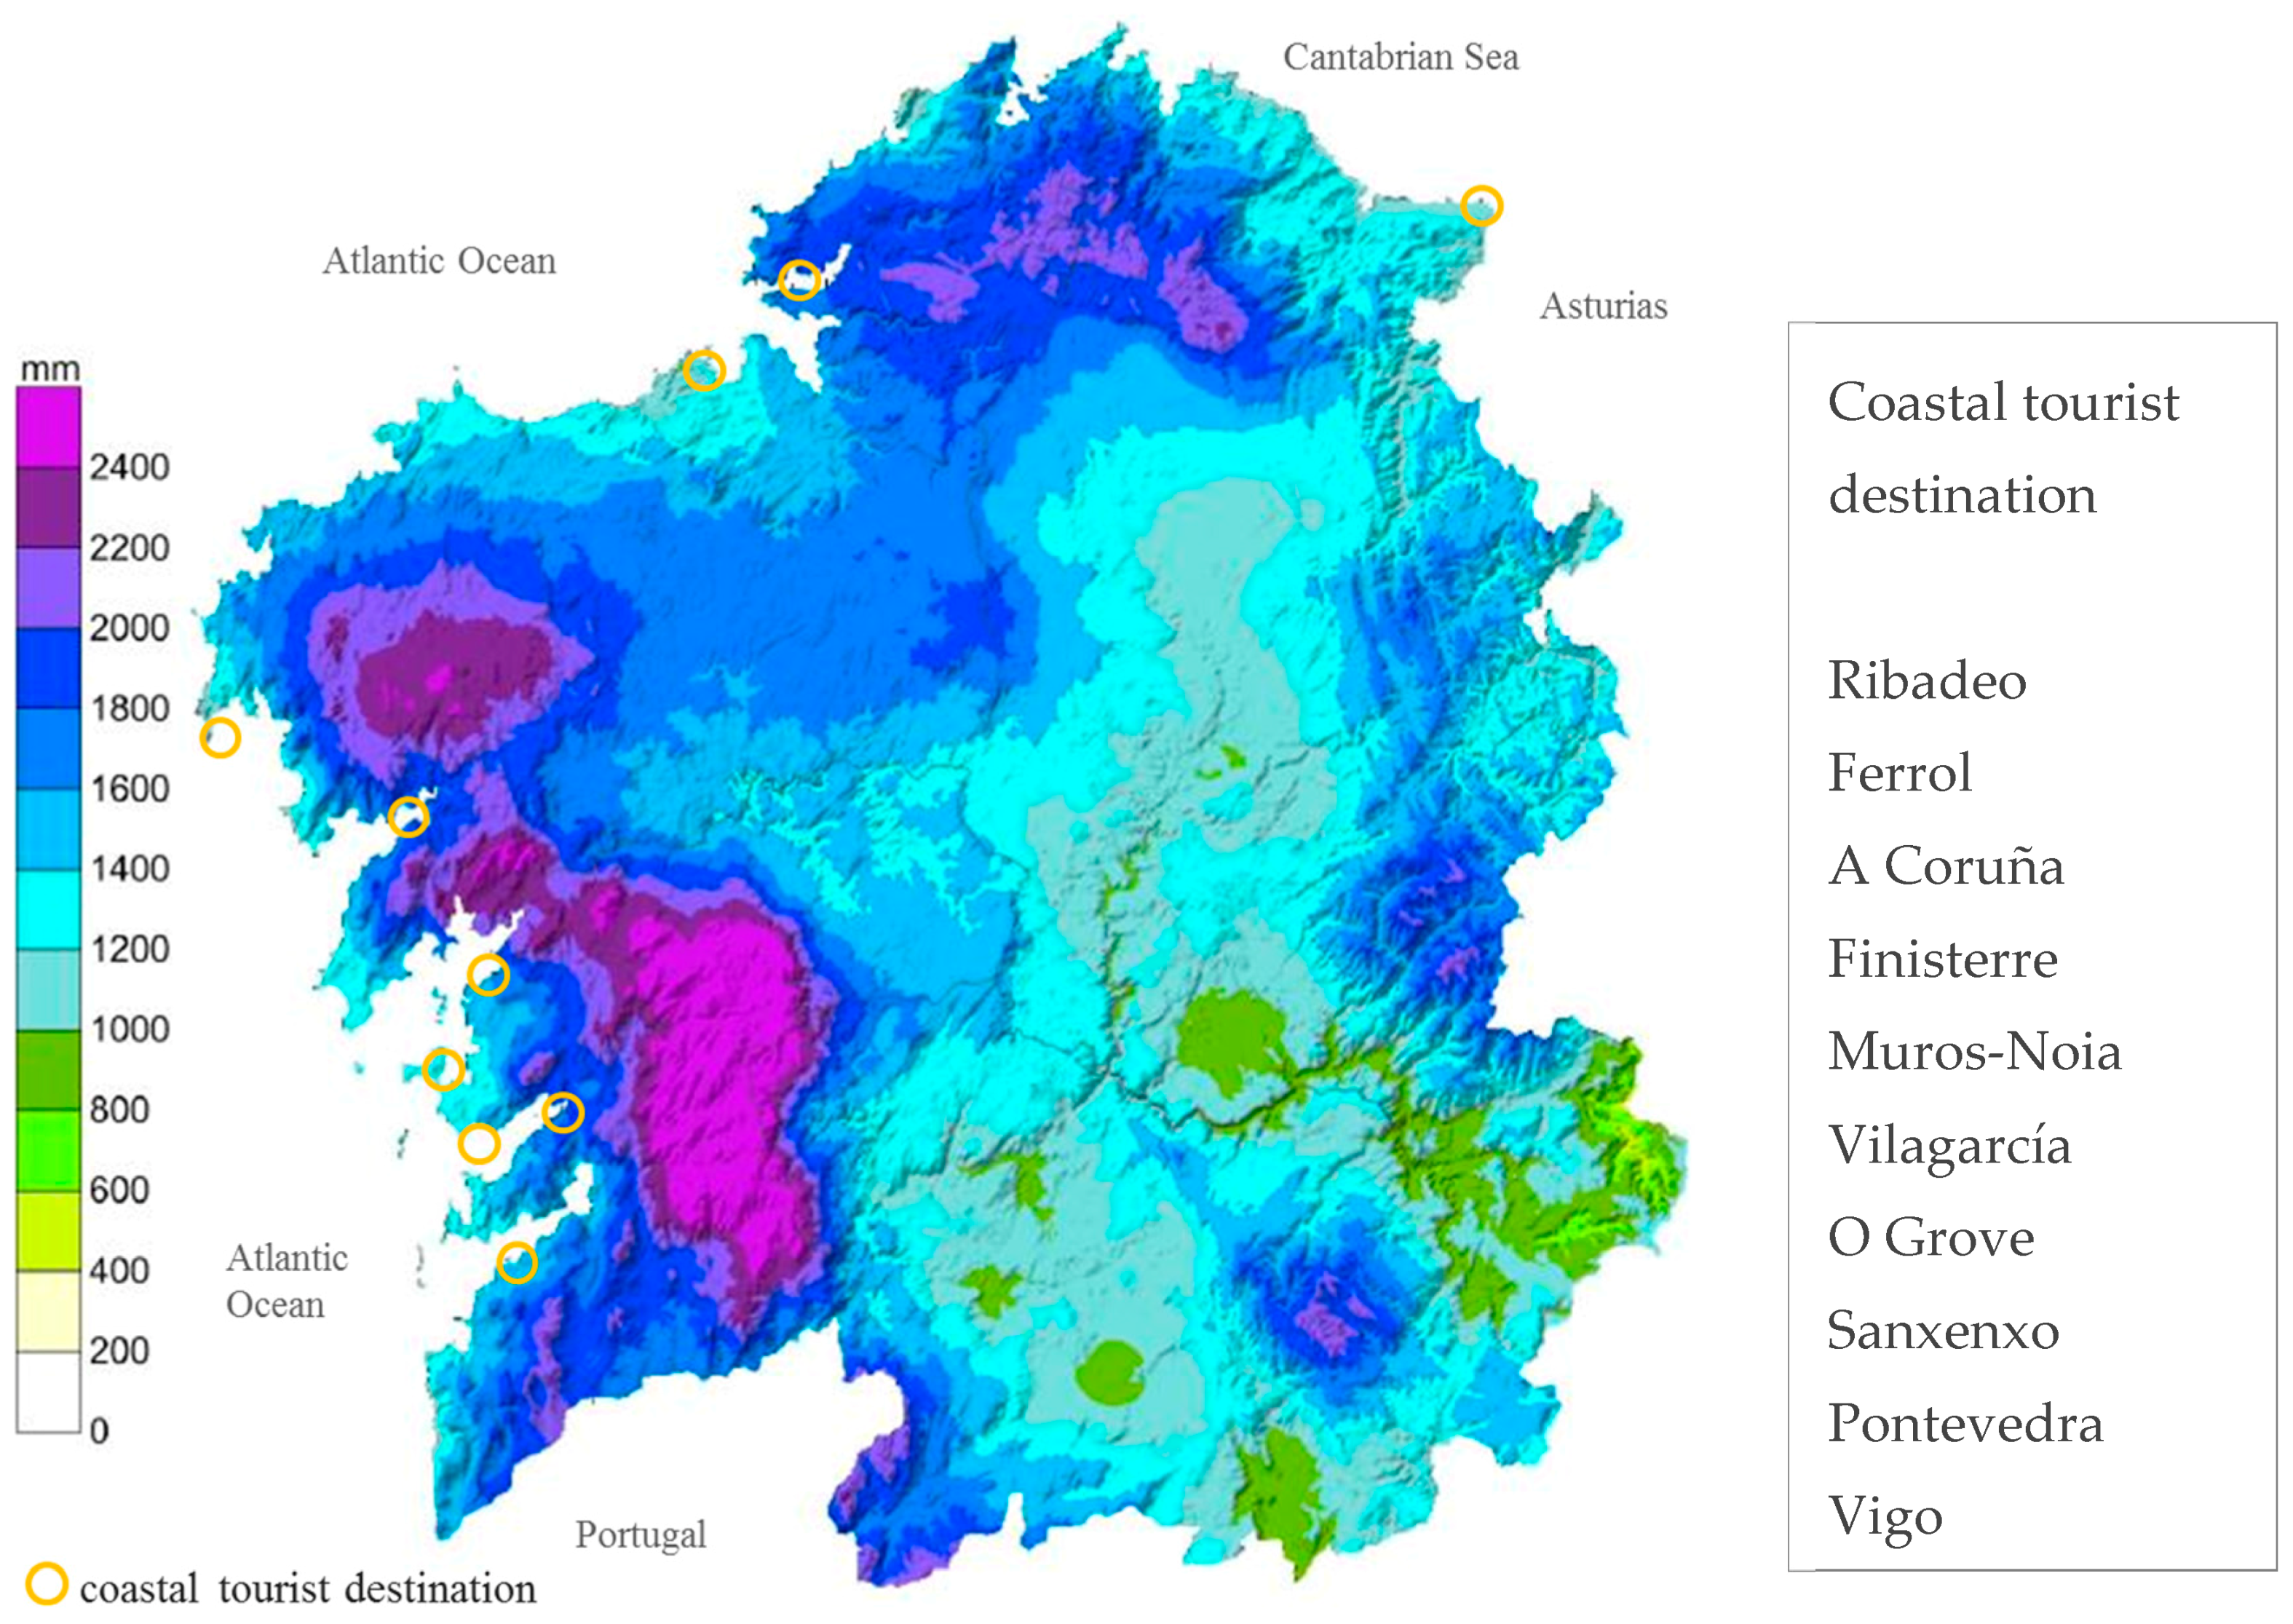
Intense and frequent rainfall periods are often observed in Galicia [74] and are expected to increase substantially in autumn and winter, as well as in summer [75,76,77]. The average annual rainfall in Galicia is 1281 mm/yr [78], which can be compared to the Spanish average of about 500 mm/yr [79]. Within Galicia, there are notable differences in rainfall, ranging between 1014 mm in the North (A Coruña) to 1613 mm in the South (Pontevedra). Over the last 10 years, rainfall has fluctuated between 880–1800 mm/yr on the north coast and between 700–2050 mm/yr in the South, indicating considerable variability between years [80]. Over the year, rainfall is most intense in October-February; June-August are driest in both areas [80]. Figure 3 shows the geographical distribution of rainfall patterns in the main coastal tourist destinations [70,78].
4.4. Hydrogeomorphology—Frequency of Storms
The severity of a storm at the coast is a result of wave height and wave period [81]. Storms coming from the northwest cause the highest waves (42%). During the period 2004–2016, waves exceeded 10 m in 11 months and 8 m in 35 months. The maximum height reached by a wave was 27.8 m (storm “Christina” in 2014; [82]).
4.5. Hydrogeomorphology—Sea Level Rise
IPCC projections on sea level rise range from 26 cm to 82 cm by 2100 [7]. Projected sea level rise at the Galician coast averages 2–2.7 cm per decade [83]. Sea levels vary between summer and winter and trends of storm surges for the last 20 years are positive for the Atlantic, showing values around 0.5 mm/yr [84]. A sea level rise of 0.5 m could lead to the disappearance of about 22 km of beaches in the Basque Country and Cantabria—i.e., approximately 30% of the beach coastline in these regions [51].
4.6. Flood Characteristics—Tides, Waves, Velocity and Inundation Area
The magnitude of astronomical tides along the Spanish coast varies and oscillations can reach 4 m in the Cantabrian and Atlantic coasts, compared to a few centimeters in the Mediterranean [52]. The spring tidal range in Galicia varies between 0.2 m to more than 4.5 m [85]. Galicia is located in a climate zone with frequent low-pressure storms passing through in winter, as well as extra tropical cyclones as a result of rapid atmospheric pressure drops. Rapidly developing storms can bring heavy rains, wind and waves. Over the last 60 years, wave height has increased by 0.2 cm/yr along the Galician coast, with more intense changes during the winter (1.4 cm/yr) [52]. Large waves show an increase of up to 0.8 cm/yr, reflecting a more energetic sea. Average energy flow of the swell in the Cantabrian Sea and the Atlantic coast has grown at a rate of 0.07 W/m2/yr [52].
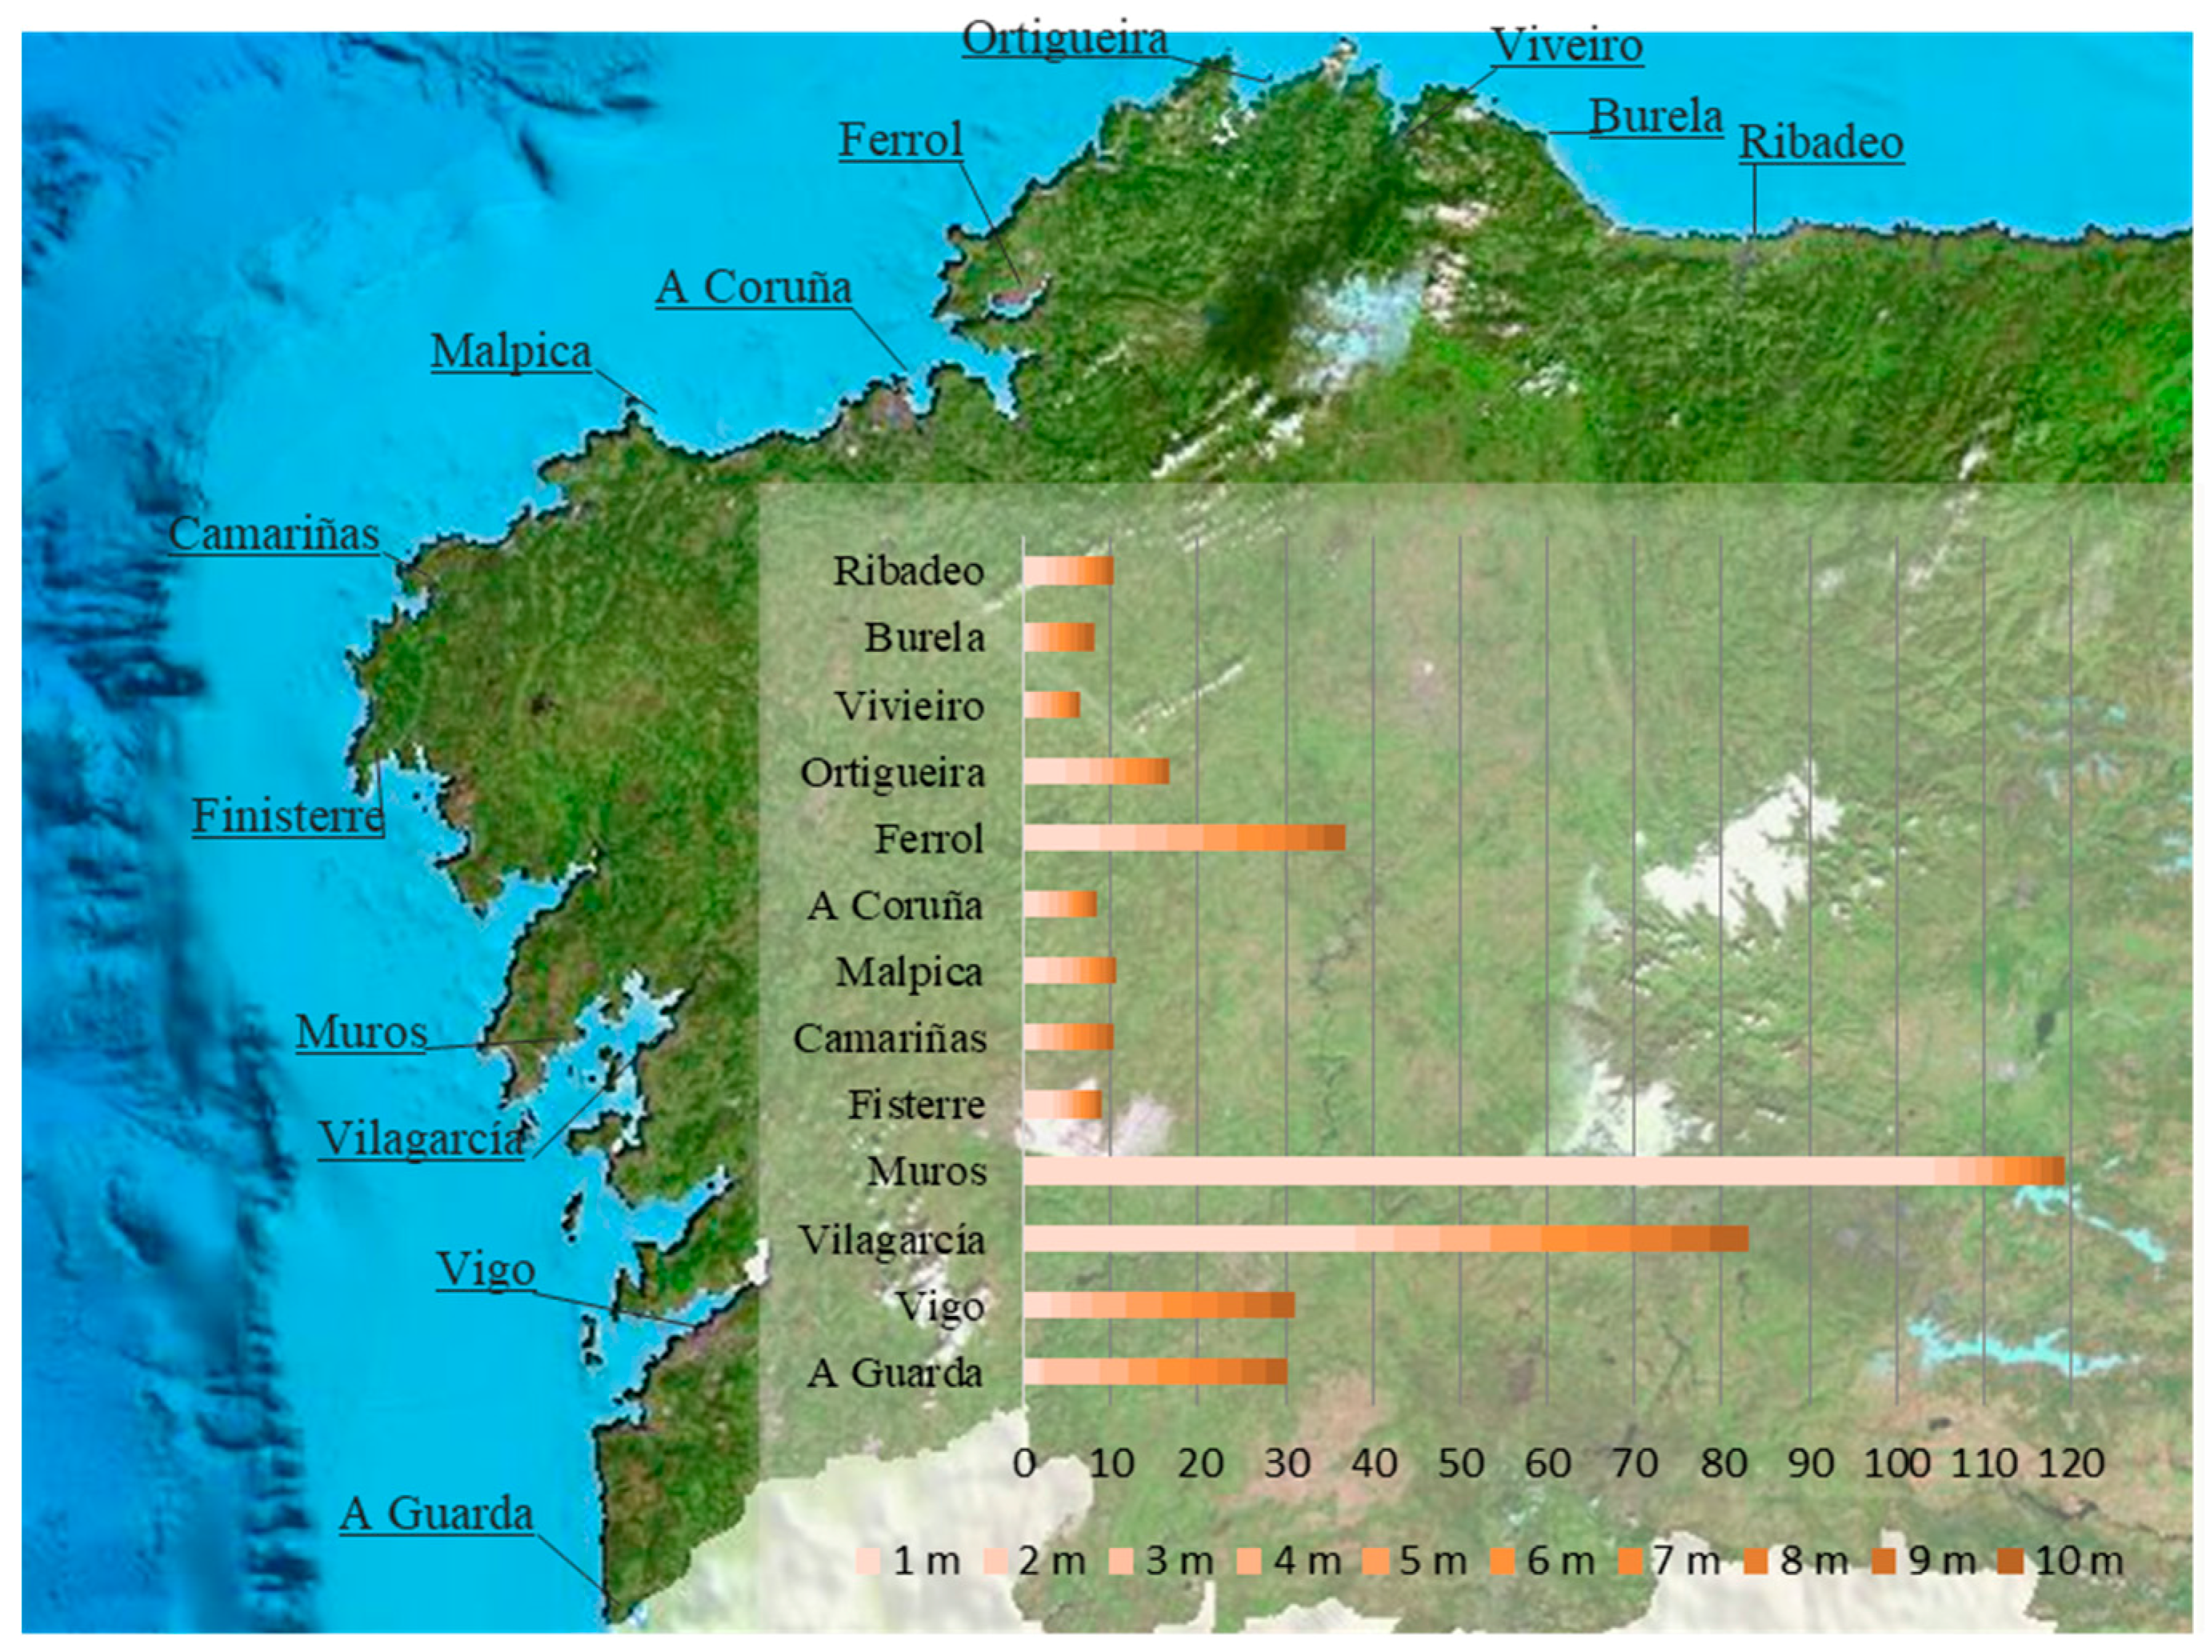
Inundation as a result of flood risks for a return period of 10, 100 and 500 years identifies 210 Areas with Potential Significant Flood Risk (APSFR), including 42 coastal areas [86]. IHCantabria [72] analyzed flooded areas in relation to a potential increase in the level of flooding (considering astronomical tide, storm surge and wave run-up). Figure 4 represents the flooded area (km2) in 13 locations of the Galician coast under flooding level scenarios between 1 and 10 m. Results indicate that most vulnerable area is the Muros-Noia estuary, where a one-meter flooding could inundate 104.3 km2.
4.7. Other Flood Characteristics
Recent years have seen more severe flooding events in Galicia, including beach berm erosion [52]. The 50-year flood level return period (FL50) analyses the potential flood risk due to storms and extreme events. Current FL50 along the coast of Galicia is between 3.44–3.91 m and 5.09–8.42 m for the dissipative, i.e., flat and shallow, beaches [48,72]. Table 5 shows an extrapolation of the long term FL50 trend for four major beach areas in Galicia (2020, 2030 and 2040 in comparison to 1960–1990). Table 6 shows FL50 projections in beaches for the end of century, averaged by provinces and for an interpolation of the trend line for 0.5 m, 0.85 m and 2.0 m sea level rise. The table also shows the FL50 percentage increase for 2100. Figure 5 illustrates the location of the four beach areas in Galicia.
4.8. Socio-Economic and Politico-Administrative Context: Legal and Regulatory Context
Spanish law for the protection and sustainable use of the coast distinguishes Public Maritime-Terrestrial Domains (PMTD) and Easement Zones (EZ). PMTD include inland waters, territorial sea, seashores and estuaries. The EZ comprises the strip of land needed to ensure public access to beaches extending 6–20 m landward from the coastal line; a zone of total protection extending landward from the coastline by 20–100 m; and an influence zone extending 500 m inland from the coastline [48]. Planning and building in this area is regulated by local authorities.
The state, regional and municipal administration have different levels of legal power in the Galician coast. The Spanish state is the owner of the maritime-terrestrial zone, beaches, territorial sea, natural resources of the economic zone and the continental shelf and responsible for ensuring its protection and conservation. As an Autonomous Community, Galicia has exclusive legal power over matters of land use planning, urban planning, coastal management, fishing in the estuaries, aquaculture, or port matters. It also has exclusive power in tourism promotion and management in its territory (Article 27.21 Statute of Autonomy).
“Landscape” and “Natural environment” are the most valued attributes when choosing Galicia as a destination, highlighted by a fifth of travelers (20.7%) as a reason for visitation [87]. This is also because Spain has established a wide range of protected areas, including conservation areas, protection areas for birds, biosphere reserves and others. In Galicia, 27 beaches under some form of environmental protection are formally recognized as Areas with Potential Significant Flood Risk (APSFR) [86].
4.9. Socio-Economic and Politico-Administrative Context: Susceptibility Including Preparedness, Coping and Recovery
Flood risk management in Spain is based on: (1) identification of Areas with Potential Significant Flood Risk, (2) danger maps for the entire Spanish coast and (3) management plans. At the national level, the General Direction for Sustainability of the Coast and Sea carries out the assessment of flood risks and also implements the European Flood Directive [88]. Regional plans include the Special Civil Protection Plan for Flood Risk in Galicia (Inungal, June 2016) and the Flood Risk Management Plan of Galicia-Costa 2015–2021 (January 2016), covering aspects of prevention-protection, preparation, recovery and evaluation.
Coastal erosion and the risks associated with flooding have led to the implementation of contingency plans and beach nourishment actions. Awareness and preparedness for floods has been growing. Weather forecasts on the arrival of storms are increasingly accurate and early warning systems in place. Storms causing floods mainly take place from October to January and much of the damage they cause can be addressed before arrival numbers peak (June-September). Coastal protection and beach recovery are also addressed in the Plan Litoral, launched in 2014. The plan addresses conservation, sustainability, storm impact mitigation and the protection, conservation and regeneration of beaches and dune systems [89]. There is also the PIMA-Adapta Plan, focused on adaptation to climate change.
4.10. Socio-Economic and Politico-Administrative Context: Other Socio-Economic and Politico-Administrative Factors
The population of the Spanish coastal municipalities increased at an annual rate of 1.9% in the first decade of the 21st century. The population density of the municipalities located on the coast of A Coruña (269 inhabitants/km2) and Lugo (92 inhabitants/km2) is below the average of Spain (435 inhabitants/km2), but higher in Pontevedra (724 inhabitants/km2) [90]. The total population in coastal municipalities is 1.1 million, of which about 11,500 people live in a flood zone [25]. Preferential Flow Zones (PFZs) are areas where serious damage to people and property may occur during flooding events. It is estimated that for a return period of 100 years, 26,800 people (0.53% of the population) live in PFZs in Galicia [25].
4.11. Resilience Indicators—Beach Structure
The coastline of Galicia is comprised of “hard” cliffs, formed by compact rocks that are resistant to erosion. The most important beaches are within the rias or cliff inlets. In the Cantabrian coast, estuaries with large intertidal zones and marshes in their environs are of special importance [51]. Dune ecosystems provide protection against flooding [48], though beach width and sediment supply are also relevant [91]. While there is sea level rise of 2.2–2.5 mm per year in Galicia, there are also cases of dune propagations exceeding 100 m per year [60,92,93].
4.12. Resilience Indicators—Previous Exposure to Flooding
During 1950–2010, eleven people died as a result of floods and 3875 houses were damaged in the provinces of A Coruña, Lugo and Pontevedra [94]. Table 7 provides an overview over historical flood events recorded within the period 1950–2010 in coastal municipalities. Tourism infrastructure, such as accommodation, has often been affected.
4.13. Resilience Indicators—Other Resilience Indicators
Resilience of a society grows when the economic and social conditions of its inhabitants improve. The household disposable income in Galicia in 2015 was €25,614, slightly lower than the average household income in Spain (€26,092; [95]). The poverty risk rate in 2015, understood as the threshold below 60% of the median annual income per unit of consumption in the OECD, is 19.4% for Galicia as compared to Spain’s 22.1%.
5. Tourism Vulnerability Assessment
The vulnerability assessment of 724 beaches in Galicia shows that 76 beaches are located in areas at risk of flooding [25] (see Appendix A for details). Of these beaches, 43 are at risk of coastal floods (waves, storm surges), 26 at risk of fluvial floods (river mouths) and seven at risk of both [86]. Based on this assessment, the vulnerability of these 76 beaches is evaluated with regard to tourism, considering three indicators: Level of visitation, tourism facilities and beach width. These indicators are assessed in terms of being at low, medium, or high risk and assigned a corresponding scoring on a scale from 1 to 3, corresponding to low-moderate-high vulnerabilities (Table 8). Note that “level of visitation”, as the most important aspect, is weighted double. The result is an aggregated number, divided by the number of indicators, resulting in an average vulnerability (low-moderate-high). As outlined, this is an inherently subjective, expert-based approach to a vulnerability assessment [42].
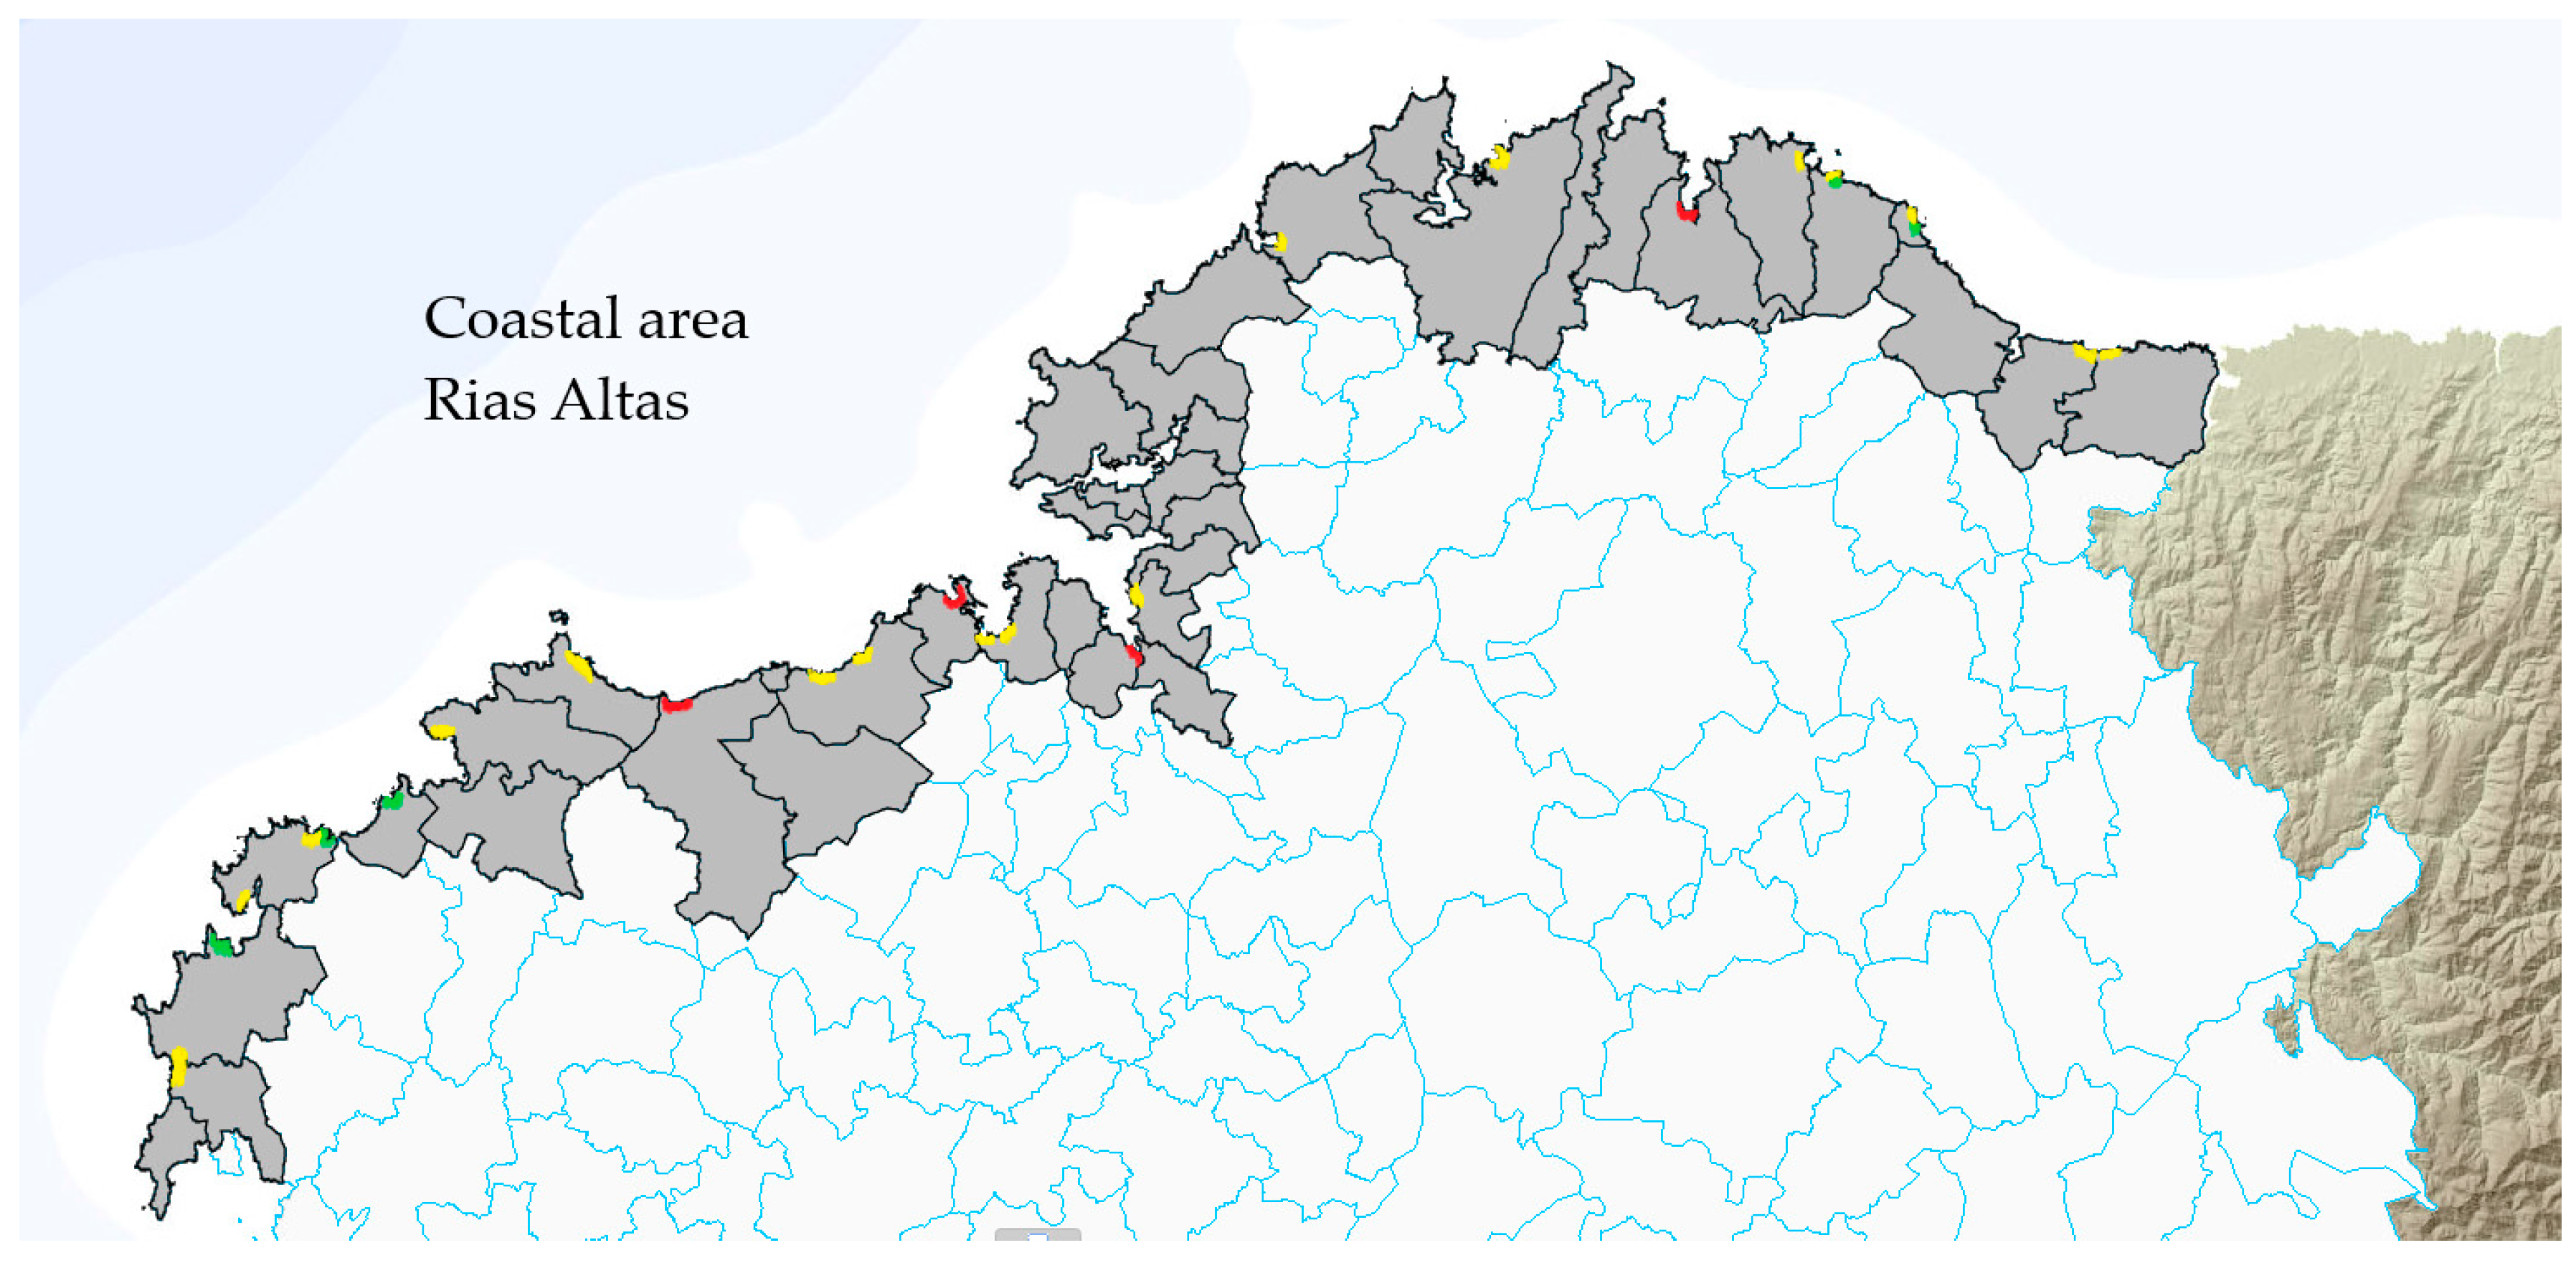
Figure 6 and Figure 7 show the location of at risk beaches, in the context of their tourism vulnerability (low-moderate-high) in two regions, Rias Altas and Rias Baixas. Results indicate that the level of vulnerability of the different beaches varies considerably, indicating potential priorities for additional in-situ vulnerability assessments. While the maps do not suggest geographically focused risks, they highlight a total of 10 beaches at high risk and a significant number of other beaches at risk. The visualization of results in maps does not seem to indicate particular patters, such as specific coastlines being at lower risks than others, even though the south-western part of Rias Altas and the northern part of Rias Baixas appear less vulnerable. The maps also show that highly vulnerable beaches can be located close to those with low risks. For a detailed calculation of one beach, as an illustration of the method, see Appendix B.
6. Discussion and Conclusions
This paper developed a framework for the assessment of beach vulnerability to flood risks in coastal tourism regions. Using the Autonomous Spanish Community of Galicia as an example, 724 beaches have been assessed, of which 76 (11%) were identified as being at risk of flooding. A total of 43 beaches are at risk of flooding by waves, 26 in areas at risk of fluvial flooding in river mouths and 7 beaches are potentially exposed to both. In further analysis, the relative risk for tourism was evaluated for these 76 beaches. Results indicate that tourism vulnerabilities vary, depending on visitation levels, the existence of tourism facilities and beach width. While some at risk beaches have great importance for tourism, others are of little relevance.
An important aspect in the context of tourism and natural disaster risk analyses is their temporal dimension. Analysis shows that flooding events usually occur outside the tourism high season in July and August. However, under scenarios of climate change, it is expected that climate conditions in spring and autumn will become more suitable for tourism and tourism agencies already seek to increase arrivals in what is currently the shoulder season. This will imply a greater risk related to floods, as arrival peaks will become more closely aligned with flooding risks.
Results consequently have various implications for coastal and tourism management. For some beach destinations, the consideration of flooding risks may have to become part of destination planning and, potentially, adaptive measures related to crisis management. This will also require for climate change effects to be considered in planning strategies, such as the construction of roads or accommodation, which need to consider the likelihood of extreme events including flooding under scenarios of climate change. For investors, risk represents a cost, either in terms of insurance, more resilient constructions, reduced attractiveness for tourists, or cancellations in extreme situations, which may include loss of income in situations where infrastructure damage (e.g., roads) prohibits visitation. The severe consequences of flooding for destinations, have for instance been felt in the Caribbean in 2017, following a series of major hurricanes. The development of such frameworks and assessments as presented here can therefore play a significant role in improving the resilience of tourism at various scales [96,97,98].
More generally, coastal management strategies have to consider changed flood risks, also in relation to climate change, to protect important coastal economic, conservation and social assets, including those that are significant for tourism. Fundamental to the management of such assets is the development of beach vulnerability assessments that identify the most at-risk locations. Such information can enable evidence-based decision-making in the development of short and long-term adaptive strategies to reducing flood risk as well as the better allocation of economic resources in response to risk, increasing coastal destination resilience. Such information is valuable for a number of different stakeholders, including government, in determining resource allocation and priorities; insurance companies in their assessment of liabilities; businesses in relation to their own planning, adaptation and risk assessments; as well as those living in coastal areas (risks, property values). The index developed in this paper can also potentially be adapted for other coastal settings, particularly in Europe’s coastal regions where similar data sets are likely to exist. Future work may improve the accuracy of the index, particularly when more data becomes available and as data and frameworks are contrasted to the impacts of actual events. Such developments could, for instance, include tourist demand and behavioral responses to flooding, which are insufficiently understood [5]. A further addition could be the inclusion of economic assessments of the potential direct, i.e., infrastructure damage and indirect, i.e., changes in tourist demand and behavior, costs of flooding into the assessment framework. However, a key issue in the development of such frameworks is the availability of existing indicators and data and the costs of development new ones.
Overall, it is acknowledged that the work presented in this paper is a pilot study that is necessarily based on simplifications. These include the choice of indicators, as well as the assumption that indicators are independent and sometimes extrapolated on the basis of existing trends, i.e., not considering trends in for instance rainfall or storm intensities. Future work should seek to address these issues in order to achieve more robust results.
Acknowledgments
There was no funding for this work.
Author Contributions
Diego R. Toubes conceived the work and collected and analyzed the data; Stefan Gössling interpreted data and drafted the paper; C. Michael Hall drew the conceptual framework, reviewed the methodology and carried out a substantive review and reformulation of the work; and Daniel Scott reviewed the methodology and carried out a substantive review and reformulation of the work.
Conflicts of Interest
The authors declare no conflict of interest.
Appendix A. Beaches Located at Potential Significant Flood Risk Areas in Galicia

Table A1.
Coastal Flood Risk.
| Length | Width | Typology | Population Density | Tourism Facilities and Infrastructure | Water Quality | Blue Flag | Mid-Range of Tidal Flooding (m) | Mid-Range of Wave Flooding (m) | ||||||||
|---|---|---|---|---|---|---|---|---|---|---|---|---|---|---|---|---|
| Beach Name | Municipality | 16 | 15 | 14 | 16 | 15 | 14 | T100 | T500 | T100 | T500 | |||||
| Covas | Viveiro | 1500 | 10–400 | village | High | promenade, camping, recreational area | G | G | G | 124.15 | 126.1 | 11.86 | 11.68 | |||
| O Torno | Cervo | 650 | 30–90 | village | High | Seafront | E | na | G | √ | √ | 34.73 | 35.73 | 23.96 | 25 | |
| Cubelas | 250 | 10–40 | village | Medium | seafront, recreational area | na | P | P | ||||||||
| Caosa | 120 | 15–60 | urban | Low | na | S | S | |||||||||
| Lago | Xove | 700 | 25–80 | rural | Medium | dunes, gardens and rest area | E | E | E | |||||||
| O Portelo | Burela | 460 | 25–110 | village | High | Seafront | E | E | G | √ | √ | √ | 13.02 | 12.38 | 26.28 | 27.18 |
| Penoural | 109 | 35–70 | village | Low | Seafront | P | P | P | ||||||||
| Areal | A Pobra Caramiñal | 1100 | 26 | urban | High | promenade, yacht club, recreational areas | G | G | G | 71.46 | 75.97 | 2.57 | 1.72 | |||
| Corrubedo | Ribeira | 5000 | 25–40 | remote | Medium | natural park | E | E | E | 59.13 | 57.87 | 22.11 | 24.59 | |||
| O Prado | 300 | 25 | village | Medium | anchorage | S | P | P | ||||||||
| Suigrexa | Porto do Son | 420 | 20 | rural | Medium | S | G | E | 29 | 28.8 | 20.66 | 22.62 | ||||
| Fonforrón | 100 | 7 | rural | High | E | E | E | |||||||||
| A Vila | 170 | 15 | village | High | S | G | E | |||||||||
| San Pedro | Carnota | 250 | 160 | village | Low | seafront | G | G | E | 137.62 | 139.22 | 43.86 | 49.81 | |||
| Ézaro | Dumbría | 800 | 28 | rural | Medium | E | E | E | √ | √ | √ | 26.79 | 32.56 | 67.53 | 89.95 | |
| Lires | Cee | 123 | 20 | remote | Medium | P | P | S | 26.52 | 29.72 | 1.41 | 2.2 | ||||
| Langosteira | Fisterra | 1970 | 26 | rural | Medium | E | E | E | √ | √ | 40.45 | 40.55 | 30.69 | 34.78 | ||
| Espiñeirido | Muxía | 250 | 15 | rural | Low | E | E | E | 25.94 | 26.02 | 59.19 | 62.3 | ||||
| A Cruz | 70 | 100 | rural | Medium | E | E | E | |||||||||
| Area da Vila | Camariñas | 200 | 100 | village | Medium | seafront, yacht club | P | P | P | 10.24 | 9.65 | 11.59 | 13.59 | |||
| Arou | 130 | 50 | rural | Medium | seafront | E | E | E | 17.75 | 18.87 | 87.07 | 88.1 | ||||
| Camelle | 150 | 105 | village | Low | seafront | P | P | P | ||||||||
| Soesto | Laxe | 850 | 30 | remote | Low | surf | E | E | E | 62.67 | 67.82 | 171.12 | 173.51 | |||
| Playa Mayor | Malpica | 378 | 60 | urban | High | surf | S | S | P | 15.27 | 15.77 | 18.64 | 18.14 | |||
| Santa Cristina | Oleiros | 1500 | 80 | village | High | E | E | E | √ | √ | √ | 123.35 | 123.18 | 1.35 | 2.35 | |
| Riazor | A Coruña | 570 | 25 | urban | High | promenade, recreational area | E | E | E | √ | √ | √ | 31.6 | 31.95 | 68.47 | 72.07 |
| Orzán | 700 | 30 | urban | High | promenade, recreational area | E | E | E | √ | √ | √ | |||||
| Matadero | 80 | 20 | urban | High | promenade | E | E | E | √ | √ | √ | |||||
| O Pedrido | Bergondo | 500 | 40 | urban | High | camping | S | G | G | 1619.52 | 1632.09 | 14.4 | 11.06 | |||
| A Magdalena | Cedeira | 1400 | 35 | urban | High | recreational area | S | P | S | 20.8 | 21.07 | 31.18 | 31.97 | |||
| Santa Marta | Baiona | 210 | 60–111 | village | High | yacht club | G | G | G | 104.69 | 106.26 | 16.07 | 18.21 | |||
| Ladeira | 1650 | 28–68 | village | High | dunes, camping | G | na | P | √ | |||||||
| América | Nigrán | 1300 | 50–100 | village | High | recreational sport area | E | E | E | √ | √ | √ | ||||
| Panxón | 1100 | 50–200 | urban | High | promenade, yacht club | E | G | na | ||||||||
| Madorra | 350 | 45 | village | High | E | E | G | |||||||||
| Area Fofa | 130 | 25 | rural | Medium | E | G | E | |||||||||
| Patos | 1400 | 25–80 | village | High | seafront, sport area | E | E | E | 45.69 | 45.2 | 20.66 | 23.2 | ||||
| As Canas | 150 | 25–80 | rural | Low | S | S | S | |||||||||
| Muiños de Fortiñón | Vigo | 120 | 60 | rural | High | E | E | E | √ | √ | √ | |||||
| O Portiño | 130 | 30 | village | Low | E | E | E | |||||||||
| A Sobreira | 180 | 35 | rural | Medium | E | E | E | |||||||||
| Arealonga | Redondela | 180 | 35 | rural | Medium | P | P | P | 6.96 | 7.06 | 0.6 | 0.74 | ||||
| A Punta | Vigo | 50 | 5–120 | rural | High | seafront | E | E | E | √ | √ | √ | ||||
| Bouzas | 450 | 25 | village | Medium | seafront | E | E | E | ||||||||
| Portiño | O Grove | 100 | 5–15 | village | Medium | yacht club | E | G | S | 27.69 | 33.6 | 3.48 | 1.67 | |||
| O Bornal | Vilanova de Arousa | 400 | 20 | village | Medium | E | E | E | 104.01 | 104.9 | 2.04 | 2.21 | ||||
| Terrón | 500 | 15 | rural | High | E | E | E | |||||||||
| As Brañas | 150 | 3 | rural | Low | E | E | E | |||||||||
| Con da Mina | 200 | 10 | village | Medium | E | E | E | |||||||||
| A Igrexa | 250 | 6 | rural | Low | E | E | E | |||||||||
Table A2.
Fluvial Flood Risk.
| Length | Width | Typology | Population Density | Tourism Facilities and Infrastructure | Water Quality | Blue Flag | Area of a Potential Fluvial Flooding (km2) | Volume of River Flow (m3/s) | ||||||||||
|---|---|---|---|---|---|---|---|---|---|---|---|---|---|---|---|---|---|---|
| Beach Name | Municipality | 16 | 15 | 14 | 16 | 15 | 14 | T10 | T100 | T500 | T10 | T100 | T500 | |||||
| Esteiro | Ribadeo | 52 | 6–220 | remote | medium | seafront | S | G | G | 0.038 | 0.086 | 0.103 | 7.41 | 17.13 | 26.31 | |||
| Arealonga | Barreiros | 1000 | 45–170 | village | medium | seafront | E | G | G | √ | 0.003 | 0.01 | 0.017 | 2.01 | 4.73 | 7.32 | ||
| Covas * | Viveiro | 1500 | 10–400 | village | high | promenade, camping, ruiniform formations, recreational area | E | E | G | 0.003 | 0.006 | 0.009 | 7.66 | 17.15 | 25.99 | |||
| Sardiñeiro | Fisterra | 370 | 60 | village | low | seafront | P | P | P | 0.005 | 0.002 | 0.022 | 6 | 13.05 | 19.52 | |||
| Lires * | Cee | 123 | 20 | remote | medium | P | P | S | 0.018 | 0.141 | 0.183 | 14.9 | 32.18 | 48 | ||||
| San Pedro * | Carnota | 250 | 160 | village | low | seafront | G | G | E | 0.012 | 0.016 | 0.019 | 4.66 | 8.99 | 12.71 | |||
| San Mamede | 300 | 45 | remote | low | E | E | E | 0.009 | 0.02 | 0.037 | 6.7 | 14.48 | 21.6 | |||||
| Porto Cubelo | 20 | 20 | rural | low | E | E | E | 0.008 | 0.017 | 0.022 | 2.51 | 5.55 | 8.38 | |||||
| A Magdalena * | Cedeira | 1400 | 35 | urban | high | recreational area | S | P | S | 0.012 | 0.034 | 0.048 | 3.77 | 8.8 | 13.56 | |||
| Arnela | Ponteceso | 100 | 20 | urban | medium | seafront | na | P | P | 0.002 | 0.004 | 0.007 | 3.03 | 6.23 | 9.08 | |||
| Razo | Carballo | 800 | 30 | rural | high | dunes, marshland, fossil beach | G | S | S | 0.037 | 0.067 | 0.083 | 14.6 | 31.02 | 45.9 | |||
| A Concha | Ortigueira | 750 | 30 | village | medium | anchorage, cultural heritage | G | E | E | √ | √ | √ | 0.016 | 0.038 | 0.051 | 15.5 | 22.7 | 28 |
| Queiruga | Porto do Son | 1200 | 75 | rural | medium | E | E | E | 0.003 | 0.014 | 0.015 | 3.29 | 6.56 | 9.42 | ||||
| Pozo | 100 | 30 | rural | medium | S | G | E | 0.013 | 0.018 | 0.02 | 7.61 | 14.95 | 21.33 | |||||
| Coira | 720 | 20 | village | high | seafront | E | E | E | 0.001 | 0.003 | 0.006 | 8.97 | 17.39 | 24.66 | ||||
| Ornanda | 300 | 25 | rural | high | 1st category camping | E | E | E | √ | 0.001 | 0.021 | 0.028 | 18.9 | 32.87 | 48.07 | |||
| Bastiagueiro | Oleiros | 500 | 100 | village | high | seafront, recreational area, camping, bike path | E | E | E | √ | √ | √ | 0.013 | 0.026 | 0.034 | 4.35 | 9.7 | 14.67 |
| San Francisco | Muros | 820 | 30 | village | high | seafront, recreational area | E | E | E | √ | √ | √ | 0.001 | 0.004 | 0.007 | 1.33 | 3.08 | 4.75 |
| Ventín | 160 | 30 | rural | low | recreational area | E | E | E | 0.008 | 0.012 | 0.012 | 2.3 | 5.05 | 7.58 | ||||
| Parameán | 250 | 30 | village | medium | G | G | G | 0.007 | 0.013 | 0.015 | 11.4 | 22.12 | 31.44 | |||||
| Perbes | Miño | 540 | 45 | village | high | promenade, camping | E | E | E | √ | √ | √ | 0.007 | 0.001 | 0.017 | 7.3 | 14.55 | 20.9 |
| Coroso | Ribeira | 1700 | 20 | village | high | seafront, leisure port | E | E | E | √ | √ | 0.043 | 0.069 | 0.089 | 8.95 | 20.34 | 31.01 | |
| Areal * | Pobra do Caramiñal | 1100 | 26 | urban | high | promenade, yacht club, recreational areas | G | G | G | 0.13 | 0.232 | 0.27 | 20.4 | 42.22 | 61.76 | |||
| Barrañán | Arteixo | 1100 | 20 | rural | high | seafront, dunes | E | E | E | √ | √ | √ | 0.091 | 0.114 | 0.125 | 23.9 | 35.9 | 45 |
| Alba-Sabón | 850 | 30–80 | remote | medium | seafront | E | E | E | √ | √ | √ | 0.064 | 0.124 | 0.157 | 24.6 | 37.6 | 47.6 | |
| Samil | Vigo | 1250 | 60 | village | high | promenade, recreational area | E | G | S | 0.043 | 0.866 | 1.034 | 90.5 | 138.5 | 175.5 | |||
| Xunqueira | Moaña | 500 | 50 | village | high | promenade, recreational area | G | S | G | 0.3 | 0.087 | 0.115 | 17.5 | 45.88 | 70.43 | |||
| Santa Marta * | Baiona | 210 | 60–111 | village | high | yacht club | G | G | G | 0.016 | 0.045 | 0.057 | 27 | 52.52 | 74.5 | |||
| Arealonga * | Redondela | 180 | 35 | rural | medium | P | P | P | 0.012 | 0.017 | 0.022 | 9.52 | 18.67 | 26.6 | ||||
| Loira | Marín | 330 | 40 | village | high | promenade, recreational area | G | S | S | 0.008 | 0.016 | 0.022 | 22.9 | 34.8 | 43.9 | |||
| Laño | Poio | 585 | 15 | village | low | S | S | P | 0.001 | 0.004 | 0.006 | 9.14 | 17.95 | 25.59 | ||||
| Covelo | 60 | 5 | village | medium | promenade, anchorage | E | E | G | 0.002 | 0.006 | 0.008 | 9.13 | 18.16 | 26.05 | ||||
| Chancelas peq. | 140 | 8–30 | village | medium | promenade | E | E | E | 0.001 | 0.001 | 0.002 | 6.76 | 12.69 | 17.7 | ||||
Appendix B. Calculation Procedure for Riazor beach, A Coruña Municipality
To illustrate the use of the index, beaches located in Areas of Potentially Significant Flood Risk (APSFR) are assessed against their tourism vulnerability. For this, the index considers the level of visitation, the characteristics of tourism facilities and infrastructures, as well as beach width. These are defined as:
- Level of visitation (Lv). Beaches score low to high (1–3), depending on use, with urban beaches being considered the most visited (score 3), those in the vicinity of a tourist destination being medium frequented (score 2) and remote beaches scoring 1. This indicator is double-weighted.
- Tourism facilities and infrastructure (Tf). Here, the highest score is given to camping, recreational areas or important cultural heritage, in addition to other infrastructures like promenade, seafront or marinas. A lower scoring (2) applies to beaches with less prominent infrastructure and the lowest scoring (1) to beaches without infrastructure.
- Beach width (W). The smaller the beach, the more vulnerable it is considered. The indicator score is 1 for beaches that are more than 75 m wide, score 2 for beaches between 15–75 m wide and score 3 for beaches with 15 m width or less.
The vulnerability index is calculated on the basis of the following equation:
To illustrate the procedure, the following section shows the calculation for Riazor beach, in the municipality of A Coruña (Rias Altas).
Indicator: Level of visitation (Lv)
- Typology (remote, rural, village or urban) [101]: urban
- Level of occupation: high
- Coastal tourist destination: yes
The beach scores 3, given its significant importance for tourism.
Indicator: Tourism facilities and infrastructure (Tf)
- Attributes at risk: promenade, recreational area
- Blue flag certified
The beach is scoring high again (3), as a result of its facilities and infrastructure.
Assessment of the indicator: 3
Indicator: Width of the beach (W)
- Average width = 25 m.
Here the beach scores 2.
Based on the equation weighting the scores, Riazor beach has a vulnerability index of 3.7, i.e., it has a high vulnerability to flooding. (High vulnerability: Vt ≥ 3.7; moderate: 2 ≤ Vt < 3.7 and low: Vt < 2).
References
- Hall, C.M. Trends in ocean and coastal tourism: The end of the last frontier? Ocean Coast. Manag. 2001, 44, 601–618. [Google Scholar] [CrossRef]
- United Nations Environment Programme (UNEP). Report on the Seminar “Coastal Tourism in the Mediterranean: Adapting to Climate Change”, Cagliari, Italy, 8–10 June 2009; United Nations Environment Programme (UNEP), République Française-Ministère de l’Écologie, du Développement et de l’Aménagement Durables, United Nations World Tourism Organization (UNWTO), Priority Actions Programme: Paris, France, 2009. [Google Scholar]
- Hall, C.M. Global change, islands and sustainable development: Islands of sustainability or analogues of the challenge of sustainable development? In Routledge International Handbook of Sustainable Development; Redclift, M., Springett, D., Eds.; Routledge: Abingdon, UK, 2015; pp. 55–73. [Google Scholar]
- Hoegh-Guldberg, O.; Beal, D.; Chaudhry, T.; Elhaj, H.; Abdullat, A.; Etessy, P.; Smits, M. Reviving the Ocean Economy: The Case for Action–2015; WWF International: Gland, Switzerland, 2015. [Google Scholar]
- Scott, D.; Hall, C.M.; Gössling, S. Tourism and Climate Change: Impacts, Adaptation and Mitigation; Routledge: London, UK, 2012. [Google Scholar]
- Intergovernmental Panel on Climate Change (IPCC). Climate Change 2007: The Physical Science Basis; Contribution of Working Group I to the Fourth Assessment Report of the Intergovernmental Panel on Climate Change; Cambridge University Press: Cambridge, UK, 2007. [Google Scholar]
- Van Oldenborgh, G.J.; Collins, M.; Arblaster, J.; Christensen, J.H.; Marotzke, J.; Power, S.B.; Rummukainen, M.; Zhou, T. Annex I: Atlas of Global and Regional Climate Projections. In Climate Change 2013: The Physical Science Basis. Contribution of Working Group I to the Fifth Assessment Report of the Intergovernmental Panel on Climate Change; Stocker, T.F., Qin, D., Plattner, G.-K., Tignor, M., Allen, S.K., Boschung, J., Nauels, A., Xia, Y., Bex, V., Midgley, P.M., Eds.; Cambridge University Press: Cambridge, UK; New York, NY, USA, 2013. [Google Scholar]
- Gössling, S.; Peeters, P.; Hall, C.M.; Dubois, G.; Ceron, J.P.; Lehmann, L.; Scott, D. Tourism and water use: Supply, demand, and security. An international review. Tour. Manag. 2012, 33, 1–15. [Google Scholar] [CrossRef]
- Vitousek, S.; Barnard, P.L.; Fletcher, C.H.; Frazer, N.; Erikson, L.; Storiazzi, C.D. Doubling of coastal flooding frequency within decades due to sea-level rise. Sci. Rep. 2017, 7, 1399. [Google Scholar] [CrossRef] [PubMed]
- Hallegatte, S.; Green, C.; Nichols, R.J.; Corfee-Morlot, J. Future flood losses in major coastal cities. Nat. Clim. Chang. 2013, 3, 802–806. [Google Scholar] [CrossRef]
- Intergovernmental Panel on Climate Change (IPCC). Summary for policymakers. In Climate Change 2014: Impacts, Adaptation, and Vulnerability. Part A: Global and Sectoral Aspects; Contribution of Working Group II to the Fifth Assessment Report of the IPCC; Cambridge University Press: Cambridge, UK; New York, NY, USA, 2014; pp. 1–32. [Google Scholar]
- Monbaliu, J.; Chen, Z.; Felts, D.; Ge, J.; Hissel, F.; Kappenberg, J.; Narayan, S.; Nicholls, R.J.; Ohle, N.; Schuster, D.; et al. Risk assessment of estuaries under climate change: Lessons from Western Europe. Coast. Eng. 2014, 87, 32–49. [Google Scholar] [CrossRef]
- Government of Galicia. Strategic Plan of Galicia, 2015–2020; Government of Galicia: Galicia, Spain, January 2016; Available online: http://www.planestratexico.gal/es/descarga (accessed on 8 July 2016).
- European Environment Agency (EEA). Mapping the Impacts of Recent Natural Disasters and Technological Accidents in Europe; Environmental Issue Report 35; EEA: Copenhagen, Denmark, 2004. [Google Scholar]
- Risk Management Solutions. Central Europe Flooding, Event Report; Risk Management Solutions: Newark, CA, USA, August 2002; Available online: http://forms2.rms.com/rs/729-DJX-565/images/fl_2002_central_europe_flooding.pdf (accessed on 24 June 2016).
- World Health Organization (WHO). Floods in the WHO European Region: Health Effects and Their Prevention; WHO Regional Office for Europe: Copenhagen, Denmark, 2013. [Google Scholar]
- Olcina Cantos, J. Prevención de riesgos: Cambio climático, sequías e inundaciones. In Fundación Nueva Cultura del Agua, Panel Científico-Técnico de Seguimiento de la Política de Aguas; Convenio Universidad de Sevilla-Ministerio de Medio Ambiente: Seville, Spain, 2008. [Google Scholar]
- Ministry of Agriculture and Fisheries, Food and Environment (MAPAMA). Gestión de los Riesgos de Inundación; Ministerio de Agricultura y Pesca: Alimentación y Medio Ambiente, Spain, 2016; Available online: http://www.mapama.gob.es/es/agua/temas/gestion-de-los-riesgos-de-inundacion/ (accessed on 24 June 2016).
- United Nation Office for Disaster Risk Reduction (UNISDR). Disaster & Risk Profile Spain. PreventionWeb, Project of UNISDR; UNISDR: Geneva, Switzerland, 2016; Available online: http://www.preventionweb.net/countries/esp/data (accessed on 26 June 2016).
- Frei, C.; Schöll, R.; Fukutome, S.; Schmidli, J.; Vidale, P.L. Future change of precipitation extremes in Europe: Intercomparison of scenarios from regional climate models. J. Geophys. Res. Atmos. 2006, 111. [Google Scholar] [CrossRef]
- Feyen, L.; Dankers, R.; Bódis, K.; Salomon, P.; Barredo, J.I. Fluvial flood risk in Europe in present and future climates. Clim. Chang. 2012, 12, 47–62. [Google Scholar] [CrossRef]
- Alfieri, L.; Burek, P.; Feyen, L.; Forzieri, G. Global warming increases the frequency of river floods in Europe. Hydrol. Earth Syst. Sci. 2015, 19, 2247–2260. [Google Scholar] [CrossRef] [Green Version]
- Ciscar, J.C.; Iglesias, A.; Feyen, L.; Goodess, C.M.; Szabó, L.; Christensen, O.B.; Nicholls, R.; Amelung, B.; Watkiss, P.; Bosello, F.; et al. Climate change impacts in Europe. In Final Report of the PESETA Research Project; Office for Official Publications of the European Communities: Luxembourg, 2009. [Google Scholar]
- Mojtahedi, S.M.H.; Oo, B.L. Coastal buildings and infrastructure flood risk analysis using multi-attribute decision-making. J. Flood Risk Manag. 2016, 9, 87–96. [Google Scholar] [CrossRef]
- Aguas de Galicia. Estudio Ambiental Estratégico. Plan de Xestión do Risco de Inundación da Demarcación Hidrográfica de Galicia-Costa (Ciclo 2015–2021); Aguas de Galicia: Santiago de Compostela, Spain, 2016. [Google Scholar]
- United Nations World Tourism Organization (UNWTO). Tourism Highlights, 2015 Edition; UNWTO: Madrid, Spain, 2015; Available online: http://www.e-unwto.org/doi/pdf/10.18111/9789284416899 (accessed on 16 March 2016).
- Instituto Nacional de Estadística (Spanish Statistic National Institute) (INE). Cuenta Satélite del Turismo de España. 2016. Available online: http://www.ine.es/dyngs/INEbase/es/operacion.htm?c=estadistica_C&cid=1254736169169&menu=ultiDatos&idp=1254735576863 (accessed on 9 February 2017).
- Exceltur. Estudio de Impacto Económico del Turismo: IMPACTUR Galicia 2014. Available online: http://www.exceltur.org/wp-content/uploads/2016/02/IMPACTUR-Galicia-2014.pdf (accessed on 3 September 2016).
- Gómez-Martín, M.B. Climate potential and tourist demand in Catalonia (Spain) during the summer season. Clim. Res. 2006, 32, 75–87. [Google Scholar] [CrossRef]
- Rutty, M.; Scott, D. Will the Mediterranean become “too hot” for tourism? A reassessment. Tour. Plan. Dev. 2010, 7, 267–281. [Google Scholar] [CrossRef]
- Olcina, C.; Vera-Rebollo, J.F. Climate change and tourism policy in Spain: Diagnosis in the Spanish Mediterranean coast. Cuadernos de Turismo 2016, 38, 323–571. [Google Scholar]
- Amelung, B.; Nichols, S.; Viner, D. Implications of global climate change for tourism flows and seasonality. J. Travel Res. 2007, 45, 285–296. [Google Scholar] [CrossRef]
- Hein, L.; Metzger, M.J.; Moreno, A. Potential impacts of climate change on tourism; a case study for Spain. Curr. Opin. Environ. Sustain. 2009, 1, 170–178. [Google Scholar] [CrossRef]
- Moreno, A. Turismo y Cambio Climático en España. Evaluación de la Vulnerabilidad del Turismo de Interior Frente a los Impactos del Cambio Climático. Ministerio de Agricultura; Alimentación y Medio Ambiente: Madrid, Spain, 2010. [Google Scholar]
- Vázquez, M.X.; Prada, A. Avaloración económica dos efectos do cambio Climático no Turismo. In Evidencias e Impactos do Cambio Climático en Galicia; Pérez, V., Fernández, M., Gómez, J., Eds.; Xunta de Galicia, Consellería de Medio Ambiente e Desenvolvemento Sostible: Santiago de Compostela, Spain, 2009; pp. 675–699. [Google Scholar]
- Bujosa, A.; Rosselló, J. Climate change and summer mass tourism: The case of Spanish domestic tourism. Clim. Chang. 2013, 117, 363–375. [Google Scholar] [CrossRef]
- Barrios, S.; Ibañez, J.N. Time is of the essence: Adaptation of tourism demand to climate change in Europe. Clim. Chang. 2015, 132, 645–660. [Google Scholar] [CrossRef]
- Connor, R.F.; Hiroki, K. Development of a method for assessing flood vulnerability. Water Sci. Technol. 2005, 51, 61–67. [Google Scholar] [PubMed]
- Balica, S.F.; Douben, N.; Wright, N.G. Flood vulnerability indices at varying spatial scales. Water Sci. Technol. 2005, 60, 2571–2580. [Google Scholar] [CrossRef] [PubMed]
- Balica, S.F.; Wright, N.G. Reducing the complexity of Flood Vulnerability Index. Environ. Hazards 2010, 9, 321–339. [Google Scholar] [CrossRef]
- Adger, W.N.; Hughes, T.P.; Folke, C.; Carpenter, S.R.; Rockstrom, J. Social-ecological resilience to coastal disasters. Science 2005, 309, 1036–1039. [Google Scholar] [CrossRef] [PubMed]
- Kaly, U.; Briguglio, L.; McLeod, H.; Schmall, S.; Pratt, C.; Pal, R. Environmental Vulnerability Index (EVI) to summarise national environmental vulnerability profiles. SOPAC Technol. Rep. 1999, 275, 73. [Google Scholar]
- McLaughlin, S.; Cooper, J.A.G. A multi-scale coastal vulnerability index: A tool for coastal managers? Environ. Hazards 2010, 9, 233–248. [Google Scholar] [CrossRef]
- Balica, S.F.; Wright, N.G.; van der Meulen, F. A flood vulnerability index for coastal cities and its use in assessing climate change impacts. Nat. Hazards 2012, 64, 73–105. [Google Scholar] [CrossRef]
- Kaján, E.; Saarinen, J. Tourism, climate change and adaptation: A review. Curr. Issues Tour. 2013, 16, 167–195. [Google Scholar] [CrossRef]
- Nicholls, R.; Zanuttigh, B.; Vanderlinden, J.P.; Weisse, R.; Silva, R.; Hanson, S.; Narayan, S.; Hoggart, S.; Thompson, R.C.; de Vries, W.; et al. Developing a holistic approach to assessing and managing coastal flood risk. In Coastal Risk Management in a Changing Climate; Zanuttigh, B., Nicholls, R.J., Vanderlinden, J.P., Thompson, R.C., Burcharth, H.F., Eds.; Butterworth-Heinemann: Oxford, UK, 2015; pp. 9–53. [Google Scholar]
- Shumann, A.H. Introduction-hydrological aspects of risk management. In Flood Risk Assessment and Management. How to Specify Hydrological Loads, Their Consequences and Uncertainties; Shumann, A.H., Ed.; Springer Science + Business Media: Dordtrecht, The Netherlands, 2011; pp. 1–11. [Google Scholar]
- Williams, A.; Micallef, A. Beach Management: Principles & Practice; Earthscan: London, UK, 2009. [Google Scholar]
- Peduzzi, P.; Dao, H.; Herold, C.; Rochette, D.; Sanahuja, H. Feasibility Study Report—On Global Risk and Vulnerability Index-Trends per Year (GRAVITY); United Nations Development Programme Emergency Response Division UNDP/ERD: Geneva, Switzerland, 2001; Available online: http://www.grid.unep.ch/products/3_Reports/ew_gravity1.pdf (accessed on 24 January 2017).
- Briguglio, L. Methodological and Practical Considerations for Constructing Socio130 Economic Indicators to Evaluate Disaster Risk; Programme on Information and Indicators for Risk Management, IADB-ECLAC-IDEA; Institute of Environmental Studies, University of Colombia: Manizales, Colombia, 2003. [Google Scholar]
- Cendrero, A.; Sánchez-Arcilla, A.; Zazo, C. Impactos sobre las zonas costeras. In Evaluación Preliminar de los Impactos en España por Efecto del Cambio Climático; Universidad de Castilla-La Mancha, Ministerio de Medio Ambiente: Toledo, Spain, 2005; pp. 469–524. [Google Scholar]
- Losada, I.; Izaguirre, C.; Diaz, P. Cambio Climático en la Costa Española; Oficina Española de Cambio Climático, Ministerio de Agricultura, Alimentación y Medio Ambiente: Madrid, Spain, 2014. [Google Scholar]
- Davis, R.A., Jr.; FitzGerald, D.M. Beaches and Coasts; Blackwell: Oxford, UK, 2004. [Google Scholar]
- Penning-Rowsell, E.C.; Parker, D.J.; de Vries, W.S.; Zanuttigh, B.; Simmonds, D.; Trifonova, E.; Hissel, F.; Monbaliu, J.; Lendzion, J.; Ohnle, N.; et al. Innovation in coastal risk management: An exploratory analysis of risk governance issues at eight THESEUS study sites. Coast. Eng. 2014, 87, 210–217. [Google Scholar] [CrossRef]
- Craig-Smith, S.J.; Tapper, R.; Font, X. The coastal and marine environment. In Tourism and Global Environmental Change: Ecological, Economic, Social and Political Interrelationships; Gössling, S., Hall, C.M., Eds.; Routledge: London, UK, 2006; pp. 107–127. [Google Scholar]
- Faulkner, B.; Vikulov, S. Katherine, washed out one day, back on track the next: A post-mortem of a tourism disaster. Tour. Manag. 2001, 22, 331–344. [Google Scholar] [CrossRef]
- Wilks, J.; Moore, S. Tourism Risk Management for the Asia Pacific Region: An Authoritative Guide for Managing Crises and Disasters; Commonwealth of Australia: Canberra, Australia, 2003. [Google Scholar]
- French, P.W. Coastal Defenses. Process, Problems and Solutions; Routledge: London, UK, 2001. [Google Scholar]
- Lorenzo, F.; Alonso, A.; Pagés, J.L. Erosion and accretion of beach and spit systems in Northwest Spain: A response to human activity. J. Coast. Res. 2007, 23, 834–845. [Google Scholar] [CrossRef]
- Pethick, J.; Crooks, S. Development of a coastal vulnerability index: A geomorphological perspective. Environ. Conserv. 2000, 27, 359–367. [Google Scholar] [CrossRef]
- Gotangco, C.K.; See, J.; Dalupang, J.P.; Ortiz, M.; Porio, E.; Narisma, G.; Yulo-Loizaga, A.; Dator-Bercilla, J. Quantifying resilience to flooding among households and local government units using system dynamics: A case study in Metro Manila. J. Flood Risk Manag. 2016, 9, 196–207. [Google Scholar] [CrossRef]
- Penning-Rowsell, E.C.; Ashley, R.; Evans, E.P.; Hall, J.W. Foresight: Future Flooding: Scientific Summary, Vol 1: Future Risks and Their Drivers; Department of Trade and Industry: London, UK, 2004. [Google Scholar]
- Cendrero, A.; Fischer, D.W. A procedure for assessing the environmental quality of coastal areas for planning and management. J. Coast. Res. 1997, 13, 732–744. [Google Scholar]
- Briguglio, L. The Vulnerability Index and Small Island developing states: A review of conceptual and methodological issues. In Proceedings of the AIMS Regional Preparatory Meeting on the Ten Year Review of the Barbados Programme of Action, Praia, Cape Verde, 1–5 September 2003. [Google Scholar]
- Farrugia, N. Conceptual Issues in Constructing Composite Indices, Occasional Paper on Islands and Small States, 2/2007. In Proceedings of the International Conference on Small States and Economic Resilience, Valletta, Malta, 23–25 April 2007. [Google Scholar]
- Galicia Tourism. Rías y Playas en Galicia. 2016. Available online: http://www.turismo.gal/localizador-de-recursos?filtro=%23STP:15&langId=es_ES (accessed on 3 August 2016).
- Servicio Gallego de Salud [Galician Health Service] SERGAS. Censo de las Playas de Galicia. Programa de Vigilancia Sanitaria 2016. Available online: http://www.sergas.es/Saude-publica/Censo-praias-Galicia (accessed on 8 August 2016).
- European Environment Agency (EEA). European Bathing Water Quality in 2015; EEA Technical report 9/2016; Publications Office of the European Union: Luxembourg, 2016. [Google Scholar]
- Association of Environmental and Consumer Education (ADEAC). Bandera Azul 2016. Available online: http://www.adeac.es/bandera_azul (accessed on 14 October 2016).
- Instituto Nacional de Estadística (Spanish Statistic National Institute) (INE) Encuesta de Ocupación Hotelera 2015. Available online: http://www.ine.es/jaxi/menu.do?type=pcaxis&path=%2Ft11%2Fe162eoh&file=inebase&L=0 (accessed on 24 July 2016).
- Galicia Tourism. Area of Research and Study of Tourism of Galicia. 2016. Available online: http://www.turismo.gal/aei/portal/index.php (accessed on 20 September 2016).
- Instituto de Hidráulica Ambiental de Cantabria (Institute of Environmental Hydraulics of Cantabria) (IHCantabria). Cambio Climático en la Costa Española, Proyecto C3E. Available online: http://www.c3e.ihcantabria.com/ (accessed on 4 March 2017).
- Center for International Earth Science Information Network (CIESIN). Urban-Rural Population and Land Area Estimates Version 2. Palisades; Columbia University, NASA Socioeconomic Data and Applications Center (SEDAC): Washington, DC, USA, 2017; Available online: http://sedac.ciesin.columbia.edu/data/set/lecz-urban-rural-population-land-area-estimates-v2 (accessed on 13 March 2017).
- Cabalar Fuentes, M. Los temporales de lluvia y viento en Galicia. Propuesta de clasificación y análisis de tendencias (1961–2001). Investig. Geogr. 2005, 36, 103–118. [Google Scholar] [CrossRef]
- Cruz, R.; Lago, A.; Lage, A.; Rial, M.E.; Díaz-Fierros, F.; Salsón, S. Evolución recente do clima de Galicia. Tendencias observadas en variables meteorolóxicas. In Evidencias e Impactos do Cambio Climático en Galicia; Pérez, V., Fernández, M., Gómez, J., Eds.; Xunta de Galicia, Consellería de Medio Ambiente e Desenvolvemento Sostible: Santiago de Compostela, Spain, 2009; pp. 19–59. [Google Scholar]
- Martínez de la Torre, A.; Míguez Macho, G. Modelización dun Escenario de futuro Cambio Climático en Galicia. In Evidencias e Impactos do Cambio Climático en Galicia; Pérez, V., Fernández, M., Gómez, J., Eds.; Xunta de Galicia, Consellería de Medio Ambiente e Desenvolvemento Sostible: Santiago de Compostela, Spain, 2009; pp. 543–556. [Google Scholar]
- Xunta de Galicia. Galicia Cambio Climático, Primer Informe. Consellería de Medio Ambiente y Ordenación del Territorio; Government of Galicia, Santiago de Compostela: Galicia, Spain, 2012; Available online: http://cambioclimatico.xunta.gal/novas (accessed on 29 October 2016).
- MeteoGalicia. Climatological Reports. Galician Meteorological Agency. Consellería de Medio Ambiente e Ordenación do Territorio da Xunta de Galicia. 2017. Available online: http://www.meteogalicia.gal/observacion/informesclima/informesIndex.action?request_locale=gl (accessed on 20 February 2017).
- Agencia Española de Meteorología (Spanish Meteorological Agency) (AEMET). Resúmenes Climatológicos; AEMET: Madrid, Spain, 2016; Available online: http://www.aemet.es/es/serviciosclimaticos/vigilancia_clima/resumenes?w=0&datos=2 (accessed on 22 December 2016).
- MeteoGalicia. Network Weather Stations. Available online: http://www.meteogalicia.gal/observacion/rede/redeIndex.action (accessed on 18 March 2017).
- Puertos del Estado. Informe Climático, Extremos Máximos de Oleaje Por Direcciones; Banco de Datos Oceanográficos de Puertos del Estado; Ministerio de Fomento: Madrid, Spain, 2017. [Google Scholar]
- Puertos del Estado. Banco de datos Oceanográficos. 2017. Available online: http://www.puertos.es/es-es/oceanografia/Paginas/portus.aspx (accessed on 16 February 2017).
- Rosón, G.; Cabanas, J.M.; Fernández Pérez, F.; Herrera Cortijo, J.L.; Ruiz-Villarreal, M.; Castro, C.G.; Piedracoba, S.; Álvarez-Salgado, X.A. Evidencias do Cambio Climático na hidrografía e a dinámica das Rías e da plataforma Galega. In Evidencias e Impactos do Cambio Climático en Galicia; Pérez, V., Fernández, M., Gómez, J., Eds.; Xunta de Galicia, Consellería de Medio Ambiente e Desenvolvemento Sostible: Santiago de Compostela, Spain, 2009; pp. 287–303. [Google Scholar]
- Cid, A.; Castanedo, S.; Abascal, A.J.; Menéndez, M.; Medina, R. A high resolution hindcast of the meteorological sea level component for Southern Europe: The GOS dataset. Clim. Dyn. 2014, 43, 2167–2184. [Google Scholar] [CrossRef]
- MeteoGalicia. Tides and Moons. In Galician Meteorological Agency; MeteoGalicia: Santiago de Compostela, Spain, 2017; Available online: http://www.meteogalicia.gal/web/predicion/maritima/mareasIndex.action (accessed on 23 March 2017).
- Aguas de Galicia. Anexo 1 Caracterización das ARPSIS. In Plan de Xestión do Risco de Inundación da Demarcación Hidrográfica de Galicia-Costa (ciclo 2015–2021); ARPSIS: Santiago de Compostela, Spain, January 2016. [Google Scholar]
- Department of Culture and Tourism. Enquisa de destino 2009. In Análise Estatística Sobre o Turismo en Galicia; Secretaría Xeral para o Turismo: Xunta de Galicia, Spain, 2010. [Google Scholar]
- Ministry of Agriculture and Fisheries, Food and Environment (MAPAMA). Aplicación de la Directiva de Inundaciones y del R.D. 903/2010 en la Costa Española. Costas y Medio Marino; Ministerio de Agricultura y Pesca, Alimentación y Medio Ambiente: Madrid, Spain, 2017. Available online: http://www.mapama.gob.es/es/costas/temas/proteccion-costa/directiva-inundaciones/ (accessed on 5 March 2017).
- Ministry of Agriculture and Fisheries, Food and Environment (MAPAMA). Actuaciones para la Protección de la Costa. Ministerio de Agricultura y Pesca; Alimentación y Medio Ambiente: Madrid, Spain, 2017. Available online: http://www.mapama.gob.es/es/costas/temas/proteccion-costa/directiva-inundaciones/ (accessed on 6 March 2017).
- BBVA Foundation. La población en España: 1900–2009. Fundación BBVA, 2010. Available online: http://www.fbbva.es/TLFU/dat/cuadernos_FBBVA_51espana_web.pdf (accessed on 12 March 2017).
- Pompe, J.J.; Rinehart, J.R. Beach quality and the enhancement of recreational property values. J. Leis. Res. 1995, 27, 143–154. [Google Scholar]
- Pérez-Alberti, A.; Vázquez-Paz, M. Caracterización y dinámica de sistemas dunares coseros en Galicia. In Las dunas en España; Sanjaume, E., Gracia, F.J., Eds.; Sociedad Española de Geomorfología: Zaragoza, Spain, 2011; pp. 161–187. [Google Scholar]
- Willis, C.M.; Griggs, G.B. Reductions in fluvial sediment discharge by coastal dams in California and implications for beach sustainability. J. Geol. 2003, 111, 167–182. [Google Scholar] [CrossRef]
- United Nations Office for Disaster Risk Reduction (UNISDR). DesInventar, Disaster Information Management System. Disaster & Risk Profile Spain. 2017. Available online: http://www.desinventar.net/DesInventar/profiletab.jsp?countrycode=esp&continue=y (accessed on 5 March 2017).
- Instituto Nacional de Estadística (Spanish Statistic National Institute) (INE). Gasto total y Gastos Medios por Comunidad Autónoma de Residencia. 2017. Available online: http://www.ine.es/jaxiT3/Datos.htm?t=10721 (accessed on 3 April 2017).
- Hall, C.M.; Prayag, G.; Amore, A. Tourism and Resilience. Dividual, Organisational and Destination Perspectives; Channel View: Bristol, UK, 2018. [Google Scholar]
- Orchiston, C. Tourism business preparedness, resilience and disaster planning in a region of high seismic risk: The case of the Southern Alps, New Zealand. Curr. Issues Tour. 2013, 16, 477–494. [Google Scholar] [CrossRef]
- Jopp, R.; DeLacy, T.; Mair, J. Developing a framework for regional destination adaptation to climate change. Curr. Issues Tour. 2010, 13, 591–605. [Google Scholar] [CrossRef]
- Ministry of Agriculture and Fisheries, Food and Environment (MAPAMA). Guía de Playas. Ministerio de Agricultura y Pesca, Alimentación y Medio Ambiente, Spain, 2016. Available online: http://www.mapama.gob.es/es/costas/servicios/guia-playas/default.aspx (accessed on 17 July 2016).
- European Environment Agency (EEA). State of Bathing Waters; European Environment Agency: Copenhagen, Denmark, 2016; Available online: http://www.eea.europa.eu/themes/water/interactive/bathing/state-of-bathing-waters#parent-fieldnametitle (accessed on 30 June 2016).
- Williams, A. Definitions and typologies of coastal tourism beach destinations. In Disappearing Destinations. Climate Change and Future Challenges for Coastal Tourism; Jones, A., Phillips, M., Eds.; CAB International: Wallingford, UK, 2011; pp. 47–65. [Google Scholar]
Figure 1.
Flood vulnerability analysis for tourism.

Figure 2.
The region of Galicia in the North of Spain.

Figure 3.
Map of cumulative rainfall in Galicia (2016). Source: MeteoGalicia [78].
Figure 3.
Map of cumulative rainfall in Galicia (2016). Source: MeteoGalicia [78].

Figure 4.
Inundation area (km2) in relation to flood level scenario (m). Source: Based on data supplied by IHCantabria [72].
Figure 4.
Inundation area (km2) in relation to flood level scenario (m). Source: Based on data supplied by IHCantabria [72].

Figure 5.
Location of the four communities studied.

Figure 6.
Tourism vulnerability of at risk beaches in Rias Altas. Green: Beaches with low tourism vulnerability; yellow: medium vulnerability; red: high vulnerability.
Figure 6.
Tourism vulnerability of at risk beaches in Rias Altas. Green: Beaches with low tourism vulnerability; yellow: medium vulnerability; red: high vulnerability.

Figure 7.
Tourism vulnerability of at risk beaches in Rias Baixas. Green: Beaches with low tourism vulnerability; yellow: medium vulnerability; red: high vulnerability.
Figure 7.
Tourism vulnerability of at risk beaches in Rias Baixas. Green: Beaches with low tourism vulnerability; yellow: medium vulnerability; red: high vulnerability.

Table 1.
Exposure indicators of the hydro-geomorphological subsystem.
| Factor | Indicator | Description | Impact on Vulnerability Increases (+) |
|---|---|---|---|
| Fluvial/costal characteristics | Beach coastline (km) | Kilometers of coastline, density of beaches | Higher beach coastline (+) |
| Hydrographical characteristics (km) | River network, density of rivers | Higher river network (+) | |
| Elevation above sea level | Low elevation coastal zones (km2 or %) | Share of coastline with elevation up to 10 m | Higher share of Low Elevation Coastal Zones (LECZ) (+) |
| Soil subsidence (m2) | Surface of soil that is experimenting a decreasing | Higher area (+) | |
| Frequency of storm/rainfall events | Rainfall intensity (mm or L/m2) | Rainfall volume | Higher intensity/ frequency (+) |
| Rainfall seasonality (mm or L/m2) | Amount of rainfall per month | Impact of rainfall on high season (+) | |
| Frequency of storms (#) | Number of storms events in the last 10 years | Higher frequency of storms (+) | |
| Sea-level rise | Sea-level rise (mm/yr) | Increasing in the level of the sea in x year | Higher Sea Level Rise (SLR) (+) |
| Waves | Wave regime (cm/yr or W/m2/yr) | Changes in wave characteristics: height, period and energy | Higher wave intensity (+) |
Table 2.
Exposure indicators of flood characteristics.
| Factor | Indicator | Description | Impact on Vulnerability Increases (+) Decreases (−) |
|---|---|---|---|
| Flood tide | Tide range (m) | Sea level variation due to tides within a day | Variable |
| Tidal flooding (m) | Estimated range by tidal flooding; 2 scenarios with return periods of 50, 100 years (T50, T100) | Higher flooding (+) | |
| Flood waves | Wave flooding (m) | Estimated range reached by wave flooding (2 scenarios T50, T100) | Higher flooding (+) |
| Velocity | Volume of flow (m3/s) | Flow volume of rivers discharging into the coast (3 scenarios with return periods of T10, T50, T100) | More volume (+) |
| Response time (scale) | Time that elapses between the moment of maximum rainfall and when the peak flow is reached | More time (−) | |
| Inundation area | Area of fluvial flooding (km2) | Surface area of potential fluvial flooding (3 scenarios with return periods of T10, T50, T100) | Larger area (+) |
| Area of sea flooding (km2) | Estimated flooded area according to a potential increase the elevation of the level of flooding in meters | Larger area (+) | |
| Other flood characteristics | Level of flooding (m or %) | Level reached as a result of the joint action of the astronomical tide, storm surge and run-up generated by waves | Higher level of flooding (+) |
Table 3.
Indicators in the socio-economic and political-administrative context.
| Factor | Indicator | Description |
|---|---|---|
| Legal and regulatory context | Regulatory context | Competences and responsibility on the coastal domain among the different levels of government |
| Beaches at protected area | Beaches with risk of flood located in areas of environmental protection | |
| Susceptibility including preparedness, coping and recovering | Contingency plans | Contingency plans designed to deal with flood risk situations and impacts on beaches |
| Beach nourishment and recovering | Replenishing beach sediment in nourishment operations, recovering and cleaning | |
| Time recovery | Time needed to recover to a functional operation after coastal flood events | |
| Other socio-economic and politico-administrative factors | Population | Number of people affected and number of inhabitants in potential flood zone |
| Stock of affected capital | Losses and properties affected by floods |
Table 4.
Resilience indicators.
| Factor | Indicator | Description |
|---|---|---|
| Beach structure | Coast and beach profile | Coastal features and natural protection that have influence on flood resilience |
| Length and width of the beach | Length, width and width variation during the year of beaches with risk of flood | |
| Sediment supply | Amount of sustained supply of sediment for the preservation and sustainability of the beaches | |
| Previous exposure to flooding | Historical floods | Historical flood events and experience and knowledge gained in previous floods |
| Other resilience indicators | Flood protection | Existence of shelters and structural measures that physically prevent beach flooding |
| Household disposable income | Household disposable income as a resilience factor |
Table 5.
FL50 absolute and relative growth at coast and dissipative beaches in Galicia.
| Year | Vigo | Vilagarcia | A Coruña | Ribadeo | |||||
|---|---|---|---|---|---|---|---|---|---|
| Coast | Dissipative Beach | Coast | Dissip. Beach | Coast | Dissip. Beach | Coast | Dissip. Beach | ||
| FL50 Absolute growth (m) | 2020 | 0.05 | 0.06 | 0.01 | 0.14 | 0.04 | 0.07 | 0.05 | 0.09 |
| 2030 | 0.11 | 0.13 | 0.02 | 0.32 | 0.08 | 0.16 | 0.11 | 0.19 | |
| 2040 | 0.17 | 0.21 | 0.03 | 0.50 | 0.13 | 0.25 | 0.16 | 0.30 | |
| FL50 Relative growth (%) | 2020 | 1.3 | 1.10 | 0.20 | 1.70 | 0.96 | 1.26 | 1.35 | 1.69 |
| 2030 | 2.9 | 2.48 | 0.45 | 3.83 | 2.17 | 2.85 | 3.05 | 3.81 | |
| 2040 | 4.6 | 3.85 | 0.68 | 5.96 | 3.38 | 4.43 | 4.75 | 5.93 | |
Source: Based on data supplied by IHCantabria [72].
Table 6.
FL50 projections for 2100 by extrapolating trends and for three SLR scenarios by provinces.
Table 6.
FL50 projections for 2100 by extrapolating trends and for three SLR scenarios by provinces.
| Extrapolation of Trends | Scenario 1 SLR: 0.5 m | Scenario 2 SLR: 0.85 m | Scenario 3 SLR: 2 m | |
|---|---|---|---|---|
| A Coruña | 6.4 | 6.9 (+7.3%) | 7.2 (+11.3%) | 8.3 (+28.0%) |
| Lugo | 5.6 | 6.1 (+9.3%) | 6.3 (+13.3%) | 7.4 (+32.5%) |
| Pontevedra | 5.4 | 5.9 (+9.0%) | 6.2 (+14.0%) | 7.2 (+32.6%) |
Source: Losada et al. [52] (pp. 77–78).
Table 7.
Flood events in costal municipalities 1950–2011.
| Province | Flood Cases | Examples of Tourism Infrastructure Affected in Flood Events | |
|---|---|---|---|
| A Coruña | 190 | 21/12/1995 | hotel facilities of Muxía |
| 20/10/2000 | beaches in Pobra do Caramiñal and Cedeira, hotel facilities in A Coruña | ||
| Pontevedra | 146 | 21/12/1995 | seafronts and beaches in Baiona, Moaña and Marín |
| 20/10/2000 | flooding of beaches in Nigrán, Vilanova de Arousa, Portonovo, Marín and Baiona; hotel facilities in Baiona and A Guarda | ||
| 11/10/2001 | hotel facilities in Pontevedra and Sanxenxo | ||
| 04/09/2004 | hotel facilities in Vigo | ||
| 18/11/2006 | tourist facilities in Pontevedra, Sanxenxo, Vilagarcía de Arousa, Cangas and Marin. | ||
| Lugo | 39 | 30/04/1998 | access road to the coast in Foz |
| 20/10/2000 | access road to Abrela beach in O Vicedo | ||
| 09/06/2010 | hotel facilities in Viveiro, access road to Catedrales beach | ||
Source: from data of UNISDR [94].
Table 8.
Assessment of beach vulnerability in regard to tourism.
| Feature | Scoring 1–3 |
|---|---|
| Level of visitation | Low to high |
| Tourism facilities | Depending on number and character |
| Beach width | more than 75 m; 15–75 m; less than 15 m |
© 2017 by the authors. Licensee MDPI, Basel, Switzerland. This article is an open access article distributed under the terms and conditions of the Creative Commons Attribution (CC BY) license (http://creativecommons.org/licenses/by/4.0/).
Share and Cite
MDPI and ACS Style
Toubes, D.R.; Gössling, S.; Hall, C.M.; Scott, D. Vulnerability of Coastal Beach Tourism to Flooding: A Case Study of Galicia, Spain. Environments 2017, 4, 83. https://0-doi-org.brum.beds.ac.uk/10.3390/environments4040083
AMA Style
Toubes DR, Gössling S, Hall CM, Scott D. Vulnerability of Coastal Beach Tourism to Flooding: A Case Study of Galicia, Spain. Environments. 2017; 4(4):83. https://0-doi-org.brum.beds.ac.uk/10.3390/environments4040083
Chicago/Turabian StyleToubes, Diego R., Stefan Gössling, C. Michael Hall, and Daniel Scott. 2017. "Vulnerability of Coastal Beach Tourism to Flooding: A Case Study of Galicia, Spain" Environments 4, no. 4: 83. https://0-doi-org.brum.beds.ac.uk/10.3390/environments4040083
Note that from the first issue of 2016, this journal uses article numbers instead of page numbers. See further details here.