Article

An Open-Data Based Assessment of Expected Changes in Land Use and Water Availability as a Result of the Construction of the West Segment of the Nicaragua Interoceanic Canal

1
Engineering Hydrology and Water Management, Technische Universität Darmstadt, Franziska-Braun-Str. 7, 64287 Darmstadt, Germany
2
Institute of Applied Geosciences, Technische Universität Darmstadt, Mornewegstr. 32, 64293 Darmstadt, Germany
*
Author to whom correspondence should be addressed.
Submission received: 15 November 2017 / Revised: 14 January 2018 / Accepted: 16 January 2018 / Published: 17 January 2018
(This article belongs to the Special Issue Environmental Impact Assessment)

Abstract

:
Nicaragua is preparing the construction of an interoceanic canal that will be the longest and largest canal on Earth. An environmental and social impact assessment was published in 2014 supporting a general viability of the canal. Nonetheless, several scientists and societal actors raised serious concerns regarding the social, economic, and ecological sustainability. Despite an open dispute within the Nicaraguan society, no independent, transparent, and scientifically sound assessment has been carried out. This article presents a transparently documented and comprehensible impact assessment of the West Canal Segment of the Nicaragua Canal. Based on publicly available data and scientifically sound and recognized methods, land use, hydrological (water availability), and socio-economic impacts (population, transportation/communication) are described, quantified, and compared with official declarations in the impact assessment. The examination of official declarations discloses significant ambiguities concerning the methodology and data used for the impact assessment. Consequently, the results presented are at least partly doubtful. When compared with official declarations, the main results of this study reveal: (1) significantly more forested areas (+53.7 km2) and areas of extensive agriculture/near nature (14.4 km2), but far less urban and intensively used areas (−39.6 km2) are affected by the canal; (2) A population of nearly 16,500, and several regional or locally unique transportation and communication routes are directly affected by the canal construction; and (3) a slightly lower water availability (−6.6%) and a much higher water demand for lock operations (+31.8%) were estimated. Accordingly, only about 20% of the lock water demand could be met by locally-available discharge.

1. Introduction

Until today, there have been numerous attempts to build a canal through Nicaragua and different routes to cross the Atlantic part of the country, as well as different transport media (e.g., a “dry” canal using railways) have been proposed. The Sandinista government under president Daniel Ortega once again picked up the plans to build an interoceanic canal in 2012 and achieved the passing of a special law for its construction (Law No. 840) by the National Assembly of Nicaragua [1]. The law defines a construction time of 15 years and an economic cost of USD $40 billion. With Law No. 840 Nicaragua’s National Assembly ratified an exclusive agreement between the Government of Nicaragua and the Hong Kong Nicaragua Canal Development (HKND) Group to develop the Nicaragua Canal in June 2013. Thereby the HKND Group obtained the concession to build the canal including the exploitation rights for at least 50 years with possible prorogation. The concession includes the construction of two deep-sea harbors, two airports, free trading zones, and an oil refinery, among others.
Essentially, the construction of the canal is economically motivated, targeting sea-borne container traffic and bulk carriers that are too large to take the passage through the expanded Panama Canal. However, geopolitical reasons may be added as well, as political powers, having no stake in the Panama Canal, look for alternative shipping routes. While economic reasons expressed by the Nicaraguan government favor the construction of a canal, environmentalists have raised severe concerns by drawing attention to the loss of important ecosystems and rare species. Nevertheless, among the Nicaraguan population the construction of a canal is also partly understood as a feasible way out of poverty for the country [2].
With 5000 million m3 of sediment excavation, the project will be, by five times, the largest earth-moving operation in human history [3]. The canal will be longer, deeper, and wider than any other interoceanic canal and result in a permanent connection of the Atlantic and Pacific Oceans via the second largest freshwater lake in Latin America and the largest freshwater reserve in Central America (Figure 1). Consequently, the construction might affect the water supply of Nicaragua, as well as of other countries in the region. Since the project will have a strong impact on the country and the Central American region, there is an enormous public interest in the possible consequences of its construction and a demand for an open debate.
Recently, journalists have been questioning the economic viability of the project. Doubts concerning the economic viability of the project have been expressed, since the only economic viability study conducted has never been made publicly available, [4] as well as recent investments by the Chinese Government in the Panama Canal and related infrastructure [5]. In addition, news about the operational difficulties that the HKND Group has faced have fired speculation about the actual realization of the project [6].

1.1. Deficits in the Environmental Impact Study

The consulting company Environmental Resources Management (ERM) was engaged by the HKND Group to perform the environmental and social impact assessment (ESIA) as the principal planning basis for the construction of the canal. Therefore, the importance of the ESIA results in public and political decision-making must not be underestimated. However, during this study, some difficulties in comprehending and evaluating the results presented in the ESIA have arisen. In most of the revised chapters, data sources are not explicitly named, nor is a complete description of methods, assumptions, and estimated precision of results for all sections provided. The data sources are not publicly available. Consequently, a reconstruction of methods and results is difficult. Moreover, the provided information contains certain discrepancies with regard to sources and to the achieved results. The ESIA referred to in this publication was published in 2015 and downloaded from the HKND webpage (www.hknd-group.com) in April 2017 [3]. Nonetheless, the official declaration of the beginning of the canal construction dates before the publication to December 2014 [7]. Nonetheless, only preparatory steps have been undertaken since then.
The following highlights some of the discrepancies found in the ESIA. Data regarding actual land use are presented in several sections. Among others, these include soil potential (Section 5.3 of the ESIA and its Appendix [3]), biodiversity (Section 5.9 and the Appendix of the ESIA [3]), and hydrologic modelling (Section 5.7 and the Appendix of the ESIA [3]). However, these sections are not consistent with regard to data sources, applied methods, and results. Differences are crucial for the following assessment of the environmental impact of the proposed construction. For instance, in Section 5.3 of the ESIA [3] an amount of 3% forest (Table 5.3.7 of the ESIA [3]), a date of 2011 in the part of the canal zone studied in this paper is determined, while in Section 5.9 of the ESIA [3], the result is 30% for the same area (Table 5.9.4, dated 2014 of the ESIA [3]). This results in a difference of approx. 6500 ha forest, which, partially, is highly valuable subtropical dry forest [8]. Other examples can be found in the hydrological study. For the Brito River catchment, varying amounts for precipitation, evapotranspiration, runoff, and discharge are listed (see Section 5.7 and Appendix RH-2 of the ESIA [3]), several of which are contradictory, e.g., an exemplary dry year with 289 mm annual precipitation and an exemplary wet year of 1423 mm annual precipitation are given. Nonetheless, an average year is quantified with 1450 mm annual precipitation in the same catchment (see Appendix RH-2 of the ESIA [3]).
Furthermore, discrepancies in quoted sources of information are evident. Results of the land use analysis in Chapter 5.9 of the ESIA [3] are referenced to FUNDAR 2014b. However, in the list of references in Chapter 16 only the reference FUNDAR 2014—Analisis comparativo de ecosistemas y cambio de uso del suelo—can be found. In Appendix BT-5 and BT-6, Volume 11 of the ESIA [3], again FUNDAR 2014 is referenced, but as FUNDAR 2014: Biodiversity Technical Report. This inconsistency of sources and quoting practices draws doubts on the retrieved information.

1.2. Aim and Scope

In addition to the unprecedented ecological and socio-economic impact of the canal construction, there has been very little investigation with regard to the West Canal Segment. Ecological studies on the canal’s impact have focused on the East Canal Segment crossing the Caribbean region of Nicaragua [9,10], which is ecologically less disturbed. Apart from comments, essays, and opinion papers [11,12,13,14,15,16] only a general comparison with the Panama Canal [17] and an analysis on the canal’s potential impact on international sea-borne trade patterns [18] can be found in the scientific literature. Hence, the aim of this article is to contribute to an open scientific debate through an objective and independent quantification of land use and hydrological impacts that will be set in context with the ESIA results. This will contribute to the knowledge of the canal’s impact on local populations, as well as ecosystems and facilitate information for better decision-making.
However, the following study is limited to the West Canal Segment, the part crossing the Isthmus of Rivas in the southwest of Nicaragua connecting the Pacific coast with Nicaragua Lake (Figure 2).
This study uses an open data-based approach to address one major concern with the ESIA and to open the results for a public debate and scientific evaluation. Specifically, this publication is responding to the call of the panel of international scientists at the Independent International Workshop organized by the Academy of Sciences of Nicaragua in November 2015. At the workshop scientists asked for “…an independent expert committee to help review the recent environmental impact report [3] to ensure that the project delivers net economic, social, and ecological benefits to the country.” and published a list of 15 major concerns regarding the ESIA [19]. Although the work of the panel focuses on deficits in the ESIA concerning the section on fresh water habitats and of Lake Nicaragua and river drainages, some of the concerns raised apply to the entire study, particularly to the small time frame for data sampling. Concern No. 7 explicitly questions the calculated water balance for the canal. Major issues are the lack of information regarding the storage capacity of Lake Atlanta and only a brief evaluation of the water availability in dry years.

2. Materials and Methods
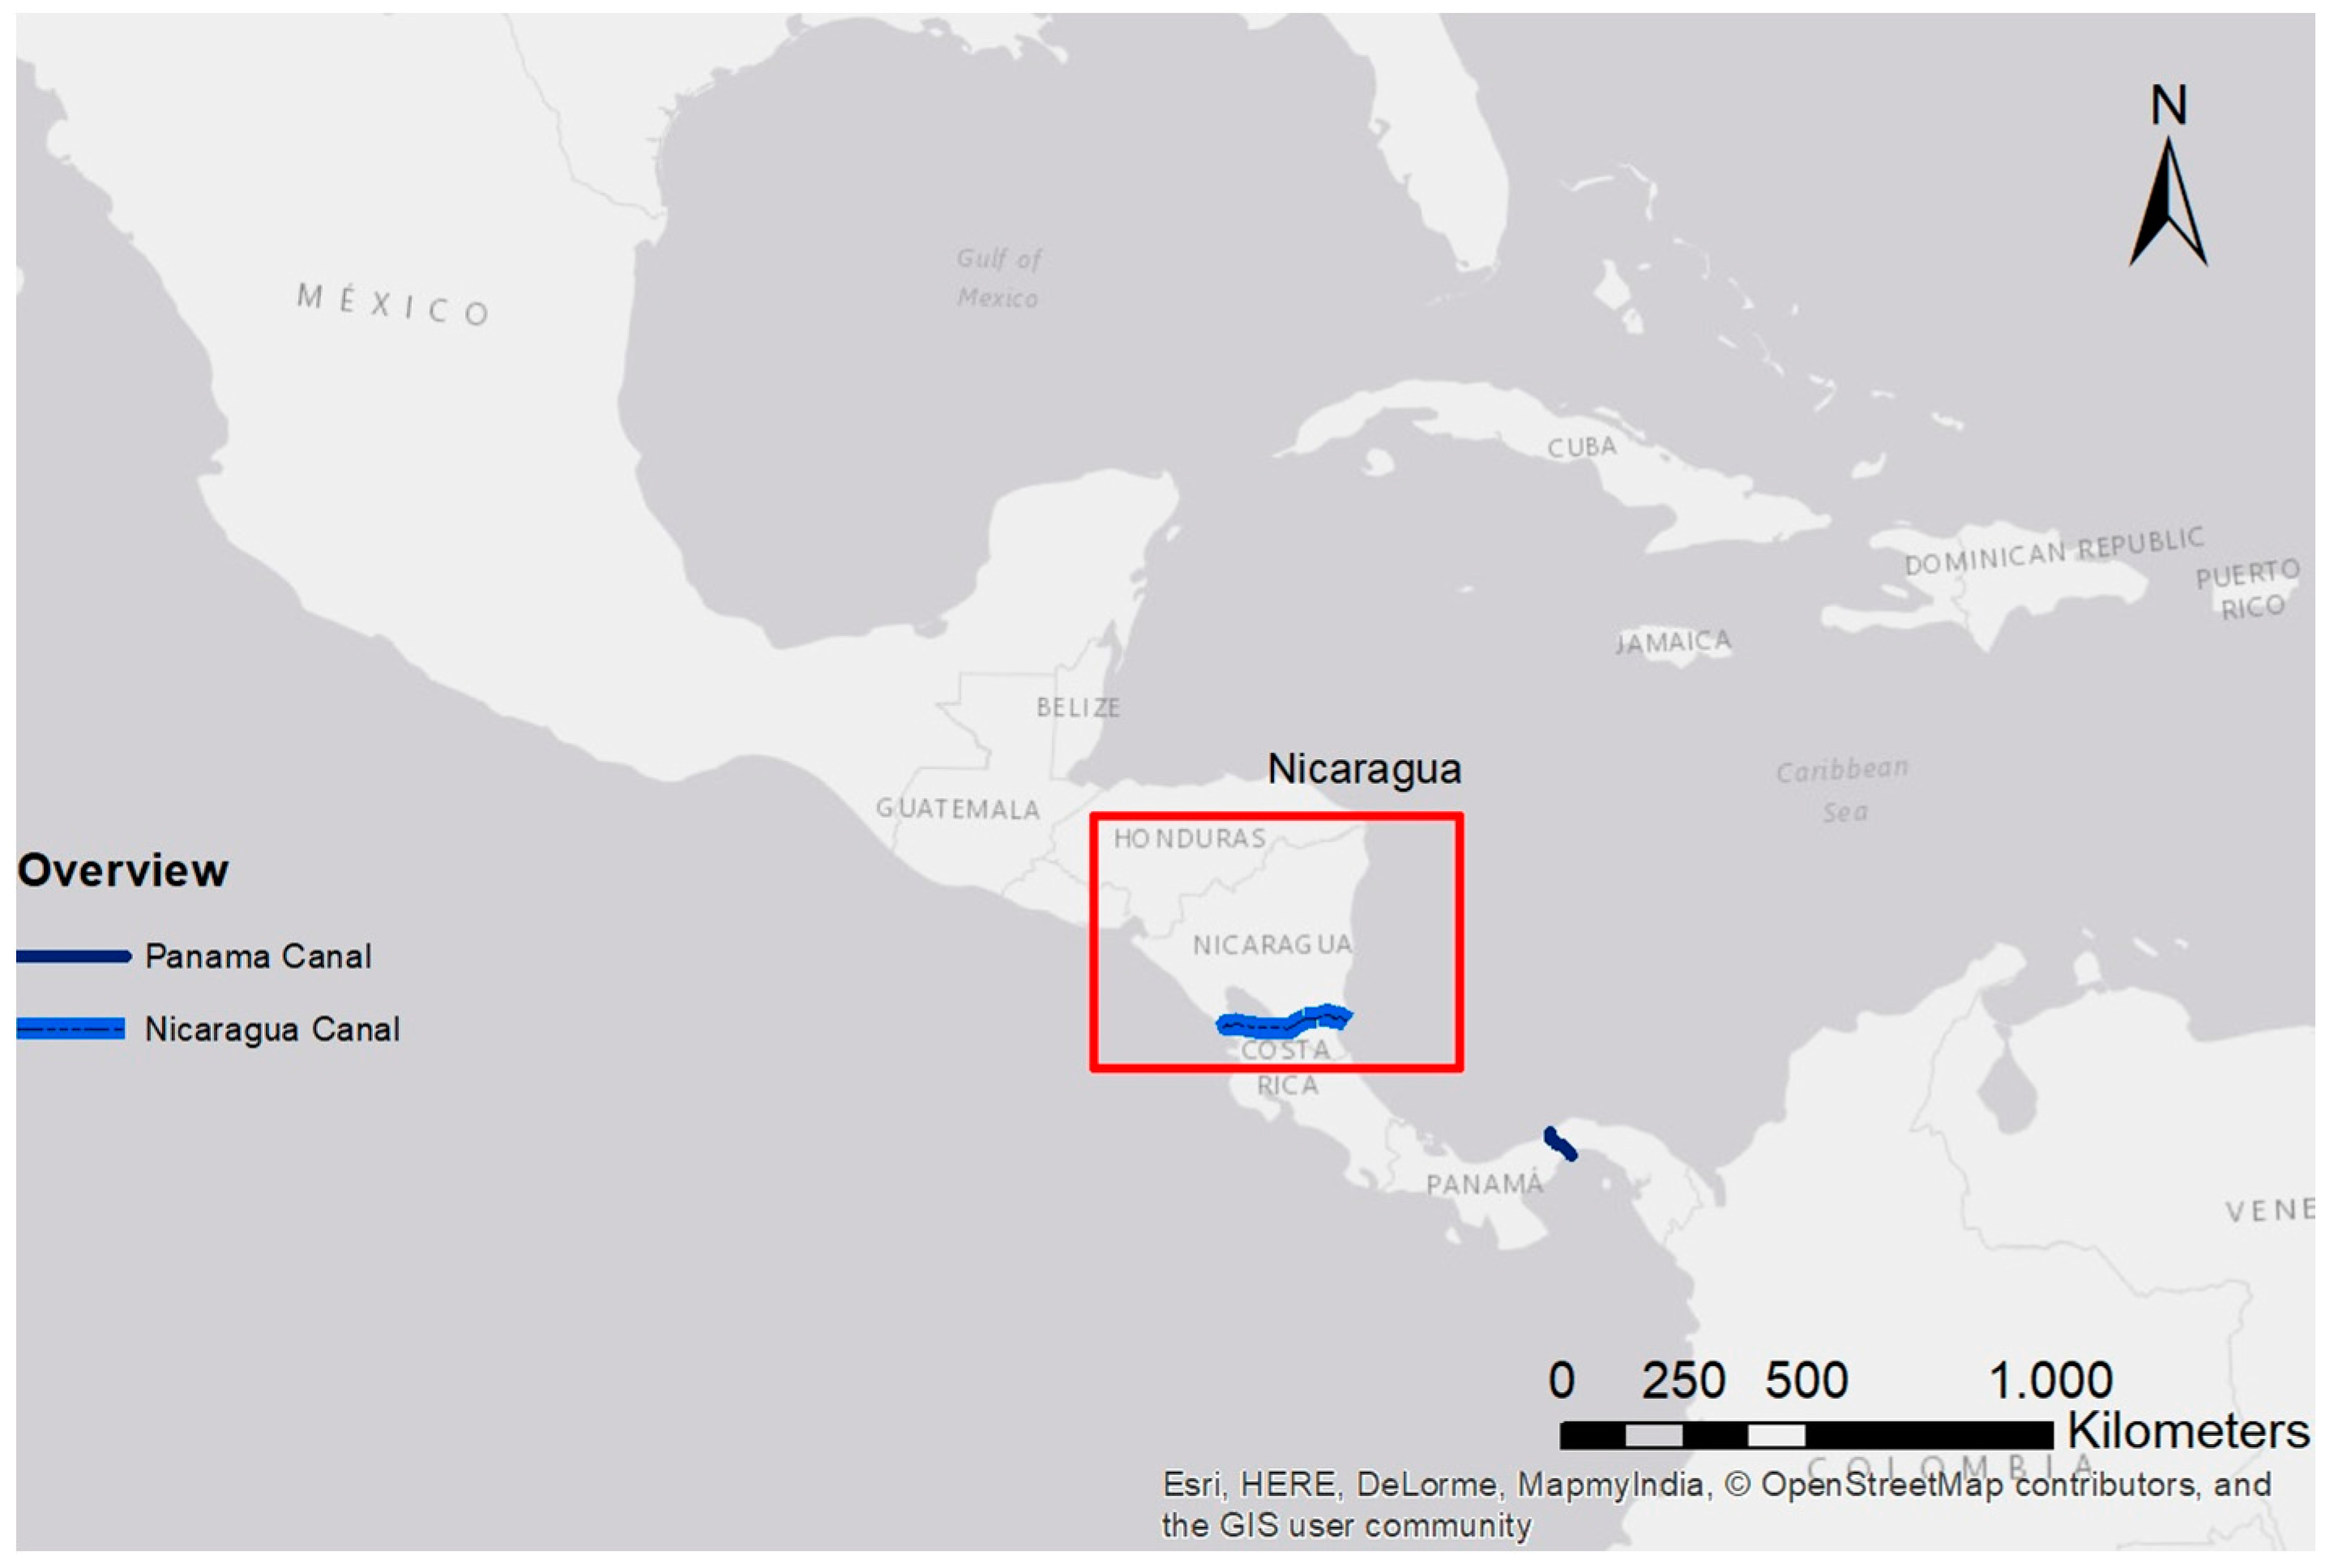
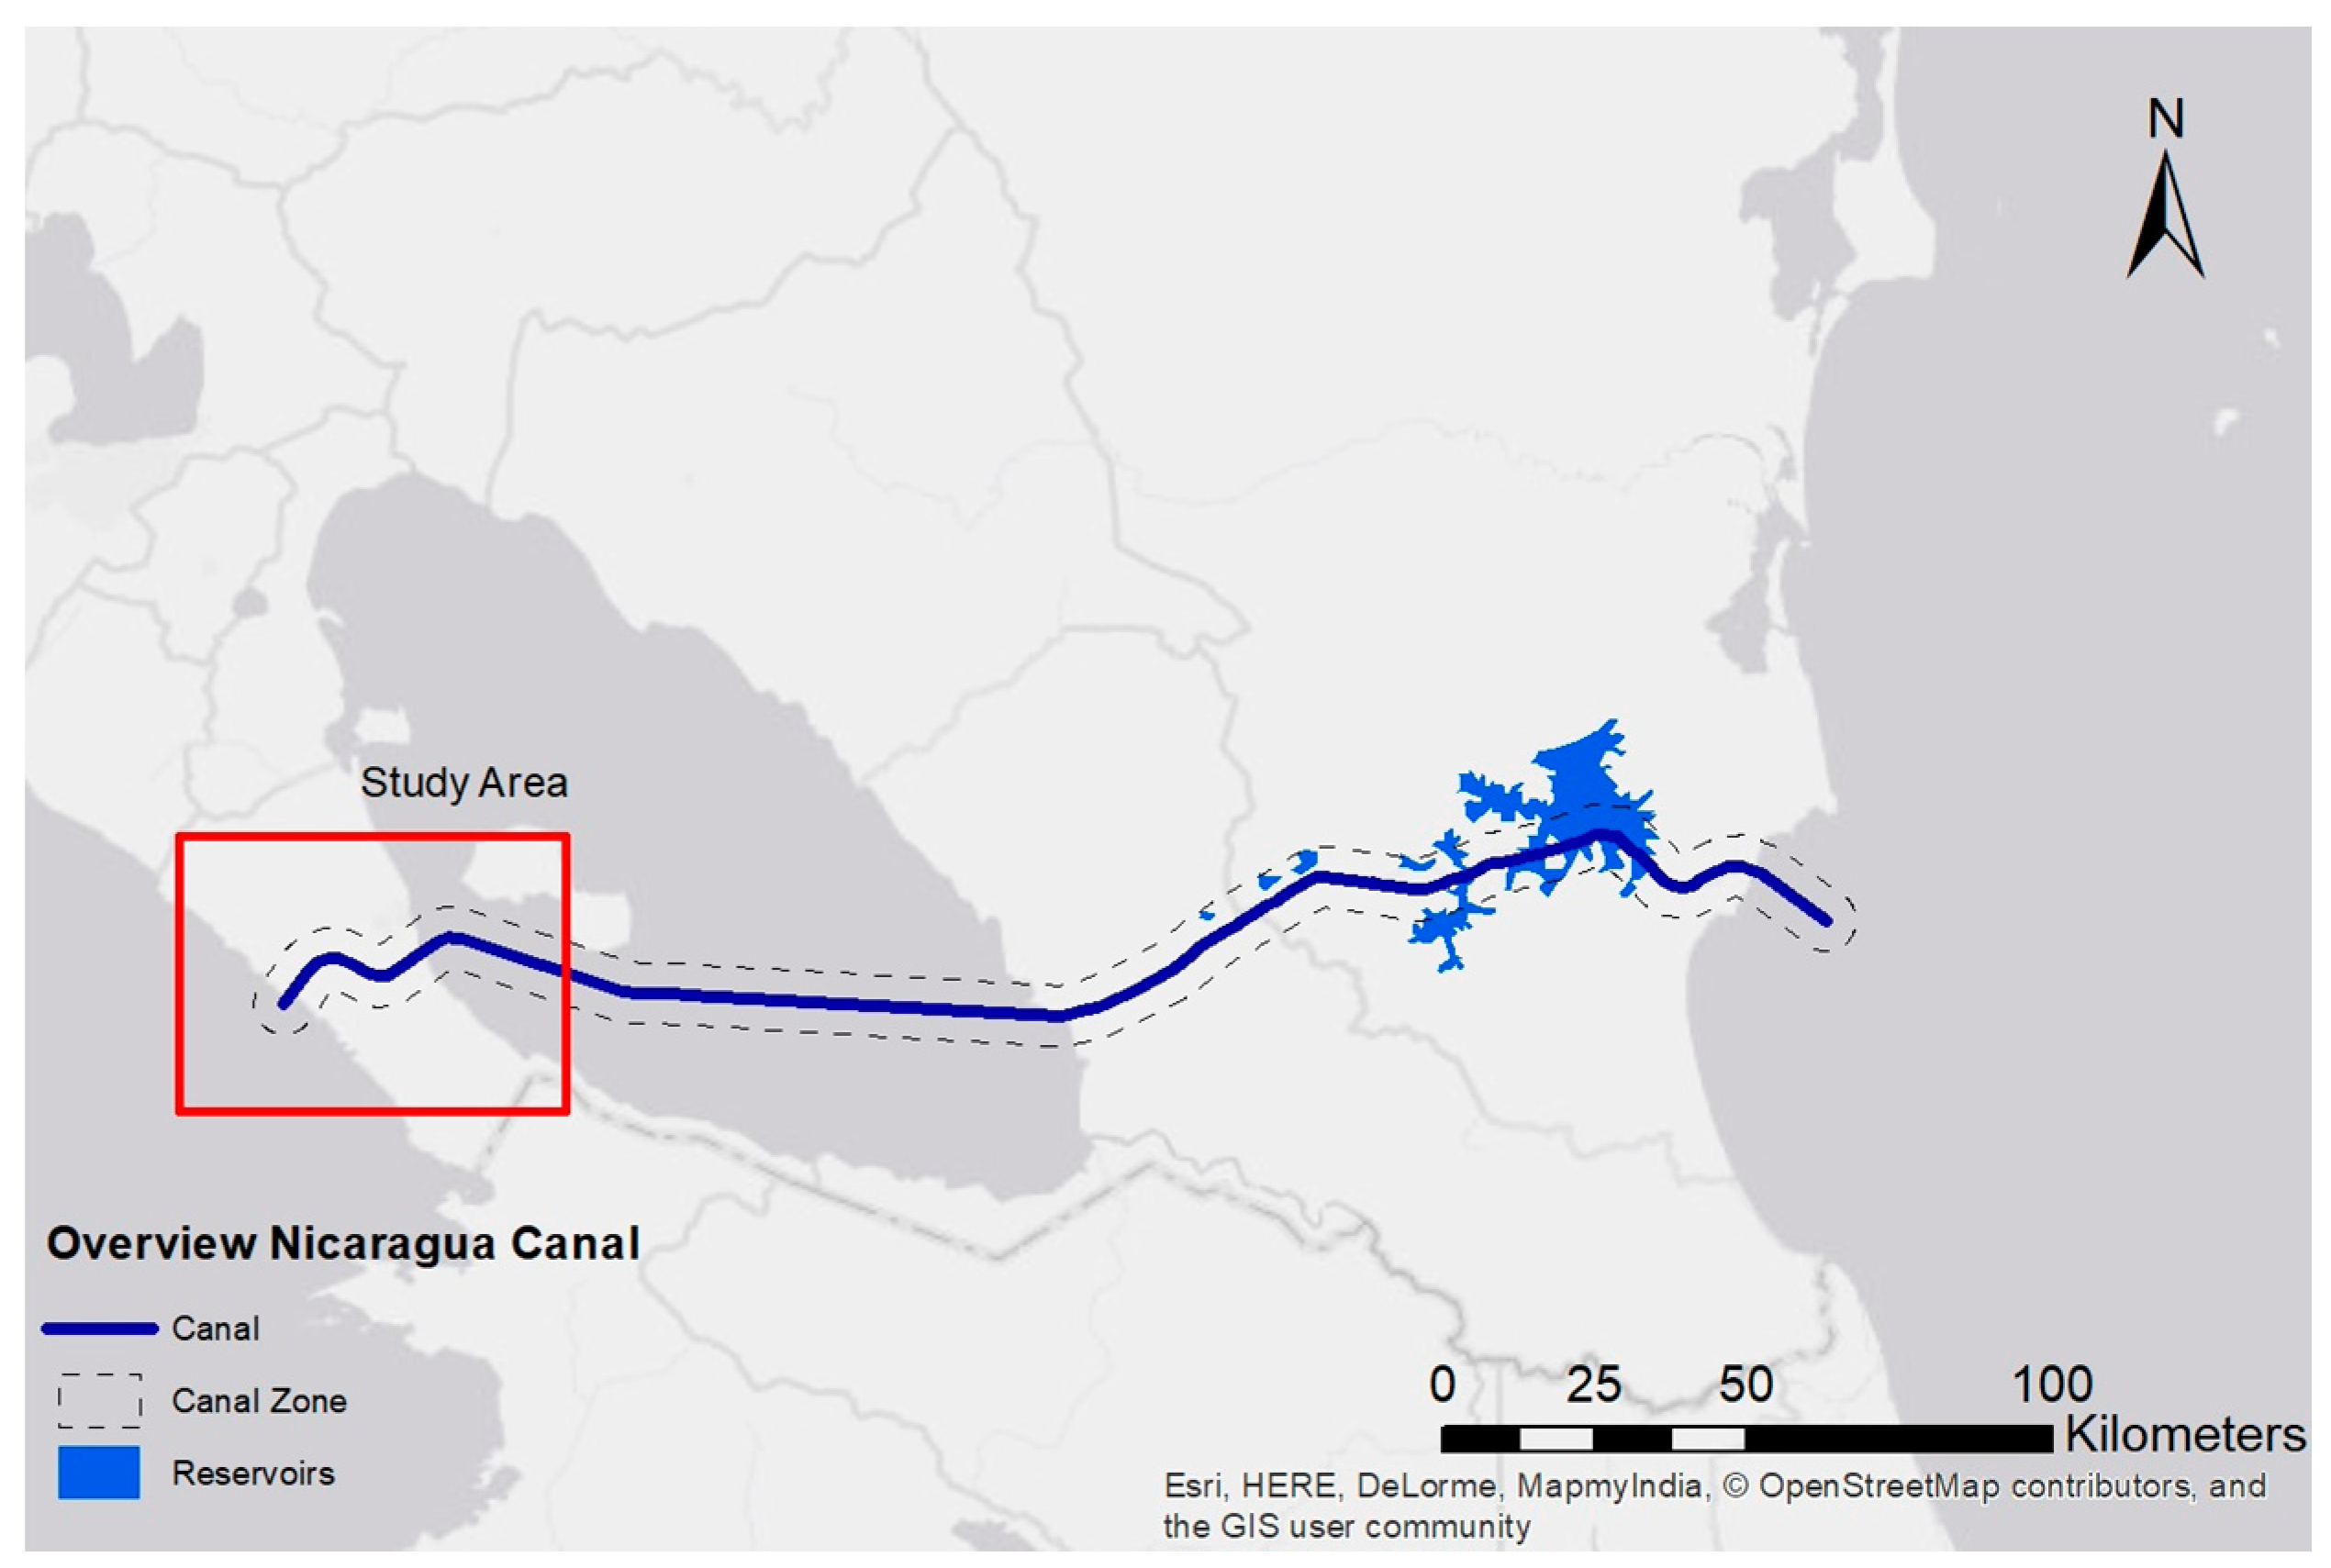
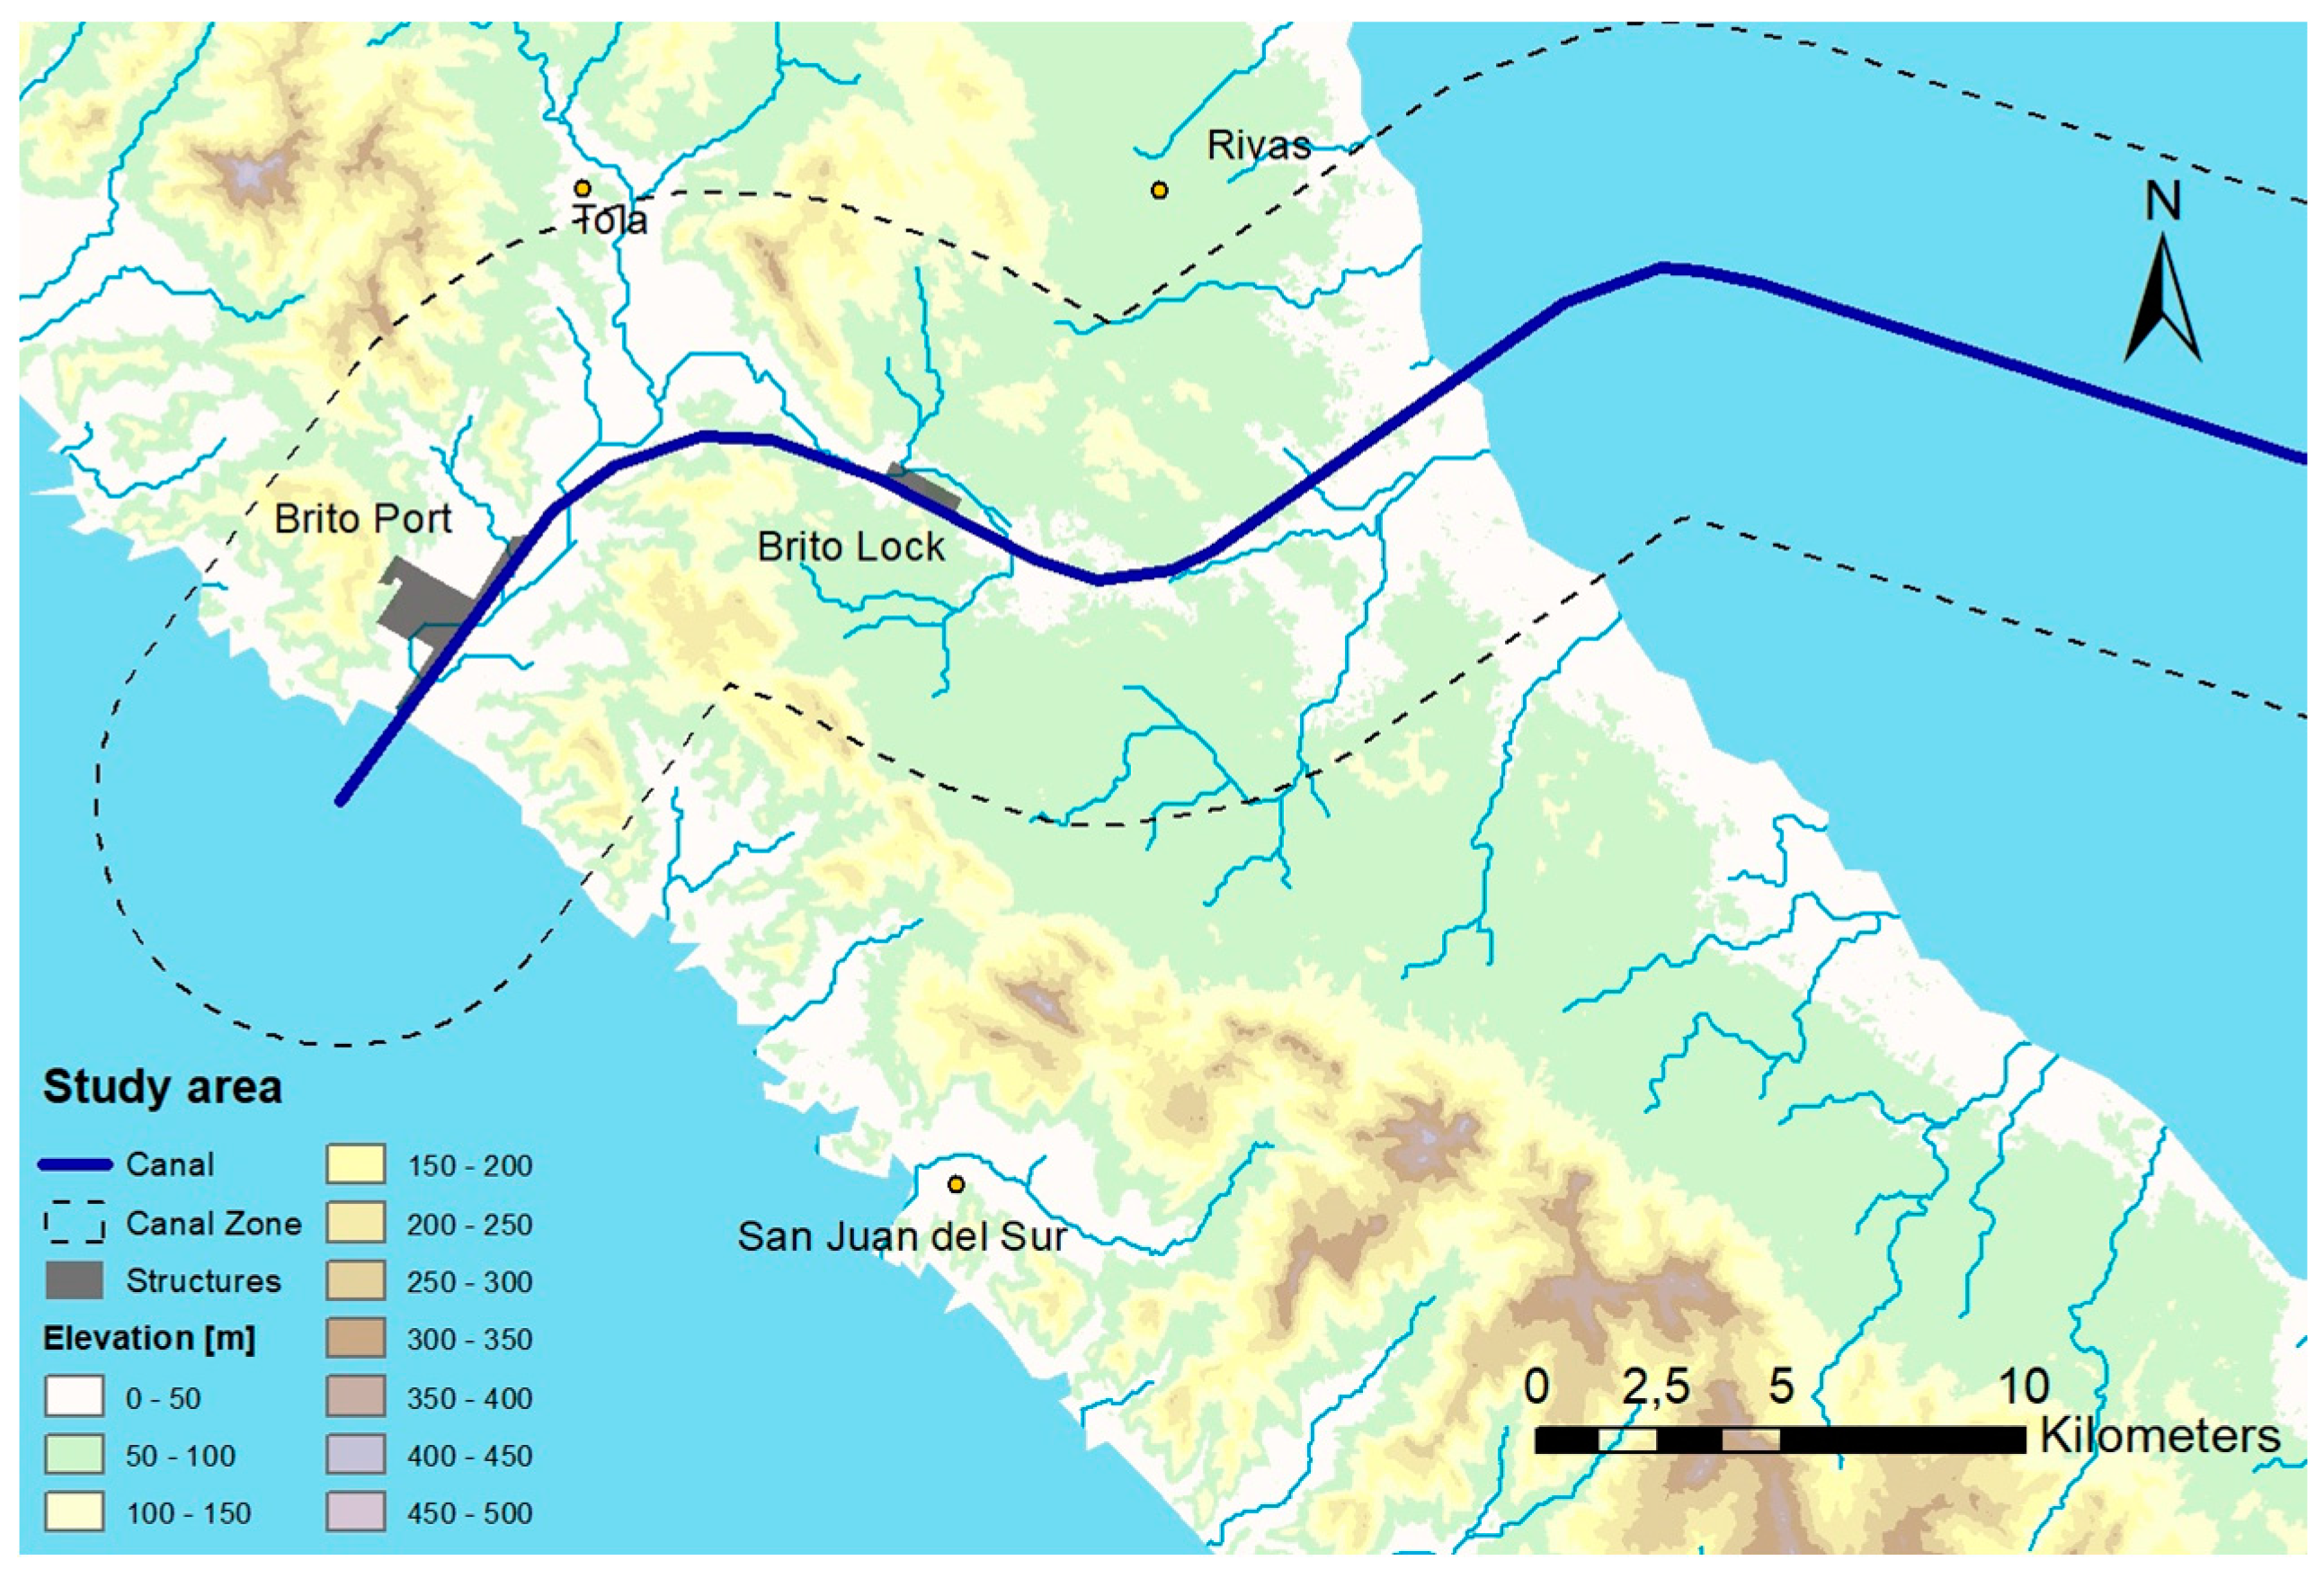
This section introduces the data used and methods applied to determine the study area (canal route and canal zone), to carry out the land use and socio-economic impact analysis within the canal zone and to realize the hydrological analysis to quantify the available river discharge for lock operation. All data processing was realized with the geographical information system ESRI ArcGIS 10.1 (ESRI Inc., Redlands, CA, USA). In each subsection, the data sources and methodology applied in each comparative assessment of the ESIA are documented and differences to them are stressed.

2.1. Study Area

The West Canal Segment starts from the Pacific coast at the Brito River Estuary, follows the course of the Brito River, crosses the watershed divide and then follows the Las Lajas River Valley to Nicaragua Lake (Figure 3). The canal will connect the Brito and the Las Lajas River Valleys through two sections joined by the Brito Lock to surpass the water table difference from sea level to the water level of Nicaragua Lake (~31 m). The canal section from the Pacific coast to the Brito Lock will have a length of 12.5 km; the section from the Brito Lock to Nicaragua Lake has a planned length of 13.4 km. The minimum depth is 26.9 m and minimum bottom width is 230 m. Moreover, the canal construction will require dredging of marine sediments along 1.7 km at the entrance of the canal on the Pacific coast [3].
The future canal zone, comprised by the canal and a 5-km wide area on both canal sides forming a 10 km buffer zone, is situated in the department of Rivas with the capital city of Rivas being the most populated settlement of the department. The canal zone is dominated by scattered human settlements and agricultural land use.
According to the HKND Group, several canal routes for the West Canal Segment were considered. The proposed one is supposed to have the least impact on people who would need to be resettled, it also avoids the Nahoa indigenous territory a few kilometers north from the planned canal zone, reduces potential seismic risks, and possibly reduces the construction costs [3]. However, the proposed route is the only one crossing the biologically-important natural reserve “Marina Isla La Anciana”, which includes the mangroves of the Brito River Estuary. This approximately 1460 ha large area, located at the western of the canal zone, is known for its high diversity of macro fauna, which has only been partly studied to date [8], e.g., the red crab is an endemic species of this habitat, which has not been reported elsewhere in the country [8]. The Nicaraguan Environmental Ministry has proposed the reserve as a priority area for marine conservation due to the abundant presence of corals. Furthermore, the studied canal zone includes tropical deciduous dry forest ecosystems being the most ecologically valuable connected habitat of the West Canal Segment [8]. The Brito River Estuary and the dry forest ecosystems are important foraging, breeding and resting areas for many resident and migratory wildlife species. They are also of importance as a nursery habitat for different kinds of sea life. Moreover, for rural communities, wildlife species like iguanas, red deer, or olive ridley and hawksbill sea turtles are important sources of complimentary nutrition [8]. However, the sea turtle species are on the Red List as critically threatened species [20].

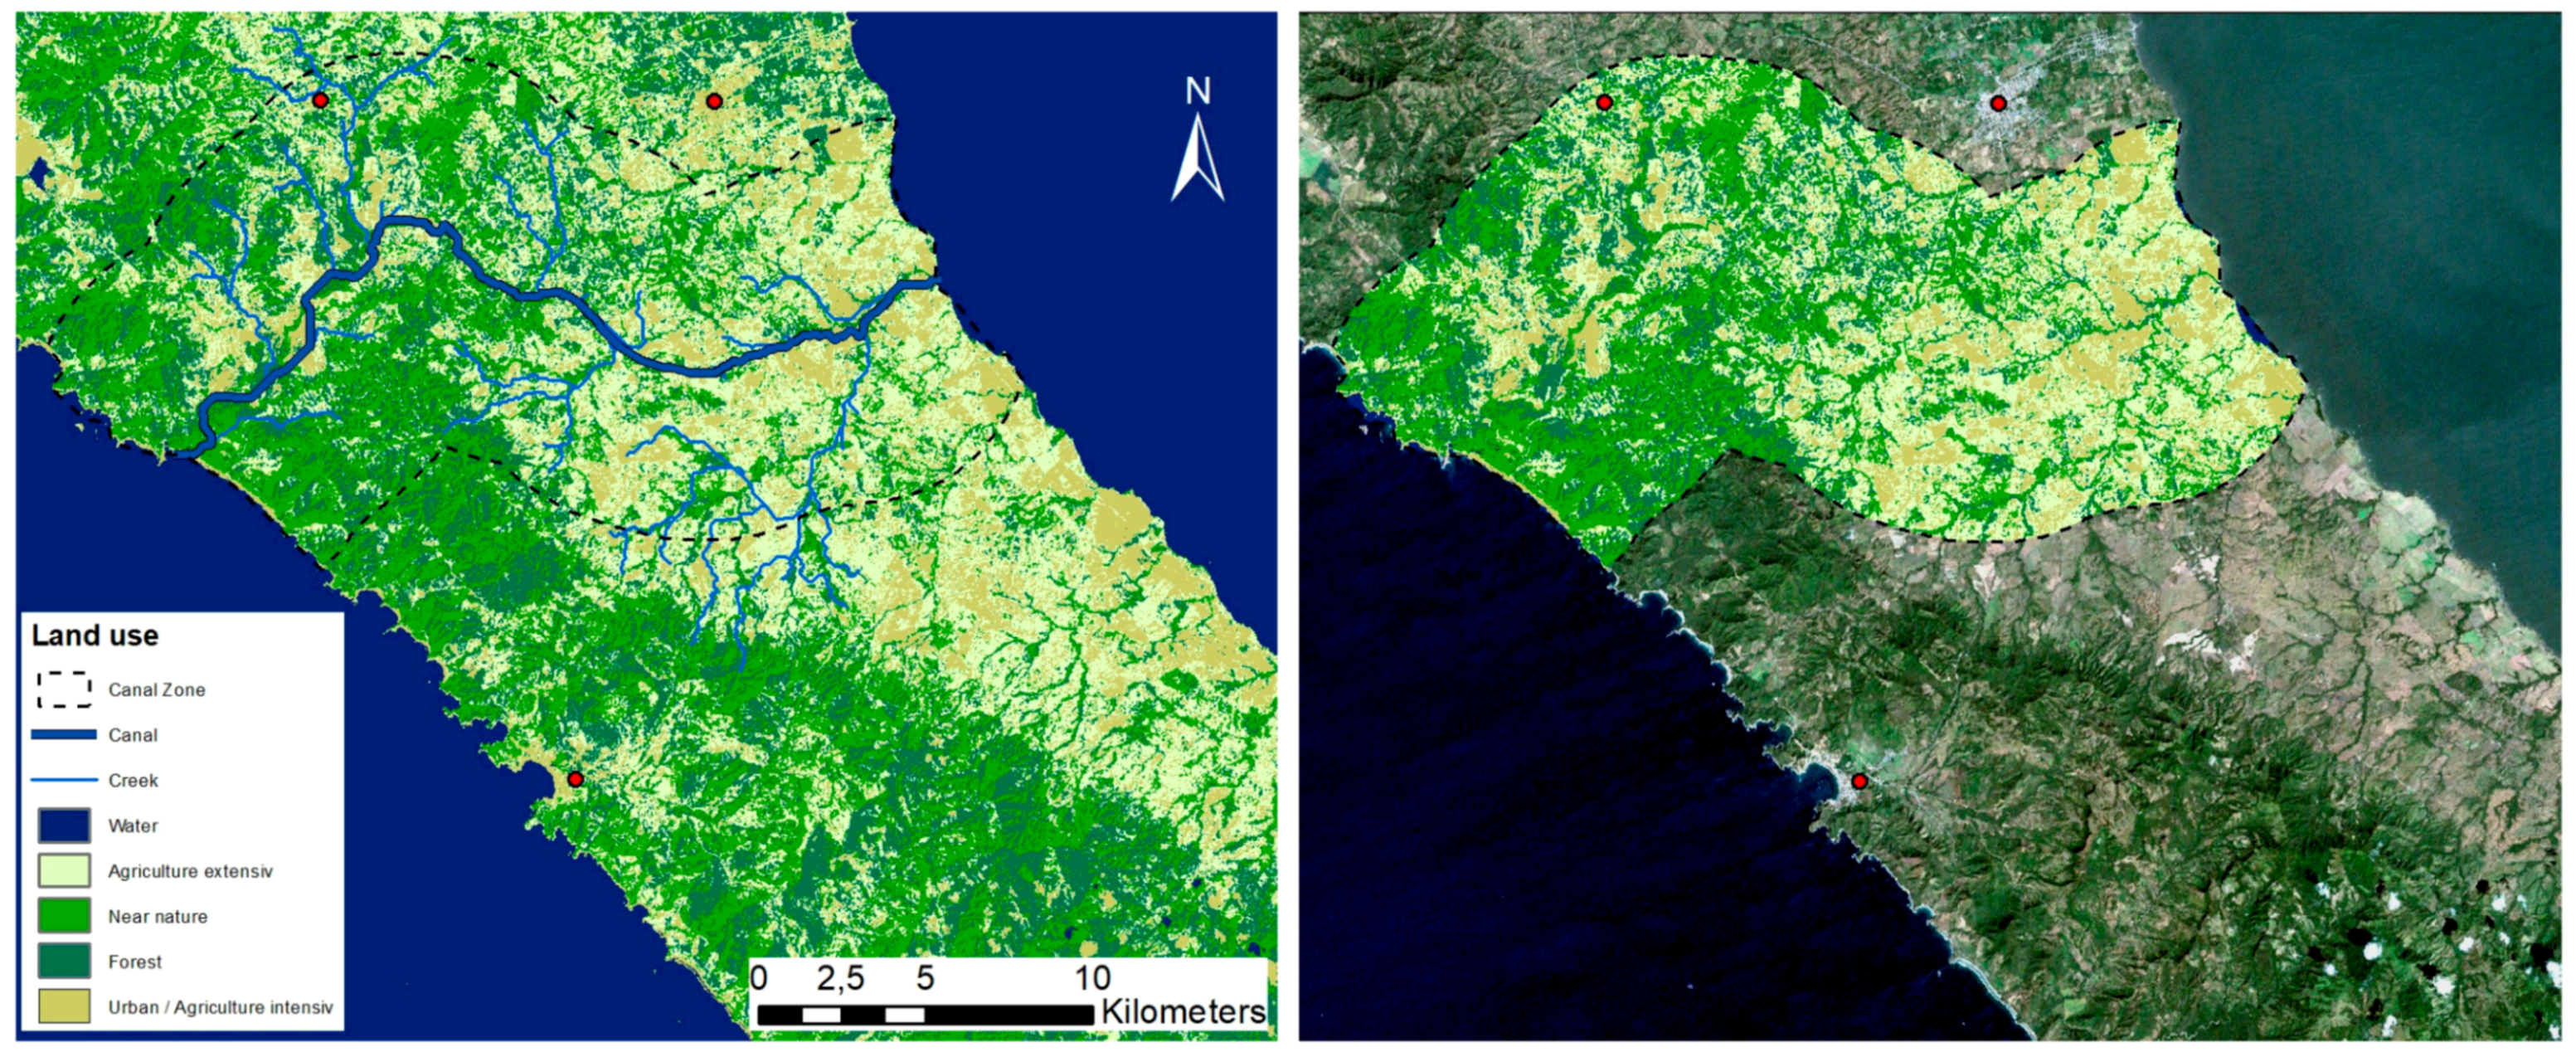
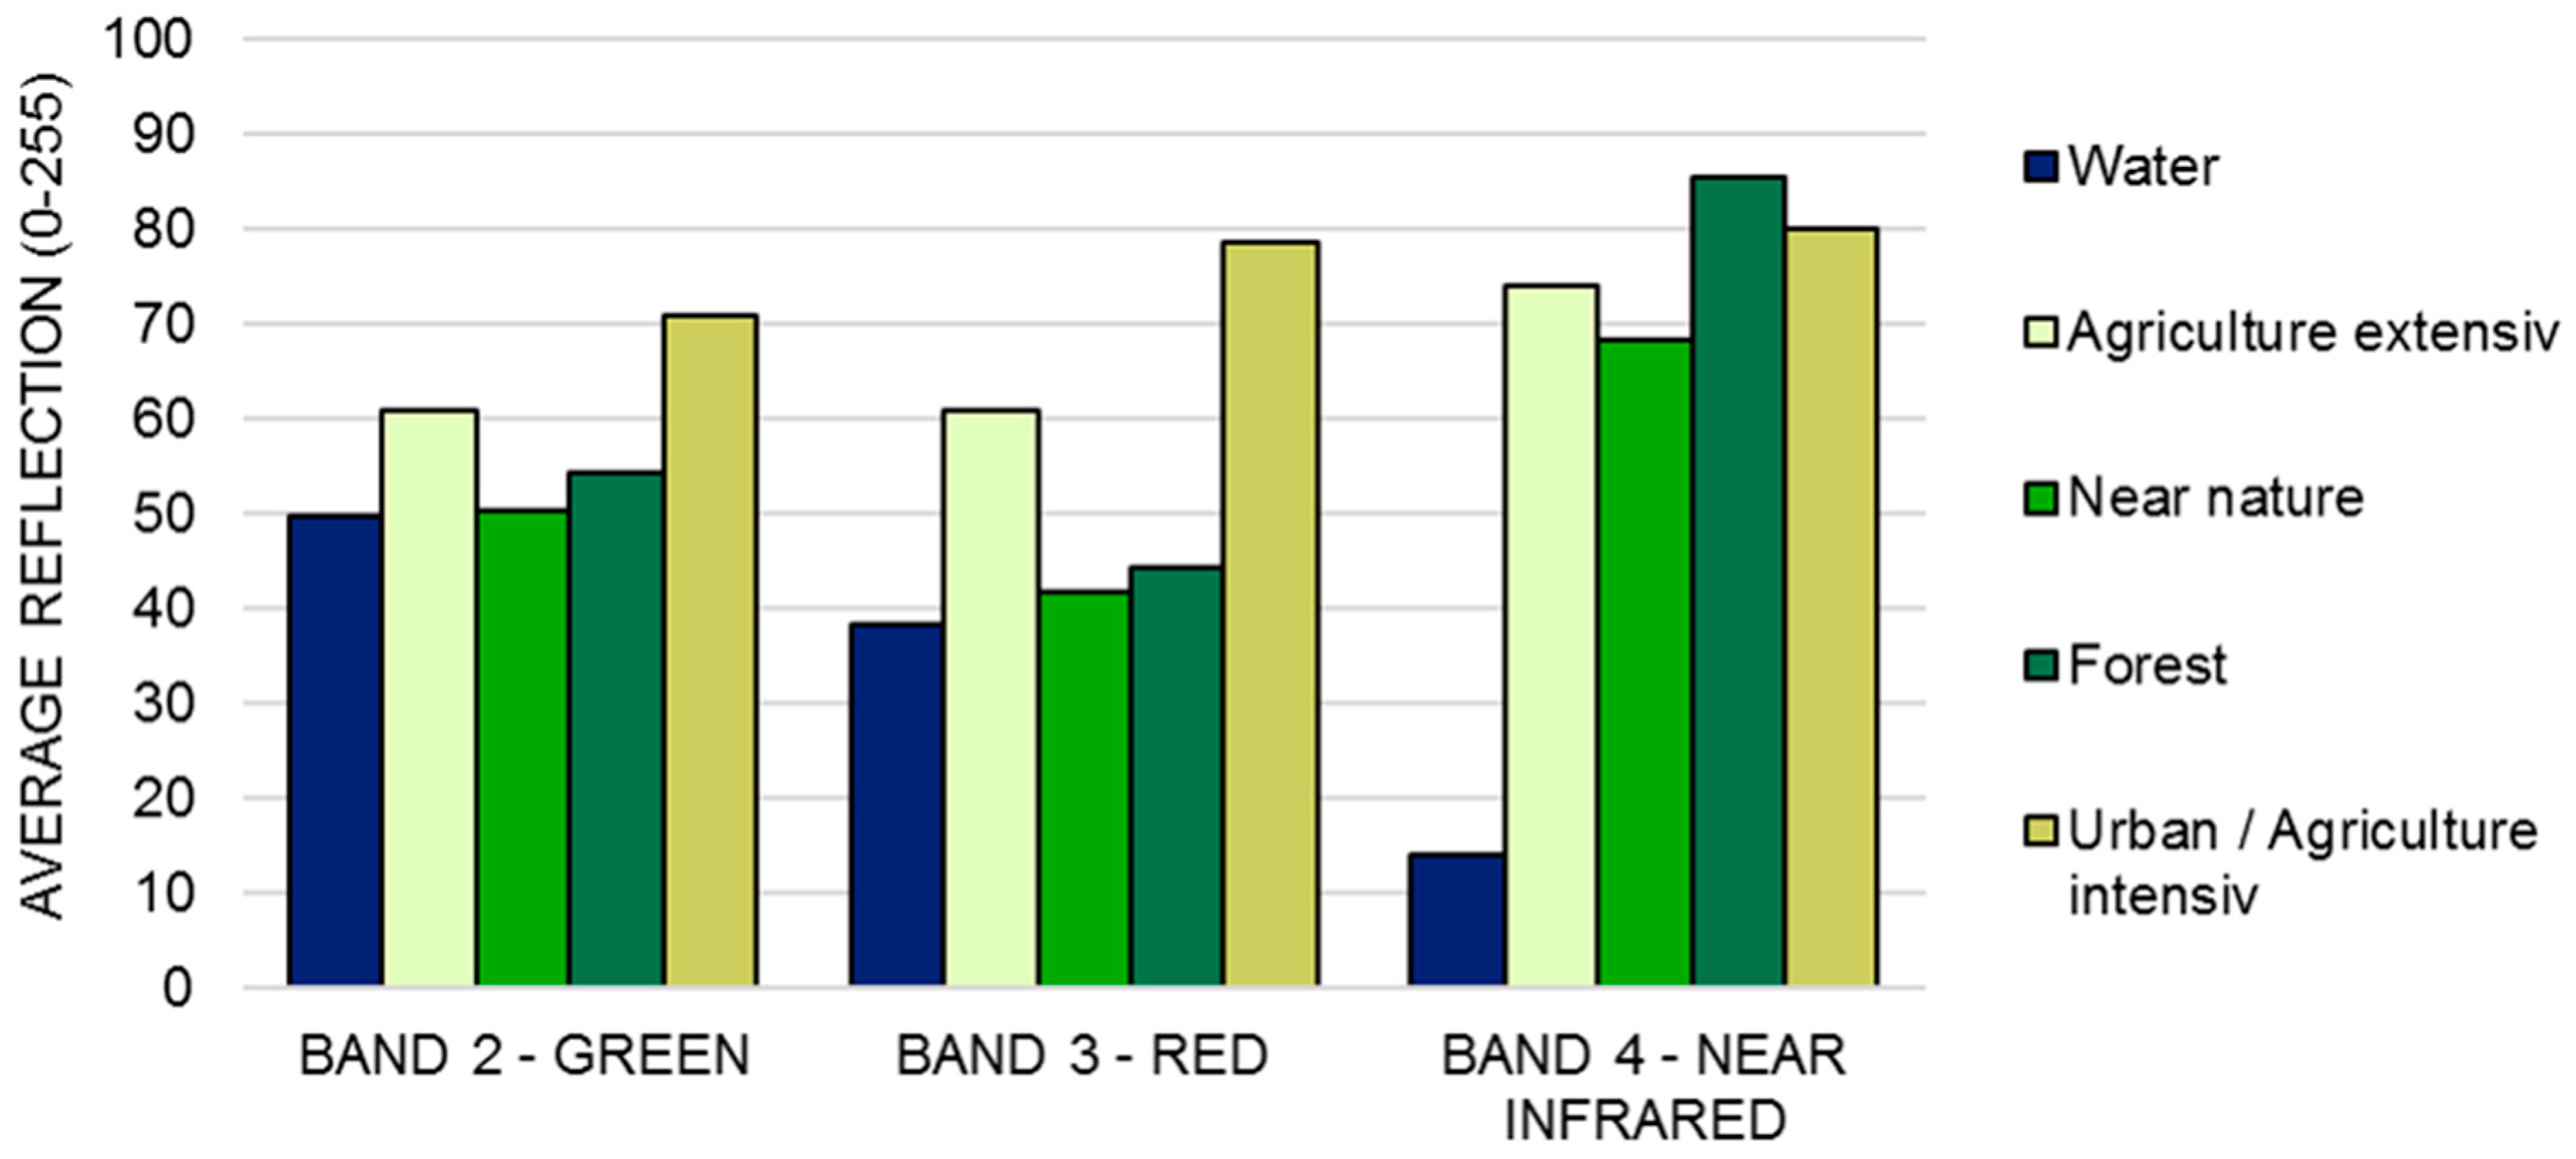
2.2. Land Use Analysis in the Canal Zone

A comprehensive understanding of land use changes is crucial for any profound evaluation of the proposed project. It allows the quantifying of valuable ecosystems and established uses affected by the canal. Furthermore, land use information provides vital data to model the water balance of the project area in order to estimate water availability for future lock operation.
A way to gather land use information for large areas is by multispectral satellite remote sensing—the analysis of reflected electromagnetic radiation of different wavelength to obtain spatially-distributed surface information. The spectrum of the wavelength used ranges from ~400 nm (blue light) to ~1 m (microwave radiation), with visible light from 400 nm (blue) to 750 nm (red). Radiation can pass the atmosphere in so-called atmospheric windows—the corresponding wavelengths are referred to as bands. The unique backscattering of a surface in multispectral scenes is called the spectral signature, which can be used to distinguish surface properties, e.g., land use. To detect vegetation, red and infrared bands are commonly used (i.e., Normalized Differenced Vegetation Index (NDVI); for reference, see, e.g., [21]). More elaborated techniques are based on classification algorithms and/or reference areas.
For this study Landsat 7 Enhanced Thematic Mapper Plus (ETM+) multispectral datasets were used, acquired from the United States Geological Survey Earth Explorer web platform. The spatial resolution of the visible and near infrared bands is 30 m. A temporal resolution of two pictures per month (16 days revisiting time) for each region is available. The spectral resolution provides nine bands, with three bands in the visible spectra, three bands in the near infrared, two bands in the thermal infrared, and one panchromatic band. Only cloud-free pictures are a sensible input for a classification, as the detected wavelength cannot pass through clouds. As the study is located in a tropical climate cloud-free scenes are rare and a singular picture—dated 27 January 2000—was the basis for the classification.
In this study, the iterative self-organized (ISO) Cluster Routine and the Maximum Likelihood Classification provided by the ArcGIS Spatial Analyst Multivariate (ESRI Inc., Redlands, CA, USA) were used. The ISO-Cluster is an unsupervised procedure to generate land use classes, as there were no designated training areas. Instead, the expert knowledge of structures and properties of the study area helped to determine which combination of spectral bands and classes gave the most satisfying results. The ISO Cluster Classification uses a migrating means technique to generate land use classes from the multispectral signature of all pixels. A maximum likelihood algorithm is then used to sort each raster cell to the class with the highest probability [22].
The spatial resolution of the Landsat 7 ETM+ data is not suitable to distinguish small-scale rural and urban structures (i.e., plots, roads, etc.). Therefore, five coarse-scale classes of urban and rural characteristics were defined. Within the urban areas, two classes were differentiated, “urban and intensive agriculture” as well as “extensive agriculture”. For the rural areas two classes were distinguished, “forest and thicket” and “rural open vegetated areas including grasslands”. The fifth class represents “water bodies”. Best results were obtained with the band set of bands 2, 3, and 4 (green, red, infrared) of the Landsat 7 ETM+.

2.3. Socio-Economic Impacts

This study assesses two socio-economic impacts: population resettlement and interruption of the transportation network in the canal zone. Within the canal zone and nearby, people mainly live in small settlements in rural areas, with Tola representing the largest settlement (about 3322 inhabitants in 2017) located in the northern part of the canal zone, which is directly affected by the canal construction [23,24]. To assess both considered impacts appropriately, data from the Nicaraguan National Institute of Development (INIDE) (Managua, Nicaragua) from 2005 (last national census) was used in order to obtain information about the administrative divisions, population distribution, and transportation network. For information about population growth, world development indicators from the World Bank database were used additionally.

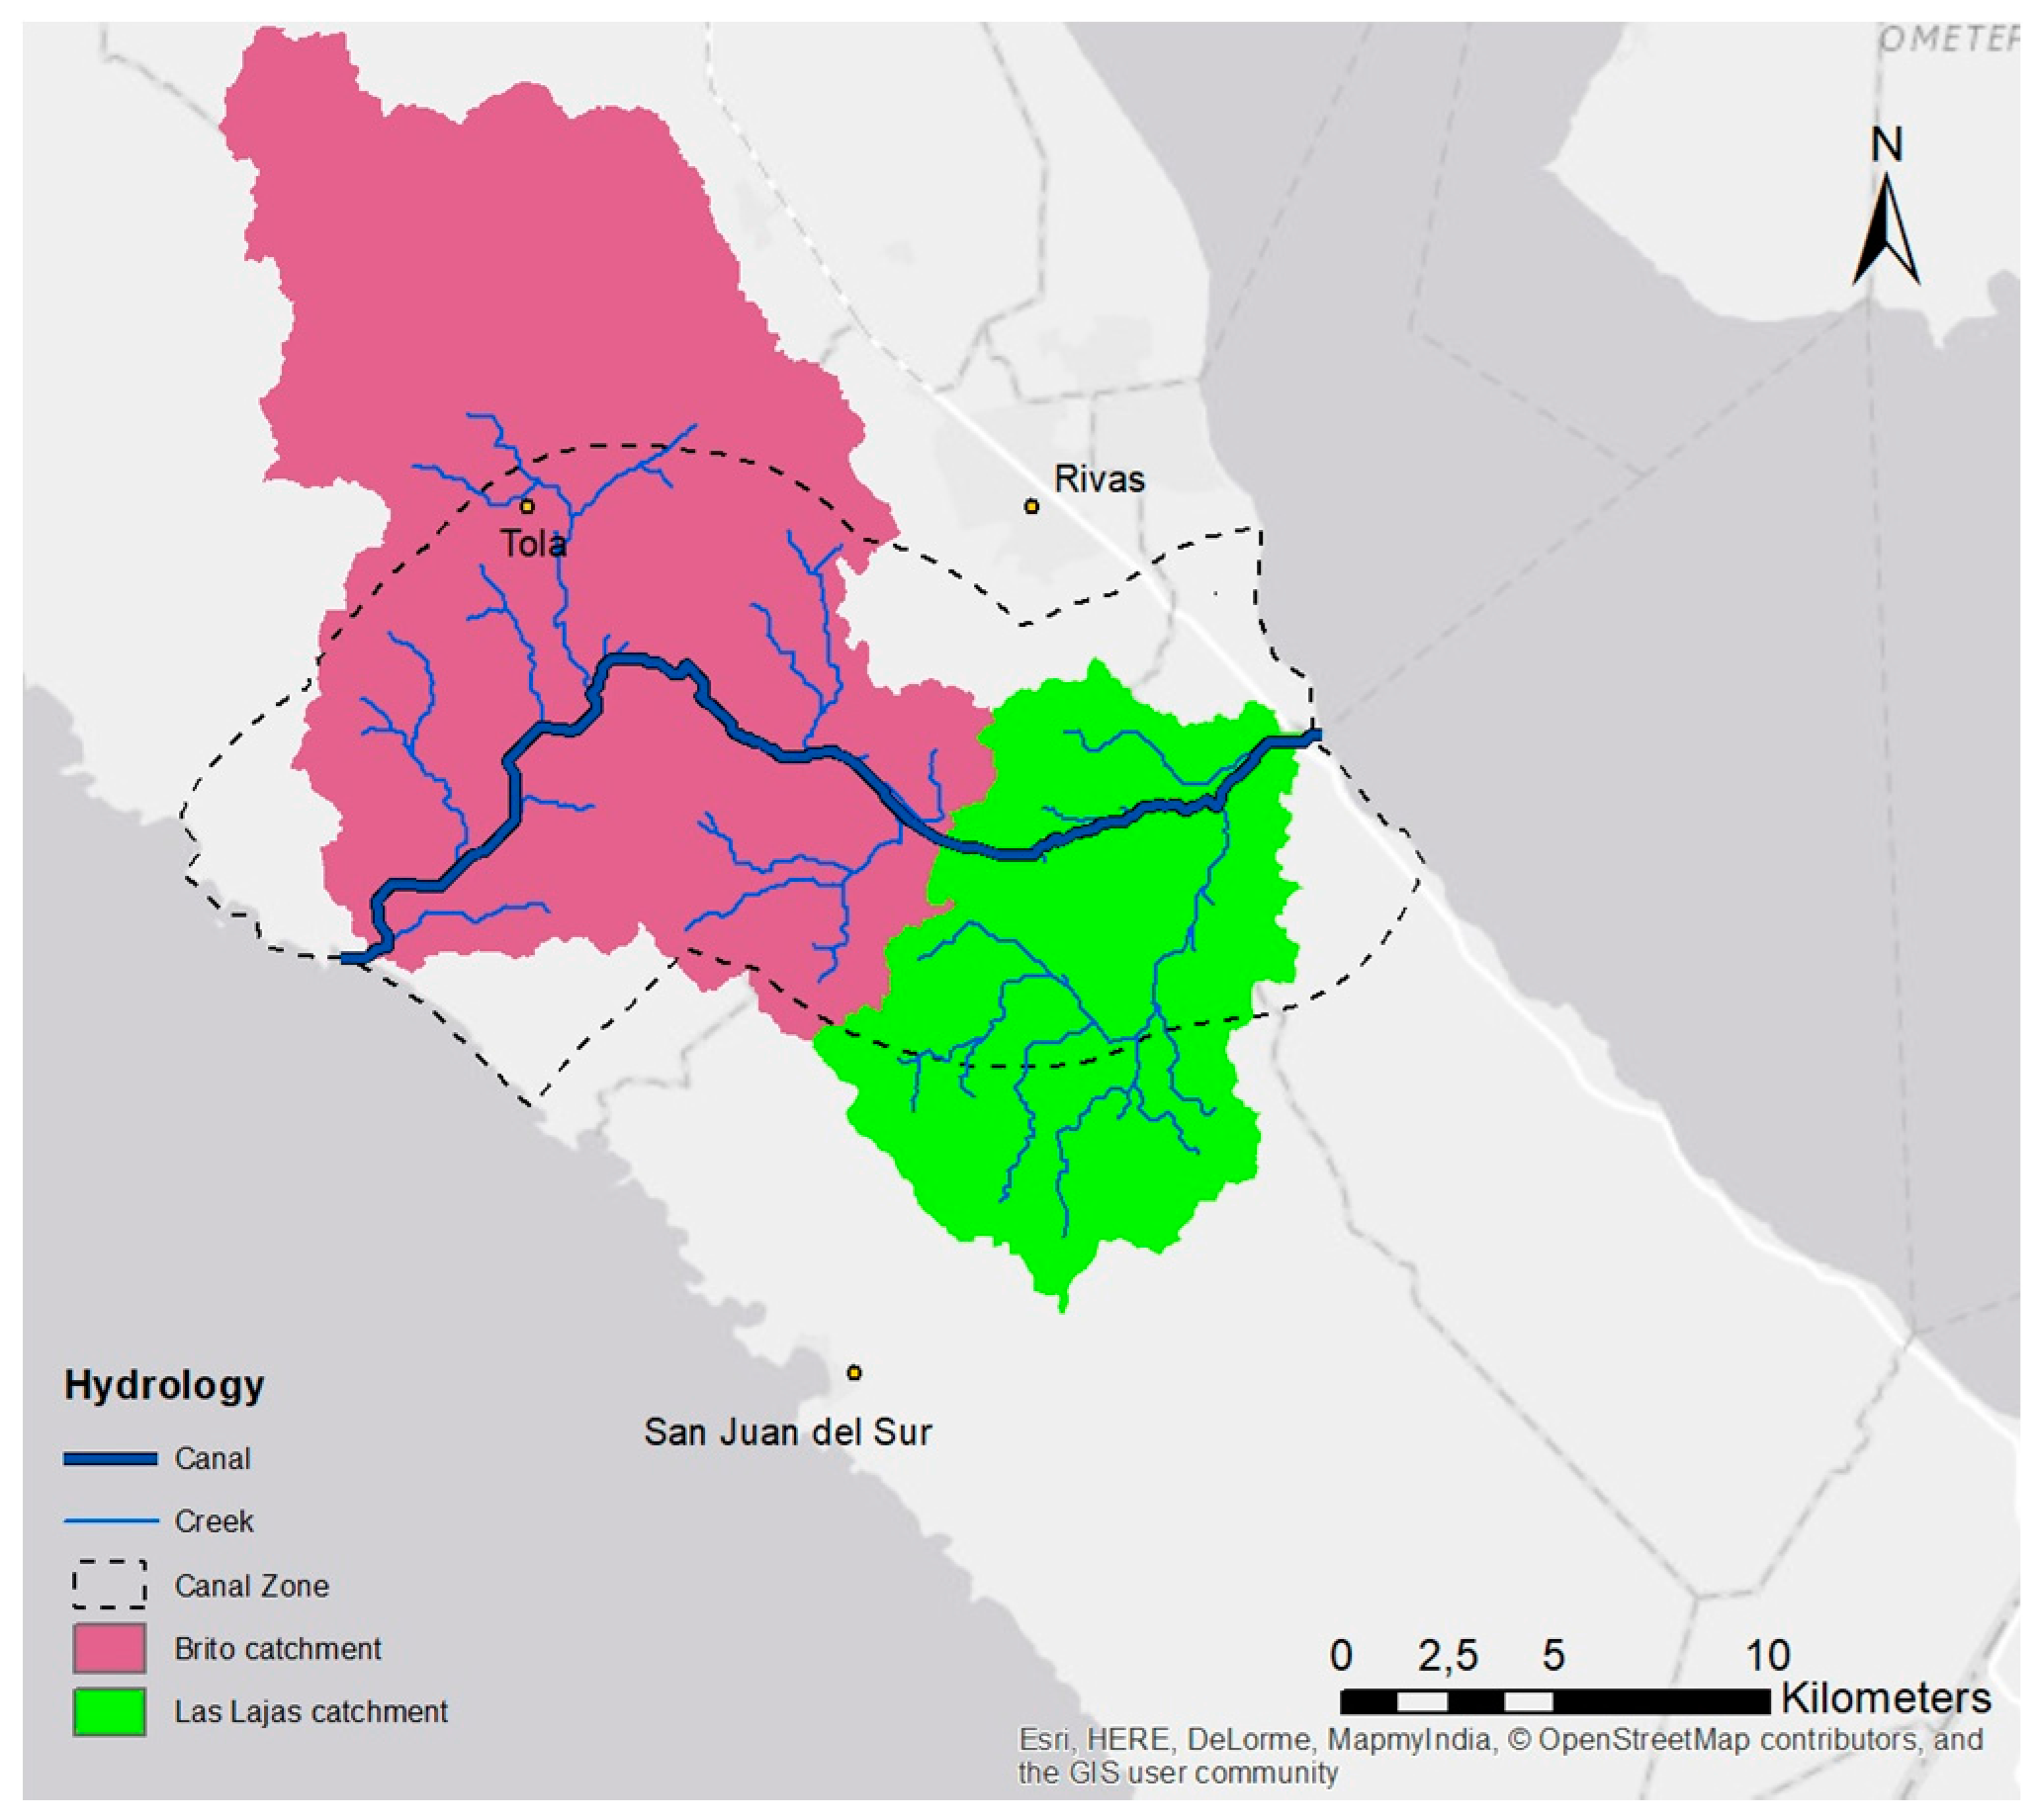
2.4. Hydrological Analysis

The digital elevation model (DEM) used for the hydrological analysis was obtained from the Shuttle Radar Topography Mission data (SRTM-3) recorded in February 2000 [25]. The mission used an interferometric synthetic aperture radar to measure elevation data nearly globally. The dataset used was published in 2014 with a resolution of 1 arc second (30 m), an absolute height error of less than 16 m, and an absolute geolocation error of less than 20 m [26].
After DEM preprocessing, the stream network and river catchments of the study area (hydrological properties) were determined, and the canal course reconstructed. Only the directly-affected catchments, which locally provide water for the operation of the canal and Brito Locks, were taken into account. These are the catchments of the Brito and Las Lajas Rivers (Figure 4). The natural course of the canal follows the course of both main rivers. The artificial connection of the rivers for the canal course was chosen with the lowest slope possible.

2.5. Discharge Determination

For the determination of total runoff, three components should be considered: surface runoff, interflow, and base flow. The surface runoff corresponds to the effective percentage of a precipitation event, which flows as an immediate runoff. The interflow flows into a water body with a short time delay (usually hours or days). Therefore, the interflow is considered part of the surface runoff on a monthly time scale. The base flow equals the amount of water that flows mainly from the groundwater with a delay of several weeks into a water body.
Average monthly precipitation for the study on water balance was retrieved from WorldClim—Global Climate Data [27]. High-resolution (30 arcseconds–1 km resolution) climate data, e.g., average monthly and annual precipitation data, are obtainable worldwide. Among others, the databases of the Global Historical Climatology Network, Food and Agriculture Organisation of the United Nations, and R-Hydronet were used. Most records were acquired for 1950–2000. Error in mean monthly precipitation, in general, is below 10 mm, and uncertainties are highest in the tropics and mountainous areas [28].
Since no data on discharge is available for the Brito and Las Lajas rivers, the mean monthly discharge was estimated based on commonly used calculation methods and open-data sources. Discharge measurements from a neighboring catchment of similar characteristics (size, topography, and climate) were used for calibration. Data of the rainfall gauging stations at the municipalities of Tola, Rivas, and San Juan Del Sur provided by Instituto Nicaragüense de Estudios Territoriales (INETER) is used to calculate an average of the rainy days per month. Thus, average rainfall per precipitation event within a given month is considered.
P m e a n , i = P t o t , i n i
Pmean,I = Average rainfall per precipitation event [mm]
Ptot,i = Rainfall of month I [mm]
ni = Number of precipitation event of month I [–]
The longtime mean annual precipitation is determined as sum of the monthly average precipitation and is 1576 mm.
The surface runoff resulting from effective monthly precipitation is calculated using a modification of the (former) United States Soil Conservation Service (SCS) Curve Number (CN) method [29], starting with the determination of CN value, which represents the storage capacity of the soil and the area-specific parameters, like the moisture class, the soil type, and the land use. These parameters are estimated based on the soil characteristics (soil type C and soil moisture class I) given by the ESIA (Appendix GS-1 of the ESIA [3]) and the land use classification as described in Section 2.2. Average CN values were determined by area-weighted CN values of different land uses within a catchment. Additionally, averaged CN values were calculated for wet (May–November) and dry seasons (December–Aril), thereby considering different antecedent soil moisture conditions.
Q i = [ [ P m e a n , i 0.01 × 25.4 × ( 1000 C N i 10 ) ] 2 P m e a n , i + 0.99 × 25.4 × ( 1000 C N i 10 ) ] × n i
Q = surface runoff [mm]
P = precipitation [mm]
CN = Curve Number [–]
i = monthly average
Base flow (Qb) was estimated to equal 5% of the precipitation of the previous month. This percentage, as well as CN values and initial losses in the CN approach, were calibrated with existing discharge measurements from a nearby catchment of similar size, topography, geology, and land use [30], within reasonable physical limits. For further reference of the calibration method see also [31]. Thus, a retention of the base flow (Qb) of 5% of the precipitation from the previous month is assumed in accordance with field measurements and observations. The total available monthly discharge Qtot is calculated:
Q t o t , i = Q i + Q b , i = Q i + 0.05 × P i 1

2.6. Water Availability of the Brito Locks

The Brito Lock consists of three successive chambers, which are used to overcome a height of about 10 m each to master the height difference between the Pacific Ocean and Nicaragua Lake (31 m). Each lock chamber has three water-saving basins to reduce fresh water consumption of the lock by approximately 60% (Appendix RH-12 of the ESIA [3]). For the calculation of the water volume needed to lift a vessel, the given dimensions from the HKND were used [3,32]. The year 2050 is used as the reference year, in which 14 ships per day should cross the canal (for comparison: 32 ships crossed the Panama Canal in year 2014 [33]). It is assumed that only one filling of the locks for the passage of two ships is required, which results in seven filling-draining processes of the chambers per day in 2050.
V l o c k s = W c h a m b e r × L c h a m b e r × H l i f t × n c h a m b e r × η l o c k × n l i f t
Vlocks = Lock water demand [m3/d]
Wchamber = Lock chamber width [m]
Lchamber = Lock chamber length [m]
Hlift = Lock chamber lift [m]
nchamber = Number of lock chamber [–] = 3
ηlock = Lock water reuse coefficient [–] = 0.6
nlift = Number of daily ship lifts
Q l o c k s = V l o c k 24 h d × 60 m i n h × 60 s m i n
Qlocks = Lock water demand as discharge [m3/s]

3. Results and Discussion

The presentation of results and the corresponding discussion follows the structure of Section 2. The principle results are summarized and confronted with respective statements in the ESIA in Table 1.
All assessment results are compared with respective declarations in the ESIA and stated in Table 1 as a relative difference Δ [%]:
Δ = ( x o w n x E S I A ) x E S I A × 100
When compared with official declarations the main results of this study reveal:
  • Much more forested areas (+53.7 km2) and areas of extensive agriculture/near nature (14.4 km2), but far less urban and intensively-used areas (−39.6 km2) are affected by the canal and the canal zone.
  • A population of nearly 16,500 and several regionally- and locally-unique transportation and communication routes are directly affected by the canal construction.
  • A slightly lower water availability (−6.6%) and a much higher water demand for lock operations (+31.8%) were estimated. Accordingly, only about 20% of the lock water demand could be met by locally-available discharge.
All results are discussed and compared to ESIA declarations in detail in the following sections.

3.1. Study Area

The canal route and associated canal zone elaborated in this study were constructed based on the natural course of the two river catchments. The differences compared to the planned canal course and canal zone by the HKND Group are negligible (compare Figure 3 and Figure 5). The derived catchments for this study are also very similar in form and size to the catchments documented in the official planning documents (Table 1). Therefore, the constructed canal course, canal zone, and catchments represent a good basis for the following comparisons with official impact statements.

3.2. Land Use Analysis in the Canal Zone

The achieved results of the land use classification are presented in Table 1 and Figure 5. According to our study, the canal zone, including the 10 km buffer area, has a total size of 291 km2. The total amount of residential and rural areas is rather similar, while a clear change in land use patterns from east to west can be observed. The eastern part of the study area with the coastal area of the Nicaragua Lake shows predominantly smaller urban structures with agricultural areas. The western part and Pacific coast are mostly rural with several ecosystems of special value, like the tropical dry forest and the mangrove areas. The transition between these main areas is rather abrupt and coincides with the watershed divide or the mountainous areas. The visual comparison and use of expert knowledge of the study area corresponds to the obtained results to a reasonable level of accuracy. Additionally, some important structural features, especially creeks, can be identified as well.
In the ESIA multispectral satellite data, land use classifications obtained from the agricultural ministry of Nicaragua (MAGFOR) and field data were used. The remote sensing data are from the RapidEye Constellation satellite program from the year 2012 (Appendix GS-1 of the ESIA [3]). The data has a spectral resolution of five bands (blue, green, red, red edge, and infrared) and a spatial resolution of 5 m. All footage and processed data obtained by RapidEye can be acquired commercially from Planet Labs Germany (Offenbach, Germany) [34]. Data was provided by the former Gesellschaft für Technische Zusammenarbeit (GTZ) (Eschborn, Germany) within the conditions of development work with the Nicaraguan Government (Appendix GS-1 of the ESIA [3]).
For reference about the land use classification procedure of the ESIA, only an internal workflow document written in Spanish can be found in Appendix GS-1 of the ESIA [3]. Information concerning the date and number of used satellite pictures is lacking, as well as a description about how the spectral signatures were obtained. The classification is supposedly done by a supervised classification algorithm, based on the NDVI in some manner. A classification solely based on the NDVI cannot obtain a land use classification if a single scene is used, as only the vegetation activity can be assessed not the type of vegetation.
The focus of the ESIA was clearly on soil potential regarding the altered land use after the construction of the canal. Questions about valuable ecosystems and agriculture are somewhat ignored within that perspective.
In the ESIA a total of ca. 16,400 ha of extensive agriculture, including grassland in the western part of the canal zone are calculated; 8616 ha are assigned as crops in the form of intensive agriculture. “Open and closed mixed leaved forest” and “dense urban areas” comprise 744.2 ha and 0.5 ha, respectively. A remarkable difference in assigned forest area is noticeable. In this study, several unsupervised classifications were run, with the chosen bands differing in the number of originally-used classes and boundary conditions of the algorithm as each pixel of the dataset represents a variety of surface reflections. All classifications showed similar patterns and resulted in no less than 10% (~2900 ha) forest and dense natural vegetation.
To validate the results a comparison with a multi-temporal, multispectral land use analysis provided by the former GTZ was performed [35]. The study accounts for approx. 1% of mangrove forest, 8% of broadleaf forest, and 20% of thicket in the canal zone. This corresponds to our results. The mangrove forest equals an area of 290 ha compared to 103 ha in the ESIA (Table 5.9-3; [3]).
One major concern with the results of land use classification in this study is the date of the utilized satellite picture, which is January 27, 2000. It is reasonable to expect that land use changes, especially deforestation, took place since then, which might explain the large discrepancies of this study with the results of the ESIA. To account for this aspect and for the former validation of results, a comparison with global forest loss data [36] was conducted. The data of Hansen et al. [36] suggest a forest cover of approximately 7600 ha for the study area and a forest loss until the year 2016 of approximately 1200 ha. This further supports the estimated amount of forest area even when the effects of deforestation are considered.
Figure 6 shows the spectral signature of each designated class. The signature differences among the land use classes are generally rather small, yet clearly visible. The benefit of using the green band in addition to NDVI bands is obvious. Using the blue band has generally little effect due to high scattering in the atmosphere.
The presented classification provides us with a first approach in assessing the results presented by ERM, and allows us to develop a robust method for land use classification and to evaluate the affected usages in the canal zone. It establishes a baseline for further research. The quality of the classification suffices to identify problems in the conducted ESIA. It has become clear that the analysis of vulnerable ecosystems, such as the dry forest or mangrove forest, is yet to be assessed to clearly understand the impact of the proposed canal.

3.3. Socio-Economic Impacts

The rural settlements directly affected by the canal zone (Figure 7) had a total population of approximately 14,072 people in 2005 [24]. With an average population growth in Nicaragua between 2005 and 2017 of 1.2% per year, the population in 2017 is estimated to ascend to 16,462 people [23,24].
The calculation of the affected population in the ESIA is based on the independent Project’s Draft Resettlement Action Plan (RAP) within the area of influence. This draft is dated January 2015, but it is not publicly available. Tables 8.1–11 of the ESIA present settlements per canal segment being affected by the canal construction. However, neither this table nor any other includes the population number of each settlement or canal segment [3]. This hinders a precise comparison of the calculated population values per segment. Moreover, the ESIA does not present a quantitative analysis of all affected roads and only mentions seven main roads, which, according to their first construction plans, will be improved. The absence of a quantification of all affected roads within the canal zone again hinders the possibility of comparison.
ERM identifies in the ESIA 7210 households, i.e., 30,000 people, who will be temporarily or permanently affected by the canal construction. This value corresponds to the entire canal (including west and east canal segments) [3].
The resettlement of the people will result in cultural, economic, and political consequences, such as the loss of identity, private and family life, the disintegration of large families and other social relationships, that provide stability. The inhabitants will also lose their usual sources of income and will have to address unknown tasks. Additionally, the division of the entire department of Rivas and its municipalities will cause difficulties and changes in the political management of these administrative units.
The road network has a total length of approximately 175.8 km. Many of them are dry-season roads (56.2 km), eleven are all-season roads (97.1 km), and two are paved roads (22.5 km) with the Pan-American Highway being the economically most important road in this area, which will be at least temporarily interrupted by the canal (Figure 7).

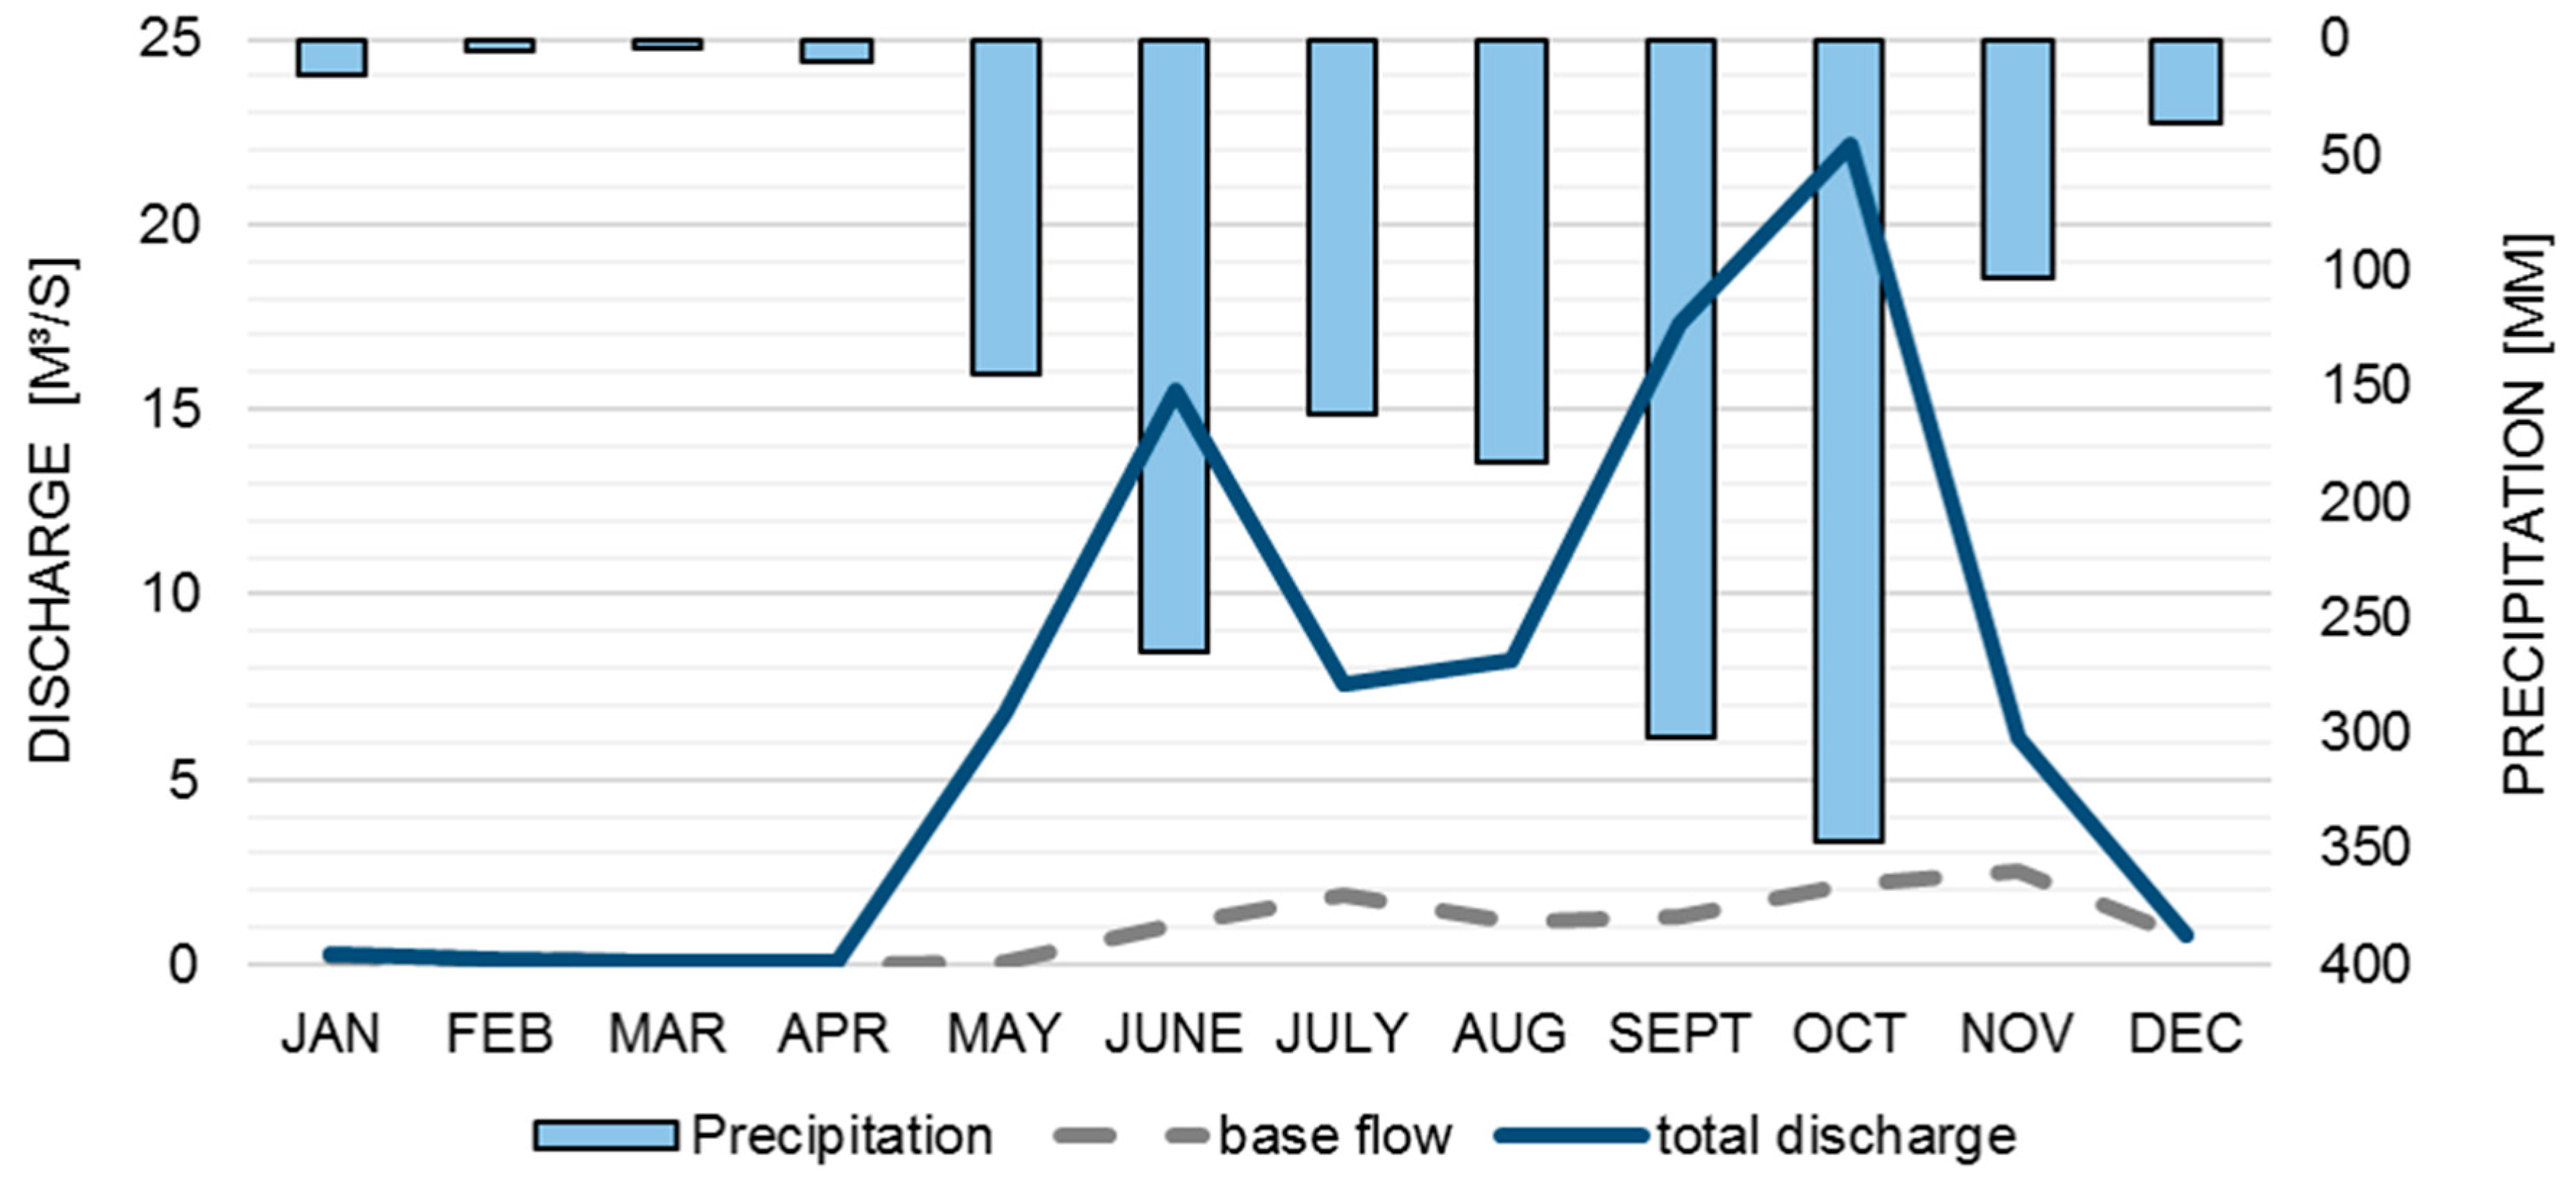
3.4. Hydrological Analysis

The hydrological analysis starts with the calculation of the catchment size of the Brito River (271.4 km2) with its discharge at the Pacific and the catchment of the Las Lajas River, which flows into Lake Nicaragua (106.8 km2) (Figure 4). Both catchments together have a total area of 378 km2. Additionally, the canal course with the artificial connection between the Brito River and the Las Lajas River with a length of 35.1 km was constructed.
ERM worked with topography (DEM) obtained from INETER (Managua, Nicaragua), as well as the hydrological model “Gridded Surface Subsurface Hydrologic Analysis” [3]. Origin, date, and resolution of this data is not documented.
The difference to the catchments areas calculated by ERM, as well as the canal course planned by HKND are small and, therefore, negligible (Table 1).

3.5. Discharge Determination

Applying the SCS method, a yearly average surface runoff from effective annual precipitation of 514.6 mm is calculated, which corresponds to 33% of the total precipitation from surface runoff. Romero Callo [30] analyzed the hydrological properties of the Gil Gonzalez catchment in the department of Rivas, working with data from 1970–2009 and calculated a mean runoff coefficient of 33% with a mean annual precipitation of 1051 mm. Consequently, these two independent studies support each other well.
Due to geological formations, the underground water storage capacity in the study area is low. Thus, the estimated amount of base flow (Qb) of 5% of the precipitation from the previous month appears reasonable. This results in a base flow of 78.8 mm per year. The discharges (Qtot,i) of the Brito and the Las Lajas Rivers are, respectively, 5.1 m3/s and 2.0 m3/s. Together they form a total runoff of 7.1 m3/s, which represents 38% of the total discharge from total precipitation (from surface runoff and base flow in the form of stored antecedent precipitation). Figure 8 shows the monthly precipitation and base flow, as well as the discharge of both catchments.
ERM obtained the discharge and precipitation data from INETER, the climatological data from the National Climatic Data Center of the National oceanic and Atmospheric Administration of the United States and the soil type data from MAGFOR. Only two representative years (wet and dry) were modeled with the hydrological model of ERM. The Brito catchment was modeled for the years 2011 (wet year) and 2006 (dry year), and the Las Lajas catchment for the years 2005 and 2006 ([3], Appendix RH-2). The hydrological model results, presented in the ESIA (wet year), are based on a similar long-term annual precipitation (1463 mm) and catchment discharges (4.6 m3/s and ca. 3 m3/s); the long-term effective annual precipitation, as well as the base flow, are not specified in the ESIA (Table 1).
The differences in results of this study from the ESIA could be explained, at least partially, by different data sources and resolutions. However, since data sources and resolutions used in the ESIA are not clearly stated, this is merely an assumption.

3.6. Water Availability for the Brito Locks

A water consumption of the Brito Locks for the year 2050 with seven filling-draining processes per day of approximately 91.2 m3/s was calculated. If there are indeed water savings of 60%, the water consumption could be reduced to 54.7 m3/s. Thus, the total water demand of the chambers will be nearly 36.5 m3/s (Table 1). Nevertheless, water losses from the gate, evaporation, and percolation are not considered in this calculation. Including these losses would lead to an even higher water demand.
The volume of water provided by Brito and Las Lajas catchments (7.1 m3/s) could only meet 20% of the water requirements of the Brito Locks (36.5 m3/s)—assuming discharge would be evenly distributed over the year.
The HKND Group states that the locks on the Pacific and Atlantic side of the canal will use most of the water from the artificial Lake Atlanta, which will accumulate the water from the catchment area of the Punta Gorda River. Lake Atlanta is planned on the Atlantic side of Nicaragua forming part of the East Canal [3]. However, it is unknown whether the Brito- and Las Lajas catchments will provide the water for the Brito Locks on the Pacific side or whether water from Lake Atlanta will be necessary.
Meeting the water requirements with excess water from the East Canal Segment is questioned. Among other major concerns regarding the ESIA, Covich et al. [19] criticize this part of the study severely because of its lack of long-term climate data for the monthly water budget and the lack of valid estimations concerning the Atlanta reservoir.

4. Conclusions

This article presents a transparently-documented and comprehensible impact assessment study of the West Canal Segment of the Nicaragua Canal. Based on publicly-available data and scientifically sound and recognized methods, land use, hydrological (water availability), and socio-economic impacts (streets, population) were described, quantified, and compared with official declarations in the ESIA. While some results support the official declarations, others do not. The examination of official declarations discloses significant ambiguities concerning the methodology and data used for the impact assessment. Therefore, the results presented in the ESIA are at least partly doubtful. For example, the water use of the Brito Lock was calculated much higher in this study. Moreover, our study reveals a lower proportion of total discharge from precipitation (effective rainfall) than stated in the ESIA. This leads to a lower discharge availability, which may become critical if future rainfall decreases and in dry years. The number of affected population in the West Canal Zone, given its small proportion of the total canal zone, is high, but in the absence of respective information in the ESIA it is not conclusively comparable. Hence, society and water availability could be affected much higher than estimated in the ESIA. With regard to land use, our results identified much larger areas of forest and less intensively used areas (urban/agriculture-intensive). This implies a potentially higher ecological impact as stated in the ESIA.
However, comparisons with official declarations were difficult because neither the data sources nor the methodology is well documented in official reports (ESIA). This study was realized in order to elaborate scientifically-based, transparent, understandable, and reproducible information on possible impacts of the construction of the Nicaragua Canal in order to initiate a public debate and scientific evaluation and to support decision-making.
Compared to the other canal segments, the West Canal has the largest amount of affected population, the highest density of traffic, and the highest (agro-)economic activity. Therefore, the social and economic impacts are probably the most important concern here, while in the other canal segments environmental impacts on pristine ecosystems, higher biodiversity, and on indigenous communities are more dominant. However, especially the Brito River Estuary and the remaining tropical dry-forest areas are unique and important ecosystems that need to be conserved.

Acknowledgments

We acknowledge support by the German Research Foundation and the Open Access Publishing Fund of Technische Universität Darmstadt. Further, we want to express our gratitude to Michael Kissel for valuable comments on the manuscript. Finally, we would like to thank the two anonymous reviewers for their valuable comments and suggestions to improve this publication.

Author Contributions

Jochen Hack wrote on Abstract, Introduction, and Conclusions; Jochen Hack contributed the Material and Methods summary, as well as the Results and Discussion section with regard to the study area; Angela Rebscher contributed the Material and Methods summary, as well as the Results and Discussion section with regard to the land use analysis in the canal zone; Angela Rebscher elaborated and designed the figures and tables and quantified the examples of the discrepancies in the ESIA; Andrea Muñoz Ardila contributed the Material and Methods summary, as well as the Results and Discussion section with regard to socio-economic impacts, hydrological analysis, discharge determination, and the water demand for the Brito Locks.

Conflicts of Interest

The authors declare no conflict of interest.

References

  1. Asamblea Nacional de Nicaragua; Asamblea Nacional. Ley No. 840. Ley Especial Para el Desarrollo de Infraestructura y Transporte Nicaragüense Atingente a El Canal, Zonas de Libre Comercio e Infraestructuras Asociadas; Asamblea Nacional de Nicaragua: Managua, Nicaragua, 2013. [Google Scholar]
  2. Álvarez, L. M&R: 71% Todavía apoya el Canal: Desde 2013 que fue Anunciado el Proyecto del Canal Interoceánico, el nivel de Aprobación ha Descendido. Available online: https://www.laprensa.com.ni/2017/04/24/politica/2218998-baja-aprobacion-al-proyecto-del-canal-interoceanico (accessed on 24 April 2017).
  3. Environmental Resources Management (ERM). Canal de Nicaragua: Environmental and Social Impact Assessment. Available online: http://hknd-group.com/upload/pdf/20150924/en/Volume%2014%20Appendices.pdf (accessed on 1 June 2015).
  4. Costantini, P. Why Doesn’t HKND Release the McKinsey Study? Available online: https://confidencial.com.ni/why-doesnt-hknd-release-the-mckinsey-study (accessed on 1 May 2017).
  5. Jensen, L. The End of the Nicaragua Canal? Available online: http://www.hellenicshippingnews.com/the-end-of-the-nicaragua-canal/ (accessed on 1 May 2017).
  6. Schmidt, B.; Mak, P.Y. China’s Unlucky Tycoon: The “Canal Madman” Keeps Finding Trouble. Available online: https://www.bloomberg.com/news/articles/2017-11-27/china-s-unlucky-tycoon-the-canal-madman-keeps-finding-trouble (accessed on 1 May 2017).
  7. El 19 Digital Realizan Acto de Inauguración de Obras del Gran Canal en Rivas. Available online: https://www.el19digital.com/articulos/ver/titulo:24728-realizan-acto-de-inauguracion-de-obras-del-gran-canal-en-rivas (accessed on 20 June 2017).
  8. Ministerio del Ambiente y los Recursos Naturales (MARENA). Biodiversidad Marino-Costera de Nicaragua (Potencialidades de los Ecosistemas); Embajada de Dinamarca: Managua, Nicaragua, 2011. [Google Scholar]
  9. Jordan, C.A.; Schank, C.J.; Urquhart, G.R.; Dans, A.J. Terrestrial Mammal Occupancy in the Context of Widespread Forest Loss and a Proposed Interoceanic Canal in Nicaragua’s Decreasingly Remote South Caribbean Region. PLoS ONE 2016, 11, e0151372. [Google Scholar] [CrossRef]
  10. Wultsch, C.; Caragiulo, A.; Dias-Freedman, I.; Quigley, H.; Rabinowitz, S.; Amato, G. Genetic Diversity and Population Structure of Mesoamerican Jaguars (Panthera onca): Implications for Conservation and Management. PLoS ONE 2016, 11, e0162377. [Google Scholar] [CrossRef] [PubMed]
  11. Conti, J.P. The New Grand Canal. Eng. Technol. 2014, 9, 68–71. [Google Scholar] [CrossRef]
  12. Huete-Perez, J.A.; Tundisi, J.G.; Alvarez, P.J.J. Will Nicaragua’s Interoceanic Canal Result in an Environmental Catastrophe for Central America? Environ. Sci. Technol. 2013, 47, 13217–13219. [Google Scholar] [CrossRef] [PubMed]
  13. Meyer, A.; Huete-Pérez, J.A. Conservation: Nicaragua Canal could wreak environmental ruin. Nature 2014, 506, 287–289. [Google Scholar] [CrossRef] [PubMed]
  14. Huete-Pérez, J.A.; Alvarez, P.J.J.; Schnoor, J.L.; Rittmann, B.E.; Clayton, A.; Acosta, M.L.; Bicudo, C.E.M.; Arroyo, M.T.K.; Brett, M.T.; Campos, V.M.; et al. Scientists Raise Alarms about Fast Tracking of Transoceanic Canal through Nicaragua. Environ. Sci. Technol. 2015, 49, 3989–3996. [Google Scholar] [CrossRef] [PubMed]
  15. Wünderlich, V. El nuevo proyecto del Gran Canal en Nicaragua: Más pesadilla que sueno. Encuentro 2014, 1, 24–35. [Google Scholar]
  16. Huete-Perez, J.A.; Meyer, A.; Alvarez, P.J. Rethink the Nicaragua Canal. Science 2015, 347, 355. [Google Scholar] [CrossRef] [PubMed]
  17. Condit, R. Extracting Environmental Benefits from a New Canal in Nicaragua: Lessons from Panama. PLoS Biol. 2015, 13, e1002208. [Google Scholar] [CrossRef] [PubMed]
  18. Yip, T.L.; Wong, M.C. The Nicaragua Canal: Scenarios of its future roles. J. Transp. Geogr. 2015, 43, 1–13. [Google Scholar] [CrossRef]
  19. Covich, A.P.; Crowl, T.; Stoa, R.; Briceno, H.; Brett, M.; Alvarez, P.; Aumem, N.; Chandra, S.; Heckadon-Moreno, S.; Henson, A. Summary Statement of Nicaragua Canal Environmental Impact Assessment Review Panel. Available online: http://www.circleofblue.org/wp-content/uploads/2015/06/Nicaragau-FIU-Panel-Summary.13-April-2015-Final.pdf (accessed on 10 March 2015).
  20. International Union for Conservation of Nature (IUCN). The IUCN Red List of Threatened Species 2017-3; IUCN: Cambridge, UK, 2017. [Google Scholar]
  21. Njoku, E.G. Encyclopedia of Remote Sensing; Encyclopedia of Earth Sciences Series; Springer: New York, NY, USA, 2014; ISBN 978-0-387-36698-2. [Google Scholar]
  22. Richards, J.A.; Jia, X. Remote Sensing Digital Image Analysis, 4th ed.; Springer: Berlin/Heidelberg, Germany, 2006; ISBN 3-540-25128-6. [Google Scholar]
  23. The World Bank World Population Growth (Annual %). Available online: http://data.worldbank.org/country/nicaragua (accessed on 24 June 2017).
  24. Instituto Nacional de Información de Desarrollo (INIDE). Caracterización Sociodemográfica del Departamento de Rivas; INIDE: Managua, Nicaragua, 2005. [Google Scholar]
  25. National Aeronautics and Space Administration Jet Propulsion Laboratory (NASA JPL). NASA Shuttle Radar Topography Mission Global 1 arc Second 2013; NASA: Washington, DC, USA, 2013.
  26. Farr, T.G.; Rosen, P.A.; Caro, E.; Crippen, R.; Duren, R.; Hensley, S.; Kobrick, M.; Paller, M.; Rodriguez, E.; Roth, L.; et al. The Shuttle Radar Topography Mission. Rev. Geophys. 2007, 45, RG2004. [Google Scholar] [CrossRef]
  27. World Clim Free Climate Data for Ecological Modeling and GIS: Global Climate Data. Available online: http://www.worldclim.org/ (accessed on 23 September 2015).
  28. Hijmans, R.J.; Cameron, S.E.; Parra, J.L.; Jones, P.G.; Jarvis, A. Very high resolution interpolated climate surfaces for global land areas. Int. J. Climatol. 2005, 25, 1965–1978. [Google Scholar] [CrossRef]
  29. United States Department of Agriculture. Urban Hydrology for Small Watersheds (TR 55); United States Department of Agriculture: Washington, DC, USA, 1986.
  30. Romero Callo, E. Investigation on the Applicability of the Soil Water Assessment Tool (SWAT) to Model Hydrological Ecosystem Services in the Gil Gonzales Catchment in Nicaragua; Technische Universität Darmstadt: Darmstadt, Germany, 2012. [Google Scholar]
  31. Hirth, T. Ausarbeitung Einer GIS-Basierten Methode zur Identifikation von Zielregionen fur ein Mobiles Kleinwasserkraftwerk; Technische Universitat Darmstadt: Darmstadt, Germany, 2015. [Google Scholar]
  32. Muñoz Ardila, A. Analyse Zukünftiger Landnutzungsänderungen im Südwesten Nicaraguas in Folge des Baus des Nicaraguakanals; Technische Universität Darmstadt: Darmstadt, Germany, 2015. [Google Scholar]
  33. Statistics and Models Administration Unit Panama Canal Traffic: Fiscal Years 2014 through 2016. Available online: http://www.pancanal.com/eng/op/transit-stats/2017/Table01.pdf (accessed on 6 February 2017).
  34. Planet. Planet Explorer Beta. Available online: https://www.planet.com/ (accessed on 6 February 2017).
  35. INTELSIG. Análisis Multitemporal Aplicando Imágenes Satélite Para la Cuantificaión de los Cambios de uso de la Tierra y Cobertura en Bosawas-RAAN y en los Departamentos de Rivas, Carazo Y Granada; INTELSIG: Managua, Nicaragua, 2008. [Google Scholar]
  36. Hansen, M.C.; Potapov, P.V.; Moore, R.; Hancher, M.; Turubanova, S.A.; Tyukavina, A.; Thau, D.; Stehman, S.V.; Goetz, S.J.; Loveland, T.R.; et al. High-Resolution Global Maps of 21st-Century Forest Cover Change. Science 2013, 342, 850–853. [Google Scholar] [CrossRef] [PubMed]
Figure 1. Overview of interoceanic canals of the Americas.
Environments 05 00014 g001
Figure 2. Overview of the planned Nicaragua Canal.
Environments 05 00014 g002
Figure 3. West Canal Segment of the planned Nicaragua Canal (blue line) and the canal zone (dashed line) representing the study area.
Environments 05 00014 g003
Figure 4. Representation of the river catchments and the stream network supplying the canal.
Environments 05 00014 g004
Figure 5. Results of land use classification (left), results of land use classification in the West Canal Segment Zone with an RGB image for areas outside of the canal zone (Landsat 7-Data) (right).
Environments 05 00014 g005
Figure 6. Average reflection of each land use class and wavelength.
Environments 05 00014 g006
Figure 7. Affected communities and roads due to the canal construction [24].
Environments 05 00014 g007
Figure 8. Long-term average monthly precipitation (Pmean; WorldClim), base flow (Qb), and total discharge (Qtot) of Brito and Las Lajas catchments.
Environments 05 00014 g008
Table 1. Analysis of results in comparison with published results from the Environmental and Social Impact Assessment (ESIA).
Own StudyESIA [3]% Difference ΔReference Chapter ESIA [3]
Land use
Total area of Canal Zone290.9 km2262.8 km210.7%5.3.4.3
Forest61.1 km27.4 km2726.7%5.3.4.3
Near nature/Agriculture extensive180.3 km2165.9 km28.7%5.3.4.3
Urban/Agriculture intensive49.5 km289.1 km24.4%5.3.4.3
Population16,462Not specified-8.1.2.3 (Affected population not specified for the West Canal Segment, only an estimation of 30,000 people for the entire Canal and Canal Zone)
Hydrological Analysis
Brito catchment area271.4 km2268.2 km21.0%App. RH-2—4.1.1
Las Lajas catchment area106.8 km298.3 km28.6%App. RH-2—4.2.1
Total catchment area378.2 km2366.5 km23.2%App. RH-2—4.1 + 4.2
Long-term annual Precipitation1576 mm1463 mm7.7%App. RH-2—3.1 (Weighted Average for total catchment area from values given in the referenced Appendix)
Long-term effective annual precipitation515 mmNot specified--
Base flow q b 79 mmNot specified--
Brito River discharge5.1 m3/s4.6 m3/s10.9%5.7.9.1 (Extrapolated from measured discharge given in Table 5.7-23 (ESIA) at gauge Rio Brito)
Las Lajas River discharge2.0 m3/s~3 m3/s−33.3%App. RH-2—4.2.1 (Average from discharge wet year and discharge dry year in the referenced Appendix)
Total discharge Q t o t 7.1 m3/s~7.6 m3/s−6.6%-
Proportion of total discharge from total precipitation38%45%−15.5%-
Brito Locks (2050)
Water demand Qlocks36.5 m3/s27.7 m3/s31.8%App. RH-12—6
-: No difference calculated; App. RH: Appendix of the ESIA [3].

