Article

Land Use/Land Cover (LULC) Using Landsat Data Series (MSS, TM, ETM+ and OLI) in Azrou Forest, in the Central Middle Atlas of Morocco

1
Soil and Environnement Microbiology Team, Department of Biology, Faculty of Sciences, Moulay Ismail University, BP11201, Zitoune, Meknès 50000, Morocco
2
Water Sciences and Environnement Engineering Team, Department of Geology, Faculty of Sciences, Moulay Ismail University, BP11201, Zitoune, Meknès 50000, Morocco
3
Department of Mathematics and Computer Science, Physical Sciences and Earth Sciences, University of Messina, 98122 Messina, Italy
4
Earth Sciences Institute (ICT) and Department of Geosciences, Environment and Land Planning, Faculty of Sciences, University of Porto, 4169-007 Porto, Portugal
*
Author to whom correspondence should be addressed.
Submission received: 17 October 2018 / Revised: 29 November 2018 / Accepted: 3 December 2018 / Published: 5 December 2018
(This article belongs to the Special Issue Application of Remote Sensing and GIS in Environmental Studies)

Abstract

:
The study of land use/land cover (LULC) has become an increasingly important stage in the development of forest ecosystems strategies. Hence, the main goal of this study was to describe the vegetation change of Azrou Forest in the Middle Atlas, Morocco, between 1987 and 2017. To achieve this, a set of Landsat images, including one Multispectral Scanner (MSS) scene from 1987; one Enhanced Thematic Mapper Plus (ETM+) scene from 2000; two Thematic Mapper (TM) scenes from 1995 and 2011; and one Landsat 8 Operational Land Imager (OLI) scene from 2017; were acquired and processed. Ground-based survey data and the normalized difference vegetation index (NDVI) were used to identify and to improve the discrimination between LULC categories. Then, the maximum likelihood (ML) classification method was applied was applied, in order to produce land cover maps for each year. Three classes were considered by the classification of NDVI value: low-density vegetation; moderate-density vegetation, and high-density vegetation. Our study achieved classification accuracies of 66.8% (1987), 99.9% (1995), 99.8% (2000), 99.9% (2011), and 99.9% (2017). The results from the Landsat-based image analysis show that the area of low-density vegetation was decreased from 27.4% to 2.1% over the past 30 years. While, in 2017, the class of high-density vegetation was increased to 64.6% of the total area of study area. The results of this study show that the total forest cover remained stable. The present study highlights the importance of the image classification algorithms combined with NDVI index for better understanding the changes that have occurred in this forest. Therefore, the findings of this study could assist planners and decision-makers to guide, in a good manner, the sustainable land development of areas with similar backgrounds.

1. Introduction

Land use/land cover (LULC) changes are among the most important applications of Earth Observation (EO) satellite sensor data [1,2,3]. It provides a comprehensive and good understanding of ecosystem monitoring and functioning, and responses to environmental factors [4,5,6,7,8,9,10]. Remote sensing techniques have been recognized as a powerful means to obtain information on Earth’s surface features [11] at different spatial and temporal scales [12].
Since the beginning of the 1970s, scientists have used various types of remote sensing data, acquired by the Landsat series of satellites, in the identification of LULC changes [13,14,15,16,17]. More recently, several researchers have concentrated on evaluating the potential of satellites data on land use classification, monitoring the land use or quantifying and analyzing land use changes [10].
Yuan et al. [18] used multitemporal Landsat TM data to map and monitor land cover change in the seven-county Twin Cities Metropolitan Area of Minnesota for 1986, 1991, 1998, and 2002. The study showed an increase of urban land from 23.7% to 32.8% of the total area between 1986 and 2002, while rural cover types of agriculture, forest, and wetland decreased from 69.6% to 60.5%. Demissie et al. [19] used Landsat data from 1973 to 2015 to assess LULC changes and their causes in Libokemkem District of South Gonder, Ethiopia. Their study showed that about 60.1% of the land experienced changes in LULC in 42 years.
In Morocco, several works have used various types of remote sensing data on LULC analysis. Barakat et al. [20] have used ASTER (Advanced Spaceborne Thermal Emission and Reflection Radiometer) and Sentinel-2A MSI images acquired in 2001 and 2015, respectively, for quantifying the changes in the Eastern area of Béni-Mellal province, based on the supervised classification algorithm and the normalized difference vegetation index (NDVI). The study showed that changes in land use have resulted in the increase of forest area. De Waroux et al. [21] estimated forest changes in argan woodlands (Morocco) using aerial photographs and satellite images between 1970 and 2007. They found that forest density decreased by 44.5% during the period of study. Hammi et al. [22] studied land cover changes in Aït Bouguemez Valley located in the middle of the Central High Atlas Mountains (Morocco) in the Azilal province, using aerial photographs dated from 1964 and Spot 5 satellite image from 2002. They found that, in the past 38 years, forest ecosystems have been affected by a relative decrease of 20.7% of the total forest area, and 8.7% for the mean canopy cover.
Several methods have been used for analyzing LULC, such as conventional image differencing, multidate image classification, image differencing rationing, vegetation index differencing, principal components analysis, and change vector analysis [23]. For more details, see review papers from Lu et al. [24] and Coppin et al. [25].
The forest ecosystem in the Middle Atlas of Morocco has attracted the attention of several researchers (e.g., [26,27,28,29]), because of the enormous value it provides for the local population in their everyday needs (wood, timber, food, etc.), as well as for local authorities and urban communities. Despite those values, this ecosystem experienced major degradation on its biodiversity (fauna and flora) caused by both natural processes as well as human activities. This requires a depth of knowledge of ecosystem services provided by this forest ecosystem, as well as knowing the interaction between human and natural phenomena, to better manage and use resources in a good way. This is the role of the National Forest Inventories. However, they are costly and time-consuming [30].
Among other forests in Morocco, the Azrou forest has been gaining popularity as a tourist attraction, due to its rich biodiversity and ecosystem values. It is dominated by the Atlas cedar (Cedrus atlantica) known as a noble tree species [31], representing an important resource that underpins the progress of socioeconomic development and benefits to the local population and the country, in general. However, the study area is subjected to several environmental disequilibria, including soil erosion, overgrazing, cutting of trees, etc. Along with these, the cedar forest is altered and affected by an advanced stage of degradation, according to [32]. For these reasons, the Azrou forest was selected for this research to create up-to-date LULC maps, which could be used as scientific data for efficient decision-making in the forest ecosystem.
Keeping all the above reasons in view, we have integrated remote sensing data, Geographic Information System (GIS) analysis, and field surveys, in order to evaluate the potential of Landsat imagery to monitor spatiotemporal changes in land cover in the Azrou forest. Thus, to obtain the different land use classes, the NDVI was used to identify and to improve discrimination between LULC categories throughout the study area. Then, the maximum likelihood classification (MLC) supervised classification method was applied in this study because of its availability, and it does not require an extended training process [33,34].
The advantage of MLC method as a parametric classifier is that it takes into account the variance–covariance within the class distributions and, for normally distributed data, the MLC performs better than the other known parametric classifies (e.g., decision trees) [35]. The results were validated with control points (ground truth).
The novelty of our study relies on the methodology proposed for the update of LULC information. Mapping and monitoring LULC, and their changes, is of critical and valuable importance for sustainable development and for monitoring environment change. Overall, the findings of this study could assist planners and decision-makers to guide, in a good manner, the sustainable land development of areas with similar backgrounds.

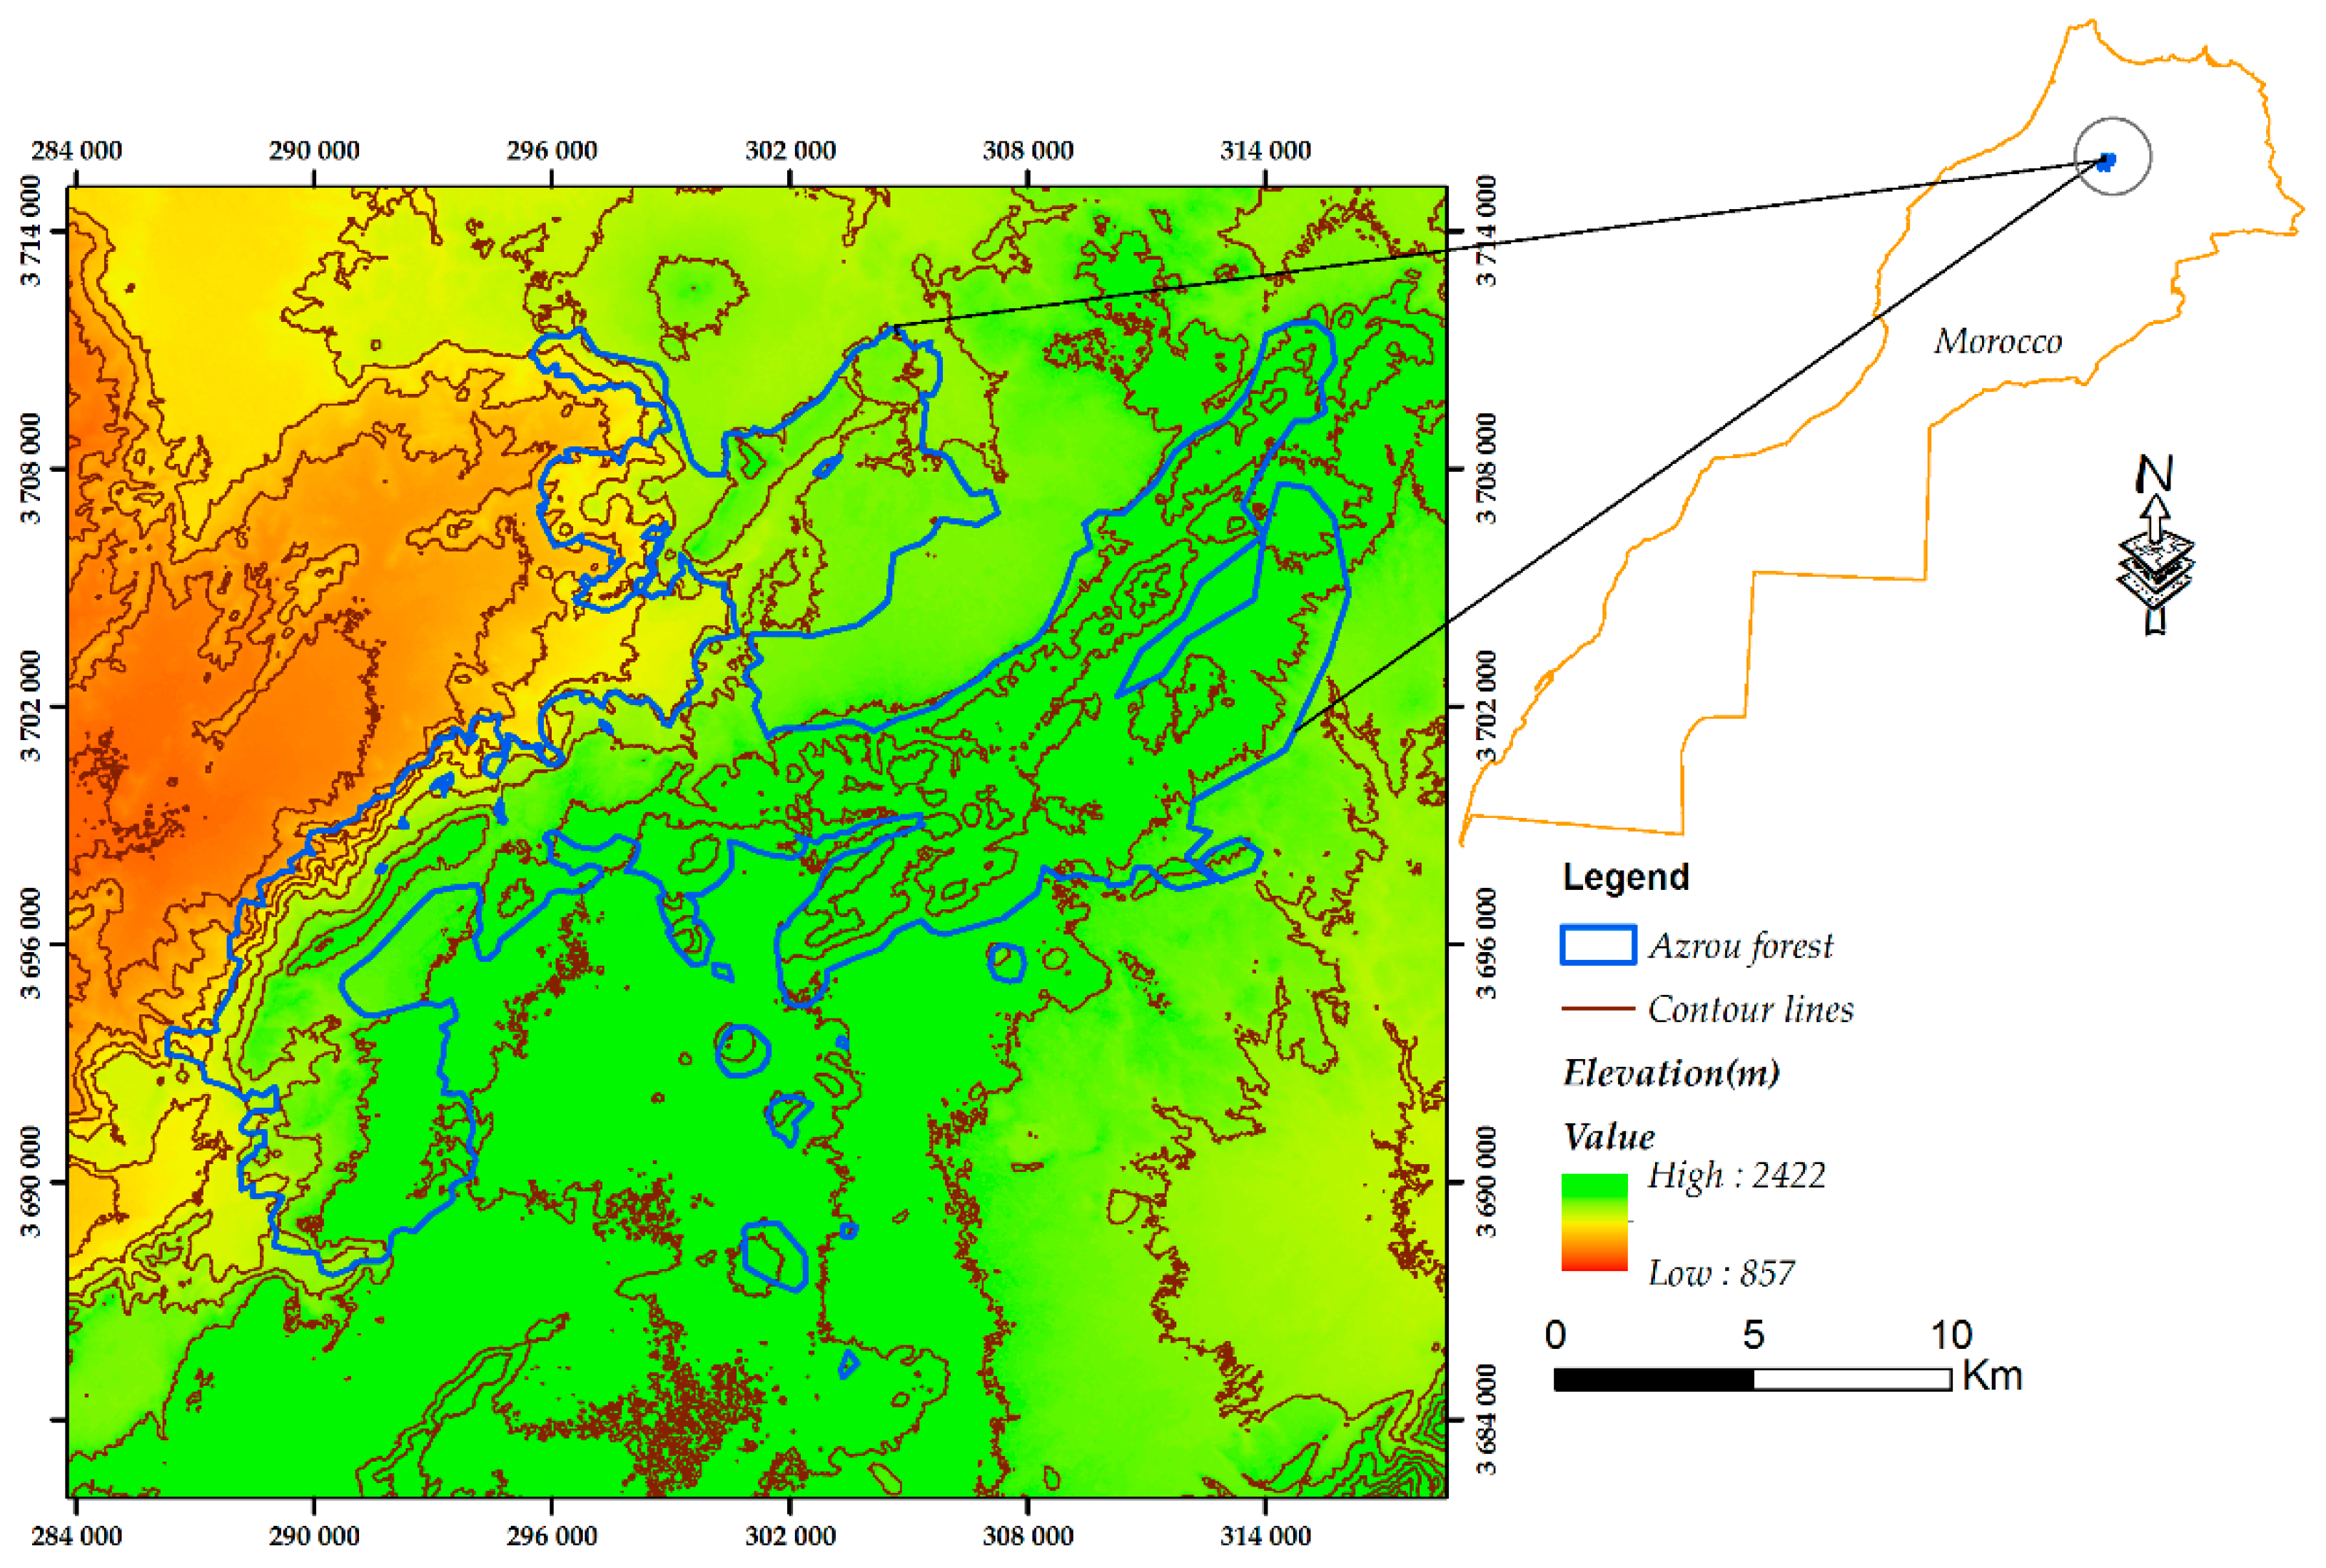
2. Materials and Methods
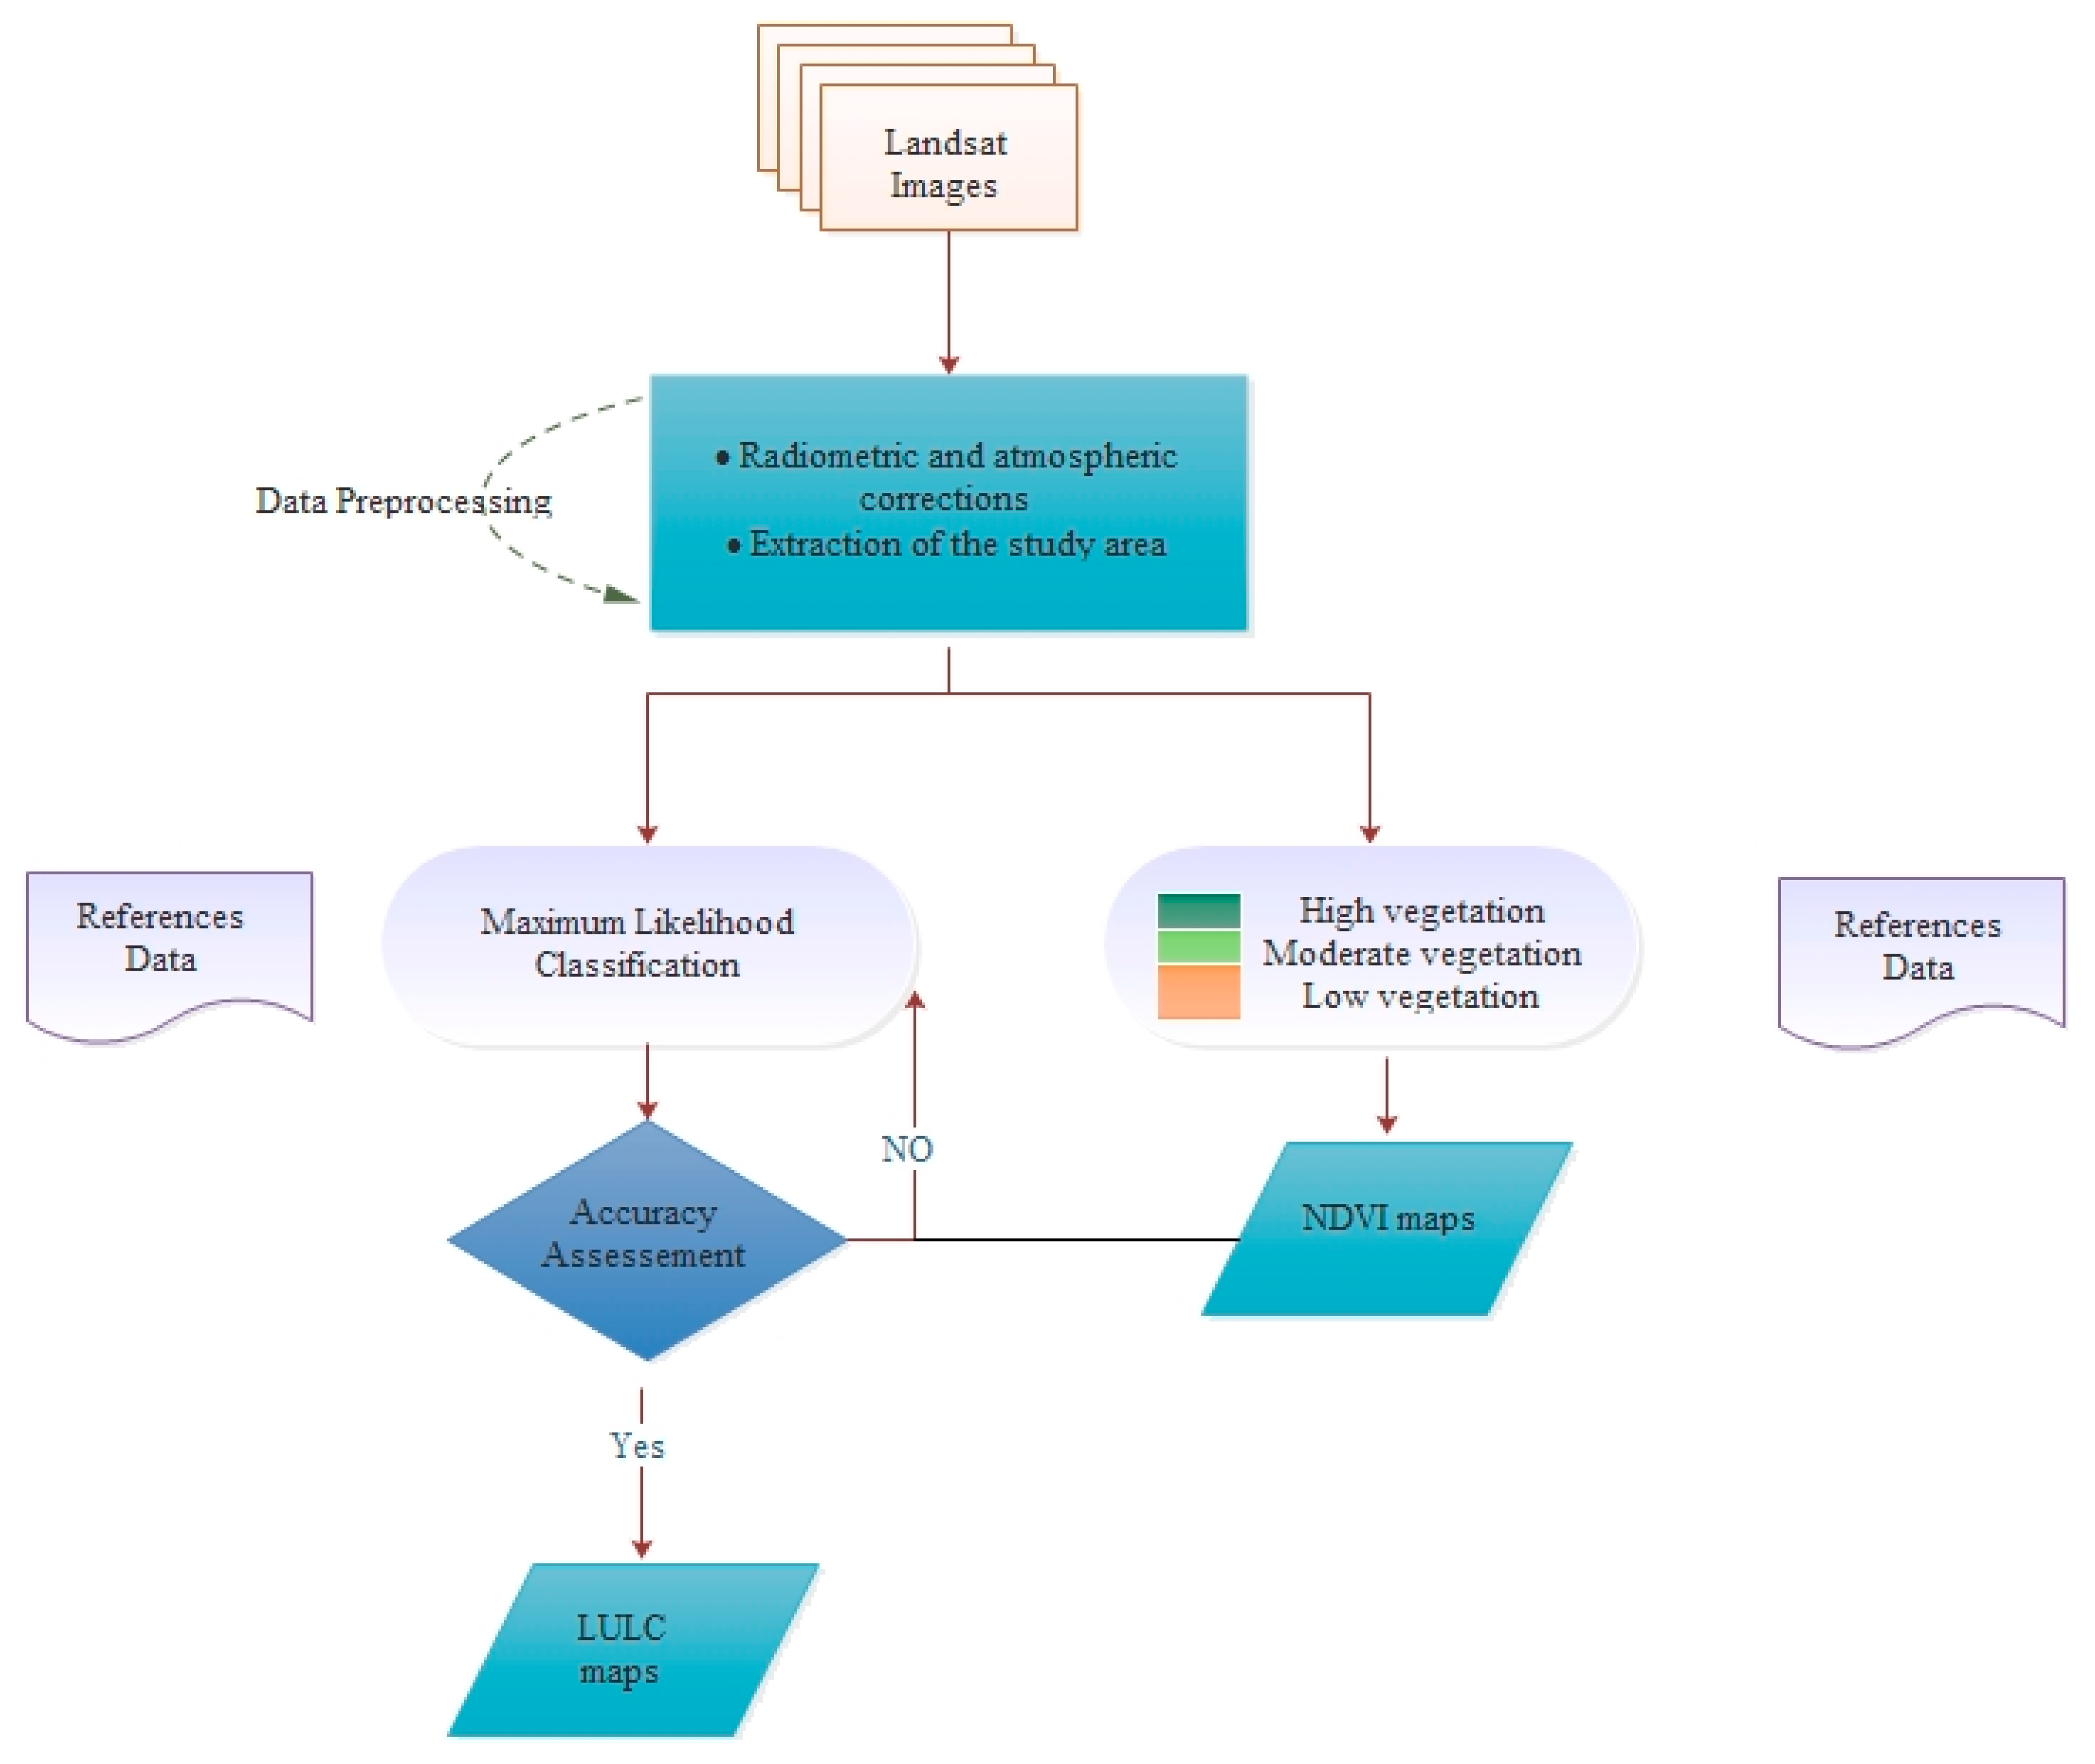
The study area is the Azrou forest; it covers 24,588 ha in the Middle Atlas of Morocco (Figure 1). The vegetation consists of evergreen cedar (Cedrus atlantica)—pure stands or mixed with evergreen stands of holm oak (Quercus ilex L., and/or with Quercus canariensis). The soils in the study area are formed by limestone, dolomite, and basalt [36]. The climate of the region is Mediterranean, with a dry season from May to October, and a rainy season is from November to April. Ifrane Meteorological Station documents average annual rainfall from 563 mm to 1122 mm, and the maximum temperature of 30.3 °C. At Tagounit Meteorological Station, the maximum temperature reached 43 °C [36]. The study area is characterized by an altitude changing from 856 to 2422 m, where the cedar forests are located in an altitude higher than 1600 m, and the holm oak in an altitude ranging between 1200 and 1600 m. Despite the diversity of services ecosystems of Azrou forest, the Atlas cedar decline symptoms go back to the 1940s, when scenarios of severe drought have been caused a mortality of this species [26,32,37]. According to [26], an estimated 23% of the Atlas forest surface area (3400 of 15,000 hectares) showed some decline symptoms after the 1999–2000 drought events.

3. Methodology

3.1. Data Source and Pre-Processing

The Landsat satellite images (path 201; raw 037) include Multispectral Scanner (MSS), Enhanced Thematic Mapper Plus (ETM+), Thematic Mapper (TM), and Operational Land Imager (OLI). All images were geometrically corrected and acquired in level 1T (L1T). They were acquired free of charge from the United States Geological Survey (USGS) website [38]. Table 1 shows the Landsat scenes used in the study. To properly compare the NDVI differences, all the images were acquired between July and September, as this is the time of year where different kinds of vegetation are all at a stable stage. In addition, the time gap between all the satellite images was more than 16 days, because of cloudiness or technically damaged scenes. Two criteria were followed to choose the satellites images in this study, according to [39]: (1) the satellite images must have less than 10% cloud coverage (if possible, cloud free); (2) the images satellite series should be available for a long time series.
The image processing chain was performed using the open source Quantum GIS (QGIS) software (Version QGIS 3.0.0) [40]. Atmospheric correction was applied through the Semi-Automatic Classification Plugin [41] based on the Dark Object Subtraction (DOS) algorithm [42]. Google Earth images and field data based on map forest stand [28,35] were used to validate the proposed methodology. Field work was carried out using ground control points (GPSs) for ground truth surveys. In addition, baseline data were obtained from a published map of forest stand of the study area, and a previous knowledge and a deep discussion with local expert and stakeholders to recognize the LCLU classes. A flowchart with the methodology followed in this study is presented in Figure 2.
For all images data, the calibration was achieved by converting raw digital numbers (DN) into at-sensor spectral radiance [43,44], through Equation (1):
L λ = ( L λ m a x L λ m i n ) / ( Q C A L λ m a x Q C A L λ m i n ) × ( DN Q C A L λ m i n ) + L λ m i n
where L λ     is the spectral radiance at the sensor’s aperture in mW/(cm2·sr·μm); DN is the digital number of the quantized calibrated pixel value; L λ m a x     is the maximum spectral radiance that is scaled to   Q C A L λ m a x ; L λ min   is the minimum spectral radiance that is scaled to   Q C A L λ m i n ; Q C A L λ m a x is the maximum quantized calibrated pixel value in DN (corresponding to   L λ m a x ); and Q C A L λ m i n   is the minimum quantized calibrated pixel value in DN (corresponding to L λ m i n ). After this conversion, the radiance is converted into top-of-atmosphere (TOA) reflectance using Equation (2):
ρ =   π L d 2 E S u n λ c os θ

3.2. NDVI Classification

Based on the values of NDVI and in the interpretation of Google Earth images to identify and to quantify the vegetation change during the analysis period (1987–2017), we applied an NDVI thresholding [45,46] to classify NDVI into three classes: (1) NDVI values below to 0.2 were considered as low-density vegetation (2) NDVI values between 0.2 and 0.5 were considered as moderate-density vegetation and (3) NDVI values higher than 0.5 were considered as high-density vegetation. This classification depends on the soil type and, in this case, is based on the knowledge of the study area characteristics.
NDVI, proposed by Rouse Jr. et al. [47], is a widely used vegetation index and provides information on the amount and vigor of vegetation considering the near infrared (NIR) and visible red bands of the electromagnetic spectrum [33,48], calculated through Equation (3):
NDVI = ( NIR RED ) / ( NIR + RED ) ,
where NIR represents the near-infrared reflectance, and RED represents the reflectance in the red band. NIR and RED are the reflectance radiated in the near-infrared band 7 (0.8–1.1 µm) and the visible red 5 (0.6–0.7 µm) wave band of the satellite MSS Landsat 5, respectively.
For TM and ETM+ sensors, the NIR band is band 4, and the RED band is band 3. Finally, for the OLI sensor, the NIR and RED bands are band 5 (0.85–0.88 µm) and band 4 (0.64–0.67 µm), respectively. The NDVI value ranges from −1 to 1. The highest value represents healthy vegetation, while the lowest NDVI value indicates non-vegetative cover.

3.3. Maximum Likelihood Classifier

The maximum likelihood (ML) classifier (supervised classification) has been widely used [33,34,49] because of its availability, and its does not require an extended training process [33,34].
The ML classifier is based on the probability that a pixel belongs to a particular class [35]. Detailed explanations can be found in the literature [50,51,52,53,54]
The algorithm for computing the weighted distance, or likelihood D of unknown measurement vector X, belongs to one of the known classes, Mc, that is based on the Bayesian Equation (4) [35]:
D = ln ( a c ) [ 0.5 ln ( | C o v c | ) ] [ 0.5 ( X M c ) T ( C o v c   1 ) ( X M c ) ] ,
where D is the weighted distance (likelihood); c is a particular class; X is the measurement vector of the candidate pixel; M c   is the mean vector of the sample of class c; a c is the percent probability that any candidate pixel is a member of class c (defaults to 1.0, or is entered from a priori knowledge);   C o v c   is the covariance matrix of the pixels in the sample of class c; | C o v c |   is the determinant of Covc (matrix algebra); C o v c 1 is the inverse of Covc (matrix algebra) ln = natural logarithm function; and T is the transposition function (matrix algebra).
In this study, ML classifier was used for the classification of the Landsat images. Based on field data and high-resolution imagery from Google Earth as a reference data, three LULC (Table 2) categories were identified: (1) cedar forest; (2) holm oak; and (3) bare soil. In the case of the MSS image, the training and validation data were generated from the visual interpretation of Google Earth images, from 1987, of the study area, since no field surveys were available for this period. The reference data samples were used to create ROI (region of interest) polygons in ENVI 5.0 software on the Landsat data, for the generation of the training areas.
Considering the training dataset, the number of pixels per each class cover selected in this study area is shown in Table 2.
To evaluate the class separability of the training areas, the Jeffries–Matusita (JM) distance [51] was computed. The Jeffries–Matusita (JM) distance is the average distance between two class density functions [55,56,57], and it is calculated through Equations (5) and (6):
J M ( i , j ) = 2 ( 1 e a ) ,
a = 1 8 ( m i m j ) T ( 2 ( C j C i ) ) ( m i m j ) + 1 2   ln | ( C j C i ) / 2 | | C i | · | C j | ,
where i and j are the two classes being compared, m i and m j is the mean vector of class i and j, respectively, and C i and C j is the covariance matrix of the feature response of class i and j, respectively. The value of 2 suggest complete separability.
Analyzing the pairs’ separability between classes, it is possible to conclude that the ROIs selected in this study present good separability, as shown on Table 3 (most of the values are higher than 1.9). The only case that not fulfil the good separability requirements is the MSS image (1987) for the ROI pair cedar forest/holm oak. This fact could be justified by the low spatial resolution of the MSS image and lower classification accuracy.

3.4. Accuracy Assessment

The accuracy assessment is an important step for evaluation of the result of the classification process [58,59], as the user of land-cover output needs to know how accurate the result is, in order to use the data correctly [60,61,62]. In this work, we consider that the minimum level of interpretation accuracy in the identification of land use and LULC categories from remote sensing data should be at least 85%, as recommended by different authors [52,63,64]. A confusion matrix (or error matrix) [65], is a square array of numbers set out in rows and columns, which expresses the number of sample units (i.e., pixels, clusters of pixels, or polygons) assigned to a particular category relative to the actual category, as verified on the ground. An error matrix is widely used for classification accuracy [58,60,64,65], to derive a series of descriptive and analytical statistics [60,64]. Several studies have explained, in detail, the meanings and calculation methods for overall accuracy (OA), producer’s accuracy (PA), user’s accuracy (UA), and kappa coefficient [58,60,63,64,65].

4. Results and Discussion

4.1. Results

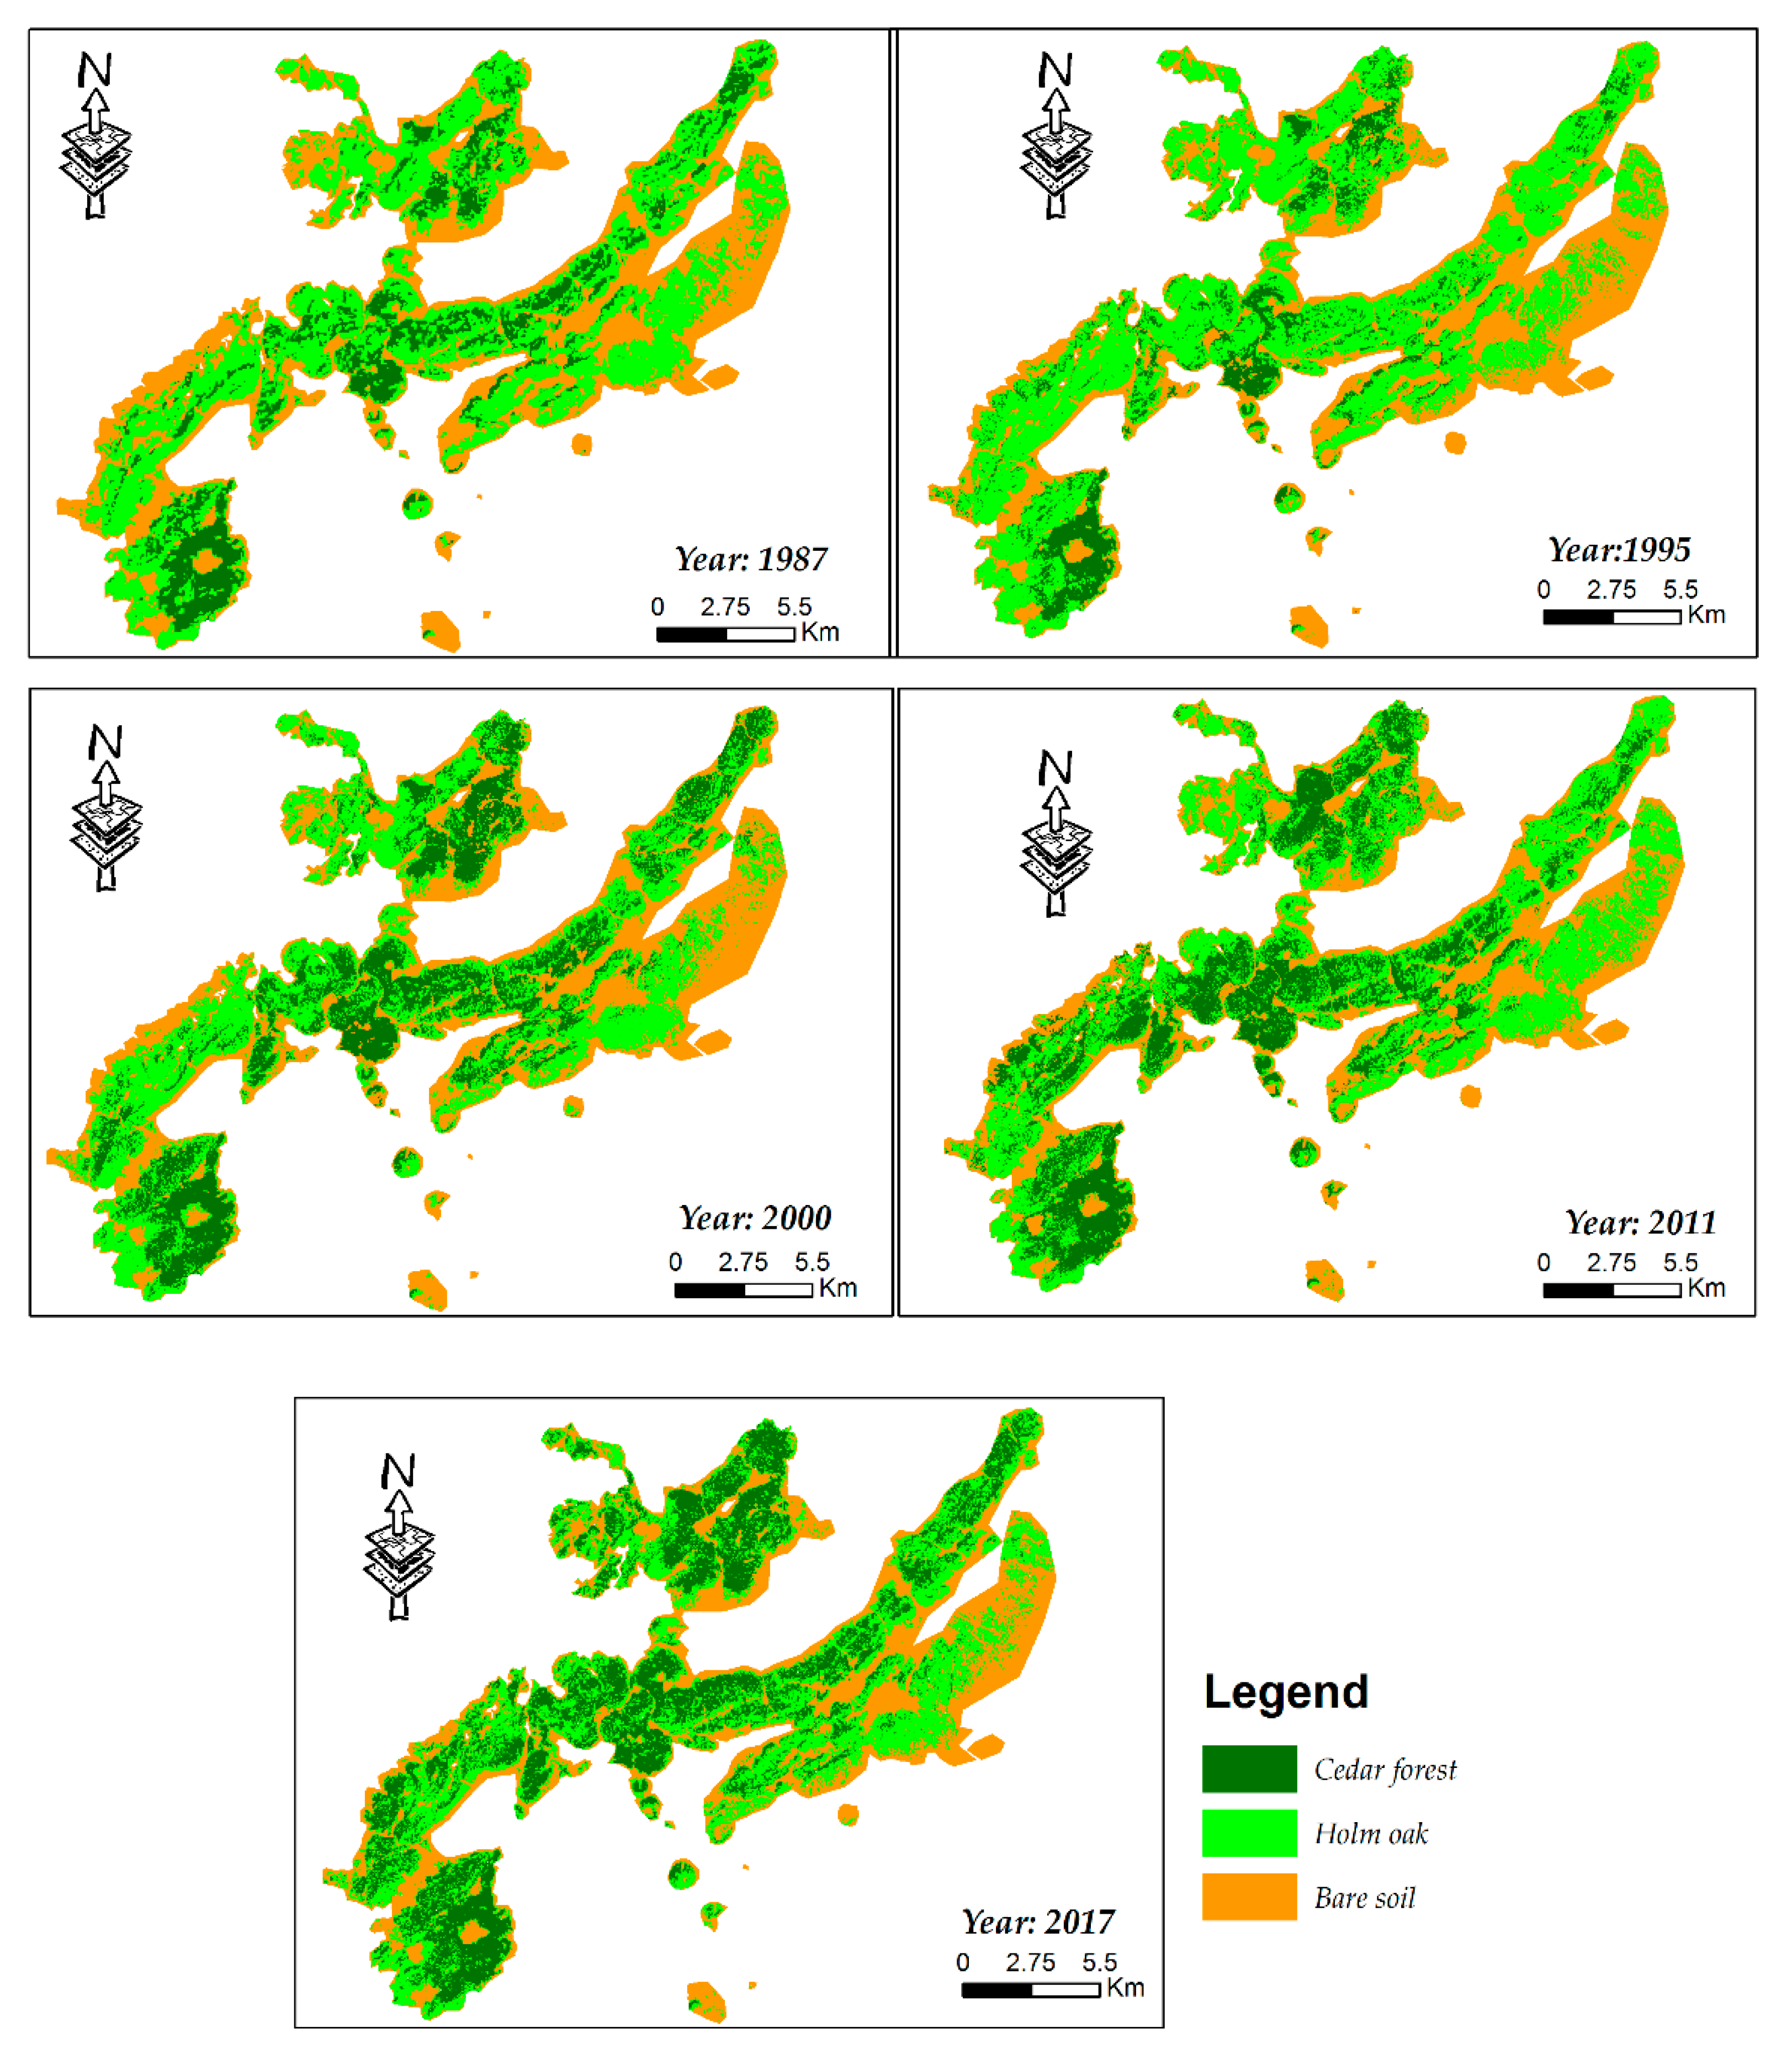
4.1.1. Land Uses/Land Cover Changes Monitoring

LULC changes were estimated from 1987 to 2017 (Table 4). Holm oak was the dominant land class in 2017, with 37.1% of the occupancy. Cedar forest class changed slightly from 1987 to 2017. Bare soil decreased from 45.5% to 32.4% (Table 4). Classified maps, showing the LULC categories in Azrou forest, are shown in Figure 3.

4.1.2. Accuracy Assessment

The classification accuracy was evaluated through the confusion matrix. The classified images showed an OA of 66.8%, 99.9%, 99.8%, 99.9%, and 99.9% in 1987, 1995, 2000, 2011, and 2017 images, respectively, with a kappa statistic of 0.413, 0.974, 0.995, 0.998, and 0.999, respectively (Table 5). User’s and producer’s accuracies of individual classes for each year of the land cover map are presented in Table 5, and indicate that all classes, with the exception of holm oak, have user’s and producer’s accuracies higher than 80%.

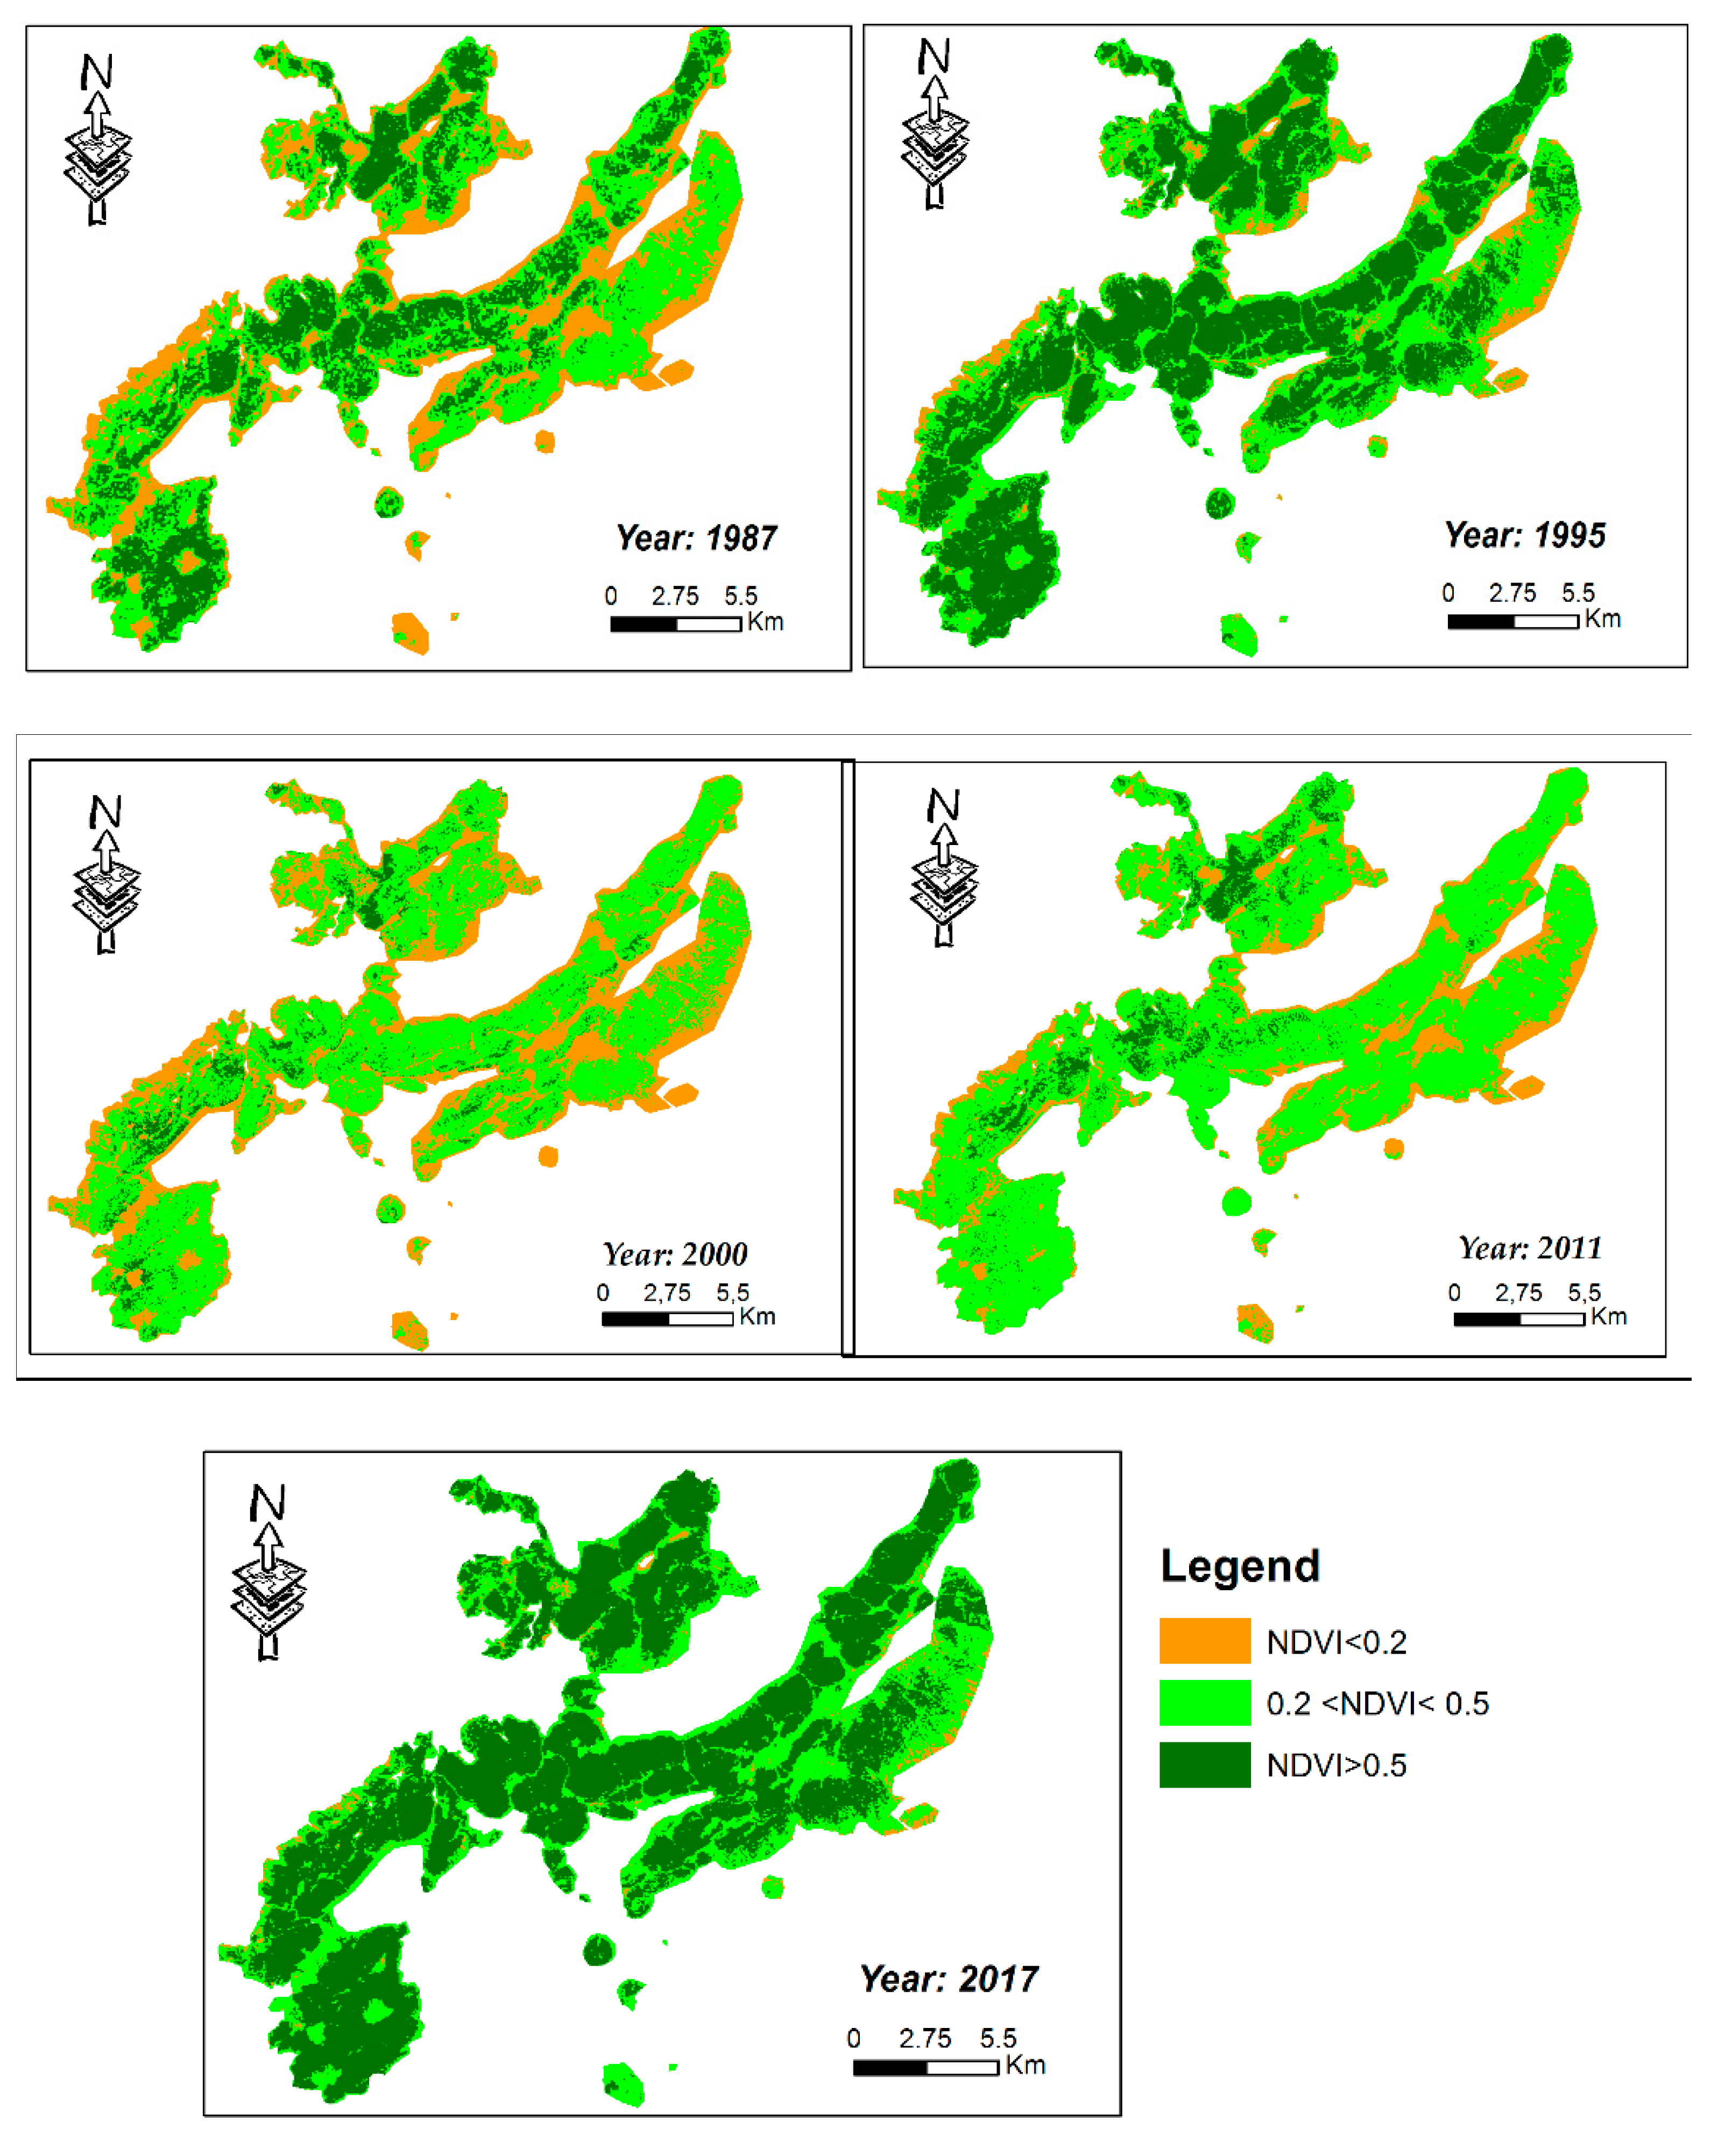
4.1.3. NDVI Land Cover

The results presented in Figure 4 and Table 6 reveal that the class of moderate-density vegetation was the dominant NDVI land cover class. It covers approximately 43.8% of the region in 1987. However, it declined to 33.2% in 2017. Low-density vegetation occupied the smallest portion of the region, and is was predominantly situated on the boundaries of the study area (Figure 4). The area of high-density vegetation class increased from 28.7% in 1987, to 64.6% in 2017.

4.2. Discussion

The classification method that was employed in this study was very effective in improving LULC classification accuracy.
As expected, and as had been discussed in several works [66,67,68], for MSS classification results, cedar forest and holm oak did not show a better separability among the LULC types, resulting in lower classification accuracy.
Similarly, Pang et al. [69], who studied deforestation and resulting land use change patterns by analysis of Landsat satellite images from 1979 (MSS), 1992 (TM), 2001 (ETM+), and 2006 (TM) in Suan County, Hwanghae Province, Democratic People’s Republic of Korea (DPR Korea), found that the 1979 Landsat MSS image was more difficult to classify than the other Landsat images. They explain that this is mainly due to the comparative lower spectral resolution of the sensor.
Ozesmi and Bauer [70] have confirmed that the MLC leads to higher accuracy than the decision trees (DT) classifier.
Moreover, our findings can be explained by a reinforced observation by Lu et al. [71] that the traditional approach to classification (such as ML) only distinguishes clearly between forest and non-forest land use and land covers.
Previous studies have successfully been carried out using remote sensing geospatial tools in a related study at the same profile area. For example, Barakat et al. [20] have used ASTER (Advanced Spaceborne Thermal Emission and Reflection Radiometer) and Sentinel-2A MSI images, acquired in 2001 and 2015 respectively, for quantifying the changes in the Eastern area of Béni-Mellal province based on the supervised classification algorithm and the normalized difference vegetation index (NDVI). The study showed that changes in land use have resulted in the increase of forest area. Haboudane and Bahri [72] have used multidate satellite images (Thematic Mapper (TM), Enhanced Thematic Mapper Plus (ETM+), and Advanced Spaceborne Thermal Emission and Reflection Radiometer (ASTER)) using maximum likelihood classification (MLC and spectral mixture analysis (SMA) for mapping major forest species in the Moroccan Middle Atlas. The results showed a decrease in cedar area of 12%, and an increase of 8% in cedar forest; in oak forest, the increment (21%) had exceeded the deforestation effect (17%); while deciduous was either degraded (11%) or remained stable (21%).
In summary, from the analyses of LULC changes, it could be found that the total forest cover remained stable and, thus, NDVI values were probably related with good climatic conditions during the period of study, as well as a result of huge efforts of the Moroccan High Commission for Water, Forests, and Combating Desertification (HCWFCD). The authorities have implemented extensive programs and a large portfolio of projects in the study area (e.g., development and protection of forest areas in the province of Ifrane and Participatory Rural Development in the Central Middle Atlas (HCWFCD 2017 [73,74]. Moreover, the Moroccan High Commissariat for Water, Forestry and Combating Desertification (HCWFCD) have undertaken huge efforts for studying and regeneration of the forest ecosystem, especially via reforestation [36,75]. The increase in forest area is mainly through plantations undertaken by the HCWFCD, for example; since 2011, the rate of reforestation and silvopastoral improvement achieve 42,988 ha per plantation, including (i) 24,464 ha of reforestation until 24 February 2012; (ii) 12,804 ha of forest regeneration (cedar—4038 ha, cork oak— 2107 ha, cedar—2403 ha, argan tree—1851 ha, Acacia raddiana—1205 ha, Aleppo pine—500 ha, holm oak—400 ha, (Aleppo Pine + Thuja)—100 ha and (Thuja + Holm oak)—200 ha); (iii) 5720 ha of silvopastoral improvement. Moreover, the management treatments, which were introduced during 2003–2007, involved 167.500 ha, or nearly 33.500 ha/an, specifically, the regeneration of natural species: cedar, atlas cypress, cork oak, carob, and argan (for more information, please see [75,76]
Additionally, since 2016, the Atlas cedar forests in Morocco are included in the world network Biosphere Reserve established by the United Nations Educational, Scientific, and Cultural Organization UNESCO ‘S Man and the Biosphere Program since 2001. This will be an effective step to regenerate these species, while maintaining essential ecosystem functions. Overall, the methodology proposed in this work could be useful for planning the use of forest resources and for developing strategies to maintain the vitality of the studied forest.

5. Conclusions

The study set out to determine LCLU statuses over the period 1987 to 2017 for the Azrou forest in the Middle Atlas of Morocco. Based on remote sensing data, MLC, GIS geospatial tools, and including the use of NDVI and ancillary data (field data), produced up-to-date reference information in the Azrou forest.
The objective of this study was to provide a recent perspective for LULC changes that have taken place, in the last 30 years, in Azrou forest. The results of this work can be summarized as follows: (i) it was found that a considerable increase in vegetation cover has taken place in the study area; (ii) the area of bare soil has decreased considerably during the period of study; (iii) our study achieved high classification accuracies (OA) for all the images, with the exception of MSS image.
The presented methodology was very promising for being used in such areas, based on remote sensing data and geospatial tools. With this, we hope to provide new insights for guiding planners in decision-making and ecosystem conservation.
This study demonstrates that exploiting a free archive of Landsat data, and its processing through open source software, provides an accurate approach to mapping and analyzing changes in land cover over time, that can be used as a guide to land management and policy decisions. In future research, we plan to compare the results of using Landsat data with other types of remote sensing data (e.g., Sentinel 2) to monitor LULC in the study area. However, Sentinel 2 data are only available since 2015. Furthermore, the proposed methodology will be applied to forestlands in other regions to advance a more comprehensive monitoring and mapping of forest change across the Middle Atlas of Morocco.

Author Contributions

Formal analysis, M.M. and M.E.H.; Methodology, M.M.; M.E.H.; A.E. and A.C.T.; Resources, A.E.O. and A.E.H.; Software, M.M. and M.E.H.; Supervision, A.E., F.O., G.R. and A.C.T.; Validation, M.M.; Visualization, M.M. and A.C.T.; Writing—original draft, M.M.; Writing—review & editing, M.M.; A.E. and A.C.T.

Funding

This research received no external funding.

Acknowledgments

The authors would like to thank the anonymous reviewers for their valuable comments on this article.

Conflicts of Interest

The authors declare no conflict of interest.

References

  1. Giri, C.; Wang, Y. Remote Sensing of Land Use and Land Cover; Giri, C., Ed.; CRC Press: Boca Raton, FL, USA, 2012. [Google Scholar]
  2. Gong, P.; Wang, J.; Yu, L.; Zhao, Y.; Zhao, Y.; Liang, L.; Niu, Z.; Huang, X.; Fu, H.; Liu, S.; et al. Finer resolution observation and monitoring of global land cover: First mapping results with Landsat TM and ETM+ data. Int. J. Remote Sens. 2013, 34, 2607–2654. [Google Scholar] [CrossRef]
  3. Chowdhury, S.; Chao, D.K.; Shipman, T.C.; Wulder, M.A. Utilization of Landsat data to quantify land-use and land-cover changes related to oil and gas activities in West-Central Alberta from 2005 to 2013. GISci. Remote Sens. 2017, 54, 700–720. [Google Scholar] [CrossRef]
  4. Muttitanon, W.; Tripathi, N.K. Land use/land cover changes in the coastal zone of Ban Don Bay, Thailand using Landsat 5 TM data. Int. J. Remote Sens. 2005, 26, 2311–2323. [Google Scholar] [CrossRef]
  5. Gerard, F.; Petit, S.; Smith, G.; Thomson, A.; Brown, N.; Manchester, S.; Wadsworth, R.; Bugar, G.; Halada, L.; Bezak, P.; et al. Land cover change in Europe between 1950 and 2000 determined employing aerial photography. Prog. Phys. Geogr. 2010, 34, 183–205. [Google Scholar] [CrossRef] [Green Version]
  6. Clerici, N.; Paracchini, M.L.; Maes, J. Land-cover change dynamics and insights into ecosystem services in European stream riparian zones. Ecohydrol. Hydrobiol. 2014, 14, 107–120. [Google Scholar] [CrossRef]
  7. Pervez, M.S.; Henebry, G.M. Assessing the impacts of climate and land use and land cover change on the freshwater availability in the Brahmaputra River basin. J. Hydrol. Reg. Stud. 2015, 3, 285–311. [Google Scholar] [CrossRef]
  8. Balthazar, V.; Vanacker, V.; Molina, A.; Lambin, E.F. Impacts of forest cover change on ecosystem services in high Andean mountains. Ecol. Indic. 2015, 48, 63–75. [Google Scholar] [CrossRef]
  9. Pasha, S.V.; Reddy, C.S.; Jha, C.S.; Rao, P.P.; Dadhwal, V.K. Assessment of land cover change hotspots in Gulf of Kachchh, India using multi-temporal remote sensing data and GIS. J. Indian Soc. Remote Sens. 2016, 44, 905–913. [Google Scholar] [CrossRef]
  10. Baumann, M.; Ozdogan, M.; Wolter, P.T.; Krylov, A.; Vladimirova, N.; Radeloff, V.C. Landsat remote sensing of forest windfall disturbance. Remote Sens. Environ. 2014, 143, 171–179. [Google Scholar] [CrossRef]
  11. Satyanarayana, B.; Thierry, B.; Seen, D.L.; Raman, A.V.; Muthusankar, G. Remote sensing in mangrove research-relationship between vegetation indices and dendrometric parameters: A case for Coringa, east coast of India. In proceeding of the 22nd Asian Conference on Remote Sensing, Singapore, 5–9 November 2001; Volume 5, p. 9. [Google Scholar]
  12. Liang, D.; Zuo, Y.; Huang, L.; Zhao, J.; Teng, L.; Yang, F. Evaluation of the consistency of MODIS land cover product (MCD12Q1) based on Chinese 30 m globeland 30 datasets: A case study in Anhui Province, China. ISPRS Int. J. Geo-Inf. 2015, 4, 2519–2541. [Google Scholar] [CrossRef]
  13. Townshend, J.R.G.; Gayler, J.R.; Hardy, J.R.; Jackson, M.J.; Baker, J.R. Preliminary analysis of LANDSAT-4 Thematic Mapper. Int. J. Remote Sens. 1983, 4, 817–828. [Google Scholar] [CrossRef]
  14. Taylor, P.; Horler, D.N.H.; Ahern, F.J. Forestry information content of Thematic Mapper data. Int. J. Remote Sens. 2007, 37–41. [Google Scholar] [CrossRef]
  15. Lunetta, R.S.; Lyon, J.G.; Guindon, B.; Elvidge, C.D. North American landscape characterization dataset development and data fusion issues. Photogramm. Eng. Remote Sens. 1998, 64, 821–828. [Google Scholar]
  16. Cohen, W.B.; Goward, S.N. Landsat’s role in ecological applications of remote sensing. AIBS Bull. 2004, 54, 535–545. [Google Scholar] [CrossRef]
  17. Campbell, J.B. Introduction to Remote Sensing, 4th ed.; The Guilford Press: New York, NY, USA, 2007. [Google Scholar]
  18. Yuan, F.; Sawaya, K.E.; Loeffelholz, B.C.; Bauer, M.E. Land cover classification and change analysis of the Twin Cities (Minnesota) Metropolitan Area by multitemporal Landsat remote sensing. Remote Sens. Environ. 2005, 98, 317–328. [Google Scholar] [CrossRef]
  19. Demissie, F.; Yeshitila, K.; Kindu, M.; Schneider, T. Land use/Land cover changes and their causes in Libokemkem District of South Gonder, Ethiopia. Remote Sens. Appl. Soc. Environ. 2017, 8, 224–230. [Google Scholar] [CrossRef]
  20. Barakat, A.; Khellouk, R.; El Jazouli, A.; Touhami, F.; Nadem, S. Monitoring of forest cover dynamics in eastern area of Béni-Mellal Province using ASTER and Sentinel-2A multispectral data. Geol. Ecol. Landsc. 2018, 2, 203–215. [Google Scholar] [CrossRef]
  21. De Waroux, Y.L.P.; Lambin, E.F. Monitoring degradation in arid and semi-arid forests and woodlands: The case of the argan woodlands (Morocco). Appl. Geogr. 2012, 32, 777–786. [Google Scholar] [CrossRef]
  22. Hammi, S.; Simonneaux, V.; Cordier, J.B.; Genin, D.; Alifriqui, M.; Montes, N.; Auclair, L. Can traditional forest management buffer forest depletion? Dynamics of Moroccan High Atlas Mountain forests using remote sensing and vegetation analysis. For. Ecol. Manag. 2010, 260, 1861–1872. [Google Scholar] [CrossRef] [Green Version]
  23. Lu, D.; Mausel, P.; Batistella, M.; Moran, E. Land-cover binary change detection methods for use in the moist tropical region of the Amazon: A comparative study. Int. J. Remote Sens. 2005, 26, 101–114. [Google Scholar] [CrossRef]
  24. Lu, D.; Mausel, P.; Brondizio, E.; Moran, E. Change detection techniques. Int. J. Remote Sens. 2004, 25, 2365–2401. [Google Scholar] [CrossRef]
  25. Coppin, P.; Lambin, E.; Jonckheere, I.; Muys, B. Digital change detection methods in natural ecosystem monitoring: A review. In Analysis of Multi-Temporal Remote Sensing Images; World Scientific: Singapore, 2002; pp. 3–36. [Google Scholar]
  26. Linares, J.C.; Taïqui, L.; Camarero, J.J. Increasing drought sensitivity and decline of Atlas cedar (Cedrus atlantica) in the Moroccan Middle Atlas forests. Forests 2011, 2, 777–796. [Google Scholar] [CrossRef]
  27. Linares, J.C.; Taïqui, L.; Sangüesa-Barreda, G.; Seco, J.I.; Camarero, J.J. Age-related drought sensitivity of Atlas cedar (Cedrus atlantica) in the Moroccan Middle Atlas forests. Dendrochronologia 2013, 31, 88–96. [Google Scholar] [CrossRef]
  28. Navarro-Cerrillo, R.M.; Manzanedo, R.D.; Bohorque, J.; Sánchez, R.; Sánchez, J.; de Miguel, S.; Solano, D.; Qarro, M.; Griffith, D.; Palacios, G. Structure and spatio-temporal dynamics of cedar forests along a management gradient in the Middle Atlas, Morocco. For. Ecol. Manag. 2013, 289, 341–353. [Google Scholar] [CrossRef]
  29. Mohajane, M.; Essahlaoui, A.; Oudija, F.; El Hafyani, M.; Cláudia Teodoro, A. Mapping Forest Species in the Central Middle Atlas of Morocco (Azrou Forest) through Remote Sensing Techniques. ISPRS Int. J. Geo-Inf. 2017, 6, 275. [Google Scholar] [CrossRef]
  30. Hyyppä, J.; Hyyppä, H.; Inkinen, M.; Engdahl, M.; Linko, S.; Zhu, Y.H. Accuracy comparison of various remote sensing data sources in the retrieval of forest stand attributes. For. Ecol. Manag. 2000, 128, 109–120. [Google Scholar] [CrossRef]
  31. Fidah, A.; Salhi, N.; Rahouti, M.; Kabouchi, B.; Ziani, M.; Aberchane, M.; Famiri, A. Natural durability of Cedrus atlantica wood related to the bioactivity of its essential oil against wood decaying fungi. Maderas. Ciencia y Tecnología 2016, 18, 567–576. [Google Scholar] [CrossRef]
  32. El Abidine, A.Z.; Lamhamedi, M.S.; Taoufik, A. Relations hydriques des arbres sains et dépérissants de Cedrus atlantica M. au Moyen Atlas Tabulaire au Maroc. Geo-Eco-Trop 2013, 37, 157–176. [Google Scholar]
  33. Osunmadewa, B.A.; Gebrehiwot, W.Z.; Csaplovics, E.; Adeofun, O.C. Spatio-temporal monitoring of vegetation phenology in the dry sub-humid region of Nigeria using time series of AVHRR NDVI and TAMSAT datasets. Open Geosci. 2018, 10, 1–11. [Google Scholar] [CrossRef] [Green Version]
  34. Pal, M.; Mather, P.M. An assessment of the effectiveness of decision tree methods for land cover classification. Remote Sens. Environ. 2003, 86, 554–565. [Google Scholar] [CrossRef]
  35. ERDAS. ERDAS Field Guide, Revised and Expanded, 15th ed.; ERDAS, Inc.: Atlanta, GA, USA, 1999. [Google Scholar]
  36. TOBA Societe d’Etudes Techniques & d’Ingenierie (SOGREAH-TTOBA). Etudes d’aménagement Concerte Des Forets et Parcours Collectifs De La Province d’Ifrane. Foret d’Azrou: Plan d’aménagement; Royaume du Maroc—Haut-Commissariat aux Eaux et Forêts, à la Lutte contre la Désertification; Direction Regionale des Eaux et Forêts de Meknes: Rabat, Morocco, 2007. [Google Scholar]
  37. Linares, J.C.; Tíscar, P.A.; Camarero, J.J.; Taïqui, L.; Viñegla, B.; Seco, J.I.; Merino, J.; Carreira, J.A. Tree growth decline on relict Western-Mediterranean mountain forests: Causes and impacts. In Forest Decline: Causes and Impacts; Nova Science Publishers, Inc.: Hauppauge, NY, USA, 2011. [Google Scholar]
  38. Le Dilemme Entre Développement Et Protection Dans Les Montagnes Du Maroc-Le Cas Des Parcs Du Moyen Atlas. Available online: https://journals.openedition.org/geocarrefour/3002 (accessed on 17 October 2018).
  39. Sun, Z.; Ma, R.; Wang, Y. Using landsat data to determine land use changes in Datong basin, China. Environ. Geol. 2009, 57, 1825–1837. [Google Scholar] [CrossRef]
  40. QGIS. QGIS Geographic Information System; Open Source Geospatial Foundation Project. Available online: https://qgis.org/en/site/ (accessed on 15 May 2018 ).
  41. Semi-Automatic Classification Plugin Documentation. Available online: https://media.readthedocs.org/pdf/semiautomaticclassificationmanual-v3/latest/semiautomaticclassificationmanual-v3.pdf (accessed on 17 October 2018).
  42. Chavez, P.S., Jr. An improved dark-object subtraction technique for atmospheric scattering correction of multispectral data. Remote Sens. Environ. 1988, 24, 459–479. [Google Scholar] [CrossRef]
  43. Schroeder, T.A.; Cohen, W.B.; Song, C.; Canty, M.J.; Yang, Z. Radiometric correction of multi-temporal Landsat data for characterization of early successional forest patterns in Western Oregon. Remote Sens. Environ. 2006, 103, 16–26. [Google Scholar] [CrossRef]
  44. Tan, K.C.; San Lim, H.; MatJafri, M.Z.; Abdullah, K. Landsat data to evaluate urban expansion and determine land use/land cover changes in Penang Island, Malaysia. Environ. Earth Sci. 2010, 60, 1509–1521. [Google Scholar] [CrossRef]
  45. Nelson, G.C.; Geoghegan, J. Deforestation and land use change: Sparse data environments. Agric. Econ. 2002, 27, 201–216. [Google Scholar] [CrossRef]
  46. Wang, Z.; Yao, W.; Tang, Q.; Liu, L.; Xiao, P.; Kong, X.; Zhang, P.; Shi, F.; Wang, Y. Continuous Change Detection of Forest/Grassland and Cropland in the Loess Plateau of China Using all Available Landsat Data. Remote Sens. 2018, 10, 1775. [Google Scholar] [CrossRef]
  47. Tucker, C.J. Red and photographic infrared linear combinations for monitoring vegetation. Remote Sens. Environ. 1979, 8, 127–150. [Google Scholar] [CrossRef] [Green Version]
  48. Song, C.; Woodcock, C.E.; Seto, K.C.; Lenney, M.P.; Macomber, S.A. Classification and change detection using Landsat TM data: When and how to correct atmospheric effects? Remote Sens. Environ. 2001, 75, 230–244. [Google Scholar] [CrossRef]
  49. Currit, N. Development of a remotely sensed, historical land-cover change database for rural Chihuahua, Mexico. Int. J. Appl. Earth Obs. Geoinf. 2005, 7, 232–247. [Google Scholar] [CrossRef]
  50. Paola, J.D.; Schowengerdt, R.A. A detailed comparison of back propagation neural network and maximum-likelihood classifiers for urban land use classification. IEEE Trans. Geosci. Remote Sens. 1995, 33, 981–996. [Google Scholar] [CrossRef]
  51. Remote Sensing Digital Image Analysis An Introduction. Available online: https://0-link-springer-com.brum.beds.ac.uk/book/10.1007/3-540-29711-1 (accessed on 17 October 2018).
  52. Foody, G.M. Status of land cover classification accuracy assessment. Remote Sens. Environ. 2002, 80, 185–201. [Google Scholar] [CrossRef]
  53. Neural Network Approaches Versus Statistical Methods in Classification of Multisource Remote Sensing Data. Available online: https://ntrs.nasa.gov/search.jsp?R=19900062611 (accessed on 17 October 2018).
  54. Otukei, J.R.; Blaschke, T. Land cover change assessment using decision trees, support vector machines and maximum likelihood classification algorithms. Int. J. Appl. Earth Obs. Geoinf. 2010, 12, S27–S31. [Google Scholar] [CrossRef]
  55. Wardlow, B.D.; Egbert, S.L.; Kastens, J.H. Analysis of time-series MODIS 250 m vegetation index data for crop classification in the US Central Great Plains. Remote Sens. Environ. 2007, 108, 290–310. [Google Scholar] [CrossRef]
  56. Wei, J.; Liu, X.; Liu, J. Integrating textural and spectral features to classify silicate-bearing rocks using Landsat 8 data. Appl. Sci. 2016, 6, 283. [Google Scholar] [CrossRef]
  57. Wang, Y.; Qi, Q.; Liu, Y. Unsupervised segmentation evaluation using area-weighted variance and Jeffries-Matusita distance for remote sensing images. Remote Sens. 2018, 10, 1193. [Google Scholar] [CrossRef]
  58. Lu, D.; Weng, Q. A survey of image classification methods and techniques for improving classification performance. Int. J. Remote Sens. 2007, 28, 823–870. [Google Scholar] [CrossRef] [Green Version]
  59. Teodoro, A.C.; Araujo, R. Comparison of performance of object-based image analysis techniques available in open source software (Spring and Orfeo Toolbox/Monteverdi) considering very high spatial resolution data. J. Appl. Remote Sens. 2016, 10, 016011. [Google Scholar] [CrossRef]
  60. Derivation and Applications of Probabilistic Measures of Class Membership from the Maximum-Likelihood Classification. Available online: https://www.asprs.org/wp-content/uploads/pers/1992journal/sep/1992_sep_1335-1341.pdf (accessed on 17 October 2018).
  61. Smits, P.C.; Commission, E.; Dellepiane, S.G. Quality assessment of image classification algorithms for land-cover mapping: A review and a proposal for a cost-based approach. Int. J. Remote Sens. 1999, 20. [Google Scholar] [CrossRef]
  62. Manandhar, R.; Odeh, I.O.; Ancev, T. Improving the accuracy of land use and land cover classification of Landsat data using post-classification enhancement. Remote Sens. 2009, 1, 330–344. [Google Scholar] [CrossRef]
  63. Anderson, J.R. A Land Use and Land cover Classification System for Use with Remote Sensor Data; US Government Printing Office: Washington, DC, USA, 1976; Volume 964. [Google Scholar]
  64. Thomlinson, J.R.; Bolstad, P.V.; Cohen, W.B. Coordinating methodologies for scaling land cover classifications from site-specific to global: Steps toward validating global map products. Remote Sens. Environ. 1999, 70, 16–28. [Google Scholar] [CrossRef]
  65. Congalton, R.G. A review of assessing the accuracy of classifications of remotely sensed data. Remote Sens. Environ. 1991, 37, 35–46. [Google Scholar] [CrossRef]
  66. Reis, S. Analyzing land use/land cover changes using remote sensing and GIS in Rize, North-East Turkey. Sensors 2008, 8, 6188–6202. [Google Scholar] [CrossRef] [PubMed]
  67. Tole, L. An estimate of forest cover extent and change in Jamaica using Landsat MSS data. Int. J. Remote Sens. 2002, 23, 91–106. [Google Scholar] [CrossRef]
  68. Apan, A.A. Land cover mapping for tropical forest rehabilitation planning using remotely-sensed data. Int. J. Remote Sens. 1997, 18, 1029–1049. [Google Scholar] [CrossRef]
  69. Pang, C.; Yu, H.; He, J.; Xu, J. Deforestation and changes in landscape patterns from 1979 to 2006 in Suan County, DPR Korea. Forests 2013, 4, 968–983. [Google Scholar] [CrossRef]
  70. Ozesmi, S.L.; Bauer, M.E. Satellite remote sensing of wetlands. Wetl. Ecol. Manag. 2002, 10, 381–402. [Google Scholar]
  71. Lu, D.; Moran, E.; Batistella, M. Linear mixture model applied to Amazonian vegetation classification. Remote Sens. Environ. 2003, 87, 456–469. [Google Scholar] [CrossRef] [Green Version]
  72. Haboudane, D. Deforestation detection and monitoring in cedar forests of the Moroccan Middle-Atlas Mountains. In Proceedings of the 2007 IEEE International Geoscience and Remote Sensing Symposium, Barcelona, Spain, 23–28 July 2007; pp. 4327–4330. [Google Scholar]
  73. Observations Satellitaires de L’état de la Cédraie du MOYEN Atlas: Étude Régionale de la Déforestation et Détection Localisée du Dépérissement du Cèdre. Available online: https://www.researchgate.net/profile/Jad_Tahouri/publication/306938711_Le_patrimoine_forestier_et_le_developpement_durable_du_Maroc_Cedre-Magot_est-ce_qu’il_existe_un_rapport_entre_la_degradation_de_la_foret_des_cedraies_et_le_singe_magot/links/5808c3de08aefaf02a2f7a84/Le-patrimoine-forestier-et-le-developpement-durable-du-Maroc-Cedre-Magot-est-ce-quil-existe-un-rapport-entre-la-degradation-de-la-foret-des-cedraies-et-le-singe-magot.pdf (accessed on 17 October 2018).
  74. Transtec. Mission D’evaluation Finale Du Projet. Développement Rural Participatif Dans le Moyen Atlas Central (Projet Khénifra) au Maroc. 2010. Available online: http://www.eauxetforets.gov.ma/admin/telechargement/fr/Projet_Khenifra.pdf (accessed on 17 October 2018).
  75. Bilan des Réalisations du HCEFLCD 2011/DPSIC/DSI/SSE. Available online: http://www.eauxetforets.gov.ma (accessed on 20 November 2018).
  76. Forets et Développement Durable Dans Les Provinces de Chefchaouen et Ifrane. Available online: http://www.eauxetforets.gov.ma/fr/index.aspx (accessed on 17 October 2018).
Figure 1. Location of the study area (elevation data).
Environments 05 00131 g001
Figure 2. Flowchart of the methodology adopted.
Environments 05 00131 g002
Figure 3. Land use/land cover (LULC) maps 1987–2017.
Environments 05 00131 g003
Figure 4. NDVI cover changes maps.
Environments 05 00131 g004
Table 1. Landsat scenes used in the study.
Date (yyyy/mm/dd)PassSpatial Resolution (m)Cloud Cover
MSS1987/09/12Descending790%
TM1995/07/02Descending300%
ETM+2000/08/06Descending300%
TM2011/07/28Descending300%
OLI 2017/07/28Descending300%
Table 2. The number of pixels used for classifications.
ImageClassNumber of Pixels
MSSHolm oak8462
Cedar forest11,641
Bare soil29,025
TM (1995)Holm oak4639
Cedar forest11,549
Bare soil11,803
ETM+Holm oak5300
Cedar forest7160
Bare soil17,069
TM (2011)Holm oak10,102
Cedar forest19,385
Bare soil14,773
OLI (2017)Holm oak7076
Cedar forest12,169
Bare soil15,203
Table 3. ROI (region of interest) pairs’ separability (Jeffries–Matusita distance) between classes.
Landsat ImagesROI PairsSeparability
MSS (1987)cedar forest/holm oak1.25491
bare soil/holm oak1.99234
bare soil/cedar forest1.99536
TM (1995)cedar forest/holm oak1.88294
bare soil/holm oak1.99711
bare soil/cedar forest1.99982
ETM+ (2000)cedar forest/holm oak1.75028
bare soil/holm oak1.99974
bare soil/cedar forest1.99990
TM (2011)cedar forest/holm oak1.89461
bare soil/holm oak1.99786
bare soil/cedar forest1.99999
Landsat 8 OLI (2017)cedar forest/holm oak1.85464
bare soil/holm oak1.99978
bare soil/cedar forest1.99999
Table 4. Land-cover (in hectare and percentage) from 1987 to 2017.
LULC Classes198719952000 20112017
Area (ha)%Area (ha)%Area (ha)%Area (ha)%Area (ha)%
Cedar forest3868.138.72882.335.96064.524.66356.125.87463.530.3
Holm oak11,214.715.712,883.411.79827.139.010,560.742.99151.937.1
Bare soil9528.545.58845.652.38719.735.47694.531.27995.932.4
Table 5. Accuracy assessment of the land cover maps generated.
Year: 1987
LULC classCedar forestHolm oakBare soilProducer’s accuracyUser’s accuracy
Cedar forest103,634999,90089170.090.50
Holm oak99,998110,71199,9690.350.09
Bare soil109293442,240,3470.990.95
Overall accuracy: 66.8%; Kappa accuracy: 0.413
Year: 1995
LULC classCedar forestHolm oakBare soilProducer’s accuracyUser’s accuracy
Cedar forest3,657,203147170.990.99
Holm oak60114,034110.950.98
Bare soil321518520.970.98
Overall accuracy: 99.9%; Kappa accuracy: 0.974
Year: 2000
LULC classCedar forestHolm oakBare soilProducer’s accuracyUser’s accuracy
Cedar forest130,000528870.990.96
Holm oak4900817,769730.990.99
Bare soil534322,720,0700.990.99
Overall accuracy: 99.8%; Kappa accurac:0.995
Year: 2011
Cedar forestHolm oakBare soilProducer’s accuracyUser’s accuracy
Cedar forest3,800,00800760.990.99
Holm oak1300662,000520.990.99
Bare soil24122,629,6480.990.99
Overall accuracy: 99.9%; Kappa accuracy: 0.998
Year: 2017
Cedar forestHolm oakBare soilProducer’s accuracyUser’s accuracy
Cedar forest325,000300190.990.99
Holm oak900673,000120.990.99
Bare soil61122,674,6080.990.99
Overall accuracy: 99.9%; Kappa accuracy: 0.999
Table 6. Normalized difference vegetation index (NDVI) land cover change (in km2 and percentage) from 1987 to 2017.
NDVI Classes19871995200020112017
Area (km2)%Area (km2)%Area (km2)%Area (km2)%Area (km2)%
Low-density vegetation67.427.420.48.281.23346.618.95.12.1
Moderate-density vegetation107.843.890.236.6150.561.1181.573.781.733.2
High-density vegetation70.828.7135.555.0514.35.817.97.2159.164.6

