Research on Organic Carbon and Elemental Carbon Distribution Characteristics and Their Influence on Fine Particulate Matter (PM2.5) in Changchun City

Abstract
:1. Introduction
2. Methods
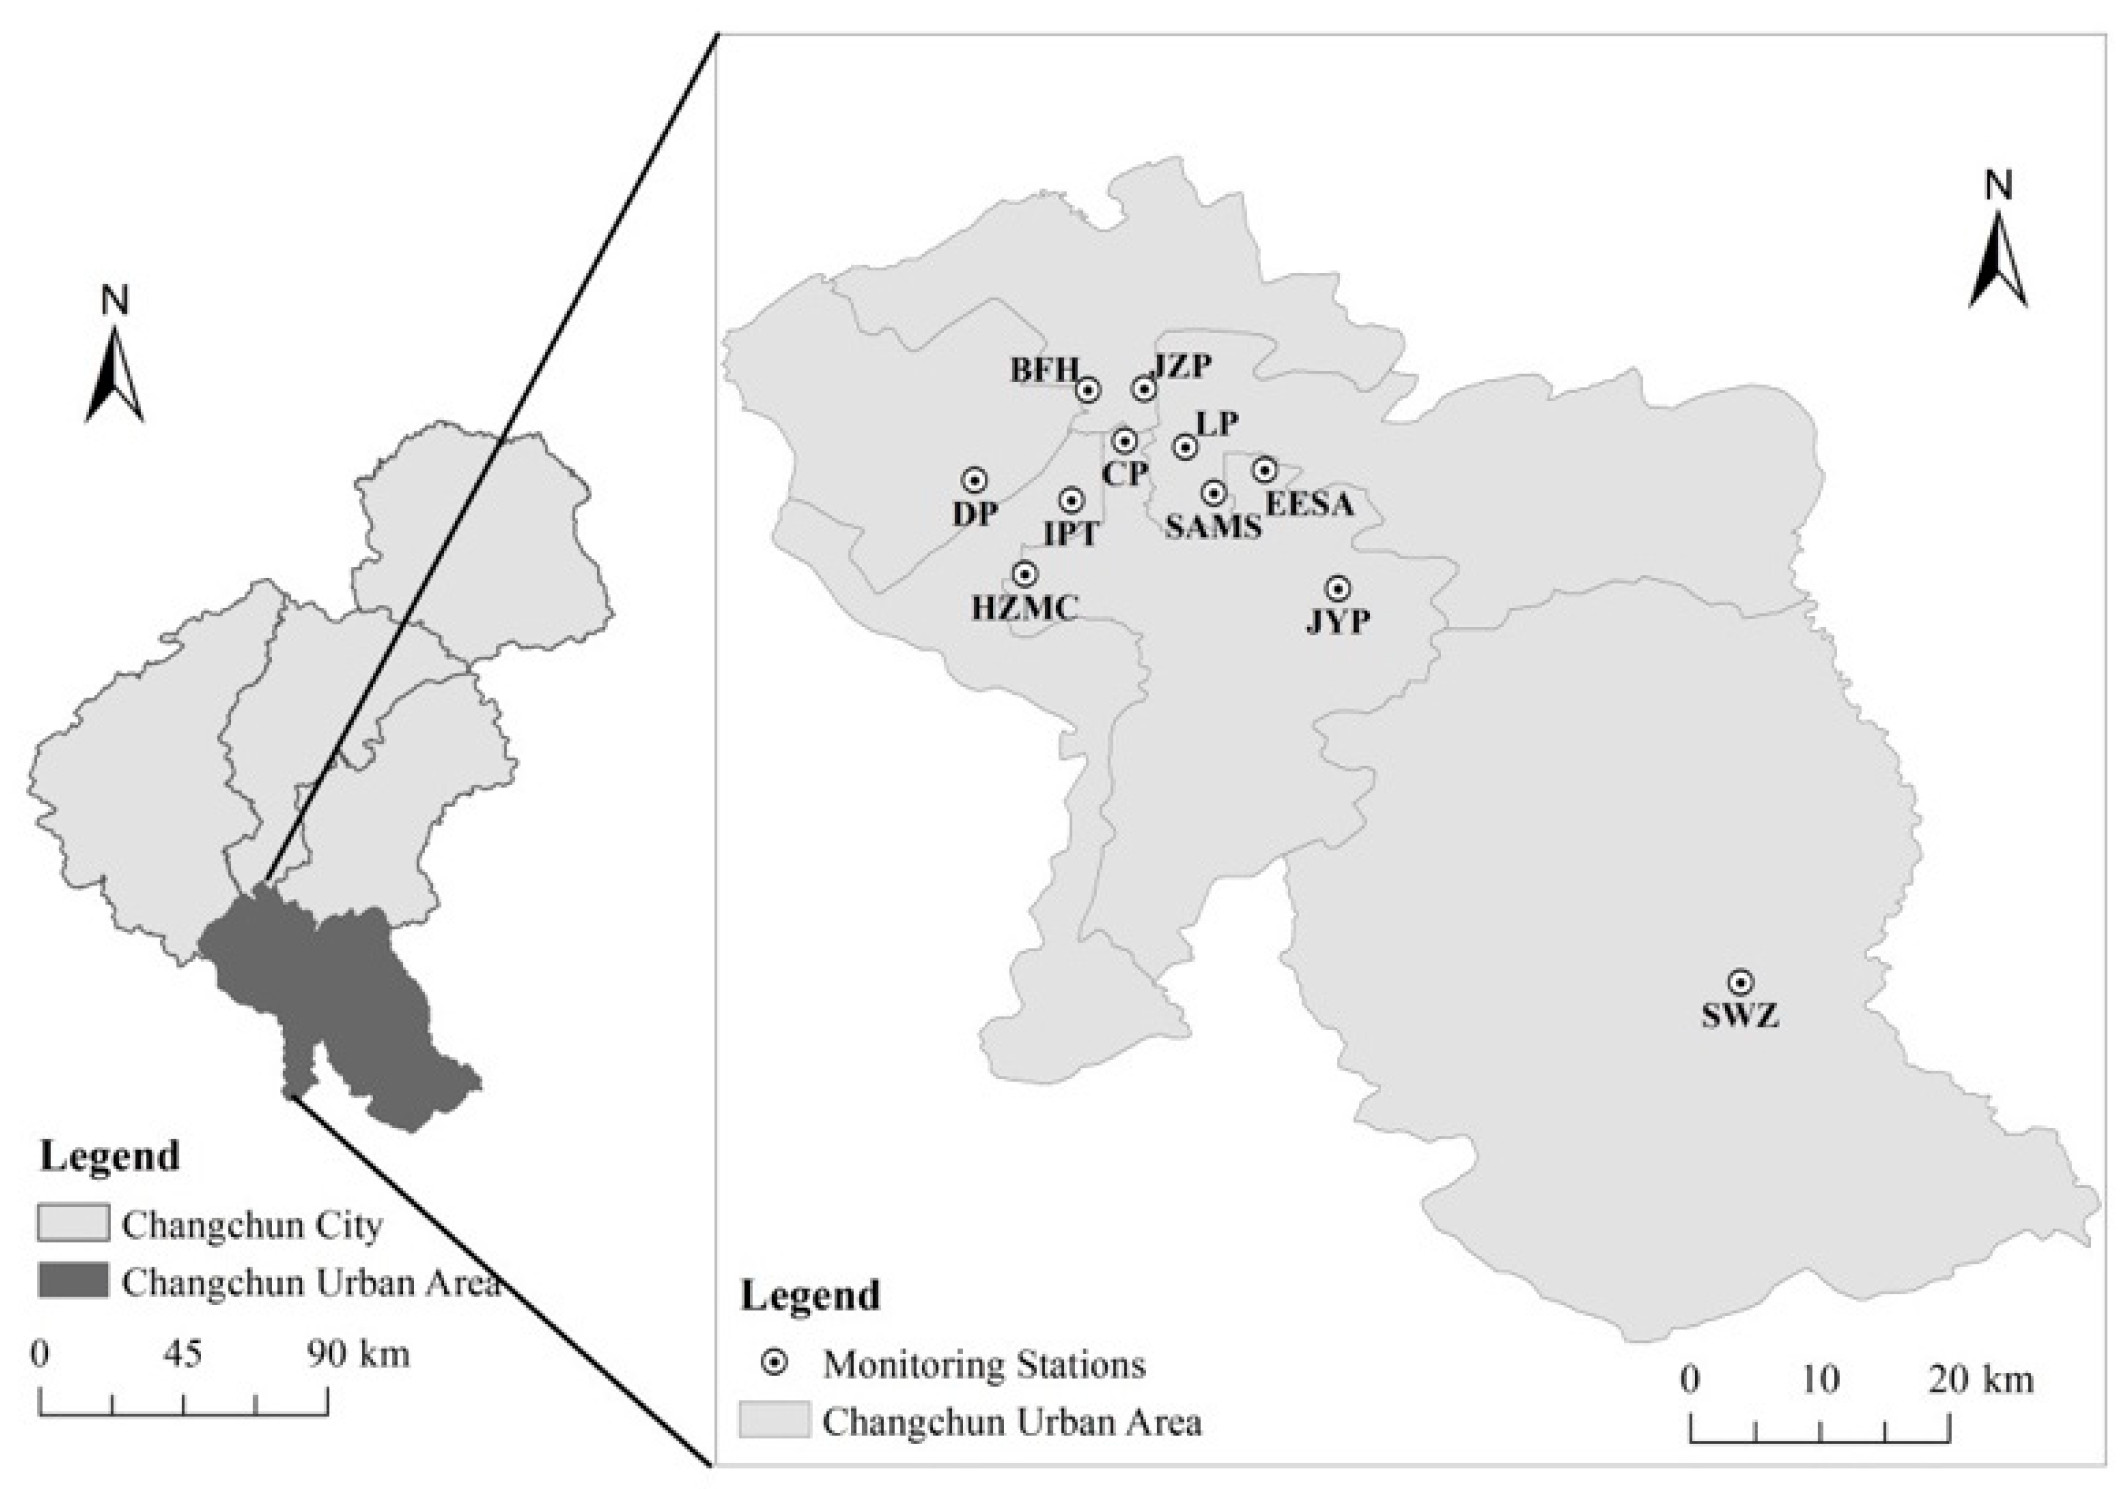
2.1. Sampling Sites
2.2. Sample Collection
2.3. Sample Analysis
2.4. Data Analysis
3. Results and Discussion
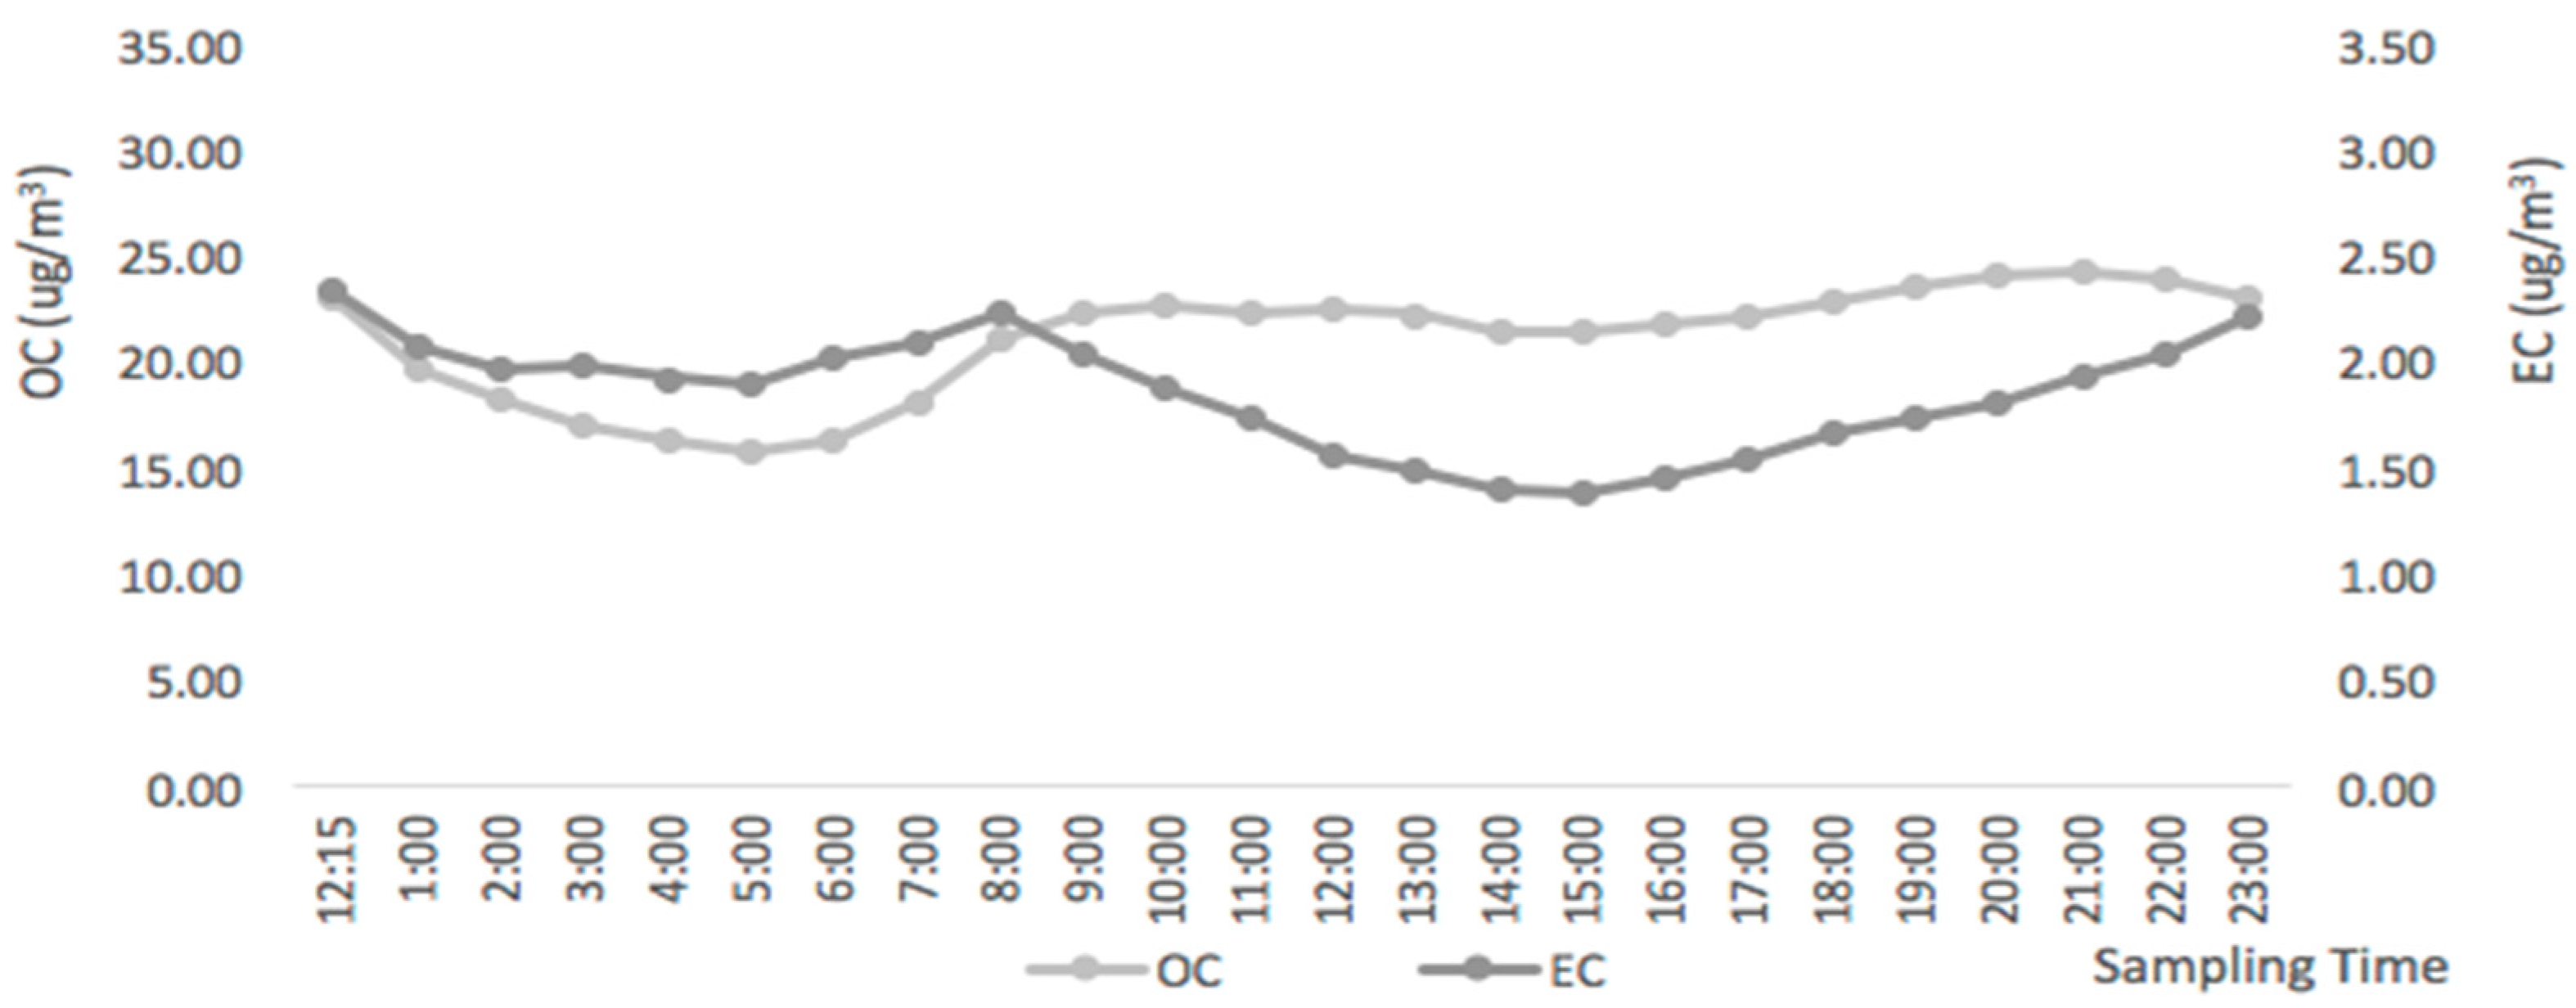
3.1. Annual Variations of OC and EC Concentration
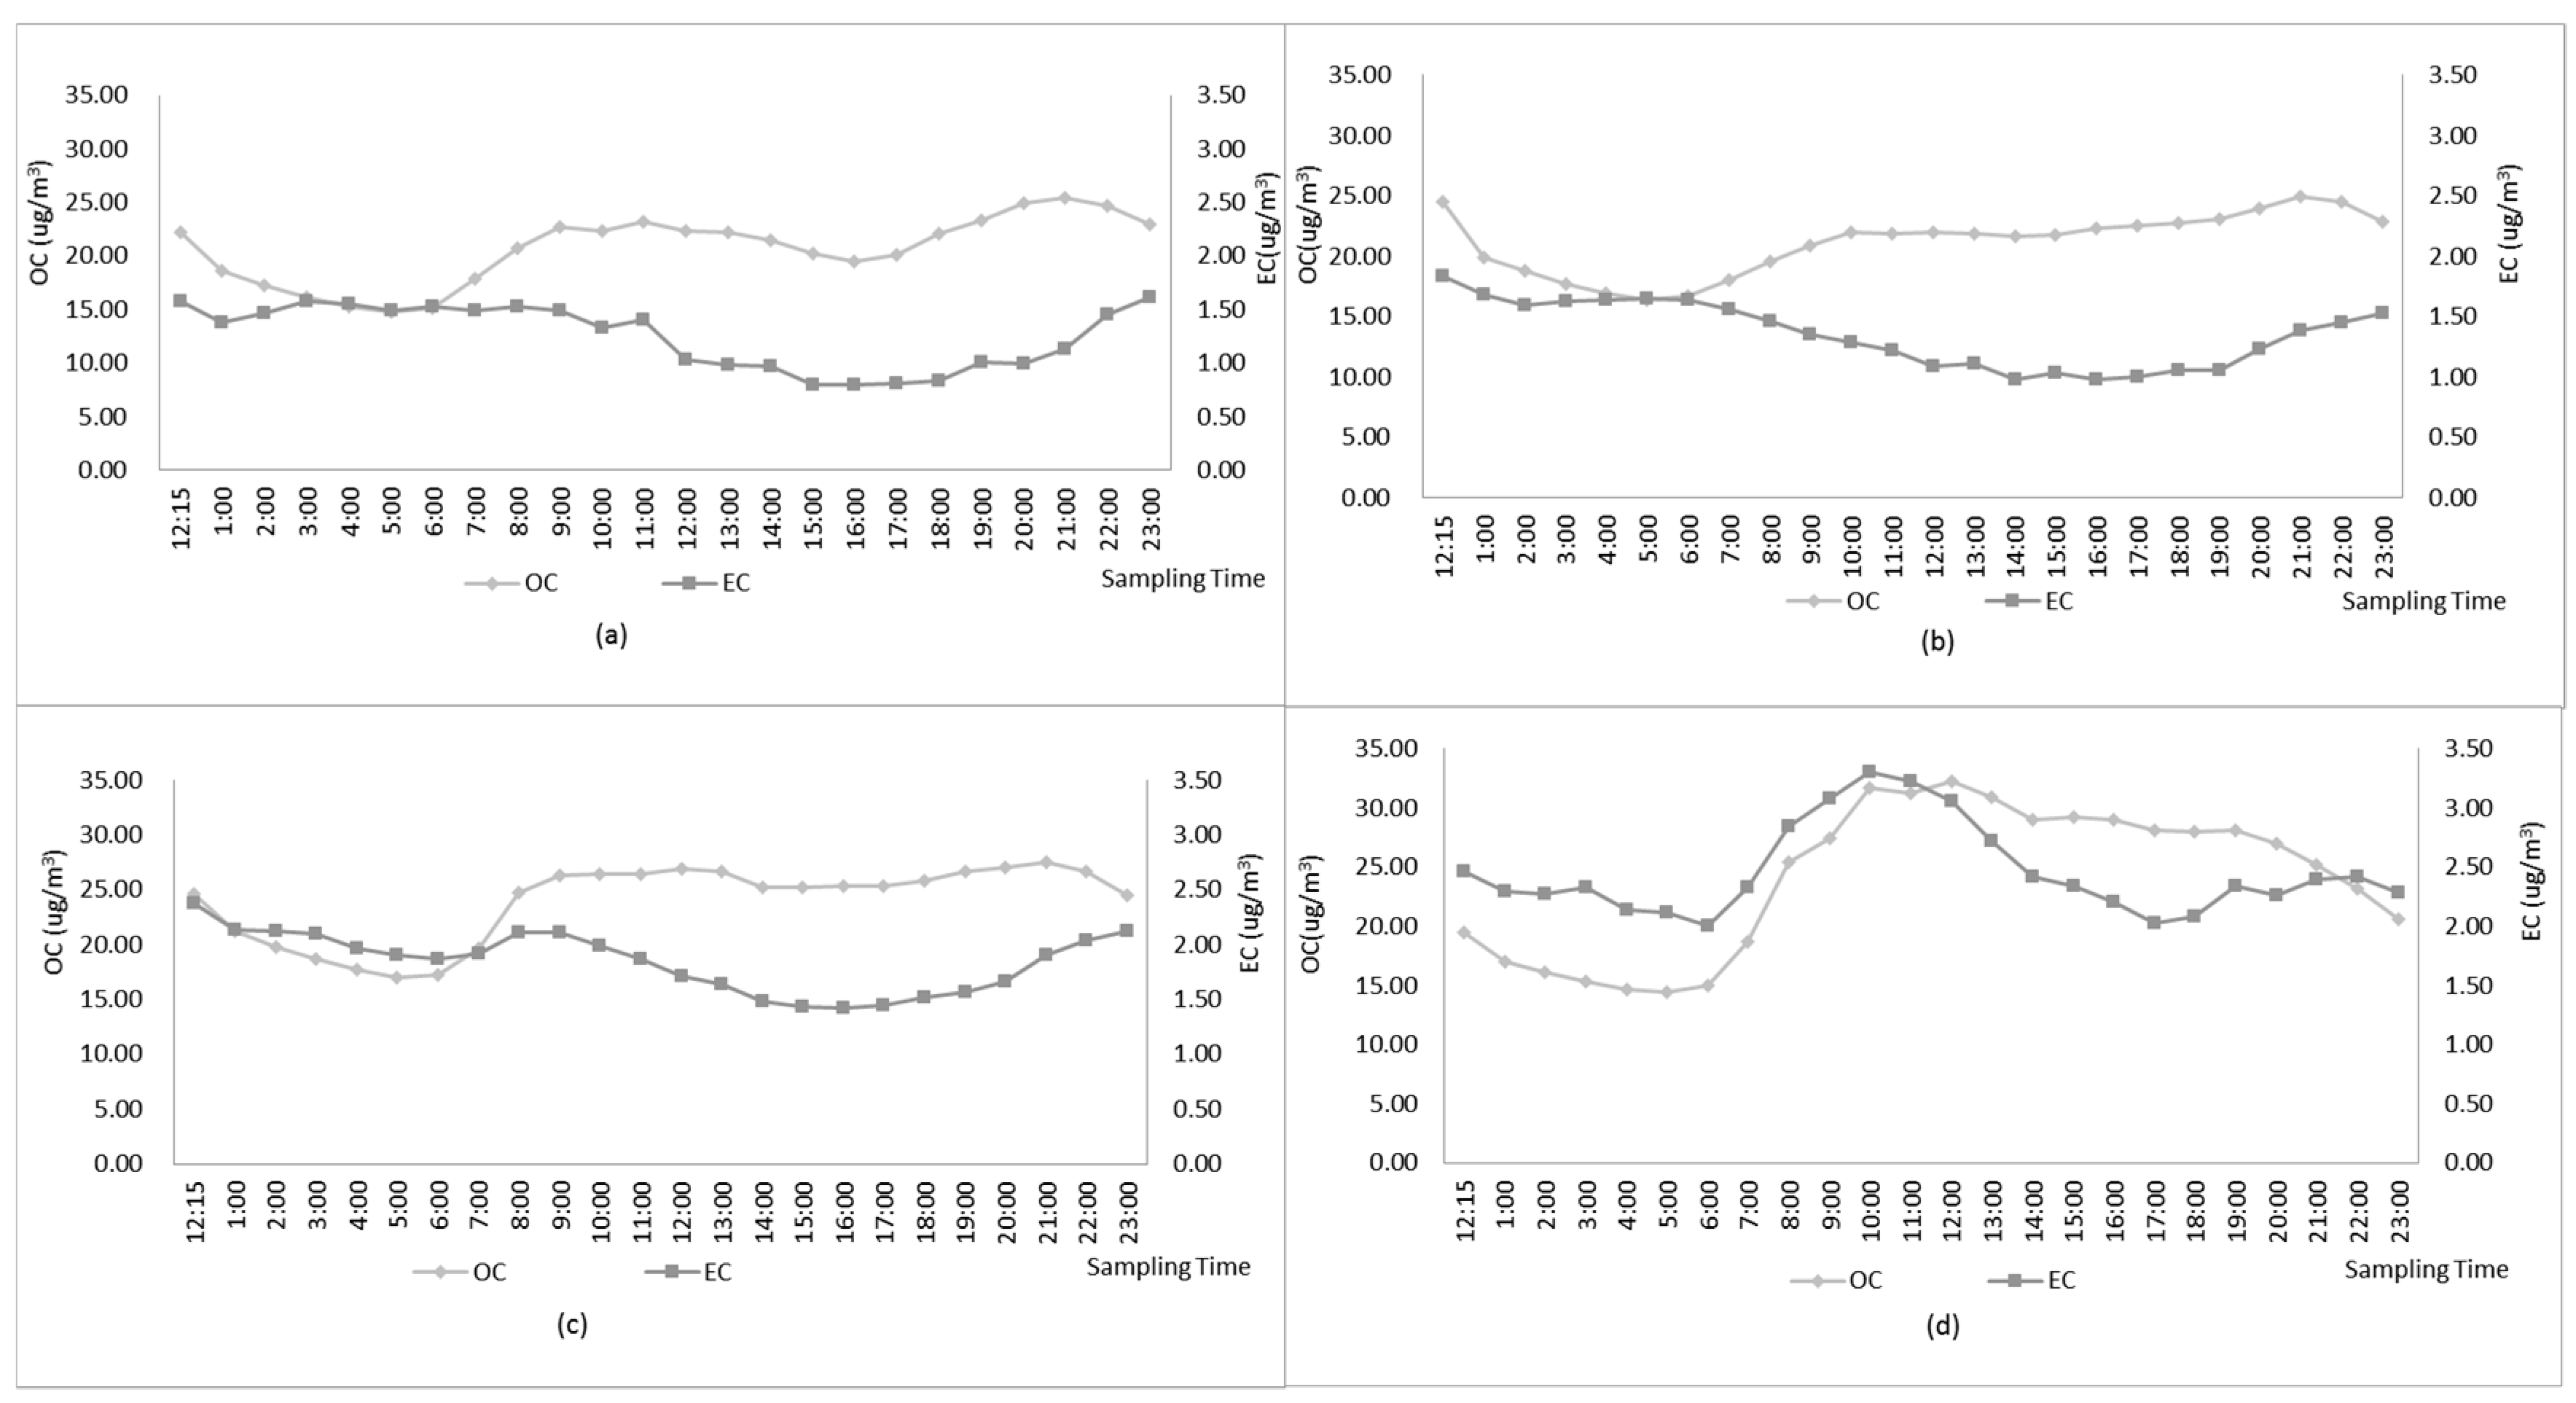
3.2. Seasonal Variations of OC and EC Concentration
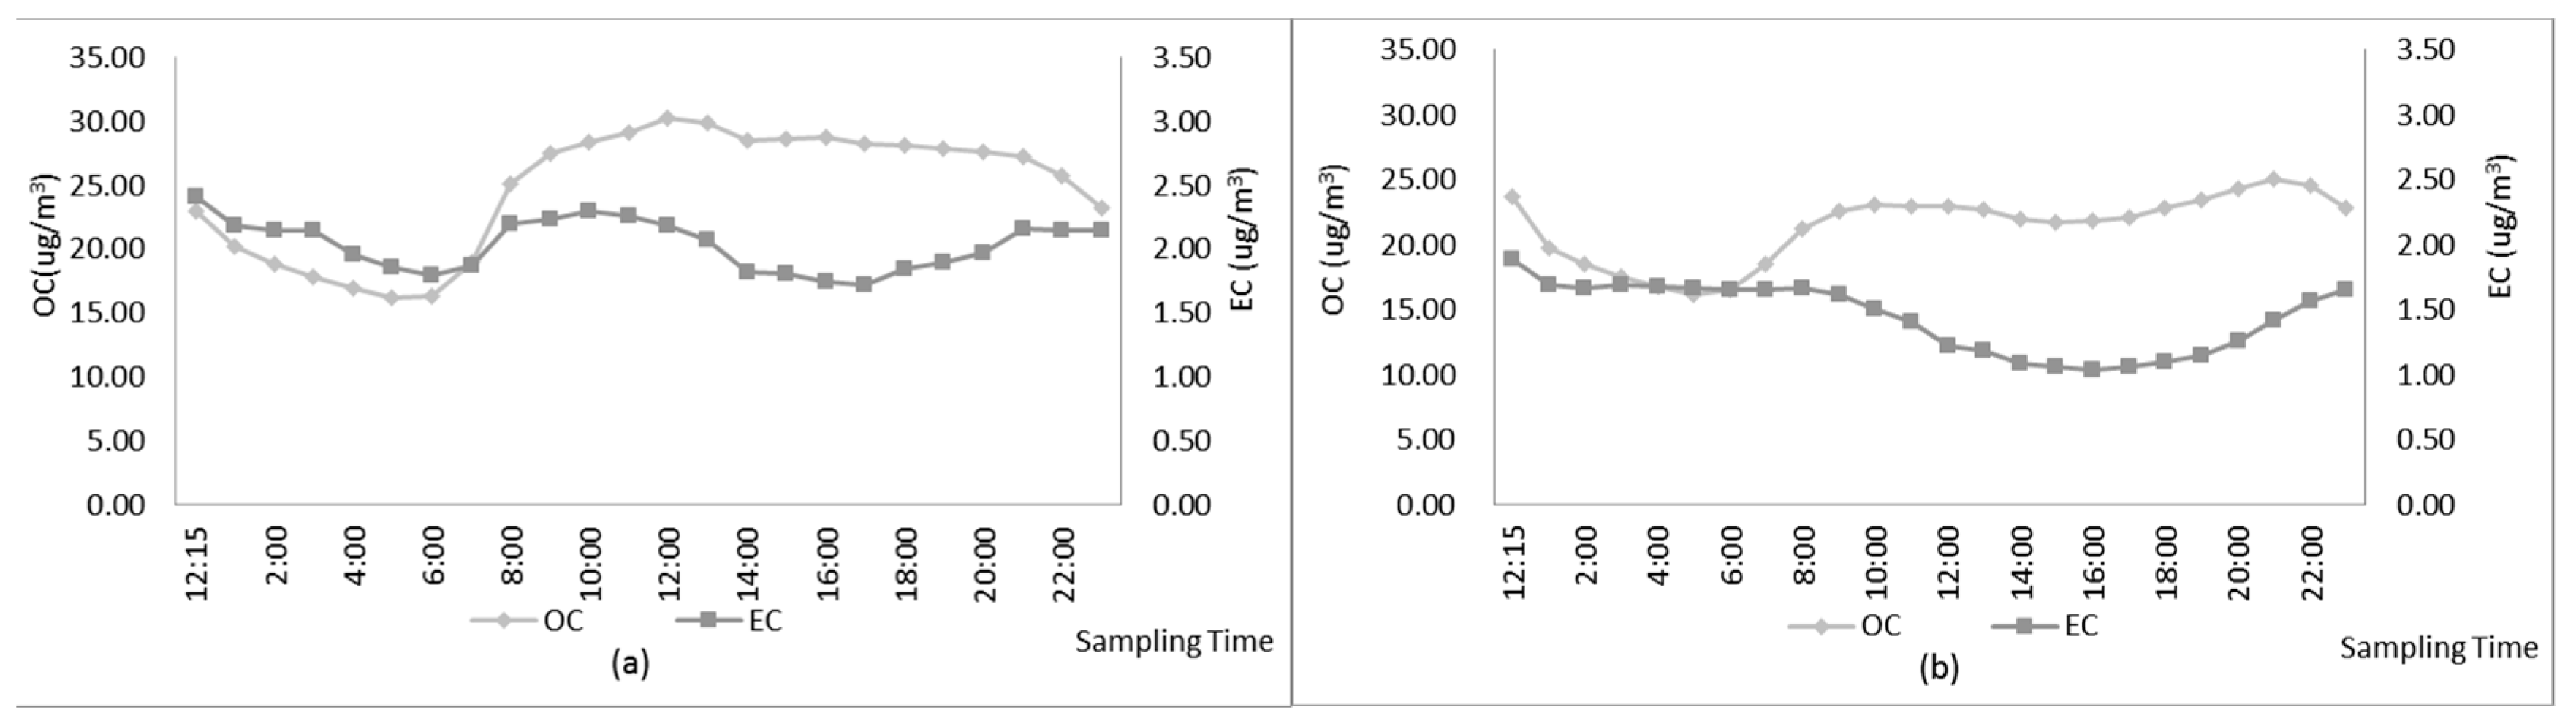
3.3. Heating and Non-Heating Period Variations of OC and EC Concentration
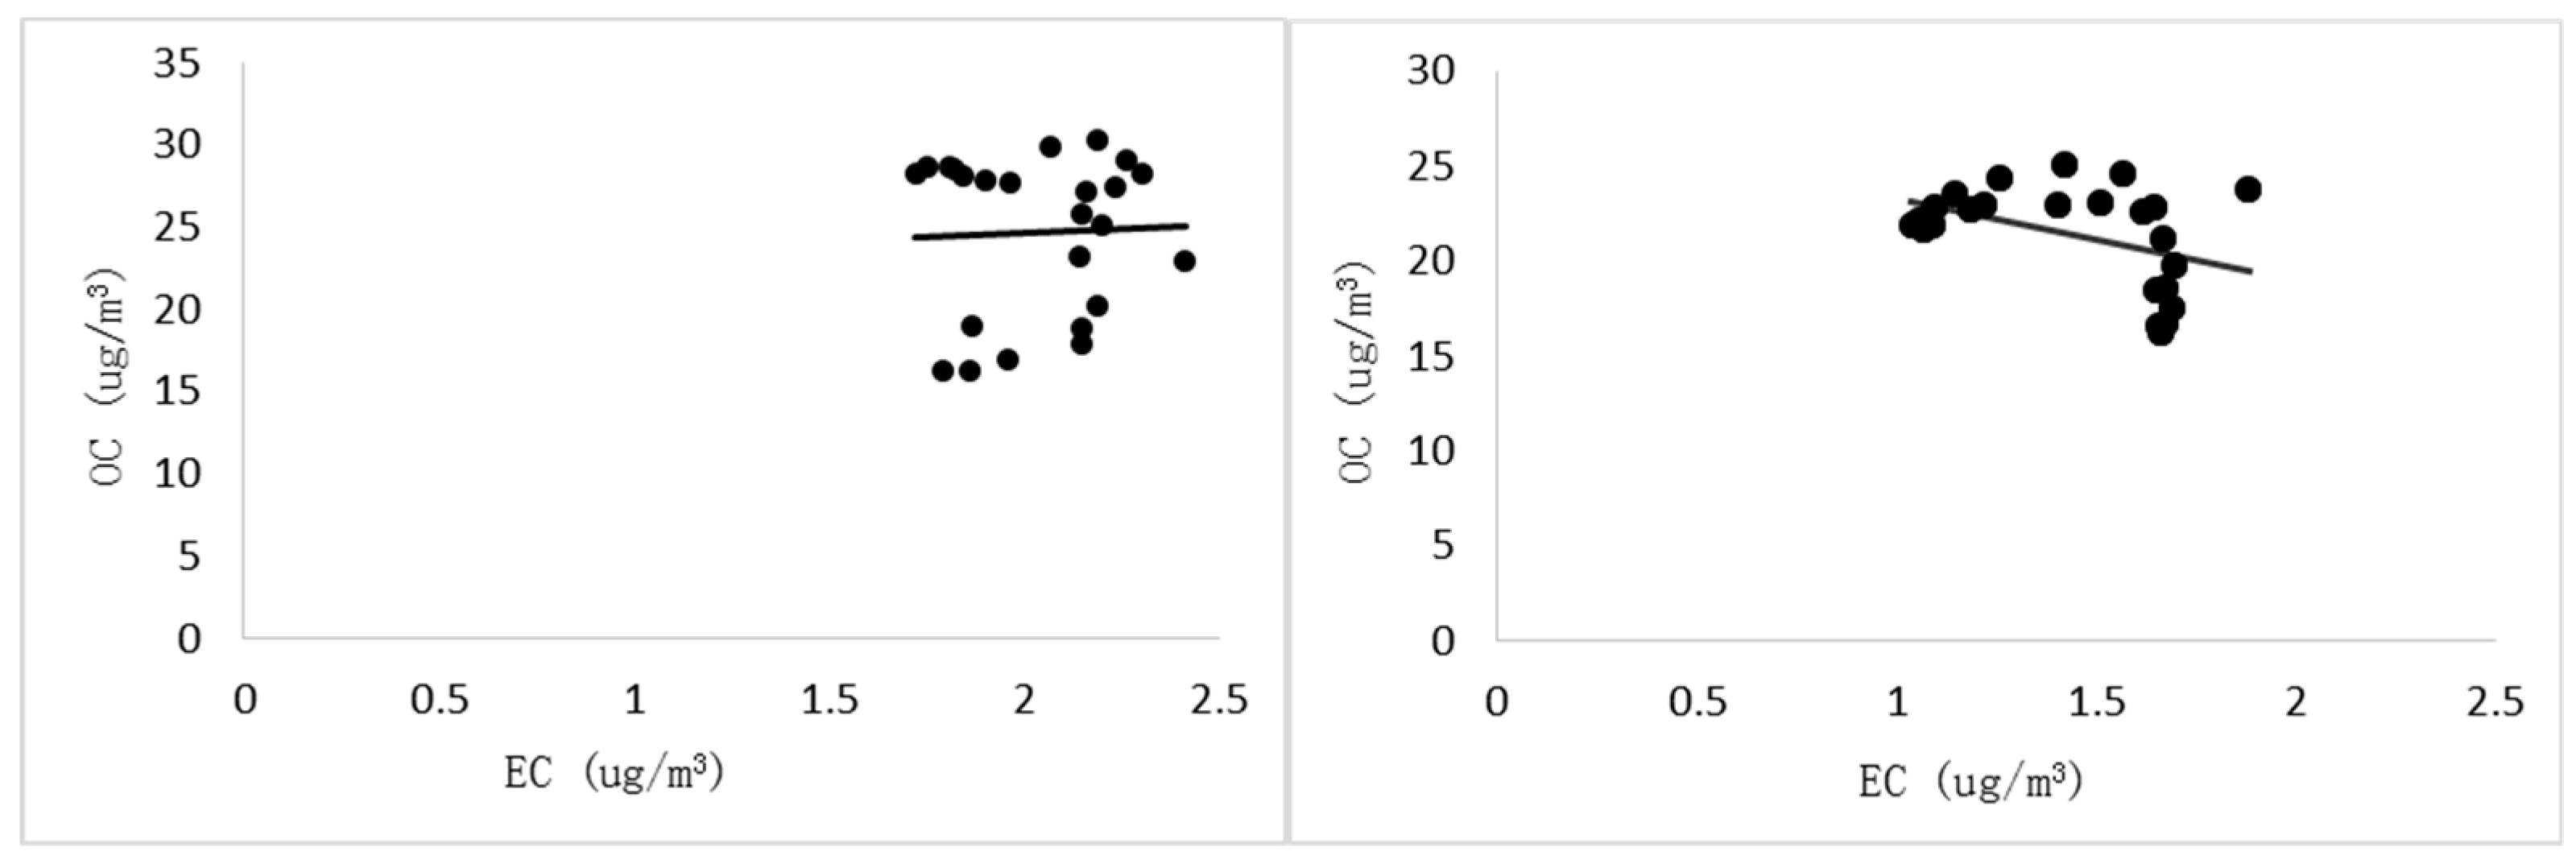
3.4. Relationship between Organic Carbon and Elemental Carbon
4. Conclusion
Author Contributions
Funding
Acknowledgments
Conflicts of Interest
References
- Zhou, C.W.; Huang, H.; Cao, J.J. Summary of basic characteristics of atmospheric aerosol carbonaceous. Environ. Pollut. Control 2006, 28, 270–274. [Google Scholar]
- Gray, H.A.; Cas, G.R. Source contribution to atmospheric fine carbon particle concentrations. Atmos. Environ. 1998, 32, 3805–3825. [Google Scholar] [CrossRef]
- Duan, F.K.; He, K.B.; Liu, X.D.; Dong, S.P.; Yang, F.M. Progress of carbonaceous aerosols: Black carbon and organic carbon. J. Environ. Eng. 2007, 1, 1–8. [Google Scholar]
- Cai, S. Golden Year of Environmental Protection Industry. China New Era. 2014, 2, 26. [Google Scholar]
- Lin, X.N. Study on Carcinogenic Heavy Metals and Carbon Components in PM2.5 in Guiyang City; Guizhou Normal University: Guizhou, China, 2017. [Google Scholar]
- Menon, S.; Hansen, J.; Nazarenko, L.; Luo, Y. Climate effects of black carbon aerosols in China and India. Science 2002, 297, 2250–2253. [Google Scholar] [CrossRef] [PubMed]
- Viana, M.; Maenhaut, W.; Ten Brink, H.M.; Chi, X.; Weijers, E.; Querol, X.; Alastuey, A.; Mikuska, P.; Vecera, Z. Comparative analysis of organic and elemental carbon concentrations in carbonaceous aerosols in three European cities. Atmos. Environ. 2007, 41, 5972–5983. [Google Scholar] [CrossRef]
- Srinivas, B.; Sarin, M.M. PM2.5 EC and OC in atmospheric outflow from the Indo-Gangetic Plain: Temporal variability and aerosol organic carbon-to-organic mass conversion factor. Sci. Total Environ. 2014, 487, 196–205. [Google Scholar] [CrossRef]
- Ham, J.; Lee, H.J.; Cha, J.W.; Ryoo, S.B. Potential source of PM10, PM2.5, and OC and EC in Seoul during spring 2016. Atmosphere 2017, 27, 41–54. [Google Scholar] [CrossRef]
- Gao, J.J.; Wang, K.; Wang, Y.; Liu, S.; Zhu, C.; Hao, J.; Liu, H.; Hua, S.; Tian, H. Temporal-spatial characteristics and source apportionment of PM2.5 as well as its associated chemical species in the Beijing-Tianjin-Hebei region of China. Environ. Pollut. 2018, 233, 714–724. [Google Scholar] [CrossRef]
- Yan, D.H.; Changchun Statistics Bureau. Changchun Statistical Yearbook-2016; China Statistical Press: Changchun, China, 2016.
- Zhang, Y.H.; Wang, F.D.; Zhao, Q.B.; Cui, H.X.; Li, J.; Duan, Y.S.; Fu, Y.Q. Characteristics and sources of organic carbon and elemental carbon in PM2.5 in Shanghai city. Environ. Sci. 2014, 35, 3263–3270. [Google Scholar]
- Chen, K.; Yin, Y.; Wei, Y.X.; Yang, W.F. Carbon components in PM2.5 of Nanjing atmosphere. China Environ. Sci. 2010, 30, 1015–1020. [Google Scholar]
- Wang, J.Z.; Ho, S.S.H.; Gao, J.J.; Huang, R.J.; Zhou, J.M.; Zhao, Y.Z.; Xu, H.M.; Liu, S.X.; Wang, G.H.; Shen, Z.Z.; et al. Characteristics and major sources of carbonaceous aerosols in PM2.5 from Sanya, China. Sci. Total Environ. 2015, 530–531, 110–119. [Google Scholar] [CrossRef] [PubMed]
- Yu, J.H.; Yu, T.; Yang, X.G.; Shi, J.G.; Wang, X. Pollution characteristics of elemental carbon and organic carbon in PM2.5 in winter in Beijing. Environ. Sci. Res. 2004, 17, 48–50, 55. [Google Scholar]
- Wang, F.; Han, J.; Zhang, J.; Han, J.C.; Xin, Y.J. Pollution characteristics of organic carbon and elemental carbon in PM2.5 of Xi’an urban area. Sci. Environ. Prot. 2015, 41, 80–85. [Google Scholar]
- Ding, Q.; Liu, J.G.; Lu, Y.H.; Lu, F.; Wang, Y.P.; Shi, J.G.; Shen, Y. Analysis of atmospheric particulate matter and carbon composition in Heshan during the Asian games in Guangzhou. Environ. Sci. Technol. 2012, 35, 43–49. [Google Scholar]
- Liu, H.; Zhang, J.Q.; Zhang, Y.; Zhan, C.L.; Zheng, J.R.; Yao, R.Z.; Xiao, W.S.; Cao, J.J. Characteristics of organic carbon and elemental carbon pollution in atmospheric PM10 and PM2.5 during summer in Huangshi city. J. Environ. Sci. 2014, 34, 36–42. [Google Scholar]
- Han, D.W.; Wang, S.Q.; An, W. Carbon composition and characteristics analysis of PM2.5 in the ambient air of Jinan city. J. China Environ. Manag. Cadre Inst. 2012, 22, 42–44. [Google Scholar]
- Bao, Y.Y. Seasonal variation characteristics and source analysis of organic carbon and elemental carbon in PM2.5 in Dalian. Environ. Sci. Manag. 2017, 42, 130–133. [Google Scholar]
- Guo, Y.H.; Xin, J.Y.; Wang, Y.S.; Wen, T.X.; Li, X.R.; Feng, X.X. Observation of airborne particulate matter Tangshan OC\EC spectral distribution of concentration. Environ. Sci. 2013, 34, 2497–2504. [Google Scholar]
- Du, B.H.; Huang, X.F.; He, L.Y.; Hu, M.; Wang, C.; Ren, Y.C.; Ying, H.M.; Zhou, J.; Wang, W.F.; Xu, D.D. Temporal and spatial distribution characteristics and secondary organic carbon estimation of carbon components in PM2.5 of Ningbo. Environ. Sci. 2015, 36, 3128–3134. [Google Scholar]
- Cheng, H.R.; Wang, Z.W.; Feng, J.L.; Chen, H.L.; Zhang, F.; Liu, J. Carbon composition and source analysis of atmospheric PM2.5 in Wuhan urban area. J. Eco-Environ. 2012, 21, 1574–1579. [Google Scholar]
- Bao, Z.; Feng, Y.C.; Jiao, L.; Hong, S.M.; Liu, W.G. Characteristics and sources of atmospheric PM2.5 and PM10 pollution in Hangzhou. China Environ. Monit. 2010, 26, 44–48. [Google Scholar]
- Meng, S.Y.; Jia, X.F.; Zhang, R.J.; Yu, X.M.; Ma, Q.L. Physicochemical characteristics of PM2.5 in the Lin’an regional background station of the the Yangtze River Delta. J. Appl. Meteorol. 2012, 23, 424–432. [Google Scholar]
- Chen, Y.T.; Chen, J.S.; Hu, G.R.; Xu, L.L.; Yin, L.Q.; Zhang, F.W. Pollution Characteristics of Organic Carbon and Elemental Carbon in Winter PM2.5 of Three Major Cities in Fujian Province. Environ. Sci. 2013, 34, 1988–1994. [Google Scholar]
- Zhang, G.X.; Yan, Y.L.; Guo, L.L.; He, Q.S.; Chen, L.G. Carbon composition and variation characteristics of atmospheric PM2.5 in Taiyuan. Journal 2015, 36, 780–786. [Google Scholar]
- Huang, X.F.; Yun, H.; Gong, Z.H.; Li, X.; He, L.Y.; Zhang, Y.H.; Hu, M. Analysis of atmospheric PM2.5 source and secondary organic aerosol estimation in Shenzhen. Chin. Sci. 2014, 44, 723–734. [Google Scholar]
- Chen, Y.; Xie, S.; Luo, B.; Zhai, C. Characteristics and origins of carbonaceous aerosol in the Sichuan Basin, China. Atmos. Environ. 2014, 94, 215–223. [Google Scholar] [CrossRef]
- Shan, S.; Chen, L.; Pu, M.H.; Wang, S.; Wang, S. Analysis of temperature changes in recent 55 years in Jilin province. Agric. Technol. 2017, 37, 143. [Google Scholar]
- Fang, C.S.; Zhang, Z.D.; Jin, M.Y.; Zou, P.C.; Wang, J. Pollution characteristics of PM2.5 aerosol during haze periods in Changchun, China. Aerosol Air Qual. Res. 2017, 17, 888–895. [Google Scholar] [CrossRef]
- Huang, J.L.; Chen, Z.M.; Mo, Z.Y.; Li, H.J.; Yang, J.C.; Liu, H.L.; Mao, J.Y.; Liang, G.Y.; Zhang, D.B.; Wu, X.P.; et al. Analysis of pollution characteristics of organic carbon and elemental carbon in atmospheric PM10 and PM2.5 in Yulin, Guangxi Province. CNKI 2018, 39, 27–37. [Google Scholar]


| Name | Environmental Air Quality Functional Area | Major Source of Pollution (Area) | Wind Direction |
|---|---|---|---|
| CP | II | Urban and rural | Upwind |
| BFH | II | Industrial discharge | Upwind |
| IPT | II | Densely populated | Upwind |
| LP | II | Densely populated | Downwind |
| HZMC | II | Urban and rural | Upwind |
| DP | II | Industrial discharge | Upwind |
| JYP | I | Natural reserve | Side wind |
| EESA | II | Densely populated | Downwind |
| JZP | II | Vehicle emission | Downwind |
| SWZ | I | Background | Side wind |
| SAMS | II | Normally populated | Center |
| Regions | OC (µg/m3) | EC (µg/m3) |
|---|---|---|
| Beijing [15] | 19.7 | 2.3 |
| Xi’an [16] | 40.6 | 8.3 |
| Guangzhou [17] | 17.5 | 4.1 |
| Huangshi [18] | 11.89 | 2.28 |
| Shanghai | 8.6 | 2.4 |
| Jinan [19] | 16.98 | 5.81 |
| Dalian [20] | 31.85 | 6.38 |
| Nanjing | 11.8 | 2.9 |
| Sanya | 3.3 | 1.1 |
| Tangshan [21] | 28 | 11 |
| Ningbo [22] | 9 | 2.9 |
| Wuhan [23] | 19.24 | 2.9 |
| Hangzhou [24] | 13.7 | 15.9 |
| Linan [25] | 10.1 | 2.4 |
| Xiamen [26] | 17.7 | 30 |
| Taiyuan [27] | 65.2 | 23.5 |
| Shenzhen [28] | 8.3 | 4.7 |
| Chongqing [29] | 15.2 | 4.2 |
| Changchun | 21.7 | 1.85 |
| Period | OC (µg/m3) | EC (µg/m3) | ||||||
|---|---|---|---|---|---|---|---|---|
| Max | Min | Mean | SD | Max | Min | Mean | SD | |
| Spring | 25.45 | 14.72 | 20.62 | 20.62 ± 3.19 | 1.62 | 0.79 | 1.26 | 1.26 ± 0.29 |
| Summer | 24.91 | 16.41 | 21.15 | 21.15 ± 2.56 | 1.84 | 0.98 | 1.35 | 1.35 ± 0.27 |
| Autumn | 27.48 | 16.99 | 23.85 | 23.85 ± 3.52 | 2.37 | 1.42 | 1.85 | 1.85 ± 0.27 |
| Winter | 32.23 | 14.38 | 24.03 | 24.03 ± 6.21 | 3.3 | 2.07 | 2.45 | 2.45 ± 0.38 |
| Period | OC (µg/m3) | EC (µg/m3) |
|---|---|---|
| Heating period | 24.68 | 2.04 |
| Non-heating period | 21.39 | 1.44 |
© 2019 by the authors. Licensee MDPI, Basel, Switzerland. This article is an open access article distributed under the terms and conditions of the Creative Commons Attribution (CC BY) license (http://creativecommons.org/licenses/by/4.0/).
Share and Cite
Wang, J.; Yu, A.; Yang, L.; Fang, C. Research on Organic Carbon and Elemental Carbon Distribution Characteristics and Their Influence on Fine Particulate Matter (PM2.5) in Changchun City. Environments 2019, 6, 21. https://0-doi-org.brum.beds.ac.uk/10.3390/environments6020021
Wang J, Yu A, Yang L, Fang C. Research on Organic Carbon and Elemental Carbon Distribution Characteristics and Their Influence on Fine Particulate Matter (PM2.5) in Changchun City. Environments. 2019; 6(2):21. https://0-doi-org.brum.beds.ac.uk/10.3390/environments6020021
Chicago/Turabian StyleWang, Ju, Anan Yu, Le Yang, and Chunsheng Fang. 2019. "Research on Organic Carbon and Elemental Carbon Distribution Characteristics and Their Influence on Fine Particulate Matter (PM2.5) in Changchun City" Environments 6, no. 2: 21. https://0-doi-org.brum.beds.ac.uk/10.3390/environments6020021