A Statistical and Spatial Analysis of Portuguese Forest Fires in Summer 2016 Considering Landsat 8 and Sentinel 2A Data


1
Department Geosciences, Environment and Land Planning Faculty of Sciences, Rua Campo Alegre, University of Porto, 4169-007 Porto, Portugal
2
Earth Sciences Institute (ICT), Faculty of Sciences, Rua Campo Alegre, University of Porto, 4169-007 Porto, Portugal
*
Author to whom correspondence should be addressed.
Environments 2019, 6(3), 36; https://0-doi-org.brum.beds.ac.uk/10.3390/environments6030036
Submission received: 29 January 2019
/
Revised: 6 March 2019
/
Accepted: 12 March 2019
/
Published: 16 March 2019
(This article belongs to the Special Issue Application of Remote Sensing and GIS in Environmental Studies)
Abstract
:Forest areas in Portugal are often affected by fires. The objective of this work was to analyze the most fire-affected areas in Portugal in the summer of 2016 for two municipalities considering data from Landsat 8 OLI and Sentinel 2A MSI (prefire and postfire data). Different remote sensed data-derived indices, such as Normalized Difference Vegetation Index (NDVI) and Normalized Burn Ratio (NBR), could be used to identify burnt areas and estimate the burn severity. In this work, NDVI was used to evaluate the area burned, and NBR was used to estimate the burn severity. The results showed that the NDVI decreased considerably after the fire event (2017 images), indicating a substantial decrease in the photosynthesis activity in these areas. The results also indicate that the NDVI differences (dNDVI) assumes the highest values in the burned areas. The results achieved for both sensors regarding the area burned presented differences from the field data no higher than 13.3% (for Sentinel 2A, less than 7.8%). We conclude that the area burned estimated using the Sentinel 2A data is more accurate, which can be justified by the higher spatial resolution of this data.
1. Introduction
Europe’s Mediterranean forests have, in the last summers (2016–2017), been extremely affected by large and devastating fires [1,2,3]. The high frequency at which forest fires have occurred in recent years in Portugal increase the need for a better interpretation and mapping of fire-damaged areas. In Portugal, in the summers of 2016 and 2017, several districts were devastated by forest fires, where hundreds of hectares were burnt, destroying goods and taking human lives. Therefore, it is crucial to estimate fire-damaged areas in order to implement effective fire management plans and to identify areas that need to be recovered. The identification of fire-affected areas should be done quickly, accurately, and at low cost in order to be effective.
Dealing with postfire studies, there is terminology associated with fire intensity, fire severity, and burn severity that should be introduced [4]. Fire intensity describes the physical combustion process of energy release from organic matter [5]. Several definitions of fire severity have been proposed in the literature, generally related to the degree of environmental change caused by fire [5,6]. Remote sensing studies have found a good correlation between NDVI and fire severity estimation based on biomass loss [7]. The term fire severity provides a description of how fire intensity affected ecosystems, particularly following wildfires where direct information on fire intensity was absent and effects are often quite variable within and between different ecosystems [5]. The term burn severity caused some confusion with fire severity, because it is often based on similar metrics [8]. The term burn severity is usually restricted to the loss of organic matter in or on the soil surface [5]. Remote sensing applications to assess burned areas typically use the term burn severity rather than fire severity. More details about fire terminology can be found in Keeley [5].
Earth Observation (EO) data, particularly satellite images and derived products combined with image processing techniques, is becoming more used in the identification of forest fire damaged areas [4]. Satellite images have been used to assess the conditions before and after forest fires events and to detect changes in postfire spectral responses, considering the vegetation response [9,10].
Most of the studies involving burn severity and remotely sensed data are based on the Red (R), Near Infrared (NIR) and Short Wave Infrared (SWIR) spectral regions of the electromagnetic spectrum, because the chlorophyll decrease associated with this phenomenon leads to major changes in these wavelengths [11].
The satellite datasets generally used for mapping the postfire effects are the Moderate Resolution Imaging Spectroradiometer (MODIS) [9], Landsat Thematic Mapper/Enhanced Thematic Mapper Plus (TM/ETM+) [12], Advanced Spaceborne Thermal Emission and Reflection Radiometer (ASTER) [13], Landsat 8 Operational Land Imager (OLI) [10], and more recently, Sentinel 2 Multispectral Instrument (MSI) [14,15]. Comparing the last two sensors, they record data in similar wavelengths, however, Sentinel 2 (A and B) has a higher spatial and temporal resolution (10/20 m vs. 30 m and 5 days vs. 16 days).
Threshold-based classification of differenced Normalized Burn Ratio (dNBR) [16] has been widely used to obtain burn severity maps [1,17] and to estimate forest fire damage areas. This ratio considers the NIR and SWIR spectral regions, since they are less sensitive to atmospheric effects, and can accurate quantify the vegetation affected and the reduction of canopy moisture and canopy shadow, i.e., a decrease in NIR regions and increase in SWIR region in the postfire scenario [15]. Despite its worldwide use and the good results achieved in several studies, several problems were verified [16]: (i) the scene selection for the prefire and postfire analysis is not an easy task. Scene pairs should represent similar phenology and moisture content; (ii) they should not exhibit between-scene land-cover changes; and (iii) prefire and postfire images should be cloud-free [16].
Different remote sensed vegetation indices, such as Normalized Difference Vegetation Index (NDVI) and Enhanced Vegetation Index (EVI), have been used in order to identify burnt areas. Chuvieco et al. [18] assess the accuracy of different vegetation indices (NDVI, Soil Adjusted Vegetation Index (SAVI)) for burned land mapping. Six Landsat TM and two NOAA Advanced very-high-resolution radiometer (AVHRR) images were considered that correspond to prefire and postfire conditions for several burned areas in Mediterranean countries (Italy, Greece, and Spain). Escuin et al. [19] analyzed the capacity of NBR and NDVI indices derived from Landsat TM/ETM images for fire severity assessment in three fires that occurred in southern Spain. Dragozi et al. [20] investigated the potential of GeoEye images on detecting the field-measured burn severity of a forest fire in Evros (Greece) during 2011. Results showed that remotely-sensed NDVI-based variables are able to encapsulate burn severity variability over time. Soulard et al. [21] summarized NDVI every 16 days across the 28-year Landsat TM time series for 26 meadows, from 1985 to 2012. Results indicate that NDVI values were significantly lower at the 95% confidence level for burned meadows following the fire date, yet not significantly lower at the 95% confidence level in the unburned meadows. Navarro et al. [14] presents the preliminary results of the assessment of several spectral indices, including NDVI, Green Normalized Difference Vegetation Index (GNDVI), NBR, and Normalized Difference Vegetation Index, using red-edge spectral bands (NDVIreXn) to assess the postfire conditions in order to evaluate the burn severity of Madeira island (Portugal) fires during August 2016, considering Sentinel 2A data. Also, several review papers proved that remote sensing-based monitoring of postfire effects is an effective approach [22].
The combination of remote sensing data with geographical information systems (GIS) is quite obvious, since GIS provide tools to integrate and manipulate spatial information [23], and adequate spatial processing algorithms that allow, for instance, estimation of remote sensed vegetation indices and visualization of the results [24].
The main objective of this work was to analyze the potential of Landsat 8 and Sentinel 2A data in order to estimate fire-damaged areas in Portugal considering NDVI and NBR. Satellite data from 2016 and 2017 from two municipalities (Arouca and Vila Nova de Cerveira) highly affected by forest fires in the summer of 2016 were chosen for this analysis. The NDVI was firstly used to evaluate the area burned. After, the dNBR was computed in order to evaluate the burn severity. All the analysis was performed in a GIS open source (QGIS) environment. The main innovation of this work lies in the comparison of the sensitivity of the two sensors tested in the computation of NDVI and dNBR [25,26] and in the retrieve of the areas burned areas, considering that the two sensors record data in similar wavelengths, however, Sentinel 2A has a higher spatial resolution (10 m vs. 30 m).
2. Materials and Methods
2.1. Study Area and Dataset
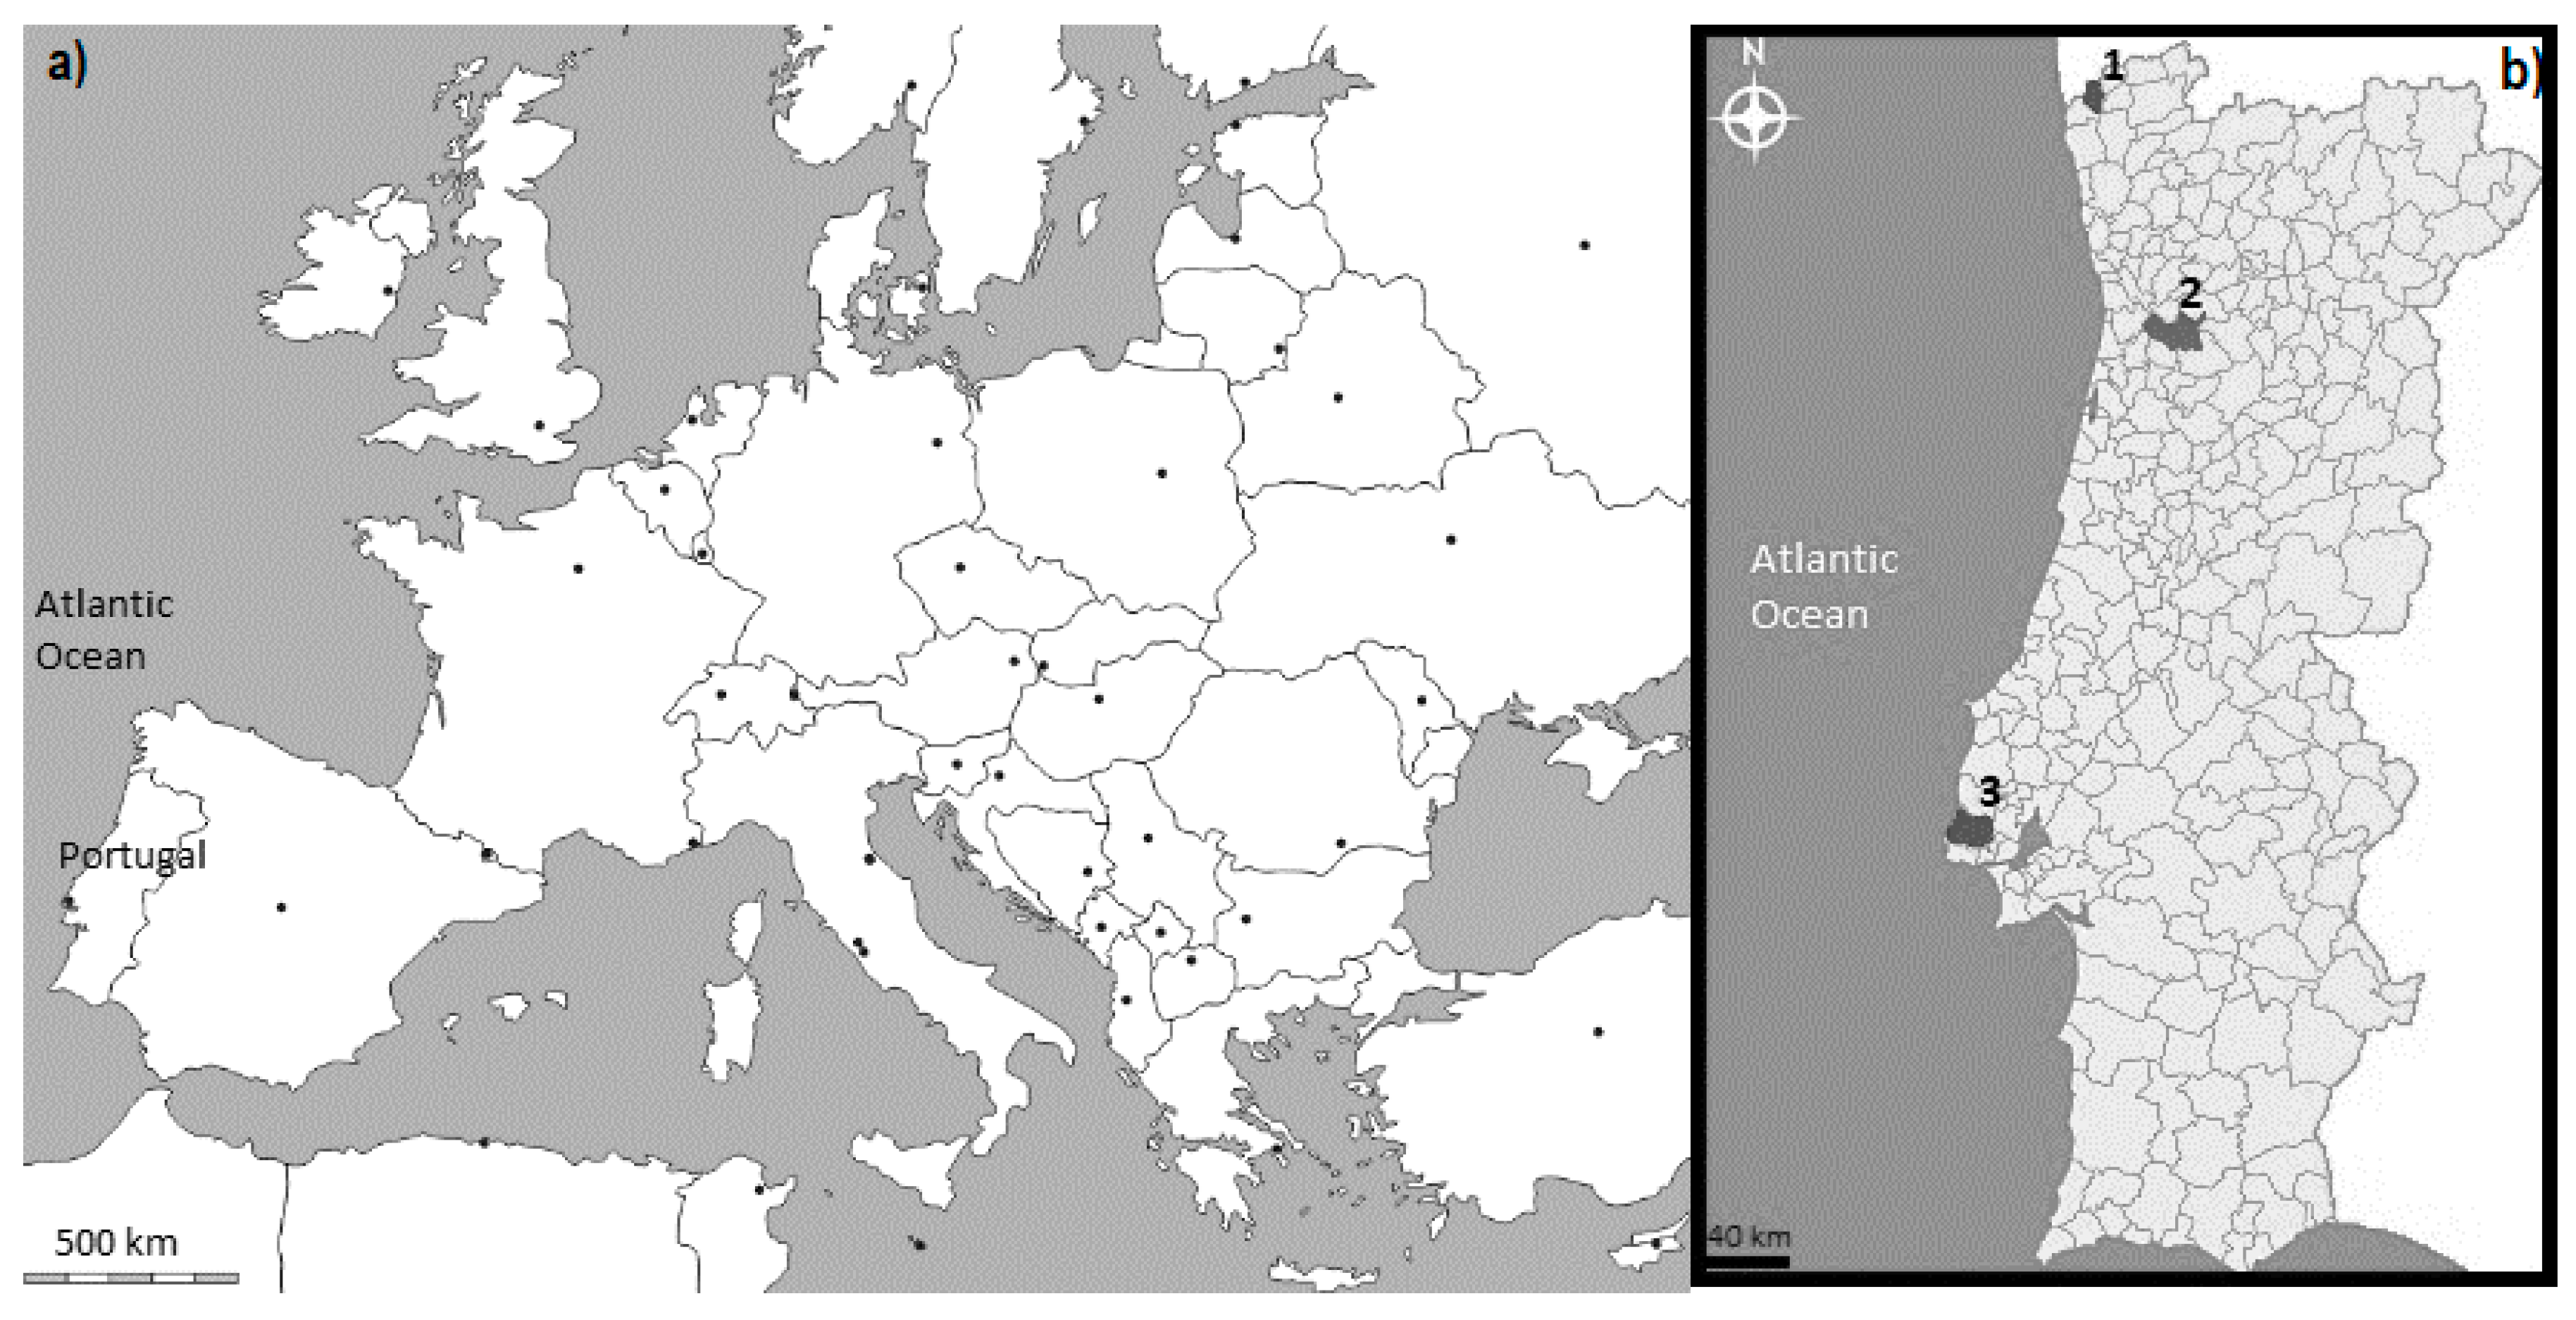
On the 11th of August 2016, a strong fire was recorded in Arouca municipality. Five days later, on 16 August 2016, another devastating fire affected Vila Nova de Cerveira (V. N. Cerveira) municipality. The study area considered in this work includes the municipality of Arouca (WGS 84 lat/lon: 40°55′29′′ N; 8°14′23′′ W), from Aveiro district and the municipality of V. N. Cerveira (WGS 84 lat/lon: 41°56′34′′ N; 8°44′27′′ W) from Viana do Castelo district, both rural/forest areas located in the North of Portugal (Figure 1). Another municipality, Sintra (WGS 84 lat/lon: 38°48′11′′ N; 9°22′54′′ W) from Lisboa district was also considered in this study. There are no records of any fire in Sintra during this period. Therefore, Sintra was used as a control case. The main objective of considering Sintra as a control case is to prove that the NDVI values were not changed in the period considered.
Arouca has an area of 328 km2, where 76% of its territory is occupied by forest species, mainly by Erica spp and Pterospartum tridentatum (70% of the forest area). Mediterranean shrublands are highly fire resilient and historically have experienced high-severity fires [27]. In August 2016, the mean precipitation and temperature were 0.17 mm and 21.7 °C, respectively.
V. N. Cerveira has an area of 108.5 km2, where 40% of its territory is occupied by forest species, mainly Pinus pinaster (80% of the forest area). Pinus pinaster forests are considered fire-prone ecosystems [28,29]. In August 2016, the mean precipitation and temperature were 16.9 mm and 21.6 °C, respectively.
According to Koppen classification [30], both areas belong to Group C (Mediterran climates), specifically, warm-summer Mediterranean climate (Csb).
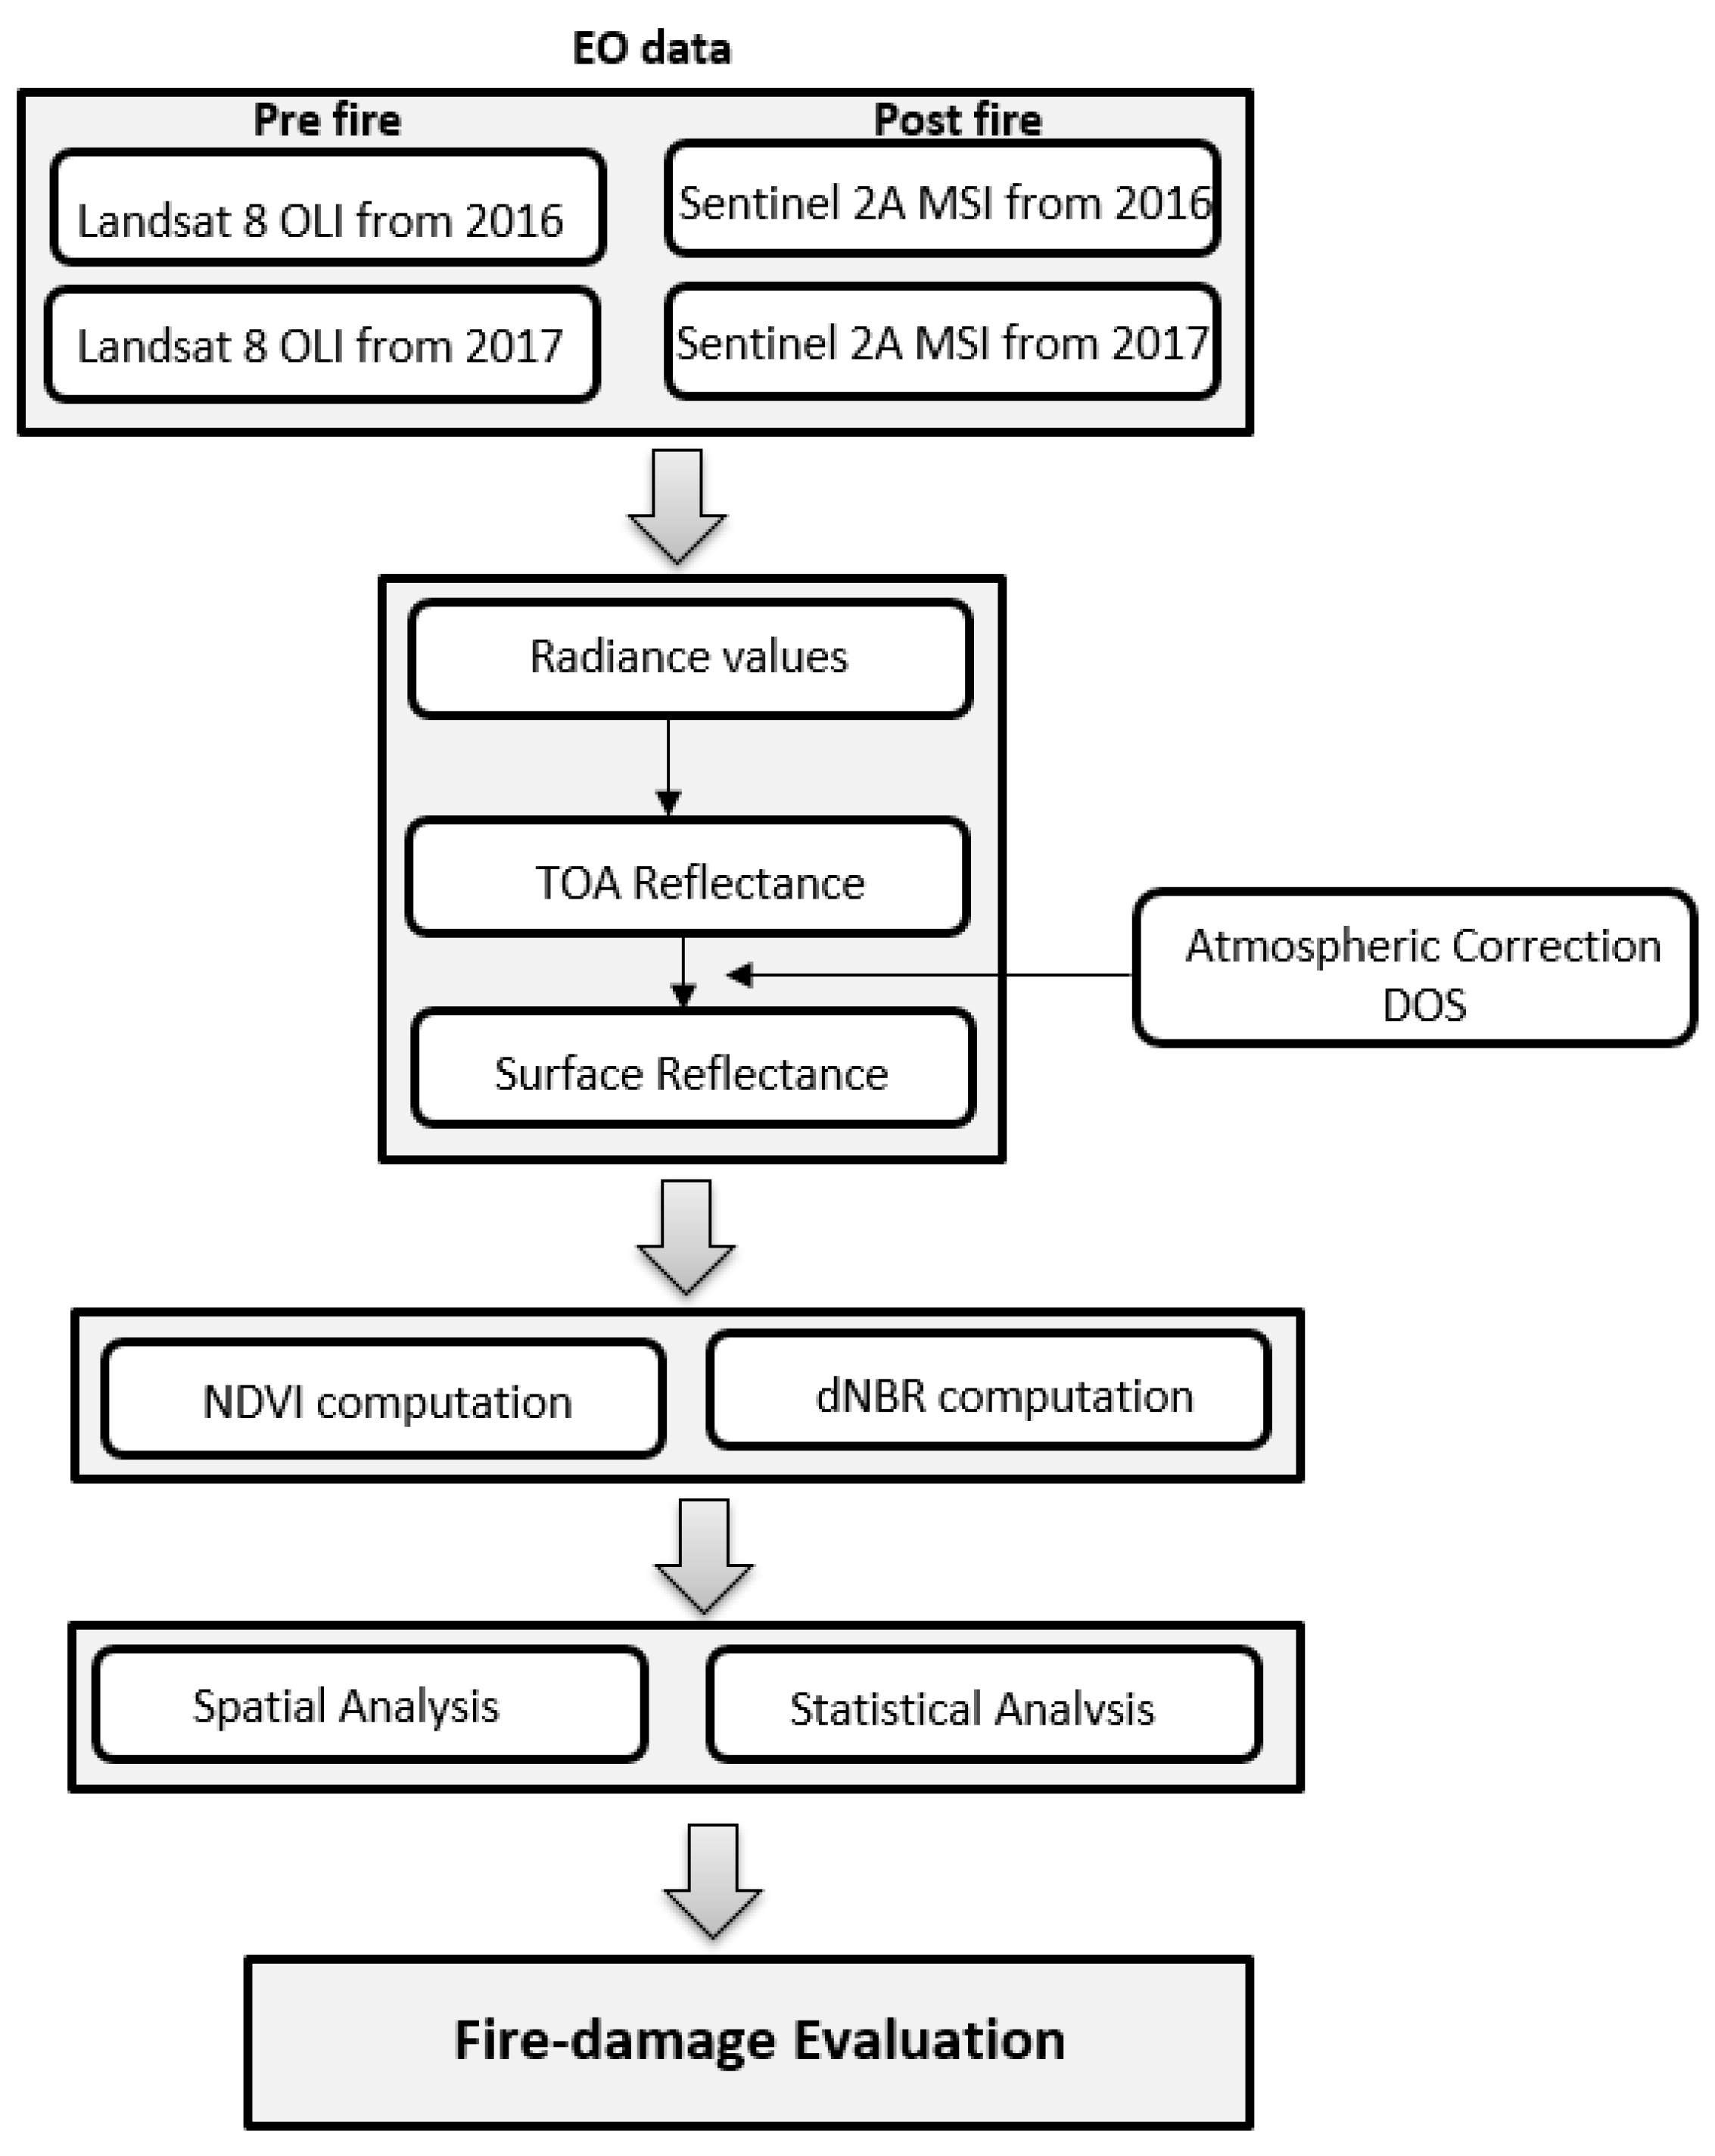
Two Sentinel 2A images, level 1C, and two Landsat 8 images, L1T, were downloaded and processed. Sentinel 2A was launched in 2015 and records data in 13 spectral bands (12-bits) with a temporal resolution of 10 days. The Landsat 8 OLI sensor was launched in 2013 and records data in 11 spectral bands (16-bits), with a 30 m of spatial resolution and 16-day temporal resolution. The main characteristics of these two sensors are listed in Table 1. The dataset for each municipality considers one prefire scene (range between March 2016 and July 2016) and one scene approximately of the same period in 2017 year, i.e., in a postfire condition (Table 2). The dataset acquisition date (almost in Spring) was chosen in order to maximize the NDVI values. The methodology followed in this work is shown in the flowchart presented in Figure 2.
2.2. Preprocessing
The image processing tasks were computed considering the QGIS plugin “Semi-Automatic Classification Plugin” (SCP) [31]. All the satellite images were radiometrically corrected and then were converted to surface reflectance by the dark object subtraction (DOS) method [32]. Landsat 8 OLI images are provided in radiance and scaled prior to output. The spectral radiance at the sensor’s aperture (𝐿𝜆) is given by Equation (1):
where 𝐿𝜆 is given in watts/(m2*ster*µm); ML is the band-specific multiplicative rescaling factor (provided in the metadata file); AL is the band-specific additive rescaling factor (provided in the metadata file); and Qcal is the quantized and calibrated standard product pixel values, i.e., DNs.
Radiance values were converted to Top Of Atmosphere (TOA) reflectance in order to reduce the between-scene variability through a normalization for solar irradiance. The TOA reflectance (𝜌TOA) can be estimated by:
where d is the Earth–sun distance in astronomical units (provided metadata file); 𝐸𝑆𝑈𝑁𝜆 is the mean solar exo-atmospheric irradiances; and 𝜃𝑠 is the solar zenith angle (in degrees). Sentinel 2A images (Level-1C) are already provided in TOA reflectance [33].
However, for both image sensors, the effects of the atmosphere should be considered in order to estimate the surface reflectance. To properly remove the atmospheric effects requires detailed information of atmospheric parameters, such as aerosols, water vapor, and ozone. A number of atmospheric correction methods have been developed considering radiative transfer algorithms and atmospheric characterization data [34,35]. However, atmospheric parameters are usually not available at the time of satellite pass, which limits the use of these models. In this work, Sentinel 2A MSI and Landsat 8 OLI TOA reflectance were converted to surface reflectance considering the dark-object subtraction (DOS) algorithm, proposed by Chavez [32]. This algorithm, an image-based atmospheric correction approach, is based on the fact that very few targets on the Earth’s surface are absolute black, so an assumed one-percent minimum reflectance is better than zero percent [32].
According to Sobrino et al. [36], based on the method developed by Chavez [32], the surface reflectance (𝜌sur) is given by Equation (3):
where Lsat is at-sensor radiance, Tz is the atmospheric transmissivity between the sun and the surface, Lp is the radiance resulted from the interaction of the electromagnetic radiance with the atmospheric components; and is expressed as:
where Lmin is the radiance that corresponds to a digital count value for which the sum of all the pixels with digital counts lower or equal to this value is equal to the 0.01% of all the pixels from the image considered. The term L1% is given in Equation (5):
There are several DOS techniques (e.g., DOS1, DOS2, DOS3, DOS4), based on different assumption of the Equation (3) parameters. The simplest technique is DOS1, which was employed in this work through the SCP. It is important to note that the accuracy of image-based techniques is lower than atmospheric-based algorithm corrections. However, they can be very useful when no atmospheric parameters are available.
2.3. Spectral Sensitivity
Global sensitivity and uncertainty analyses can highlight the uncertainty, sensitivity, and complexity of the data [37,38]. In this work, we follow a more simplistic approach—separability index (SI)—in order to assess the discriminatory ability of the two sensor bands and indices derived for burned area and fire severity estimation [15,39]. In the SI (Equation (6)), the μ term refers to the mean values for the band used for burned (b) and unburned (u) areas that were extracted within the study area, and the and are standard deviations of the respective bands for the same areas.
Values larger than 1 allow for a good separability, while values smaller than 1 suggest poor separability (poor discrimination). More details about this index can be found in [39].
2.4. NDVI Computation
NDVI is one of the most applied spectral indices and is used to monitor the seasonal vegetation changes and depends on vegetation reflectance properties, and is defined by Equation (7):
where 𝜌NIR and 𝜌Red are, respectively, the NIR band surface reflectance and Red band surface reflectance. The NDVI assumed values between −1 and +1, where dense and healthy vegetation shows higher values (close to 1 and typically higher than 0.2) and nonvegetated areas (bare soil) assume lower values (lower than 0.2). As a ratio, the NDVI has the advantage of minimizing several effects, such as variations in direct/diffuse irradiance, atmospheric conditions, topography, and atmospheric attenuation. In this work, the NDVI was computed for the Landsat 8 data and Sentinel 2A data pre and postfire event (Table 2) considering the surface reflectance values.
2.5. NBR Computation
In order to complement this study, the NBR and dNBR were computed for the two municipalities where a fire occurred, regarding the two datasets.
The NBR was defined to highlight areas that have burned and to index the burn severity using satellite images [5]. The equation used to compute NBR is very similar to NDVI except that it uses SWIR reflectance instead of a visible (Red) reflectance, as is given by Equation (8).
The dNBR is usually calculated by considering an image before the fire (burn) and ideally a second image after the burn. In this study, we use the same images considered in NDVI computation, so the post burn image is not immediately following the fire event. The prefire scenes should be taken within the same seasonal period (to match phenological period), as was done in this work. The burn severity is evaluated considering the difference between the NBR prefire and NBR postfire (dNBR). The dNBR is a quantitative measure of environmental change due to the fire [40]. It represents a scaled index of the magnitude of change caused by fire [41]. In order to interpret the dNBR, we use two classification levels. The first one is a wide classification level, proposed by USGS, and comprises seven classes, as shown in Table 3. The other classification level, also presented in Table 3, is also a standard classification of dNBR and comprises only 3 severity levels and is more adapted to the local species of Mediterranean conditions [25,42].
3. Results and Discussion
3.1. Spectral Sensitivity
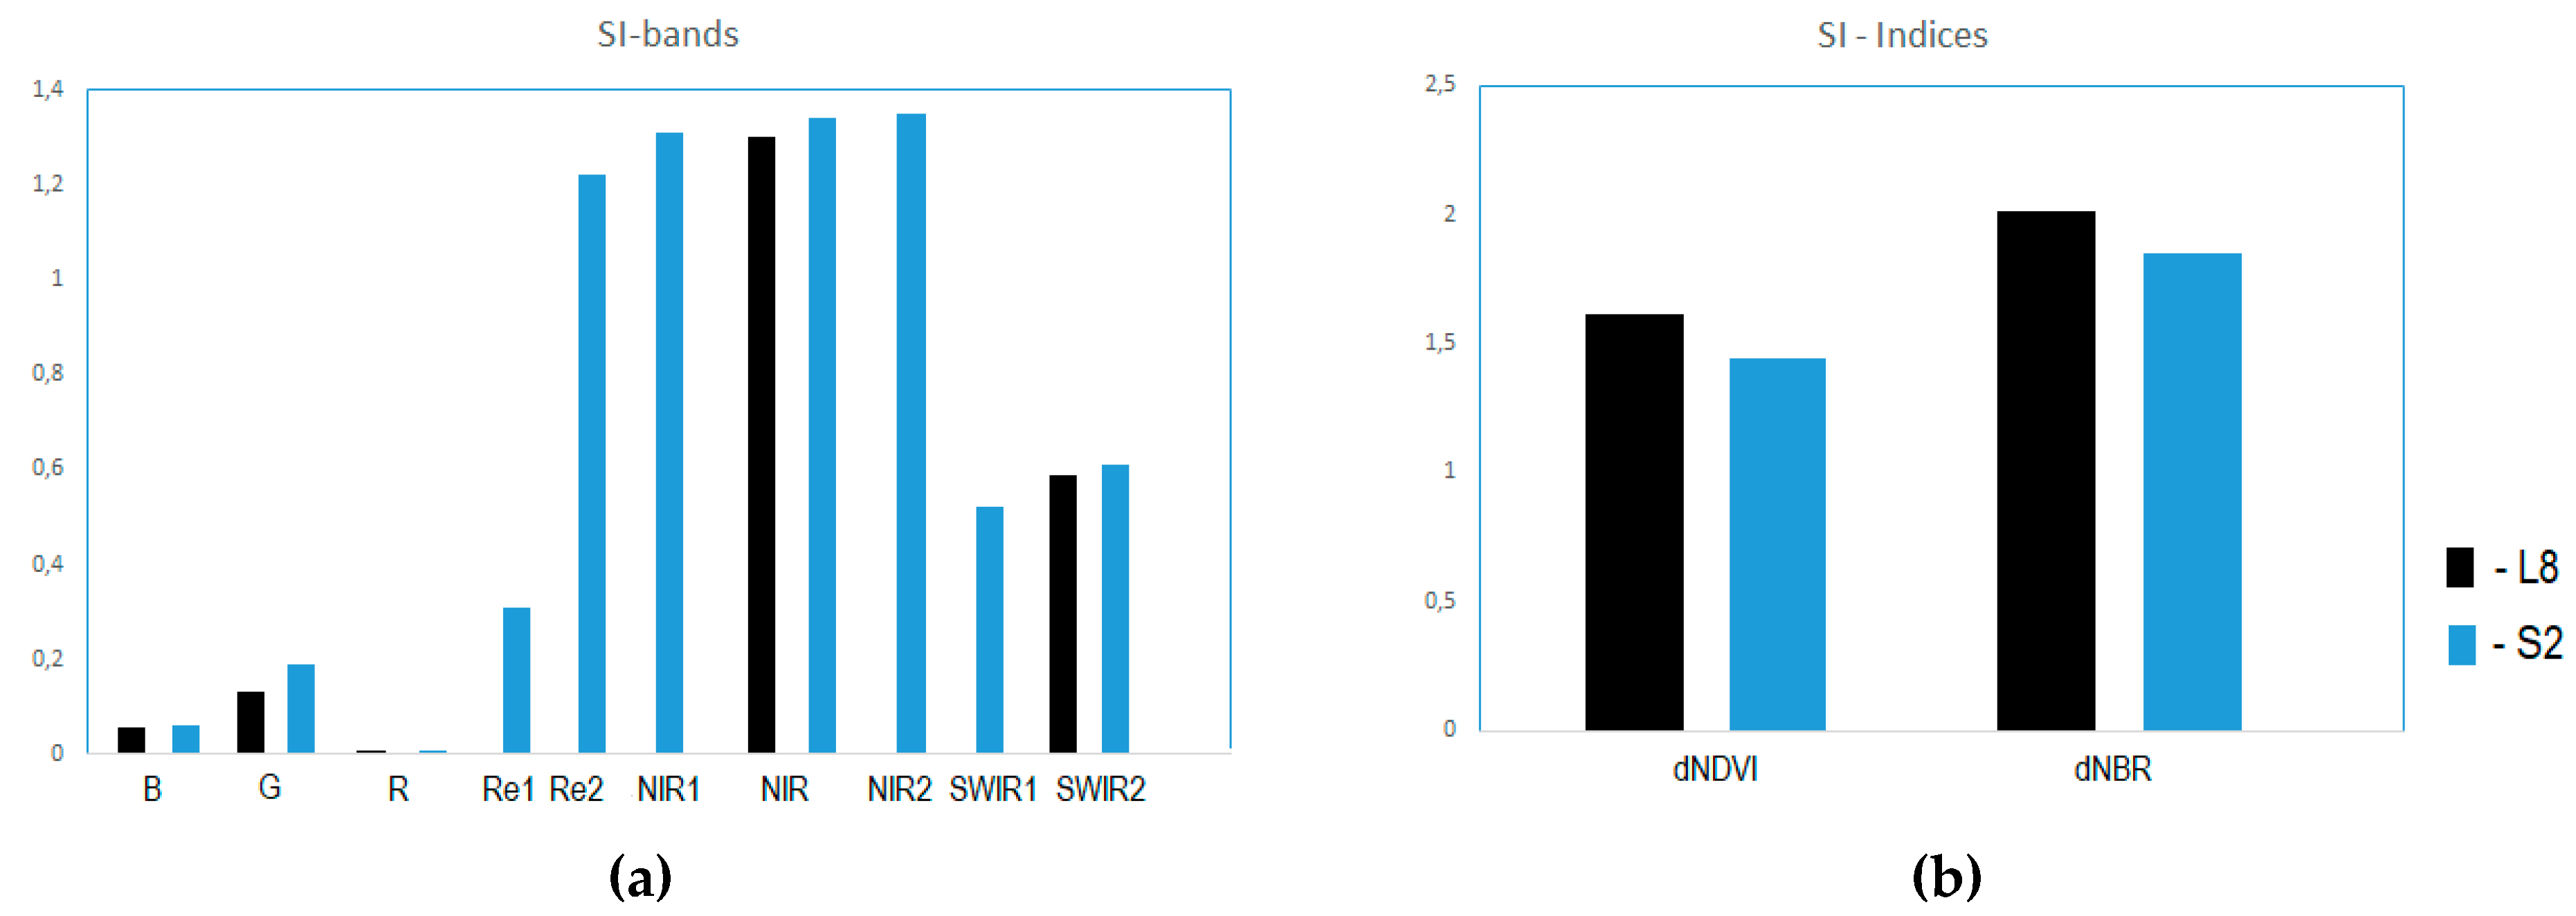
Figure 3 presents the separability analysis of the two sensors’ original bands and the two indices analyzed. In this paper, we only present the results for the Arouca municipality. The results for V.N Cerveira are very similar. For Sintra municipality, this analysis was not performed, since burned areas are not available.
In both sensors, the lowest separability was obtained in red (R) spectral bands, followed by blue (B) bands. The green (G) band presents, in both sensors, relatively higher values, but the value for Sentinel 2A is higher (Figure 3a). Only the Sentinel 2A sensor has bands in the Red Edge (Re1 and Re2). The separability of these two bands are very different. The Re1 presents a low separability value, while the Re2 presents a high value. As expected, all the NIR bands for both sensors present high separability values. NIR bands presented more efficient discrimination of burned–unburned areas due to their sensitivity in the reflectance of leaf pigments and ash deposition, respectively [15]. Regarding the SWIR bands, it is possible to observe that in both sensors, the longer SWIR band (SWIR2) provides better separability. In the NIR and SWIR bands, the separability values were slightly higher for Sentinel 2A. Analyzing the separability values for the two indices analyzed, the Landsat 8-based spectral indices presented slightly higher values of separability when compared to Sentinel 2A data. Regarding the two indices analyzed, the dNBR presents higher separability. The dNBR considers the SWIR2 reflectance instead of a visible (R) reflectance. These results are similar to previous studies that consider the same sensors and the same indices [15,43]. It is important to note that, although this sensitivity analysis was performed on all satellite bands, only the R, NIR, and SWIR2 bands were used to compute the two indices analyzed in this work.
3.2. Spatial Analysis
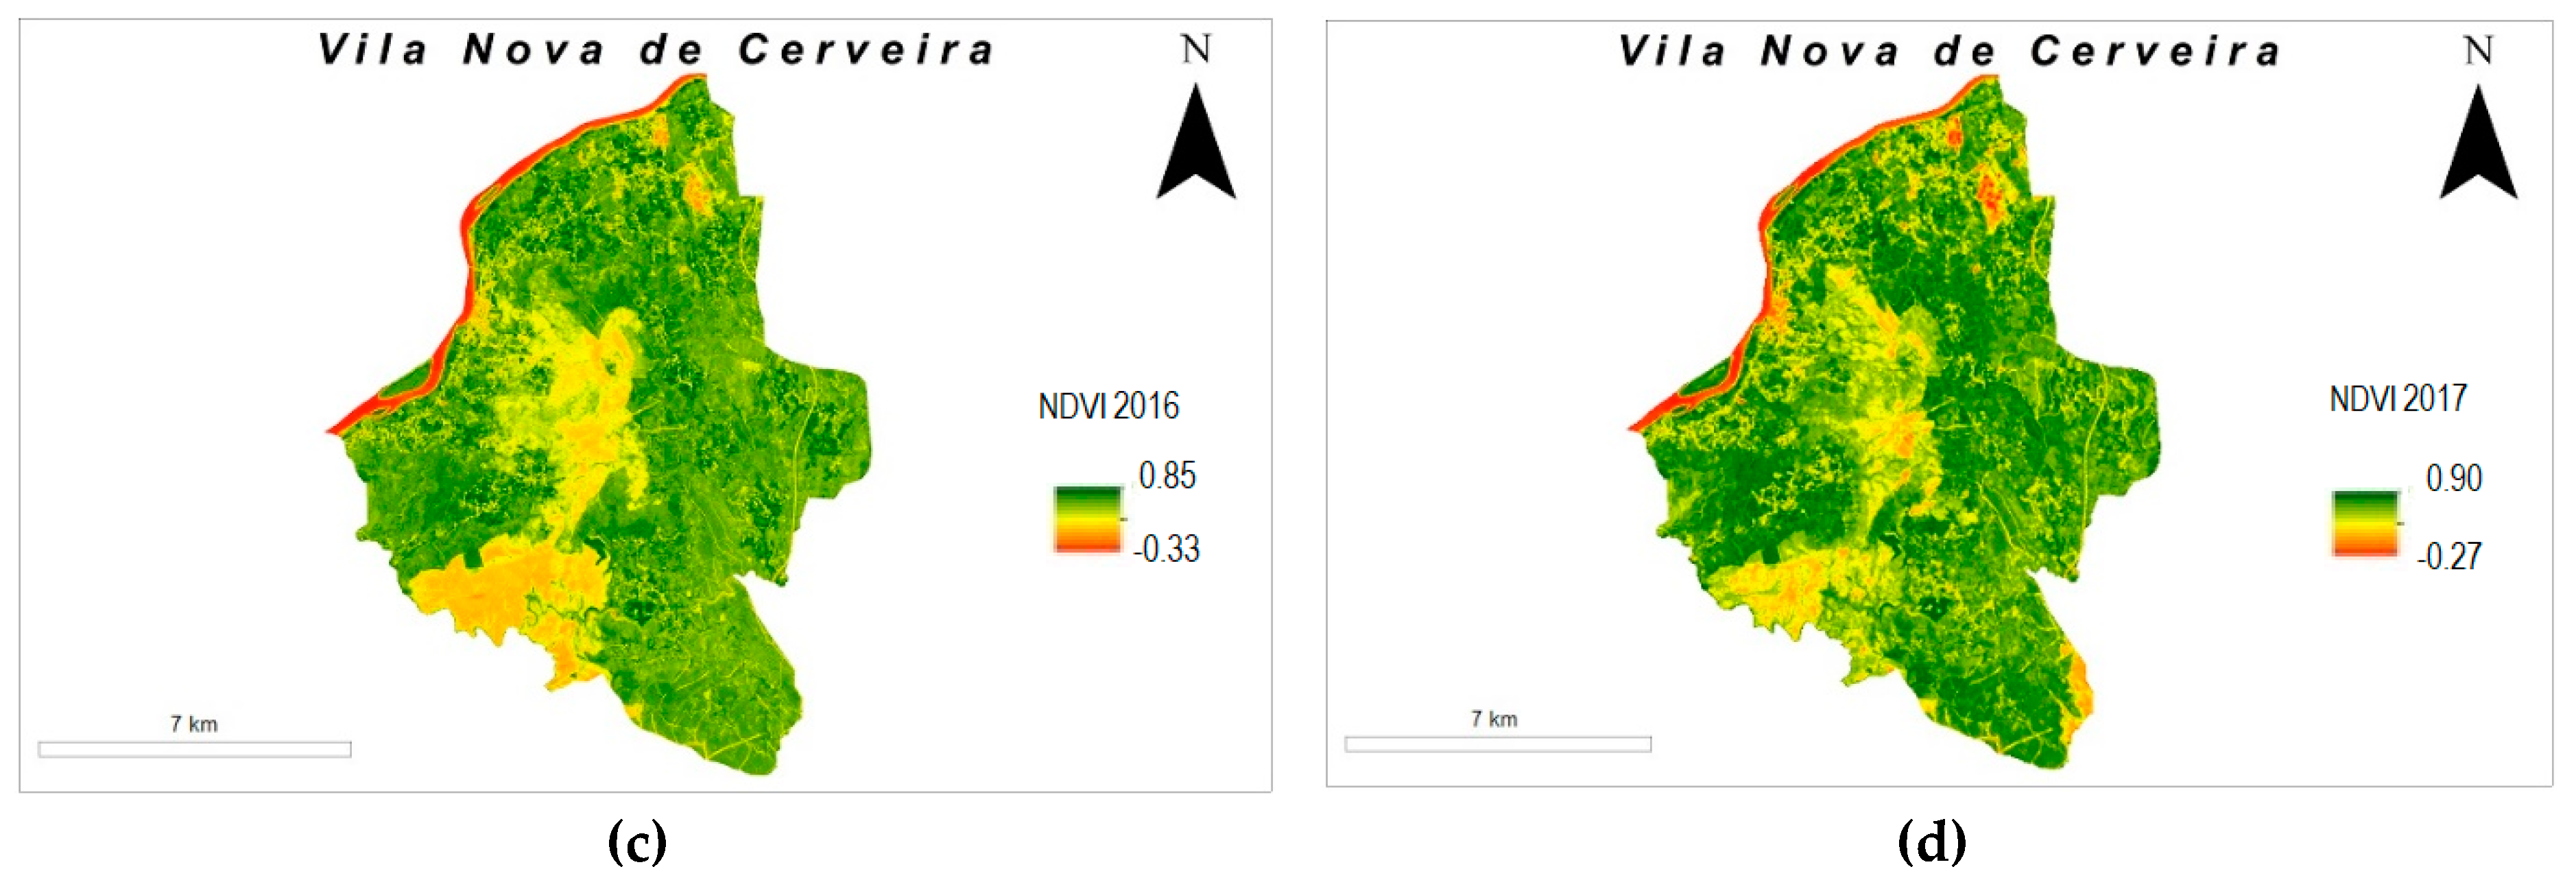
NDVI maps were generated for Arouca and V. N. Cerveira before (2016) and after (2017) the fire event. The NDVI maps considering Landsat 8 data for both municipalities are shown in Figure 4.
A general decrease in the NDVI values in Arouca in 2017 could be easily visualized (Figure 4b). The decrease in the NDVI values is not homogeneous across the municipality. The East and SE parts present a higher decrease in the NDVI, and an area which extends in the East–West direction shows more severe fire action. In V. N. Cerveira it is not possible, just by a visual interpretation of the NDVI maps presented in Figure 4c,d, to identify the areas more affected by the 2016 fire.
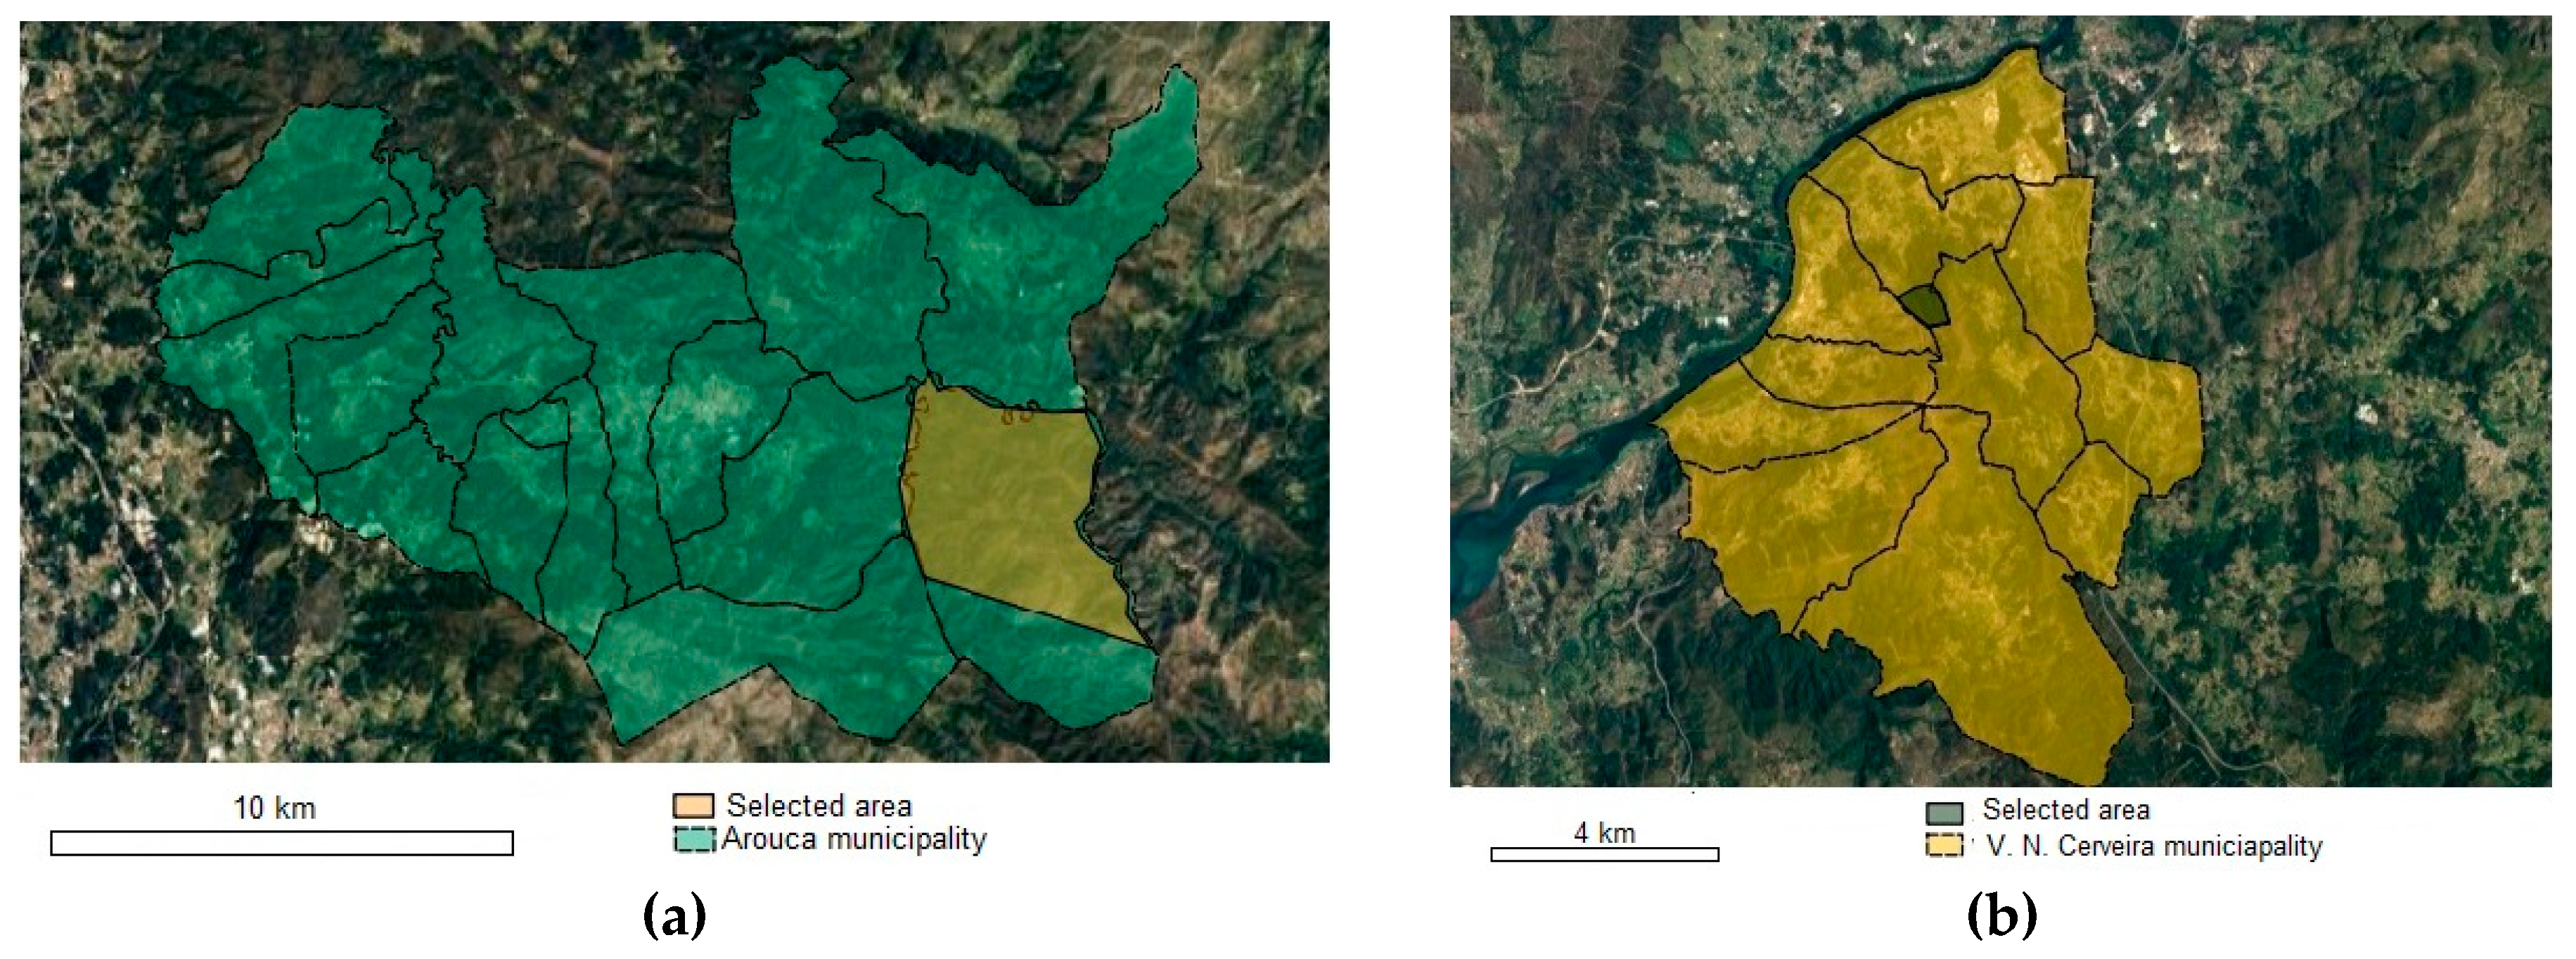
In order to perform a deeper analysis of postfire damage, specific areas from both municipalities very affected by the 2016 fires were selected for a further analysis (Figure 5). These two areas were chosen based on the field reports provided by the Portuguese institute of nature conservation and forests (ICNF—Instituto da Conservação da Natureza e Florestas) [45].
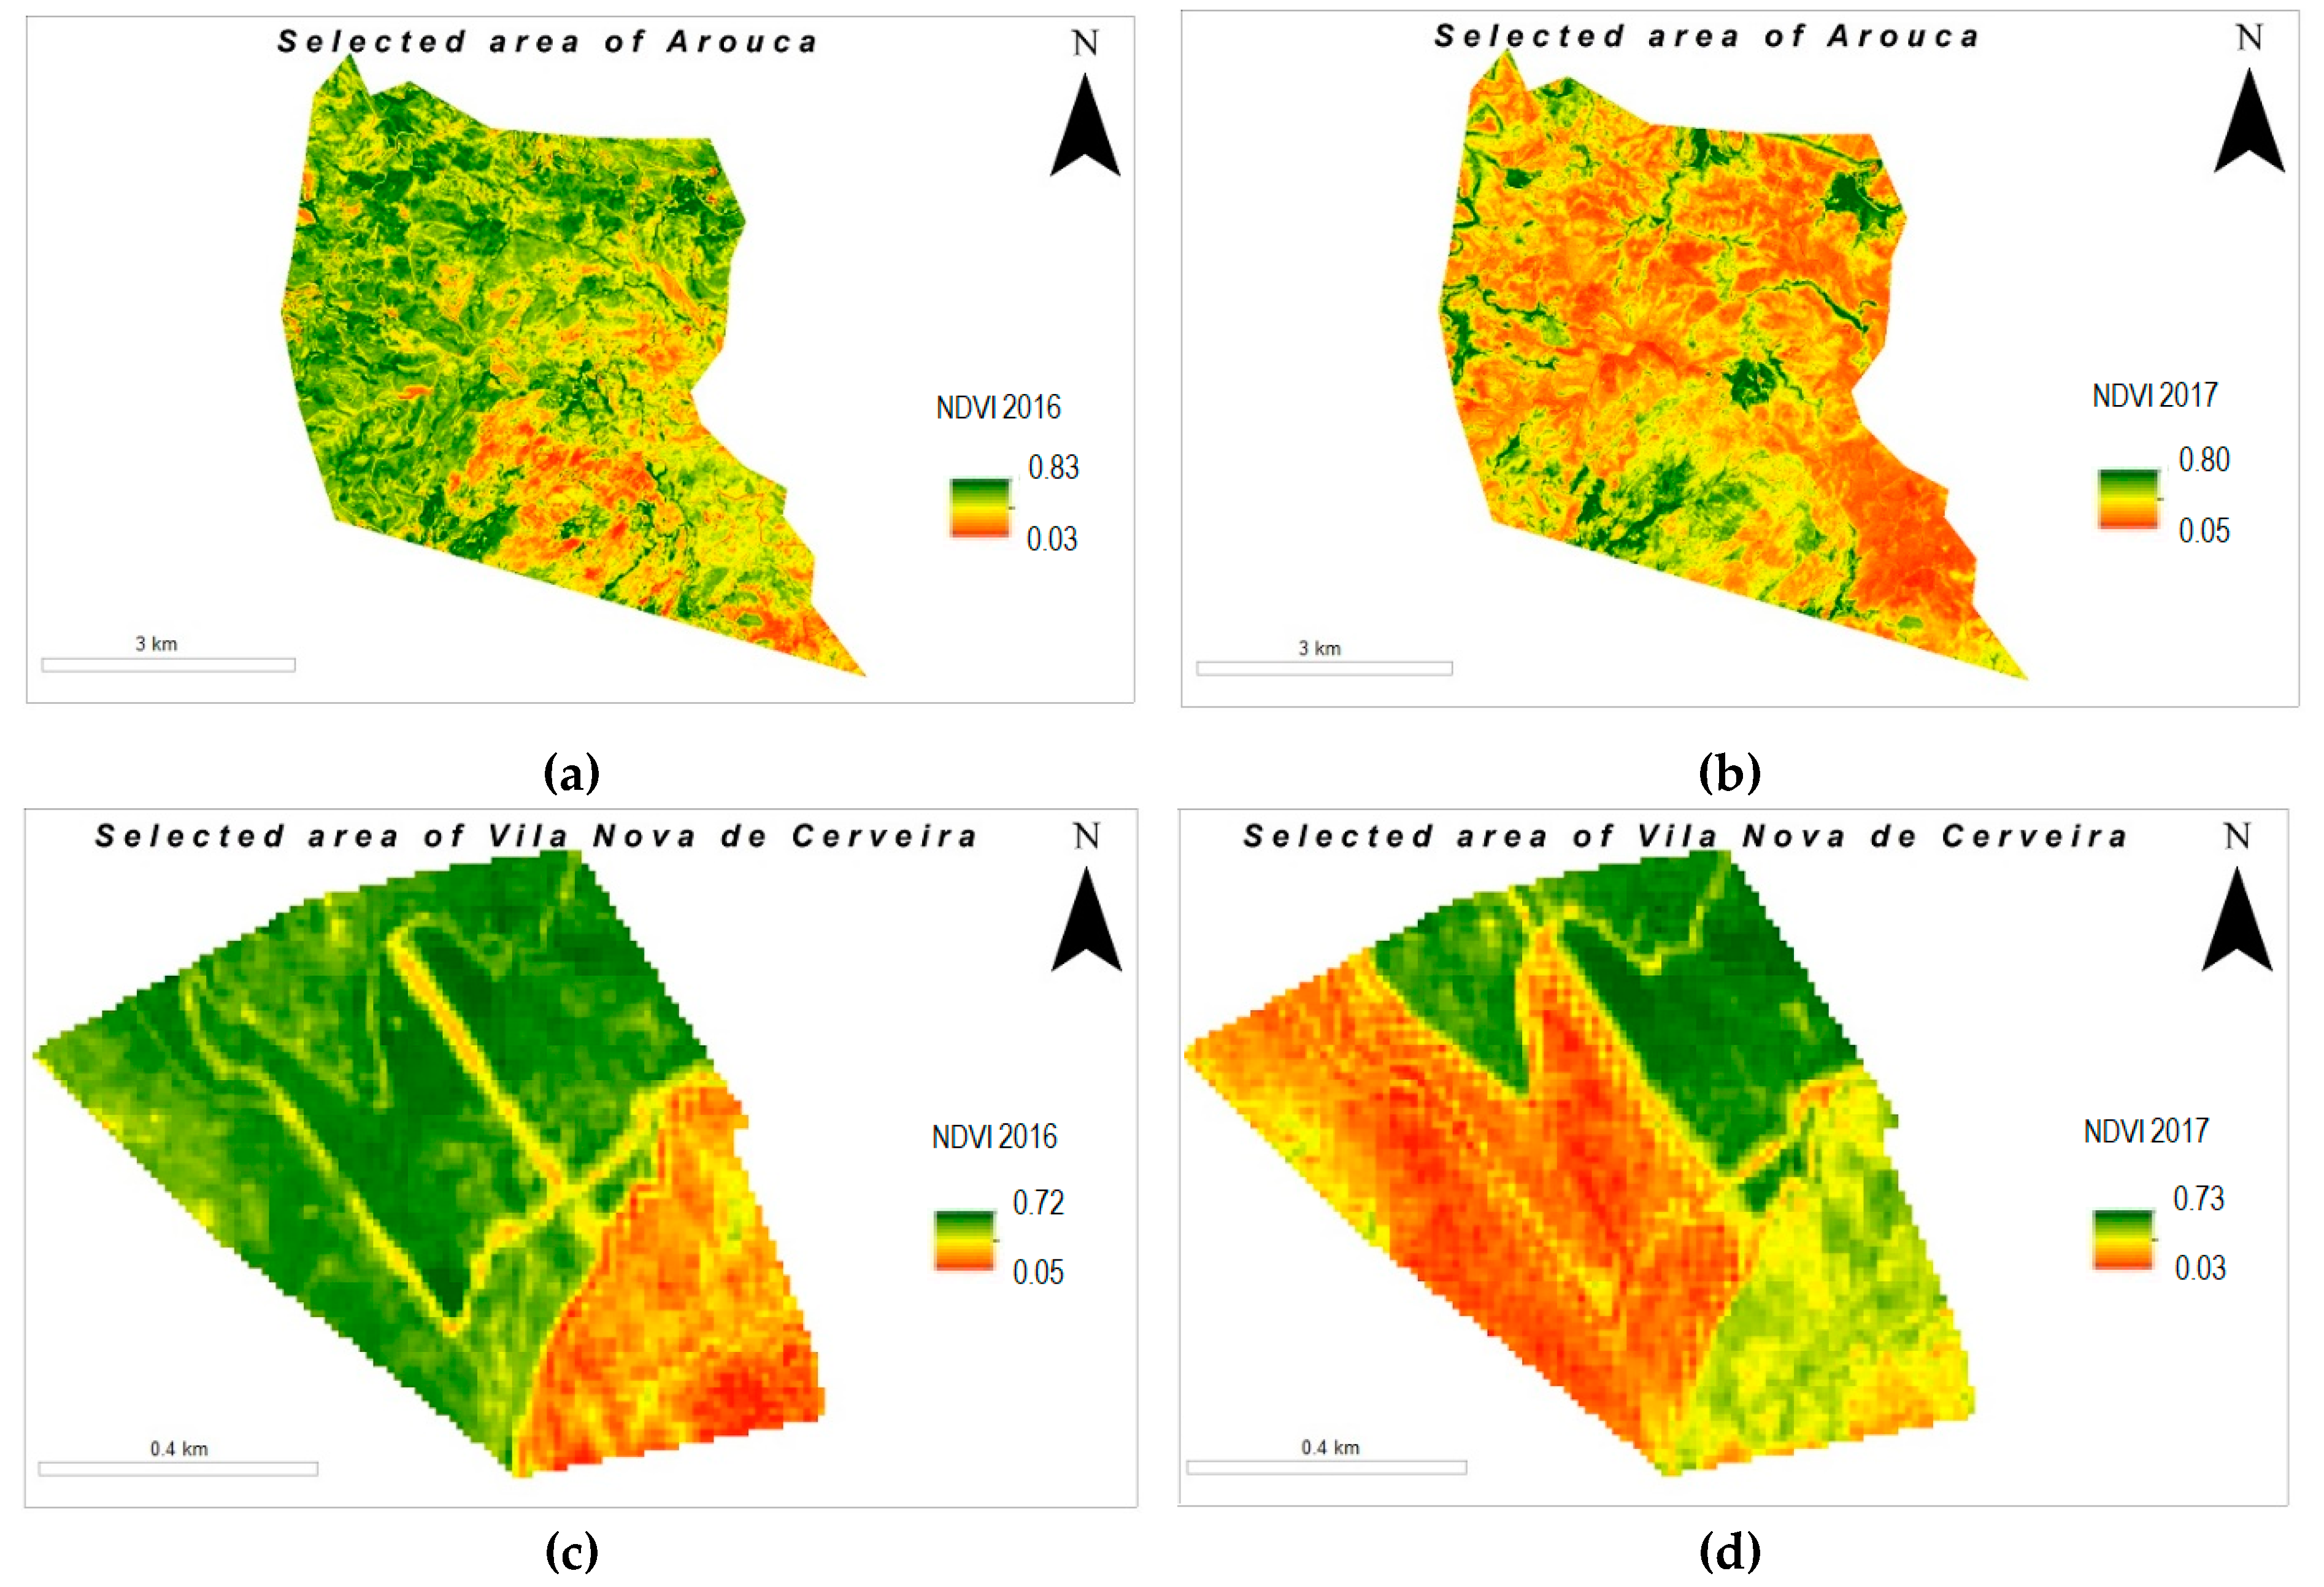
For the two specifically selected areas presented in Figure 5, the NDVI maps before (2016) and after (2017) the fire events were computed. Figure 6 presents NDVI maps for the specifically selected areas of Arouca and V. N. Cerveira taken from Sentinel 2A.
The specifically selected area of Arouca shows a general decrease in NDVI values in 2017, especially in the central and eastern part, indicating that this area was most severely affected by the 2016 fire. For the specifically selected area of V. N. Cerveira, although the area analyzed was smaller, it is possible to clearly check that the better spatial resolution of Sentinel 2A data allows better identification of the transition between the areas most affected by fire (lower NDVI values) and those areas that were not (highest NDVI values). It is possible to observe a separation line (probably a firebreak) that prevented the spread of the fire to the NE zone, which retained high NDVI values after the 2016 fire. It is also interesting to note that an area with low NDVI values in 2016 (prefire) located in the SE part of the image presented higher values of NDVI in 2017 (postfire). That means that, although these areas had not been affected by the 2016 fire, the NDVI increase could be related to recovery from an earlier fire event.
The NDVI analysis performed in this work includes unitemporal (prefire or postfire) images and bitemporal (pre-/postfire difference, dNDVI) analysis. Thus, maps of the NDVI difference (dNDVI) were computed for the two specific selected areas. The result for the selected area of Arouca is showed in Figure 7, using data from both sensors.
The two dNDVI maps presented in Figure 7 for the selected area of Arouca are visually very similar regarding both sensors. The same was verified for the selected area of V. N. Cerveira (not showed). High values of the dNDVI (close to 1) were found in the central part of the selected area, corresponding to areas with the lowest NDVI values in 2017 (postfire, see Figure 6b).
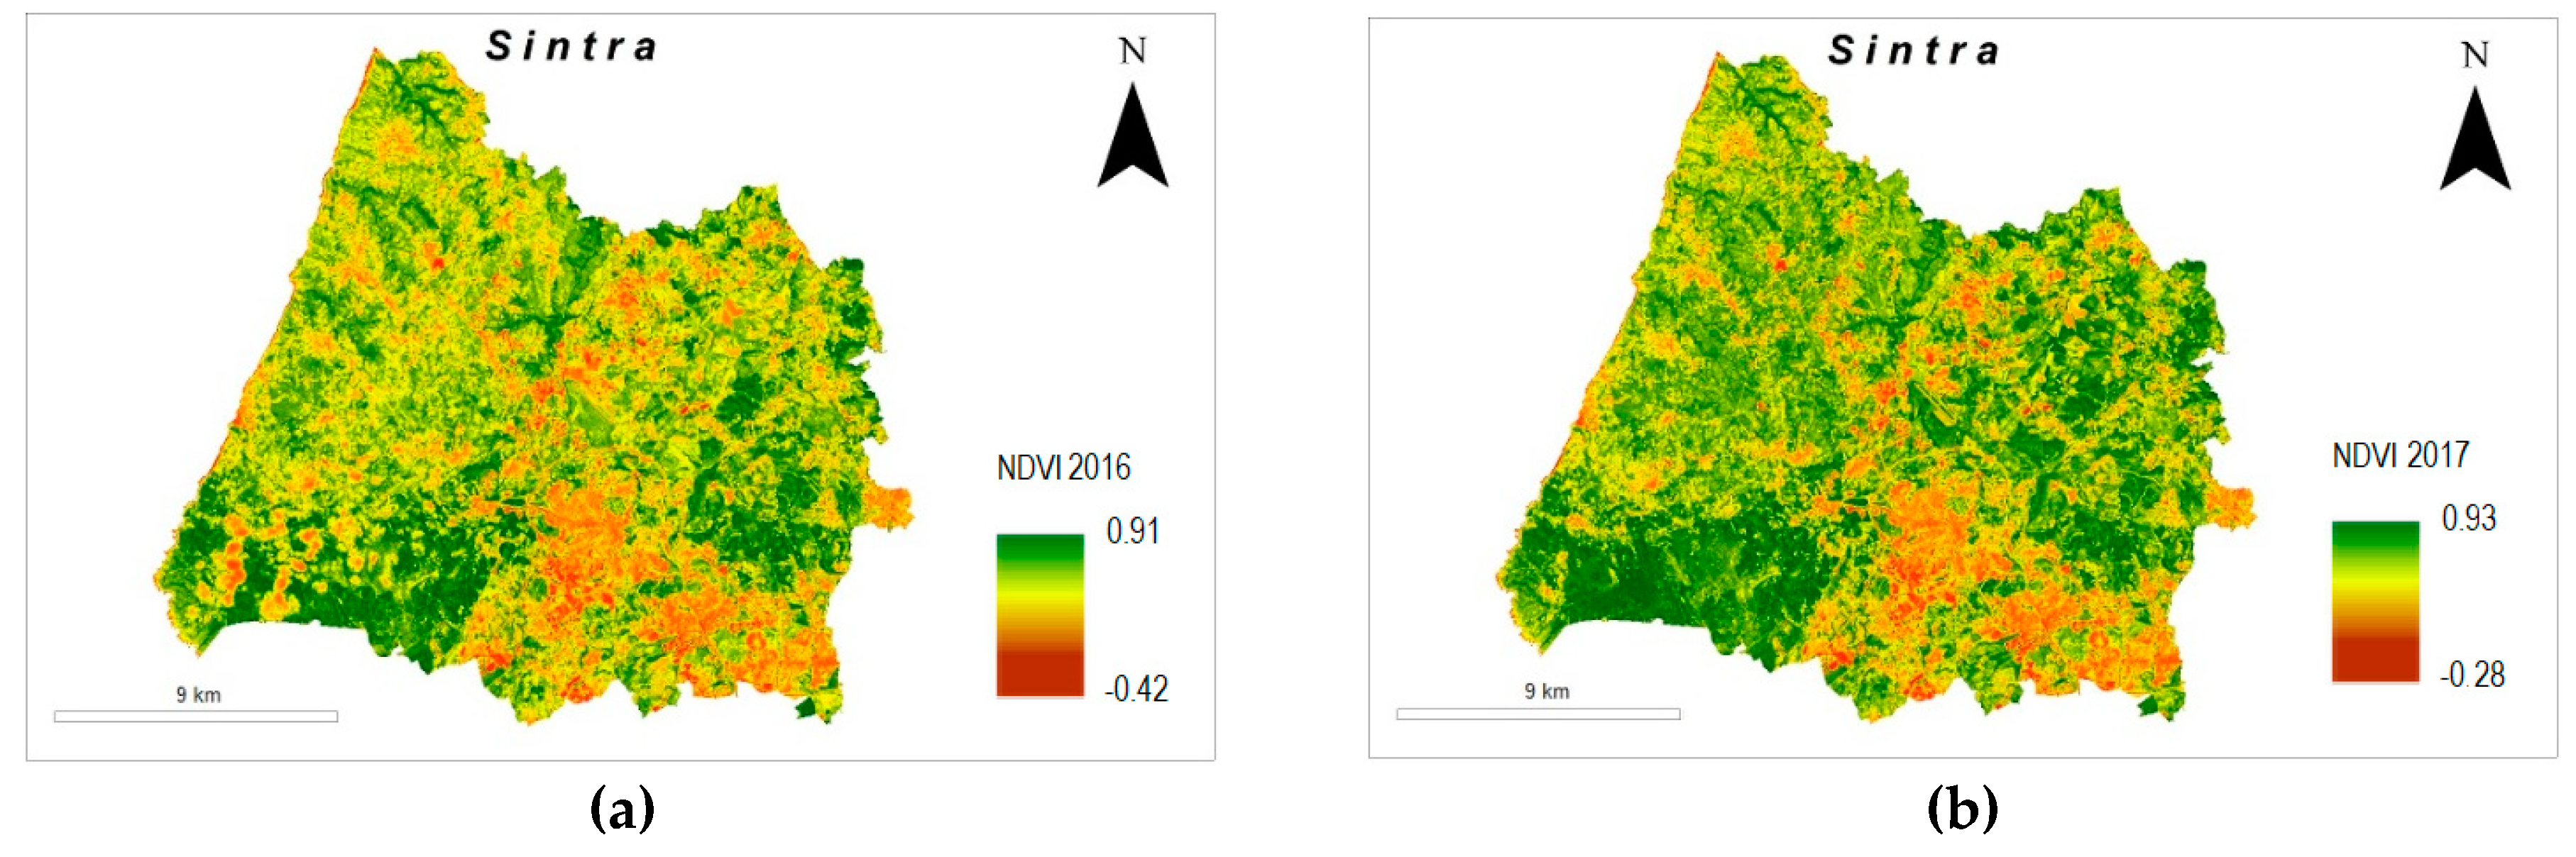
As mentioned before, Sintra municipality was used as a control case, since no fire occurred between the capture of its two scenes. The NDVI maps generated considering Landsat 8 for 2016 and 2017 are presented in Figure 8. As expected, it is not possible, just by visual inspection, to identify any change in the NDVI values between 2016 and 2017.
3.3. Statistical Analysis
The spatial analysis regarding the NDVI values were not sufficient to make any robust conclusion. Therefore, this analysis must be complemented with a statistical analysis for each area considered. Also, for Sintra municipality, a specific area was selected for further analysis. Since Sintra was not affected by forest fires, a forested area identified in the CORINE Land Cover (CLC) map was selected. This area corresponds to the region where the NDVI values present the higher values (SW part). The statistical analysis results of the NDVI computation performed in these three selected areas are presented in the Table 4.
Considering the values presented in Table 4 for the Arouca area, the statistical values of Landsat 8 and Sentinel 2A data are similar. The mean percentage variation (MPV) is approximately the same (−41.3% for Landsat 8 and −40.8% for Sentinel 2A), and the mean and median values are also of the same magnitude. The major difference is in the maximum and in the minimum values of NDVI identified for each sensor. Sentinel 2A is more sensitive in the identification of extreme NDVI values.
Considering the V. N. Cerveira area, the differences between the values of NDVI obtained by the two sensors are higher (MPV −14.7% for Landsat 8 and −23.2% for Sentinel 2A). In this case, the sensibility in identifying the NDVI minimum values is even more evident regarding the two sensors. Again, Sentinel 2A is more sensitive in the identification of the minimum NDVI values.
For the Sintra area (not affected by forest fires), the MPV is lower than in the other two areas analyzed. Moreover, the MPV is positive, which indicates that, in addition to not having experienced a fire, the vegetation is more active in 2017. The statistical values regarding the two sensors are quite similar.
3.4. Normalized Burn Ratio (NBR)
The dNBR was computed for the two municipalities affected by fire and for the two selected areas of these municipalities, considering both datasets. Table 5 and Figure 9 present the dNBR for Arouca (whole municipality and selected area).
Analyzing the maps presented in Figure 9, it is possible observe some similarities and the same pattern tendency in the maps obtained with Landsat 8 and Sentinel 2A. However, we found some differences between the burn severity values obtained when we check the statistic values given in Table 5. For instance, considering Sentinel 2A, for Arouca municipality, a maximum value of 0.987 was obtained (0.954 for the selected area), which corresponds to a “High Severity” level for both classifications proposed and presented in Table 3. This maximum value was lower (0.607 for whole municipality and 0.569 for selected area) when Landsat 8 data was used. This led us to conclude that Sentinel 2A, due to its higher spatial resolution, is more sensitive to this index.
3.5. Field Data
Postfire field surveys are usually conducted to identify burned areas. However, field surveys are time-consuming and costly, which makes remote sensing data a valid alternative.
The Portuguese institute of nature conservation and forests (ICNF—Instituto da Conservação da Natureza e Florestas) is the public institution responsible for the evaluation and quantification of forest fires. According to ICNF, in 2016, there were 13,261 fires in mainland Portugal, of which 21% were forest fires (with an area burnt >1 ha) and 79% to fires (occurrence of a burned area <1 ha) [41]. The total area of burning was 161,522 ha, of which 48% was in forest areas and 52% was in brushwood. The total number of events in 2016 presents a reduction of 14% when compared to 2015, and a decrease of 31% when compared to the average of the previous decade. However, the burned area in 2016 has increased to double of the average of the last ten years (+110%). The number of monthly registered occurrences shows that August 2016 was the only month that surpassed the average monthly value of the decade 2006–2015 [41]. According to the report provided by the ICNF [45], the two municipalities with the largest burned area in 2016 were Arouca and V. N. Cerveira (Table 6).
In order to validate our results, we compare the area burned retrieved by our methodology (based on NDVI analysis) and the data provided by the ICNF. The results are presented in Table 7.
Regarding the two datasets used, the Sentinel 2A data allowed more accurate estimation of total burned area than the Landsat 8 data. The differences between estimated area burned and real area burned was less than 7.8% considering the Sentinel 2A data in both municipalities. The results obtained with Landsat 8 data were a little worse; however, the differences were never higher than 13.3%. Although the Landsat 8-based spectral indices present slightly higher values of separability when compared to Sentinel 2A data, and other factors that could interfere with the NDVI computation, the main differences in the burned area estimation are related to the spatial resolution of two sensors.
Several bitemporal (pre- and postfire) spectral indices have been described in the literature for fire and burn severity mapping. For instance, Navarro et al. [14] found similar results for the Madeira Island in the performance of same spectral indices (NDVI, NBR) employed in this work, using Sentinel 2A data. As in this work, several authors have also proved that the NDVI and dNDVI have shown good correlation with fire severity [19]. Several authors also report that NBR and dNBR could be an added value in the estimation of fire and burn severity [46]. Mallinis et al. [15] compared the performance of the two sensors analyzed in this work. They concluded that Sentinel 2A provided the highest potential for estimating and mapping fire severity, when compared to Landsat 8 OLI. However, they also concluded that both sensors complement each other. Delegido et al. [47] also analyzed the feasibility of Sentinel 2 data for fire studies, and provided a comparison to Landsat 8. They use prefire and postfire Sentinel 2 and Landsat 8 imagery to compute a Normalized Difference Spectral Index (NDSI) in the southern Buenos Aires, Argentina. As in the work presented here, the results derived from Sentinel 2 were better than results derived from Landsat 8. More recently, Amos at al. [48] demonstrated the ability of Sentinel 2A to detect burnt areas and separate burning severity levels, in a fire occurred in Sierra de Gata, Spain. As in our work, [48] performed a spectral separability study of the different bands and derived indices commonly used to detect burnt areas.
4. Conclusions
There are numerous other factors beyond vegetation, such as ignition agents, topography, landscape fragmentation, and fire management activities, that can influence fire activity in a region. In this work, the main objective was not evaluating the causes of forest fires or proposing a new model to estimate the fire hazard or fire risk, but to evaluate the ability of remote sensed derived indices, such NDVI and dNBR, to estimate the burnt areas and evaluate the burn severity. The study areas selected for this study correspond to the two municipalities with the largest burned area in 2016 in mainland Portugal. NDVI was proven to be an excellent indicator to analyze the impact of forest fires and the computation of dNBR allows evaluation of the burn severity. The results achieved for both sensors for the area burned in the August 2016 fires in the two municipalities analyzed presented differences from the field data no higher than 13.3% (for Sentinel 2A data the differences are less than 7.8%). Moreover, the area burned estimated considering the Sentinel 2A data is more accurate, which can be justified by the higher spatial resolution of the data. The conjugation of NDVI and dNBR analysis is an added value in the analysis of fire assessment, since the conjugation of these two indices allows identification of the forest areas most affected and their recovery behavior after fire. Thus, the entities responsible for the management of these ecosystems can make an initial assessment of fire damage and promote more objective measures for their recovery. In conclusion, the higher spatial resolution of the Sentinel 2A sensor allows higher accuracy in the estimation of burned areas. In addition to the higher spatial resolution of Sentinel 2A, the temporal resolution of Sentinel 2 (10 days) was increased with the launch of the Sentinel 2B (March 2017) and therefore the frequency of the combined constellation revisit is less than 5 days. This fact could be very useful if we intend to make an evaluation (postfire image) just after a fire’s occurrence. However, for historical fires, the Landsat program remains the best option. Different indices, such as green normalized difference vegetation index (GNDVI), SAVI, or modified soil adjusted vegetation index (MSAVI), can also be applied in order to evaluate the burned areas. Also, the conjugation of multiple indices can provide a more accurate estimation of the burned areas. This will be our next step.
Author Contributions
A.T. conceived, designed and performed the experiments; A.A. performed the experiments; A.T. and A.A. analyzed the data; and A.T. wrote the paper.
Funding
This research received no external funding.
Acknowledgments
The authors would like to thank to the European Space Agency (ESA) for providing Sentinel 2A data and to United States Geological Survey (USGS) for providing Landsat 8 data. The authors would also to thank to Mário Cunha for their valuable contributions.
Conflicts of Interest
The authors declare no conflict of interest.
References
- Quintano, C.; Fernández-Manso, A.; Fernández-Mans, O. Combination of Landsat and Sentinel-2 MSI data for initial assessing of burn severity. Int. J. Appl. Earth Observ. Geoinf. 2018, 64, 221–225. [Google Scholar] [CrossRef]
- Oliveira, S.; Félix, F.; Nunes, A.; Lourenço, L.; Laneve, G.; Sebastian, A. Mapping wildfire vulnerability in Mediterranean Europe. Testing a stepwise approach for operational purposes. J. Environ. Manag. 2018, 206, 158–169. [Google Scholar] [CrossRef]
- Sa, A.; Benali, A.; Fernandes, P.; Pinto, R.; Trigo, R.; Salis, M.; Russo, A.; Jerez, S.; Soares, P.; Schroeder, W.; Pereira, J. Evaluating fire growth simulations using satellite active fire data. Remote Sens. Environ. 2017, 190, 302–317. [Google Scholar] [CrossRef]
- Lentile, L.B.; Holden, Z.A.; Smith, A.M.S.; Falkowski, M.J.; Hudak, A.T.; Morgan, P.; Lewis, S.A.; Gessler, P.E.; Benson, N.C. Remote sensing techniques to assess active fire characteristics and post-fire effects. Int. J. Wildl. Fire 2006, 15, 319–345. [Google Scholar] [CrossRef]
- Keeley, J.E. Fire intensity, fire severity and burn severity: A brief review and suggested usage. Int. J. Wildl. Fire 2009, 18, 116–126. [Google Scholar] [CrossRef]
- Jain, T.; Pilliod, D.; Graham, R. Tongue-tied. Wildfire 2004, 4, 22–36. [Google Scholar]
- Chafer, C.J.; Noonan, M.; Macnaught, E. The post-fire measurement of fire severity and intensity in the Christmas 2001 Sydney wildfires. Int. J. Wildl. Fire 2004, 13, 227–240. [Google Scholar] [CrossRef]
- Rogan, J.; Franklin, J. Mapping Wildfire Burn Severity in Southern California Forests and Shrublands Using Enhanced Thematic Mapper Imagery. Geocarto Int. 2001, 16, 91–106. [Google Scholar] [CrossRef]
- Schroeder, W.; Prins, E.M.; Giglio, L.; Csiszar, I.; Schmidt, C.C.; Morisette, J.; Morton, D.C. Validation of GOES and MODIS active fire detection products using ASTER and ETM+ data. Remote Sens. Environ. 2008, 112, 2711–2726. [Google Scholar] [CrossRef]
- Schroeder, W.; Oliva, P.; Giglio, L.; Quayle, B.; Lorenz, E.; Morelli, F. Active fire detection using Landsat-8/OLI data. Remote Sens. Environ. 2016, 185, 210–220. [Google Scholar] [CrossRef]
- Chuvieco, E. Earth Observation of Wildland Fires in Mediterranean Ecosystems; Springer: New York, NY, USA, 2009. [Google Scholar]
- Borrelli, P.; Armentetas, D.; Panagos, P.; Modugno, S.; Schutt, B. The Implications of Fire Management in the Andean Paramo: A Preliminary Assessment Using Satellite Remote Sensing. Remote Sens. 2015, 7, 11061–11082. [Google Scholar] [CrossRef]
- Polychronaki, A.; Gitas, I.Z. The development of an operational procedure for burned-area mapping using object-based classification and ASTER imagery. Int. J. Remote Sens. 2010, 31, 1113–1120. [Google Scholar] [CrossRef]
- Navarro, G.; Caballero, I.; Silva, G.; Parra, P.; Vázquez, À.; Caldeira, R. Evaluation of forest fire on Madeira Island using Sentinel 2A MS Imagery. Int. J. Appl. Earth Observ. Geoinf. 2017, 58, 97–106. [Google Scholar] [CrossRef]
- Mallinis, G.; Mitsopoulos, I.; Chysafi, I. Evaluating and comparing Sentinel 2A and Landsat 8 Operational Land Imager (OLI) spectral indices for estimating fire severity in a Mediterranean pine ecosystem of Greece. GISci. Remote Sens. 2018, 55, 1–18. [Google Scholar] [CrossRef]
- Key, C.; Benson, N. Landscape Assessment: Ground Measure of Severity, the Composite Burn Index; and Remote Sensing of Severity, the Normalized Burn Ratio. In FIREMON: Fire Effects Monitoring and Inventory System; USDA Forest Service, Rocky Mountains Research Station General Technical Report RMRS-GTR-164-CD: Fort Collins, CO, USA, 2006. [Google Scholar]
- Soverel, N.O.; Perrakis, D.D.B. Estimating burn severity from Landsat dNBR and RdNBR indices across western Canada. Remote Sens. Environ. 2010, 114, 1896–1909. [Google Scholar] [CrossRef]
- Chuvieco, E.; Martin, M.P.; Palacios, A. Assessment of different spectral indices in the red-near-infrared spectral domain for burned land discrimination. Int. J. Remote Sens. 2002, 23, 5103–5110. [Google Scholar] [CrossRef]
- Escuin, E.; Navarro, R.; Fernández, P. Fire Severity Assessment by Using NBR (Normalized Burn Ratio) and NDVI (Normalized Difference Vegetation Index) Derived from LANDSAT TM/ETM Images. Int. J. Remote Sens. 2008, 29, 1053–1073. [Google Scholar] [CrossRef]
- Dragozi, E.; Gitas, I.Z.; Bajocco, S.; Stavrakoudis, D.G. Exploring the Relationship between Burn Severity Field Data and Very High Resolution GeoEye Images: The Case of the 2011 Evros Wildfire in Greece. Remote Sens. 2016, 8, 566. [Google Scholar] [CrossRef]
- Soulard, C.E.; Albano, C.M.; Villareal, M.L.; Walker, J.J. Continuous 1985–2012 Landsat Monitoring to Assess Fire Effects on Meadows in Yosemite National Park, California. Remote Sens. 2016, 8, 371. [Google Scholar] [CrossRef]
- Chu, T.; Guo, X. Remote Sensing Techniques in Monitoring Post-Fire Effects and Patterns of Forest Recovery in Boreal Forest Regions: A Review. Remote Sens. 2014, 6, 470–520. [Google Scholar] [CrossRef]
- Teodoro, A.C.; Duarte, L. Forest fire risk maps: A GIS open source application – a case study in Norwest of Portugal. Int. J. Geogr. Inf. Sci. 2013, 27, 699–720. [Google Scholar] [CrossRef]
- Duarte, L.; Teodoro, A.; Monteiro, A.T.; Cunha, C.; Gonçalves, H. PhenoMetrics: An open source software application to assess vegetation phenology metrics. Comput. Electron. Agric. 2018, 148, 82–94. [Google Scholar] [CrossRef]
- Miller, J.D.; Thode, A.E. Quantifying burn severity in a heterogeneous landscape with a relative version of the delta Normalized Burn Ratio (dNBR). Remote Sens. Environ. 2007, 109, 66–80. [Google Scholar] [CrossRef]
- French, N.H.F.; Kasischke, E.S.; Hall, R.J.; Murphy, K.A.; Verbyla, D.L.; Hoy, E.E.; Allen, J.L. Using Landsat data to assess fire and burn severity in the North American boreal forest region: An overview and summary of results. Int. J. Wildl. Fire 2008, 17, 443–462. [Google Scholar] [CrossRef]
- Keeley, J.E.; Davis, F.W. Terrestrial Vegetation of California; Barbour, M.G., Keeler-Wolf, T., Schoenherr, A.A., Eds.; University of California Press: Los Angeles, VA, USA, 2007; pp. 339–366. [Google Scholar]
- Keeley, J.E.; Zedler, P.H. Evolution of life histories in Pinus. In Ecology and Biogeography of Pinus; Richardson, D.M., Ed.; Cambridge University Press: Cambridge, UK, 1998; pp. 219–250. [Google Scholar]
- Fernandes, P.M.; Rigolot, E. The fire ecology and management of maritime pine (Pinus pinaster Ait). For. Ecol. Manag. 2007, 241, 1–13. [Google Scholar] [CrossRef]
- Rubel, F.; Kottek, M. Observed and projected climate shifts 1901-2100 depicted by world maps of the Köppen-Geiger climate classification. Meteorol. Z. 2010, 19, 135–141. [Google Scholar] [CrossRef]
- Congedo, L. Semi-Automatic Classification Plugin Documentation. Available online: https://semiautomaticclassificationmanual-v5.readthedocs.io/en/latest/ (accessed on 1 May 2017).
- Chavez, P. An improved dark-object subtraction technique for atmospheric scattering correction of multispectral data. Remote Sens. Environ. 1988, 2, 459–479. [Google Scholar] [CrossRef]
- ESA. Sentinel-2 User Handbook. 2015. Available online: https://sentinels.copernicus.eu/documents/247904/ 685211/Sentinel-2_User_Handbook (accessed on 13 September 2017).
- Vermote, E.; El Saleouset, N.Z.; Justice, C.O. Atmospheric correction of MODIS data in the visible to middle infrared: First results. Remote Sens. Environ. 2002, 83, 97–111. [Google Scholar] [CrossRef]
- Vermote, E.; Justice, C.; Martin, C.; Belen, F. Preliminary analysis of the performance of the Landsat 8/OLI land surface reflectance product. Remote Sens. Environ. 2016, 185, 46–56. [Google Scholar] [CrossRef]
- Sobrino, J.A.; Jimenéz-Munoz, J.C.; Paolini, L. Land surface temperature retrieval from LANDSAT TM 5. Remote Sens. Environ. 2004, 90, 434–440. [Google Scholar] [CrossRef]
- Lüdtke;, N.; Panzeri, S.; Brown, M.; Broomhead, D.; Knowles, J.; Montemurro, M.A.; Kell, D.B. Information-theoretic sensitivity analysis: A general method for credit assignment in complex networks. J. R. Soc. Interface 2007, 5, 223–235. [Google Scholar]
- Convertino, M.; Muñoz-Carpena, M.; Chu-Agor, M.L.; Kiker, G.A.; Linkov, I. Untangling drivers of species distributions: Global sensitivity and uncertainty analyses of MaxEnt. Environ. Model. Softw. 2014, 51, 296–309. [Google Scholar] [CrossRef]
- Veraverbeke, S.; Lhermitte, S.; Verstraeten, W.; Goossens, R. Evaluation of Pre/Post-Fire Differenced Spectral Indices for Assessing Burn Severity in a Mediterranean Environment with Landsat Thematic Mapper. Int. J. Remote Sens. 2011, 32, 3521–3537. [Google Scholar] [CrossRef]
- Key, C.H.; Benson, N.C. Remote Sensing Measure of Severity: The Normalized Burn Ratio. In FIREMON Landscape Assessment (LA) V4 Sampling and Analysis Methods, LA1-16; USFS Rocky Mountain Research Station: Collins, CO, USA, 2004. [Google Scholar]
- Van Wagtendonk, J.W.; Root, R.R.; Key, C.H. Comparison of AVIRIS and Landsat ETM+ detection capabilities for burn severity. Remote Sens. Environ. 2004, 92, 397–340. [Google Scholar] [CrossRef]
- De Santis, A.; Chuvieco, E. GeoCBI: A modified version of the Composite Burn Index for the initial assessment of the short-term burn severity from remotely sensed data. Remote Sens. Environ. 2009, 113, 554–562. [Google Scholar] [CrossRef]
- Huang, H.; Roy, D.; Boschetti, L.; Zhang, H.; Yan, L.; Kumar, S.; Gomez-Dans, J.; Li, J. Separability Analysis of sentinel-2A Multi-Spectral Instrument (MSI) Data for Burned Area Discrimination. Remote Sens. 2016, 8, 873. [Google Scholar] [CrossRef]
- Teodoro, A.; Amaral, A. Evaluation of forest fires in Portugal Mainland during 2016 summer considering different satellite datasets. In Proceedings of the Remote Sensing for Agriculture, Ecosystems, and Hydrology, Warsaw, Poland, 11–14 September 2017. [Google Scholar]
- ICNF. Departamento de Gestão de Áreas Públicas e de Proteção Florestal. IN: 9º Relatório Provisório de Incêndios Florestais. Available online: http://www2.icnf.pt/portal/florestas/dfci/Resource/doc/rel/2017/9-rel-prov-1jan-16out-2017_v2.pdf / (accessed on 1 October 2017).
- Veraverbeke, S.; Lhermitte, S.; Verstraeten, W.; Goossens, R. Evaluating Landsat Thematic Mapper Spectral Indices for Estimating Burn Severity of the 2007 Peloponnese Wildfires in Greece. Int. J. Wildl. Fire 2010, 19, 558–569. [Google Scholar] [CrossRef]
- Delegido, J.; Pezzola, A.; Casella, A.; Winschel, C.; Urrego, E.P.; Jimenez, J.C.; Sobrino, J.A.; Soria, G.; Moreno, J. Fire severity estimation in southern of the Buenos Aires province, Argentina, using Sentinel-2 and its comparison with Landsat-8. Revista Teledetección 2018, 51, 47–60. [Google Scholar] [CrossRef]
- Amos, C.; Petropoulos, G.P.; Ferentinos, K.P. Determining the use of Sentinel-2A MSI for wildfire burning & severity detection. Int. J. Remote Sens. 2019, 40, 905–930. [Google Scholar]
Figure 1.
Study area: (a) Location of Portugal in Europe; (b) the three municipalities analyzed: 1. V. N. Cerveira; 2. Arouca; and 3. Sintra.
Figure 1.
Study area: (a) Location of Portugal in Europe; (b) the three municipalities analyzed: 1. V. N. Cerveira; 2. Arouca; and 3. Sintra.

Figure 2.
Flowchart of the methodology followed in this work.

Figure 3.
Separability analysis for Sentinel 2A and Landsat 8, considering the Arouca municipality: (a) considered sensor’s original bands; and (b) dNDVI and dNBR.
Figure 3.
Separability analysis for Sentinel 2A and Landsat 8, considering the Arouca municipality: (a) considered sensor’s original bands; and (b) dNDVI and dNBR.

Figure 4.
NDVI maps of Arouca for: (a) prefire and (b) postfire; and V. N. Cerveira for (c) prefire and (d) postfire derived from Landsat 8 data (adapted from [44]).
Figure 4.
NDVI maps of Arouca for: (a) prefire and (b) postfire; and V. N. Cerveira for (c) prefire and (d) postfire derived from Landsat 8 data (adapted from [44]).


Figure 5.
Areas selected for postfire analysis in (a) Arouca (yellow) and (b) V.N Cerveira (green) municipalities.
Figure 5.
Areas selected for postfire analysis in (a) Arouca (yellow) and (b) V.N Cerveira (green) municipalities.

Figure 6.
NDVI maps of the specifically selected areas for: (a) prefire and (b) postfire in Arouca; and (c) prefire and (d) postfire in V. N. Cerveira, derived from Sentinel 2A data (adapted from [44]).
Figure 6.
NDVI maps of the specifically selected areas for: (a) prefire and (b) postfire in Arouca; and (c) prefire and (d) postfire in V. N. Cerveira, derived from Sentinel 2A data (adapted from [44]).

Figure 7.
NDVI difference (dNDVI) maps for the selected area of Arouca for: (a) Landsat 8 and (b) Sentinel 2A.
Figure 7.
NDVI difference (dNDVI) maps for the selected area of Arouca for: (a) Landsat 8 and (b) Sentinel 2A.

Figure 8.
NDVI maps of Sintra for: (a) prefire and (b) postfire derived from the Landsat 8 data (adapted from [44]).
Figure 8.
NDVI maps of Sintra for: (a) prefire and (b) postfire derived from the Landsat 8 data (adapted from [44]).

Figure 9.
dNBR for: (a) Arouca municipality and (b) selected area calculated from Sentinel 2A data; and (c) Arouca municipality and (d) selected area calculated from Landsat 8 data.
Figure 9.
dNBR for: (a) Arouca municipality and (b) selected area calculated from Sentinel 2A data; and (c) Arouca municipality and (d) selected area calculated from Landsat 8 data.


Table 1.
Main characteristics of Sentinel 2A and Landsat 8.
| Sentinel 2A | Landsat 8 | ||||
|---|---|---|---|---|---|
| Spectral Bands | Central Wavelength (nm) | Spatial Resolution (m) | Spectral Bands | Central Wavelength (nm) | Spatial Resolution (m) |
| B1 | 443 | 60 | B1 | 440 | 30 |
| B2 | 490 | 10 | B2 | 480 | 30 |
| B3 | 560 | 10 | B3 | 560 | 30 |
| B4 | 665 | 10 | B4 | 655 | 30 |
| B5 | 705 | 20 | B5 | 865 | 30 |
| B6 | 740 | 20 | B6 | 1610 | 30 |
| B7 | 783 | 20 | B7 | 2200 | 30 |
| B8 | 842 | 10 | B8 | 590 | 15 |
| B8a | 865 | 20 | B9 | 1370 | 30 |
| B9 | 945 | 60 | B10 | 10.895 * | 100 ** (30) |
| B10 | 1380 | 60 | B11 | 12.005 * | 100 ** (30) |
| B11 | 1610 | 20 | |||
| B12 | 2190 | 20 | |||
* in micrometers; ** Thermal Infrared Sensor (TIRS) bands are acquired at 100 m resolution but are resampled to 30 m in the delivered data product.
Table 2.
Dataset considered in this study for the three municipalities analyzed.
| Satellite/Sensor | Acquisition Date | Event | Municipality |
|---|---|---|---|
| Landsat 8 | 14 July 2016 12 April 2017 | Prefire event Postfire event | Arouca |
| 14 March 2016 19 March 2017 | Prefire event Postfire event | V. N. Cerveira | |
| 12 June 2016 28 April 2017 | Prefire event Postfire event | Sintra | |
| Sentinel 2A | 19 July 2016 15 April 2017 | Prefire event Postfire event | Arouca |
| 24 March 2016 19 March 2017 | Prefire event Postfire event | V. N. Cerveira | |
| 16 June 2016 3 May 2017 | Prefire event Postfire event | Sintra |
Table 3.
Fire severity levels.
| Severity Level | dNBR Range (Not Scaled)- USGS | dNBR Range (Not Scaled)- Mediterranean Local Conditions |
|---|---|---|
| Enhanced Regrowth, high (postfire) | <−0.250 | |
| Enhanced Regrowth, low (postfire) | −0.250 to −0.101 | |
| Unburned | −0.100 to 0.099 | |
| Low Severity | 0.100 to 0.269 | <0.319 |
| Moderate–low Severity | 0.270 to 0.439 | 0.320–0.649 |
| Moderate–high Severity | 0.440 to 0.659 | |
| High Severity | >0.660 | >0.650 |
dNBR - difference Normalized Burn Ratio.
Table 4.
NDVI statistical analysis for the selected areas of the three municipalities analyzed.
| NDVI | Arouca | V. N. Cerveira | Sintra | |||||||||
|---|---|---|---|---|---|---|---|---|---|---|---|---|
| Landsat 8 | Sentinel 2A | Landsat 8 | Sentinel 2A | Landsat 8 | Sentinel 2A | |||||||
| 2016 | 2017 | 2016 | 2017 | 2016 | 2017 | 2016 | 2017 | 2016 | 2017 | 2016 | 2017 | |
| Minimum | 0.125 | 0.036 | −0.038 | −0.126 | 0.257 | 0.282 | 0.052 | 0.029 | −0.169 | −0.193 | −0.276 | −0.339 |
| Maximum | 0.912 | 0.872 | 0.834 | 0.845 | 0.776 | 0.819 | 0.724 | 0.736 | 0.912 | 0.904 | 0.873 | 0.883 |
| Mean | 0.666 | 0.391 | 0.546 | 0.323 | 0.611 | 0.521 | 0.517 | 0.397 | 0.653 | 0.684 | 0.611 | 0.619 |
| Standard dev. | 0.116 | 0.140 | 0.112 | 0.142 | 0.127 | 0.156 | 0.144 | 0.174 | 0.178 | 0.161 | 0.183 | 0.171 |
| Median | 0.687 | 0.365 | 0.564 | 0.296 | 0.660 | 0.511 | 0.578 | 0.390 | 0.705 | 0.739 | 0.671 | 0.676 |
| Variance | 0.020 | 0.005 | 0.002 | 0.006 | 0.003 | 0.005 | 0.004 | 0.007 | 0.005 | 0.004 | 0.055 | 0.005 |
| Mean Perc. Variation | −41.291% | −40.842% | −14.730% | −23.210% | +4.747% | +1.310% | ||||||
Table 5.
dNBR statistical analysis for the entire Arouca municipality and the selected area, considering both Sentinel 2A and Landsat 8 data.
Table 5.
dNBR statistical analysis for the entire Arouca municipality and the selected area, considering both Sentinel 2A and Landsat 8 data.
| dNBR | Sentinel 2A | Landsat 8 | ||
|---|---|---|---|---|
| Arouca | Selected Area | Arouca | Selected Area | |
| Minimum | −0.807 | −0.492 | −0.950 | −0.388 |
| Maximum | 0.987 | 0.954 | 0.607 | 0.569 |
| Mean | 0.135 | 0.271 | −0.035 | 0.161 |
| Standard dev. | 0.188 | 0.187 | 0.220 | 1.151 |
| Median | 0.086 | 0.283 | 0.124 | 0.172 |
Table 6.
Total area burned in Arouca and V.N. Cerveira municipalities in the 2016 fires [41].
Table 6.
Total area burned in Arouca and V.N. Cerveira municipalities in the 2016 fires [41].
| Municipality | Total Area (ha) | Total Area Burned (ha) | |
|---|---|---|---|
| Arouca | 32,800 | 24,628 | Forest area—18,369 ha (74.6%) |
| Bush—6259 ha (25.4%) | |||
| V. N. Cerveira | 10,800 | 6755 | Forest area—755 ha (11.6%) |
| Bush—5889 ha (87.2%) |
Table 7.
Area burned in Arouca and V.N Cerveira based in the methodology proposed in this work and available field data.
Table 7.
Area burned in Arouca and V.N Cerveira based in the methodology proposed in this work and available field data.
| Municipality | Landsat 8 Area Burned (Estimated) | Sentinel 2A Area Burned (Estimated) | Field Data Area Burned (Field) | Differences Landsat 8/Sentinel 2A |
|---|---|---|---|---|
| Arouca | 27,440 ha | 26,443 ha | 24,628 ha | 11.1%/6.8% |
| V.N. Cerveira | 7656 | 7284 | 6755 ha | 13.3%/7.8% |
© 2019 by the authors. Licensee MDPI, Basel, Switzerland. This article is an open access article distributed under the terms and conditions of the Creative Commons Attribution (CC BY) license (http://creativecommons.org/licenses/by/4.0/).
Share and Cite
MDPI and ACS Style
Teodoro, A.; Amaral, A. A Statistical and Spatial Analysis of Portuguese Forest Fires in Summer 2016 Considering Landsat 8 and Sentinel 2A Data. Environments 2019, 6, 36. https://0-doi-org.brum.beds.ac.uk/10.3390/environments6030036
AMA Style
Teodoro A, Amaral A. A Statistical and Spatial Analysis of Portuguese Forest Fires in Summer 2016 Considering Landsat 8 and Sentinel 2A Data. Environments. 2019; 6(3):36. https://0-doi-org.brum.beds.ac.uk/10.3390/environments6030036
Chicago/Turabian StyleTeodoro, Ana, and Ana Amaral. 2019. "A Statistical and Spatial Analysis of Portuguese Forest Fires in Summer 2016 Considering Landsat 8 and Sentinel 2A Data" Environments 6, no. 3: 36. https://0-doi-org.brum.beds.ac.uk/10.3390/environments6030036
Note that from the first issue of 2016, this journal uses article numbers instead of page numbers. See further details here.