Environmental Impacts of Infrastructure Development under the Belt and Road Initiative

 ,
,  ,
,  ,
,
Abstract
:1. Introduction
2. What is BRI?
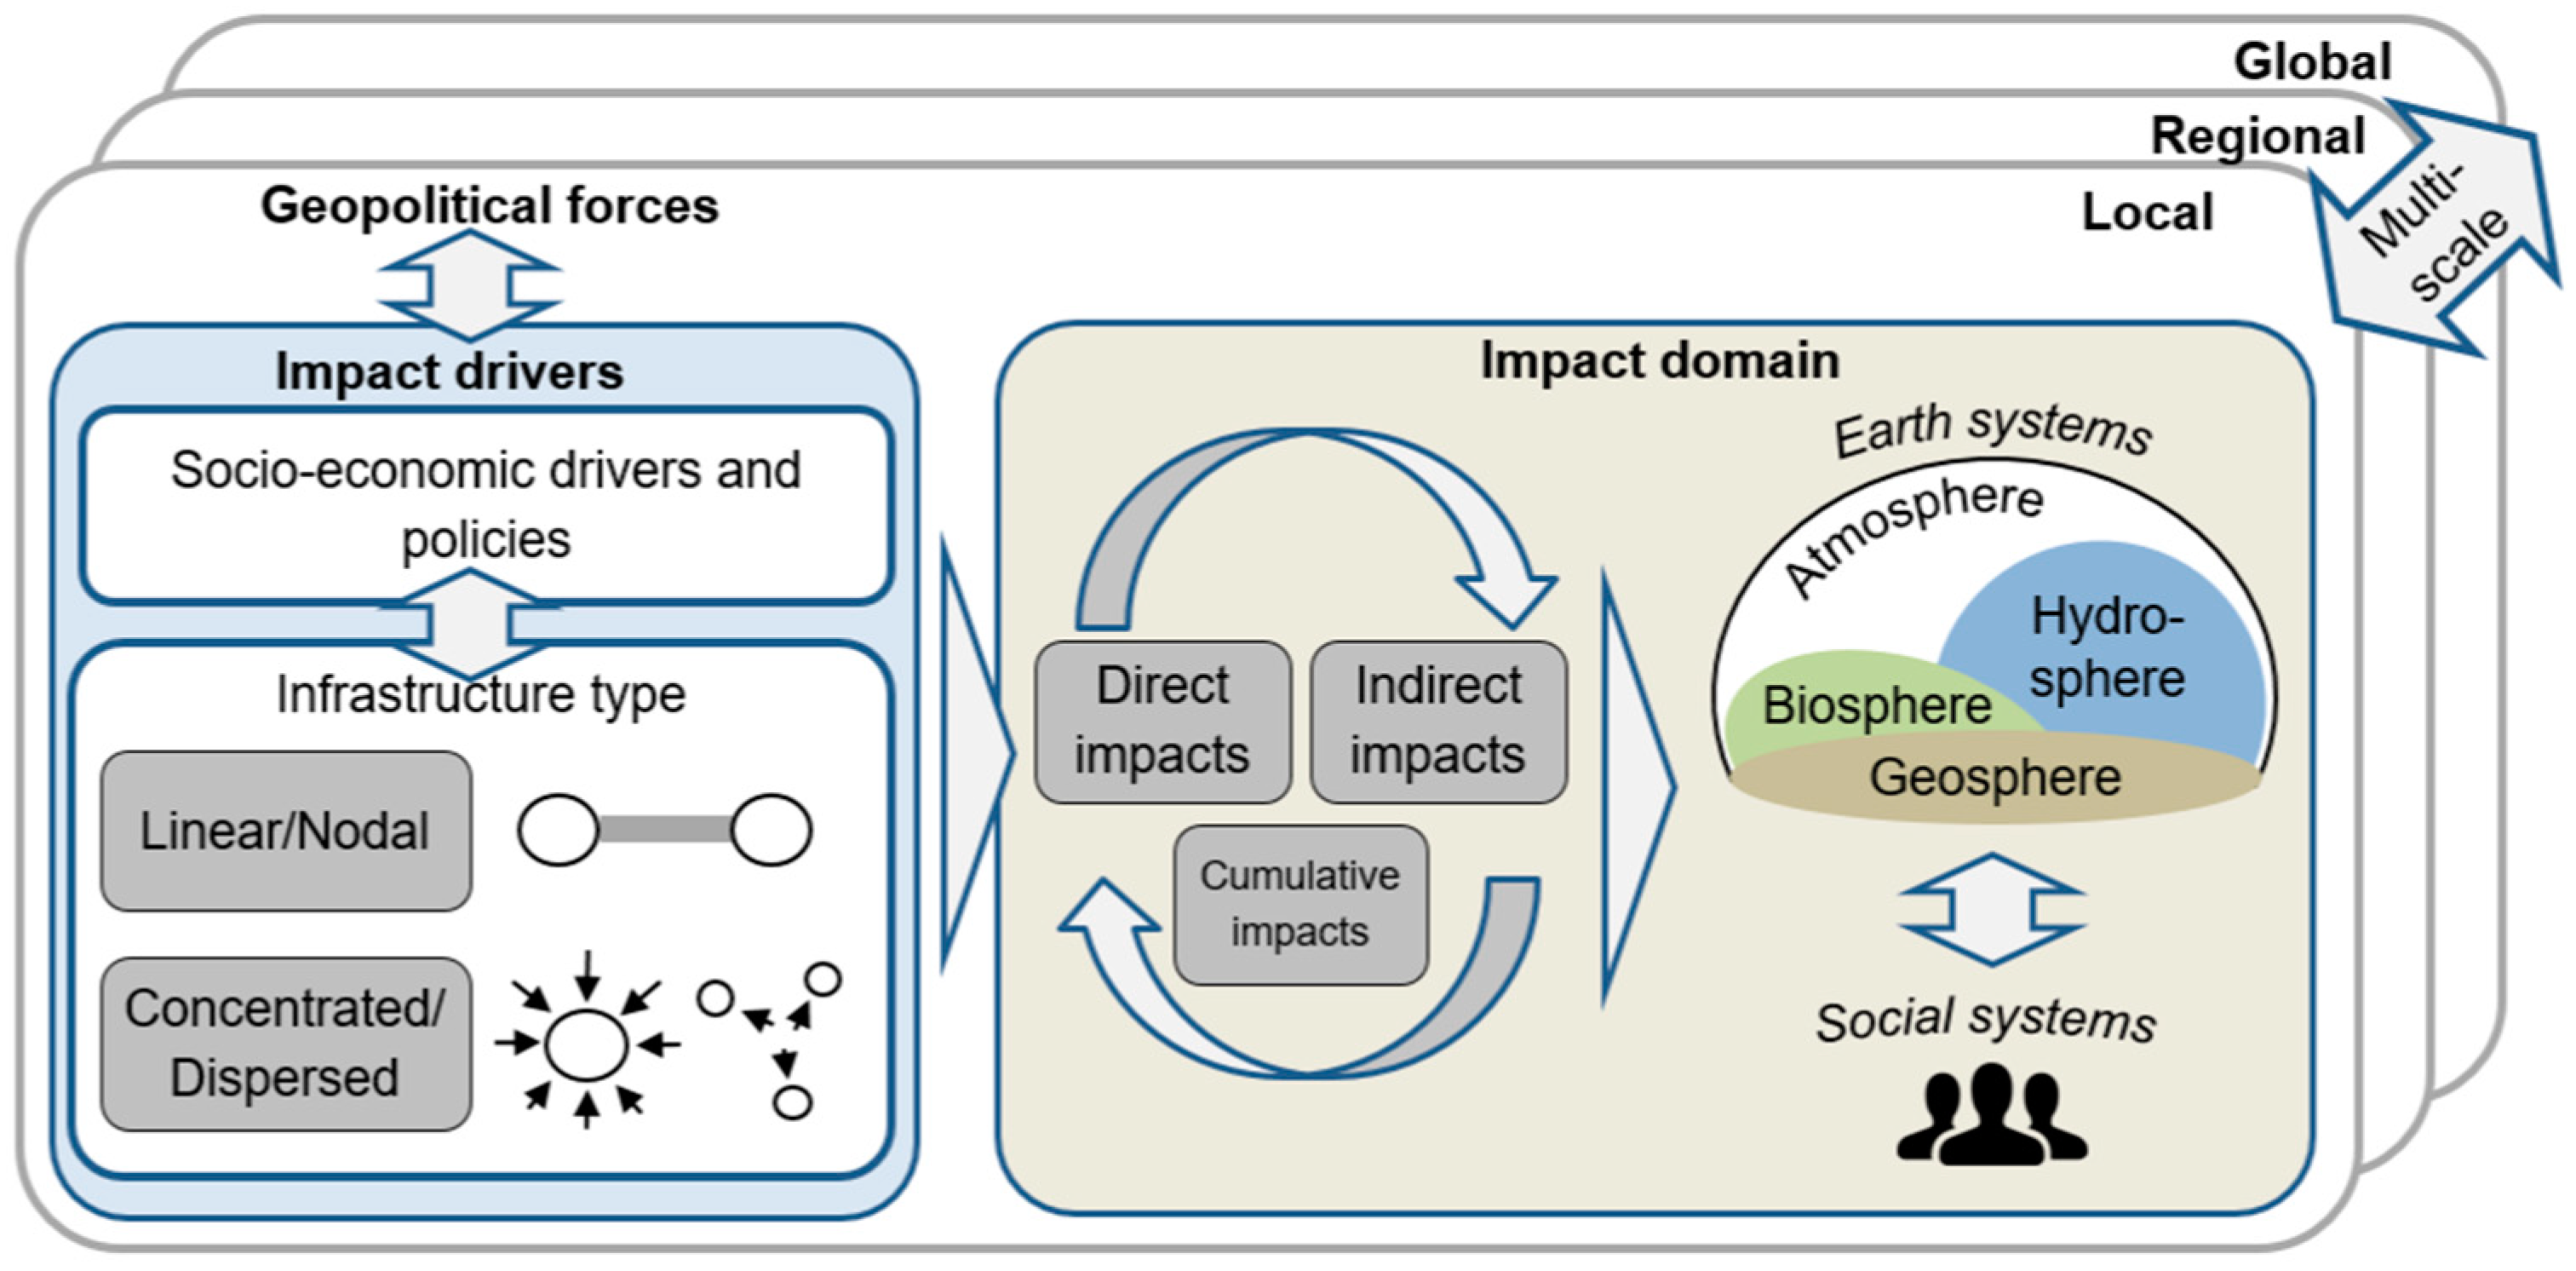
3. Nature of BRI Environmental Impacts
4. Typology of BRI Environmental Impact Drivers
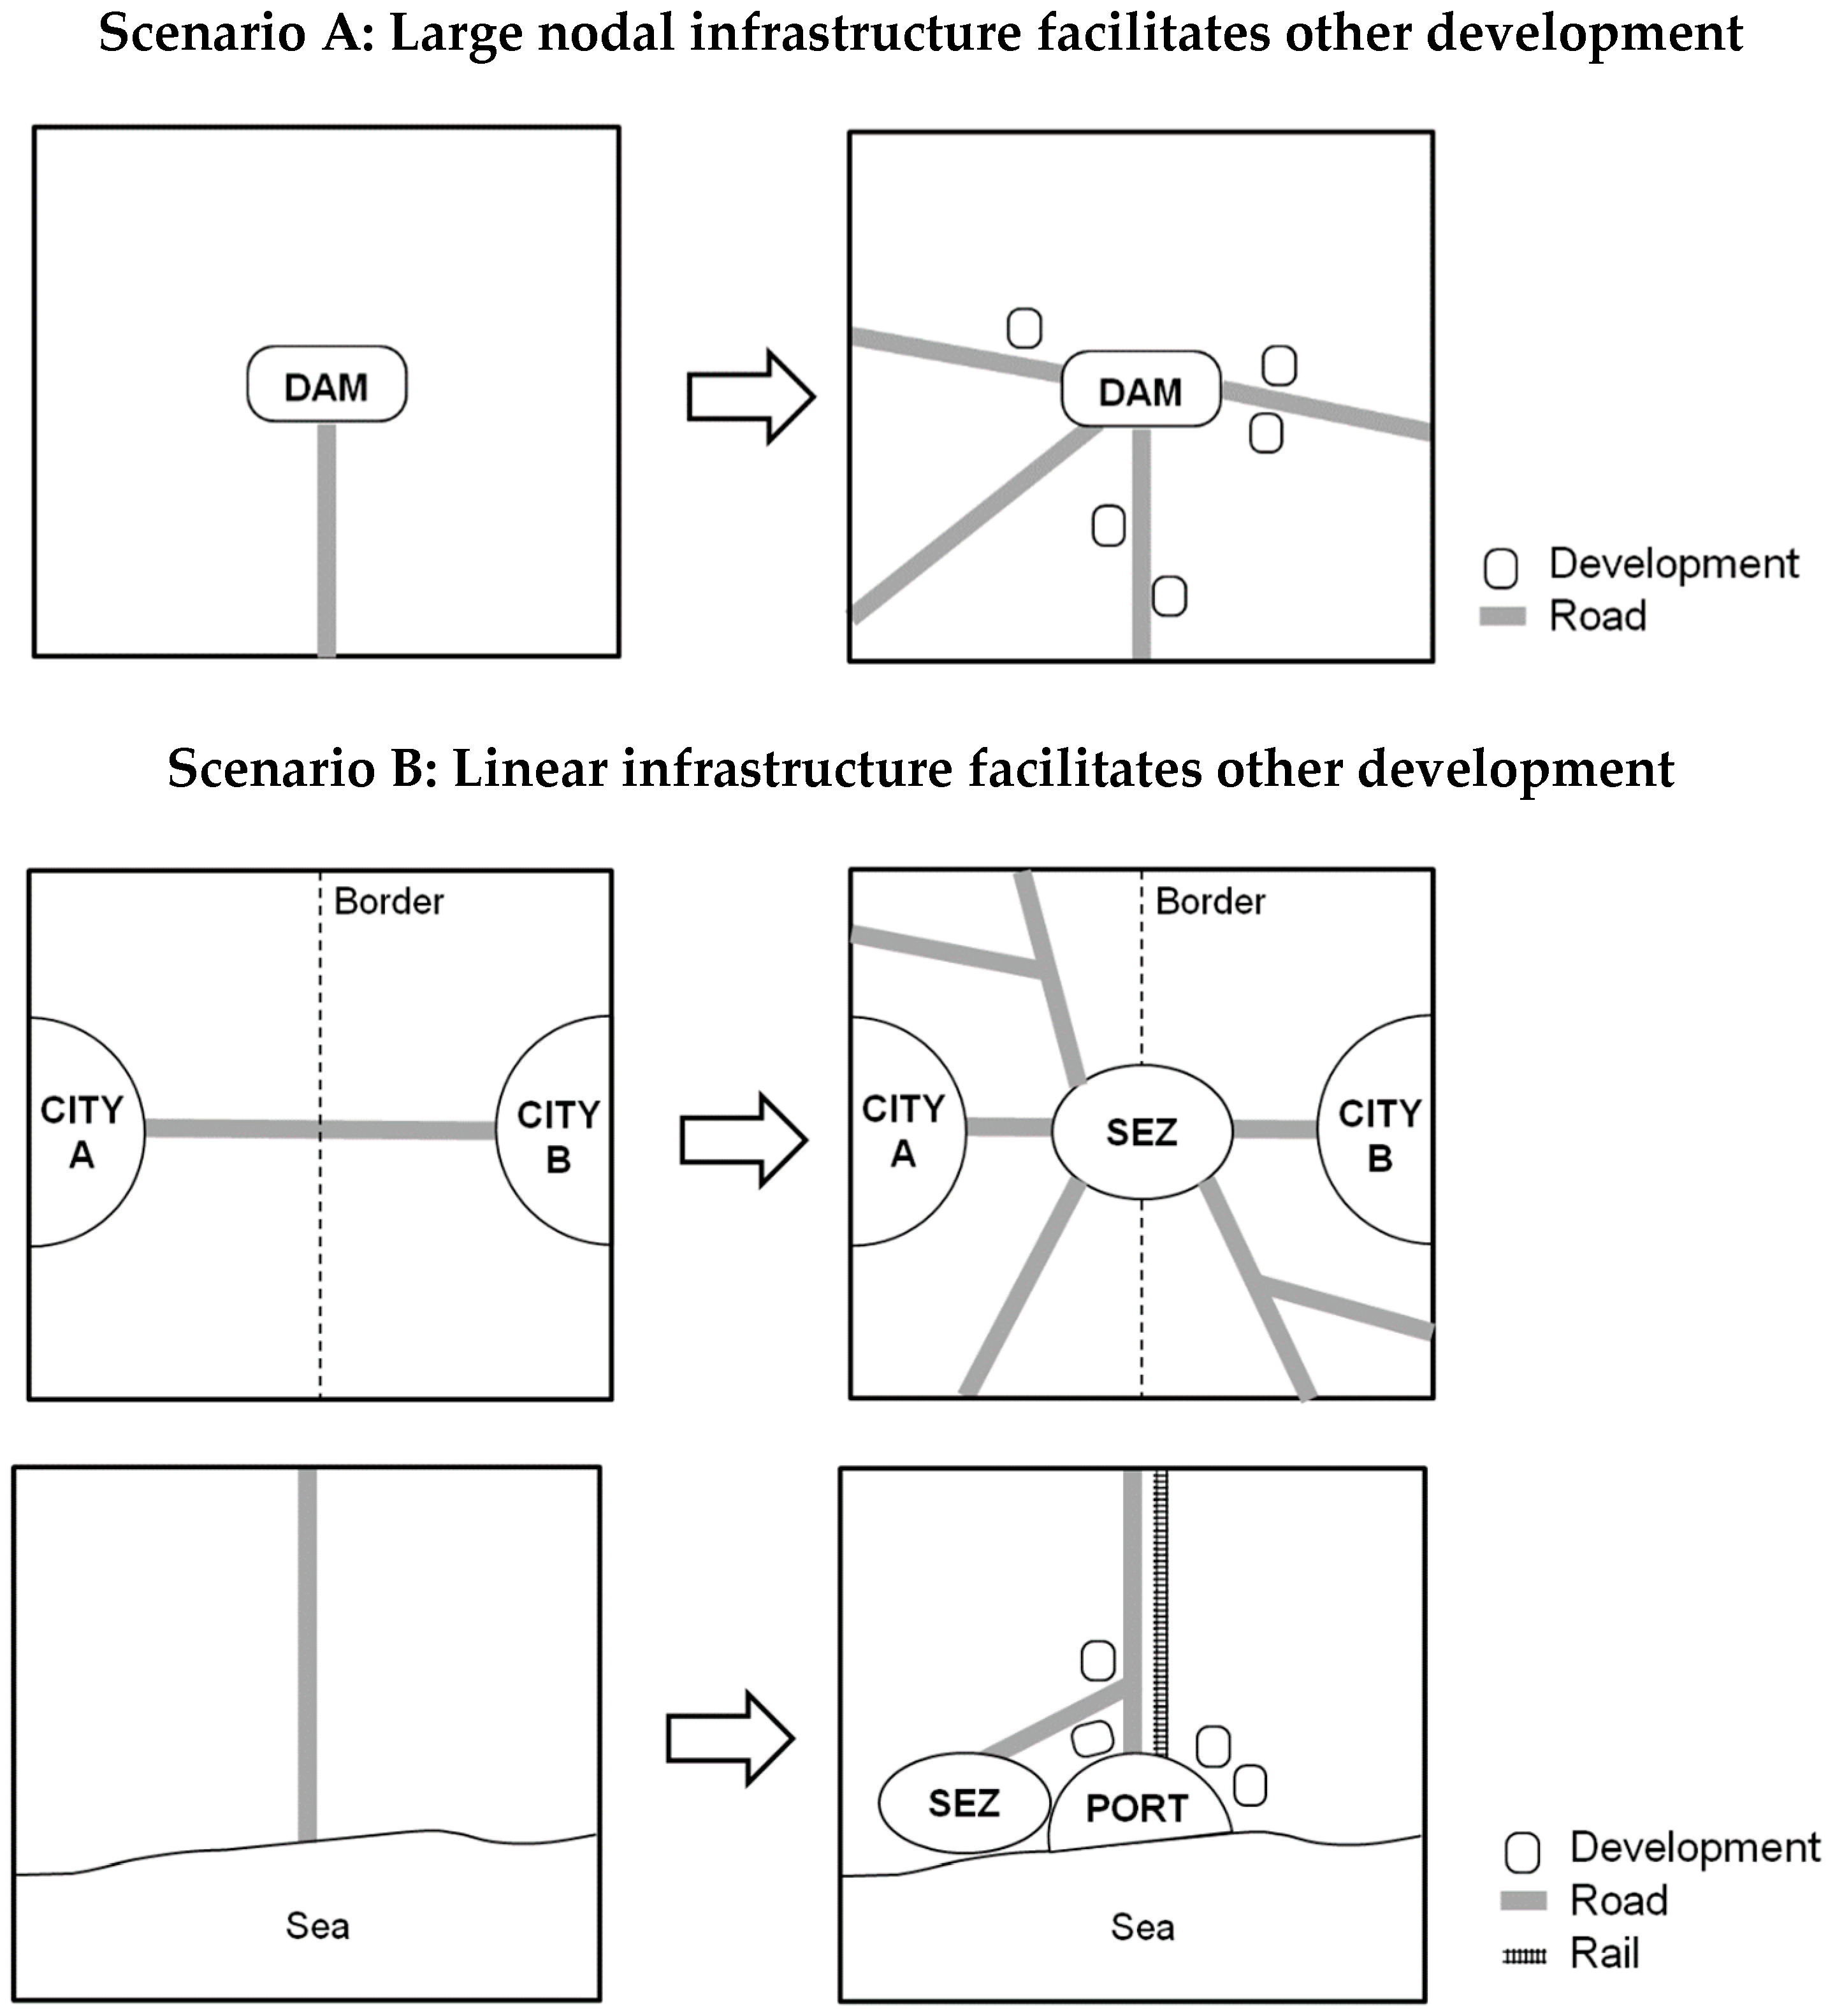
4.1. Function
4.2. Causality
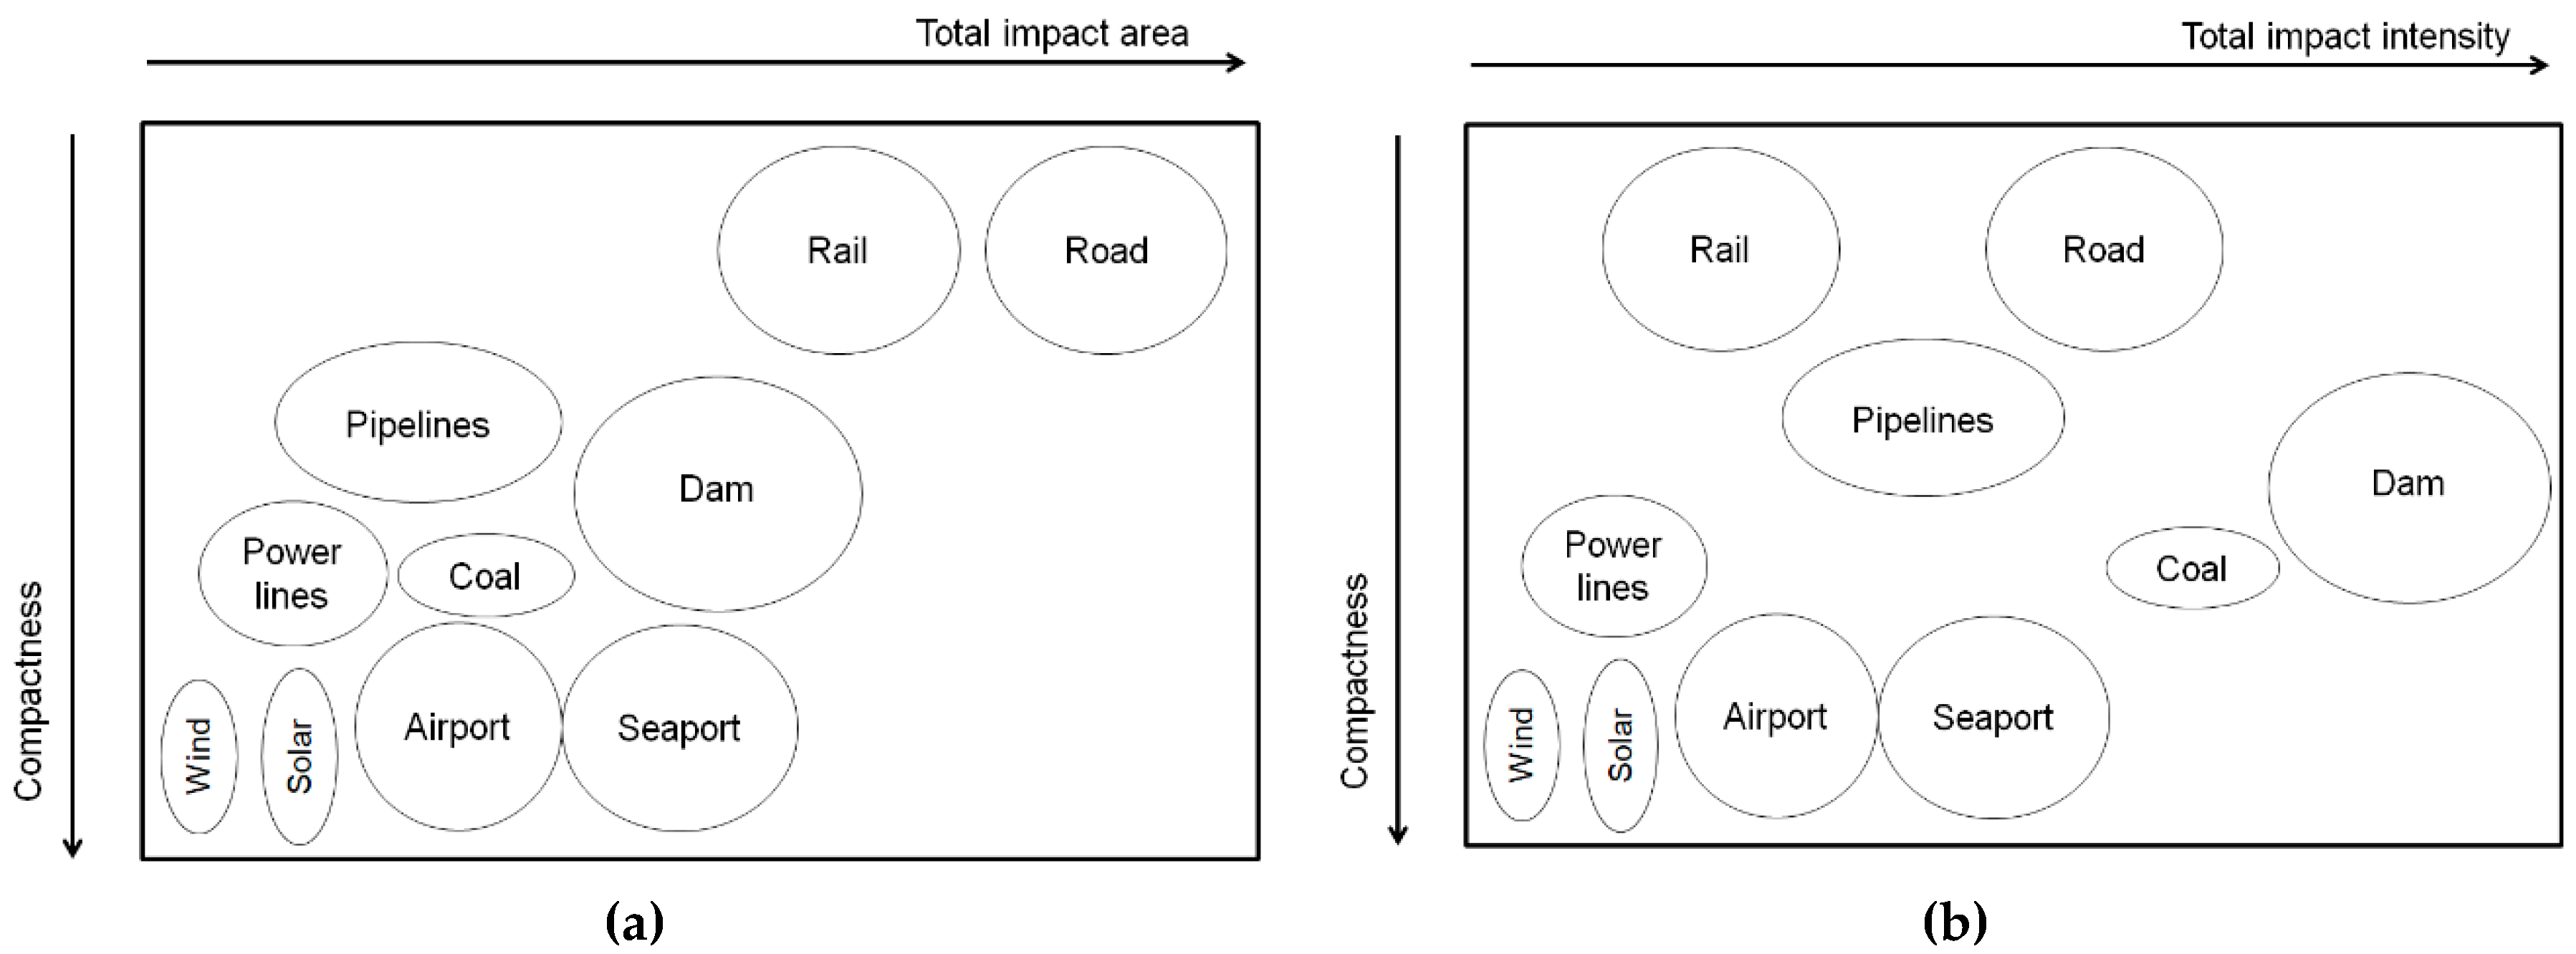
4.3. Scale and Intensity of BRI Impacts
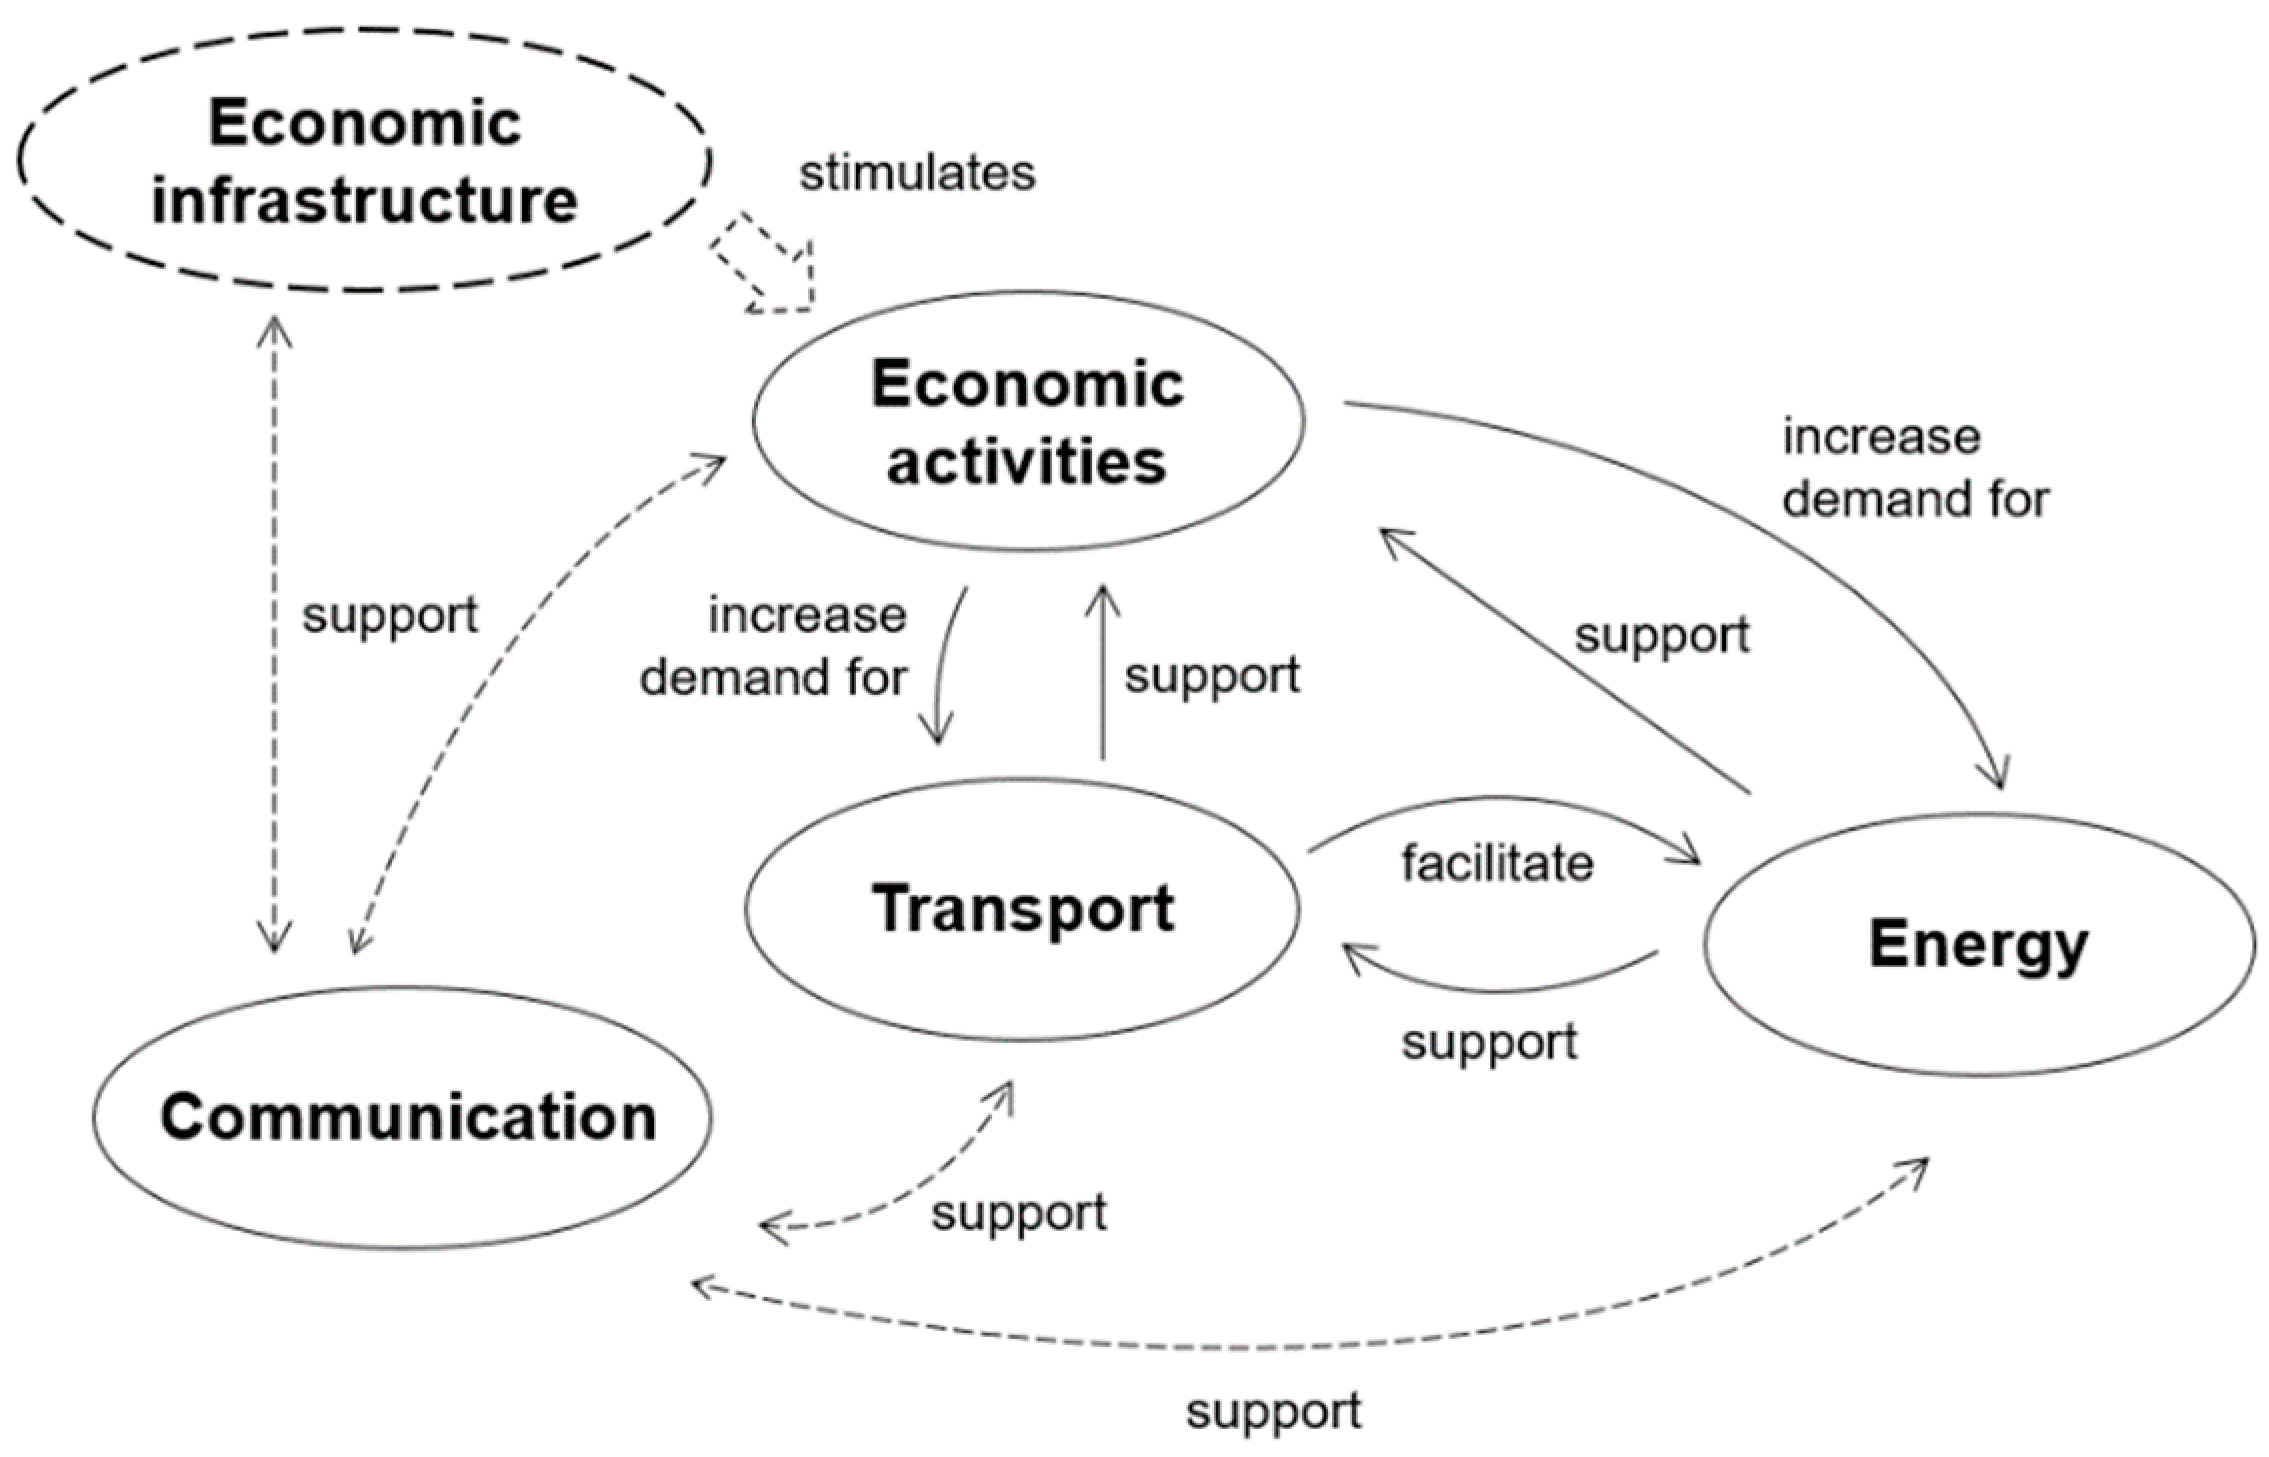
5. Economic Drivers and Environmental Impacts
6. Socio-Political Drivers and Environmental Policies
7. Conclusions: Planning for the BRI
Author Contributions
Funding
Conflicts of Interest
References
- China MFA. President Xi Jinping Delivers Important Speech and Proposes to Build a Silk Road Economic Belt with Central Asian Countries. 7 September 2013. Available online: http://www.fmprc.gov.cn/mfa_eng/topics_665678/xjpfwzysiesgjtfhshzzfh_665686/t1076334.shtml (accessed on 16 May 2019).
- Villafuerte, J.; Corong, E.; Zhuang, J. The One Belt, One Road Initiative Impact on Trade and Growth. In Proceedings of the 19th Annual Conference on Global Economic Analysis, Purdue University, Washington, DC, USA, 15–17 June 2016; Available online: https://www.gtap.agecon.purdue.edu (accessed on 10 June 2019).
- Summers, T. China’s ‘New Silk Roads’: Sub-national regions and networks of global political economy. Third World Q. 2016, 37, 1628–1643. [Google Scholar] [CrossRef]
- Zheng, B. China’s “One Belt, One Road” Plan Marks the Next Phase of Globalization. New Perspect. Q. 2017, 34, 27–30. [Google Scholar]
- Brewster, D. Silk Roads and Strings of Pearls: The Strategic Geography of China’s New Pathways in the Indian Ocean. Geopolitics 2017, 22, 269–291. [Google Scholar] [CrossRef]
- Ferdinand, P. Westward ho—The China dream and ‘one belt, one road’: Chinese foreign policy under Xi Jinping. Int. Aff. 2016, 92, 941–957. [Google Scholar] [CrossRef]
- Shambaugh, D. China’s Soft-Power Push. Foreign Aff. 2015, 99, 99–107. [Google Scholar]
- Liu, H.Y.; Tang, Y.K.; Chen, X.L.; Poznanska, J. The Determinants of Chinese Outward FDI in Countries Along “One Belt One Road”. Emerg. Mark. Finance Trade 2017, 53, 1374–1387. [Google Scholar] [CrossRef]
- Ascensão, F.; Fahrig, L.; Clevenger, A.P.; Corlett, R.T.; Jaeger, J.A.G.; Laurance, W.F.; Pereira, H.M. Environmental challenges for the Belt and Road Initiative. Nat. Sustain. 2018, 1, 206–209. [Google Scholar] [CrossRef]
- Lechner, A.M.; Chan, F.K.S.; Campos-Arceiz, A. Biodiversity conservation should be a core value of China’s Belt and Road Initiative. Nat. Ecol. Evol. 2018, 2, 408–409. [Google Scholar] [CrossRef]
- Sternberg, T.; Ahearn, A.; Mcconnell, F. Central Asian ‘Characteristics’ on China’s New Silk Road: The Role of Landscape and the Politics of Infrastructure. Land 2017, 6, 55. [Google Scholar] [CrossRef]
- Tracy, E.F.; Shvarts, E.; Simonov, E.; Babenko, M. China’s new Eurasian ambitions: The environmental risks of the Silk Road Economic Belt. Eur. Geogr. Econ. 2017, 58, 56–88. [Google Scholar] [CrossRef]
- Chen, X. Yong lvse fazhan jiang “yidaiyilu” jiancheng mingyun gongtongti [Using green development to make One Belt One Road a regional community of common destiny]. Reg. Econ. Rev. 2015, 6, 7–9. [Google Scholar]
- Zhang, M. “Yidaiyilu” jianshe zhong ruhe shijian lvse fazhan linian? [How to implement green development concepts in One Belt One Road construction]. Reg. Econ. Rev. 2017, 6, 5–7. [Google Scholar]
- Cheng, C.; Weng, Z.; Ge, C.; Duan, Y. Promoting efficient multi-dimensional ecological and environmental cooperation to build a green Belt and Road. Environ. Prot. 2017, 45, 53–56. [Google Scholar]
- Tao, H.; Yang, X.; Zhu, Q.; Hou, C.; Ma, S.; Wang, Q.; Jin, X. Wenxian jiliang fenxifa jingzhun dingwei ziyuan huanjinglei keji qikan “yidaiyilu” zhuanti cehua fangxiang [Special selection of Belt and Road Initiative for resource and environment scientific journals based on bibliometric analysis]. Chin. J. Sci. Tech. Period. 2018, 5, 520–524. [Google Scholar]
- Deng, H. Tuijin lvse “yidaiyilu” jianshe de jidian sikao [Points of note in promoting a green OBOR]. Reg. Econ. Rev. 2017, 6, 10–11. [Google Scholar]
- Virapongse, A.; Brooks, S.; Metcalf, E.C.; Zedalis, M.; Gosz, J.; Kliskey, A.; Alessa, L. A social-ecological systems approach for environmental management. J. Environ. Manag. 2016, 178, 83–91. [Google Scholar] [CrossRef] [PubMed] [Green Version]
- Hamilton, S.H.; ElSawah, S.; Guillaume, J.H.A.; Jakeman, A.J.; Pierce, S.A. Integrated assessment and modelling: Overview and synthesis of salient dimensions. Environ. Model. Softw. 2015, 64, 215–229. [Google Scholar] [CrossRef]
- Jakeman, A.J.; Letcher, R.A. Integrated assessment and modelling: Features, principles and examples for catchment management. Environ. Model. Softw. 2003, 18, 491–501. [Google Scholar] [CrossRef]
- Franks, D.M.; Brereton, D.; Moran, C.J. The cumulative dimensions of impact in resource regions. Resour. Policy 2013, 38, 640–647. [Google Scholar] [CrossRef]
- Wang, Z.; Lechner, A.M.; Baumgartl, T. Mapping cumulative impacts of mining on sediment retention ecosystem service in an Australian mining region. Int. J. Sustain. Dev. World 2018, 25, 69–80. [Google Scholar] [CrossRef]
- Li, P.; Zhang, X.M. Sichou zhilu jingjidai ziyuan huanjing chengben ji shengtai fuhe qiangdu de shikong yanbian fenxi [Analysis of the spatial and temporal evolution about environmental cost and ecological load intensity of Silk Road Economic Belt]. Chin. J. Environ. Manag. 2017, 9, 69–77. [Google Scholar]
- Wang, J.S. “Yidaiyilu” yanxian guojia lvse fazhan shuiping yanjiu [Research on green development level of countries along “the Belt and Road”]. J. Environ. Manag. Coll. China 2018, 28, 23–26. [Google Scholar] [CrossRef] [PubMed]
- Liu, Y.Y.; Hao, Y. The dynamic links between CO2 emissions, energy consumption and economic development in the countries along “the Belt and Road”. Sci. Total Environ. 2018, 645, 674–683. [Google Scholar] [CrossRef] [PubMed]
- Zhang, Z.F.; He, W.J.; An, M.; Degefu, D.M.; Yuan, L.; Wu, X. Water security assessment of China’s One Belt and One Road region. Water 2019, 11, 607. [Google Scholar] [CrossRef]
- Folke, C.; Biggs, R.; Norström, A.V.; Reyers, B.; Rockström, J. Social-ecological resilience and biosphere-based sustainability science. Ecol. Soc. 2016, 21. [Google Scholar] [CrossRef]
- McGinnis, M.D.; Ostrom, E. Social-ecological system framework: Initial changes and continuing challenges. Ecol. Soc. 2014, 19, 30. [Google Scholar] [CrossRef]
- Ostrom, E. A General Framework for Analyzing Sustainability of Social-Ecological Systems. Science 2009, 325, 419–422. [Google Scholar] [CrossRef] [PubMed]
- Bolongesi, T.; Gerlak, A.K.; Giuliani, G. Explaining and Measuring Social-Ecological Pathways: The Case of Global Changes and Water Security. Sustainability 2018, 10, 4378. [Google Scholar] [Green Version]
- Yu, H. Motivation behind China’s ‘One Belt, One Road’ Initiatives and Establishment of the Asian Infrastructure Investment Bank. J. Contemp. China 2017, 26, 353–368. [Google Scholar] [CrossRef]
- Akhter, M. The Geopolitics of Infrastructure: Development, Expertise, and Nation on the Indus Rivers. University of Arizona, 2013. Available online: https://arizona.openrepository.com/handle/10150/311357 (accessed on 16 May 2019).
- Bouzarovski, S.; Bradshaw, M.; Wochnik, A. Making territory through infrastructure: The governance of natural gas transit in Europe. Geoforum 2015, 64, 217–228. [Google Scholar] [CrossRef]
- van der Putten, F.P. Infrastructure and geopolitics: China’s emerging presence in the eastern mediterranean. J. Balk. Near East. Stud. 2016, 18, 337–351. [Google Scholar] [CrossRef]
- Rodrigue, J.-P.; Comtois, C.; Slack, B. The Geography of Transport Systems, 4th ed.; Routledge: Oxford, UK, 2006. [Google Scholar]
- Roberts, G. Moscow and the Marshall plan: Politics, ideology and the onset of the cold war, 1947. Eur. Asia Stud. 1994, 46, 1371–1386. [Google Scholar] [CrossRef]
- Bräutigam, D. Aid ‘With Chinese Characteristics’: Chinese Foreign Aid and Development Finance Meet the OECD-DAC Aid Regime. J. Int. Dev. 2011, 23, 752–764. [Google Scholar] [CrossRef]
- Tan-Mullins, M.; Urban, F.; Mang, G. Evaluating the Behaviour of Chinese Stakeholders Engaged in Large Hydropower Projects in Asia and Africa. China Q. 2017, 230, 464–488. [Google Scholar] [CrossRef] [Green Version]
- Rolland, N. China’s “Belt and Road Initiative”: Underwhelming or Game-Changer? Wash. Q. 2017, 40, 127–142. [Google Scholar] [CrossRef]
- Shepard, W. The Western Europe-Western China Highway Is Coming Alive in Kazakhstan. Forbes. 3 August 2016. Available online: https://www.forbes.com/sites/wadeshepard/2016/08/03/the-western-europe-western-china-highway-is-coming-alive-in-kazakhstan/ (accessed on 16 May 2019).
- Pisei, H. Sihanoukville Highway Work to Begin. The Phnom Penh Post. 5 March 2019. Available online: https://www.phnompenhpost.com/business-post-property/sihanoukville-highway-work-begin (accessed on 16 May 2019).
- Pannier, B. No Stops in Kyrgyzstan For China-Uzbekistan Railway Line. Radio Free Europe. 3 September 2017. Available online: https://www.rferl.org/a/qishloq-ovozi-kyrgyzstan-uzbekistan-china-railway/28713485.html (accessed on 16 May 2019).
- Mahitthirook, A. Bangkok Set to be China’s Rail Hub. Bangkok Post. 28 December 2015. Available online: https://www.bangkokpost.com/news/general/808364/bangkok-set-to-be-china-rail-hub (accessed on 16 May 2019).
- XINHUA. First Phase of Thai-Chinese High Speed Rail Project Approved by Thai Cabinet. XINHUA. 11 July 2017. Available online: http://news.xinhuanet.com/english/2017-07/11/c_136435964.htm (accessed on 16 May 2019).
- Ahmed, K. Pakistan PM to Launch $230m Gwadar Airport Project. Arab News. 28 March 2019. Available online: http://www.arabnews.com/node/1474206/world (accessed on 16 May 2019).
- Gupta, R.; Orlovskiy, E. Kazakhstan and the New Silk Road. PwC. 2017. Available online: https://www.pwc.kz/en/publications/new-2017/silk-way-publication-eng.pdf (accessed on 16 May 2019).
- Jaipragas, B. Can China Really Deliver Malaysia’s Singapore Slayer? South China Morning Post. 15 April 2017. Available online: http://www.scmp.com/week-asia/politics/article/2087402/can-china-really-deliver-malaysias-singapore-slayer (accessed on 16 May 2019).
- Sirilal, R.; Aneez, S. Sri Lanka Signs $1.1 Billion China Port Deal Amid Local, Foreign Concerns. Reuters. 29 July 2017. Available online: https://www.reuters.com/article/us-sri-lanka-china-ports-idUSKBN1AE0CN?il=0 (accessed on 16 May 2019).
- CPEC Energy Priority Projects. Available online: http://cpec.gov.pk/energy (accessed on 16 May 2019).
- Otgonsuren, B. Mongolia–China–Russia Economic Corridor Infrastructure Cooperation. Erina Rep. 2015, 127. Available online: https://www.erina.or.jp/wp-content/uploads/2015/02/se12710_tssc.pdf (accessed on 16 May 2019).
- Chen, X.; Fazilov, F. Re-centering Central Asia: China’s “New Great Game” in the old Eurasian Heartland. Palgrave Commun. 2018, 4, 71. [Google Scholar] [CrossRef]
- Cao, S.; Shan, J. Sino-Myanmar Oil Pipeline Launch a Good Signal: Experts. Global Times. 18 March 2017. Available online: http://www.globaltimes.cn/content/1039861.shtml (accessed on 16 May 2019).
- AFP. China Completes $350 Million Power Plant in Tajikistan’s Capital Dushanbe. The Economic Times. 9 December 2016. Available online: https://energy.economictimes.indiatimes.com/news/power/china-completes-350-million-power-plant-in-tajikistan/55886095 (accessed on 16 May 2019).
- Wong, S.L.; Gordeyeva, M. Silk Road Hub or Tax Haven? Reuters. 5 June 2017. Available online: https://www.reuters.com/article/us-china-silkroad-horgos/silk-road-hub-or-tax-haven-chinas-new-border-trade-zone-may-be-less-than-it-seems-idUSKBN18V15Z (accessed on 16 May 2019).
- CPEC. Development of Free Zone. Available online: http://cpec.gov.pk/project-details/36 (accessed on 16 May 2019).
- Laurance, W.F.; Sloan, S.; Weng, L.; Sayer, J.A. Estimating the Environmental Costs of Africa’s Massive “Development Corridors”. Curr. Biol. 2015, 25, 3202–3208. [Google Scholar] [CrossRef]
- Siciliano, G.; Urban, F.; Tan-Mullins, M.; Mohan, G. Large dams, energy justice and the divergence between international, national and local developmental needs and priorities in the global South. Energy Res. Soc. Sci. 2018, 41, 199–209. [Google Scholar] [CrossRef]
- Canepa, E.; Builtjes, P.J.H. Thoughts on Earth System Modeling: From global to regional scale. Earth Sci. Rev. 2017, 171, 456–462. [Google Scholar] [CrossRef]
- Steffen, W.; Leinfelder, R.; Zalasiewicz, J.; Waters, C.N.; Williams, M.; Summerhayes, C.; Schellnhuber, H.J. Stratigraphic and Earth System approaches to defining the Anthropocene. Earth’s Future 2016, 4, 324–345. [Google Scholar] [CrossRef] [Green Version]
- Venter, O.; Sanderson, E.W.; Magrach, A.; Allan, J.R.; Beher, J.; Jones, K.R.; Watson, J.E.M. Sixteen years of change in the global terrestrial human footprint and implications for biodiversity conservation. Nat. Commun. 2016, 7, 1–11. [Google Scholar] [CrossRef] [PubMed]
- Vitousek, P.M.; Mooney, H.A.; Lubchenco, J.; Melillo, J.M. Human Domination of Earth’s Ecosystems. Science 1997, 277, 494–499. [Google Scholar] [CrossRef]
- Leopold, L.B. A Reverence for Rivers. Berkeley, CA, USA. 1977. Available online: http://riogranderestoration.org/manager/download_files/15.pdf (accessed on 16 May 2019).
- Rockström, J.; Steffen, W.; Noone, K.; Persson, Å.; Chapin, F.S.I.; Lambin, E.; Foley, J. Planetary Boundaries: Exploring the Safe Operating Space for Humanity. Ecol. Soc. 2009, 14, 32. [Google Scholar] [CrossRef]
- Wang, B.; Wu, R.G.; Lau, K.-M. Interannual Variability of the Asian Summer Monsoon: Contrasts between the Indian and the Western North Pacific–East Asian Monsoons. J. Clim. 2001, 14, 4073–4090. [Google Scholar] [CrossRef]
- Indoitu, R.; Orlovsky, L.; Orlovsky, N. Dust storms in Central Asia: Spatial and temporal variations. J. Arid Environ. 2012, 85, 62–70. [Google Scholar] [CrossRef]
- Kishtawal, C.M.; Niyogi, D.; Tewari, M.; Pielke, R.A.; Shepherd, J.M. Urbanization signature in the observed heavy rainfall climatology over India. Int. J. Climatol. 2010, 30, 1908–1916. [Google Scholar] [CrossRef]
- Niyogi, D.; Kishtawal, C.; Tripathi, S.; Govindaraju, R.S. Observational evidence that agricultural intensification and land use change may be reducing the Indian summer monsoon rainfall. Water Resour. Res. 2010, 46. [Google Scholar] [CrossRef] [Green Version]
- Jencso, K.G.; McGlynn, B.L.; Gooseff, M.N.; Wondzell, S.M.; Bencala, K.E.; Marshall, L.A. Hydrologic connectivity between landscapes and streams: Transferring reach- and plot-scale understanding to the catchment scale. Water Resour. Res. 2009, 45. [Google Scholar] [CrossRef]
- Wang, Y.; Lin, Z. Jiaqiang dameigonghe ciquyu huanjing baohu hezuo wei “Yidaiyilu” zhanlve tigong huanbao zhicheng [Strengthening environmental cooperation in the Greater Mekong sub-region to support the One Belt One Road strategy]. Environ. Sustain. Dev. 2015, 2, 9–12. [Google Scholar]
- Howard, K.W.F.; Howard, K.K. The new “Silk Road Economic Belt” as a threat to the sustainable management of Central Asia’s transboundary water resources. Environ. Earth. Sci. 2016, 75, 1–12. [Google Scholar] [CrossRef]
- Grieve, I.C. Human impacts on soil properties and their implications for the sensitivity of soil systems in Scotland. CATENA 2001, 42, 361–374. [Google Scholar] [CrossRef]
- Norra, S.; Stüben, D. Urban Soils. J. Soils Sediments 2003, 3, 230–233. [Google Scholar] [CrossRef]
- Derbyshire, E.; Fort, M.; Owen, L.A. Geomorphological hazards along the Karakoram highway: Khunjerab pass to the Gilgit river, Northernmost Pakistan. Erdkunde 2001, 55, 49–71. [Google Scholar] [CrossRef]
- Johnstone, C.P.; Lill, A.; Reina, R.D. Habitat loss, fragmentation and degradation effects on small mammals: Analysis with conditional inference tree statistical modelling. Biol. Conserv. 2014, 176, 80–98. [Google Scholar] [CrossRef]
- Laurance, W.F.; Goosem, M.; Laurance, S.G.W. Impacts of roads and linear clearings on tropical forests. Trends Ecol. Evol. 2009, 24, 659–669. [Google Scholar] [CrossRef] [PubMed]
- Laurance, W.F.; Peletier-Jellema, A.; Geenen, B.; Koster, H.; Verweij, P.; Van Kuijk, M. Reducing the global environmental impacts of rapid infrastructure expansion. Curr. Biol. 2015, 25, R259–R262. [Google Scholar] [CrossRef] [Green Version]
- Zehe, E.; Sivapalan, M. Threshold behaviour in hydrological systems as (human) geo-ecosystems: Manifestations, controls, implications. Hydrol. Earth Syst. Sci. 2009, 13, 1273–1297. [Google Scholar] [CrossRef]
- Karlson, M.; Mörtberg, U.; Balfors, B. Road ecology in environmental impact assessment. Environ. Impact Assess. 2014, 48, 10–19. [Google Scholar] [CrossRef]
- Laurance, W.F.; Balmford, A. Land use: A global map for road building. Nature 2013, 495, 308–309. [Google Scholar] [CrossRef]
- Nokelaynen, T.S. Mapping of the environmental impacts of railway transport in Russia. InterCarto InterGIS 2016, 22, 256–261. [Google Scholar] [CrossRef]
- Ashford, N.J.; Mumayiz, S.A.; Wright, P.H. Airport Engineering: Planning, Design and Development of 21st Century Airports, 4th ed.; John Wiley & Sons: Hoboken, NJ, USA, 2011. [Google Scholar]
- Kurniawan, J.S.; Khardi, S. Comparison of methodologies estimating emissions of aircraft pollutants, environmental impact assessment around airports. Environ. Impact Assess. 2011, 31, 240–252. [Google Scholar] [CrossRef]
- Nunes, L.M.; Zhu, Y.-G.; Stigter, T.Y.; Monteiro, J.P.; Teixeira, M.R. Environmental impacts on soil and groundwater at airports: Origin, contaminants of concern and environmental risks. J. Environ. Monit. 2011, 13, 3026–3039. [Google Scholar] [CrossRef] [PubMed]
- Puig, M.; Michail, A.; Wooldridge, C.; Darbra, R.M. Benchmark dynamics in the environmental performance of ports. Mar. Pollut. Bull. 2017, 121, 111–119. [Google Scholar] [CrossRef] [PubMed]
- Trozzi, C.; Vaccaro, R. Environmental Impact of Port Activities. WIT Trans. Built Environ. 2000, 51, 151–161. [Google Scholar]
- Milt, A.W.; Gagnolet, T.; Armsworth, P.R. Synergies and Tradeoffs Among Environmental Impacts Under Conservation Planning of Shale Gas Surface Infrastructure. Environ. Manag. 2016, 57, 21–30. [Google Scholar] [CrossRef] [PubMed]
- Biasotto, L.D.; Kindel, A. Power lines and impacts on biodiversity: A systematic review. Environ. Impact Assess. 2018, 71, 110–119. [Google Scholar] [CrossRef]
- Jiang, Y.Z.; An, J.T.; Hong, J.E.; Zhao, R.X.; Li, F.W. Tegaoya shudian gongcheng daqi huanjing xiaoyi fenxi [Assessment methods for atmospheric environmental benefits of Ultra High Voltage power transmission projects]. Shandong Electr. Power 2016, 6, 5–10. [Google Scholar]
- Fearnside, P.M. Environmental and Social Impacts of Hydroelectric Dams in Brazilian Amazonia: Implications for the Aluminum Industry. World Dev. 2016, 77, 48–65. [Google Scholar] [CrossRef]
- Wang, Q.G.; Du, Y.H.; Su, Y.; Chen, K.Q. Environmental Impact Post-Assessment of Dam and Reservoir Projects: A Review. Procedia Environ. Sci. 2012, 13, 1439–1443. [Google Scholar] [CrossRef] [Green Version]
- Munawer, M.E. Human health and environmental impacts of coal combustion and post-combustion wastes. J. Sust. Min. 2017, 17, 87–96. [Google Scholar] [CrossRef]
- Thopil, G.A.; Pouris, A. A 20 year forecast of water usage in electricity generation for South Africa amidst water scarce conditions. Renew. Sust. Energy Rev. 2016, 62, 1106–1121. [Google Scholar] [CrossRef] [Green Version]
- Jaber, S. Environmental Impacts of Wind Energy. J. Clean Energy Technol. 2014, 1, 251–254. [Google Scholar] [CrossRef]
- Delfanti, L.; Colantoni, A.; Recanatesi, F.; Bencardino, M.; Sateriano, A.; Zambon, I.; Salvati, L. Solar plants, environmental degradation and local socioeconomic contexts: A case study in a Mediterranean country. Environ. Impact Assess. 2016, 61, 88–93. [Google Scholar] [CrossRef]
- Acbarpur, D. Assessment of environmental impact as a result of industrial development in the Pars special economic energy zone. Principy Èkol. 2014, 3, 25–41. [Google Scholar]
- Chen, Y.; Zhang, Z.; Du, S.Q.; Shi, P.J.; Tao, F.L.; Doyle, M. Water quality changes in the world’s first special economic zone, Shenzhen, China. Water Resour. Res. 2011, 47. [Google Scholar] [CrossRef]
- Lechner, A.M.; McIntyre, N.; Witt, K.; Raymond, C.M.; Arnold, S.; Scott, M.; Rifkin, W. Challenges of integrated modelling in mining regions to address social, environmental and economic impacts. Environ. Model. Softw. 2017, 93, 268–281. [Google Scholar] [CrossRef]
- Lal, R.; Suleimenov, M.; Stewart, B.A.; Hansen, D.O.; Doraiswamy, P. (Eds.) Climate Change and Terrestrial Carbon Sequestration in Central Asia; Taylor & Francis: London, UK, 2007. [Google Scholar]
- Gong, Z.; Peng, D.; Wen, J.; Cai, Z.; Wang, T.; Hu, Y.; Xu, J. Research on trend of warm-humid climate in Central Asia. IOP Conf. Ser. Earth Environ. Sci. 2017, 74. [Google Scholar] [CrossRef]
- Keeling, D.J. Transportation geography: New directions on well-worn trails. Prog. Hum. Geogr. 2007, 31, 217–225. [Google Scholar] [CrossRef]
- He, C.; Wei, Y.D.; Xie, X. Globalization, Institutional Change, and Industrial Location: Economic Transition and Industrial Concentration in China. Reg. Stud. 2008, 42, 923–945. [Google Scholar] [CrossRef]
- Sjöberg, Ö.; Sjöholm, F. Trade Liberalization and the Geography of Production: Agglomeration, Concentration, and Dispersal in Indonesia’s Manufacturing Industry. Econ. Geogr. 2009, 80, 287–310. [Google Scholar] [CrossRef]
- Röller, L.-H.; Waverman, L. Telecommunications Infrastructure and Economic Development: A Simultaneous Approach. Am. Econ. Rev. 2001, 91, 909–923. [Google Scholar] [CrossRef]
- Skorobogatova, O.; Kuzmina-Merlino, I. Transport Infrastructure Development Performance. Procedia Eng. 2017, 178, 319–329. [Google Scholar] [CrossRef]
- Hackler, D. Invisible Infrastructure and the City. Am. Behav. Sci. 2003, 46, 1034–1055. [Google Scholar] [CrossRef]
- Fourie, J. Economic infrastructure: A review of definitions, theory and empirics. S. Afr. J. Econ. 2006, 74, 530–556. [Google Scholar] [CrossRef]
- Crane, B.; Albrecht, C.; Duffin, K.M.; Albrecht, C. China’s special economic zones: An analysis of policy to reduce regional disparities. Reg. Stud. Reg. Sci. 2018, 5, 98–107. [Google Scholar] [CrossRef]
- Tan-Mullins, M. The Environmental Implications of Chinese State-owned Enterprises (CSOEs) investment in Africa’s energy sector. Int. J. Energy Secur. Environ. Res. 2014, 1, 43–58. [Google Scholar]
- Chertow, M.R. The IPAT Equation and Its Variants. J. Ind. Ecol. 2000, 4, 13–29. [Google Scholar] [CrossRef]
- Waggoner, P.E.; Ausubel, J.H. A framework for sustainability science: A renovated IPAT identity. Proc. Natl. Acad. Sci. USA 2002, 99, 7860–7865. [Google Scholar] [CrossRef] [Green Version]
- Cervero, R. Transit-Oriented Development in the United States: Experiences, Challenges, and Prospects; The National Academic Press: Washington, DC, USA, 2004. [Google Scholar]
- Wang, Y. Huoerguosi zai sichouzhilu jingjidai “Zhong-ha jingji zoulang” jianshe zhong fahui hulian hutong zuoyong de youshi tuxian [The connectivity advantages of Khorgos in the China-Kazakhstan economic corridor of the Silk Road Economic Belt]. New Silk Road Horizon 2016, 8, 44–47. [Google Scholar]
- Wang, L. Zhong-ba jingji zoulang jianshe shiru kuaichedao [China-Pakistan economic corridor construction enters the fast lane]. New Silk Road Horizon 2014, 8, 82. [Google Scholar]
- Xu, J.; Chen, K.; Yang, S.; Lin, Y. “Yidaiyilu” jiaotong jichu jianshe de guoji jingmaoxiao [International trade effects of One Belt One Road transport infrastructure]. Asia Pac. Econ. Rev. 2016, 3, 3–11. [Google Scholar]
- Cole, M.A.; Elliott, R.J.R. Determining the trade–environment composition effect: The role of capital, labor and environmental regulations. J. Environ. Econ. Manag. 2003, 46, 363–383. [Google Scholar] [CrossRef]
- Dong, Z.; Ge, C.; Wang, J.; Yan, X.; Cheng, C. “Yidaiyilu” lvse fazhan de zhanlve shishi kuangjia [Strategic framework for green development of OBOR]. Chin. J. Environ. Manag. 2016, 2, 31–35. [Google Scholar]
- van der Kley, D. China Shifts Polluting Cement to Tajikistan. China Dialogue. 8 August 2016. Available online: https://www.chinadialogue.net/article/show/single/en/9174-China-shifts-polluting-cement-to-Tajikistan (accessed on 16 May 2019).
- Levinson, A.; Taylor, M.S. Unmasking the pollution haven effect. Int. Econ. Rev. 2008, 49, 223–254. [Google Scholar] [CrossRef]
- Cherniwchan, J. Trade liberalization and the environment: Evidence from NAFTA and U.S. manufacturing. J. Int. Econ. 2017, 105, 130–149. [Google Scholar] [CrossRef]
- Saunders, C.; Barber, A.; Taylor, G. Food Miles—Comparative Energy/Emissions Performance of New Zealand’s Agriculture Industry; Agribusiness & Economics Research Unit, Lincoln University: Christchurch, New Zealand, 2006; Volume 295, Available online: https://hdl.handle.net/10182/125 (accessed on 16 May 2019).
- Liu, N.Q.; Dai, J. Woguodui “yidaiyilu” yanxian guojia OFDI de huanjing [Empirical analysis on the environmental effects of China’s OFDI to countries along “The Belt and Road”. Bus. Manag. J. 2017, 39, 6–23. [Google Scholar]
- Frankel, J.A.; Romer, D. Does trade cause growth? Am. Econ. Rev. 1999, 89, 379–399. [Google Scholar] [CrossRef]
- Allard, A.; Takman, J.; Uddin, G.S.; Ahmed, A. The N-shaped environmental Kuznets curve: An empirical evaluation using a panel quantile regression approach. Environ. Sci. Pollut. Res. Int. 2018, 25, 5848–5861. [Google Scholar] [CrossRef]
- Bo, S. A Literature Survey on Environmental Kuznets Curve. Energy Procedia 2011, 5, 1322–1325. [Google Scholar] [CrossRef] [Green Version]
- Dinda, S. Environmental Kuznets Curve Hypothesis: A Survey. Ecol. Econ. 2004, 49, 431–455. [Google Scholar] [CrossRef] [Green Version]
- Stern, D.I. The Rise and Fall of the Environmental Kuznets Curve. World Dev. 2004, 32, 1419–1439. [Google Scholar] [CrossRef]
- Dasgupta, S.; Laplante, B.; Wang, H.; Wheeler, D. Confronting the Environmental Kuznets Curve. J. Econ. Perspect. 2002, 16, 147–168. [Google Scholar] [CrossRef]
- Panayotou, T. Demystifying the environmental Kuznets curve: Turning a black box into a policy tool. Environ. Dev. Econ. 1997, 2, 465–484. [Google Scholar] [CrossRef]
- European Commission. CO2 Time Series 1990–2015 Per Region/Country. Available online: http://edgar.jrc.ec.europa.eu/overview.php?v=CO2ts1990-2015 (accessed on 16 May 2019).
- Ang, J.B. CO2 emissions, research and technology transfer in China. Ecol. Econ. 2009, 68, 2658–2665. [Google Scholar] [CrossRef]
- McCrone, A. Global Trends in Renewable Energy Investment 2017. Frankfurt. Available online: http://fs-unep-centre.org/sites/default/files/publications/globaltrendsinrenewableenergyinvestment2017.pdf (accessed on 16 May 2019).
- Hart, M.; Bassett, L.; Johnson, B. Research Note on U.S. and Chinese Coal-Fired Power Data and Emissions. Center for American Progress, 2017. Available online: https://www.americanprogress.org/issues/green/reports/2017/05/15/432136/research-note-u-s-chinese-coal-fired-power-data/ (accessed on 16 May 2019).
- Shi, X. “Yidaiyilu” beijing xia de zhongguo keji “zouchuqu” zhanlve [Chinese technology “going out” in the context of One Belt One Road]. Theor. Res. 2017, 2, 41–46. [Google Scholar]
- Levina, M. China Helps Upgrade Bishkek Thermal Power Plant. The Times of Central Asia. 23 September 2013. Available online: https://www.timesca.com/index.php/news/8295-china-helps-upgrade-bishkek-thermal-power-plant (accessed on 16 May 2019).
- Awasthi, D. Bangladesh’s Increased Commitment to China Helps It Land Deals Beyond OBOR. Frontera. 22 May 2017. Available online: https://frontera.net/news/asia/bangladesh-has-chosen-the-obor-on-its-path-to-success-and-china-is-responding/# (accessed on 16 May 2019).
- Grossman, G.; Krueger, A. Environmental Impacts of a North American Free Trade Agreement (No. 3914). Cambridge, MA, USA. 2019. Available online: https://0-doi-org.brum.beds.ac.uk/10.3386/w3914 (accessed on 16 May 2019).
- Antweiler, W.; Copeland, B.R.; Taylor, M.S. Is Free Trade Good for the Environment? Am. Econ. Rev. 2001, 91, 877–908. [Google Scholar] [CrossRef] [Green Version]
- Cole, M.A. Does trade liberalization increase national energy use? Econ. Lett. 2006, 92, 108–112. [Google Scholar] [CrossRef]
- Shen, J. Trade liberalization and environmental degradation in China. Appl. Econ. 2008, 40, 997–1004. [Google Scholar] [CrossRef]
- Guttman, D.; Young, O.; Jing, Y.; Bramble, B.; Bu, M.; Chen, C.; Zeidan, R. Environmental governance in China: Interactions between the state and “nonstate actors”. J. Environ. Manag. 2018, 220, 126–135. [Google Scholar] [CrossRef]
- Vanclay, F.; Esteves, A.M.; Aucamp, I.; Franks, D.M. Social Impact Assessment: Guidance for assessing and managing the social impacts of projects. Int. Assoc. Impact Assess. 2015, 1, 98. Available online: https://www.iaia.org/uploads/pdf/SIA_Guidance_Document_IAIA.pdf (accessed on 16 May 2019).
- Dugarova, E.; Utting, P. Social Drivers of Sustainable Development. Geneva, Switzerland, 2013. Available online: http://www.unrisd.org/social-drivers-note (accessed on 16 May 2019).
- Eisenman, J.; Stewart, D.T. China’s New Silk Road Is Getting Muddy. Foreign Policy. 9 January 2017. Available online: https://foreignpolicy.com/2017/01/09/chinas-new-silk-road-is-getting-muddy/ (accessed on 16 May 2019).
- Yao, Y.; Zhang, Y. Public Perception of Chinese Investment in Myanmar and its Political Consequences: A Survey Experimental Approach. Policy Brief, International Growth Centre, 2018. Available online: https://www.theigc.org/wp-content/uploads/2018/06/Yao-Zhang-2018-Policy-Brief.pdf (accessed on 16 May 2019).
- Levina, M. Kyrgyzstan: China Demands to Protect Investor After Locals Burnt Gold-Processing Plant. The Times of Central Asia. 13 April 2018. Available online: https://www.timesca.com/index.php/news/19611-kyrgyzstan-china-demands-to-protect-investor-after-locals-burnt-gold-processing-plant (accessed on 16 May 2019).
- KCETA. 2017 Chinese Enterprises in Kenya Social Responsibility Report; Kenya China Economic and Trade Association: Nairobi, Kenya, 2017. Available online: http://ke2.mofcom.gov.cn/17en.pdf (accessed on 16 May 2019).
- Han, M.Y.; Yao, Q.H.; Liu, W.D.; Dunford, M. Tracking embodied carbon flows in the Belt and Road regions. J. Geogr. Sci. 2018, 28, 1263–1274. [Google Scholar] [CrossRef] [Green Version]
- Zheng, S.; Kahn, M.E.; Sun, W.; Luo, D. Incentives for China’s urban mayors to mitigate pollution externalities: The role of the central government and public environmentalism. Reg. Sci. Urban Econ. 2014, 47, 61–71. [Google Scholar] [CrossRef]
- Chen, W.Y.; Hua, J. Citizens’ distrust of government and their protest responses in a contingent valuation study of urban heritage trees in Guangzhou, China. J. Environ. Manag. 2015, 155, 40–48. [Google Scholar] [CrossRef] [PubMed]
- Steinhardt, H.C.; Wu, F. In the Name of the Public: Environmental Protest and the Changing Landscape of Popular Contention in China. China J. 2016, 75, 61–82. [Google Scholar] [CrossRef] [Green Version]
- Wang, X.; Berman, E.M.; Chen, D.; Niu, X. Strategies to improve environmental networks for pollution control: Evidence from eco-compensation programs in China. J. Environ. Manag. 2019, 234, 387–395. [Google Scholar] [CrossRef] [PubMed]
- Chen, B.; Suo, L.; Ma, J. A Network Approach to Interprovincial Agreements. State Local Gov. Rev. 2015, 47, 181–191. [Google Scholar] [CrossRef]
- Liu, R.J. “Yidaiyilu” zhong de shengtai buchang yanjiu zhongshu yu zhanwang [Review of ecological compensation in “One Belt and One Road”]. J. Anhui Adm. Inst. 2017, 4, 79–83. [Google Scholar]
- China MEP. Guidance on Promoting Green Belt and Road. 2017. Available online: https://eng.yidaiyilu.gov.cn/qwyw/rdxw/12484.htm (accessed on 16 May 2019).
- China MOFCOM. Tuidong Gongjian Sichouzhilu Jingjidai he 21 Shiji Haishang Sichouzhilu de Yuanjing [Vision and Actions on Jointly Building Silk Road Economic Belt and 21st-Century Maritime Silk Road]. Ministry of Commerce: Beijing, China, 2015. Available online: http://www.mofcom.gov.cn/article/i/dxfw/jlyd/201601/20160101243342.shtml (accessed on 16 May 2019).
- China MOFCOM. Zhongguo Qiye Jingwai Kechixu Senlin Peiyv Zhinan [A Guide on Sustainable Overseas Silviculture by Chinese Enterprises]. State Forestry Administration and Ministry of Commerce: Beijing, China, 2007. Available online: http://www.mofcom.gov.cn/aarticle/b/g/200712/20071205265858.html (accessed on 16 May 2019).
- China MOFCOM. Zhongguo Qiye Jingwai Senlin Kechixu Jingying Liyong Zhinan [A Guide on Sustainable Overseas Forest Management and Utilization by Chinese Enterprises]. State Forestry Administration and Ministry of Commerce: Beijing, China, 2009. Available online: http://www.mofcom.gov.cn/aarticle/b/g/200904/20090406191363.html (accessed on 16 May 2019).
- Chen, Y.; Muianga, M.; Chen, S.; Li, M. Manual on Sustainable Overseas Forest Management Trade and Investment by Chinese Enterprises: Mozambique Version. 2016. Available online: http://pubs.iied.org/G04146/ (accessed on 16 May 2019).
- China MEP. The Belt and Road Ecological and Environmental Cooperation Plan. 2017. Available online: https://eng.yidaiyilu.gov.cn/zchj/qwfb/13392.htm (accessed on 16 May 2019).
- Zhu, R. Understanding China’s Overseas Investments Governance and Analysis of Environmental and Social Policies. Global Environmental Institute, 2015. Available online: http://www.geichina.org/_upload/file/book/goingoutreport/Understanding_China’s_Overseas_Investments_Governance_and_Anyalsis%20of_E&S_Policies.pdf (accessed on 10 June 2019).
- Meng, S. Following the Money: Chinese NGOs Overseas. China Dialogue. 20 September 2010. Available online: https://www.chinadialogue.net/article/show/single/en/3825-Following-the-money (accessed on 16 May 2019).
- Cheshmehzangi, A.; Xie, L.; Tan-Mullins, M. The role of international actors in low-carbon transitions of Shenzhen’s International Low Carbon City in China. Cities 2018, 74, 64–74. [Google Scholar] [CrossRef]
- Yan, K. Interview with Dr. Hu Tao on China’s Overseas Investment Guidelines. International Rivers. 24 April 2013. Available online: https://www.internationalrivers.org/resources/interview-with-dr-hu-tao-on-china-s-overseas-investment-guidelines-7944 (accessed on 16 May 2019).
- Lau, Z.Z. Empowering SMEs through Belt and Road. The Malaysian Reserve. 20 February 2018. Available online: https://themalaysianreserve.com/2018/02/20/empowering-smes-belt-road/ (accessed on 16 May 2019).
- Orestes, G.D.; Ryan, M. The Belt and Road Initiatives: Opportunities and Challenges for EU SMEs. EU-SME Centre and China-Britain Business Business Council, 2018. Available online: http://www.eusmecentre.org.cn/it/guideline/belt-and-road-initiatives-opportunities-and-challenges-eu-smes (accessed on 10 June 2019).
- Green Finance Initiative. Greening the Belt and Road. City of London Corporation. 2017. Available online: http://greenfinanceinitiative.org/wp-content/uploads/2017/10/Greening-the-Belt-and-Road-English.pdf (accessed on 10 June 2019).
- Cooley, A. The Emerging Political Economy of OBOR. Center for Strategic and International Studies, 2016. Available online: https://www.csis.org/analysis/emerging-political-economy-obor (accessed on 16 May 2019).
- Hurley, J.; Morris, S.; Portelance, G. Examining the Debt Implications of the Belt and Road Initiative from a Policy Perspective; CGD Policy Paper No. 121; Center for Global Development: Washington, DC, USA, 2018; Available online: www.cgdev.org (accessed on 16 May 2019).
- Tan-Mullins, M. Dancing to China’s Tune: Understanding the Impacts of a Rising China through the Political-Ecology Framework. J. Curr. Chin. Aff. 2017, 3, 1–30. [Google Scholar] [CrossRef]
- Iyer, R. Good News for India as North-South Trade Corridor Takes Shape. The Diplomat. 10 June 2017. Available online: https://thediplomat.com/2017/06/good-news-for-india-as-north-south-trade-corridor-takes-shape/ (accessed on 16 May 2019).
- Cadier, D. The Geopolitics of Eurasian Economic Integration. London School of Economics. 2014. Available online: http://www.lse.ac.uk/ideas/Assets/Documents/reports/LSE-IDEAS-Geopolitics-of-Eurasian-Economic-Intergration.pdf (accessed on 16 May 2019).
- Goodman, M.P.; Hillman, J.A. Is China Winning the Scramble for Eurasia? The National Interest. 21 August 2017. Available online: http://nationalinterest.org/feature/the-new-cold-war-was-never-inevitable-21994?page=show (accessed on 16 May 2019).


| Infrastructure Type | Country | Route | Examples | Construction | Area (sq km) | Total Length (km) 1 | Intensity | Type 2 | Ref |
|---|---|---|---|---|---|---|---|---|---|
| Transport | |||||||||
| Road | Kazakhstan | New Eurasia Land Bridge | Western Europe–Western China Highway | 2008–2018 | 8445 | 8445 | Med | Linear | [40] |
| Cambodia | China–Indochina Peninsula Economic Corridor | Phnom Penh–Sihanoukville highway | 2019–2023 | 190 | 190 | Med | Linear | [41] | |
| Rail | Kyrgyzstan | China–Central Asia–West Asia Corridor | Uzbekistan–Kyrgyzstan-China railway | TBC | 250 | 500 | Low | Linear | [42] |
| Laos, Thailand | China–Indochina Peninsula Economic Corridor | Kunming–Vientiane railway; Vientiane–Bangkok high speed rail | 2015–2022 | 908 | 1816 | Low | Linear | [43,44] | |
| Airport | Pakistan | China–Pakistan Economic Corridor | Gwadar | 2019–2022 | 17.4 | 4.2 | Med | Nodal | [45] |
| Seaport 3 | Kazakhstan | New Eurasia Land Bridge | Kuryk | 2017–2022 | 1 | 1 | Med | Nodal | [46] |
| Malaysia | China–Indochina Peninsula Economic Corridor | Malacca | 2014–2019 | 5.5 | 2.4 | Med | Nodal | [47] | |
| Sri Lanka | Maritime Silk Road | Hambantota | 2008–2014 | 60.7 | 7.8 | Med | Nodal | [48] | |
| Energy | |||||||||
| Power lines | Pakistan | China–Pakistan Economic Corridor | Matiari–Lahore, Matiari–Faisalabad | 2017–2021 | 203 | 2030 | Low | Linear | [49] |
| Pipeline | Mongolia | China–Mongolia–Russia Economic Corridor | Russia–Mongolia–China pipeline | TBC | 500 | 1000 | Med | Linear | [50] |
| Central Asia | China–Central Asia–West Asia Corridor | Pan-Central Asia pipeline: Kazakhstan, Kyrgyzstan, Tajikistan, Turkmenistan, Uzbekistan to China | 2008 | 920 | 1840 | Med | Linear | [51] | |
| Myanmar | Bangladesh–China–India-Myanmar Economic Corridor | Kyaukpyu–Kunming pipeline | 2010–2017 | 385 | 770 | Med | Linear | [52] | |
| Coal plants | Tajikistan | China–Central Asia–West Asia Corridor | Dushanbe | 2012–2016 | 0.04 | 0.2 | High | Nodal | [53] |
| Hydropower | Pakistan | China–Pakistan Economic Corridor | Diamer–Bhasha dam (Indus River) | 2011–2029 | 1200 | 140 | High | Nodal | [49] |
| Wind farms | Pakistan | China–Pakistan Economic Corridor | Gharo, Jhimpir, Cacho | 2017 | 60 | 7.7 | Low | Nodal | [49] |
| Solar farms | Pakistan | China–Pakistan Economic Corridor | Quaid-e-Azam Bahawalpur | 2014–2015 | 26 | 5.1 | Low | Nodal | [49] |
| Economic | |||||||||
| Special Economic zone | Kazakhstan | New Eurasia Land Bridge | China–Kazakhstan Khorgos International Border Cooperation Center | 2010 | 5.6 | 2.4 | Med | Concentrated | [54] |
| Pakistan | China–Pakistan Economic Corridor | Gwadar Free Trade Zone | 2016–2018 | 25 | 5 | Med | Concentrated | [55] |
| Infrastructure Type | Impact on Earth Systems | e.g., Ref | |||
|---|---|---|---|---|---|
| Atmosphere | Hydrosphere | Geosphere | Biosphere | ||
| Transport | |||||
| Road | Air pollution; dust; microclimatic effects from warming; noise | Impede drainage; pollution and sediments in runoff; littering | Soil erosion; landslides especially in mountainous terrain | Habitat loss; edge and barrier effects, particularly wider clearings; roadkills; fragmentation; human and exotic species invasions | [78,79] |
| Rail | Less local pollution as pollution generated at power plant for electric trains; noise | Contaminants in runoff | Less than road but still present; soil pollution | Similar to roads, including fragmentation and barrier effects. Generally, less severe than roads; limited stops reduce human footprint | [79,80] |
| Airport | Air pollution; acid rain; noise | Impede drainage; chemical contaminants in runoff; solid and hazardous waste | Soil pollution | Often affects floodplains, wetlands and coasts; noise and light disturbance | [81,82,83] |
| Seaport | Local air pollution from ships and refineries | Direct discharge of pollutants | Dredging and reclamation | Exotic species invasions from ballast discharge; algal blooms from nutrient runoff; mortality from ship strikes and entanglement in waste | [84,85] |
| Energy | |||||
| Pipelines | Air pollution; noise | Contaminants in runoff; risk of accidents | Soil pollution | Habitat loss; fragmentation; human and exotic species invasions | [86] |
| Power lines | Electromagnetic disturbance; redistribution of pollution to power source | Contaminants in runoff (mainly during construction) | Soil pollution, compaction (mainly during construction) | Habitat loss; edge and barrier effects; fragmentation; human and exotic species invasions; avian/bat mortality | [87,88] |
| Hydropower | Heavy usage of energy-intensive concrete, usually produced from coal-fired plants; greenhouse gas emissions from decomposing biomass in reservoir | Alteration of river flow and sediment transport | Higher water table affects soil, can cause landslides and soil erosion | Hydrological changes affect aquatic ecosystem; submersion of vast swathes of forest | [89,90] |
| Coal plants | Toxic air pollution; acid rain; greenhouse gases | Heavy metal contamination; high water usage; thermal pollution | Subsidence from lowering of water table | Physical habitat destruction; air and water pollutants | [91,92] |
| Wind farms | Significantly lower impact than fossil fuel power plants, but will still have life-cycle impacts | Avian/bat mortality | [93] | ||
| Solar farms | Thermal pollution and microclimatic changes; glare effect | Reduced infiltration capacity due to shading of soil, potentially increasing runoff | Soil sealing, shading and degradation | Landscape alteration and habitat fragmentation | [94] |
| Economic | |||||
| Special Economic Zone | Air pollution; noise | Impede drainage–flooding risks; pollution and sediments in runoff | Soil erosion and pollution | Habitat loss and fragmentation driven by land cover change and urbanisation | [95,96] |
| Category | Type | Examples | Primarily Physical | Function |
|---|---|---|---|---|
| Transport | Linear | Road, rail | Y | Movement of people and goods between settlements separated by space |
| Nodal | Airports, seaports, rail terminal | Y | Serve as land-sea, land-air, and land-land interface | |
| Energy | Linear | Pipelines, power lines | Y | Energy transmission across space |
| Nodal | Dams, coal, wind, solar, mines | Y | Energy generation-convert energy source into form suitable for human use | |
| Communication | Linear | Fibre-optic cables | Y* | Movement of information between settlements separated by space |
| Nodal | Receiving stations | Y* | Serve as network-network or network-user interface | |
| Economic | Concentrated | Special Economic Zones (SEZs) | N | Concentrate economic activity in a geographically-limited area |
| Dispersed | Development incentives, financial mechanisms | N | Facilitate economic activity across a wider region |
© 2019 by the authors. Licensee MDPI, Basel, Switzerland. This article is an open access article distributed under the terms and conditions of the Creative Commons Attribution (CC BY) license (http://creativecommons.org/licenses/by/4.0/).
Share and Cite
Teo, H.C.; Lechner, A.M.; Walton, G.W.; Chan, F.K.S.; Cheshmehzangi, A.; Tan-Mullins, M.; Chan, H.K.; Sternberg, T.; Campos-Arceiz, A. Environmental Impacts of Infrastructure Development under the Belt and Road Initiative. Environments 2019, 6, 72. https://0-doi-org.brum.beds.ac.uk/10.3390/environments6060072
Teo HC, Lechner AM, Walton GW, Chan FKS, Cheshmehzangi A, Tan-Mullins M, Chan HK, Sternberg T, Campos-Arceiz A. Environmental Impacts of Infrastructure Development under the Belt and Road Initiative. Environments. 2019; 6(6):72. https://0-doi-org.brum.beds.ac.uk/10.3390/environments6060072
Chicago/Turabian StyleTeo, Hoong Chen, Alex Mark Lechner, Grant W. Walton, Faith Ka Shun Chan, Ali Cheshmehzangi, May Tan-Mullins, Hing Kai Chan, Troy Sternberg, and Ahimsa Campos-Arceiz. 2019. "Environmental Impacts of Infrastructure Development under the Belt and Road Initiative" Environments 6, no. 6: 72. https://0-doi-org.brum.beds.ac.uk/10.3390/environments6060072