Article

Production of Ethanol from Livestock, Agricultural, and Forest Residuals: An Economic Feasibility Study

1
USDA-ARS, Coastal Plains Soil, Water & Plant Research Center, Florence, SC 29501, USA
2
USDA-FS, Forest Product Laboratory, Madison, WI 53726, USA
3
Leibniz Institute for Agricultural Engineering and Bioeconomy, 14469 Potsdam-Bornim, Germany
4
Proe Power Systems, LLC., Medina, OH 44256, USA
5
Department of Biosystems and Agricultural Engineering, Oklahoma State University, Stillwater, OK 74078, USA
6
USDA-FS, Forest Product Laboratory, Madison, University of Wisconsin-Madison, Madison, WI 53726, USA
7
Clemson University, Pee Dee Research Education Center, Florence, SC 29501, USA
*
Author to whom correspondence should be addressed.
Submission received: 12 July 2019 / Revised: 13 August 2019 / Accepted: 15 August 2019 / Published: 17 August 2019

Abstract

:
In this study, the economic feasibility of producing ethanol from gasification followed by syngas fermentation via commercially available technologies was theoretically evaluated using a set of selected livestock and agricultural and forest residuals ranging from low valued feedstocks (i.e., wood, wheat straw, wheat straws blended with dewatered swine manure, and corn stover) to high valued oilseed rape meal. A preliminary cost analysis of an integrated commercial system was made for two cases, a regional scale 50 million gallon (189,271 m3) per year facility (MGY) and a co-op scale 1–2 MGY facility. The estimates for the minimum ethanol selling prices (MESP) depend heavily on the facility size and feedstock costs. For the 1–2 MGY (3785–7571 m3/y) facility, the MESP ranged from $5.61–$7.39 per gallon ($1.48–$1.95 per liter) for the four low-value feedstocks. These high costs suggest that the co-op scale even for the low-value feedstocks may not be economically sustainable. However, the MESP for the 50 MGY facility were significantly lower and comparable to gasoline prices ($2.24–$2.96 per gallon or $0.59–$0.78 per liter) for these low-value feedstocks, clearly showing the benefits of scale-up on construction costs and MESP.

Graphical Abstract

1. Introduction

Sustainable agricultural biomass feedstock can be used to produce biofuel, bioenergy, biochemicals, and bioproducts via a variety of conversion pathways. Important sources of biomass feedstock for bioenergy identified by the 2016 Billion-Ton-Study and its update [1] include forest resources, energy crops, crop residues, and animal manures. While forest resources such as logging residues and the whole tree, and perennial energy crops (herbaceous: switchgrass, miscanthus, and energy cane, and woody crops: southern pine, poplar, willow, and eucalyptus) are often considered for bioenergy production, conversion processes for farm-based biomass such as crop residues and animal manures are less typical. Economically viable local conversion facilities to produce liquid biofuels would offer potential income to farmers. The development of such facilities is especially important since crop residues are one of the largest sustainable sources of feedstock in the United States. Corn stover and wheat straw are the two major crop residues. Further potential agricultural residual feedstocks are cover crops such as vetch, clover, and rye. These cover crops grown during fallow periods between major cash crops are used to prevent soil erosion. In addition to these traditional cover crops, the oil seed crop species Brassica napus represented by canola and rapeseed can also be used as a cover crop. As a cover crop, canola and rapeseed, cumulatively oilseed rape (OSR) is known for benefits such as preventing erosion, increasing soil organic matter, suppressing weeds and soilborne pests, alleviating subsoil compaction, and scavenging nutrients [2,3].
Animal manure is also considered to be one of the major available biomass waste resources [1]. In view of the change in animal production in the U.S. and worldwide toward more concentrated animal feeding operations, environmentally sound methods for the storage and disposal of this surplus manure are required [4]. Studies have shown that thermochemical conversion of surplus animal manures such as pyrolysis not only alleviates the storage and disposal problems, but it can also provide regionally available power for local farmers [4,5,6,7] and value-added byproducts that can be used to remove odors [8], fugitive gas such as ammonia [9,10], and as soil amendments to improve soil quality [11,12].
Gasification is another thermochemical technology which converts surplus manures, as well as other residues to produce synthesis gas (hereafter referred as syngas) composed mainly of CO and H2. The syngas can be used to generate power via combustion or converted to liquid fuels via downstream catalytic syngas conversion [13] or fermentation processes. A number of commercial gasification systems capable of converting a variety of feedstocks for syngas production have been used [14,15,16,17,18,19,20,21]. The fermentation of the syngas in a following process step utilizes autotrophic microorganisms to convert CO, H2, and CO2 with flexible molar ratios into alcohols, organic acids, and other products [22,23,24,25,26,27,28,29,30,31,32,33,34,35,36]. Both monocultures and mixed cultures have been used to produce a variety of fermented products. Commercial facilities have been constructed, producing ethanol from municipal solid and industrial cellulosic wastes [14,15]. In addition to ethanol, research on competing uses for biomass continues and may bring forth alternative economically sustainable products, ranging from higher value niche chemicals [37,38] to lower cost bulk biofuels using chemical transformations (e.g., methanol, dimethyl ether, synthetic natural gas) [39].
With current gasification technology, low-valued agricultural residuals can be combined with the amenable woody feedstocks to increase the economic feasibility of ethanol production facilities. Small scale systems that draw farm-based and forest residues from surroundings with shorter biomass draw radius, i.e., shorter transport distance for hauling biomass to the plant, will reduce a major costing of the biomass supply [40,41]. Moreover, farm-based biomass can often include woody feedstocks. The relatively clean, high growth rate and the high heating values for some wood (particularly poplar) often motivate a creation of energy crop production alongside the agricultural production.
The overall goal of this study is to estimate the economic potential of producing ethanol from agricultural and forest residuals using commercially available technology for gasification-syngas fermentation. Specific objectives of this study were to determine (1) theoretical amounts of ethanol that can be produced from selected forest and agricultural residuals by operating coop- or regional-scale, integrated gasification, and syngas fermentation systems and (2) preliminary economic feasibility by conducting cost analyses of the integrated systems.

2. Materials and Methods

2.1. Feedstocks and Logistics

This study considered forest resources (logging residues), crop residues (corn stover and wheat straw), swine manure mixed with wheat straw, and OSR meal (a residual from oil processing), to produce liquid biofuel for two cases from small to large commercial systems. Case 1 was assumed to be a regional-scale size bioethanol facility (50 million gallon per year, 50 MGY or 189,271 m3/y). Case 2 was assumed to have 1 to 2 MGY (3785–7571 m3/y) ethanol production capacities as a co-op-scale facility. The plant capacity and biomass availability surrounding a biofuel plant determine the biomass draw radius or transport distance between feedstocks and the plant.
The estimated roadside costs of forest resources that include stumpage price and harvesting costs (assuming an integrated harvesting option) were taken from the 2016 Billion-Ton-Study [1]. Both stumpage price and harvesting cost varied widely between regions, which mainly depend on harvesting method, topography, and stand type. Usually, crop residues are harvested as bales, especially large rectangular bales that have lower harvesting, handling, storage, and transportation cost compared to round bales [42,43]. The farmgate price of crop residues included nutrient replacement cost due to crop residues removal and harvesting cost.
The delivered cost of biomass to a biomass conversion plant includes roadside or farmgate cost and transportation cost of biomass from forest roadside or farm gate to bioenergy/biofuel conversion site. Storage may be necessary due to the seasonal availability of biomass, especially crop residues [43]. Forest resources and manure may be available throughout the year and biomass storage may not be necessary. A detailed estimation of bales and woodchips were described in Sahoo and Mani [43] and Sahoo et al. [44] respectively. The conversion plant considered in this study can use wood chips directly and further grinding is not required. However, bales require additional grinding operation before use in the conversion plant. A detailed estimation of transport and handling cost for bales and woodchips were presented by Sahoo and Mani [42] and Sahoo et al. [45] respectively. Animal manure cost at the farmgate varies between 0 and 40 $/dry tonne [1]. Because swine manure solid contents are only about 2–5%, various dewatering techniques are used to dewater the manure and reduce the transportation cost. The dewatered swine manure can be available at the price of $22/tonne (25% solid content) (personal communication with a manure sludge management company in North Carolina). Although the cost for OSR meal is much higher than other feedstocks, it was selected for comparing its competing use as animal feed. Table 1 summarizes the logistics cost of various feedstocks considered in this study.

2.2. Proximate and Ultimate Analyses of Feedstock

In order to estimate the syngas production rates and compositions using the Proe Power Systems’ simulation model, proximate and ultimate properties of feedstock were needed. Triplicate proximate and ultimate properties of wheat straw samples (ASTM D3172 and 3176) were analyzed by Hazen Research Inc. (Golden, CO, USA). Mean values of proximate and ultimate properties reported in the literature were used for swine manure and OSR meal [48,49].

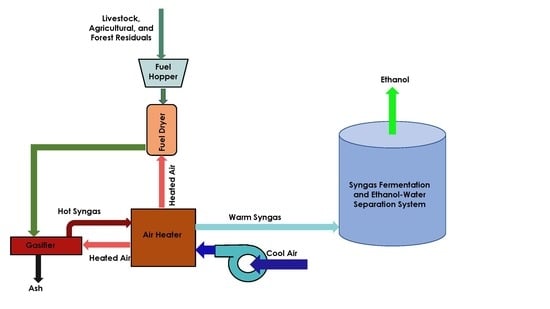
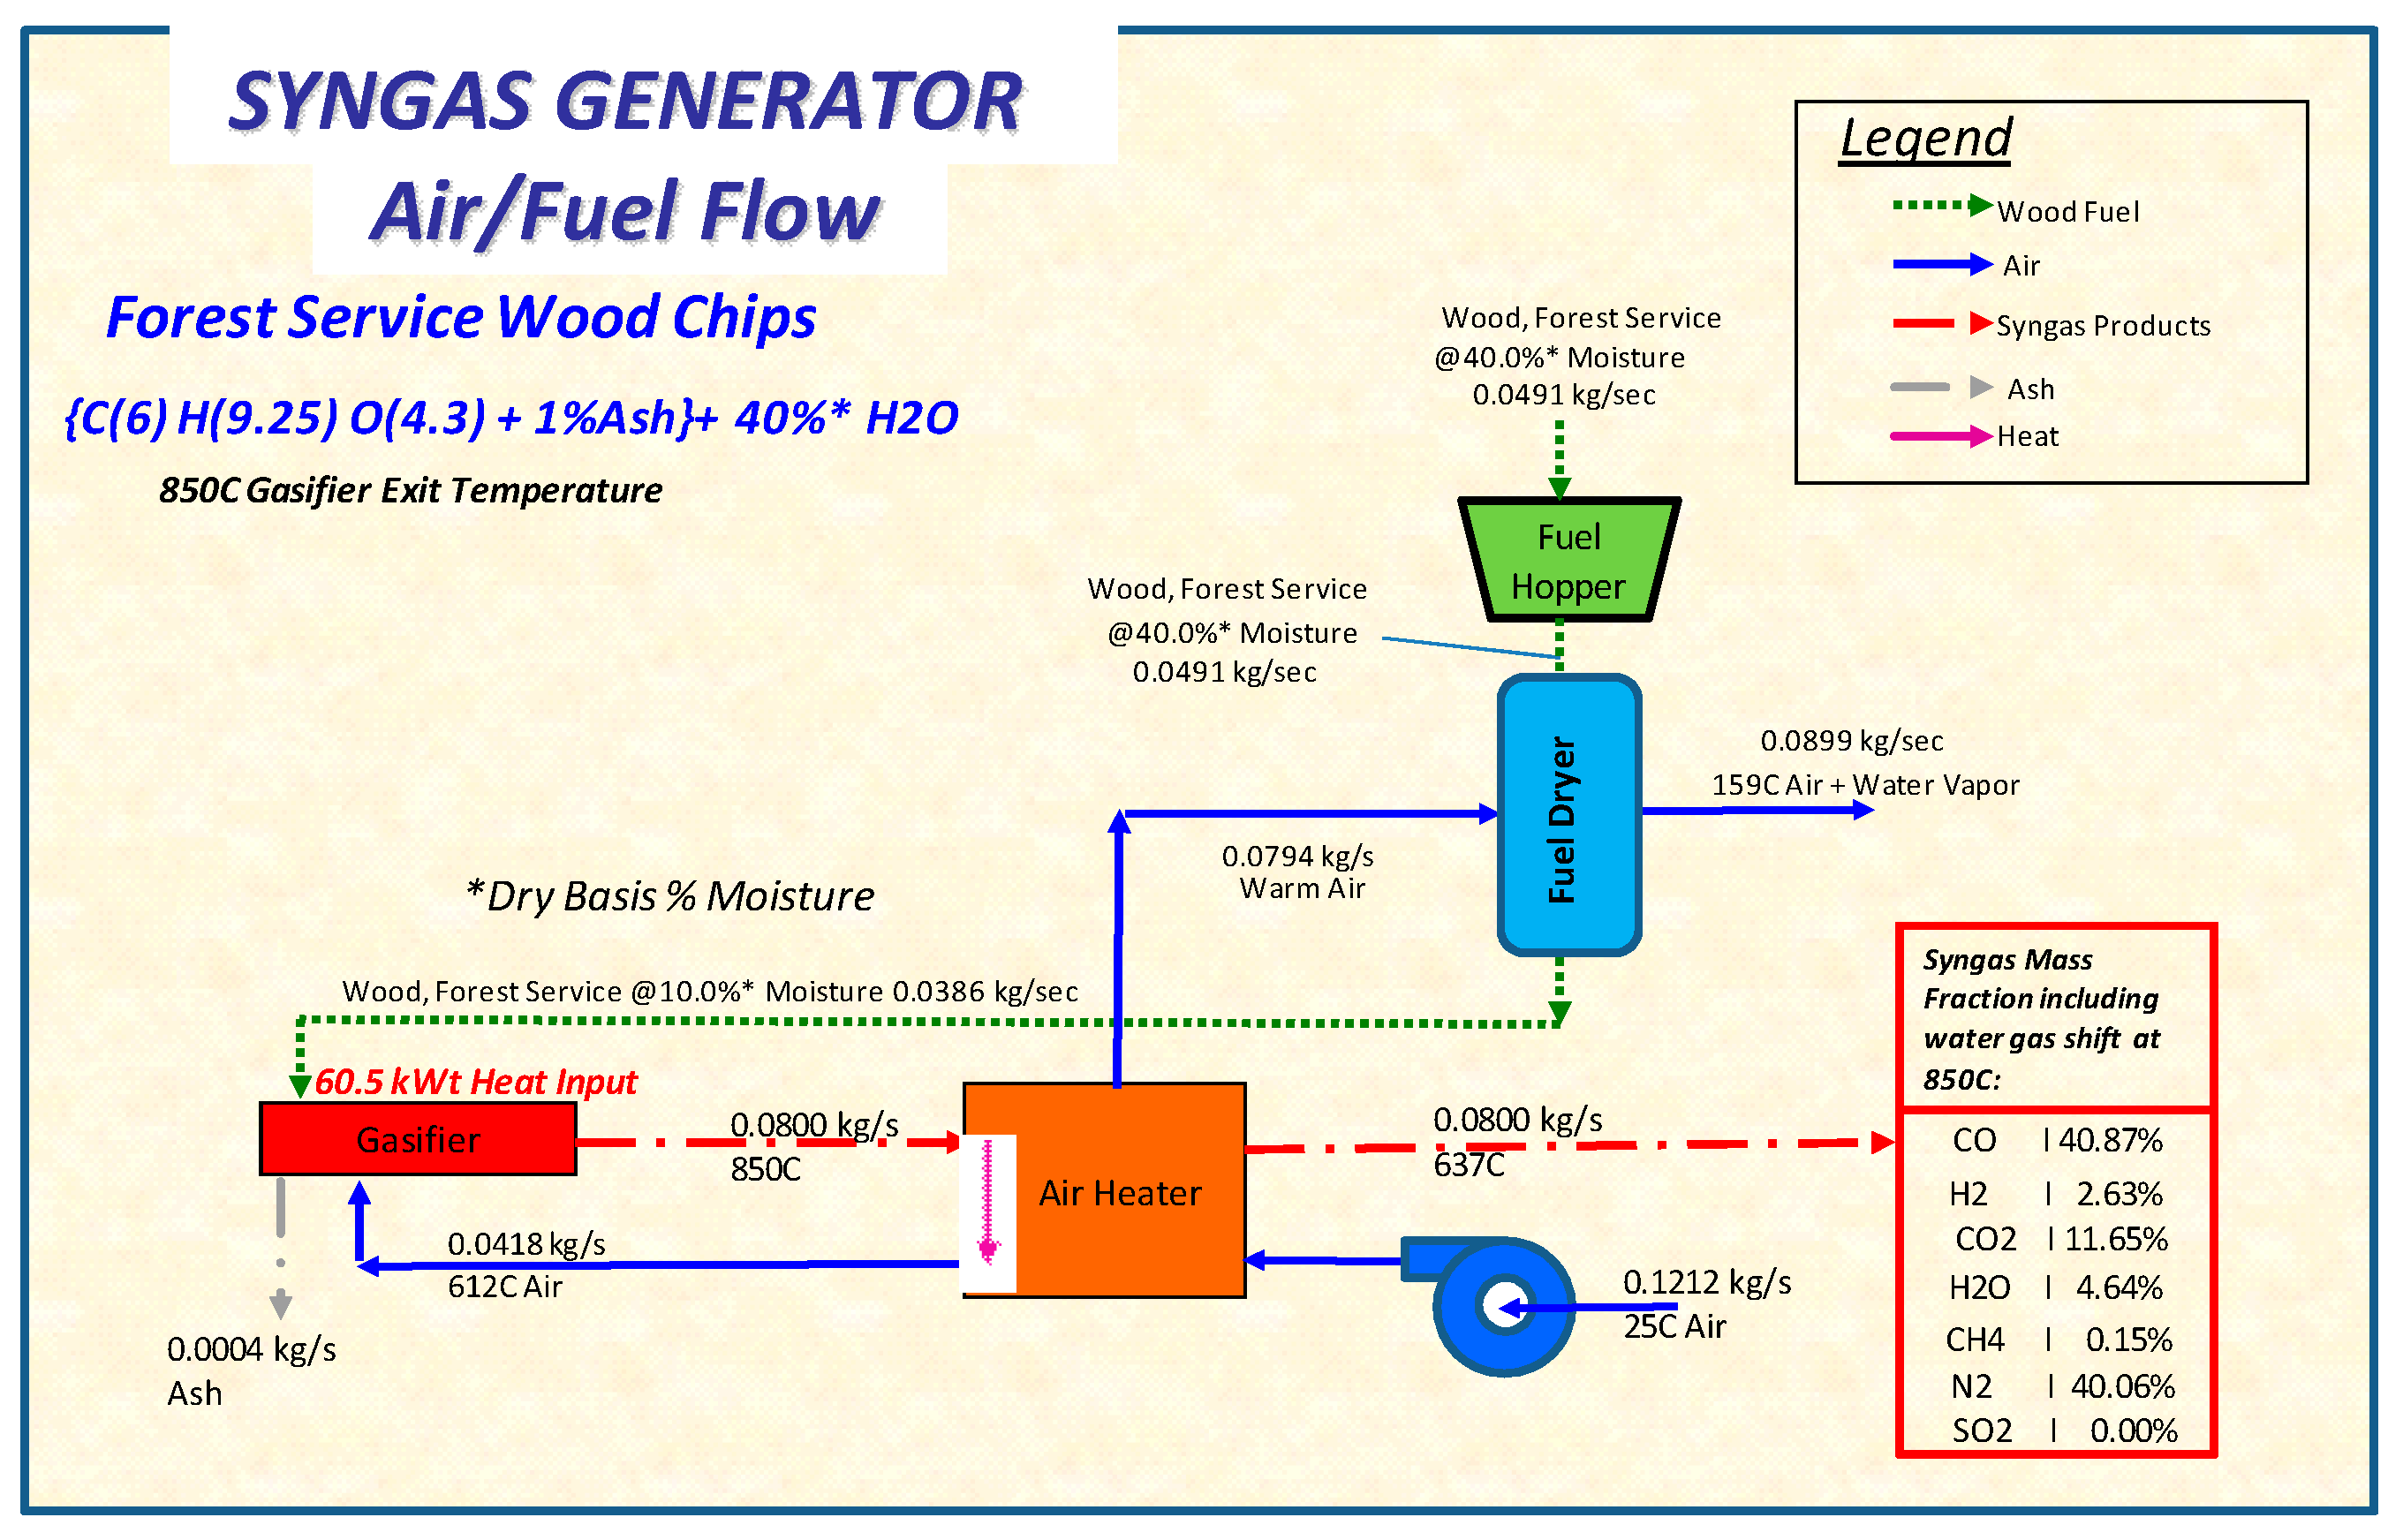
2.3. Syngas Production Using a Commercial Gasification System

In order to handle a wide variety of feedstocks, we chose to use a modular fixed-bed, crossflow gasification system (Proe Power 250 kWe, Proe Power Systems, LLC, Median, OH, USA) to generate syngas from various forest and agricultural residuals. Selecting the appropriate gasifier technology has several facets when using the farm-based biomass [16]. Due to the variation in the size of the biomass feedstock, many biomass gasification systems require attention to size reduction and/or feed flow uniformity, particularly in downdraft and fluidized bed gasifiers. The fixed bed gasifier was chosen because it was more tolerant of feedstock sizing, helping to reduce costs. Air was used in the gasifier instead of oxygen for the gasification reactions since oxygen separation units are usually not cost-effective at the smaller scales [17]. Likewise, the higher cost associated with the use of super-heated steam for carbon gasification [17,18] was also avoided at the smaller scales. However, there is a potential low-cost approach of using a commercial air heat exchanger to preheat the combustion air and lower the nitrogen content of the syngas. With the air heat exchanger, less oxygen is needed to reach the adiabatic temperature within the gasifier that then promote more CO and H2 production and less CO2 and H2O byproducts via the water gas shift reactions; which has some mention as a concept in the literature [19,20]. A preheated combustion air concept in a downdraft gasifier design has already been used for gasification of cow manure [21], but the downdraft gasifier design may not be optimal for other types of farm feedstock.
The Proe Power Systems’ simulation model for the crossflow gasification system component was used to determine the syngas composition and production rates. The model is a thermochemical equilibrium model based on the elemental composition of the feedstock and the assumption that equilibrium is achieved. The model can be used for both woody and non-woody biomass feedstocks. The composition was determined for gasification with two output temperatures of 649 Celsius and 850 Celsius. This simulation model predicts material flow rates and temperatures of various components of the gasification system. Figure 1 shows the basic schematic of the selected modular Proe Syngas Generator, the predicted material flow rates, and temperatures for gasifying wood fuel to generate syngas. The simulation model performs mass and energy balances on the air heater, gasifier, and dryer. Input values are biomass fuel properties, gasifier temperature, air temperature, desired syngas production flowrate, and the ratio of air flow split to the fuel dryer and gasifier. This model can be used to optimize the syngas production for a wide variety of biomass fuels by varying the input values. As a check we also used the gaseous equilibrium solver, known as StanJan, to verify the model accuracy on the major gases, at least to within 1% at 850 °C, and nil production of solid carbon at equilibrium. Predictions of the computer model are comparable with the literature and other models for the air blown gasifiers [16]. The composition is then considered “frozen” at that equilibrium value as it passes through the air heater and on to the fermentation process.

2.4. Theoretical Ethanol Yields from Syngas Fermentation and Ethanol Production Rates

Syngas-utilizing microorganisms fix carbon via the acetyl-CoA pathway, also known as Wood–Ljungdahl pathway [50], and its derivative [51,52]. Acetic acid and ethanol are produced from CO, CO2, and H2 according to the following possible reactions, which are dependent on syngas composition [23]:
2   CO + 2   H 2 CH 3 COOH
4   H 2 + 2   CO 2   CH 3 COOH + 2   H 2 O
4   CO + 2   H 2 O   CH 3 COOH + 2   CO 2
CO + 3   H 2 + CO 2   CH 3 COOH + H 2 O
6   CO + 3   H 2 O   CH 3 CH 2 OH + 4   CO 2
3   CO + 3   H 2 CH 3 CH 2 OH + CO 2
4   CO + 2   H 2 + H 2 O   CH 3 CH 2 OH + 2   CO 2
CO + 5   H 2 + CO 2   CH 3 CH 2 OH + 2   H 2 O
In Equations (1)–(4), 1 mole of acetic acid is produced from 4 moles of reductants. For ethanol production Equations (5)–(8), 1 mole of ethanol requires 6 moles of reductants. The reductants in syngas fermentation come from either H2, CO or both. In this study, the theoretical ethanol yield was estimated based on the assumption that all the reductants (i.e., 6 moles CO + H2) available in the syngas were converted to one mole of ethanol [23]. This assumption was combined with the syngas yield from each feedstock to calculate theoretical ethanol yields, which are reported in the results section. In practice, though, not all the CO and H2 is converted to ethanol by fermentative microorganisms, nor is all ethanol recovered from the system. In this study, we assumed 90% conversion of CO and H2 to ethanol, and 90% ethanol recovery efficiency (or yield) of ethanol from the fermentation system to estimate the actual ethanol yields.
Since the fermentation process benefits from steady state conditions in the system, the feed rates of the five feedstocks to the gasifier were adjusted to obtain syngas flow rates that would yield similar ethanol production rates (case 1) or were similar (case 2). For case 1, the regional facility was sized to produce 50 MGY. Syngas flows ranged between 30 to 50 kg/s (Table 5). For case 2, a 1–2 MGY commercial level facility for farm-based application at the coop level would need around 1 kg/s of the syngas. A factor of 1000/80 = 12.5 was used to obtain the respective flows for the coop facility.

2.5. Cash Flow Analyses

Cost estimation was based on an 8 million gallon per year, 80 MGY(30,283 m3/y), commercial demonstration ethanol facility built in Florida in 2013 [14]. The Ineos Bio facility produces 8 MGY ethanol from municipal solid waste, that includes gasification, fermentation, and distillation. The construction cost of the facility was reported to be $130 million in the 8 MGY facility that employed 65 full-time employees. A summary of assumptions made for cost estimation in the present study is shown in Table 2. The feedstock cost for the base case (Ineos Bio) was assumed to be $70 per dry tonne of feedstock. However, for the estimated cases in the present study, cases 1 and 2, the feedstock costs were based on the estimation provided in Table 1. The case 1 was assumed to have a typical size bioethanol facility (50 MGY) while the case 2 was assumed to have 1 to 2 MGY ethanol production capacities as small co-op facilities.
The construction cost and employee numbers were scaled by feed capacity ratio to the power 0.7 for the case 1. For the case 2, the number of operation employees was assumed to be 8. Other assumptions used in estimation are shown in Table 2. The minimum ethanol selling price (MESP) per gallon was estimated by equating revenue with the sum of feedstock cost, operating costs (supply and labor), and capital return per year.

3. Results and Discussion

3.1. Feedstock Characteristics

This study considered five raw feedstocks and/or mixtures to the syngas unit: wood chips, two crop residues (corn stover and wheat straw), a blend of wheat straw and swine manure, and OSR meal in the two cases. The characteristics of the 5 feedstocks used in the feed of the simulation model are shown in Table 3. Their original moisture content (MC) varied from 8% to 40%. The ash content ranged from 1–12.3%. The highest ash content was due to the blending of wheat straw with dewatered swine manure, thereby increasing the value from 3.4% to 12.3%. The increase in ash content does not directly affect gasification reactions in the crossflow fixed-bed gasifier design but does result in a mass fraction that must be disposed of as a solid and therefore reduces the amount of dry fuel weight available for gasification, and is a factor included in the simulation.

3.2. Syngas Yields and Production Rates
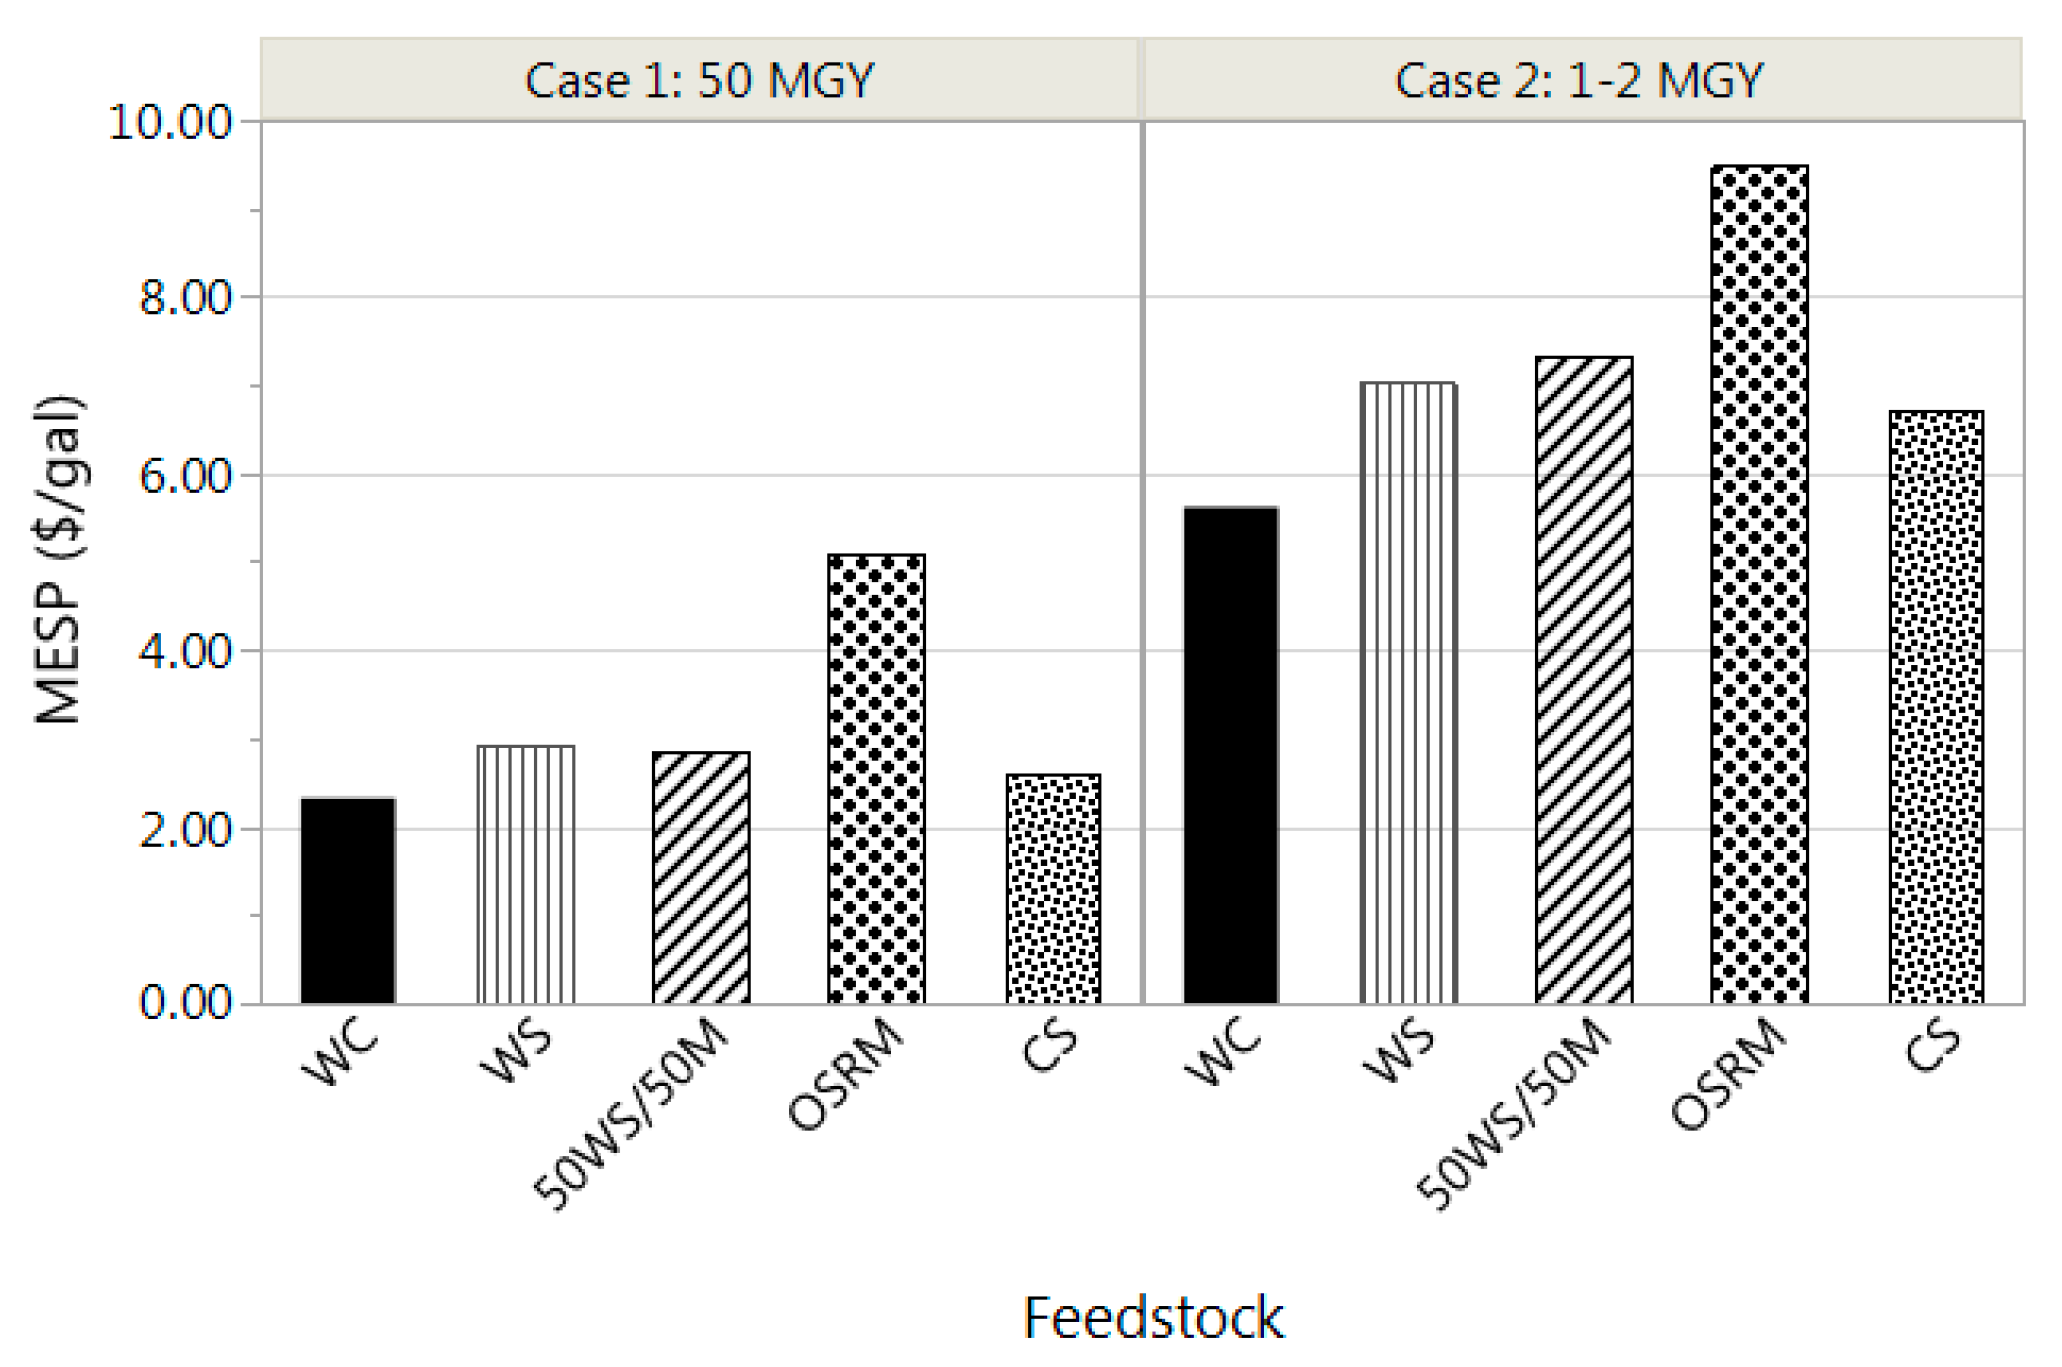
An overview of the modeled material flow rates and syngas composition for the simulated syngas production at two synthesis gas outlet temperatures (649 °C and 850 °C) in a modular fixed-bed, crossflow gasification system is given in Table 4. The values are all referenced to syngas flow rate of 80 g/s which approximates that found in the Proe Power System’s 250 kWe mobile facility, processing dried wood at a flow rate of 44 g/s and 649 °C. The simulation results for both gasification temperatures show the production of high amounts of CO and H2, in approximately equal molar ratios (Table 4). The higher temperature output of 850 °C requires approximately 12% lower wood flow rates to produce the same syngas flow at 649 °C. Other feedstocks require 10% (wheat straw) to 8% (OSR meal) lower feed flows to produce the same syngas flow rate. Since the simulation model is set to maximize the heating value of the syngas, it is not surprising that there is a wide variation of dryer air flows, with the greatest flow variation (between 17 to 148 g/s for the 80 g/s syngas) in the drying of the feedstock to an appropriate level. The most challenging feedstock was the manure and wheat blend with relatively low heating value and high ash, and it still gave a reasonable production of CO and H2 for the fermentation process. The ability to produce a reasonable CO and H2 concentration is largely due to the regenerative heat process provided by the preheated combustion air, a feature often not available in other gasifier designs. Although the StanJan chemical equilibrium software has confirmed minimizing the methane and elimination of solid carbon, the challenge remains in the effectiveness and speed of the tar, char, and methane conversion process, which means a relatively long exposure of the producer gas to quite high temperatures, which is enhanced with preheated combustion air [18].
Our models assumed most of feedstock S became SO2, as Xu et al., (2011) reported that COS and H2S were far less than SO2 in various gasifier outputs [53]. As for N in the feedstock, the gas equilibrium calculations showed N being primarily N2 with miniscule amounts of NOx, HCN, and NH3. These N gas species distributions can be highly variable with any particular gasification technology and cannot be reliably predicted with our models. Moreover, a thermochemical equilibrium model cannot predict potential interactions between feedstocks. Therefore, since some gasifiers are better than others to approach full conversion with varying requirements for cleaning syngas for downstream processes, experimentation in a pilot scale facility is needed to determine these concentrations and interactions.

3.3. Cost Analyses

The preliminary cost analysis for the five feedstocks showed that the differences between the feedstocks and gasification conditions (e.g., costs, syngas yields) were dampened when further processes and the facility construction costs were considered. For example, although the syngas yields were higher at 850 °C than at 649 °C, ranging from 13% (corn stover) and 17% (wood chips), this translated into only slightly higher ethanol yields (2% to 5%, respectively) in the fermentation process (Table 5 and Table 6). The highest ethanol yield was obtained from wood chips (133 gal per tonne biomass at 850 °C), while the yields for the four non-woody feedstocks were quite similar (117.8 to 120.2 gal per tonne). Looking at the construction costs, the higher costs are associated with the non-woody feedstocks in the 50 MGY facility, ranging from $384 to $424 million for wood chips and corn stover, respectively (Table 5). However, this is reversed for the cost of ethanol facilities between 1 and 2 MGY, varying from $26 million for the wheat straw/swine manure mixture to $36 million for wood chips (Table 6).
Comparison of the estimated MESP for the two cases shows that the MESP is very affected by the size of ethanol facility and cost of feedstocks (Table 5 and Table 6 and Figure 2). However, transportation costs play a very small role. For a typical 50 MGY facility, the MESP ranged between $2.28 and $2.96 per gallon for the low-value feedstocks and $5.13 per gallon for the high value OSR meal. The lowest price ($2.28 per gallon) was obtained for wood chips with the lowest feedstock cost of $40.5 per dry tonne, while the MESP for the high valued OSR meal ($352 per dry tone) was more than double at $5.13 per gallon. Tripling the transportation distance only increases the MESP by 5 cents on average. This demonstrates that the cost for the feedstock plays a considerable role in determining the MESP for the large-scale facility. In contrast, the costs for construction and operation play a larger role in the MESP for smaller scale facilities. The MESP ranged between $5.61 and $9.49 per gallon (Figure 2). This clearly shows the effects of scale-up and feedstock cost on construction cost and MESP, since ethanol yield per dry tonne of feedstock was the same for both cases.

4. Conclusions

This study showed that integrated commercially available gasification-fermentation systems have the potential to valorize abundant biomass residuals by converting low-valued agricultural and/or forest residuals to liquid fuels. Comparison of syngas production at two output temperatures (649 °C vs. 850 °C) showed that approximately 10% higher feedstock flow rates are required at 649 °C to produce the same syngas flow at 850 °C. Conversion of the four agricultural residuals (i.e., wheat straw, wheat straw/swine manure blend, OSR meal, and corn stover) had up to 11% lower ethanol yields and produced lower amounts of ethanol than that of woody feedstock. The wood chips also had the lowest feedstock costs. Therefore, the lowest MESP was estimated for wood chips at both scales, $2.28 and $5.61 per gallon for the 50 MGY and 1–2 MGY facility, respectively. However, the other three low valued agricultural residuals had MESP similar to wood chips in the 50 MGY facility ($2.59–$2.96), showing that such a facility could be economically operated with a variety of low cost feedstocks. High valued feedstocks such as the OSR meal more than double the MESP at $5.13 per gallon. This demonstrates that the cost for the feedstock plays a considerable role in determining the MESP for the large-scale facility. The biggest difference in MESP was from the two different sized facilities, 50 MGY and 1–2 MGY facilities. The MESP from the smaller (co-op scale, 1–2 MGY) facility were almost twice ($5.61–$9.49/gal) that of larger 50 MGY facility ($2.28–5.13/gal). This highlights the effect of scale-up on construction cost and MESP. With current gasoline selling price of about $2.50 to $3.00/gal, the ethanol production at co-op scale may not be economically sustainable. However, the regional scale ethanol facility may be sustainable by blending with gasoline at comparable prices.
Another key finding of the study is that through a good selection of technologies most farm biomass residuals can be reasonably converted to ethanol via syngas fermentation. Since the largest driving force promoting biofuels, globally and in the USA, are statutory blending requirements [54], the MESP need not be price competitive with gasoline when meeting blending quotas. A more detailed economic evaluation of the market situation is required to determine which range of MESP will be economically sustainable for ethanol use in blended gasolines. Furthermore, the study identified some important challenges: (1) the economic feasibility of smaller scale units should be increased through further research, as well as the development of a pilot scale facility with the gasification-syngas fermentation technology described here. Since the high investment cost of a regional ethanol facility discourages investors, the demonstration of an economically viable smaller scale conversion facility will promote the sustainable use of biomass residuals and offer potential income to farmers. (2) On-going research on alternative products, ranging from higher value niche chemicals to lower cost bulk biofuels from less capital-intensive systems using chemical transformations of syngas (e.g., methanol, dimethyl ether, synthetic natural gas) should continue. Since the feedstock unit costs generally increases with facility size, the optimum facility size for a sustainable product from biomass residuals may very well be a more affordable and smaller facility, most ideally that of the coop size, of 1–2 MGY.

Author Contributions

This research idea was originally conceived by K.S.R. and M.A.D., K.S.R. and W.J.P. analyzed feedstock characteristics of cover crops and manure; M.A.D. and R.P. simulated gasification; H.K.A. and J.A.L. estimated ethanol production; and R.P., H.K.A. and K.S. performed economic analyses. All authors participated in the writing of the manuscript.

Funding

This research received no external funding.

Acknowledgments

The authors would like to acknowledge the technical support by Philip Bauer and Melvin Johnson of the USDA-ARS Coastal Plains Soil, Water & Plant Research Center. This research was supported by the USDA-ARS National Programs 212. Mention of trade names or commercial products in this publication is solely for providing specific information and does not imply recommendation or endorsement by the U.S. Department of Agriculture (USDA).

Conflicts of Interest

The authors declare no conflict of interest.

References

  1. Langholtz, M.; Stokes, B.J.; Eaton, L. 2016 Billion-Ton report: Advanding Domestic Resources for a Thriving Bioeconomy, Volume 1: Economic Availability of Feedstock; Oak Ridge National Laboratory: Oak Ridge, TN, USA, 2016; p. 448. [Google Scholar]
  2. Dean, J.E.; Weil, R.R. Brassica cover crops for nitrogen retention in the Mid-Atlantic Coastal Plain. J. Envion. Qual. 2009, 38, 520–528. [Google Scholar] [CrossRef] [PubMed]
  3. SARE. Managing Cover Crops Profitably: Sustainable Agriculture Research and Eduction (SARE) Handbook Series 9, 3rd ed.; DIANE Publishing: Collingdale, PA, USA, 2012. [Google Scholar]
  4. Cantrell, K.B.; Ducey, T.F.; Ro, K.S.; Hunt, P.G. Livestock waste-to-bioenergy generation opportunities. Bioresour. Technol. 2008, 99, 7941–7953. [Google Scholar] [CrossRef] [PubMed]
  5. Ro, K.S.; Libra, J.A.; Bae, S.; Berge, N.D.; Flora, J.R.V.; Pecenka, R. Combustion behavior of animal-manure-based hydrochar and pyrochar. ACS Sustain. Chem. Eng. 2019, 7, 470–478. [Google Scholar] [CrossRef]
  6. Ro, K.S.; Hunt, P.G.; Jackson, M.A.; Compton, D.L.; Yates, S.R.; Cantrell, K.; Chang, S.C. Co-pyrolysis of swine manure with agricultural plastic waste: Laboratory-scale study. Waste Manag. 2014, 34, 1520–1528. [Google Scholar] [CrossRef] [PubMed]
  7. Cantrell, K.; Ro, K.S.; Szogi, A.A.; Vanotti, M.B.; Smith, M.C.; Hunt, P.G. Green farming systems for the Southeast USA using manure-to-energy conversion platforms. J. Renew. Sustain. Energy 2012, 4, 041401. [Google Scholar] [CrossRef]
  8. Hwang, O.; Lee, S.-R.; Cho, S.; Ro, K.S.; Spiechs, M.; Woodbury, B.L.; Silva, P.J.; Han, D.-W.; Choi, H.; Kim, K.-Y.; et al. Efficacy of different biochars in removing odorous volatile organic compounds (VOCs) emitted from swine manure. ACS Sustain. Chem. Eng. 2018, 6, 14239–14247. [Google Scholar] [CrossRef]
  9. Ro, K.S.; Lima, I.M.; Reddy, G.B.; Jackson, M.A.; Gao, B. Removing gaseous NH3 using biochar as an adsorbent. Agriculture 2015, 5, 991–1002. [Google Scholar] [CrossRef]
  10. Lima, I.M.; Ro, K.S.; Reddy, G.B.; Boykin, D.L.; Klasson, K.T. Efficacy of chicken litter and wood biochars and their activated counterparts in heavy metal cleanup from wastewater. Agriculture 2015, 5, 806–825. [Google Scholar] [CrossRef]
  11. Novak, J.M.; Spokas, K.A.; Cantrell, K.; Ro, K.S.; Watts, D.W.; Glaz, B.; Busscher, W.J.; Hunt, P.G. Effects of biochars and hydrochars produced from lignocellulosic and animal manure on fertility of a Mollisol and Entisol. Soil Use Manag. 2014, 30, 175–181. [Google Scholar] [CrossRef]
  12. Ro, K.S.; Novak, J.M.; Johnson, M.G.; Szogi, A.A.; Libra, J.A.; Spokas, K.A.; Bae, S. Leachate water quality of soils amended with different swine manure-based amendements. Chemosphere 2016, 142, 92–99. [Google Scholar] [CrossRef]
  13. Cantrell, K.; Ro, K.; Mahajan, D.; Anjom, M.; Hunt, P.G. Role of thermochemical conversion in livestock waste-to-energy treatments: Obstacles and opportunities. Ind. Eng. Chem. Res. 2007, 46, 8918–8927. [Google Scholar] [CrossRef]
  14. INEOS. Available online: https://www.ineos.com/news/ineos-group/ineos-bio-produces-cellulosic-ethanol-at-commercial-scale/ (accessed on 31 July 2013).
  15. LanzaTech. Available online: https://www.lanzatech.com/ (accessed on 2 July 2019).
  16. Kirsanovs, V.; Zandeckis, A.; Blumberga, D.; Veidenbergs, I. Influence of process temperature, equivalence ratio and fuel moisture content on gasification process, a review. In Proceedings of the 27th International Conference on Efficiency, Cost, Optimization, Simulation and Environmental Impact of Energy Systems—ECOS, Turku, Finland, June 2014. [Google Scholar]
  17. Ince, P.; Bilek, E.; Dietenberger, M. Modeling integrated biomass gasification business concepts. 2011. [Google Scholar] [CrossRef]
  18. Dietenberger, M.; Anderson, M. Vision of the U.S. biofuel future: A case for hydrogen-enriched biomass gasification. Ind. Eng. Chem. Res. 2007, 46, 8863–8874. [Google Scholar] [CrossRef]
  19. Wu, Y.; Yang, W.; Blasiak, W. Energy and exergy analysis of high temperature agent gasification of biomass. Energies 2014, 7, 2107–2122. [Google Scholar] [CrossRef]
  20. Pian, C.C.P.; Yoshikawa, K. Development of a high-temperature air-blown gasification system. Bioresour. Technol. 2001, 79, 231–241. [Google Scholar] [CrossRef]
  21. Young, L.; Pian, C.C.P. High-temperature, air-blown gasification of dairy-farm wastes for energy product. Energy 2003, 28, 655–672. [Google Scholar] [CrossRef]
  22. Kopke, M.; Mihalcea, C.; Bromley, J.C.; Simpson, S.D. Fermentative production of ethanol from carbon monooxide. Curr. Opin. Biotechnol. 2011, 22, 320–325. [Google Scholar] [CrossRef]
  23. Phillips, J.; Huhnke, R.; Atiyeh, H. Syngas Fermentation: A Microbial Conversion Process of Gaseous Substrates to Various Products. Fermentation 2017, 3, 28. [Google Scholar] [CrossRef]
  24. Abubackar, H.N.; Veiga, M.C.; Kennes, C. Carbon monoxide fermentation to ethanol by Clostridium autoethanogenum in a bioreactor with no accumulation of acetic acid. Bioresour. Technol. 2015, 186, 122–127. [Google Scholar] [CrossRef] [Green Version]
  25. Devarapalli, M.; Atiyeh, H.K.; Phillips, J.R.; Lewis, R.S.; Huhnke, R.L. Ethanol production during semi-continuous syngas fermentation in a trickle bed reactor using Clostridium ragsdalei. Bioresour. Technol. 2016, 209, 56–65. [Google Scholar] [CrossRef] [Green Version]
  26. Huhnke, R.L.; Lewis, R.S.; Tanner, R.S. Isolation and characterization of novel clostridial species. U.S. Patent 7,704,723, 27 April 2010. [Google Scholar]
  27. Liu, K.; Atiyeh, H.K.; Tanner, R.S.; Wilkins, M.R.; Huhnke, R.L. Fermentative production of ethanol from syngas using novel moderately alkaliphilic strains of Alkalibaculum bacchi. Bioresour. Technol. 2012, 104, 336–341. [Google Scholar] [CrossRef]
  28. Phillips, J.R.; Atiyeh, H.K.; Tanner, R.S.; Torres, J.R.; Saxena, J.; Wilkins, M.R.; Huhnke, R.L. Butanol and hexanol production in Clostridium carboxidivorans syngas fermentation: Medium development and culture techniques. Bioresour. Technol. 2015, 190, 114–121. [Google Scholar] [CrossRef]
  29. Phillips, J.R.; Klasson, K.T.; Clausen, E.C.; Gaddy, J.L. Biological production of ethanol from coal synthesis gas. Appl. Biochem. Biotechnol. 1993, 39, 559–571. [Google Scholar] [CrossRef]
  30. Sun, X.; Atiyeh, H.K.; Zhang, H.; Tanner, R.S.; Huhnke, R.L. Enhanced ethanol production from syngas by Clostridium ragsdalei in continuous stirred tank reactor using medium with poultry litter biochar. Appl. Energy 2019, 236, 1269–1279. [Google Scholar] [CrossRef]
  31. Diender, M.; Stams, A.J.M.; Sousa, D.Z. Production of medium-chain fatty acids and higher alcohols by a synthetic co-culture grown on carbon monoxide or syngas. Biotechnol. Biofuels 2016, 9, 82. [Google Scholar] [CrossRef]
  32. He, P.; Han, W.; Shao, L.; Lü, F. One-step production of C6–C8 carboxylates by mixed culture solely grown on CO. Biotechnol. Biofuels 2018, 11, 4. [Google Scholar] [CrossRef] [PubMed]
  33. Liu, K.; Atiyeh, H.K.; Stevenson, B.S.; Tanner, R.S.; Wilkins, M.R.; Huhnke, R.L. Mixed culture syngas fermentation and conversion of carboxylic acids into alcohols. Bioresour. Technol. 2014, 152, 337–346. [Google Scholar] [CrossRef]
  34. Richter, H.; Molitor, B.; Diender, M.; Sousa, D.Z.; Angenent, L.T. A Narrow pH Range Supports Butanol, Hexanol, and Octanol Production from Syngas in a Continuous Co-culture of Clostridium ljungdahlii and Clostridium kluyveri with In-Line Product Extraction. Front. Microbiol. 2016, 7, 1773. [Google Scholar] [CrossRef] [Green Version]
  35. Wang, Y.-Q.; Zhang, F.; Zhang, W.; Dai, K.; Wang, H.-J.; Li, X.; Zeng, R.J. Hydrogen and carbon dioxide mixed culture fermentation in a hollow-fiber membrane biofilm reactor at 25 °C. Bioresour. Technol. 2018, 249, 659–665. [Google Scholar] [CrossRef]
  36. Xu, S.; Fu, B.; Zhang, L.; Liu, H. Bioconversion of H2/CO2 by acetogen enriched cultures for acetate and ethanol production: The impact of pH. World J. Microbiol. Biotechnol. 2015, 31, 941–950. [Google Scholar] [CrossRef]
  37. Werpy, T.; Petersen, G. Top Value Added Chemicals from Biomass: Volume 1—Results of Screening for Potential Candidates from Sugars and Synthesis Gas, 1st ed.; National Renewable Energy Laboratory: Golden, CO, USA, 2004. [Google Scholar]
  38. Pfltzgraff, L.A.; De bruyn, M.; Cooper, E.C.; Budarin, V.; Clark, J.H. Food waste biomass: A resource for high-value chemicals. Green Chem. 2013, 15, 307–314. [Google Scholar] [CrossRef]
  39. Molino, A.; Larocca, V.; Chianese, S.; Musmarra, D. Biofuels production by biomass gasification: A review. Energies 2018, 11, 811. [Google Scholar] [CrossRef]
  40. Bergman, R.; Berry, M.; Bilek, E.M.T.; Bower, T.; Eastin, I.; Ganguly, I.; Han, H.-S.; Hirth, K.; Jacobson, A.; Karp, S.; et al. Waste to Wisdom: Utilizing forest residues for the production of bioenergy and biobased products. Appl. Eng. Agric. 2018, 34, 5–10. [Google Scholar]
  41. Sahoo, K.; Bilek, E.; Bergman, R.; Mani, S. Techno-economic analysis of producing solid biofuels and biochar from forest residues using portable systems. Appl. Energy 2019, 235, 578–590. [Google Scholar] [CrossRef]
  42. Sahoo, K.; Mani, S. Engineering Economics of Cotton Stalk Supply Logistics Systems for Bioenergy Applications. Trans. ASABE 2016, 59, 737–747. [Google Scholar]
  43. Sahoo, K.; Mani, S. Techno-economic assessment of biomass bales storage systems for a large-scale biorefinery. Biofuels Bioprod. Biorefin. 2017, 11, 417–429. [Google Scholar] [CrossRef]
  44. Sahoo, K.; Bilek, E.M.; Mani, S. Techno-economic and environmental assessments of storing woodchips and pellets for bioenergy applications. Renew. Sustain. Energy Rev. 2018, 98, 27–39. [Google Scholar] [CrossRef]
  45. Sahoo, K.; Bilek, E.M.; Bergman, R.D.; Kizha, A.R.; Mani, S. Economic analysis of forest residues supply chain options to produce enhanced quality feedstocks. Biofuels Bioprod. Biorefin. 2018, 13, 514–534. [Google Scholar] [CrossRef]
  46. USDA Oil crops yearbook. Available online: https://www.ers.usda.gov/data-products/oil-crops-yearbook/ (accessed on 15 June 2019).
  47. Sahoo, K. Sustainable Design and Simulation of Multi-Feedstock Bioenergy Supply Chain. Doctroal Thesis, University of Georgia, Athens, Greece, 2017; 436p. [Google Scholar]
  48. Eriksson, G.; Hedman, H.; Bostrom, D.; Pettersson, E.; Backman, R.; Ohman, M. Combustion characterization of rapeseed meal and possible combustion applications. Energy Fuels 2009, 23, 3930–3939. [Google Scholar] [CrossRef]
  49. Ro, K.S.; Cantrell, K.B.; Hunt, P.G. High-temperature pyrolysis of blended animal manures for producing renewable energy and value-added biochar. Ind. Eng. Chem. Res. 2010, 49, 10125–10131. [Google Scholar] [CrossRef]
  50. Ljungdhal, L. The autotrophic pathway of acetate synthesis in acetogenic bacteria. Annu. Rev. Microbiol. 1986, 40, 415–450. [Google Scholar] [CrossRef]
  51. Köpke, M.; Mihalcea, C.; Liew, F.; Tizard, J.H.; Ali, M.S.; Conolly, J.J.; Al-Sinawi, B.; Simpson, S.D. 2,3-Butanediol Production by Acetogenic Bacteria, an Alternative Route to Chemical Synthesis, Using Industrial Waste Gas. Appl. Environ. Microbiol. 2011, 77, 5467–5475. [Google Scholar] [CrossRef] [Green Version]
  52. Fernández-Naveira, Á.; Veiga, M.C.; Kennes, C. H-B-E (hexanol-butanol-ethanol) fermentation for the production of higher alcohols from syngas/waste gas. J. Chem. Technol. Biotechnol. 2017, 92, 712–731. [Google Scholar] [CrossRef]
  53. Xu, D.; Tree, D.R.; Lewis, R.S. The effects of syngas impurities on syngas fermentation to liquid fuels. Biomass Bioenergy 2011, 35, 2690–2696. [Google Scholar] [CrossRef]
  54. UFOP. UFOP Report on Global Market Supply 2017/2018. Available online: https://www.ufop.de/files/3515/1515/2657/UFOP_Report_on_Global_Market_Supply_2017-2018.pdf (accessed on 16 August 2019).
Figure 1. Calculated result of syngas generator for the wood chips feedstock.
Environments 06 00097 g001
Figure 2. Minimum ethanol selling prices (MESP), for Case 1: 50 million gallons per year (MGY) facility (see Table 5; Table 1 for feedstock cost with transportation distance of 60 km) and Case 2: 1 to 2 MGY (see Table 6; Table 1 for feedstock cost with transportation distance of 20 km) for various feedstocks with gasification at 850 °C. WC: wood chips; WS: wheat straw; 50WS/50M: 50% wheat straw & 50% manure; OSRM: OSR meal; CS: corn stover.
Environments 06 00097 g002
Table 1. Logistics costs of biomass for the small-scale portable biofuel plants.
Biomass
Type
Stumpage Cost a ($/Dry Tonne) [1] Harvesting Cost
($/Dry Tonne) [1]
Transportation Cost ($/Dry Tonne)Storage Cost d ($/Dry Tonne) [43,44]Grinding ($/Dry Tonne) e [42]Average Total Feedstock Cost f ($/Dry Tonne)
20 b km60 c km 20 a km60 c km
Logging residuesWood chips1−515−206128-34.540.5
Wheat StrawRectangular bale9−2844−494106.010.585.591.5
Corn StoverRectangular bale5−1514−164106.010.545.551.5
Swine Manure 7003.58.0--73.578.0
Oilseed rape (OSR) meal 342-410--346.0352.0
Wheat Straw (50%) + Swine manure (50%) ------79.584.8
a A price paid to forest owners for logging residues. A price paid to farmers for the crop residues to recover the cost of adding removed nutrients due to the removal of crop residues [1]. Swine manure delivered cost was provided by the local vendors $22/tonne (25% solid content) includes transportation (personal communication) and this study assumed the cost $17.5/tonne (excluding transportation cost) of dewatered swine manure and estimated the transportation cost for the specific transport distances of 20 km ($3.5/dry tonne) and 60 km ($8/tonne) for small and large scale plants respectively. Oilseed rape (OSR) meal cost was taken from USDA year book ($285/US tonne, 8% moisture content [46]. b Assumed biomass draw radius of 20 km for smaller size plant (1–2 million gallon per year (MGY) ethanol plant capacity). Transport cost was estimated based on [42,45,47]. c Assumed biomass draw radius of 60 km for large size plant (50 MGY ethanol plant capacity). Transport cost was estimated based on [42,45,47]. d Wood chips are assumed to be stored for 1 month as they are available throughout the year. Crop residues are seasonal and thus a six-month storage of bales was assumed [43,44]. Storage was not considered for Swine manure and OSR meal. e Debaling and grinding cost for agricultural wastes [42]. Grinding or chipping is part of harvesting logging residues. f Average total feedstocks cost delivered to biorefinery includes average values for stumpage, harvest, transportation, storage and grinding.
Table 2. Summary of assumptions for cost estimation of the two cases.
Base aCase 1 bCase 2 c
Nameplate Ethanol (MGY)8501 to 2
Construction Cost (M$)130Varied dVaried d
Assumed Yield (gal/tonne)100Varied eVaried f
Feedstock Cost (per tonne)$70Varied g Varied g
Feedstock Requirement (M tonne,yr)0.080Varied eVaried f
Operations Employees69Varied h8
Payroll Burden per Employee/year$60,000$60,000$60,000
Payout Period (years)101010
Interest for Capital Return (%)5%5%5%
Operating costs (% of Capital Cost/yr)10%10%10%
a Based on published data for Ineos Bio 8 million gallons per year (MGY) facility [14]. b Case 1 is for 50 MGY based on typical ethanol biorefinery. c Case 2 is for 1 to 2 MGY for a small-scale co-operation. d Construction cost scaled by feed capacity ratio, (Case/Base)0.7. e See Table 5 for values for each feedstock. f See Table 6 for values for each feedstock. g see Table 1 for values for each feedstock. h Employee number scaled by feed capacity ratio, (Case/Base)0.7.
Table 3. Actual Proximate and Ultimate values used in gasification simulation.
ParametersWood ChipsWheat Straw (WS)1:1 Blend of WS and SM [49]OSR Meal (OSRM) [48]Corn Stover
Proximate—dry basis (db)
Feed MC (%db)404040810
Dried MC (%db)10101022.5
Ash (%db)13.412.37.34.9
Ultimate—dry and ash free basis (dafb)
C (%dafb)48.048.453.750.749.5
H (%dafb)6.26.46.96.86.1
O (%dafb)45.844.135.734.743.7
N (%dafb)01.03.26.90.68
S (%dafb)00.10.50.90.02
Table 4. Mass flow, temperatures, and syngas composition of gasification simulation, all referenced to syngas flow rate of 80 g/s.
Gasification
Parameters
Wood ChipsWheat Straw50 Wheat Straw/50 ManureOSR MealCorn Stover
649 °C850 °C649 °C850 °C649 °C850 °C649 °C850 °C649 °C850 °C
Feed Flow (g/s)5649.145.340.838.435.329.827.536.633.4
Dried Feed Flow (g/s)4438.635.632.130.227.728.226.034.131.1
Pumped Air Flow (g/s)182121.2193.4132119.794.180.872.6118.990.7
Dryer Air Flow (g/s)145.679.4147.983.166.538.826.916.871.440.3
Gasifier Air Flow (g/s)36.441.845.548.953.255.453.955.847.650.4
Ash Flow (g/s)0.40.41.11.03.43.12.01.91.61.5
Syngas/dried feed (g/g)1.82.12.22.52.62.92.83.12.32.6
Syngas Temperature (°C)649850649850649850649850649850
Heated Air Temperature (°C)443612445615485665460626450621
Cooled Syngas Temperature (°C)521637477585416509423524460565
CO (% mass)43.4240.8730.7630.4226.4626.4528.9328.2935.5134.14
H2 (% mass)2.932.632.271.981.921.681.841.652.061.84
CO2 (% mass)14.4711.6518.1514.3915.4812.5711.9710.1513.4611.45
H2O (% mass)2.694.643.75.83.094.952.013.672.153.83
CH4 (% mass)1.580.151.020.090.730.070.690.070.840.08
N2 (% mass)34.8940.0644.0347.2651.9753.9653.8455.5945.8848.58
SO2 (% mass)000.060.060.350.320.630.580.090.08
CO (% moles)32.1130.8924.5224.6321.8422.123.9623.728.7828.05
H2 (% moles)30.1427.5825.1722.2722.0119.5221.2119.2323.1721.03
CO2 (% moles)6.815.619.217.418.136.686.315.426.955.99
H2O (% moles)3.15.454.587.33.976.432.714.782.714.89
CH4 (% moles)2.050.21.420.131.060.110.11.190.12
N2 (% moles)25.7930.2735.0838.2442.8745.0544.5846.5637.1739.9
SO2 (% moles)000.020.020.120.120.230.210.030.03
Table 5. Case 1—Comparison of feedstock feed rate, syngas and ethanol yield and ethanol selling prices from gasification and syngas fermentation of 30–50 kg/s syngas from 5 feedstocks in a 50 million gallons per year (MGY) ethanol facility.
Feedstocks
Parameters
Wood ChipsWheat Straw50 Wheat Straw/50 ManureOSR MealCorn Stover
649 °C850 °C649 °C850 °C649 °C850 °C649 °C850 °C649 °C850 °C
Syngas yield, kg/kg feedstock (db)2.02.22.42.62.93.12.83.02.42.5
Syngas input (kg/s)30.431.939.841.847.950.045.848.140.240.9
Feedstock feed, tonne (db)/d a,b1311.31252.21433.11390.01425.71394.71412.41386.61445.51414.8
Annual demand, thousand tonne (db)/y a,b393.39375.66429.92417.01427.72418.41423.73415.97433.65424.45
Theoretical ethanol yield, gal/tonne (db) a156.9164.4143.6148.0144.3147.5145.6148.4142.3145.4
Ethanol selling price, $/gal a1.981.922.472.412.422.384.234.162.212.17
Ethanol selling price, $/gal b2.021.952.512.452.462.414.274.202.252.21
Ethanol yield, gal/tonne (db) c127.1133.1116.3119.9116.9119.5118.0120.2115.3117.8
Construction cost, $ million a,b,c,d 396.42383.83421.85412.94420.33413.91417.58412.22424.40418.08
Operating cost, $ million a,b,c,d50.6749.0853.8752.7553.6852.8753.3352.6654.1953.39
Minimum ethanol selling price (MESP), $/gal a,c2.312.242.912.842.842.795.085.002.582.54
Minimum ethanol selling price (MESP), $/gal b,c2.362.282.962.892.892.845.135.052.632.59
a Based on 20 km transportation cost in Table 1. b Based on 60 km transportation cost in Table 1. c Based on 90% conversion of CO + H2 by the microbial catalyst used and ethanol yield from CO + H2 is 90%. d Include supply and labor.
Table 6. Case 2—Comparison of feedstock feed rate, syngas and ethanol yield and ethanol selling prices from gasification and syngas fermentation of 1 kg/s syngas from 5 feedstocks in a 1–2 million gallons per year (MGY) ethanol facility.
Feedstocks
Parameters
Wood ChipsWheat Straw50 Wheat Straw/50 ManureOSR MealCorn Stover
649 °C850 °C649 °C850 °C649 °C850 °C649 °C850 °C649 °C850 °C
Feedstock feed, tonne (db)/d43.2037.8834.9531.4729.6227.2329.8027.5035.9332.79
Annual demand, thousand tonne (db)/y a12.9611.3610.489.448.878.178.948.2510.789.34
Ethanol production, million gal/y a1.6471.5131.2201.1321.0390.9761.0550.9921.2431.159
Ethanol yield, gal/tonne (db) a,b127.1133.1116.3119.9116.9119.5118.0120.2115.3117.8
Construction cost, $million36.3533.1731.3629.1327.9226.3228.0426.5131.9629.98
Operating cost, $million c4.123.803.623.393.273.113.283.133.683.48
Minimum ethanol selling price (MESP), $/gal a,b,d5.635.617.037.047.317.359.499.496.686.74
Minimum ethanol selling price (MESP), $/gal a,b,e5.685.657.087.097.357.399.549.546.736.79
a Based on 1 to 2 million gal/year. b Based on 90% conversion of CO + H2 by the microbial catalyst used and ethanol yield from CO + H2 is 90%. c Include supply and labor. d Based on 20 km transportation cost in Table 1. e Based on 60 km transportation cost in Table 1.

