Article

The Air Quality Perception of Residents in the Metropolitan Zone of Acapulco Who Live Around Intersections with Intense Traffic

by
Alfredo Ricardo Zárate Valencia
1,*,
Maximino Reyes Umaña
1,*,
Hilda Janet Arellano Wences
1,
Antonio Alfonso Rodríguez Rosales
2,
Columba Rodríguez Alviso
1 and
Justiniano González González
1
1
Doctorado en Ciencias Ambientales, Universidad Autónoma de Guerrero, Acapulco 39070, Mexico
2
Instituto de Ciencias Aplicadas y Tecnología, Universidad Nacional Autónoma de México, Cidade do México 04510, Mexico
*
Authors to whom correspondence should be addressed.
Submission received: 6 February 2020 / Revised: 3 March 2020 / Accepted: 3 March 2020 / Published: 6 March 2020

Abstract

:
Air pollution is a global environmental problem that affects the population. This work demonstrates the perception of air quality by the population of the urban area of the municipality of Acapulco, Guerrero, Mexico. To meet the objective, a survey of 36 questions was applied to a sample of 382 people living in the main crossing points of vehicles, where there is more traffic and more severe pollutant concentration problems. We decided to apply the grouping method within a radius of 500 m around the selected intersections, where 95% of the respondents are aware that the air they breathe has a certain degree of contamination.

Graphical Abstract

1. Introduction

Poor air quality is a risk factor for human health. Since the Industrial Revolution, the world has been experiencing a high concentration of people in sites near factories. Today, such a high concentration is observed in large cities, or megalopolises, in Latin America, where Mexico City is the most notable. However, in our country, there are other cities with more than 500,000 inhabitants, such as Guadalajara, Monterrey, Puebla, and urban areas of the municipality of Acapulco, among others [1], where high air pollutants emissions occur, as many vehicles and/or factories are concentrated in these areas [2].
The problem of air pollution has grown globally. Currently, nine out of ten people breathe air with high pollution [3], with approximately seven million deaths per year related to breathing suspended particles (PM10 and PM2.5) [4]. This fact has forced us to closely study air pollution in our cities, as environmental indicators are developed by considering the particularities of every place [5], in addition to analyzing pollution’s impact on the health of an area’s inhabitants and pollution’s possible relationship with socioeconomic factors [6].
In Latin America, there have been few studies on public perception regarding the quality of the breathable air [7]. In Mexico, the news of Mexico City provides the main reference for air quality measurement, as well as the alerts that are issued regarding the Metropolitan Air Quality Index (IMECA); it is known from the above that there are moments in Mexico City when the air is contaminated or has very poor quality.
In similar studies around the world, such as a study in Bogota, Colombia [8], which is one of the most polluted cities in Latin America, the population’s perception about air quality is poor. However, in a Spanish study on the public perception of urban air pollution [9], participants in the study reflected a lack of awareness about the issue. As the study in question took place in Barcelona, both the megalopolis and its citizens belong to the so-called First World.
In addition to physical sensory factors, there are other aspects, such as psychological factors, one’s own health status [10], and cultural factors that contribute to one’s perception of air quality. In other words, a person with respiratory health problems may have a perception of greater air pollution than a healthy person living in the same place.
How people exposed to air pollution problems perceive air quality and how they will respond to public policies to mitigate the problem remains very divisive. Hence, it is important to study and understand the perceptions of people regarding air quality and to design measures or programs to be implemented in certain areas [11].
Acapulco, for example, intends to analyze air quality based on data from the National Report on Air Quality 2014 [12], which is based on a single monitoring station (incidentally, the only one in the state), but this station is not running because of a lack of responses. Consequently, the available data are taken from the short period of time when the station worked normally. On the other hand, countries with high levels of pollution and monitoring stations pay little attention to how the population perceives air pollution [13].
Based on this background, a study to determine the perception of air quality in Acapulco, Gro. México is highly relevant.

Study Area

Acapulco is the most important municipality in the state of Guerrero, not only in population size but also because it is the city that generates the most resources (Acapulco contributes 26% of the state’s GDP). According to INEGI data [2], the population of the municipality is 789,971 inhabitants, which represents 23.3% of the total population of Guerrero and has a vehicle fleet of 322,682 vehicles, of which 301,340 are for domestic use.
The city of Acapulco concentrates a large part of the economic activities of the State of Guerrero, where the tertiary sector stands out because 70.10% of its branch of services meet 70.10% of the municipality’s economically active population (EAP). The tourism sector is an important factor in the economy of the state since it houses 70% of the state’s hotel plant, the secondary sector contributes 18.00% of the workforce and the primary sector 7.4%, while 4.5% of the workers do not specify their activity.
Over time, economic growth caused thousands of people settling in the port in search of better life options through employment and study. This migratory phenomenon caused the use of land to build houses for the new population.
Due to the rugged topography of the land, it is difficult to provide public services, as well as urban infrastructure that is required to meet communication needs; but, this has not been an obstacle for the amphitheater and surrounding areas to become populated. Day by day, the new irregular settlements that appear, cause the destruction of the habitat, with unfortunate consequences. All of this is due to the incapacity or complicity of authorities of three levels of government, who have tolerated land invasions even in areas of high risk for a living.
The aforementioned has generated the considerable increase in demand for services by citizens, and one of the main ones has to do with mobility.
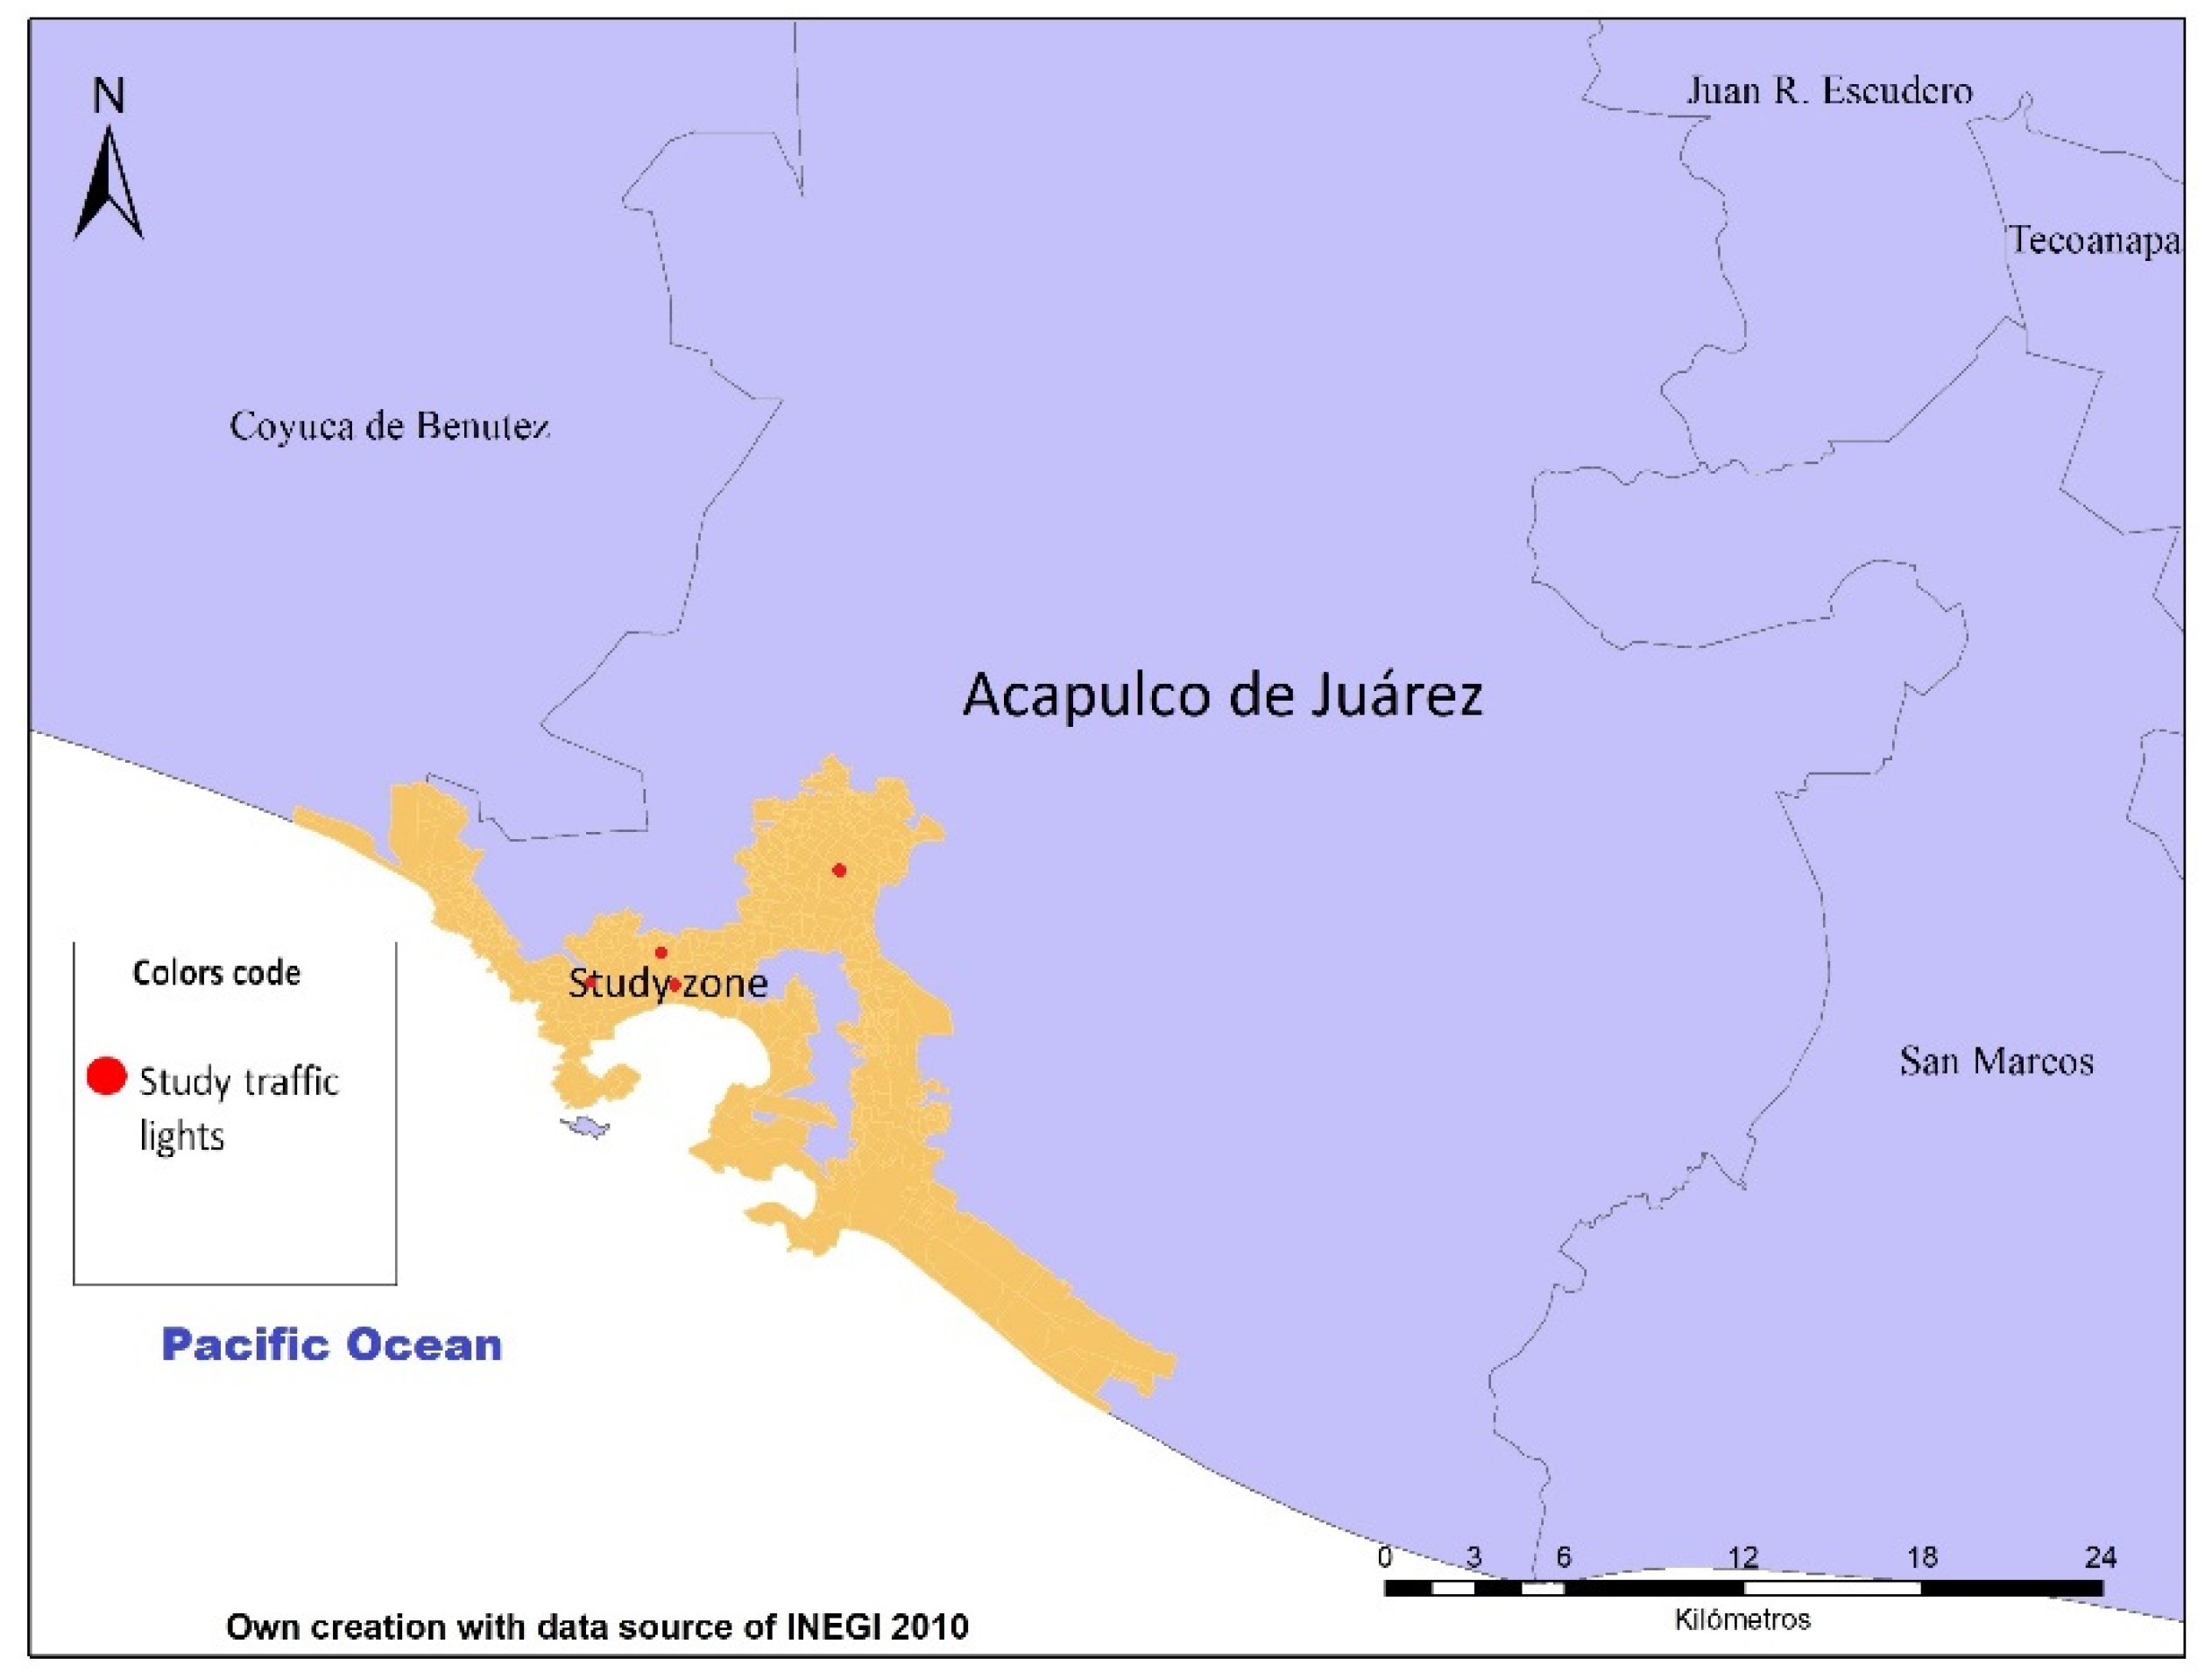
The study area is located in the metropolitan area of the city and the port of Acapulco, Guerrero, Mexico. Specifically, the study area comprises four specific points (Figure 1, in brown), which are located at the busiest traffic intersections. This study area allows one to assess general information on the municipality and its population, as well as other factors.

2. Materials and Methods

As the first part of the study, in order to apply the survey to the perception of air quality in the appropriate areas, the mathematical model CAL3QHC [14], which is used for gas concentrations, (mainly CO) near the main urban traffic crossings, with calculations of queues and hot spots and with a traffic model to calculate delays and queues that occur at marked intersections.
Meteorological data require the use of algorithms (such as CAL3QHC) to calculate more accurately the measurement of pollutants and their projection by dispersion in the air. The most important to be recorded are:
Temperature;
Humidity;
Wind speed and direction;
Solar radiation;
Rain levels.
CAL3QHC requirements. The most important are listed below.
Geometry of the path to be analyzed. It means having a map of the crossing.
Receivers’ location. They are locations within the intersection to be analyzed that will be used as a reference to determine, according to the input data, the concentration of CO at that point at a given time.
Weather conditions. Temperature, wind direction and speed, humidity, among others.
CO emission rates for vehicles. Average emissions in places according to historical or estimated records.
Traffic light signaling data. Timings measured in seconds of green, yellow, and red.
Arrival queues. Length size of the queue of vehicles waiting for the traffic light to turn green.
As a result, with the application of CAL3QHC, the highest emissions in the analyzed places were determined. With these processed data, four points, out of the ten studied, were selected by applying location criteria, which allowed us to identify those distributed in the central, western, and Sabana Valley zones. As the eastern one had no conflicting crossing points, there was no need to apply the model there.
The following points were obtained for this research:
The traffic light at Ejido and Constituents;
The traffic light at Comercial Mexicana and Zapata;
The traffic light at KFC–IMSS Ruiz Cortínez;
The traffic light at Anclas–Cuauhtémoc.
Because the aim of this research was to study the perception of air quality around the selected points (the closer the points, the greater the effects of the concentrations of gases and suspended particles on people), a radius of 500 m around the traffic light was determined to be an appropriate area for the study. This was concluded after observing the area through the CAL3QHC model, as the gases are dispersed at different distances from the point of study. For the study sample, we used the method of clustering, which was found to be the most suitable method for the type of study performed. This method entails two steps: choosing variables and measuring the proximity grouping criteria [15].
Cluster sampling allows one to group sampling units with specific features and saves costs by only requiring a few samples from each group [16]. A randomly selected number of units represents the sample for the general population. Certain neighborhoods or clusters in a city, followed by blocks or streets, are chosen to obtain the units applicable to this study [17].
To determine the clusters’ statistical and geographical data, censuses were used [2]. Because we had no access to housing data, a radius of 500 m was chosen using blocks instead of AGEBs (geographical areas according to its acronym in Spanish, Table 1). For example, at the traffic light “Ejido and Constituyentes”, if the main junction is taken as the center and measured within 500 m according to block delimitation, 93 blocks are selected.
The variables that allowed conglomerate blocks were:
Total population;
Population 18 years and over;
Population 15 years and over with a complete basic education;
Working population;
Covered population (with access to health services).
According to the previous variables, the cluster is shown in Table 2, wherein a key column is a random number only to identify a particular cluster. In the case of Key 1, the group that corresponds to up to 25% of the population is adult, but less than half of that population is economically active, while people aged 15 and older have basic education and also have access to health services. Ninety-three blocks meet the above criteria.
The exercise cluster was performed for all blocks of the city and can be seen in Table 2. These blocks were designed to cover the greatest number of possible combinations based on the selected socioeconomic variables, but the results demonstrate that not all blocks are significant enough to implement them. For example, the clusters that were not significant (grouped as shown in Table 3) were removed. Groups that were not significant were eliminated, as shown in Table 3.
The data used in the clusters are from INEGI 2010 [2] and, therefore, may not correspond to the current data, especially in terms of study level. INEGI 2010 data were used as they were the most reliable at the time of our study.
Next, the number of blocks that exist within a radius of 500 m is determined, and the total population in these places is considered, thereby obtaining 95% reliability with a deviation of 5%; consequently, the tool was used online [18], and total surveys were obtained with the use of the total sample and each percentage point (Table 4).
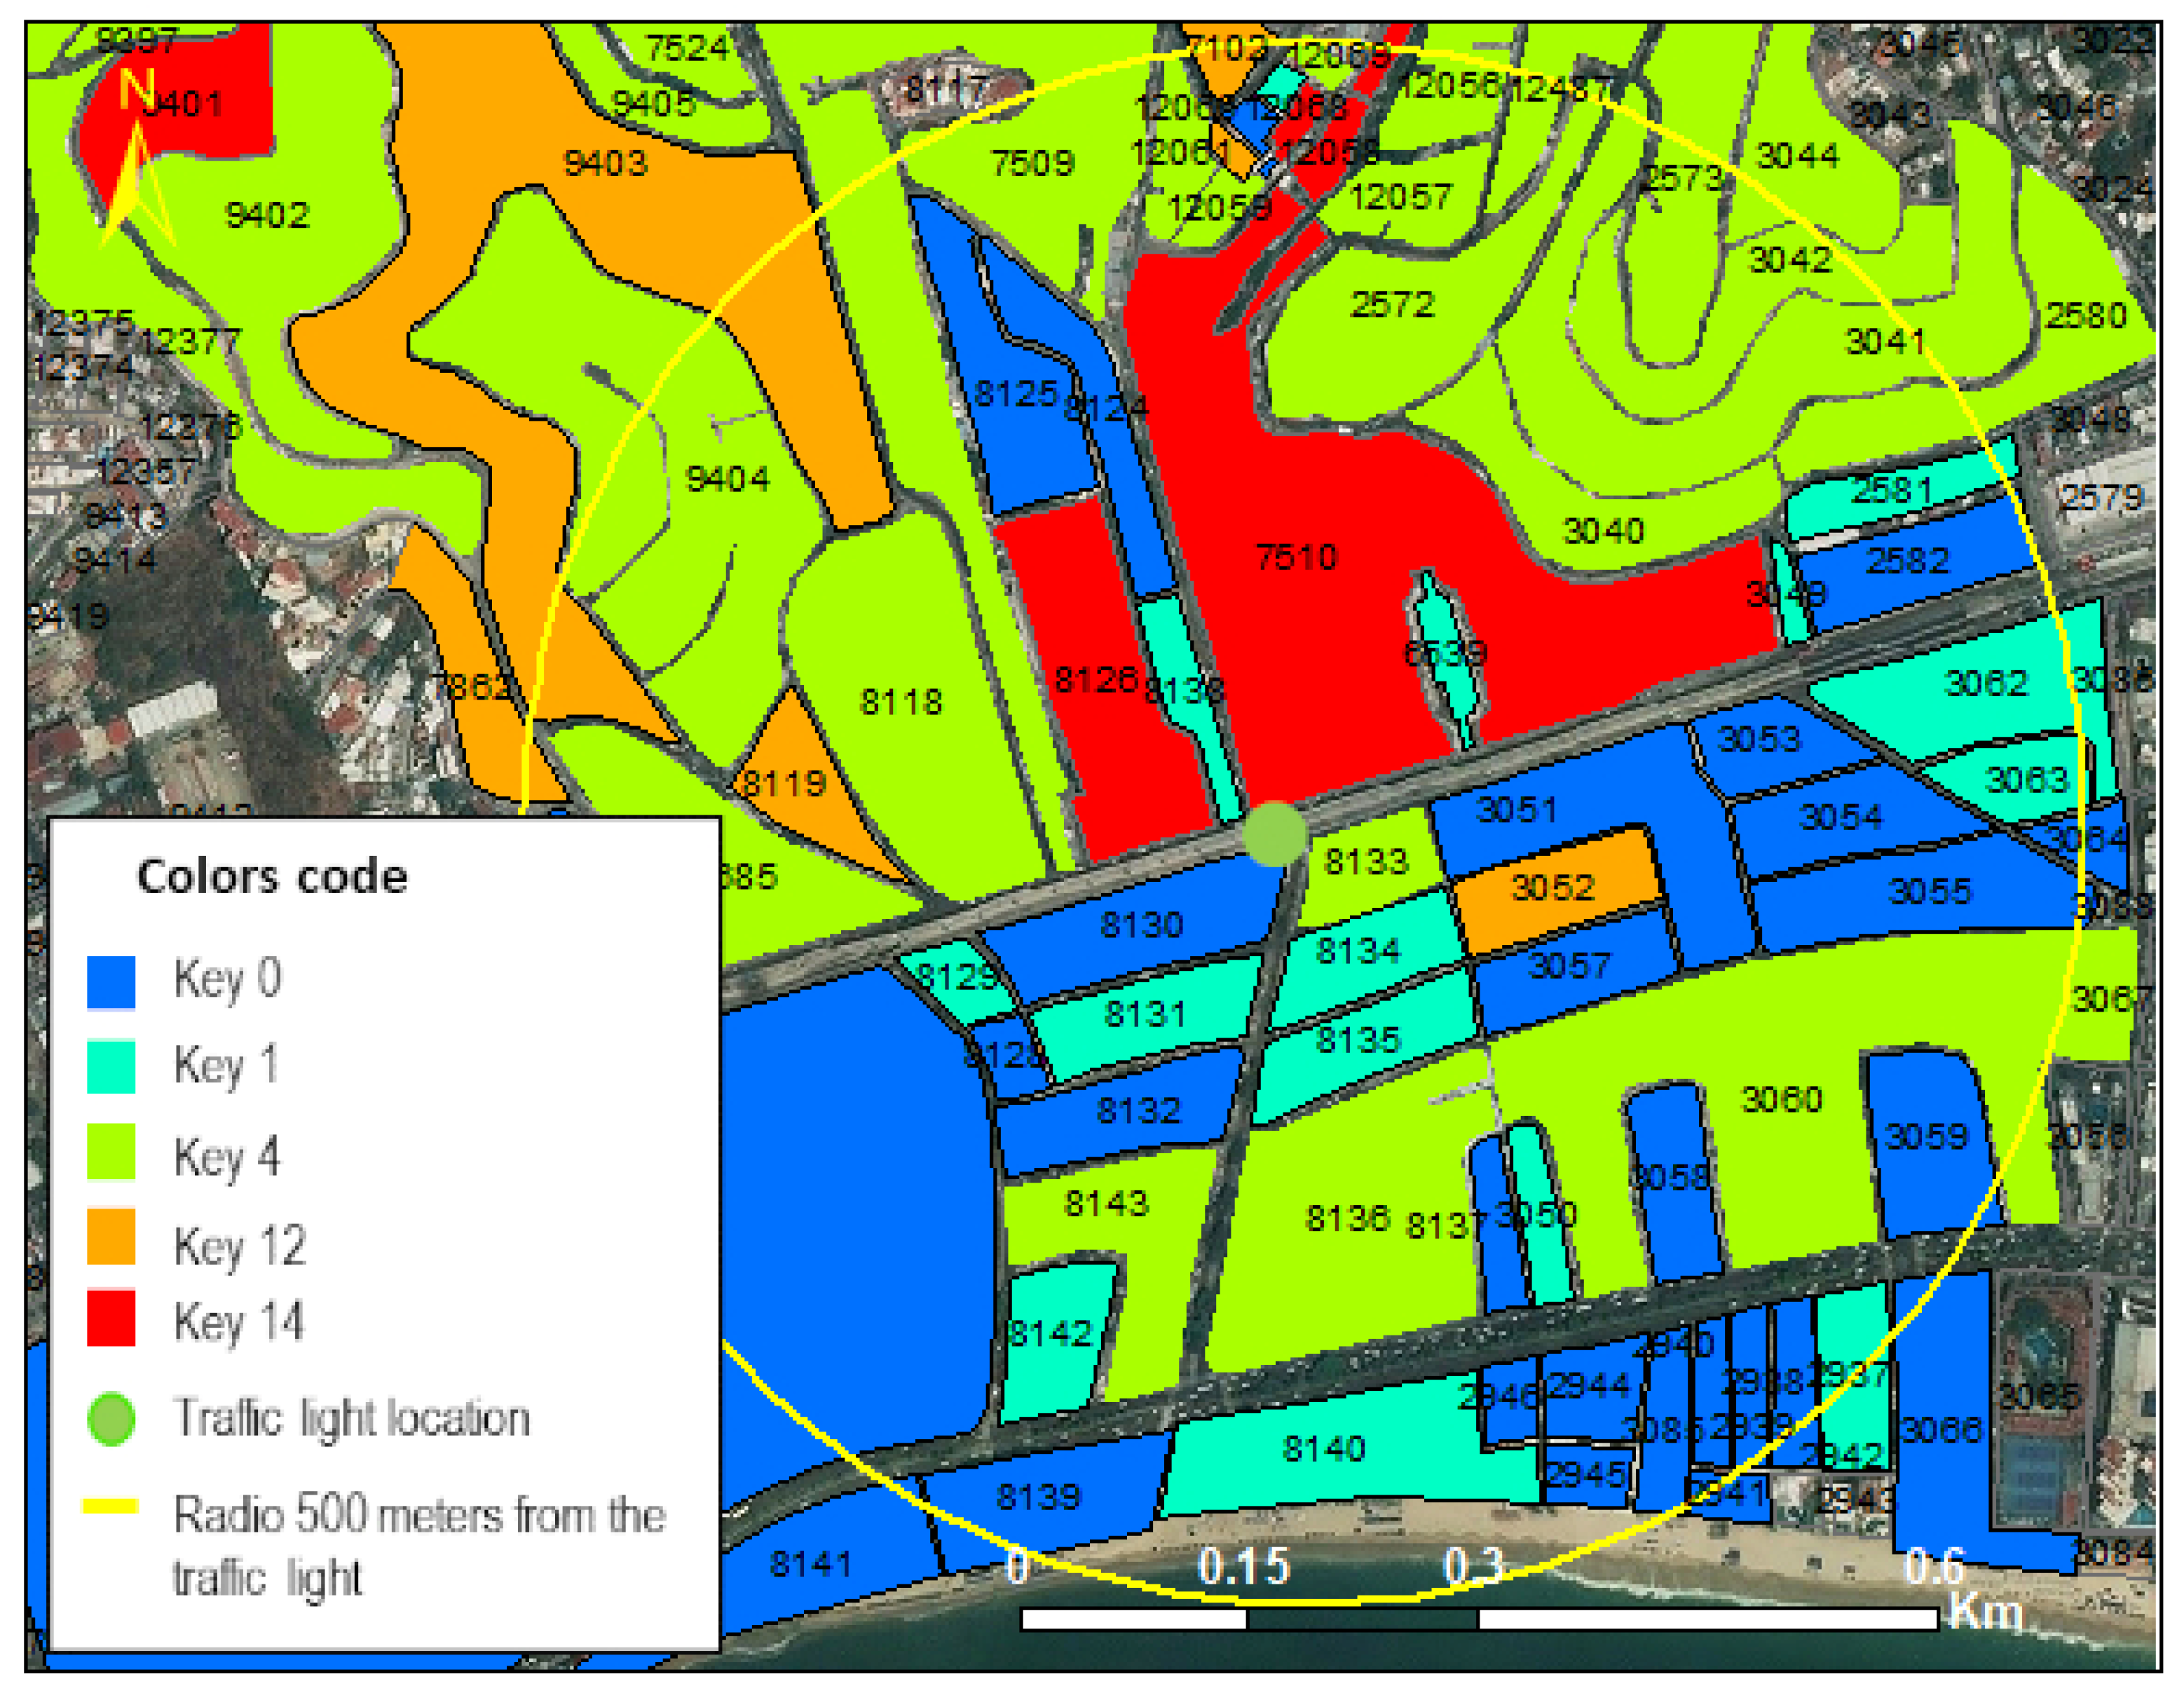
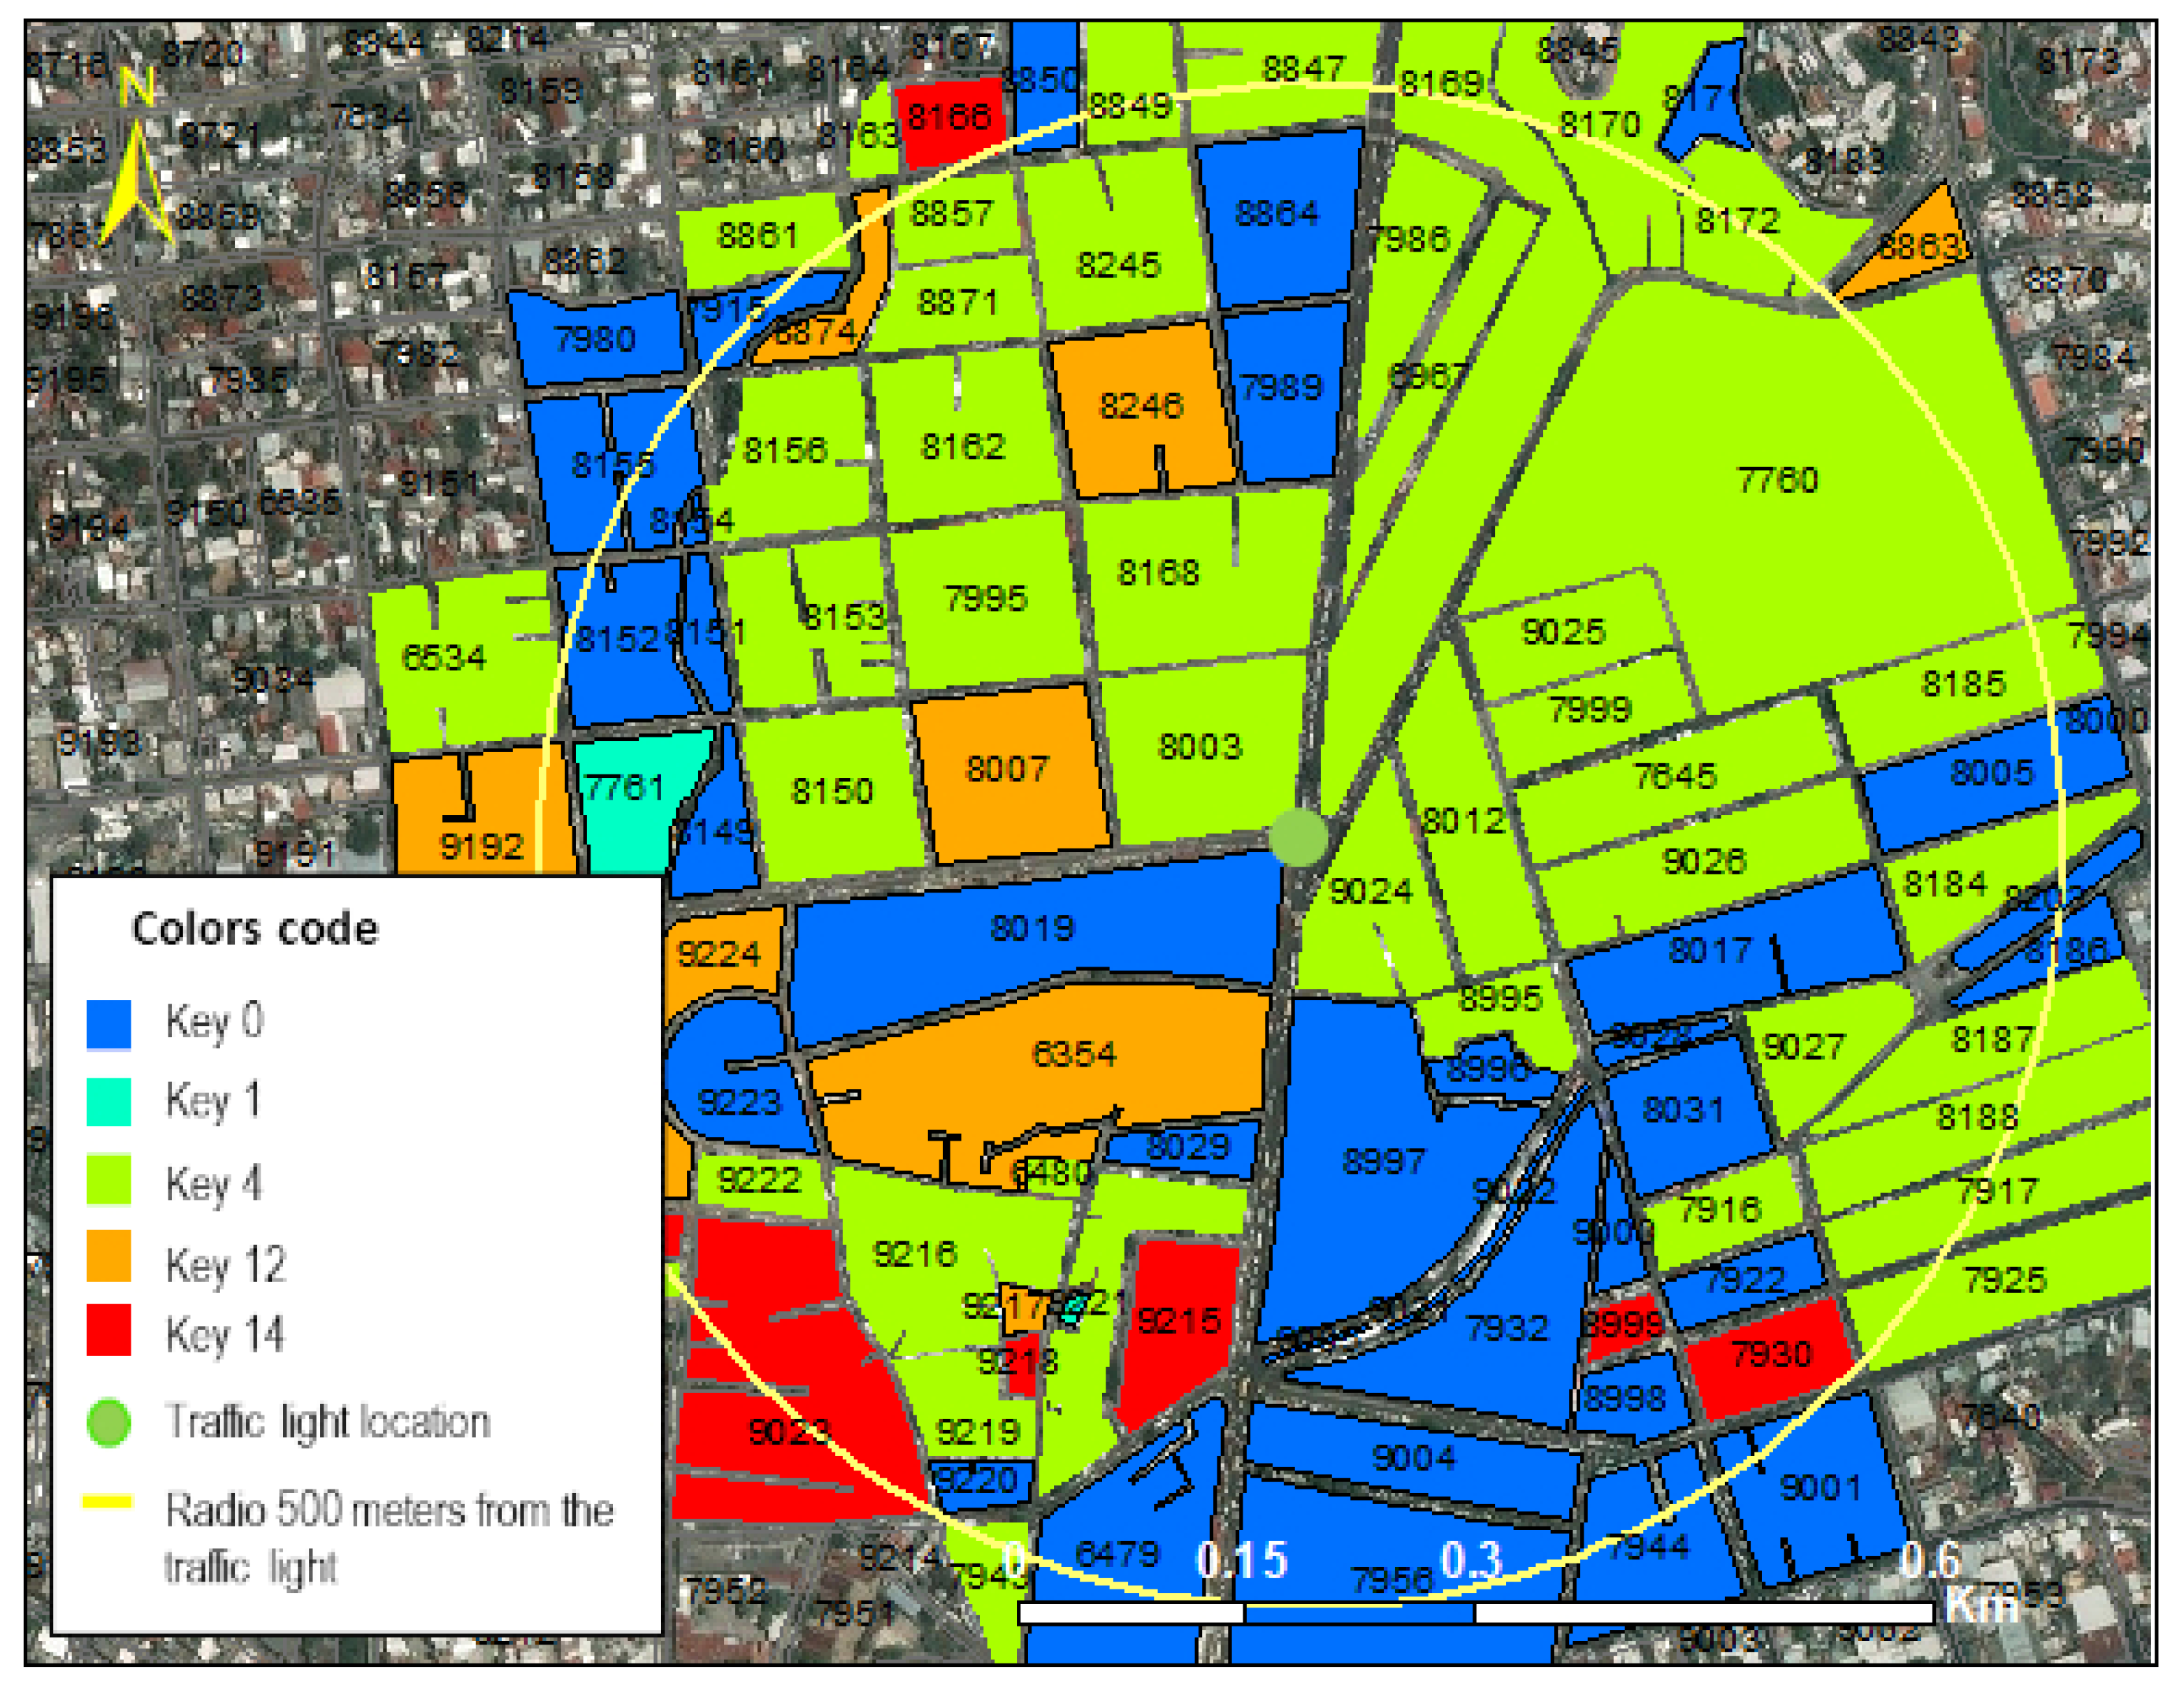
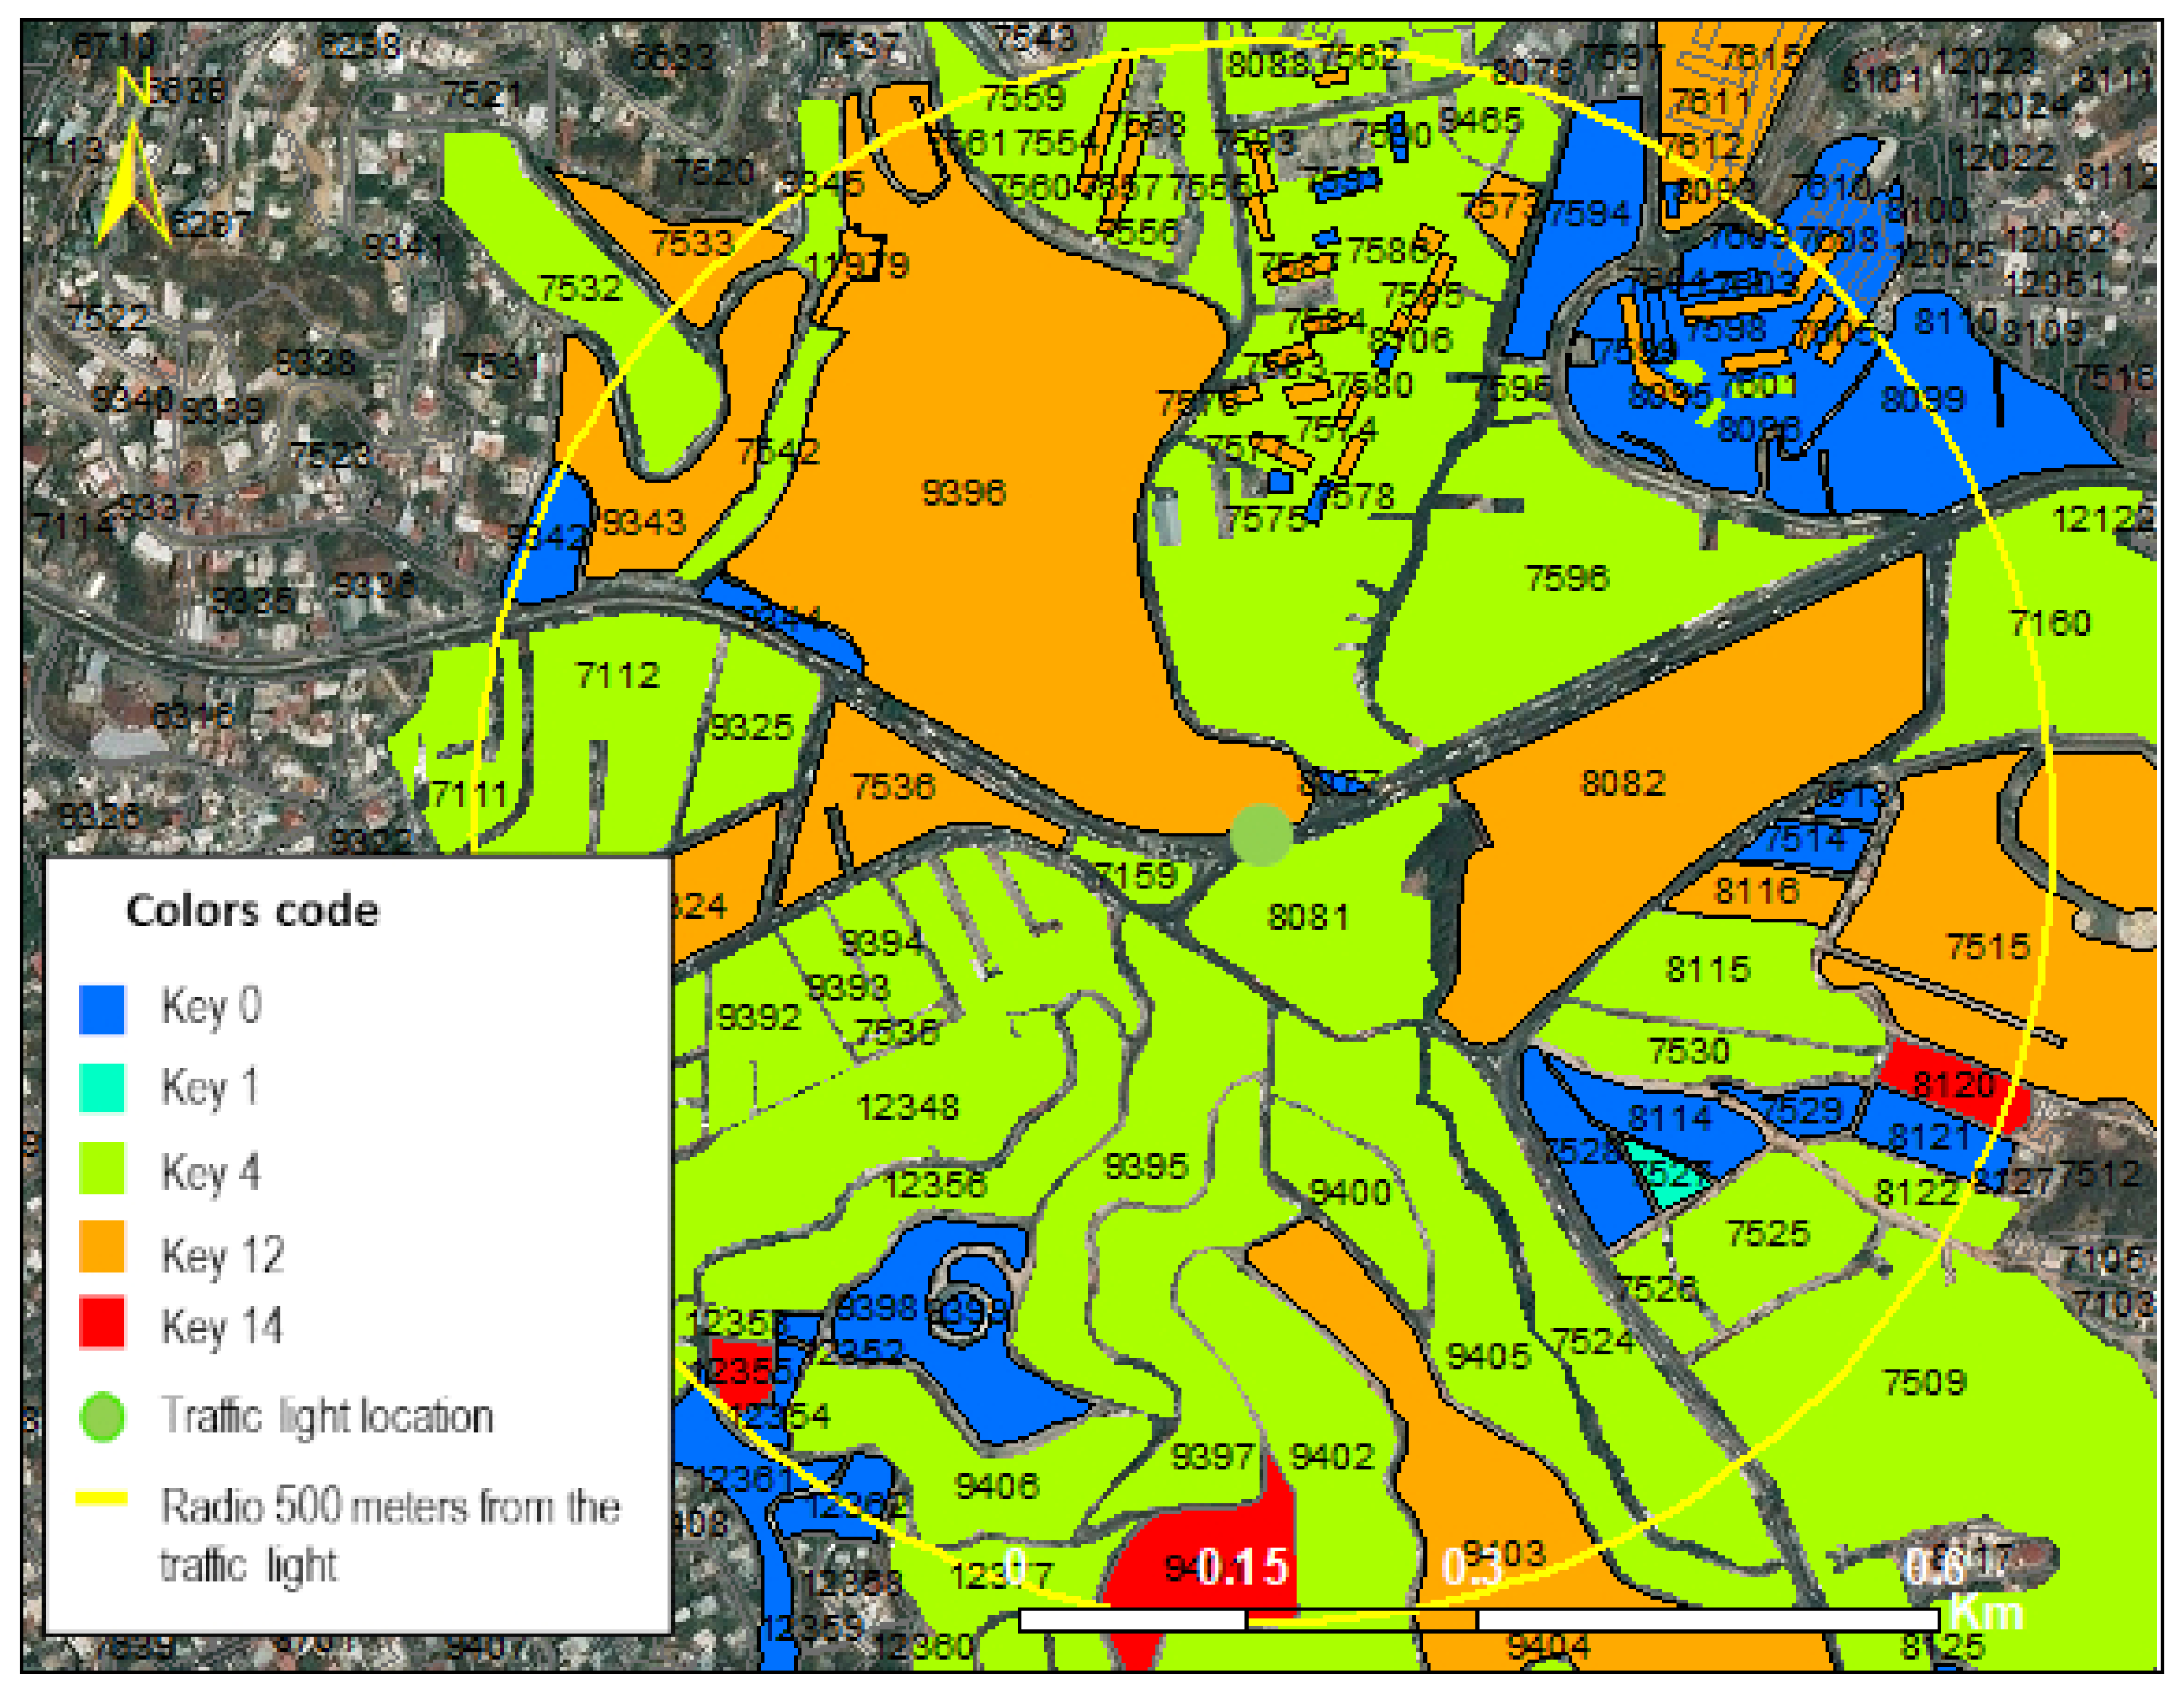
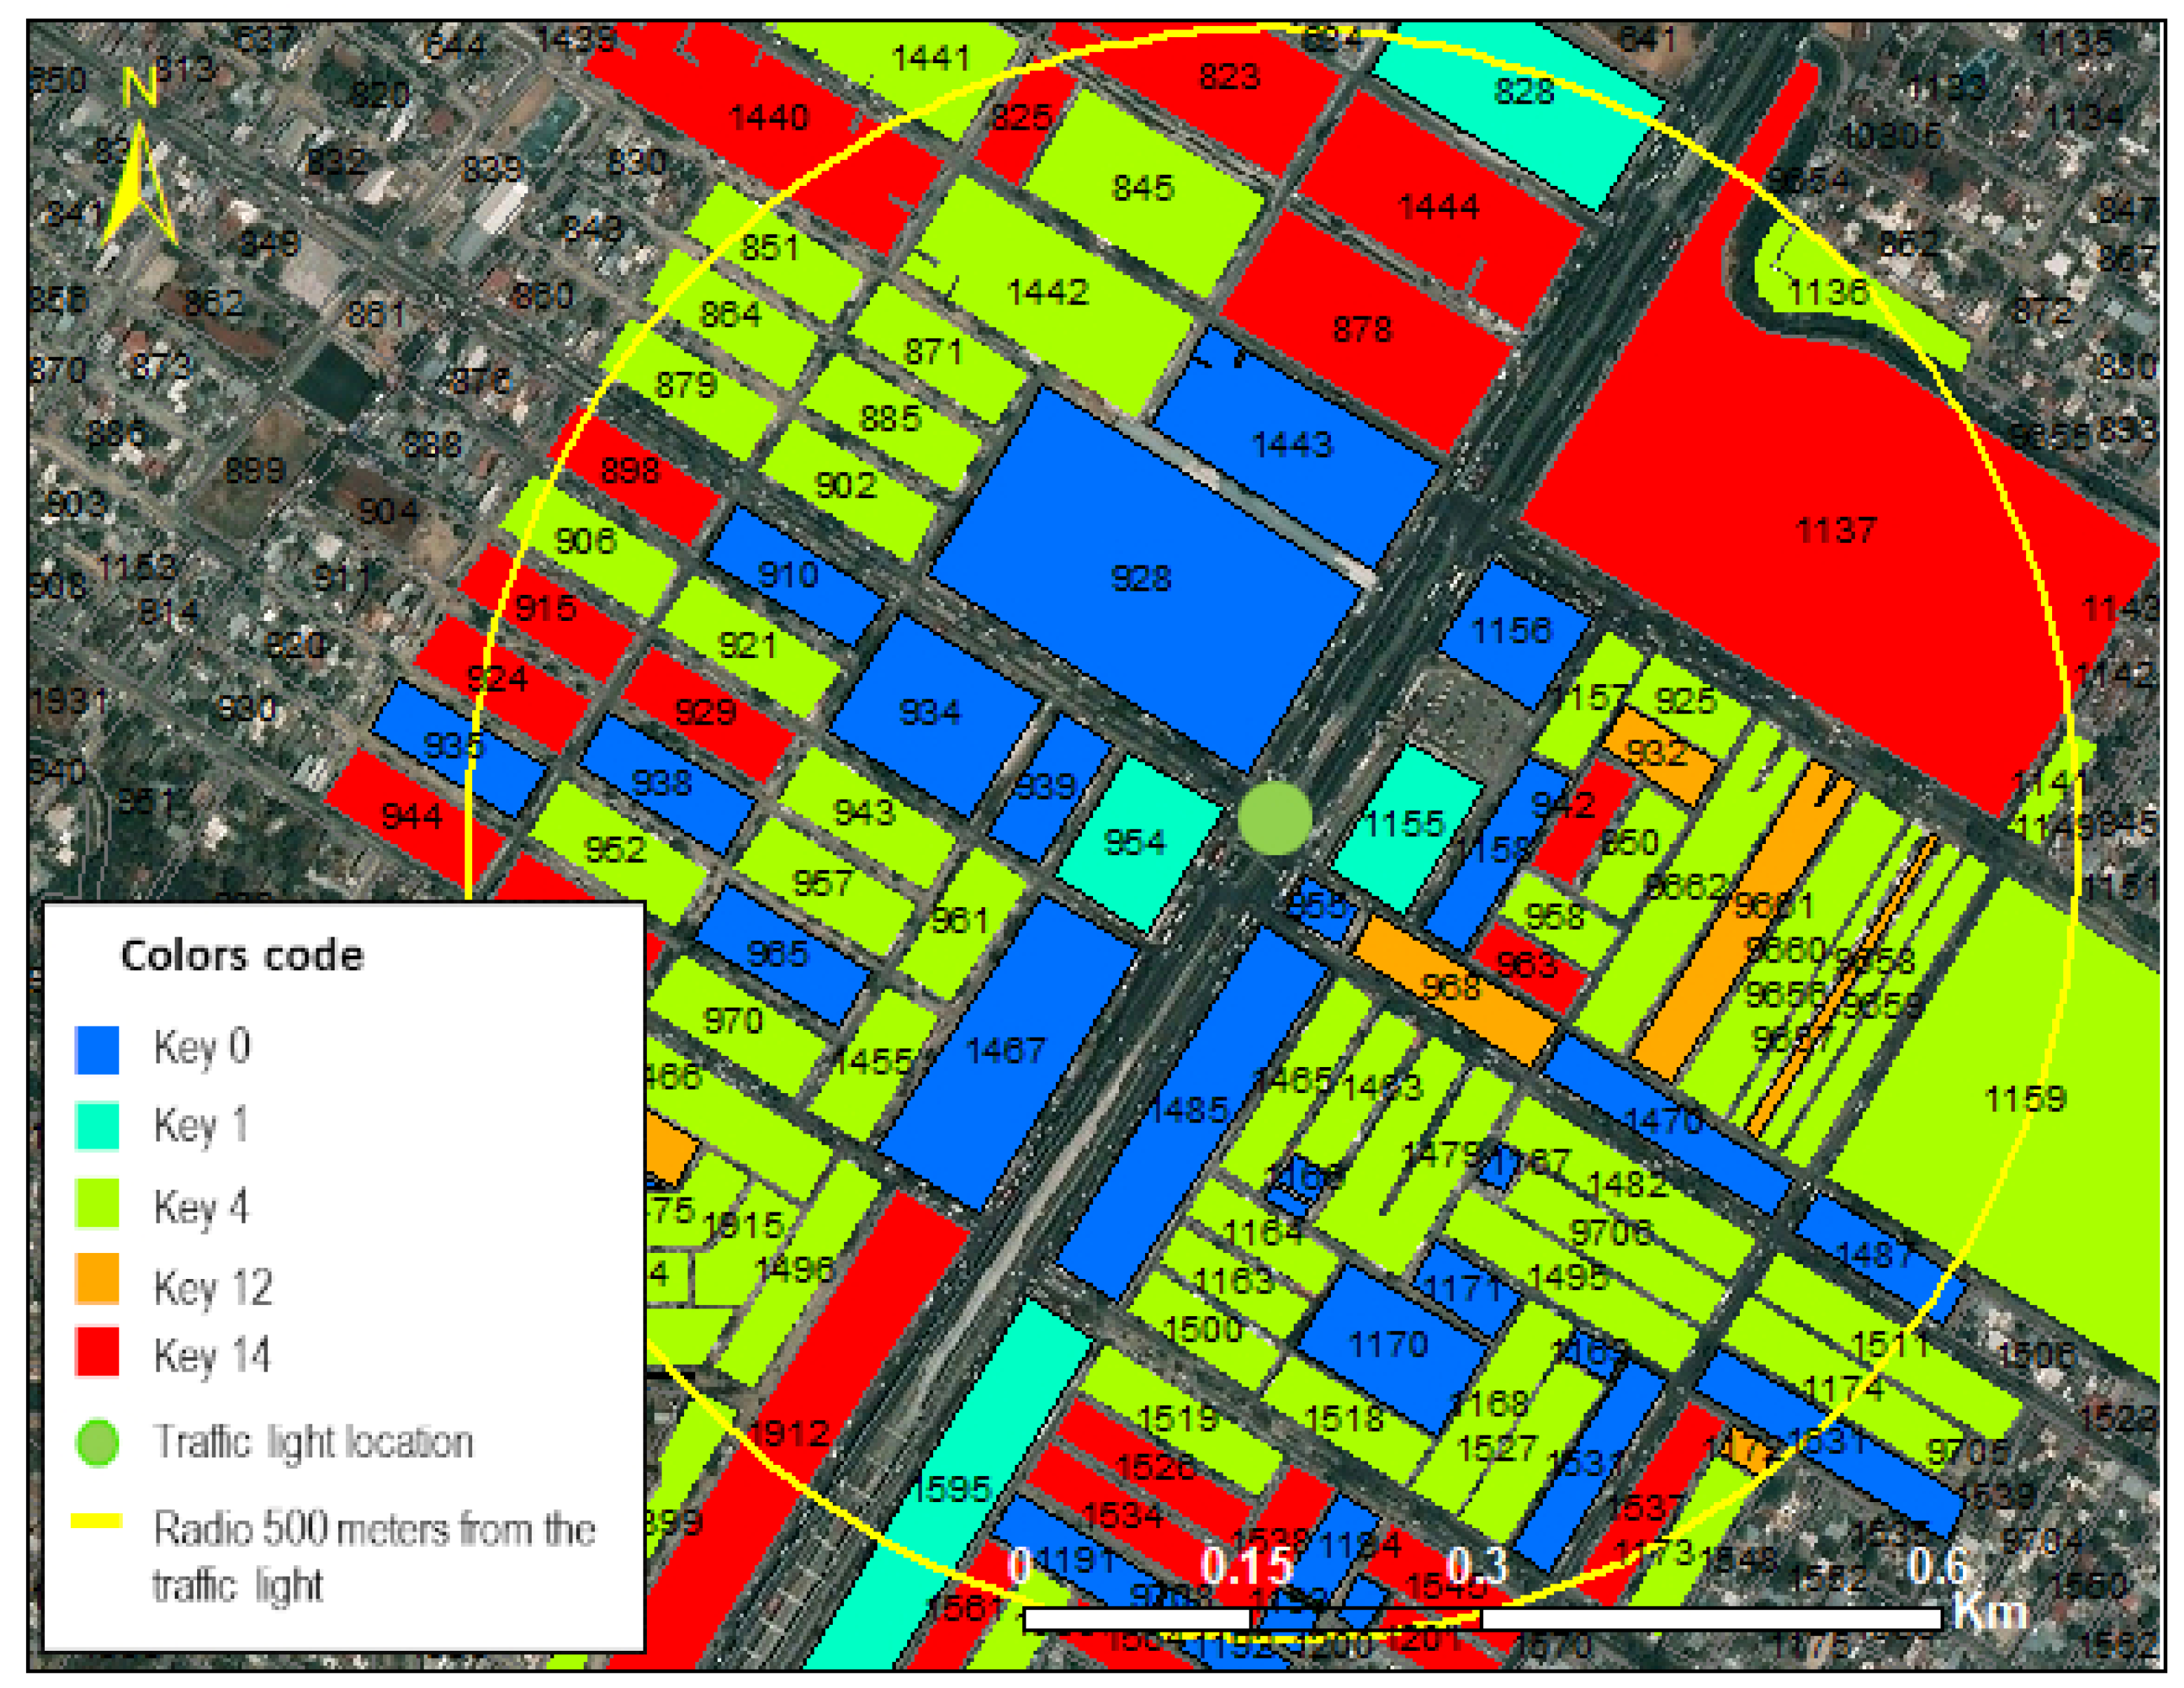
Subsequently, the images of the four study points are shown in Figure 2, Figure 3, Figure 4 and Figure 5. Starting from the block map of INEGI [2], the main point of the crossroads in Figure 2 is “Cuauhtémoc and Wilfrido Massieu”, whose radius of 500 m allows us to determine how the blocks are included in that area. The blocks of data are then selected with the nomenclature defined in the cluster and assigned a color so that they can be easily distinguished.
Table 5 details the number of surveys according to the type of cluster for each survey point.

3. Results

The questionnaire used as a tool to analyze the perception of air quality had 36 questions that were mostly dichotomous. These questions were grouped into categories based on the study in [19], in which the variables were as follows:
  • Identification data.
  • Sociodemographic data.
  • Territorial attachment.
  • Overall health.
  • Environmental sensitivity.
  • Evaluation of air pollution.
  • Sources of air pollution.
  • Attribution of responsibilities of polluting.
  • Knowledge of laws to counter the problems of contamination.
  • Perceived health risks.

3.1. Application of the Questionnaire

Based on the information in Table 5, the questionnaires were delivered between 6 and 9 February 2019 in schedules from 9:00 to 15:00 hours.
To process the collected data, we used the SPSS v23 program, which allows one to create a well-structured data file, to which various statistical analyses is applied [20].
With the questionnaire data already captured, the next step was to analyze whether or not there are reliable methods to calculate the reliability coefficients [21], including those measuring coherence or internal consistency, such as Cronbach’s alpha (developed by JL Cronbach) and the KR-20, KR-21, Kuder, and Richardson coefficients.
Cronbach’s alpha is used when the responses employ a Linkert scale, but if, as with our instrument, a study uses mostly a dichotomous scale, we recommend using KR-20 [22].
Next, we decided to use KR-20 while employing only questions with dichotomous answers and default applications, such as SPSS Cronbach’s alpha. The data were adjusted to 0 in Excel, and the negative response was migrated to a positive one. The formula for KR-20 is:
k r 20 = ( K K 1 ) ( σ 2 Σ p q σ 2 )
where K is the number of items in the instrument, p is the percentage of respondents for each item, q is the percentage of respondents whose answer was NO, and σ 2 is the total variance of the instrument.
Figure 6 shows the screen where KR-20 was applied. For a reliable sample, the KR20 index should be close to one, as seen for the D389 cell in our study. It can be observed that this method is reliable because it has good internal consistency [23].
The frequency values of 36 responses are shown in Table 6. Notably, the average age of the respondents was around 40 years (P01), and the average time of residence in the study area was 23 years (P06).

3.2. Characterization of the Surveyed Population

Based on the data from Table 7 that identifies the predominant school level followed by the basic medium, the sum of both factors accounts for about 78%. The occupation data show that 39% of respondents work on their own, while 46.3% are employed and engage in above 85% of the predominant economic activities.
Income distribution, for nearly 75%, does not exceed two minimum wages. Age represents the way the population is distributed in the country where the majority of respondents (all adults) up to 40 years old account for 58% of the total; 70.9% of respondents have good or excellent health.

3.3. Perceived Air Quality

In general, people are acutely aware that the air they breathe has some degree of contamination, as more than 95% believe that the air is greatly (68.6%) or slightly (27.2%) polluted, as shown in Table 8.

3.4. Sources Responsible for Pollution

For possible sources of contamination, 50% of respondents recognized that cars and trucks are the main source and 24.6% emphasized that they perceive dust pollution to be the cause in Acapulco, where the dust problem is noticeable. The respondents also perceived the time of day with the most polluted air to be 62.8% in the afternoon on Monday (44.2%) and during the summer season (42.7%). The respondents noted that the cause most responsible for the problems of air pollution is “society” as a whole, with 71.7%.
Note: Chi-square was applied to validate the association between the variables shown in the graphs below.
Regarding the question “What do you think contaminates more?”, as seen in Figure 7, 24% think cars produce the most pollution, while 36% believe public buses are the culprits; together, 60% believe that cars and trucks are primarily responsible for air pollution. It is remarkable that, despite there being only one factory in Acapulco (a cement factory located near one of the study points called “entrance Col Zapata” (Figure 5)), 28% of the respondents feel that factories are responsible for pollution.
These questions tried to establish what the public believes to cause pollution. The results were influenced by gender issues and educational level. Generally speaking, the aforementioned aspects remained very similar to the overall rate. However, in the case of gender, 41.6% of women believe that public transport pollutes the most, compared to 31.2% of men (a difference of more than 10%), However, compared to men, women believe that cars and factories pollute less (see Figure 8).
As shown in Figure 9, the level of education undoubtedly influences the perception of what pollutes. Those who have a bachelor’s degree believe that trucks pollute more, while factories were perceived to pollute the least by those with middle and basic levels of education. However, the respondents with a postgraduate level of education perceived factories to contribute the greatest to air pollution, as no one in this educational category chose another option.
One of the questions in the questionnaire focused on health in general and how respondents felt about their health. In contrast to the question “What do you think that pollutes more?, the correlation obtained is similar to that of the general results. People with “Regular” health believe that factories pollute more than trailers and cars (see Figure 10).

4. Discussion

As can be seen in Table 7, the levels of basic and medium education dominate, and the sum thereof represents about 78%, which is similar to nearly 74% of the indicators in Guerrero [24].
As in other similar studies, we considered various aspects of the sample, such as gender, general health status, and level of concern about air quality, among others [25].
In Acapulco, there are few studies on the perception of air quality. In fact, there are no studies on any other city in the state. This paper offers the first survey of public perception about air quality in the metropolitan area of Acapulco.
Given that Acapulco is a tourism destination, the main source of air pollution in the city is motor vehicles. Although the city contains a single factory (cement), this factory is not a benchmark of contamination for the population. Another source that has been identified is population generated by fine particles of PM10 and PM2.5 (smoke and dust).
As surveys were applied near places with very high rates of traffic, one of the questions was aimed at determining the respondents’ perceptions of the causes of pollution, primarily regarding motor vehicles. Europe, specifically Portugal, has come a long way in the classification or nomenclature of air pollution, where there are 11 different categories, including commercial and residential combustion, industrial combustion, production processes, transport, and mobile sources, including waste disposal [26]. In this study, we focus on transport and mobile sources because many of these sources of air pollution are not present in the study area.
Notably, people’s perceptions or concerns over air quality do not always reflect the true risks [27], but in our case, there are no updated data to use as contrasting measurements. However, the perception of the population is not always consistent with the results of measurements. For example, in Mexico City between 2000 and 2003, several studies were made and graded according to the sentiments of the people regarding very high pollution air, but monitoring indicated that pollution during those periods was low [6].
In similar research studies, more than 57% [9] and 69% [28] of the population felt that the air quality is bad, even when the study was performed close to industrial areas [29], placing the perception of poor quality at only 55%, indicating greater awareness in our case.
The results of this study showed that, although weather conditions are generally favorable for the dispersion of pollutants, almost 70% of respondents perceived the degree of air pollution as “strong”; although 50% attributed this contamination to vehicles, the rest equally felt that “dust” and “smoke” are the worst pollutants. Dust is likely due to the above factors with respect to the rainy season, which, for practical purposes, extends just over six months. Smoke was surprisingly strongly perceived in Acapulco. Here, smoke refers to the burning of solid waste, perhaps due to a deficient garbage collection service that compels residents to burn their waste.
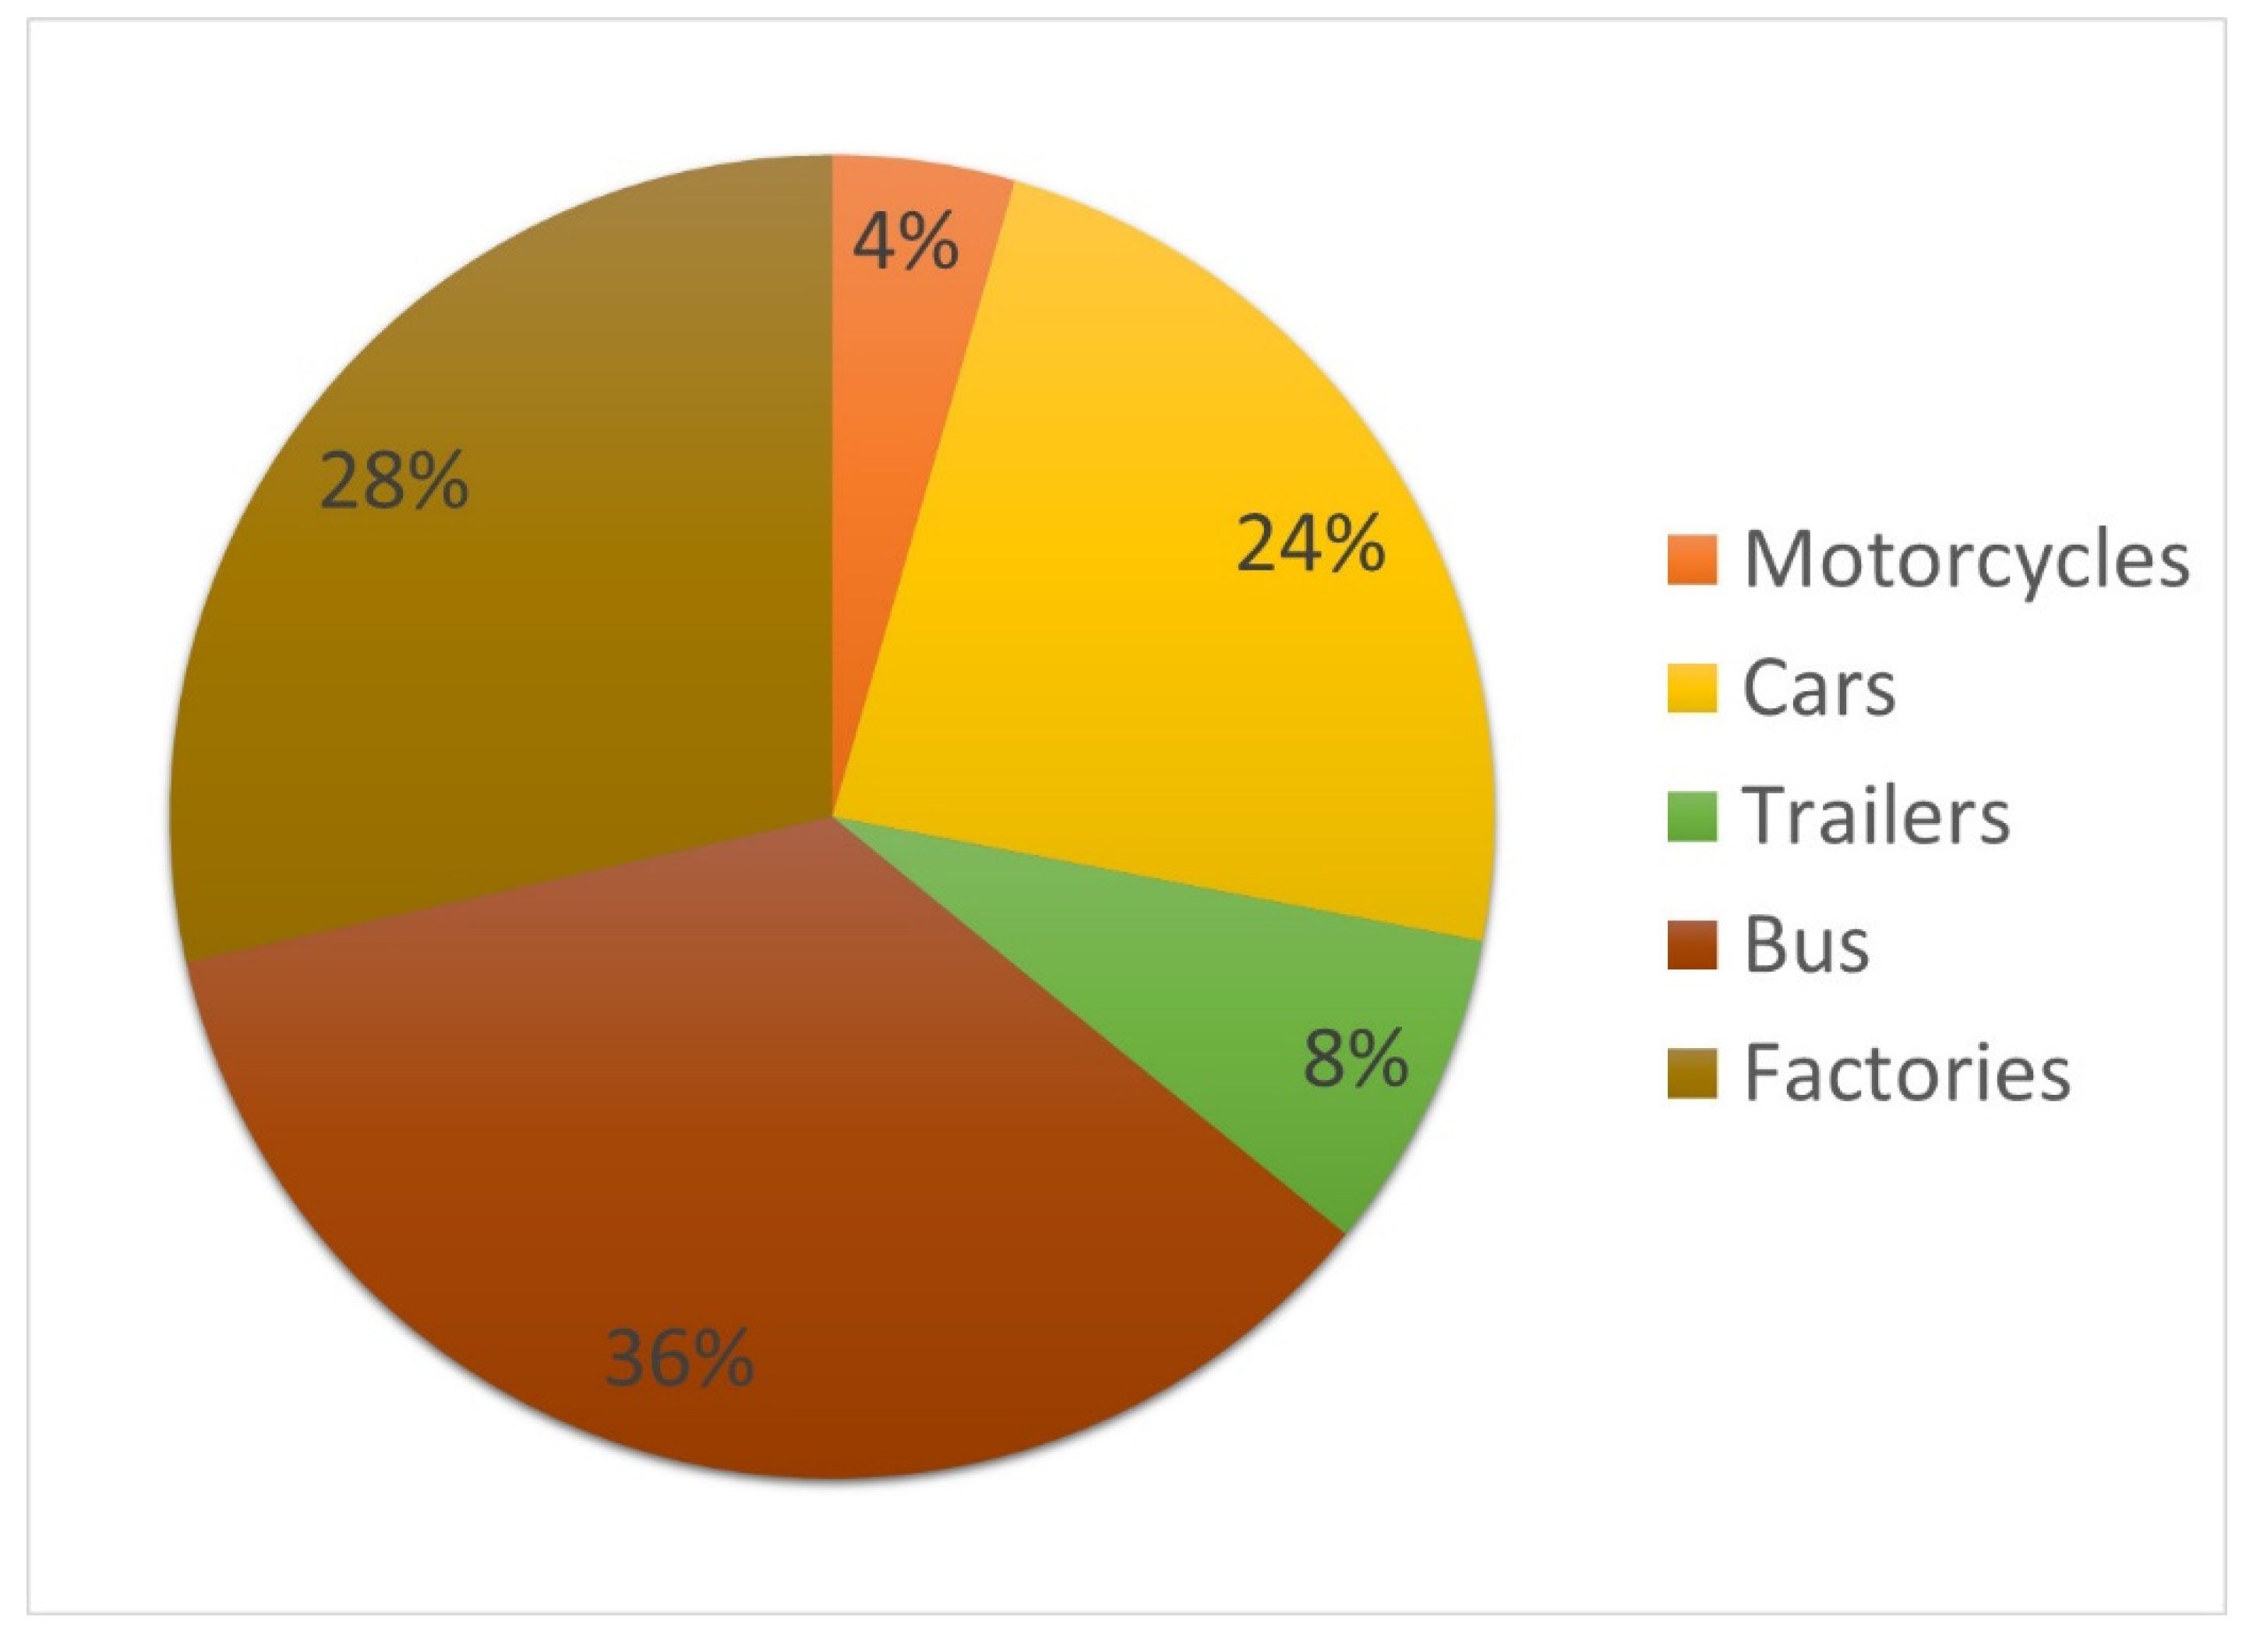
As shown in Figure 7, 24% think that the cars contribute more to pollution, while 36% believe that buses and public transport contribute more. According to data from INEGI, Acapulco has a vehicle fleet of 322,000 [2]. Interestingly, trailers and factories were noted by around 30% of respondents, but in Acapulco, there is only one factory.
Although this research was conducted in the winter season, participants were asked what time of the year received more pollution, and almost 43% said summer, in contrast with studies indicating that rain acts as an environmental cleaner [30], followed by almost 30% who reported spring, which reveals the perceived correlation between the rainy season’s heat and greater pollution—most likely due to fine particles resulting from the runoff with soil, which then evaporate during the indicated seasons.
When asked about who is most responsible for problems of air pollution, 71.7% said “society”, which is higher than the results of a study in the Yucatán [31], in which 50.8% of the population surveyed saw society as responsible.
Based on the results, it is evident that the inhabitants of the metropolitan area of Acapulco are aware of the existence of poor air quality and know that society as a whole has engendered these conditions. A conscious society will always be better prepared to take action to improve their living conditions—in this case, air quality.
While it is true that there are no measurement data to contrast people’s feelings about air pollution, this area provides an opportunity to further analyze the air quality in Acapulco and to propose public policies for improvement.
Another possible upgrade for future research lies in the fact that our sample was gathered in places with high levels of vehicular concentration because of the study’s goal. However, in a larger project, expanding the study area could offer an opportunity to obtain more data around the city and compare the results between areas.
Finally, it is noteworthy that a quarter of respondents perceived smoke from combusted garbage to be the main source of air pollution. Thus, it will be necessary to verify if the deficient collection of garbage is forcing people to burn their waste or if this is a common practice.

5. Conclusions

This document details the population’s perception of the air quality in Acapulco. The sample was based on areas with major traffic problems, but these points are distributed throughout the city, so using the method of cluster homogeneity is guaranteed to be suitable. A total of 95% of people are aware that the air they breathe has some degree of pollution.
Of all pollution sources, most recognized the gases from the automotive sector as the primary contaminants at 50%, but 25% noted dust as the main pollutant, considering the problem of suspended particles as a major health risk in the municipality of Acapulco. Smoke (24%) was also considered to be a possible contaminant. The sample indicated the time of year with the greatest amount of air pollution to be summer.
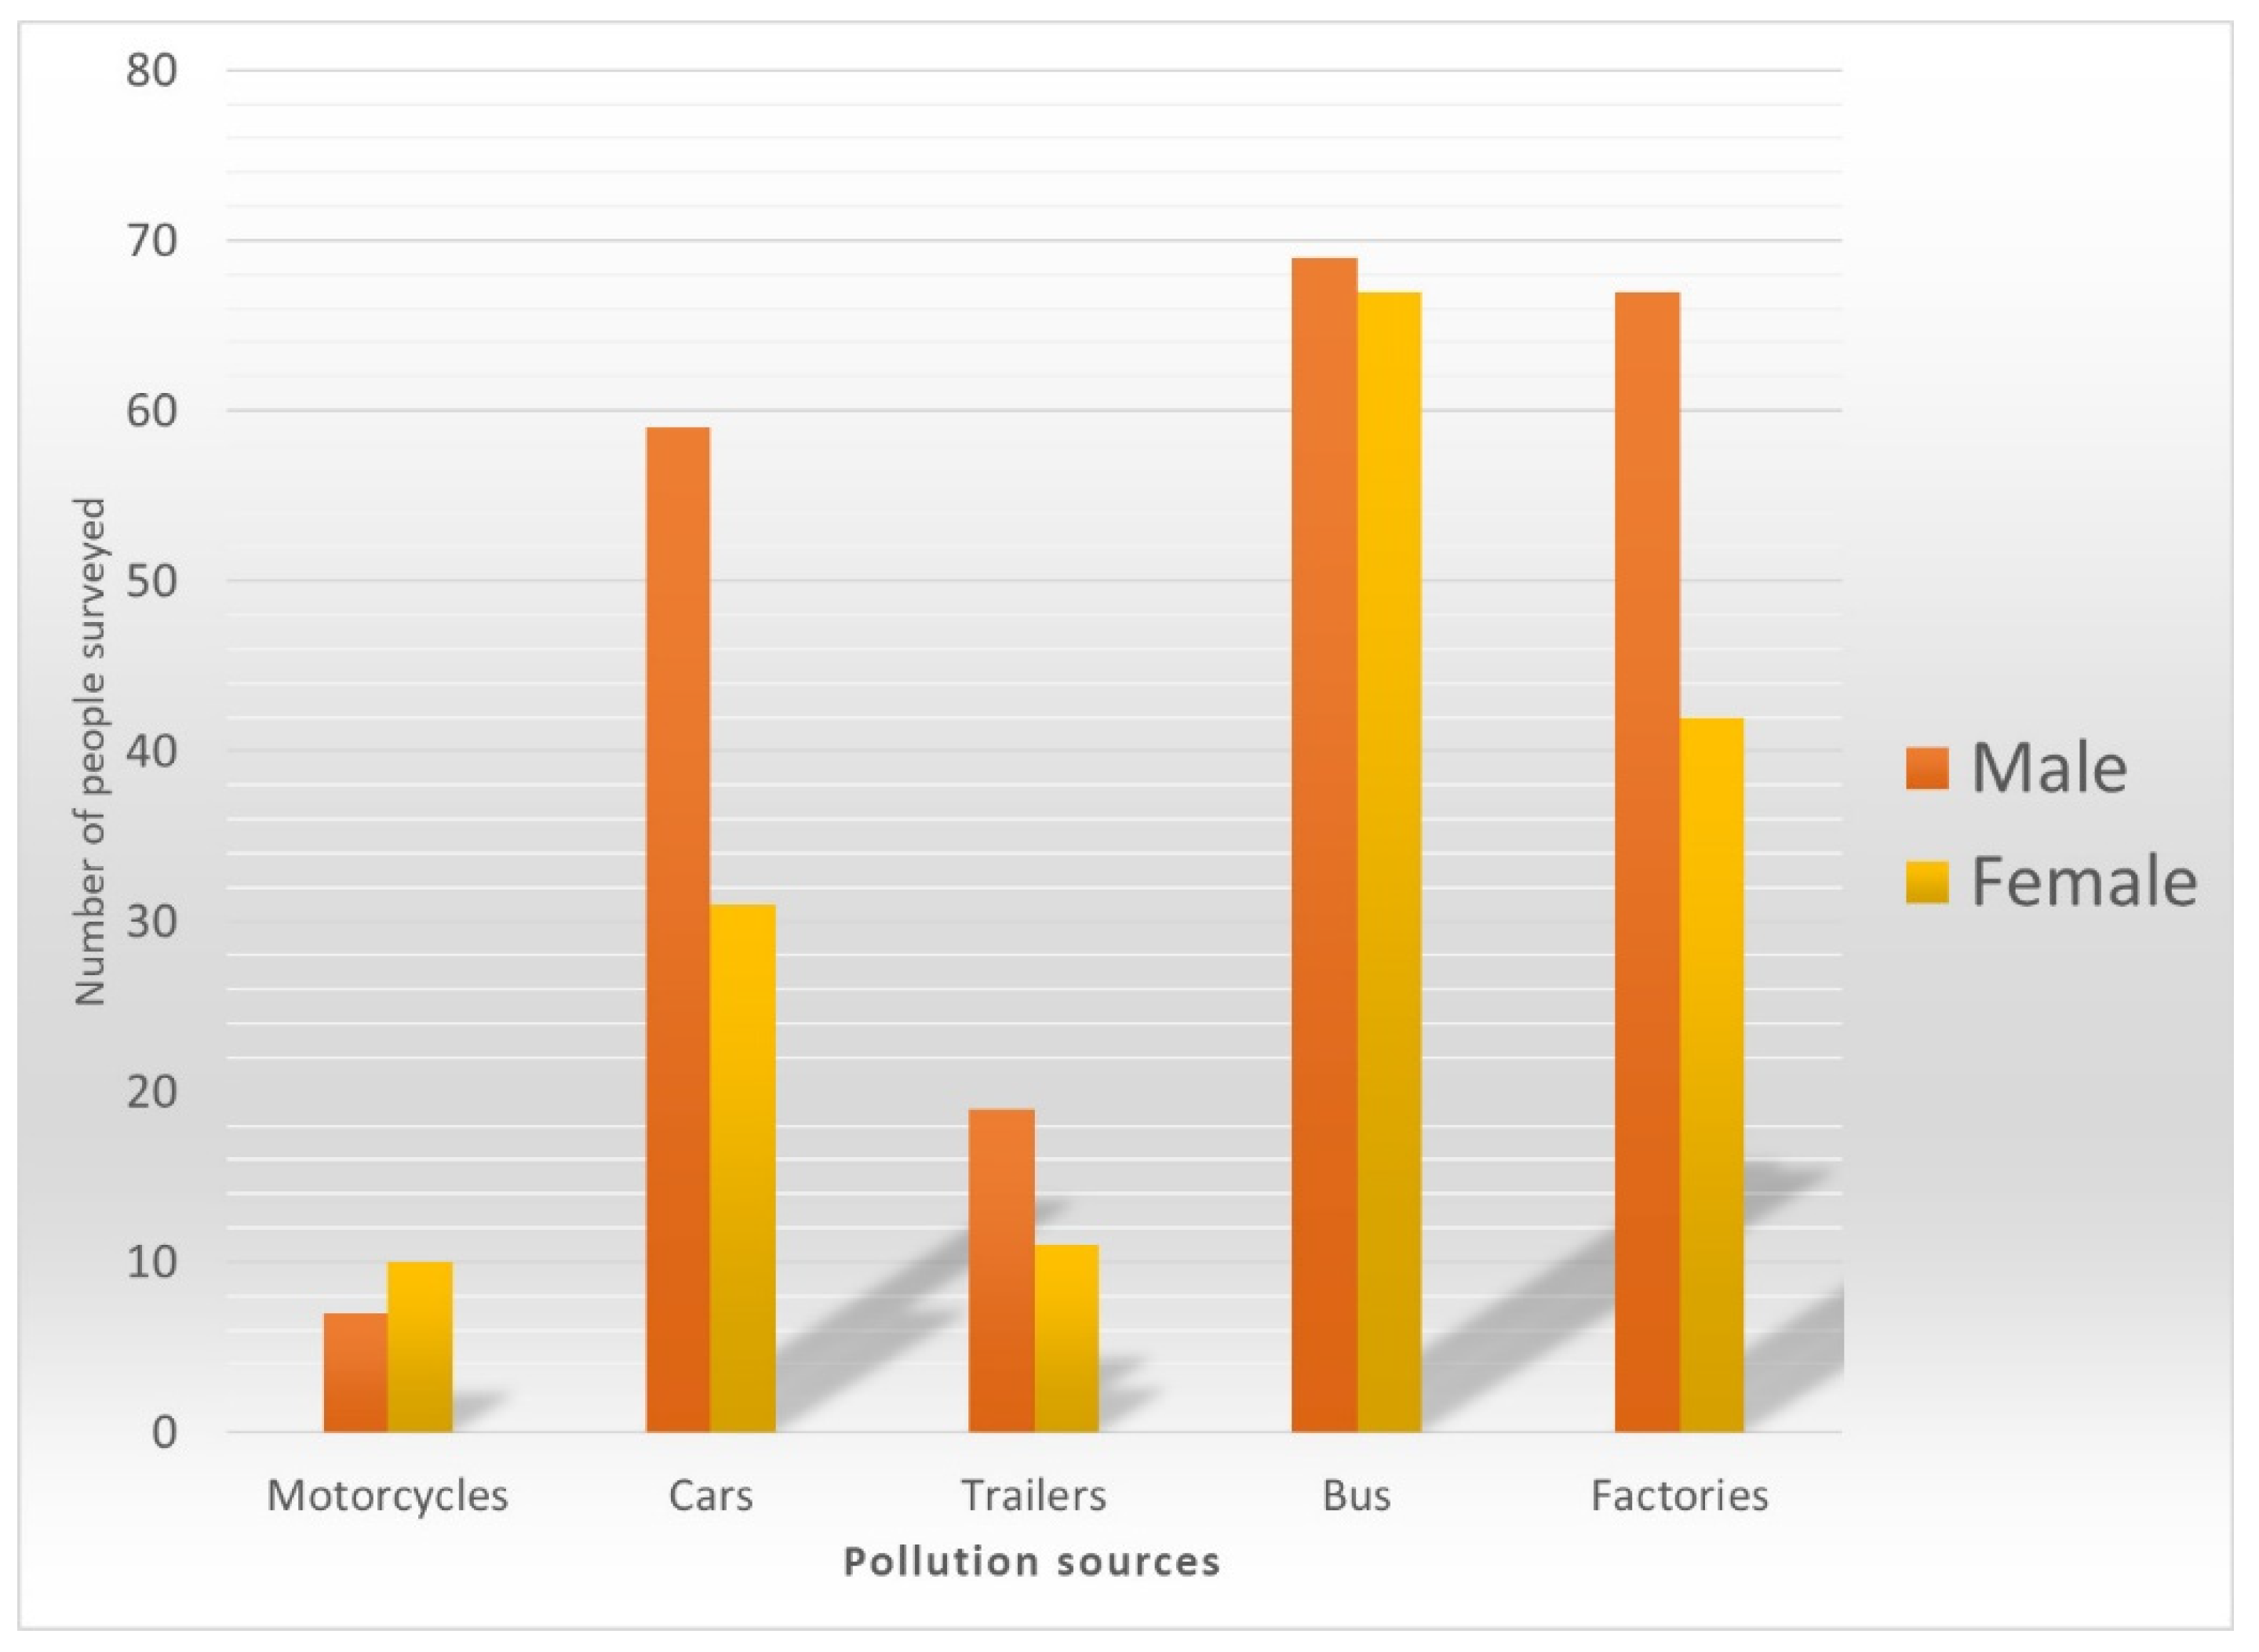
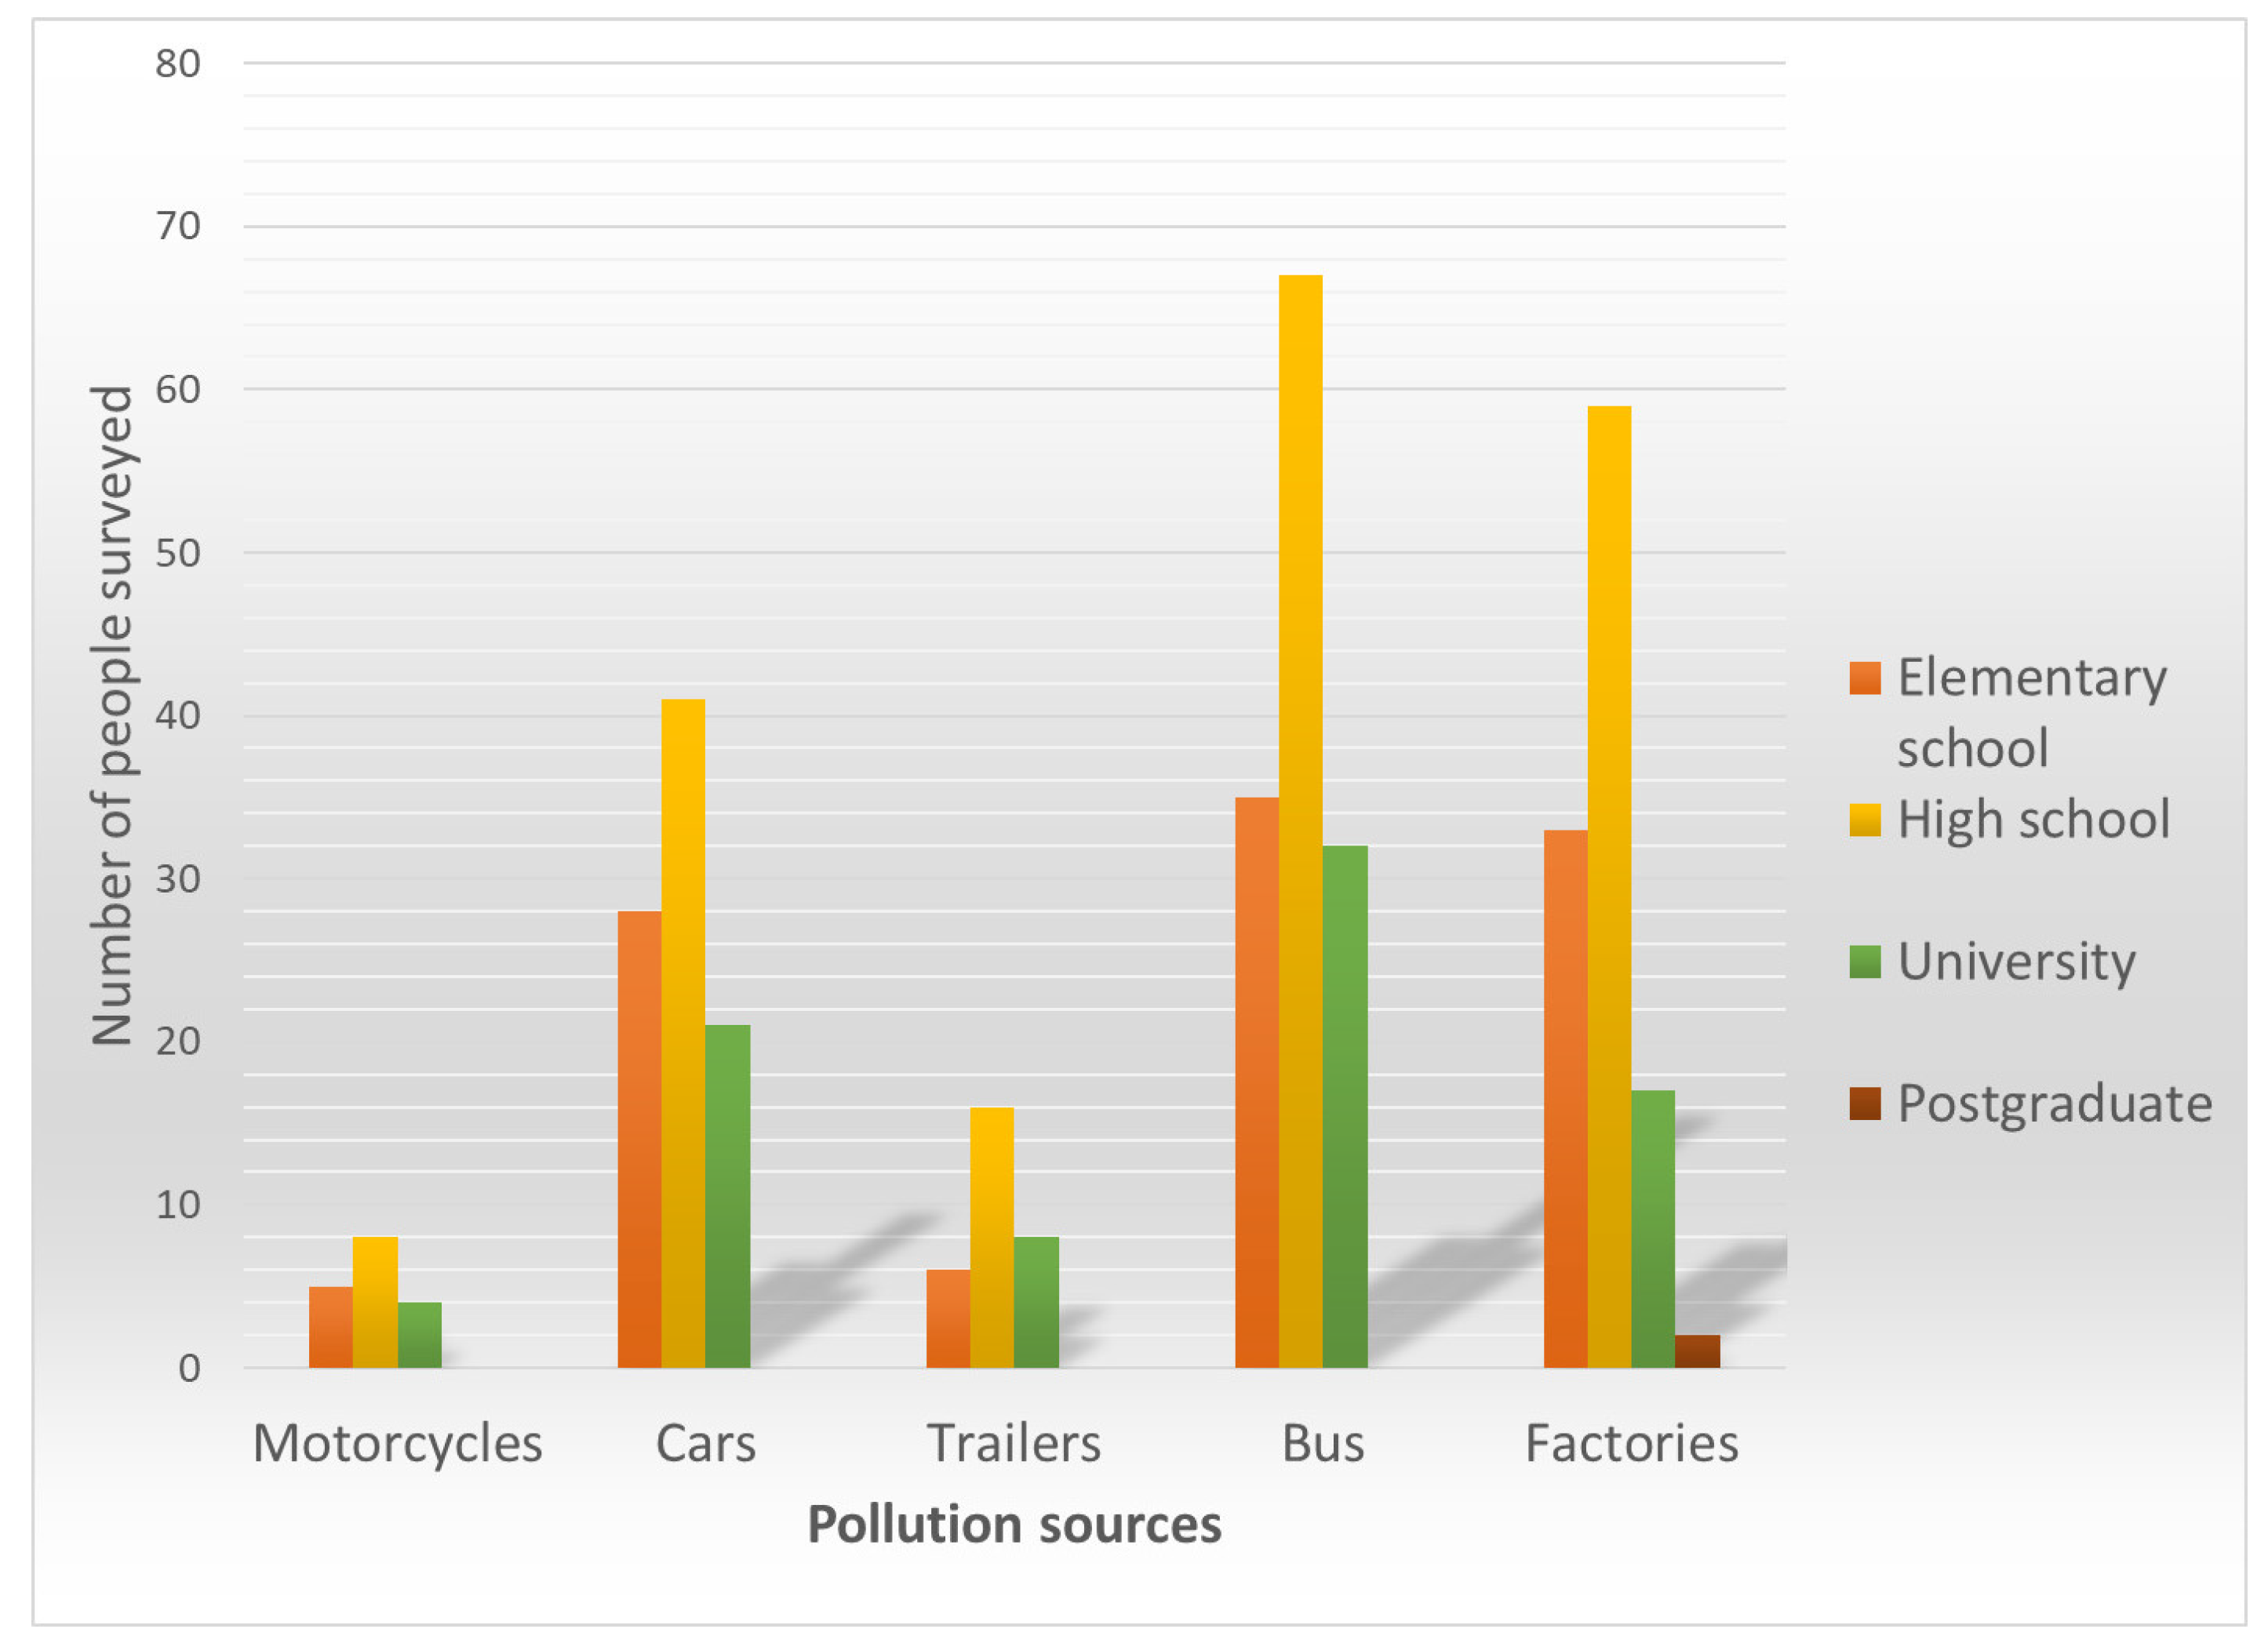
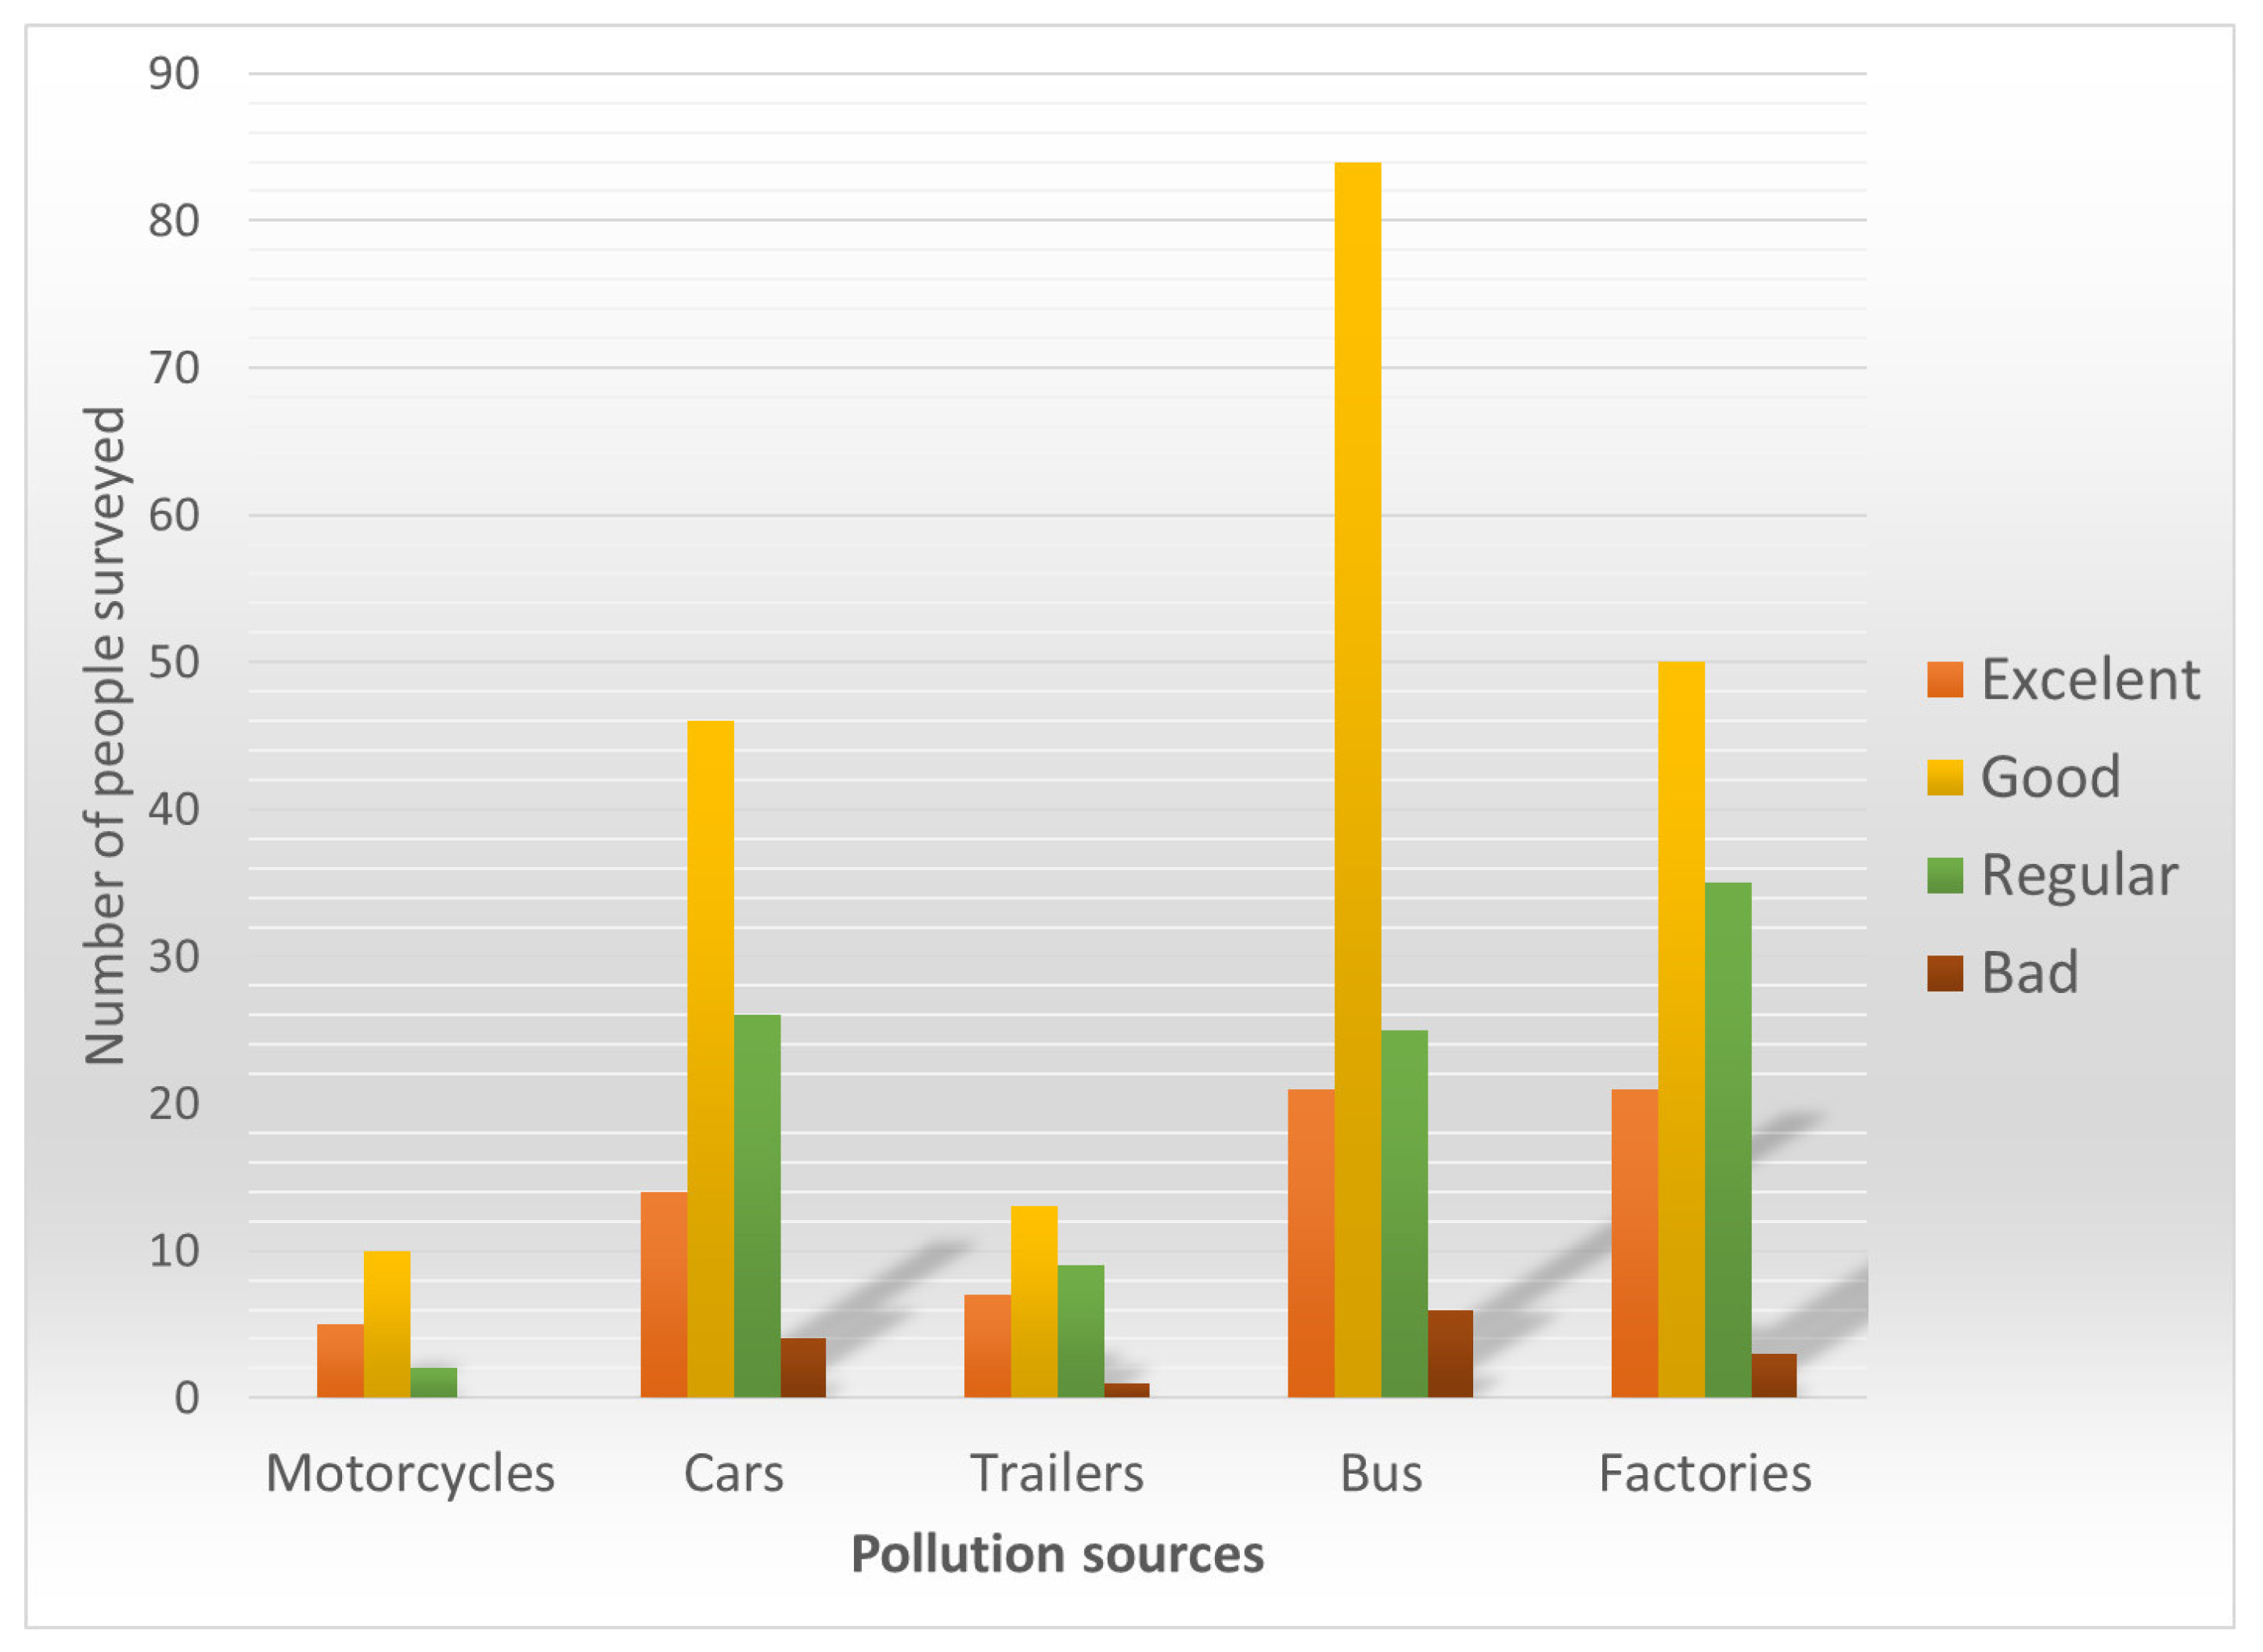
When the results are analyzed for causes of pollution, by gender, women believe that public transport contributes more to pollution at 41.6%, compared to 31.2% of men (a nearly 10% difference). However, compared to men, women think that cars and factories pollute less. In the same category, but with respect to the dominant responses, among the general participants, only people with “Regular” health showed a greater preference to select factories over buses and cars. However, in general, buses and cars always occupy the largest percentage responsible for pollution. It is important that respondents be aware that the responsibility of air pollution rests primarily on society’s shoulders.
In our experience, it was necessary to know the perception of what people feel, think, or want. This helped us with the first step of implementing a strategy that influences public policies successfully. This research is part of a larger project in which researchers from the Autonomous University of Guerrero and the Government of the Municipality of Acapulco are concerned about the increase in vehicular traffic and for which a prototype was developed to measure air quality in the city, which will initially be installed at the critical pollution points studied described in this text.

Author Contributions

Conceptualization, A.R.Z.V., M.R.U. and H.J.A.W.; methodology, A.R.Z.V., M.R.U., and H.J.A.W.; software, A.R.Z.V., and A.A.R.R.; validation, J.G.G., H.J.A.W., and C.R.A.; formal analysis, A.R.Z.V., J.G.G., and A.A.R.R.; investigation, A.R.Z.V. and C.R.A.; resources, J.G.G.; data curation, H.J.A.W. and C.R.A.; writing—original draft preparation, A.R.Z.V., and H.J.A.W.; writing—review and editing, A.R.Z.V.; visualization, A.R.Z.V.; supervision, A.A.R.R.; project administration, M.R.U. All authors have read and agreed to the published version of the manuscript.

Funding

This research received no external funding.

Conflicts of Interest

The authors declare no conflict of interest.

References

  1. Perevochtchikova, M. The current situation of environmental monitoring system in the metropolitan area of Mexico City. Demogr. Urban 2009, 24, 513–547. [Google Scholar] [CrossRef] [Green Version]
  2. INEGI. Censo de Población y Vivienda; INEGI. Instituto Nacional de Estadística y Geografía: Aguascalientes, México, 2010. [Google Scholar]
  3. WHO. Nine Out of Ten People Around the World Breathe Polluted Air. WHO. Available online: https://www.who.int/es/news-room/detail/02-05-2018-9-out-of-10-people-worldwide-breathe-polluted-air-but-more-countries-are-taking-action (accessed on 4 March 2019).
  4. WHO. Air Quality and Health. WEB: WHO. Available online: https://www.who.int/es/news-room/fact-sheets/detail/ambient-(outdoor)-air-quality-and-health (accessed on 2 May 2018).
  5. Perevochtchikova, M. Ambientaly impact assessment of the importance of environmental indicators. Manag. Public Policy 2013, XXII, 283–312. [Google Scholar]
  6. Wheeler, B.W.; Ben-Shlomo, Y. Environmental equity, air quality, socioeconomic status, and respiratory health: A linkage analysis of routine data from the Health Survey for England. J. Epidemiol. Community Health 2005, 59, 948–954. [Google Scholar] [CrossRef] [PubMed] [Green Version]
  7. Catalan Vazquez, M. Study of public perception of air pollution and health risks: Theoretical and methodological perspectives. Rev. Inst. Nal. Enf. Resp. Mex. 2006, 19, 28–37. [Google Scholar]
  8. Sanchez Maria, A.A.; Linda, V.; Franco Juan, F. Public perception of the impact of air pollution on health and quality of life: A pilot study. Mag. Épsilon 2013, 21, 173–187. [Google Scholar]
  9. Sala, R.; Oltra, C.; Goncalves, L. Percepción Pública de la Contaminación Atmosférica Urbana: Un Análisis Exploratorio; Informes Técnicos CIEMAT: Madrid, Spain, 2014. [Google Scholar]
  10. Deguen, S.S.C.; Pedrono, G.M.M. A New Perception Scale Air Quality Assessment for Global Health Effects of Air Pollution. Soc. Risk Anal. 2012, 32, 2043–2054. [Google Scholar] [CrossRef] [PubMed]
  11. Egondi, T.; Kyobutungi, C.; Ng, N.; Muindi, K.; Oti, S.; van de Vijver, S.; Rocklöv, J. Community Perceptions of Air Pollution and Related Health Risks in Nairobi Slums. Int. J. Environ. Res. Public Health 2013, 10, 4851–4868. [Google Scholar] [CrossRef] [PubMed] [Green Version]
  12. INECC. Informe Nacional de Calidad del Aire, México; Instituto Nacional de Ecología y Cambio Climático: Mexico City, Mexico, 2014. [Google Scholar]
  13. Huang, L.; Rao, C.; van der Kuijp, T.J.; Bi, J.; Liu, Y. A comparison of single exposure, perception, and acceptable levels of PM2.5 with air pollution policy Objectives in China. Environ. Res. 2017, 157, 78–86. [Google Scholar] [CrossRef] [PubMed]
  14. EPA. Revisions to the Guideline on Air Quality Models: Enhancements to the AERMOD Dispersion Modeling System and Incorporation of Approaches to Address Oz1 and Fine Particulate Matter. Federal Register; 2017. Available online: https://www.federalregister.gov/documents/2017/01/17/2016-31747/revisions-to-the-guideline-on-air-quality-models-enhancements-to-the-aermod-dispersion-modeling (accessed on 19 March 2019).
  15. Ordaz Sanz, J.A.; Melgar Hilario, M.C.; Rubio Castaño, C.M. Statistical and Econometric Methods in Business and Finance; Pablo de Olavide University: Seville, Spain, 2010. [Google Scholar]
  16. Guillén, A.; Badii, M.H.; Prado, J.L.; Valenzuela, J. Concepto y Aplicación de Muestreo Conglomerado y Sistemático. Daena Int. J. Good Conscienc. 2011, 6, 186–194. [Google Scholar]
  17. Otzen, T.M.C. Sampling techniques on a study population. Int. J. Morphol. 2017, 35, 227–232. [Google Scholar] [CrossRef] [Green Version]
  18. López, B.; Pita, S.; Pertega, S.; Seoane, T. Excel Calculator for Sample Size [Excel, Tamano_Muestral.xls]. Available online: https://www.fisterra.com/gestor/upload/guias/tamano_muestral.xls (accessed on 2 January 2019).
  19. Jiménez, M.; Ferrer, A.; Chaves, L.; Navarro, O.E.; Marín, J.G.; Cárdenas, J.; Rodríguez, S.C. Preliminary analysis of a questionnaire assessing social perception of air pollution. Rev. Public Health 2015, 15, 713–727. [Google Scholar]
  20. Castañeda, M.B.; Cabrera, A.; Navarro, Y.; Vries, W. Procesamiento de Datos y Análisis Estadístico Usando SPSS; EdiPUCRS: Porto Alegre, Brazil, 2010. [Google Scholar]
  21. Sampieri, R.H.; Collado, C.F.; Lucio, P.B.; Valencia, S.M.; Torres, C.P.M. Metodología de la Investigación; Mc Graw Hill: Mexico City, México, 2010. [Google Scholar]
  22. Sijtsma, K. On the use, the misuse and the very limited Cronbach’s Alpha of the. Psychometrika 2009, 74, 107–120. [Google Scholar] [CrossRef] [PubMed] [Green Version]
  23. da Silva, F.C.; Goncalves, E.; Valdivia Arancibia, B.A.; Bento, G.G.; da Silva Castro, T.L.; Soleman Hernandez, S.S.; da Silva, R. Estimates of internal consistency in health research: Using Alfa Coefficient. Rev. Exp. Med. Peru Public Health 2015, 32, 129–138. [Google Scholar]
  24. INEGI. Intercensal Survey 2015; INEGI: Aguascalientes, México, 2015. [Google Scholar]
  25. Schmitz, S.W.L.; Becker, S.N.N.; Schwartzbach, F.; von Schneidemesser, S.E. An assessment of perceptions of air quality surrounding the implementation of a measure Traffic- reduction in local urban environment. Sustain. Cities Soc. 2018, 41, 525–537. [Google Scholar] [CrossRef]
  26. Sa, E.F.J.; Carvalho, A.B.C. Development of current and future pollutant Emissions for Portugal. Atmos. Pollut. Res. 2015, 6, 849–857. [Google Scholar] [CrossRef]
  27. Brody, S.D.; Peck, B.M.; Highfield, W.E. Localized examining Patterns of Air Quality Perception in Texas: A Spatial Analysis and Satatistical. Risk Anal. 2004, 24, 1561–1574. [Google Scholar] [CrossRef] [PubMed]
  28. Liao, X.; Tu, H.; Maddock, J.E.; Fan, S.; Lan, G.; Wu, Y.; Lu, Y. Residents’ perception of air quality, pollution sources, and air pollution control in Nanchang, China. Atmos. Pollut. Res. 2015, 6, 835–841. [Google Scholar] [CrossRef]
  29. Guevara, B.H.G.A.; Palacios, M.C.A.; Hernandez, J.R.L.; Manrique, K.R.E.; Azuaje, V.G.E.; Rodriguez, C. Health Risk Perception of Environmental Pollution in Housing development Terrazas del Este, Cloris Industrial Z1. Guarenas. Med. Rep. 2011, 13, 257–267. [Google Scholar]
  30. Pérez-Vidal, H.; Lunagómez-Rocha, M.A.; Acosta-Perez, L.I. ANALYSIS Total Suspended Particles (TSP) and particulates Respirable fraction (PM10), Cunduacán, TABASCO. Univ. Cienc. 2010, 26, 151–162. [Google Scholar]
  31. Bautista, F. Social perception of environmental problems in Yucatan, Mexico. A view from geography. Theory Prax. 2011, 9, 33–54. [Google Scholar]
Figure 1. Study area of the metropolitan area in Acapulco.
Environments 07 00021 g001
Figure 2. Traffic light “Anclas–Cuauhtémoc” with the selected blocks.
Environments 07 00021 g002
Figure 3. Traffic light “Ejido and Constituyentes” with the selected blocks.
Environments 07 00021 g003
Figure 4. Traffic light “KFC–IMSS” with the selected blocks.
Environments 07 00021 g004
Figure 5. Traffic light “entrance Col. Zapata” with the selected blocks.
Environments 07 00021 g005
Figure 6. Excel screen using KR-20.
Environments 07 00021 g006
Figure 7. What do you think contaminates more?
Environments 07 00021 g007
Figure 8. What do you think contaminates more (by gender)?
Environments 07 00021 g008
Figure 9. What do you think pollutes more (by education)?
Environments 07 00021 g009
Figure 10. What do you think causes pollution (by general health)?
Environments 07 00021 g010
Table 1. Number of blocks within a radius of 500 m at every traffic light.
PlaceBlocks
Traffic light Ejido and Constituyentes93
Traffic light Comercial Mexicana–Zapata113
Traffic light KFC–IMSS Ruíz Cortínez115
Traffic light Anclas–Cuauhtémoc77
Table 2. The first grouping exercise to determine the clusters of blocks.
KeyDescriptionBlock%
0Everything else30
1Up to 25% of the adult population and less than half are economically active and 15 years or older, with basic education and access to health services.14
2Among 26% to 50% of the adult population, less than 50% are economically active, more than 50% have basic education, and less than 50% have access to health services.0
3Among 26% to 50% of the adult population, over 50% are economically active, more than 50% have basic education, and less than 50% have access to health services.0
4Among 50% of the adult population, less than 50% are economically active, less than 50% have completed basic studies, and 50% to 75% have access to health services.26
5Among 50% of the adult population, less than 50% are economically active, more than 50% have basic education, and over 50% have access to health services.0
6Among 50% of the adult population, over 50% are economically active, more than 50% have basic education, and over 50% have access to health services.0
7Among 50% of the adult population, less than 50% are economically active, 50% to 75% have basic education, and 50% to 75% have access to health services.0
8More than 50% of the adult population, from 50% to 75%, are economically active, 50% to 75% have basic education, and 50% to 75% have access to health services.0
9More than 50% of the adult population, from 50% to 75%, are economically active, 50% to 75% have basic studies, and over 76% have access to health services.0
10More than 50% of the adult population, from 50% to 75%, are economically active, more than 76% have completed basic studies, and 76% have access to health services.0
11More than 50% of the adult population, over 76%, are economically active, more than 76% have basic education, and over 76% have access to health services.0
12Among 50% of the adult population, less than 50% are economically active, less than 50% have basic education, and over 76% have access to health services.10
14Among 50% adult population, less than 50% are economically active, less than 50% have basic education, and less than 50% have access to health services.20
Table 3. Summary of determining the definitive blocks of the conglomerates.
KeyDescriptionBlocks%
0Everything else30
1Up to 25% of the adult population and less than half are economically active, 15 years or older with basic education, and have access to health services.14
4Among over 50% of the adult population, less than 50% are economically active, less than 50% have completed basic studies, and 50% to 75% have access to health services.26
12Among over 50% adult population, less than 50% are economically active, less than 50% have basic education, and over 76% have access to health services.10
14Among over 50% of the adult population, less than 50% are economically active, less than 50% have basic education, and less than 50% have access to health services.20
Table 4. Total number of surveys and each study point.
PlaceBlocksPopulationSurveys
The traffic light of Ejido and Constituyentes9310,787121
The traffic light of Comercial Mexicana–Zapata11310.412116
The traffic light of KFC–IMSS Ruíz Cortínez1159030101
The traffic light of Anclas–Cuauhtémoc77374042
33.969380
Table 5. A conglomerate study of the total surveys by point.
PlaceBlocksPopulationSurveyskey 0key 1key 4key 12key 13
Traffic light Ejido and Constituyentes9310,7871213617311224
Traffic light Commercial Mexicana Zapata11310,4121163516301223
Traffic light KFC–IMSS Ruíz Cortínez11590301013014261020
Traffic light Anclas– Cuauhtémoc773740421361148
33,969380
Table 6. Result frequencies. From question 1 to 36.
Q01Q02Q03Q04Q05Q06Q07Q08Q09Q10Q11Q12Q13Q14Q15Q16Q17Q18
Half39.51.421.952.132.52231.472.151.21.861.932.611.811.891.751.641.81.13
Std Dev15.50.490.720.931.2315.60.690.750.410.360.660.650.410.320.440.480.40.34
Min1811111111111111111
Max842452171342233222222
Q19Q20Q21Q22Q23Q24Q25Q26Q27Q28Q29Q30Q31Q32Q33Q34Q35Q36
Half1.361.162.261.772.772.162.071.351.051.343.261.223.771.191.121.42.323.61
Std Dev0.560.380.830.572.031.020.630.480.210.491.930.423.410.390.331.111.791.24
Min111111111111111111
Max323374422262422255
Table 7. Demographic characteristics of the sample.
FrequencyPercentage
Gender
Female16142.1
Male22157.9
Level of education
Basic10728.0
Medium19150.0
Bachelor’s degree8221.5
Postgraduate20.5
Occupation
Study3910.2
Work alone14939.0
Employee17746.3
Professional102.6
Retired71.8
Income (in minimum wages)
up to 19424.6
Over 1 to 218548.4
Over 2 to 36617.3
Over 3 to 4328.4
More than 551.3
Age (range years)
18–20389.9
21–309524.9
31–409023.5
41–507419.4
51–604311.3
60–854211.0
Table 8. Perception of air quality.
FrequencyPercentage
Do you think the air you breathe has some degree of contamination?
Much26268.6
Little bit10427.2
Nothing164.2
Choose one of the possible contaminants.
Smoke9424.6
Dust9424.6
Gases emitted by cars / trucks19450.8
During what time of day does it feel like there is more air pollution?
Morning11530.1
Afternoon24062.8
Night277.1
What day of the week has the most polluted air?
Monday16944.2
Tuesday4511.8
Wednesday5213.6
Thursday195.0
Friday379.7
Saturday369.4
Sunday246.3
During what time of year do you believe there is more air pollution?
Spring11028.8
Summer16342.6
Autumn4812.6
Winter6116.0
Of the following, what is the most responsible for pollution?
Government4912.8
Society27471.7
Business4411.5
Climate change153.9

