Potentially Toxic Elements in Urban Soils of Havana, Cuba


1
Department of Soil Science and Agricultural Chemistry, University of Santiago de Compostela, 27002 Lugo, Spain
2
Instituto de Investigaciones Fundamentales en Agricultura Tropical “Alejandro de Humboldt” (INIFAT), Havana 17200, Cuba
3
Institute of Agricultural Biodiversity and Rural Development, University of Santiago de Compostela, 27002 Lugo, Spain
*
Author to whom correspondence should be addressed.
†
Deceased.
Environments 2020, 7(6), 43; https://0-doi-org.brum.beds.ac.uk/10.3390/environments7060043
Submission received: 13 May 2020
/
Revised: 1 June 2020
/
Accepted: 5 June 2020
/
Published: 9 June 2020
(This article belongs to the Special Issue Soil Contamination by Heavy Metals and Metalloids)
Abstract
:Urban soils are characterised by a strong anthropogenic influence. Potentially toxic elements were studied in various horizons of 35 urban soils in Havana, Cuba, classified as Urbic or Garbic Technosols. Pseudo-total, available, and acid-oxalate extractable concentrations were determined. The pseudo-total concentrations were generally higher than the average values for the world’s soils but similar to those published for urban soils. In a few cases, very high values of copper or lead were found. Nickel and chromium concentrations exceeded the maximum allowable concentrations for agricultural soils in 22% and 12% of samples. Vanadium concentrations were always very high. There was minimum enrichment of most samples in Co, Mn, As, Cd, Cr, Cu, and Ni, but outliers reached moderate or significant enrichment. Enrichment was significant for V, while for Pb, Zn, and Hg the median values denoted moderate enrichment, but outliers reached significant enrichment in Zn and extremely high enrichment in Pb and Hg. The available elements amounted to between 0.07% of the pseudo-total vanadium and 30% lead and cadmium. The published toxicity limits for bioavailable Cd, Mn, Ni, and Pb were exceeded in 14%, 39%, 10%, and 56% of samples, respectively. The concentrations of pseudo-total total iron, cobalt, chromium, and nickel, and available cobalt, nickel and titanium were significantly lower in soils with gleyic properties (reducing conditions).
1. Introduction
Soils in urban environments are strongly influenced by man, whose activity is based in these environments. The anthropogenic influence alters the processes of soil formation, often changing the direction of soil evolution. The human perturbation may vary in intensity, giving rise to a wide range of urban soils from quasi-natural to strongly disturbed soils. Human influence can interfere more or less intensely with the natural processes of soil formation, can provide exogenous materials, including pollutants, and can eventually build new soils by providing organic or mineral materials from which new processes of soil formation will start. Urban soils usually show a high vertical and horizontal variability, often contain artefacts, and are classified in the WRB [1] as Technosols.
On the other hand, urban soils provide considerable ecosystem services, such as supporting plant growth, including urban agriculture; taking part in biogeochemical cycles; contributing to the hydrological cycle; storing carbon and regulating greenhouse gases; modulating urban climate and air quality; contributing to urban biodiversity; supporting human activities; and intercepting and immobilizing or decomposing contaminants [2,3]. Therefore, having healthy urban soils is of paramount importance to enhance the quality of the urban environment and foster urban sustainable development.
The presence of high levels of trace elements and heavy metals is a major threat to the quality of urban soils, being of special concern in those involved in urban agriculture. A number of published articles studied potentially toxic elements (PTEs) in urban and peri-urban soils around the world [4,5,6,7,8,9,10,11,12,13,14,15,16,17]. Virtually all of them reported concentrations of heavy metals in urban soils higher than in natural soils.
The Cuban urbanization process is one of the oldest in the Americas. The urban population (8,637,568 inhabitants) constitutes 77% of the total residents of Cuba in 2018. Of this urban people, 2,131,480 inhabitants reside in the province of Havana [18]. One hundred percent of the province of Havana is urbanized. Given the size of the urban population, urban agriculture, which emerged in Cuba in 1987 as a programme of the Cuban Government, contributes significantly to local food self-sufficiency and to the country’s food security [19]. Urban agriculture uses locally produced organic fertilizers with agro-ecological pest control and local seed production, avoiding the use of petrochemicals [19,20]. Along with urban agricultural soils, soils of parks and gardens, urban groves, and vacant areas constitute the urban soils of Havana.
This paper aims to study the concentrations and forms of PTEs in urban soils in the province of Havana, as a contribution to the knowledge of the quality of these soils, and to identify the possible origin of these elements. For such purposes, 35 urban soils were selected having a variety of uses (including urban agriculture) and intensity of human intervention.
2. Materials and Methods
2.1. Study Area
Havana is the province with the smallest area in Cuba, occupying 727.4 km2. It is situated on the northern coast, surrounding the Havana Bay, where the main port of the country is located. The province has a population of 2.13 million inhabitants and a population density of 3000 inhabitants/km2. One hundred percent of the province is urbanized. The climate is tropical with two distinct seasons: a wetter season (May–October) and a drier season (November–April). The monthly average temperature ranges between 22 and 27 °C, with an annual average of 25.7 °C. The annual average relative humidity is 80%, and the annual rainfall is 1240 mm. The geology of the area is mainly sedimentary limestone and ultramafic rocks, sometimes serpentinized.
Several industries are located in this province, which could well be a source of PTEs, including an oil refinery, metal processing industries, and power plants. The dense traffic of motor vehicles, some of them very old, could also contribute to the emissions.
The province consists of 15 districts, distributed in three areas: central, intermediate, and peripheral. Soils were selected for study in 6 of the 15 districts, 5 in the central area, the most densely populated, and 1 (Playa) in the intermediate area. The latter district has experienced a rapid socio-economic and touristic development in recent decades.
2.2. Soils
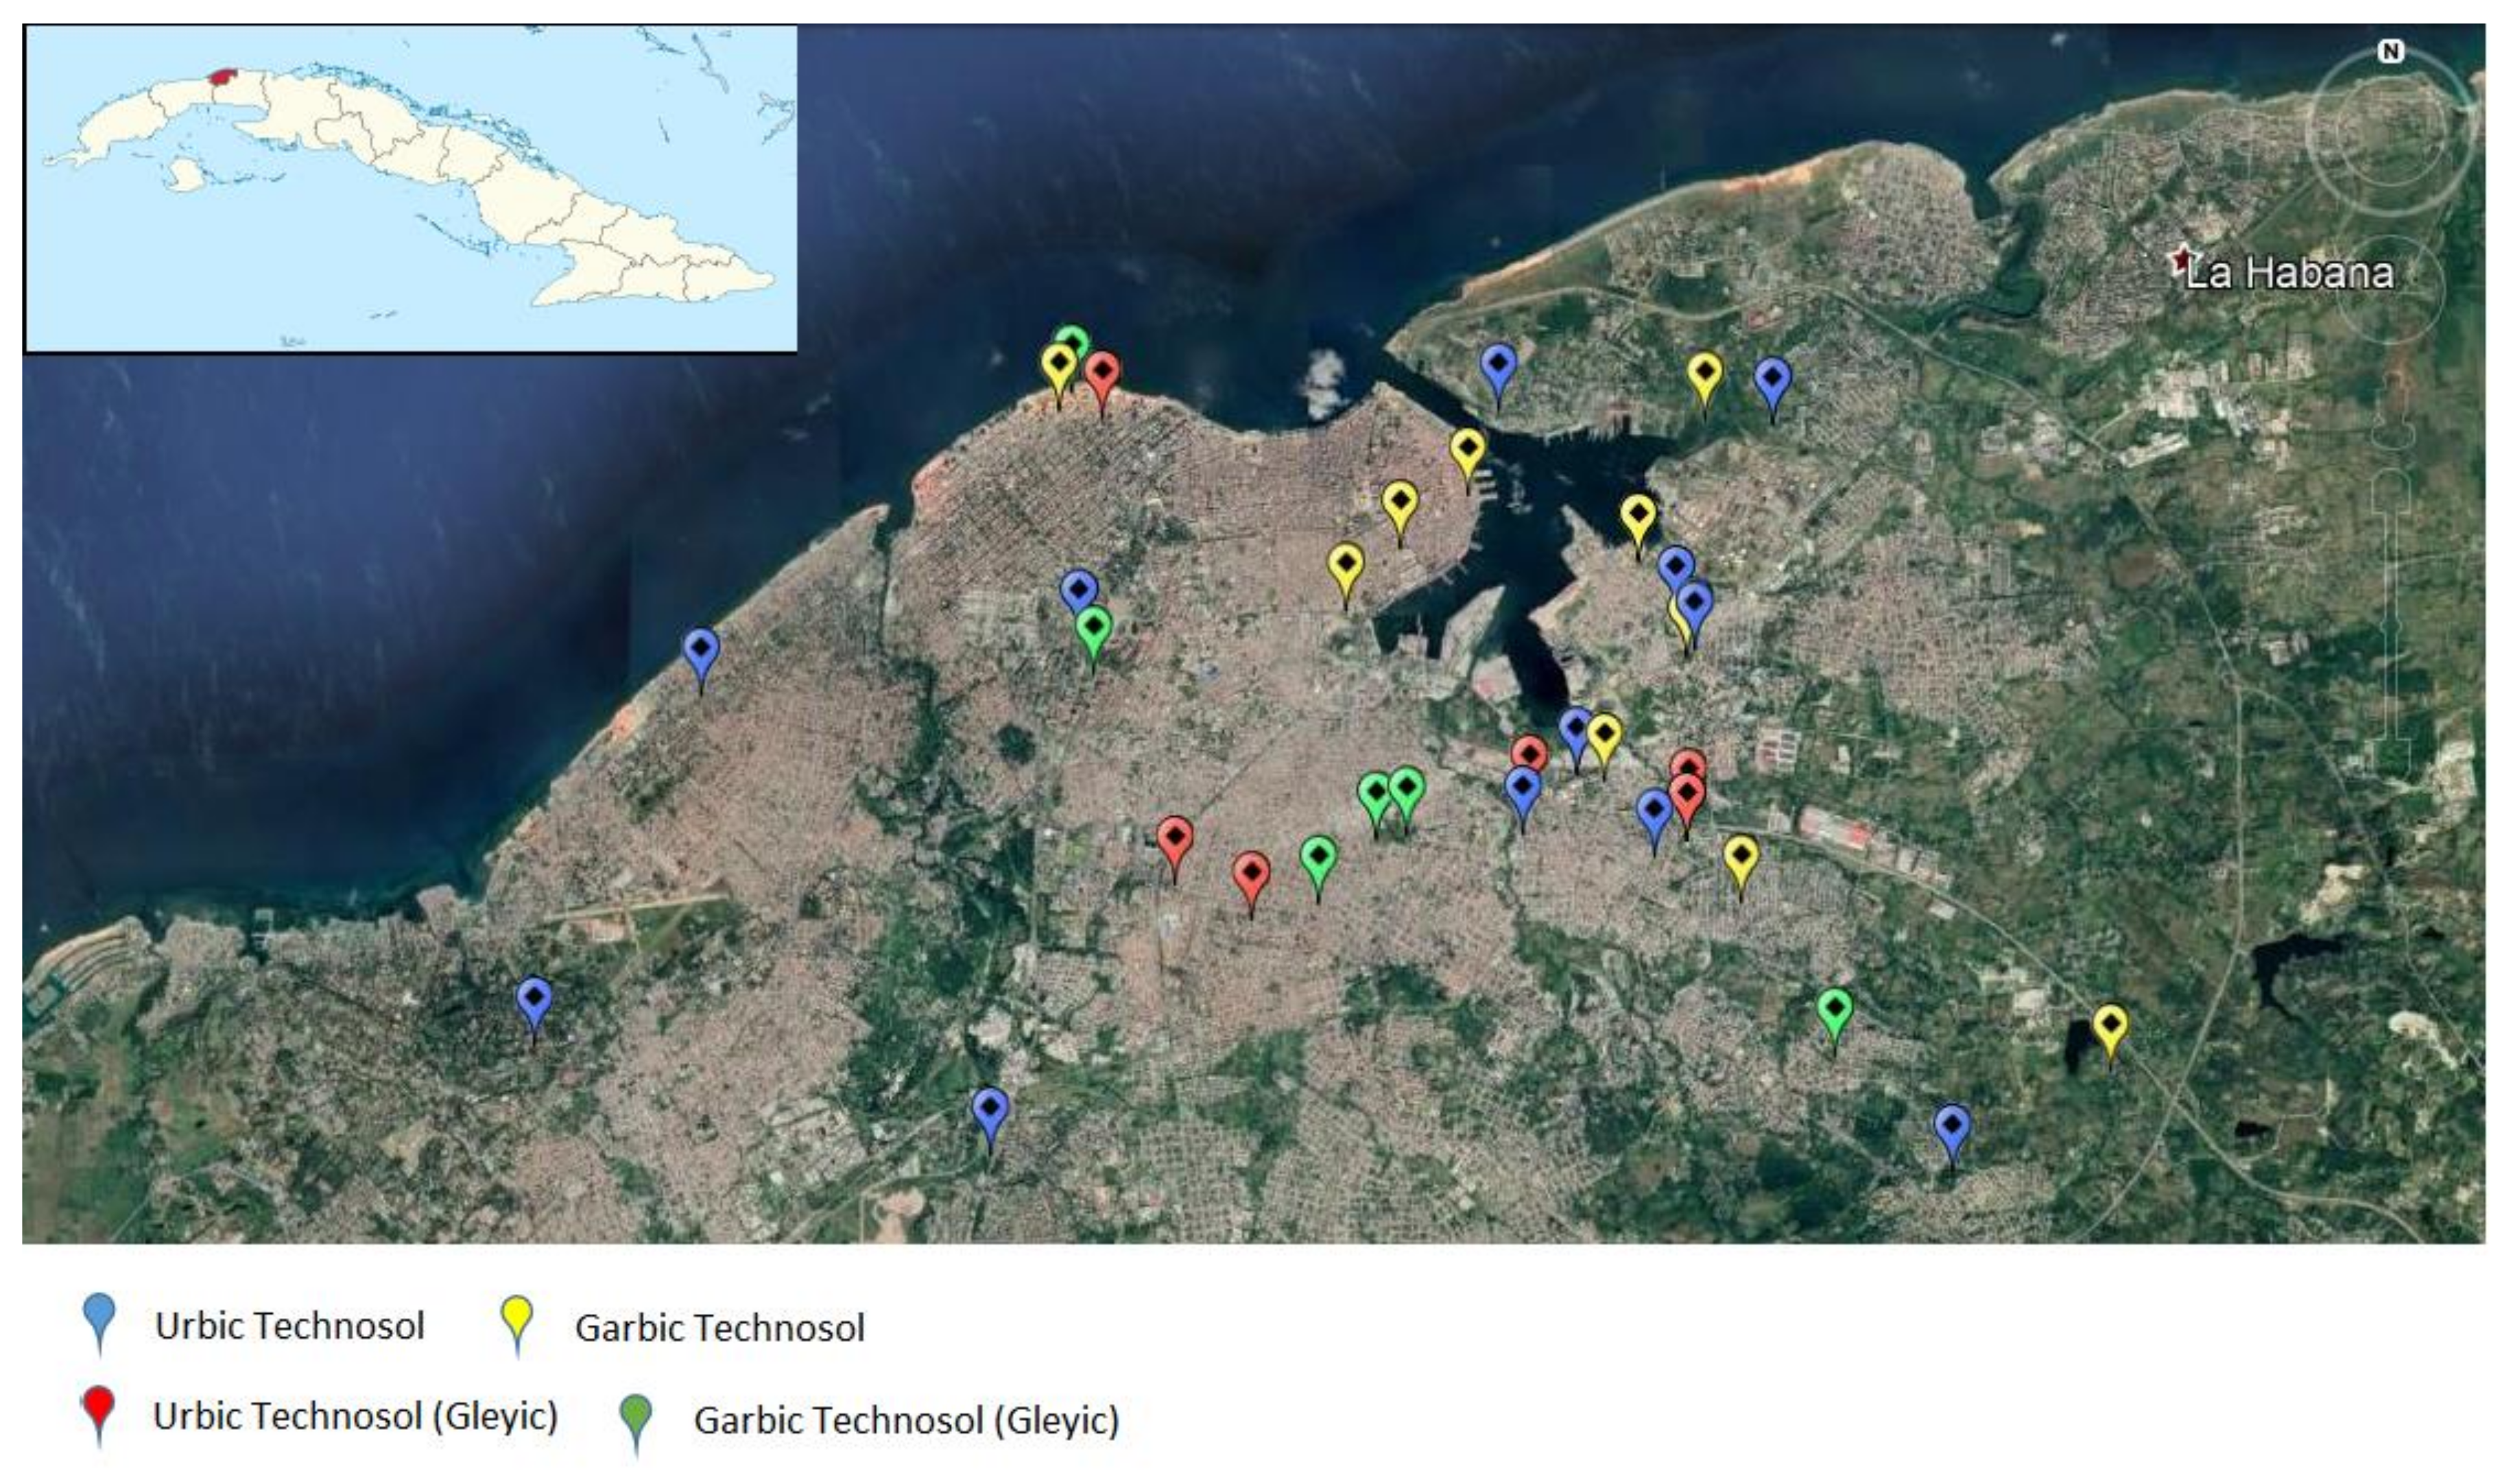
Thirty-five representative soils (Figure 1) were sampled in 6 of the 15 districts of the province of Havana, Cuba (Regla, San Miguel del Padrón, Plaza de la Revolución, 10 de Octubre, Playa, and Habana Vieja). The 35 soils have different uses: urban agriculture, parks and gardens, wooded areas, and vacant areas. The presence of PTEs in agricultural soils is of concern because of the risk of metal exportation to the food chain. In the case of parks and gardens, the main concern is related to the presence of children playing in these areas [15].
The agricultural soils were often built from soil materials transported from other locations. Some of them have a surface layer made of compost from various organic wastes. The urban agriculture system developed in these soils is known as organoponics [21,22]. Others only had manure and vermicompost applied.
The studied soils are moderately alkaline (pH = 8.27 ± 0.20) and usually rich in calcium carbonate (CaCO3) in the surface horizon. The most frequent textures were clay, loam, or clay loam. According to the World Reference Base for Soil Resources [1], the selected soils were classified as Urbic or Garbic Technosols. Often the water table was near the soil surface, so that the soils had hydromorphic features. Twelve of the 35 soils studied showed gleyic properties. Gleyic properties mean current or past soil saturation with groundwater for a period that allows reducing conditions to occur [1].
Several horizons were morphologically differentiated and sampled for each soil. Soil samples were air-dried and sieved (<2 mm) before analysis.
2.3. Analysis of PTEs
Thirteen heavy metals and trace elements were determined: arsenic (As), cadmium (Cd), cobalt (Co), chromium (Cr), copper (Cu), iron (Fe), manganese (Mn), nickel (Ni), lead (Pb), titanium (Ti), vanadium (V), zinc (Zn), and mercury (Hg). Pseudo-total and available elements were determined for each soil horizon (91 samples). PTEs associated with noncrystalline Al and Fe were determined only in surface horizons.
The determination of pseudo-total PTEs was performed by microwave-assisted digestion, with concentrated HNO3 and HCl (HCl:HNO3 ratio 1:3), according to the EPA 3051A method [23]. The metals were determined in the digestate by ICP-MS. The limits of detection, calculated as 3 times the standard deviation of blank values, in mg kg−1, were: As, 0.09; Cd, 0.006; Co, 0.03; Cr, 4.6; Cu, 1.1; Fe, 8.3; Mn, 1.0; Ni, 0.32; Pb, 1.0; Ti, 2.0; V, 2.8; Zn, 6.1; and Hg, 0.01.
Available PTEs were extracted by Mehlich 3 reagent [24] and determined by ICP-MS.
PTEs associated with noncrystalline Al and Fe were extracted by ammonium oxalate/oxalic acid at pH 3 [25] and determined by ICP-MS.
2.4. Pollution Assessment
Two indices were used to assess pollution in the studied soils [13]. The enrichment factor (EF) compares the concentration of an element in the studied soil with the background concentration, both concentrations standardized against a reference element (Al, Fe, or Ti). We chose Fe as the reference element, so that EF was calculated as:
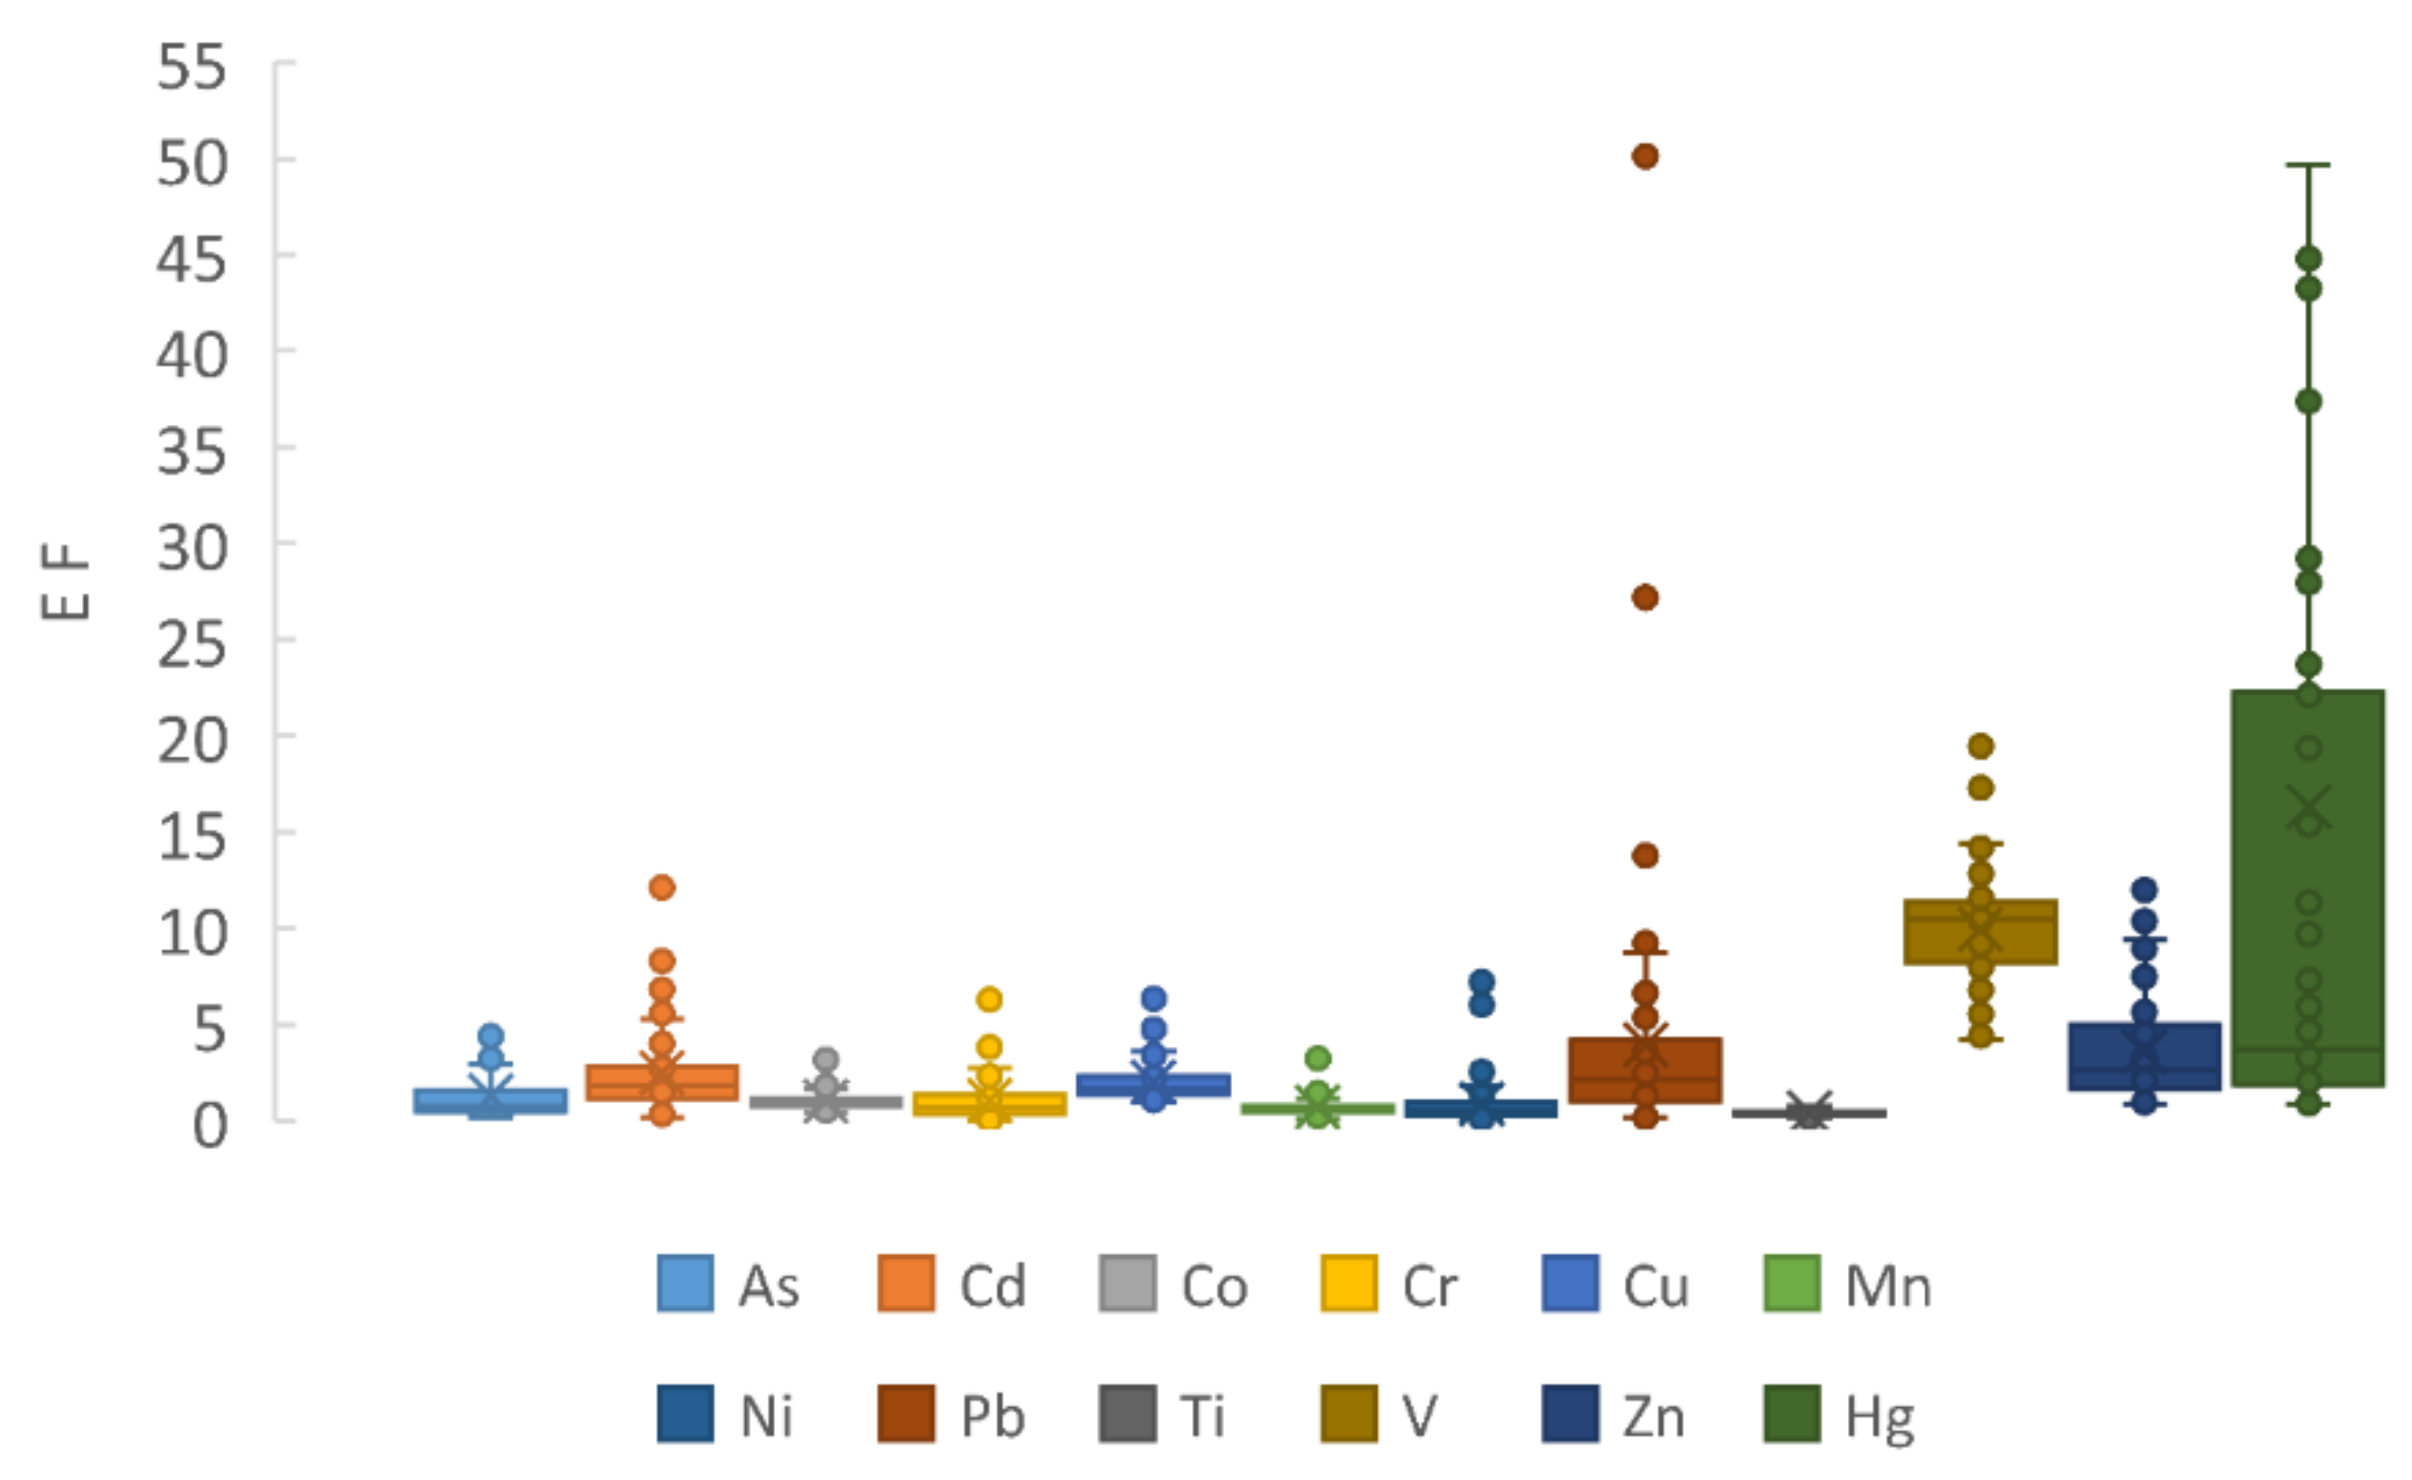
where X represents the element of interest; EFX, the EF of element X; CX, the total concentration of element X; CFe, the total concentration of iron (a lithogenic reference element); “soil” refers to the assessed soil, and “background” to the situation of natural unpolluted soils in the study area, taken as a reference. EF values below 2 indicate minimum enrichment; values between 2 and 5 denote moderate enrichment; significant enrichment is attributed to values between 5 and 20; values above 20 show very high enrichment; while values above 40 reveal extremely high enrichment [13].
EFX = (CX/CFe)soil/(CX/CFe)background
The geoaccumulation index (Igeo) for a given element is calculated as:
where CX is the total concentration of element X; BX is the background value for element X; and the factor 1.5 is used to minimize the effect of possible variations in the background due to lithological variations. According to Igeo values, the soils are classified into seven categories: <0 = practically unpolluted, 0–1 = unpolluted to moderately polluted, 1–2 = moderately polluted, 2–3 = moderately to strongly polluted, 3–4 = strongly polluted, 4–5 = strongly to extremely polluted, and >5 = extremely polluted [13].
Igeo = log2 (CX/1.5 Bx)
As background concentrations to calculate EF and Igeo, we used the quality reference values (QRVs) established by Rodríguez Alfaro et al. [26] for Cuban soils:
EFX = (CX/CFe)/(QRVX/QRVFe)
Igeo = log2 (CX/1.5 QRVx)
QRVFe equals 54,055 mg kg−1 [26].
The EF and Igeo for Ti were calculated using the average concentrations of Ti (4.4 g kg−1) and Fe (50 g kg−1) in the earth’s crust, instead of the QRVs for Cuban soils, because there is no reference value for Ti in Cuban soils:
where CTi represents the Ti concentration and CFe represents the Fe concentration.
EFTi = (CTi/CFe)soil/(CTi/CFe)earth crust
2.5. Statistical Analysis
Statistical analysis was performed by using the statistical software SPSS® 20.0 (New York, NY, USA). Analysis of variance (ANOVA) was used to assess the influence of district and soil use on the PTE concentrations. The Student’s t-test was performed to compare pseudo-total and Mehlich-3 extractable metals in soils with and without gleyic properties and in surface and subsurface horizons. Principal component analysis (PCA) was applied to the pseudo-total data set for identifying associations among metals. Varimax was used as the rotation method in the PCA. The Kolmogorov–Smirnov (K–S) test was applied to check the normal distribution of data. Correlation coefficients were determined to complete and support the results obtained by factorial analysis.
3. Results
3.1. PTE Concentrations
The concentrations of pseudo-total and Mehlich-3 extractable and acid-oxalate extractable PTEs are presented in Table 1.
The Kolmogorov–Smirnov (K–S) test showed normal distributions for pseudo-total As, Mn, Ti, and V, Mehlich-3 Fe and Mn, and acid-oxalate Cu and Hg. The distribution was not normal for the remaining concentrations. Consequently, the Spearman’s correlations were determined.
Pseudo-total and Mehlich-3 extractable metal concentrations were significantly correlated (p < 0.01) for all elements except Fe, As, and Hg. However, the proportions extracted by Mehlich-3 reagent varied widely among elements. The metal extracted by the Mehlich-3 reagent was a negligible fraction of the pseudo-total metal in the cases of Ti (0.11%) and V (0.07%). This fraction was also very low for Fe (0.66%), As (1.02%), Hg (1.29%), and Cr (1.33%). On the contrary, high fractions of Cd and Pb (30%), Mn (22%), Zn and Cu (18%) were extracted by Mehlich-3 reagent. Intermediate values were found for Co (13%) and Ni (6%).
Acid-oxalate concentrations correlated to pseudo-total concentrations (p < 0.01) for Co, Cr, Fe, Mn, and Pb, and to Mehlich-3 concentrations (p < 0.05) for Co, Cr, Cu, Mn, Ni, and Pb.
The percentage of metal extracted by acid oxalate, referred to the pseudo-total metal, was very high in the case of Hg, with an average value of 32% and a maximum value of 96%. The extractions were high for Co, Mn, and Zn (with average values of 10, 11, and 12%, respectively, referring to the pseudo-total concentration). For the other metals, the extraction percentages were low, with average values of less than 3%.
3.2. Analysis of Variance
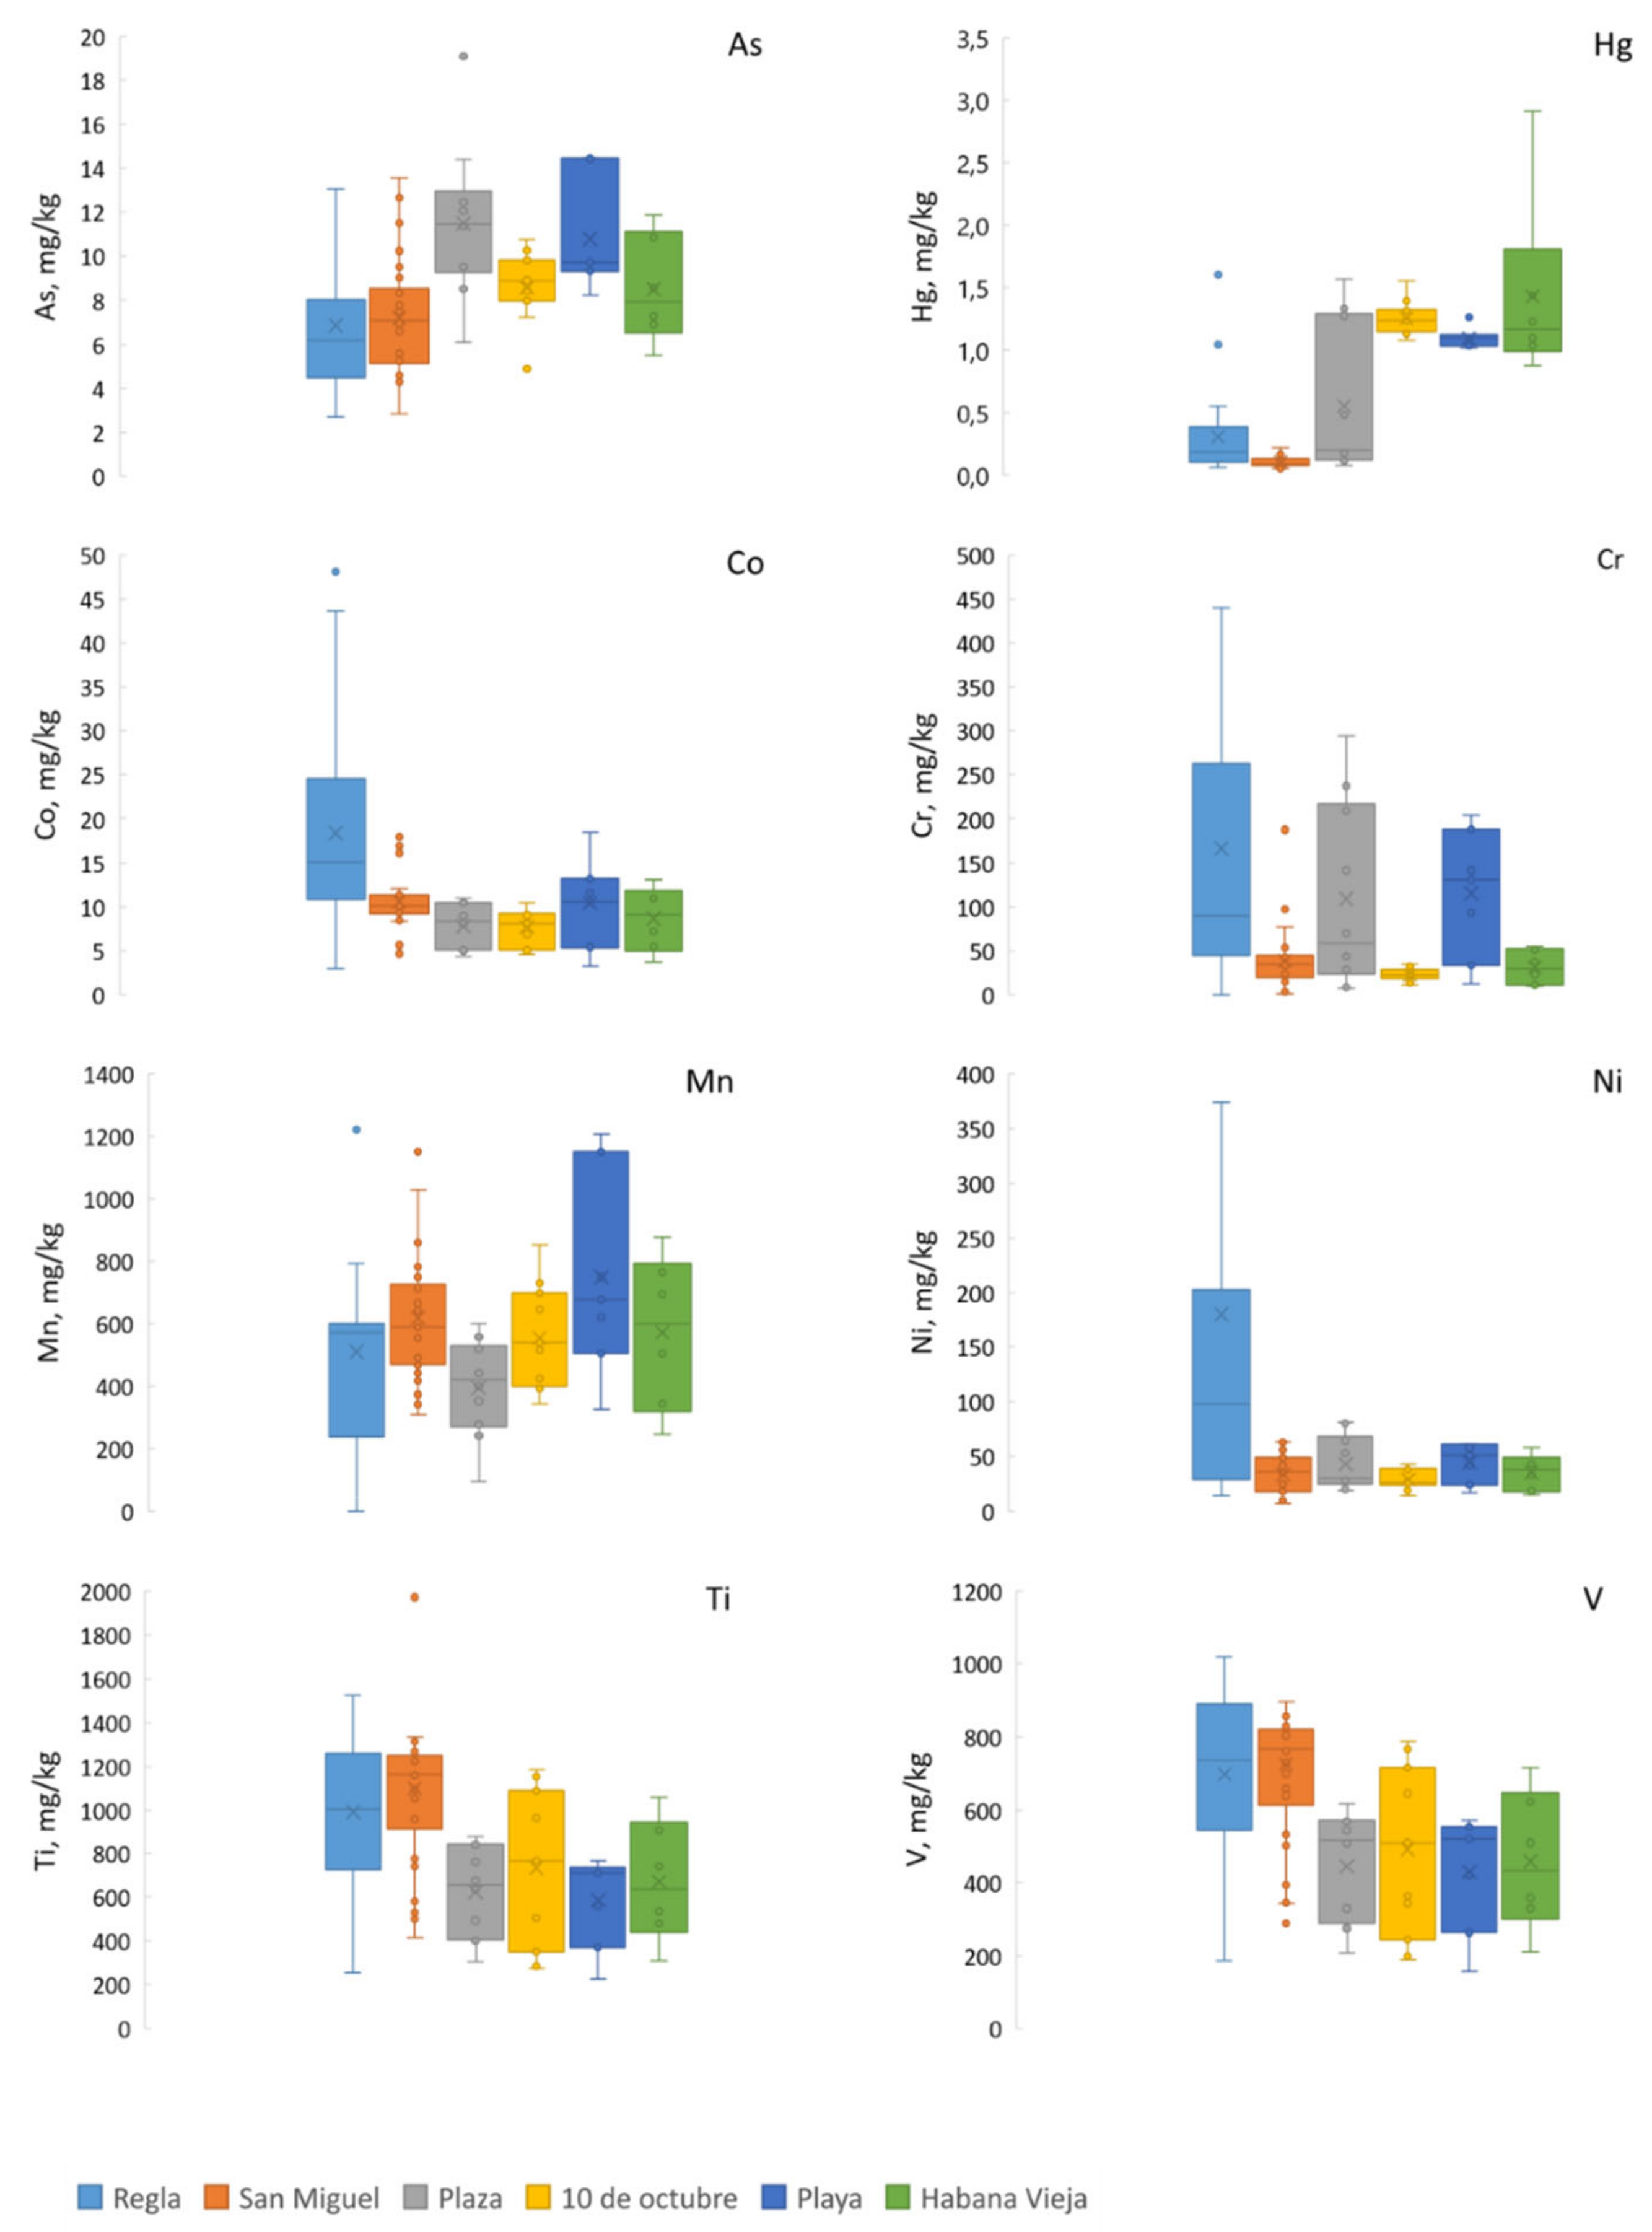
The analysis of variance showed that the district significantly affected the pseudo-total concentrations of As, Co, Cr, Ni, Ti, V, Hg (p < 0.001), and Mn (p < 0.05) (Table 2). On the contrary, the pseudo-total concentrations of Cd, Cu, Fe, Pb, and Zn were not significantly different among districts.
The land use did not affect significantly the pseudo-total concentrations of the elements studied.
The district of Regla had the highest concentrations of pseudo-total Co, Cr, and Ni (Figure 2). The highest concentrations of As were found in Playa and Plaza de la Revolución, while the highest concentrations of Hg were found in Playa, 10 de Octubre, and Habana Vieja. Playa had the highest concentrations of Mn, and the highest concentrations of Ti and V were found in San Miguel del Padrón and Regla.
3.3. Principal Component Analysis
The results of PCA for pseudo-total metal concentrations in soils are shown in Table 3 and Table 4. Four principal components (PC) with eigenvalues higher than 1 (before and after rotation) were extracted. The total variance explained by these four components is nearly 78%. In the rotated matrix, Ti, V, Fe (with positive loadings) and As and Hg (with negative loadings) are associated in a first component (PC1), which explains 24.8% of the variance. A second component (PC2), which combines Ni, Cr, and Co (all with positive loadings), and explaining 22.0% of variance, was identified. The third component (PC3) combines Pb, Zn, Cd, and Cu, accounting for 19.0% of variance. The fourth component (PC4) includes only Mn and accounts for 11.8% of variance.
3.4. Correlation Matrix
Table 5 presents the correlation matrix among pseudo-total metals. In general, the correlations were in accordance with the results obtained by PCA.
Interestingly, all elements except Cd, Pb, Zn, and Hg were significantly (p < 0.01) correlated with Fe, a mostly lithogenic element. The correlation was negative for As and positive for the other elements.
Al metals associated in PC1 with positive loadings (Ti, V, and Fe) correlated positively with each other (p < 0.01). As and Hg correlated positively with each other (p < 0.05) and negatively with Fe, Ti, and V (p < 0.01), except Hg with Fe. Remarkably, the correlation between Ti and V was extremely high (r = 0.980, p = 0.0000).
The three elements combined in PC2 (Ni, Cr, and Co) correlated positively to each other (p < 0.01). Furthermore, the four elements combined in PC3 (Pb, Zn, Cd, and Cu) correlated positively to each other (p < 0.01).
3.5. Influence of Soil Depth and Gleyic Properties
The concentrations of pseudo-total and bioavailable Cd and Zn, pseudo-total Cr and Ni, and bioavailable Cu were higher in surface horizons (Table 6).
The concentrations of pseudo-total Co, Cr, Fe, and Ni were higher in soils with gleyic properties than in soils without gleyic properties (Table 7). Furthermore, the concentrations of bioavailable Co, Ni, and Ti were higher in soils with gleyic properties than in soils without gleyic properties.
4. Discussion
The pseudo-total PTE concentrations (Table 1) were generally higher than the average values for the world’s soils: 58% of the samples presented pseudo-total As concentrations higher than the average concentrations for world’s soils reported by Kabata-Pendias [27]; this percentage was also 58% for Cd, 33% for Co, 31% for Cr, 87% for Cu, 65% for Mn, 58% for Ni, 70% for Pb, 71% for Zn, and 84% for Hg. Furthermore, the average V concentration for world’s soils was exceeded by all samples, while the average Ti concentration for world’s soils was never exceeded. However, Ti and V pseudo-total concentrations were highly correlated.
Conversely, the measured pseudo-total metal concentrations were similar to those published by other authors for urban soils [6,11,12,13,14,15,28,29,30], except for vanadium, which presented very high concentrations in the soils studied.
The pseudo-total concentrations for most PTEs did not exceed the maximum concentrations allowed in agricultural soils. The maximum allowable concentrations (MAC) in agricultural soils reported by Kabata-Pendias [27] for Cr and Ni were exceeded by 12% and 22% of samples, respectively. As discussed below, these elements have a mainly lithogenic character, associated with ultramafic rocks. The MAC in agricultural soils for Cu, Pb, and Zn were exceeded by 4% (4 samples), 1% (one sample), and 3% (3 samples) of samples, respectively. The V concentrations were very high, always exceeding the MAC for agricultural soils. This element, as discussed below, can have a lithogenic character, although anthropogenic sources might contribute to increase its concentrations.
The measured pseudo-total Co, Cu, Ni, and Pb are in accordance with those reported by Diaz-Rizo et al. [31] for surface soils (0–10 cm) of Havana, measured by X-ray fluorescence. The Zn concentrations were mostly lower in the present study, rather closer to the values for nonurbanized areas in [31].
Cuban soils have naturally high concentrations of some heavy metals, exceeding usual quality standards [26]. This is true especially for Ni, Cr, Cu, and Co, abundant in ultramafic rocks, which are common in the island. Consequently, Rodriguez Alfaro et al. [26] established quality reference values (QRVs) for PTEs in Cuban soils, based in the analysis of representative natural soils (Table 8).
The pseudo-total concentrations of all the elements determined by Rodriguez Alfaro et al. [26] in Cuban natural soils correlated significantly with the concentration of the lithogenic element Fe. Similarly, in the present study this happens to be true for all the elements studied except Cd, Pb, Zn, and Hg, which is a clear indication of the human origin of these elements.
These QRVs for Cuban soils were used as background concentrations to calculate the EF and Igeo for PTEs in urban soils.
The EFs for Ti were always lower than 1, indicating no enrichment, while the calculated Igeo were always negative, indicating the absence of pollution. Titanium is a lithogenic element, and a common constituent of several rocks [27].
Except for Ti, the lowest enrichment factors (Table 8) were calculated for As, Co, Cr, Mn, and Ni. These EFs were lower than 2 (minimum enrichment) for most samples, although there are a few samples with values between 2 and 5 (moderate enrichment) for Co, Cr, Mn, and Ni and 19% of samples (in all districts) with EFs between 2 and 5 for As. Co, Cr, Mn, and Ni are lithogenic elements, Co, Cr, and Ni being associated with ultramafic rocks and Mn with both acid and basic rocks [27]. However, soil enrichment can occur through anthropogenic emissions. The application to soils of composts and organic amendments can contribute with several PTEs, such as As, Co, Cr, Cu, Mn, Ni, Pb, and Zn [32].
According to the EF values, there was no or minimum enrichment in Co and Mn for most samples, with a few outliers showing moderate enrichment (Figure 3). There was minimum enrichment in As, Cd, Cr, Cu, and Ni for most samples, but outliers showed moderate (EF between 2 and 5) to significant (EF between 5 and 20) enrichment. These elements can be of lithological origin, but the presence of outliers suggest the contribution of anthropogenic sources in some samples. These possible anthropogenic sources include the traffic of vehicles [13], metal smelting, waste disposal and incineration, burning of fossil fuels [33,34], and the application of organic amendments to soils [35].
The enrichment factors were high or very high for Pb, V, Zn, and Hg (Table 8, Figure 3), which points to a human origin of these elements. This origin is unquestionable for Pb and Hg. The past use of leaded gasoline, Pb-containing paints, metal smelting, and fuel combustion, among other anthropogenic activities, can be sources of lead [27,36]. Mercury can originate from combustion of coal and oil, smelting industry, or waste incineration [27,36]. Zn can be lithogenic, but it can also be brought to the soil with organic amendments [32,35] or as a result of various human activities, such as metal smelting or traffic of vehicles. V can have a lithogenic character, mainly associated to ultramafic rocks, but its enrichment may be linked to anthropogenic activities, such as combustion of fuel oil, metal smelting, or oil refining [27,36]. There was significant enrichment in V, while for Pb, Zn, and Hg the median values denote moderate enrichment, but outliers reached significant enrichment in Zn and extremely high enrichment in Pb and Hg.
The values of the geoaccumulation index (Igeo) were always negative, indicating the absence of pollution, for As, Mn, and Ti, even in cases of moderate enrichment in As and Mn. For Co and Cu, the Igeo were negative for all but one (Co) or six (Cu) samples, which had Igeo values between 0 and 1 (unpolluted to moderately polluted). In the cases of Cd, Cr, and Ni, the Igeo values ranged from negative to 2.00, 1.84, and 1.87, respectively, indicating situations between practically unpolluted and moderately polluted. The Igeo values reached 2.49, 2.82, and 2.37 for Pb, V, and Zn, respectively, indicating some situations of moderate to strong pollution (2 < Igeo < 3). The worse situation is that of Hg, with 13 samples (14%) with Igeo values between 3 and 4 (strongly polluted) and 1 sample with Igeo = 4.28 (strongly to extremely polluted). In general, the interpretation of Igeo values is in accordance with that of EF values.
The first principal component in the PCA, accounting for 25% of the variance in the rotated matrix (Table 3 and Table 4), groups the elements Ti, V, Fe, As, and Hg. Ti, V, and Fe, correlating positively to each other (Table 5), must be mostly lithogenic. Conversely, As and Hg, correlating negatively with Ti, V, and Fe, seem to be associated with soil organic fraction and have an anthropogenic origin. Both elements can originate from metal processing industry, combustion of fuel, waste incineration, and application of organic amendments to soil [27,36].
The vanadium enrichment could be attributed to smelting industries and to generators located in all the Havana districts, since V can be present as an impurity in fuels. The combustion of oil and its derivatives is considered the main source of vanadium contamination. V concentrations in crudes from Venezuela are particularly high, ranging from 282 to 1180 mg kg−1 [37].
As referred to before, the titanium and vanadium concentrations showed a very high correlation (Table 5), which points to a common origin. Vanadium appears as an impurity in titanium minerals, such as ilmenite and rutile. Both elements are present in pyroxenes and amphiboles, being, therefore, relatively more abundant in basic and ultrabasic rocks [27]. Furthermore, both elements are used in the steel industry. Therefore, its origin seems to be mainly lithological, although there seems to be an anthropogenic enrichment of vanadium.
The second principal component includes the elements Ni, Cr, and Co and accounts for 22% of the variance in the rotated matrix (Table 3 and Table 4). These elements, highly correlated to each other (Table 5), are abundant in ultramafic rocks. They are therefore considered as lithogenic. Anthropogenic activities (fuel combustion, smelting industry, and soil organic amendments) may contribute to increasing the concentrations of these elements in some samples. Accordingly, Díaz-Rizo et al. [38] report high bivariate correlations among Co, Cr, and Ni in soils of Las Tunas City (NE Cuba), which they interpret as a result of a common natural (nonanthropogenic) origin.
The third principal component, which explains 19% of the variance, includes Pb, Zn, Cd, and Cu (Table 3 and Table 4). Cd, Pb, and Zn did not significantly correlate with Fe, which indicates a nonlithogenic origin. The association in the same PC points to an anthropogenic origin of the four elements. The higher concentrations of Zn and Cd (both pseudo-total and bioavailable) and bioavailable Cu in surface horizons (Table 6) are in accordance with this anthropogenic origin. The surface soil is usually more likely affected by anthropogenic sources than the subsurface horizons, closer to the parent material. However, urban soils in general, and the soils studied here in particular, are often allochthonous and, therefore, the enrichment of the surface soil in a certain element does not necessarily indicate a nonlithogenic character, since different horizons may have different origins. Our results are in accordance with those reported by Díaz-Rizo et al. [31], which, based on the bivariate correlations among Cu, Zn, and Pb, suggest a common origin for these three elements in Havana urban soils. However, by comparing soils from urban and nonurbanized areas, these authors conclude that Pb and Zn have a human origin, while Cu, the same as Co and Ni, may have a lithogenic character. Furthermore, for Las Tunas soils, Díaz-Rizo et al. [38] report a high correlation between Pb and Zn, which are considered anthropogenic elements. Because Cu is an abundant element in ultramafic rocks, its presence in Havana soils may have in part a geological origin, but the PCA points to an important anthropogenic contribution. The absence of significant correlations between Cu and any of Co, Cr, Ni, Pb, and Zn and their different spatial distribution in the aforementioned study from Las Tunas [38] would be in accordance with the double lithogenic and anthropogenic character of Cu.
Similarly to our results, in a study of urban soils of Hong Kong [16], Cd, Cu, Ni, Pb, and Zn were associated in the same principal component and considered anthropogenic. Massas et al. [11] and Gasparatos et al. [12] inferred from their data for urban soils of Greece a common anthropogenic origin for Zn, Cu and Pb. Also in Vigo (Spain), Pb, Cu and Zn were identified as anthropogenic [13]. Sun et al. [6] reported an association among the anthropogenic Cd, Cu, Pb and Zn in urban soils of Shenyang, China. In topsoils of urban parks in Beijing, China [33], Pb, Zn, and Cu were strongly correlated and were considered of anthropogenic origin, mainly related to vehicular traffic. In summary, profuse research shows that Cd, Cu, Pb, and Zn are ubiquitous in urban soils and arise from human activity.
The last component (PC4) explains 11% of the variance and includes only Mn (Table 3 and Table 4). This is usually a lithogenic element. However, its isolation in a unique component and its high concentration in some samples (up to 1230 mg kg−1) could indicate a partially human origin. The major anthropogenic sources of Mn are municipal wastewaters, sewage sludge, coal combustion, and metal smelting processes [27,36].
Our results are broadly consistent with those of Manta et al. [14], which for urban soils of Palermo (Italy) conclude that Pb, Zn, Cu, Sb, and Hg can be considered tracers of anthropogenic pollution, whereas Mn, Ni, Co, Cr, V, and Cd were interpreted to be mainly inherited from parent materials.
Ti and V, having a common origin, showed the same spatial distribution (Figure 2). Similarly, Ni, Cr, and Co presented an analogous spatial distribution. On the contrary, the anthropogenic As and Hg showed different spatial distribution patterns. The spatial distribution of Mn was different from any other element. Cd, Cu, Fe, Pb, and Zn were not affected by the district; this is interpreted as a result of lithological origin for Fe and ubiquitous contamination with Cd, Cu, Pb, and Zn.
The high levels of Ti and V can be linked to the oil refinery Ñico López and the electric power plant Antonio Maceo in Regla and to the smelting industry FUNALCO in San Miguel del Padrón, as well as to various small sources like electricity generating facilities. The highest Hg concentrations in Habana Vieja, the historical centre of the city, are in accordance with reports of a relationship between the accumulation of Hg and the duration of urbanization [33]. High concentrations of Co, Cr, and Ni (Figure 2) can be related to lithological factors (ultramafic rocks). They could also be associated with the oil refinery Ñico López, in Regla, with the traffic of vehicles and with the application of organic amendments to soils. All the enriched elements can originate from local application of different organic amendments.
The high concentrations of PTEs, mainly Cr, Ni, and V, in some soils pose an environmental risk, particularly in soils for agricultural use. However, it should be noted that these elements are expected to be scarcely soluble in moderately alkaline soils, such as those in this study. Moreover, to the extent that they are lithogenic elements, they must be part of primary minerals and be released only upon weathering of these minerals. Chromium is solubilized above pH 8 as CrO42− [27]. Therefore, an increase of soil pH would be risky, taking into account that Cr (VI) is carcinogenic to humans. The high content of organic matter in soil favors the reduction of Cr (VI) to Cr (III), less mobile and less toxic to human. Vanadium is found in neutral and alkaline soils in anionic forms, which are adsorbed by iron oxides or clay minerals through Fe cation bridges [27]. Nickel is rather mobile in horizons rich in organic matter, where it is solubilized in the form of chelates, although the complexation by organic ligands reduces the toxicity of Ni for soil organisms.
Pb, Zn, and Hg, having high enrichment factors and geoaccumulation indices, do not exceed the upper limits of the maximum allowable concentrations for agricultural soils (Table 1).
To evaluate the risk associated to the presence of PTEs in soils, it is necessary not only to know the total metal concentrations, but also the concentrations of mobile or bioavailable forms. The soil pH, the presence of carbonates, the organic matter content, the redox potential, and the presence of potential adsorbents, such as iron, aluminum, and manganese oxyhydroxides, are, among others, factors that influence the retention/mobility of PTEs.
The Mehlich 3 reagent extracts bioavailable PTEs [24,39,40]. The low proportions of Mehlich-3 extractable Ti (0.10%), V (0.07%), Fe (0.66%), As (1.02%), Hg (1.44%), and Cr (1.60%) indicate a low mobility and a low risk of exportation of these elements to food chain or water bodies. This is particularly relevant for vanadium and mercury: even though the pseudo-total V concentrations were very high, the bioavailable V concentrations (Table 1) were very low; even though the EFs of Hg were very high, the bioavailable Hg concentrations were also very low, suggesting that there is no risk of V or Hg being exported to vegetation or water bodies. This risk is also very low for Cr, whose pseudo-total concentrations were high in certain samples. According to Baken et al. [41], vanadium is strongly adsorbed onto poorly crystalline oxyhydroxides. This is in accordance with the fact that V extracted by acid oxalate (associated with poorly crystalline oxyhydroxides) is considerably higher than V extracted by Mehlich-3 reagent (bioavailable, Table 1). For soils derived from fluvioglacial sands in Poland, Jeske and Gworek [42] reported low mobilities of Cr, Ni, and V, the latter being the least mobile among them. According to Larsson et al. [43], V toxicity to plants and soil microorganisms is controlled by the vanadium sorption capacity of soils and, therefore, V concentration in the soil solution is a better predictor of V toxicity than total V in soil.
On the contrary, high proportions of metals in available form (observed for Mn, Cd, Pb, Zn, and Cu) indicate a recent enrichment, so that there has been no time for these metals to be immobilized in organic or inorganic forms [11,15]. In accordance with our results, Massas et al. [11] reported very low availability ratios (available metal/pseudo-total metal) for Cr and high availability ratios for Pb, Cu, and Zn in urban soils in Greece. Similarly, Pb was the most mobile and Cr the least mobile metal, among Pb, Zn, Cu, Ni, and Cr, in urban soils of the same area [12].
For Ni, whose pseudo-total concentrations exceeded the MAC for agricultural soils in 22% of samples, some values of the concentrations in bioavailable form are still high. The critical toxicity limit according to Monterroso et al. [39] (7 mg kg−1 at pH 8) was exceeded by three soils of the district Regla, one of them being an agricultural soil. However, the determined Mehlich-3 extractable concentrations were all within the range reported by Caridad-Cancela et al. [44] for natural soils of Galicia, NW Spain (0.22–42.65 mg kg−1).
The toxicity limit for bioavailable Cd (0.25 mg kg−1) was exceeded in some horizon of five agricultural soils and three park or vacant soils. Nevertheless, it is worth mentioning that the determined concentrations were very similar to those reported by Caridad-Cancela et al. [44] for natural soils of Galicia, NW Spain (<0.01–0.41 mg kg−1). The toxicity limits for Mn (140 mg kg−1) and Pb (12 mg kg−1) were often (39% and 56% of samples, respectively) exceeded by soils of various uses. One sample had a concentration of bioavailable Cu above the toxicity limit (60 mg kg−1), and two samples had a concentration of bioavailable Zn above the toxicity limit (100 mg kg−1).
According to Rodriguez Alfaro et al. [45], high concentrations of PTEs can be present in Cuban agricultural soils as a result of the application of municipal-solid-waste compost, which contain elevated concentrations of Cd, Pb, Hg, As, Se, and Ni. According to these authors, as a result of their study, the use of municipal-solid-waste composts for food production has been forbidden by Cuban authorities. Upon discontinuation of the application of contaminated municipal-solid-waste compost, the PTEs will expectedly evolve into immobile forms.
The extraction with acid oxalate allows estimation of the elements occluded in noncrystalline iron oxides, which can be made available in the medium to long term [46], particularly if a change in soil conditions (e.g., pH and redox potential) favors the dissolution of oxides. This would be of particular concern for Hg, although the pseudo-total concentrations for this metal were always well below the reported upper limit of the MAC for agricultural soils.
The existence of gleyic properties had a significant influence on the concentrations of PTEs, both pseudo-total and available. The pseudo-total Fe, Co, Cr, and Ni concentrations were significantly (p < 0.05) lower in the soils with gleyic properties. Mobility and subsequent loss of iron are well-known facts in soils with reducing conditions. Co, Cr, and Ni can coprecipitate with iron or be adsorbed or occluded in iron oxyhydroxides, so that they are mobilized upon solubilization. It may also happen that these elements are mobilized in the form of complexes with soluble organic matter, more abundant under reducing conditions. Similarly, Shaheen et al. [47] reported a release of Cd, Cu, Co, Fe, Mn, Ni, and Zn under flood-dry cycles in a contaminated floodplain soil, related to variations of redox potential, pH, and dissolved organic carbon. In laboratory experiments, waterlogging was observed to affect the mobility of heavy metals (Cu, Pb, and Zn) retained or occluded in Fe or Mn compounds in urban soils [34,48].
The soils with gleyic properties showed lower concentrations (p < 0.05) of Mehlich-3 extractable Co, Ni, and Ti. In the cases of Co and Ni, this behavior was the same as that observed in pseudo-total concentrations. For these elements, pseudo-total and Mehlich-3 extractable concentrations were highly correlated. In the case of Ti, there were no significant differences in pseudo-total concentrations between gleyic and nongleyic soils. The extractable Ti/pseudo-total Ti ratio was significantly lower in soils with gleyic properties (p < 0.01). This appears to be a loss of Ti solubility under reducing conditions, which could be due to Ti precipitation as sulfide. This precipitation as sulfide may also occur for Co and Ni; in these cases, the precipitation, added to the decrease in total contents of these elements, could intensify the decline of available Co and Ni. Therefore, a change in the redox conditions of soils (for example, a variation of the water table) can result in mobilization or immobilization of some PTEs, increasing or decreasing the risk for these metals being exported to the food chain or water bodies. According to Ajmone-Marsan et al. [34], waterlogging of urban soils contaminated with PTEs may pose a serious environmental risk, particularly in the context of climate change.
5. Conclusions
The study shows that Fe, Ti, V, Ni, Cr, and Co were mainly of lithological origin, although a contribution of anthropogenic sources was not negligible for V, Ni, and Cr. As, Hg, Pb, Zn, Cd, and Cu arose mostly from anthropogenic activities, being related to industrial activities, fuel combustion, and application of organic amendments to soil. Mn seems to have a combined origin (lithogenic and anthropogenic).
Ti and V, having a common origin, showed the same distribution among the studied districts. Furthermore, Ni, Cr, and Co, associated with ultramafic rocks, showed a similar spatial distribution.
The pseudo-total concentrations of Cr and Ni were above the maximum allowable concentrations (MAC) for agricultural soils in 12% and 22% of samples, respectively, while the concentrations of Cu, Pb, and Zn rarely exceeded the MAC values. The pseudo-total V concentration always exceeded this MAC. For the other elements, the concentrations were below the MAC.
The enrichment factors (EFs) showed no anthropogenic enrichment for Ti. There was minimum enrichment of most samples in Co, Mn, As, Cd, Cr, Cu, and Ni, but outliers reached moderate enrichment in Co, Mn, and As, and significant enrichment in Cd, Cr, Cu, and Ni. There was significant enrichment in V, while for Pb, Zn, and Hg the median values denote moderate enrichment, but outliers reached significant enrichment in Zn and extremely high enrichment in Pb and Hg.
The concentrations of bioavailable forms of metals (including some usually considered as lithogenic) were quite often above acceptable thresholds, suggesting a recent enrichment from anthropogenic sources. The toxicity limits for bioavailable Cd, Ni, Mn, and Pb were exceeded by 14%, 10%, 39%, and 56% of samples, respectively.
The results of this study may be valuable for the authorities to issue guidelines for better management of the urban agriculture activities underlining the most toxic elements as well as their safety limits.
Supplementary Materials
The following are available online at https://0-www-mdpi-com.brum.beds.ac.uk/2076-3298/7/6/43/s1, Table S1: Concentrations of potentially toxic elements in urban soils of Havana. Raw data.
Author Contributions
Conception and design of the work: J.M.M.-A. and R.O.-G. Acquisition of data: J.M.M.-A. Analysis and interpretation of data: J.M.M.-A., R.O.-G. and M.L.F.-M. Drafting the work and revising it critically for important intellectual content: J.M.M.-A. and M.L.F.-M. Final approval of the submitted version: J.M.M.-A. and M.L.F.-M. Agreement to be accountable for all aspects of the work in ensuring that questions related to the accuracy or integrity of any part of the work are appropriately investigated and resolved: J.M.M.-A. and M.L.F.-M. All authors have read and agreed to the published version of the manuscript.
Funding
This research received no external funding.
Acknowledgments
The first author thanks the Banco de Santander for granting a USC-Banco Santander fellowship, which has made possible the completion of this work. The authors thank Timoteo Caetano Ferreira for revising the manuscript and three anonymous reviewers for their valuable suggestions and constructive criticism.
Conflicts of Interest
The authors declare no conflict of interest.
References
- IUSS Working Group WRB. World Reference Base for Soil Resources 2014, Update 2015, International Soil Classification System for Naming Soils and Creating Legends for Soil Maps; FAO: Rome, Italy, 2015. [Google Scholar]
- Effland, W.; Pouyat, R. The genesis, classification, and mapping of soils in urban areas. Urban Ecosyst. 1997, 1, 217–228. [Google Scholar] [CrossRef]
- Morel, J.L.; Chenu, C.; Lorenz, K. Ecosystem services provided by soils of urban, industrial, traffic, mining, and military areas (SUITMAs). J. Soils Sediments 2015, 15, 1659–1666. [Google Scholar] [CrossRef]
- Sharma, R.K.; Agrawal, M.; Marshall, F. Heavy metal contamination of soil and vegetables in suburban areas of Varanasi, India. Environ. Saf. 2007, 66, 258–266. [Google Scholar] [CrossRef]
- Iram, S.; Ahmad, I.; Akhtar, S. Distribution of Heavy Metals in Peri-Urban Agricultural Areas Soils. J. Chem. Soc. Pak. 2012, 34, 861–869. [Google Scholar]
- Sun, Y.B.; Zhou, Q.X.; Xie, X.K.; Liu, R. Spatial, sources and risk assessment of heavy metal contamination of urban soils in typical regions of Shenyang, China. J. Hazard. Mater 2010, 174, 455–462. [Google Scholar] [CrossRef]
- Huang, Y.; Li, T.; Wu, C.; He, Z.; Japenga, J.; Deng, M.; Yang, X. An integrated approach to assess heavy metal source apportionment in peri-urban agricultural soils. J. Hazard. Mater 2015, 299, 540–549. [Google Scholar] [CrossRef]
- Papa, S.; Bartoli, G.; Pellegrino, A.; Fioretto, A. Microbial activities and trace element contents in an urban soil. Environ. Monit. Assess. 2010, 165, 193–203. [Google Scholar] [CrossRef]
- Kumar, K.; Hundal, L.S. Soil in the City: Sustainably Improving Urban Soils. J. Environ. Qual. 2016, 45, 2–8. [Google Scholar] [CrossRef]
- Pouyat, R.V.; Yesilonis, I.D.; Russell-Anelli, J.; Neerchal, N.K. Soil Chemical and Physical Properties That Differentiate Urban Land-Use and Cover Types. Soil Sci. Soc. Am. J. 2007, 71, 1010–1019. [Google Scholar] [CrossRef] [Green Version]
- Massas, I.; Kalivas, D.; Ehaliotis, C.; Gasparatos, D. Total and available heavy metal concentrations in soils of the Thriassio plain (Greece) and assessment of soil pollution indexes. Environ. Monit. Assess. 2013, 185, 6751–6766. [Google Scholar] [CrossRef]
- Gasparatos, D.; Mavromati, G.; Kotsovilis, P.; Massas, I. Fractionation of heavy metals and evaluation of the environmental risk for the alkaline soils of the Thriassio plain: A residential, agricultural, and industrial area in Greece. Environ. Earth Sci. 2015, 74, 1099–1108. [Google Scholar] [CrossRef]
- Rodríguez-Seijo, A.; Andrade, M.L.; Vega, F.A. Origin and spatial distribution of metals in urban soils. J. Soils Sediments 2017, 17, 1514–1526. [Google Scholar] [CrossRef]
- Manta, D.S.; Angelone, M.; Bellanca, A.; Neri, R.; Sprovieri, M. Heavy metals in urban soils: A case study from the city of Palermo (Sicily), Italy. Sci. Total. Environ. 2002, 300, 229–243. [Google Scholar] [CrossRef]
- Massas, I.; Ehaliotis, C.; Kalivas, D.; Panagopoulou, G. Concentrations and Availability Indicators of Soil Heavy Metals; the Case of Children’s Playgrounds in the City of Athens (Greece). Water Air Soil Pollut. 2010, 212, 51–63. [Google Scholar] [CrossRef]
- Lee, C.S.-l.; Li, X.; Shi, W.; Cheung, S.C.-n.; Thornton, I. Metal contamination in urban, suburban, and country park soils of Hong Kong: A study based on GIS and multivariate statistics. Sci. Total. Environ. 2006, 356, 45–61. [Google Scholar] [CrossRef] [Green Version]
- Delbecque, N.; Verdoodt, A. Spatial Patterns of Heavy Metal Contamination by Urbanization. J. Environ. Qual. 2016, 45, 9–17. [Google Scholar] [CrossRef] [Green Version]
- National Bureau of Statistics and Information. Statistical Yearbook of Cuba 2018. 2019. Available online: http://www.one.cu/aec2018.htm (accessed on 23 July 2019).
- Companioni, N.; Rodríguez-Nodals, A.; Sardiñas, J. Avances de la agricultura urbana, suburbana y familiar. Agroecología 2017, 12, 91–98. [Google Scholar]
- Koont, S. A Cuban Success Story: Urban Agriculture. Rev. Radic. Politi- Econ. 2008, 40, 285–291. [Google Scholar] [CrossRef]
- Orsini, F.; Kahane, R.; Nono-Womdim, R.; Gianquinto, G. Urban agriculture in the developing world: A review. Agron. Sustain. Dev. 2013, 33, 695–720. [Google Scholar] [CrossRef] [Green Version]
- Wright, J. Sustainable Agriculture and Food Security in an Era of Oil Scarcity: Lessons from Cuba; Routledge: London, UK, 2012; p. 280. [Google Scholar]
- USEPA. Method 3051A. Microwave Assisted Acid Digestion of Sediments, Sludges, Soils, and Oils. Available online: https://www.epa.gov/hw-sw846/sw-846-test-method-3051a-microwave-assisted-acid-digestion-sediments-sludges-soils-and-oils (accessed on 11 May 2020).
- Mehlich, A. Mehlich 3 soil test extractant: A modification of Mehlich 2 extractant. Commun. Soil Sci. Plant Anal. 1984, 15, 1409–1416. [Google Scholar] [CrossRef]
- Schwertmann, U. The differentiation of iron oxide in soils by a photochemical extraction with acid ammonium oxalate. Z. Pflanz. Düngung Bodenkd. 1964, 105, 194–202. [Google Scholar] [CrossRef]
- Rodriguez Alfaro, M.; Montero, A.; Muniz Ugarte, O.; Araujo do Nascimento, C.W.; de Aguiar Accioly, A.M.; Biondi, C.M.; Agra Bezerra da Silva, Y.J. Background concentrations and reference values for heavy metals in soils of Cuba. Environ. Monit. Assess. 2015, 187. [Google Scholar] [CrossRef]
- Kabata-Pendias, A. Trace Elements in Soils and Plants; CRC: Boca Raton, FL, USA, 2011. [Google Scholar]
- Ajmone-Marsan, F.; Biasioli, M. Trace Elements in Soils of Urban Areas. Water Air Soil Pollut. 2010, 213, 121–143. [Google Scholar] [CrossRef]
- Madrid, F.; Biasioli, M.; Ajmone-Marsan, F. Availability and bioaccessibility of metals in fine particles of some urban soils. Arch. Environ. Contam. Toxicol. 2008, 55, 21–32. [Google Scholar] [CrossRef]
- Wei, B.G.; Yang, L.S. A review of heavy metal contaminations in urban soils, urban road dusts and agricultural soils from China. Microchem. J. 2010, 94, 99–107. [Google Scholar] [CrossRef]
- Diaz Rizo, O.; Echeverria Castillo, F.; Arado Lopez, J.O.; Hernandez Merlo, M. Assessment of Heavy Metal Pollution in Urban Soils of Havana City, Cuba. Bull. Environ. Contam. Toxicol. 2011, 87, 414–419. [Google Scholar] [CrossRef]
- Senesi, G.S.; Baldassarre, G.; Senesi, N.; Radina, B. Trace element inputs into soils by anthropogenic activities and implications for human health. Chemosphere 1999, 39, 343–377. [Google Scholar] [CrossRef]
- Liu, L.; Liu, Q.; Ma, J.; Wu, H.; Qu, Y.; Gong, Y.; Yang, S.; An, Y.; Zhou, Y. Heavy metal(loid)s in the topsoil of urban parks in Beijing, China: Concentrations, potential sources, and risk assessment. Environ. Pollut. 2020, 260. [Google Scholar] [CrossRef]
- Ajmone-Marsan, F.; Padoan, E.; Madrid, F.; Vrscaj, B.; Biasioli, M.; Davidson, C.M. Metal Release under Anaerobic Conditions of Urban Soils of Four European Cities. Water Air Soil Pollut. 2019, 230. [Google Scholar] [CrossRef] [Green Version]
- Franco-Uria, A.; Lopez-Mateo, C.; Roca, E.; Fernandez-Marcos, M.L. Source identification of heavy metals in pastureland by multivariate analysis in NW Spain. J. Hazard. Mater. 2009, 165, 1008–1015. [Google Scholar] [CrossRef]
- Nriagu, J.O. Natural versus anthropogenic emissions of trace-metals to the atmosphere. In Control and Fate of Atmospheric Trace Metals; Pacyna, J.M., Ottar, B., Eds.; Springer: Berlin/Heidelberg, Germany, 1989; Volume 268, pp. 3–13. [Google Scholar]
- Rodríguez-Mercado, J.J.; Altamirano-Lozano, M.A. Vanadio: Contaminación, Metabolismo y Genotoxicidad. Rev. Int. Contam. Ambient. 2006, 22, 173–189. [Google Scholar]
- Diaz Rizo, O.; Fonticiella Morell, D.; Arado Lopez, J.O.; Borrell Munoz, J.L.; D’Alessandro Rodriguez, K.; Lopez Pino, N. Spatial Distribution and Contamination Assessment of Heavy Metals in Urban Topsoils from Las Tunas City, Cuba. Bull. Environ. Contam. Toxicol. 2013, 91, 29–35. [Google Scholar] [CrossRef]
- Monterroso, C.; Alvarez, E.; Marcos, M.L.F. Evaluation of Mehlich 3 reagent as a multielement extractant in mine soils. Land Degrad. Dev. 1999, 10, 35–47. [Google Scholar] [CrossRef]
- Wendt, J.W. Evaluation of the Mehlich 3 soil extractant for upland Malawi soils. Commun. Soil Sci. Plant Anal. 1995, 26, 687–702. [Google Scholar] [CrossRef]
- Baken, S.; Larsson, M.A.; Gustafsson, J.P.; Cubadda, F.; Smolders, E. Ageing of vanadium in soils and consequences for bioavailability. Eur. J. Soil Sci. 2012, 63, 839–847. [Google Scholar] [CrossRef] [Green Version]
- Jeske, A.; Gworek, B. Chromium, nickel and vanadium mobility in soils derived from fluvioglacial sands. J. Hazard. Mater. 2012, 237, 315–322. [Google Scholar] [CrossRef]
- Larsson, M.A.; Baken, S.; Gustafsson, J.P.; Hadialhejazi, G.; Smolders, E. Vanadium bioavailability and toxicity to soil microorganisms and plants. Environ. Toxicol. Chem. 2013, 32, 2266–2273. [Google Scholar] [CrossRef] [Green Version]
- Caridad-Cancela, R.; Paz-González, A.; de Abreu, C.A. Total and Extractable Nickel and Cadmium Contents in Natural Soils. Commun. Soil Sci. Plant Anal. 2005, 36, 241–252. [Google Scholar] [CrossRef]
- Rodriguez Alfaro, M.; Araujo do Nascimento, C.W.; Muniz Ugarte, O.; Montero Alvarez, A.; de Aguiar Accioly, A.M.; Calero Martin, B.; Limeres Jimenez, T.; Ginebra Aguilar, M. First national-wide survey of trace elements in Cuban urban agriculture. Agron. Sustain. Dev. 2017, 37. [Google Scholar] [CrossRef]
- Agbenin, J.O.; Welp, G.; Danko, M. Fractionation and Prediction of Copper, Lead, and Zinc Uptake by Two Leaf Vegetables from Their Geochemical Fractions in Urban Garden Fields in Northern Nigeria. Commun. Soil Sci. Plant Anal. 2010, 41, 1028–1041. [Google Scholar] [CrossRef]
- Shaheen, S.M.; Rinklebe, J.; Rupp, H.; Meissner, R. Temporal dynamics of pore water concentrations of Cd, Co, Cu, Ni, and Zn and their controlling factors in a contaminated floodplain soil assessed by undisturbed groundwater lysimeters. Environ. Pollut. 2014, 191, 223–231. [Google Scholar] [CrossRef]
- Florido, M.C.; Madrid, F.; Ajmone-Marsan, F. Variations of Metal Availability and Bio-accessibility in Water-Logged Soils with Various Metal Contents: In Vitro Experiments. Water Air Soil Pollut. 2011, 217, 149–156. [Google Scholar] [CrossRef] [Green Version]
Figure 1.
Location of the studied soils in Havana, Cuba (map from Google Earth).

Figure 2.
Distribution of pseudo-total As, Hg Co, Cr, Mn, Ni, Ti, and V in the various districts. The limits of the boxes are percentiles 25 and 75. The horizontal lines inside the boxes are the medians. The whiskers indicate the 0th and 100th percentiles, excluding outliers.
Figure 2.
Distribution of pseudo-total As, Hg Co, Cr, Mn, Ni, Ti, and V in the various districts. The limits of the boxes are percentiles 25 and 75. The horizontal lines inside the boxes are the medians. The whiskers indicate the 0th and 100th percentiles, excluding outliers.

Figure 3.
Enrichment factors for the studied elements relative to Cuban natural soils.


Table 1.
Concentrations of potentially toxic elements (PTEs) for the 35 soils studied: average ± standard deviation, along with world soil average and maximum allowable concentrations (MAC) for agricultural soils according to Kabata-Pendias [27] (see also Table S1).
| Pseudo-Total, mg kg−1 | World Average, mg kg−1 | MAC, mg kg−1 | Mehlich 3, mg kg−1 | Acid Oxalate, mg kg−1 | 100 x Mehlich 3/Pseudo-Total | |
|---|---|---|---|---|---|---|
| As | 8.11 ± 3.09 | 6.83 | 15–20 | 0.074 ± 0.054 | 0.098 ± 0.082 | 1.02 ± 0.66 |
| Cd | 0.62 ± 0.56 | 0.41 | 1–5 | 0.187 ± 0.155 | n.d. | 30.4 ± 10.4 |
| Co | 11.7 ± 7.8 | 11.3 | 20–50 | 1.56 ± 1.37 | 1.35 ± 1.24 | 12.5 ± 7.5 |
| Cr | 82.9 ± 119.3 | 59.5 | 50–200 | 0.40 ± 0.25 | 2.27 ± 2.46 | 1.33 ± 2.70 |
| Cu | 73.5 ± 37.5 | 38.9 | 60–150 | 14.1 ± 11.0 | 1.78 ± 0.80 | 18.2 ± 6.7 |
| Fe | 25,500 ± 9960 | 35,000 | ---- | 124 ± 38 | 1490 ± 1110 | 0.66 ± 0.54 |
| Mn | 578 ± 235 | 488 | ---- | 131 ± 82 | 72.8 ± 57.5 | 21.9 ± 10.9 |
| Ni | 72.1 ± 131.0 | 29 | 20–60 | 2.95 ± 3.22 | 2.11 ± 3.48 | 6.34 ± 3.25 |
| Pb | 73.5 ± 79.4 | 27 | 20–300 | 25.0 ± 33.3 | 0.69 ± 0.57 | 30.4 ± 11.8 |
| Ti | 907 ± 393 | 7,038 | ---- | 0.93 ± 0.41 | 2.60 ± 2.37 | 0.11 ± 0.07 |
| V | 619 ± 253 | 129 | 150 | 0.41 ± 0.23 | 6.03 ± 4.36 | 0.07 ± 0.07 |
| Zn | 126 ± 88 | 70 | 100–300 | 27.2 ± 33.9 | 16.7 ± 9.3 | 18.3 ± 9.7 |
| Hg | 0.51 ± 0.57 | 0.07 | 0.5–5 | 0.0017 ± 0.0011 | 0.041 ± 0.029 | 1.29 ± 1.91 |
Table 2.
Main effects of district, soil use, and interaction district x soil use on pseudo-total PTE concentrations (significance level).
Table 2.
Main effects of district, soil use, and interaction district x soil use on pseudo-total PTE concentrations (significance level).
| Significance | |||
|---|---|---|---|
| District | Soil Use | District x Soil Use | |
| As | 0.00 | 0.09 | 0.52 |
| Cd | 0.49 | 0.40 | 0.25 |
| Co | 0.00 | 0.49 | 0.71 |
| Cr | 0.00 | 0.53 | 0.03 |
| Cu | 0.54 | 0.14 | 0.63 |
| Fe | 0.16 | 0.05 | 0.31 |
| Mn | 0.05 | 0.27 | 0.53 |
| Ni | 0.00 | 0.52 | 0.18 |
| Pb | 0.66 | 0.23 | 0.10 |
| Ti | 0.00 | 0.16 | 0.99 |
| V | 0.00 | 0.15 | 0.95 |
| Zn | 0.12 | 0.88 | 0.88 |
| Hg | 0.00 | 0.13 | 0.01 |
Bold numbers indicate significance level ≤0.05.
Table 3.
Total explained variance.
| Component | Initial Eigenvalues | Rotation Sum of Squared Loadings | ||||
|---|---|---|---|---|---|---|
| Total | % of Variance | % Cumulative | Total | % of Variance | % Cumulative | |
| 1 | 4.211 | 32.39 | 32.39 | 3.225 | 24.81 | 24.81 |
| 2 | 2.799 | 21.53 | 53.92 | 2.866 | 22.05 | 46.85 |
| 3 | 2.041 | 15.70 | 69.62 | 2.476 | 19.05 | 65.90 |
| 4 | 1.055 | 8.12 | 77.74 | 1.539 | 11.84 | 77.74 |
| 5 | 0.792 | 6.09 | 83.83 | |||
| 6 | 0.627 | 4.83 | 88.66 | |||
| 7 | 0.518 | 3.98 | 92.64 | |||
| 8 | 0.357 | 2.75 | 95.38 | |||
| 9 | 0.302 | 2.33 | 97.71 | |||
| 10 | 0.209 | 1.61 | 99.31 | |||
| 11 | 0.074 | 0.57 | 99.89 | |||
| 12 | 0.015 | 0.11 | 100.0 | |||
| 13 | 0.000 | 0.00 | 100.0 | |||
Table 4.
Matrix of principal components analysis (significant loading factors are highlighted in bold).
Table 4.
Matrix of principal components analysis (significant loading factors are highlighted in bold).
| Component Matrix | Rotated Component Matrix | ||||||||
|---|---|---|---|---|---|---|---|---|---|
| Element | PC1 | PC2 | PC3 | PC4 | Element | PC1 | PC2 | PC3 | PC4 |
| Fe | 0.828 | 0.092 | 0.201 | 0.157 | Ti | 0.950 | −0.094 | 0.027 | 0.124 |
| Co | 0.818 | 0.299 | −0.414 | 0.050 | V | 0.947 | 0.056 | 0.048 | 0.137 |
| V | 0.762 | −0.393 | 0.393 | −0.180 | As | −0.707 | −0.250 | 0.222 | −0.257 |
| As | −0.724 | 0.0392 | −0.011 | −0.009 | Fe | 0.577 | 0.354 | 0.250 | 0.488 |
| Ti | 0.669 | −0.474 | 0.0480 | −0.158 | Hg | −0.575 | −0.086 | 0.245 | 0.193 |
| Cr | 0.592 | 0.474 | −0.569 | −0.181 | Ni | 0.034 | 0.976 | 0.022 | −0.018 |
| Zn | 0.067 | 0.761 | 0.380 | 0.156 | Cr | 0.010 | 0.959 | 0.104 | 0.040 |
| Cd | 0.008 | 0.709 | 0.387 | −0.084 | Co | 0.250 | 0.867 | 0.047 | 0.340 |
| Pb | −0.054 | 0.605 | 0.475 | −0.422 | Pb | −0.013 | −0.012 | 0.821 | −0.314 |
| Hg | −0.359 | 0.447 | −0.008 | 0.326 | Zn | −0.216 | 0.068 | 0.795 | 0.264 |
| Ni | 0.0588 | 0.403 | −0.627 | −0.231 | Cd | −0.158 | 0.057 | 0.795 | 0.017 |
| Cu | 0.446 | 0.355 | 0.448 | −0.000 | Cu | 0.325 | 0.108 | 0.591 | 0.242 |
| Mn | 0.522 | 0.077 | 0.085 | 0.754 | Mn | 0.140 | 0.125 | 0.034 | 0.905 |
Table 5.
Spearman’s correlation coefficient matrix between pseudo-total metal concentrations in the soils studied.
Table 5.
Spearman’s correlation coefficient matrix between pseudo-total metal concentrations in the soils studied.
| As | Cd | Co | Cr | Cu | Fe | Mn | Ni | Pb | Ti | V | Zn | |
|---|---|---|---|---|---|---|---|---|---|---|---|---|
| Cd | 0.27 * | |||||||||||
| Co | −0.59 ** | 0.14 | ||||||||||
| Cr | −0.04 | 0.58 ** | 0.57 ** | |||||||||
| Cu | −0.18 | 0.47 ** | 0.56 ** | 0.44 ** | ||||||||
| Fe | −0.49 ** | 0.20 | 0.70 ** | 0.49 ** | 0.55 ** | |||||||
| Mn | −0.40 ** | 0.10 | 0.63 ** | 0.12 | 0.32 ** | 0.40 ** | ||||||
| Ni | −0.07 | 0.49 ** | 0.56 ** | 0.90 ** | 0.46 ** | 0.39 ** | 0.20 | |||||
| Pb | 0.17 | 0.58 ** | 0.08 | 0.29 ** | 0.49 ** | 0.03 | −0.06 | 0.33 ** | ||||
| Ti | −0.70 ** | −0.21 * | 0.48 ** | −0.06 | 0.39 ** | 0.53 ** | 0.24 * | −0.07 | 0.04 | |||
| V | −0.72 ** | −0.18 | 0.54 ** | 0.04 | 0.42 ** | 0.59 ** | 0.26 * | 0.04 | 0.05 | 0.98 ** | ||
| Zn | 0.18 | 0.79 ** | 0.18 | 0.45 ** | 0.57 ** | 0.21 | 0.05 | 0.44 ** | 0.77 ** | −0.08 | −0.05 | |
| Hg | 0.26 * | 0.34 ** | −0.06 | 0.14 | 0.14 | −0.04 | −0.06 | 0.20 | 0.42 ** | −0.35 ** | −0.31 ** | 0.53 ** |
* significant at p < 0.05 level; ** significant at p < 0.01 level.
Table 6.
Mean values and standard deviations of the concentrations (mg kg−1) of pseudo-total and Mehlich-3 extractable PTEs from surface (n = 35) and subsurface (n = 56) horizons of the urban soils studied and significance of equality of means (T-test). Significant differences (p ≤ 0.05) highlighted in bold.
| Pseudo-Total Elements, mg kg−1 | Mehlich-3 Extractable Elements, mg kg−1 | |||||
|---|---|---|---|---|---|---|
| Surface | Subsurface | p | Surface | Subsurface | p | |
| As | 7.74 ± 2.34 | 8.35 ± 3.48 | 0.37 | 0.086 ± 0.047 | 0.066 ± 0.056 | 0.07 |
| Cd | 0.788 ± 0.681 | 0.514 ± 0.433 | 0.04 | 0.240 ± 0.168 | 0.153 ± 0.137 | 0.01 |
| Co | 13.4 ± 9.9 | 10.7 ± 6.0 | 0.16 | 1.71 ± 1.49 | 1.47 ± 1.30 | 0.43 |
| Cr | 116 ± 160 | 61.8 ± 78.5 | 0.03 | 0.433 ± 0.258 | 0.372 ± 0.247 | 0.27 |
| Cu | 80.6 ± 37.4 | 69.1 ± 37.2 | 0.16 | 17.2 ± 13.2 | 12.2 ± 9.0 | 0.05 |
| Fe | 27,300 ± 9020 | 24,400 ± 10,400 | 0.16 | 122 ±31 | 125 ± 42 | 0.68 |
| Mn | 588 ± 217 | 573 ± 247 | 0.76 | 171 ± 200 | 125 ± 85 | 0.20 |
| Ni | 103 ± 190 | 53.1 ± 69.7 | 0.05 | 3.25 ± 4.09 | 2.77 ± 2.57 | 0.53 |
| Pb | 84.7 ± 60.9 | 66.5 ± 88.9 | 0.25 | 25.8± 18.0 | 24.5 ± 40.1 | 0.83 |
| Ti | 847 ± 307 | 944 ± 437 | 0.25 | 0.997 ± 0.458 | 0.879 ± 0.378 | 0.25 |
| V | 593 ± 194 | 635± 283 | 0.44 | 0.401 ± 0.264 | 0. 417 ± 0.201 | 0.76 |
| Zn | 163 ± 108 | 103 ± 65 | 0.01 | 41.1 ± 46.9 | 18.6 ± 18.0 | 0.00 |
| Hg | 0.528 ± 0.544 | 0.491 ± 0.591 | 0.76 | 0.0016 ± 0.0008 | 0.0017 ± 0.0012 | 0.39 |
Table 7.
Mean values and standard deviations of the concentrations (mg kg−1) of pseudo-total and Mehlich-3 extractable PTEs of the urban soils studied, without gleyic properties (n = 62) and with gleyic properties (n = 29), and significance of equality of means (T-test). Significant differences (p ≤ 0.05) highlighted in bold.
| Pseudo-Total Elements. mg kg−1 | Mehlich-3 Extractable Elements. mg kg−1 | |||||
|---|---|---|---|---|---|---|
| Nongleyic | Gleyic | p | Nongleyic | Gleyic | p | |
| As | 7.96 ± 3.31 | 8.46 ± 2.56 | 0.44 | 0.079 ± 0.056 | 0.062 ± 0.046 | 0.13 |
| Cd | 0.620 ± 0.532 | 0.618 ± 0.614 | 0.98 | 0.184 ± 0.155 | 0.193 ± 0.156 | 0.79 |
| Co | 13.2 ± 8.9 | 8.43 ± 2.29 | 0.01 | 1.74 ± 1.47 | 1.17 ± 1.04 | 0.04 |
| Cr | 101 ± 134 | 43.3 ± 65.1 | 0.03 | 0.420 ± 0.247 | 0.340 ± 0.259 | 0.16 |
| Cu | 75.6 ± 34.6 | 69.0 ± 43.6 | 0.49 | 14.9 ± 11.3 | 12.4 ± 10.4 | 0.33 |
| Fe | 27,100 ± 10,100 | 22,000 ± 8850 | 0.02 | 124 ±40 | 124 ± 35 | 0.99 |
| Mn | 597 ± 257 | 537 ± 176 | 0.20 | 154 ± 162 | 119 ± 82 | 0.18 |
| Ni | 89.9 ±154.1 | 32.2 ± 18.4 | 0.05 | 3.45 ± 3.75 | 1.83 ± 0.72 | 0.03 |
| Pb | 66.2 ± 68.2 | 89.8 ± 99.8 | 0.19 | 23.4 ± 33.5 | 28.5 ± 33.1 | 0.51 |
| Ti | 941 ± 411 | 831 ± 344 | 0.19 | 1.00 ± 0.36 | 0.702 ± 0.482 | 0.01 |
| V | 646 ± 263 | 559 ± 220 | 0.11 | 0.421 ± 0.242 | 0.378 ±0.175 | 0.41 |
| Zn | 129 ± 94 | 121 ± 75 | 0.68 | 28.5 ± 38.1 | 24.5 ± 22.3 | 0.53 |
| Hg | 0.463 ± 0.562 | 0.601 ± 0.586 | 0.30 | 0.0018 ± 0.0013 | 0.0015 ± 0.0004 | 0.24 |
Table 8.
Quality reference values (QRVs) established by Rodriguez Alfaro et al. (2015) for Cuban soils, enrichment factors (EF) and geoaccumulation indices (Igeo) calculated for the urban soils studied by comparison with these QRVs (median and interval in parentheses).
Table 8.
Quality reference values (QRVs) established by Rodriguez Alfaro et al. (2015) for Cuban soils, enrichment factors (EF) and geoaccumulation indices (Igeo) calculated for the urban soils studied by comparison with these QRVs (median and interval in parentheses).
| QRV, mg kg−1 | EF | Igeo | |
|---|---|---|---|
| As | 19 | 0.75 (0.19 to 5.17) | −1.87 (−3.40 to −0.58) |
| Cd | 0.6 | 1.84 (0.89 to 12.12) | −0.94 (−3.91 to 2.00) |
| Co | 25 | 0.90 (0.42 to 3.20) | −1.89 (−3.67 to 0.36) |
| Cr | 153 | 0.67 (0.01 to 7.08) | −2.59 (−8.06 to 1.84) |
| Cu | 83 | 1.67 (0.94 to 6.78) | −0.86 (−3.30 to 0.88) |
| Mn | 1947 | 0.65 (0.08 to 3.24) | −2.35 (−4.94 to −1.25) |
| Ni | 170 | 0.54 (0.08 to 7.26) | −2.74 (−5.08 to 1.87) |
| Pb | 50 | 2.19 (0.15 to 50.1) | −0.61 (−4.85 to 2.49) |
| Ti | ----- | 0.45 (0.16 to 0.87) * | −2.80 (−4.88 to −1.55) * |
| V | 137 | 10.5 (4.20 to 19.5) | 1.65 (−0.40 to 2.82) |
| Zn | 86 | 2.65 (0.89 to 12.2) | −0.31 (−2.70 to 2.37) |
| Hg | 0.1 | 2.70 (0.90 to 176) | 0.15 (−1.62 to 4.28) |
* In the case of Ti, the average concentrations of Ti and Fe in the earth’s crust were used as a reference.
© 2020 by the authors. Licensee MDPI, Basel, Switzerland. This article is an open access article distributed under the terms and conditions of the Creative Commons Attribution (CC BY) license (http://creativecommons.org/licenses/by/4.0/).
Share and Cite
MDPI and ACS Style
Moreno-Alvarez, J.M.; Orellana-Gallego, R.; Fernandez-Marcos, M.L. Potentially Toxic Elements in Urban Soils of Havana, Cuba. Environments 2020, 7, 43. https://0-doi-org.brum.beds.ac.uk/10.3390/environments7060043
AMA Style
Moreno-Alvarez JM, Orellana-Gallego R, Fernandez-Marcos ML. Potentially Toxic Elements in Urban Soils of Havana, Cuba. Environments. 2020; 7(6):43. https://0-doi-org.brum.beds.ac.uk/10.3390/environments7060043
Chicago/Turabian StyleMoreno-Alvarez, Juan Miguel, Rosa Orellana-Gallego, and Maria Luisa Fernandez-Marcos. 2020. "Potentially Toxic Elements in Urban Soils of Havana, Cuba" Environments 7, no. 6: 43. https://0-doi-org.brum.beds.ac.uk/10.3390/environments7060043
Note that from the first issue of 2016, this journal uses article numbers instead of page numbers. See further details here.