1. Introduction
Due to the use of Gd
3+ in magnetic resonance imaging and manufacturing, large quantities of gadolinium have been released into the environment [
1,
2,
3]. Gd
3+ can be extremely toxic under some circumstances, and an investigation of its chemistry in the environment is warranted. The goal of this work was to develop a method that can probe the interaction of Gd
3+ with environmentally important ligands including organic acids and humic materials. In order to effectively utilize PAR as a speciation probe, it is important to establish the stoichiometry of the complexes formed and a value for the stability constants under the pH, ionic strength, and temperature conditions utilized. In addition, it is important to gauge the impact of potentially competitive side reactions such as hydrolysis on the formation of the PAR complex. These experiments were conducted with Gd
3+ at micro-molar (uM) concentrations. While these concentrations are considerably higher than the observed concentrations for Gd
3+ in the environment, they are considerably lower than the concentrations used in most previous studies.
Gadolinium is a rare earth that occurs primarily in the +3 oxidation state. It has a complex environmental chemistry that includes the potential for complex formation with a variety of organic and inorganic ligands, surface sorption and hydrolysis, co-precipitation and precipitation [
4]. The hydrolysis behavior of Gd
3+ is important for accessing the speciation of Gd
3+ in the environment. The hydrolysis reactions are shown below. While more complex hydrolysis products are often evoked to rationalize potentiometric titration results, our measurements were all performed at low Gd
3+ concentrations and in the presence of excess PAR, thus we are including only the first two hydrolysis reactions in our modeling for which data are available.
The hydrolysis of Gd
3+ has been studied by a number of authors [
5,
6,
7]. For the calculations of speciation in the presence of 4-(2-pyridylazo) resorcinol (PAR) performed for this investigation, both the first and second hydrolysis constants from Garcia-Rodenas and Liberman [
5] were incorporated, after these values were adjusted to 0.100 ionic strength using the Davies equation. However, including the hydrolysis reactions did not make a significant difference in our calculations because of the relatively high concentrations of PAR.
PAR is a colorimetric complexing agent that has been utilized as a titration indicator and colorimetric reagent for various metals. The stoichiometry of the metal–PAR complexes has been reported as 1:1 or 1:2 by various authors. Iwamoto (1961) [
8] investigated the acid–base properties of PAR and chelate formation with a several transition metals and lead. Iwamoto [
8] indicated Fe
3+, Co
2+, and Ni
2+ form PAR complexes in 1:2 at pH 4 while Cu
2+, Zn
2+ Cd, Hg
2+, Pb
2+ form 1:1 complexes at pH 10. Kocyła et al. used PAR as a metallochromic indicator in a competitive ligand (spectrophotometry) approach to measure the affinity of Zn
2+ in Zn protein finger domains [
9]. Kocyła et al. [
9] indicated that several different protonated species of the PAR complexes may exist in solution. Under the conditions utilized in Kocłya et al. [
9], the Zn
2+ complex appeared to be primarily 1:2. Kocyła et al. [
9] emphasized the conditional aspect of all of these measurements. PAR is not a simple ligand and several species of varying spectral properties may be present. Therefore, the observed extinction coefficient is highly pH dependent. Holm and Smothers (2006) [
10] characterized the lead-complexing properties of polyphosphate water treatment products using competing-ligand spectrophotometry with PAR. These experiments employed high Pb
2+: PAR ratios, and the authors indicated that 1:1 Pb
2+: PAR complexes were forming under these conditions, with the possibility of multiple adsorbing species present in solution. They considered the possibility of mixed complexes between PAR and the polyphosphates but concluded that these complexes were not necessary to explain their data. Degnall et al. (1965) [
11] developed an analytical method for the determination of lead with PAR. This method incorporated an elaborate solvent extraction procedure to remove interfering metal ions before forming the PAR complex. Degnall et al. [
11] indicated that a 1:1 Pb
2+-PAR complex was formed. Neas and Guyon (1972) [
12] developed a method for the indirect determination of oxalate using the competitive disruption of the highly colored uranium and PAR complex by oxalate at pH 4.8. Florence and Farrar (1963) [
13] used PAR for a spectrophotometric determination of uranium. Corsini et al. (1962) [
14] conducted a potentiometric investigation of PAR with Mn
2+, Co
2+, Ni
2+, and Zn
2+ in 50% dioxane–water where their results indicated that 1:2 metal: PAR complexes were formed. Pollard et al. (1959) [
15] suggested PAR as a possible analytical reagent for the colorimetric estimation of cobalt, lead, and uranium. These authors demonstrated excellent sensitivity for these metals and recommended the use of the reagent after separation using methods such as paper chromatography. Ghasemi et al. (2007) [
16] studied complex formation between PAR and Al
3+, Fe
3+, Zn
2+, and Cd
2+ in an aqueous solution at 0.1 M ionic strength. McCall and Fierke (2000) [
17] utilized PAR to investigate the binding of several transition metals to the enzyme carbonic anhydrase and measured the metal released from carbonic anhydrase that was previously incubated with various metal ion buffers. Their method incorporated 4 M guanidine to denature the carbonic anhydrase and release the metals into solution where they would be complexed by PAR. Similarly, Hunt et al. (1985) [
18] used PAR to measure zinc release from Escherichia coli aspartate transcarbamoylase. PAR was used to measure the instantaneous concentration of Zn
2+ at pH 7.0 after the aspartate transcarbamoylase was treated with the organo-mercury reagent (PMPS).
Mori et al. (1988) [
19] developed an assay for mercury(II) using PAR. In addition, Mori et al. used the disruption of the Hg
2+–PAR complex by cyanide in order to quantify cyanide in solution. Munshi and Dey (1964, 1971) [
20,
21] reported the spectrophotometric determination of lanthanides using PAR. They established 1:2 metal: PAR stoichiometry by several methods. Sommer and Novotná (1967) [
22] investigated the complexation of aluminum, yttrium, lanthanum, and lanthanides with PAR and their results indicate that Al
3+ forms 1:1 complexes at low pH while yttrium forms a 1:2 complex.
Thompson and Byrne (1988) [
23] used PAR as an indicator complex in the study of europium carbonate equilibrium at an ionic strength of ~0.7 (similar to seawater). They used a large excess of PAR and observed competitive complexation by both the carbonate and oxalate. They assumed that the Gd
3+–oxalate constant was well established and were able to estimate the Gd
3+–carbonate equilibrium relative to the Gd
3+–oxalate equilibrium. The mathematical development presented in the Thompson and Byrne [
23] manuscript implies that both mono- and bis-PAR complexes exist.
Furthermore their data analysis including the possibility of mixed complexes, however their results indicated that they were quantitatively unimportant in their contribution to absorbance.
The pK
a values for PAR have been reported by a number of groups [
8,
9,
24]. PAR when fully protonated has a charge of +1. At circumneutral pH conditions, mono-protonated HPAR
- is the dominant species. Munshi and Dey (1971) [
21] measured stability constants for PAR chelates of the lanthanides and reported that the lanthanides formed 1:2 complexes with PAR. Munshi and Dey (1971) [
21] reported a stability constant with Gd
3+ of 10
9.9 for the formation of the 1:2 complex. Ohyoshi (1984) [
25] reported a stability constant for the formation of Gd(HPAR)
2+ and Gd(PAR)
+ of 10
4.28 and 10
10.25, respectively. Ohyoshi [
25] significantly implied a 1:1 stoichiometry for the complex as these measurements were conducted with metal ions far in excess over PAR. The differences in experimental conditions makes these two results difficult to reconcile.
It is clear that PAR is a complex ligand that reacts with metal ions to produce a number of light absorbing species that are simultaneously present in solution. The speciation of PAR, and most likely the chelates, are highly concentration, pH, and ionic strength dependent. To utilize PAR in a competitive ligand study, it is important that pH, ionic strength, and concentration of PAR be well controlled during the measurements as stability constants and complex absorptivity are clearly conditional in nature. In addition, it is important that the stoichiometry of the complex be well established in order to successfully model competitive ligand interactions.
3. Results and Discussion
3.1. Gd3+-PAR Complexation Color Development as a Function of pH
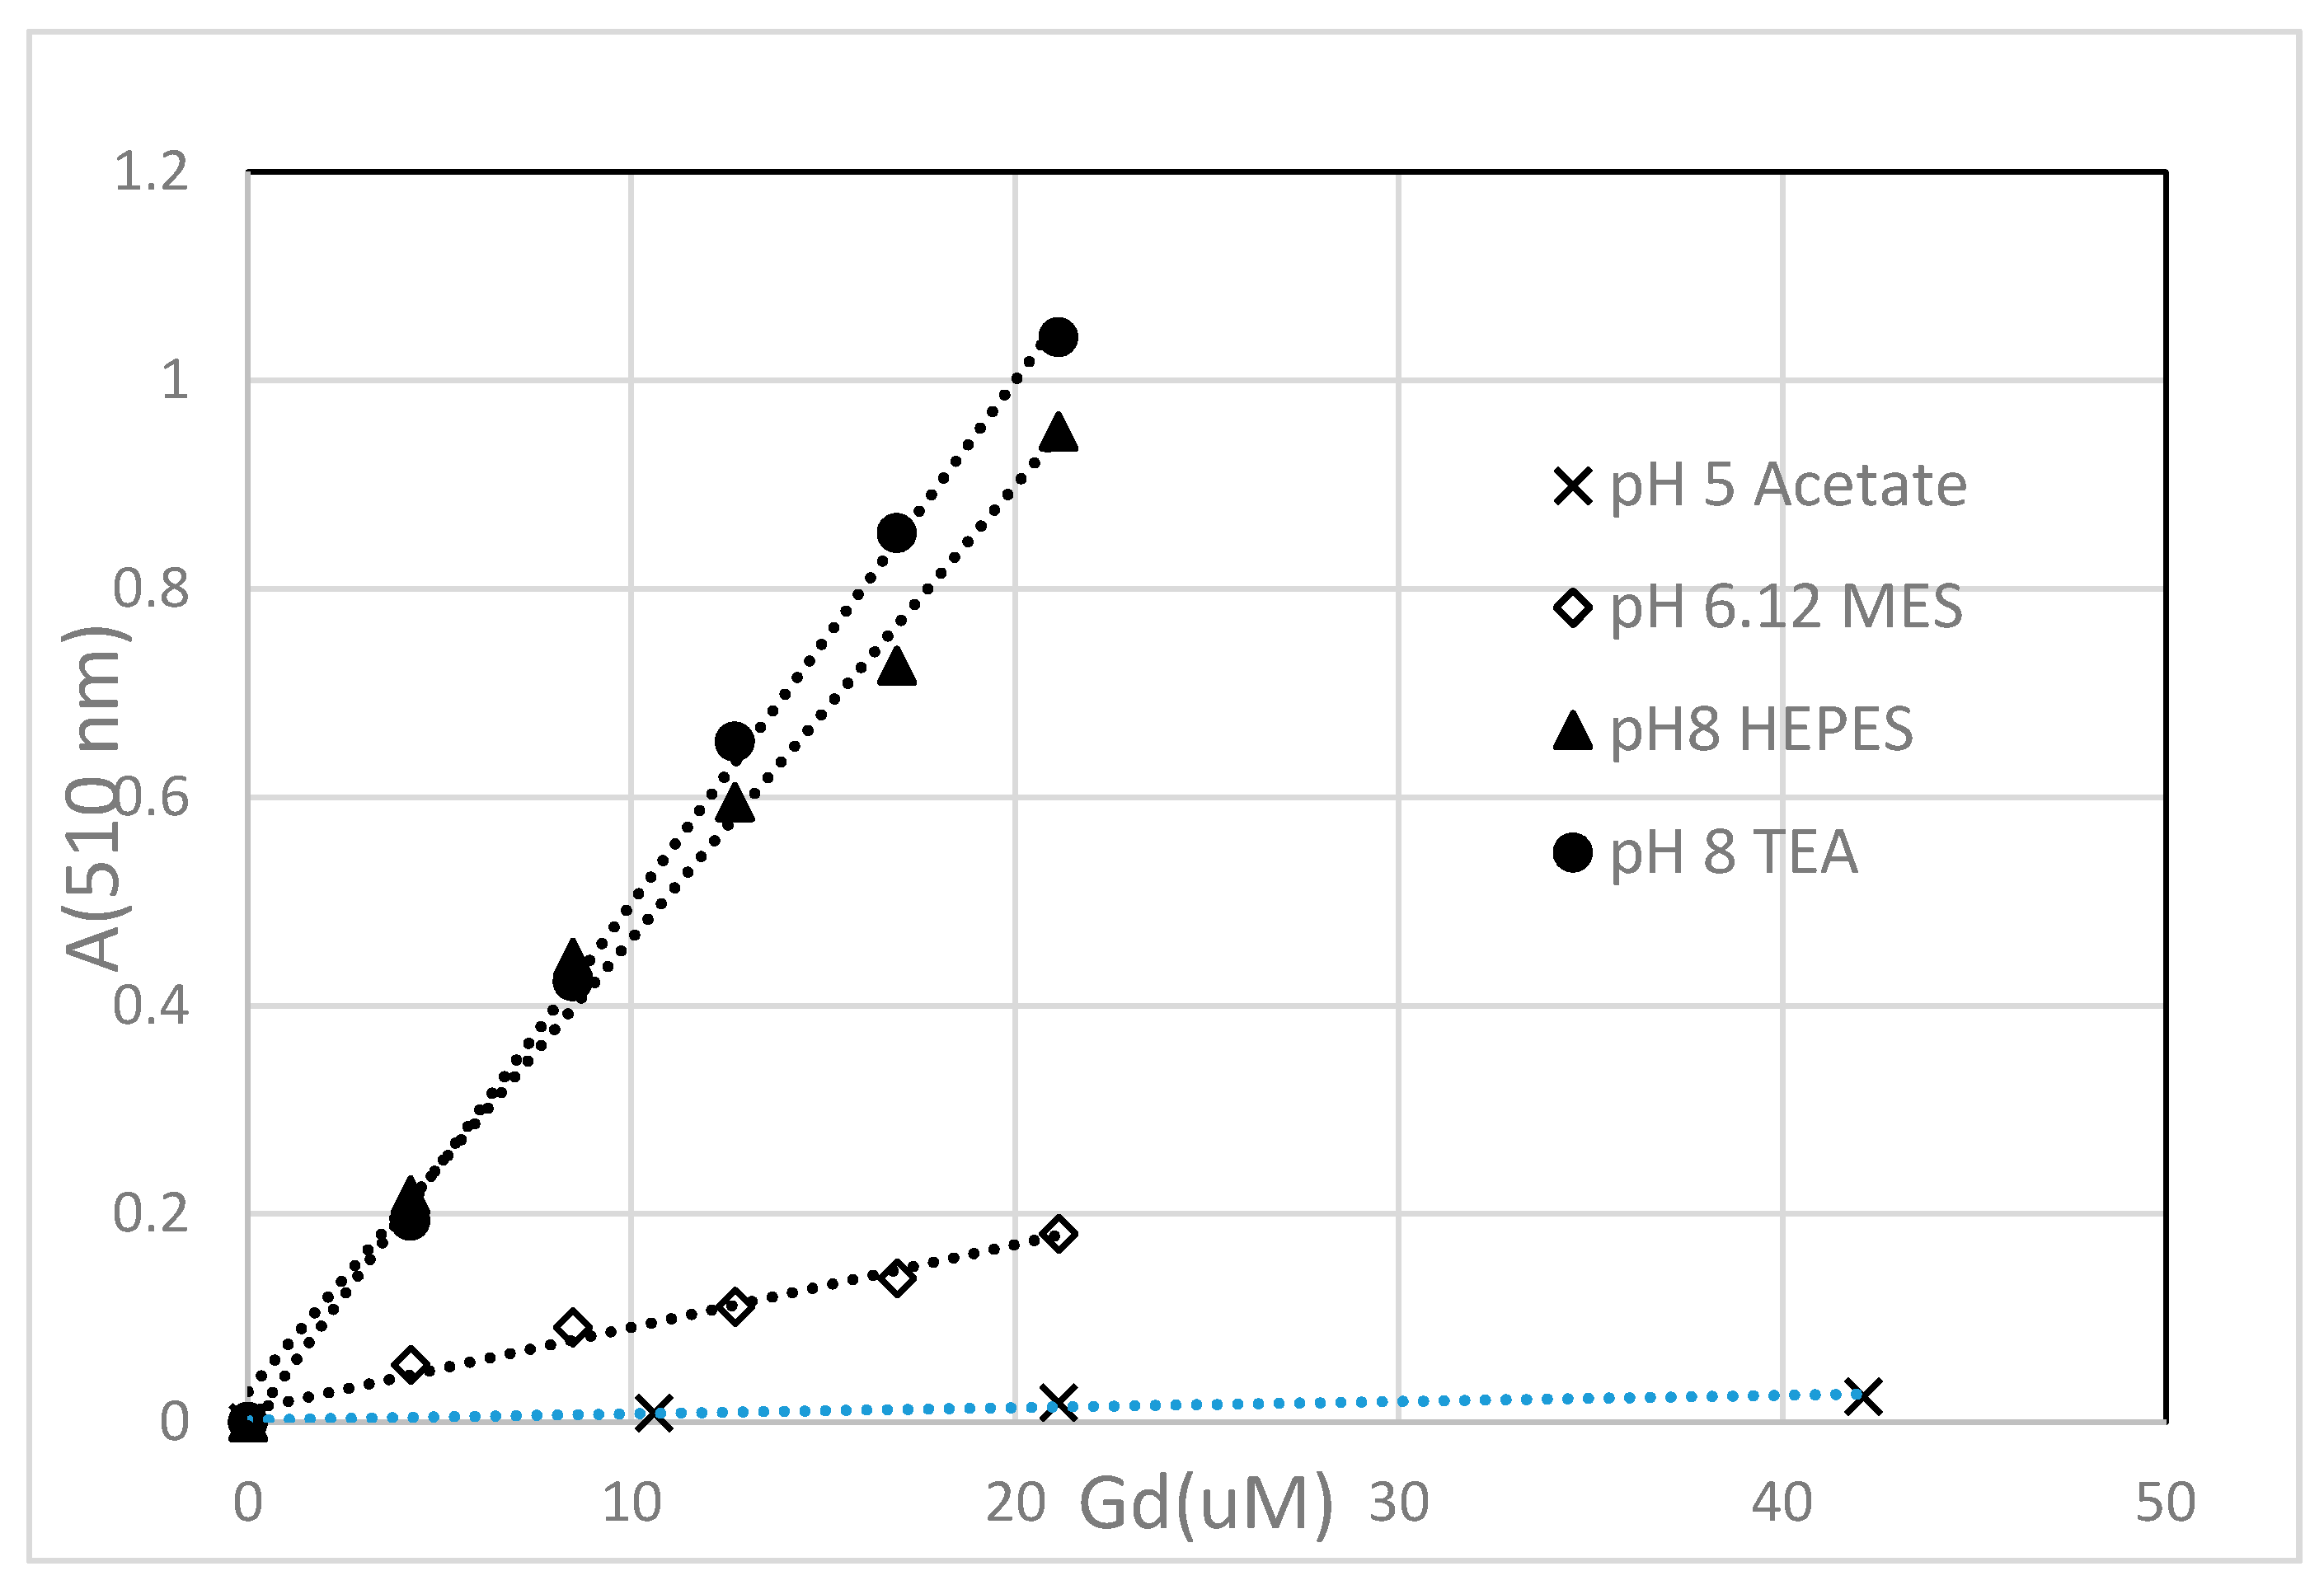
For this study, most of the measurements were conducted at pH 8, where the response was favorable and hydrolysis was not extensive due to the presence of PAR concentrations that were in significant excess over the total Gd3+ concentrations. The objective was that PAR concentrations should be sufficient to assure that Gd(PAR)2 formation was essentially quantitative. The linearity of the absorbance at 510 nm with total Gd3+ concentration indicates that these conditions were achieved. With 0.6 mL of the 1.2 mM PAR reagent added to the cuvette, the resulting concentration of PAR was 0.240 mM. As a result, the PAR: Gd3+ ratio was greater than 10 for the majority of these experiments.
The maximum absorbance occurred at 510 nm for the Gd
3+-PAR complex at all pH values investigated. Calibration plots for four buffers are shown in
Figure 1, and demonstrate that the response at 510 nm increased linearly with Gd
3+ concentration in all four buffers. In addition, we found that the Gd
3+ response was significantly higher using the pH 8 TEA buffer than in the pH 8 HEPES buffer.
3.2. Gd3+: PAR Complex Ratio Investigation
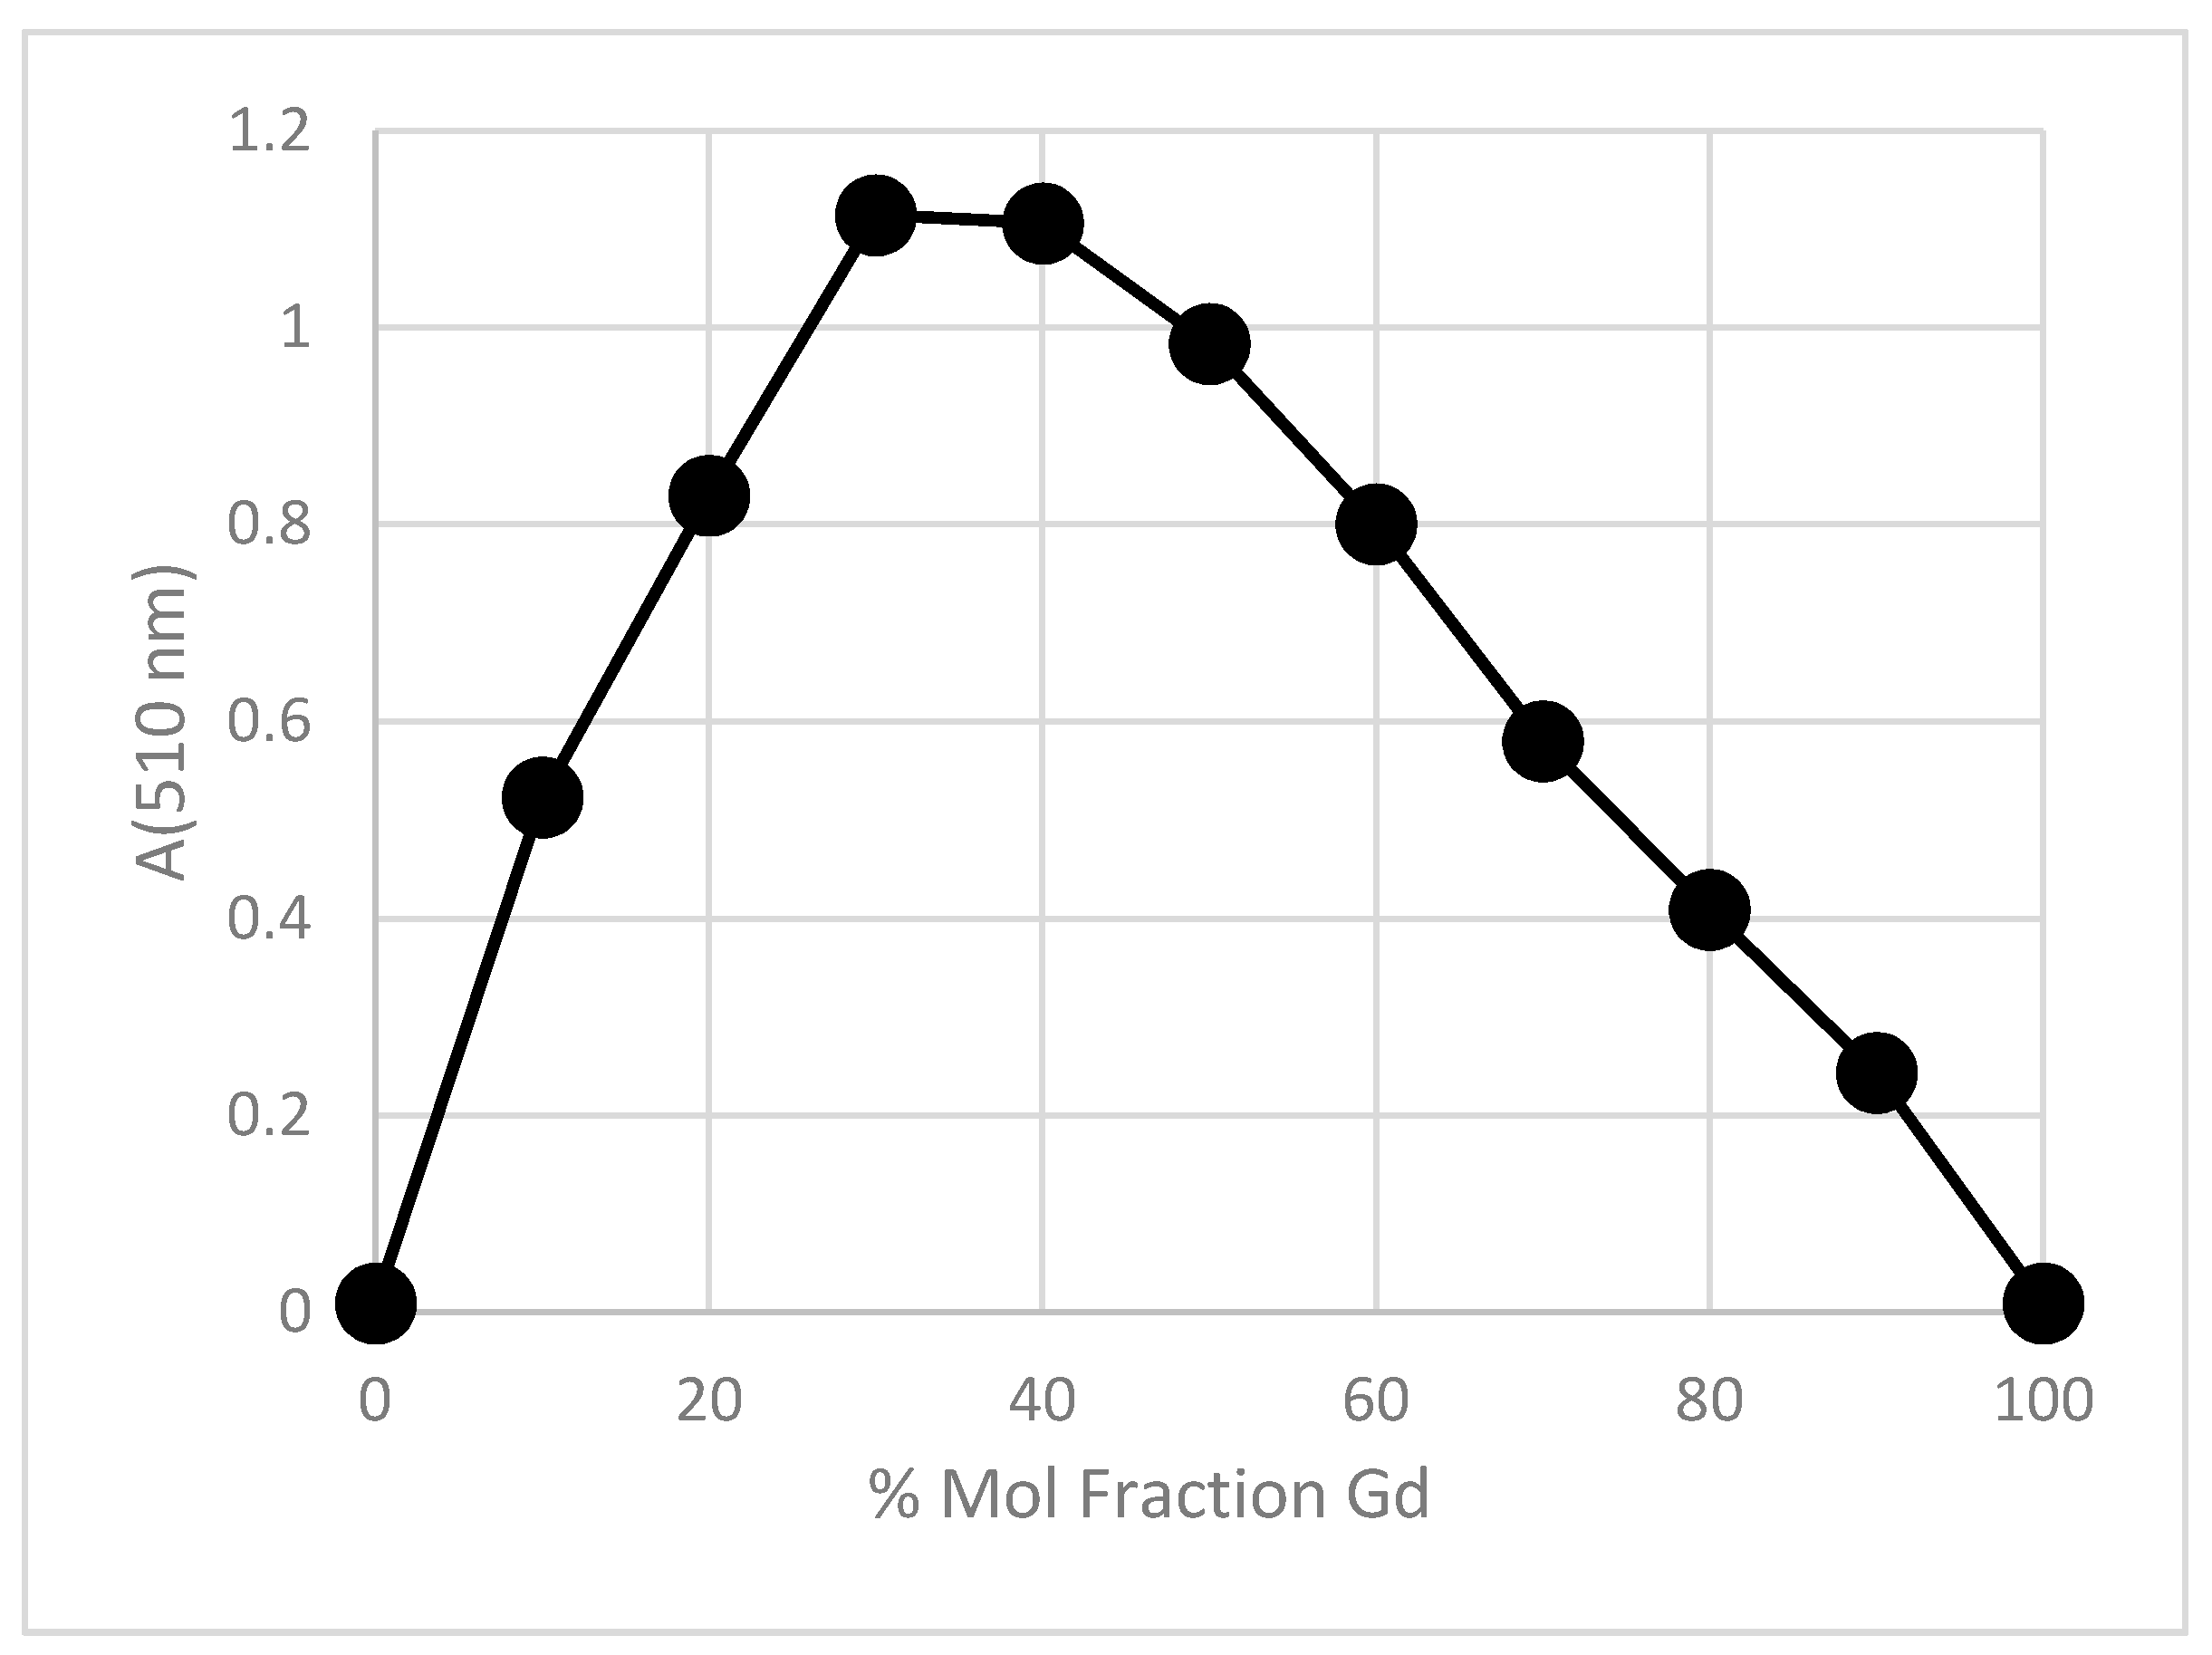
In order to establish the stoichiometry of the Gd
3+–PAR complex, the method of continuous variation was performed in 0.100 M TEA buffer adjusted to pH 8. A constant volume of 3.00 mL was maintained in the cuvette during these measurements. The total PAR plus Gd
3+ concentration was maintained at 1.00 × 10
−4 M, while the mole ratio of Gd
3+: PAR was varied from 0:1 to 1:0. The results are shown in
Figure 2.
These results are clear evidence that the 1:2 complex predominates under our experimental conditions. Experiments with the HEPES buffer also support the 1:2 complex. As noted above, the response (absorbance intensities) with the TEA buffer is higher than with the HEPES buffer. Although HEPES is generally considered to have a negligible interaction with metal cations, while TEA buffer is known to form metal complexes, it is clear that in this application, the formation of the PAR complex with Gd
3+ was evidently more favorable in TEA [
26]. There is no clear explanation for this, other than possible reduced interference of hydrolysis and adsorption in TEA. As a result of these observations, most of our experiments were conducted using the TEA buffer.
In order to determine the absorptivity of the Gd(PAR)2 complex, the following experiment was performed. A stock solution of 1.2 mM PAR in 100 mM TEA buffer (pH 8) was prepared. A series of calibration experiments was performed at pH 8 (TEA buffer) using variable PAR concentrations. The response factor for these calibrations was found to be constant with a PAR concentration above 0.200 mM. Therefore a PAR concentration of 0.240 mM was selected for these studies. With a PAR concentration of 0.240 mM, the above experiment indicates that Gd3+ is essentially quantitatively converted to the Gd(PAR)2 complex and the slope of the absorbance at 510 nm against gadolinium(III) concentrations was taken as the extinction coefficient for this complex. An average molar absorptivity (extinction coefficient) of 6.54(±0.15) × 104 M−1 was measured.
The response factor at 0.240 mM PAR was re-measured before each experiment and did vary ±5%. The variation may be instrumental in origin or due to small variations in the buffer pH or temperature. Using this extinction coefficient estimate, the MCV results were utilized to estimate the stability constant for the PAR complex by optimizing the fit of a simple mathematical model to these measurements. The absorbance at 510 nm was converted to complex concentration and the concentration of unbound PAR was calculated by mass balance. These measurements were fit to a speciation model as outlined below. In this exercise, only the first and second hydrolysis of Gd
3+ were included in the analysis [
5]. The hydrolysis constants have been estimated in previous studies using potentiometric methods and estimates for the second hydrolysis, constant, are not as well established. In order to apply potentiometric methods to determine the hydrolysis constants, the concentration of Gd
3+ has to be at least on the order of mM. At these concentrations, the precipitation of Gd
3+ interferes with the determination of the second and third hydrolysis constant. In addition, formation of dimeric and trimeric Gd
3+ species is also a possibility [
7,
27]. Under the high PAR concentration conditions used in this investigation, hydrolysis made a very small contribution to Gd
3+ speciation. We did not see any evidence of precipitation during our measurements.
Our simple model that considers “free Gd
3+, the first and second hydrolysis product and the PAR complex, to be the only significant Gd
3+ species in solution. The MCV results were fit to Equation (1). In Equation (1), Gd
t is the total Gd
3+ concentration and β
PAR is the stability constant for the formation of Gd(PAR)
2. The curve was fit using CurveExpert Professional Software 2.6.5 (Hyams Development). Similar results were obtained with using the Excel Solver to minimize the difference in the sum of square differences between the concentration of Gd(PAR)
2 and the calculated concentration of Gd(PAR)
2.
The MCV data can be fit to Equation (1) by optimizing βpar. A best fit value of log βPAR = 9.51 ± 0.06 was determined by this method. This value was utilized to assign stability constants to other ligands. We are cognizant that this estimate for log βpar likely only applies to the conditions of this experiment. We have not made any attempt to determine the protonation state of this complex. However, our results did demonstrate that absorbance increased strongly with the increase in pH.
3.3. Gadolinium Interaction with Various Ligands
In order to demonstrate the feasibility of this experimental approach to estimate the stability constant of Gd3+ with various ligands, the following procedure was followed. The determination of the stability constant for Gd3+ with oxalate will serve as an example. A 21.1 uM solution of Gd3+ in 0.1 M TEA (pH 8) and 0.240 mM PAR was prepared. This was done with 2400 uL of 100 mM TEA buffer and 600 uL of 1.2 mM PAR that was dissolved in 100 mM TEA (total volume 3.00 mL). Using the value of βPAR for the formation of Gd(PAR)2, a “reasonable” preliminary assumption is that all of the Gd3+ in this solution is essentially Gd(PAR)2. A 0.200 M solution of sodium oxalate was prepared and added to the solution (2–5 uL at a time). The objective was to minimize any dilution during the addition of oxalate as a competitive ligand. The results show that oxalate (at the concentrations introduced) can compete for Gd3+.
In order to estimate the stability constant of Gd
+3 and oxalate, it was assumed that in this solution, Gd
3+ exists as the Gd(PAR)
2 complex or as an oxalate complex. The hydrolysis of Gd
3+ was ignored in this preliminary calculation. It was assumed that free Gd
3+ and Gd
3+ hydrolysis products were of minor importance. It was also assumed that GdOx
+ was the dominant oxalate complex. If this assumption is valid, the concentration of Gd(PAR)
2 is given by the following equation (to a good approximation).
Gd
t is the total amount of gadolinium in solution. [Gd(PAR)
2] is estimated from the absorbance at 510 nm. [PAR] in this equation is estimated from the mass balance and is given by subtracting the Gd(PAR)
2 concentration from the total concentration of PAR in the solution. As the β
ox << β
PAR for most of the plot [
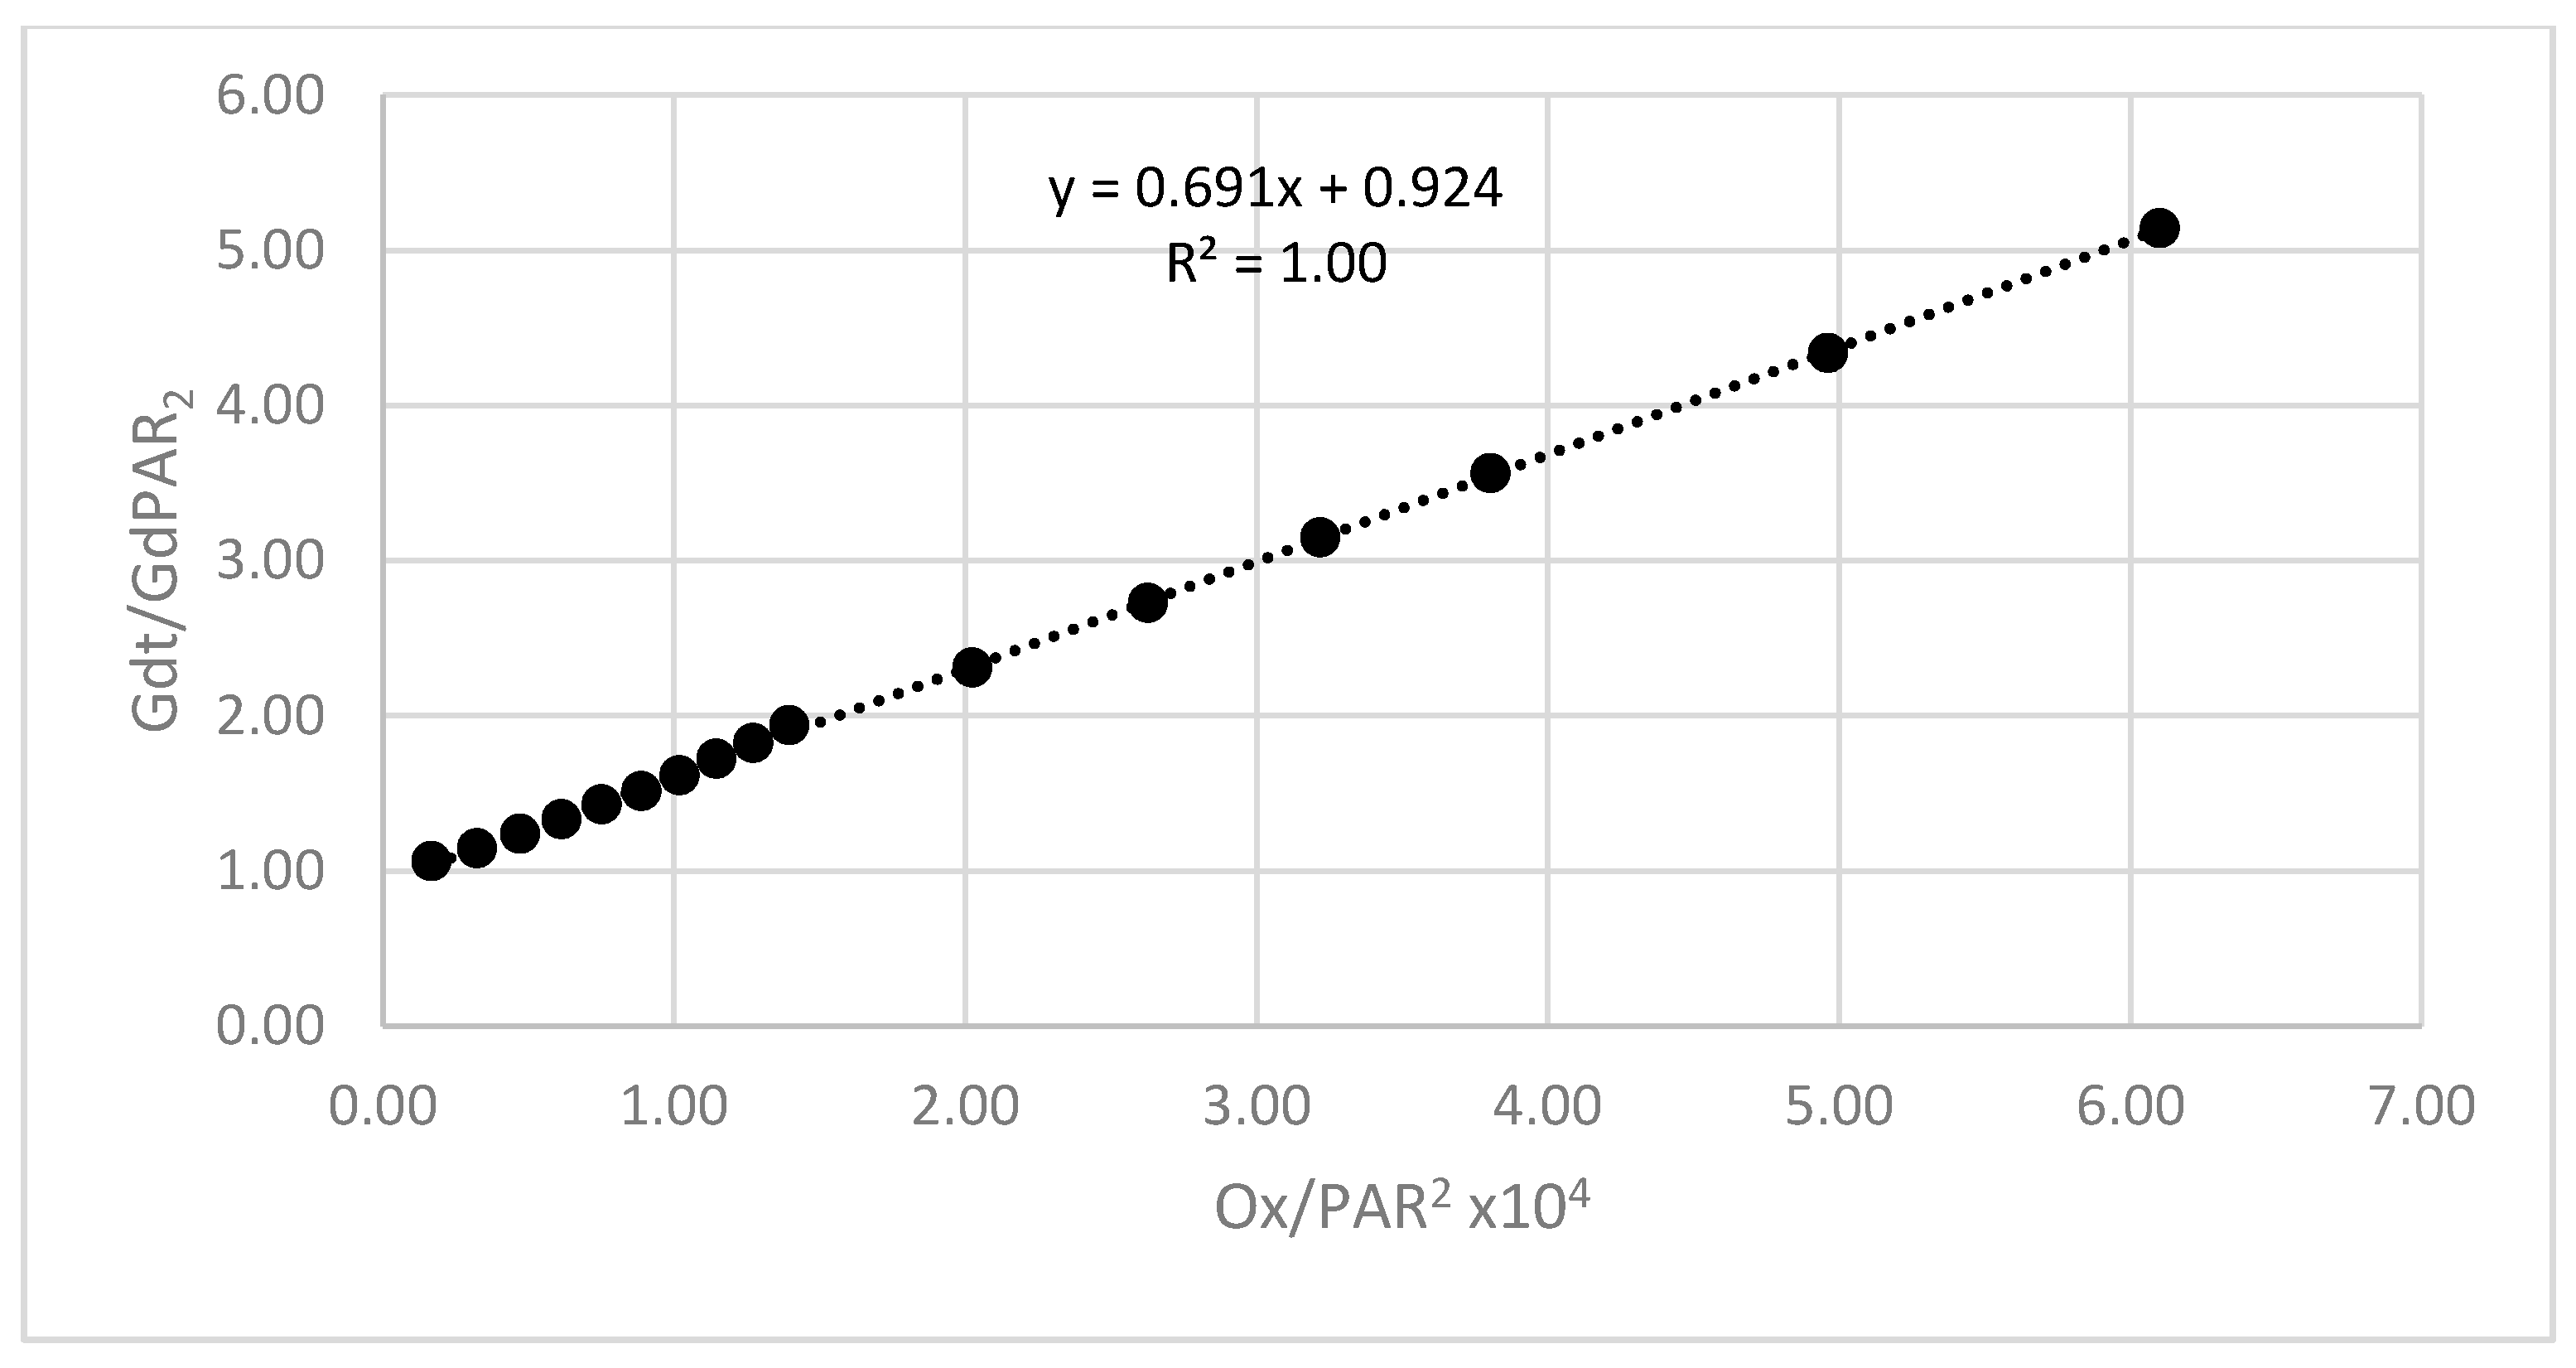
Ox2−] is equal to the total concentration of oxalate in the solution. This equation can be rearranged to:
The data from the above experiment were plotted according to the above equation in
Figure 3. The fact that the plot is linear indicates that the previous speciation assumptions were reasonable and the slope of this plot was used to determine a preliminary estimate for β
ox. This approach was utilized for obtaining preliminary estimates for all of the low molecular weight ligands that we examined.
From the slope of the plot, β
oxal was estimated as 10
5.02. This estimated value was refined by fitting the data to Equation (4) by using the software package CurveExpert Professional.
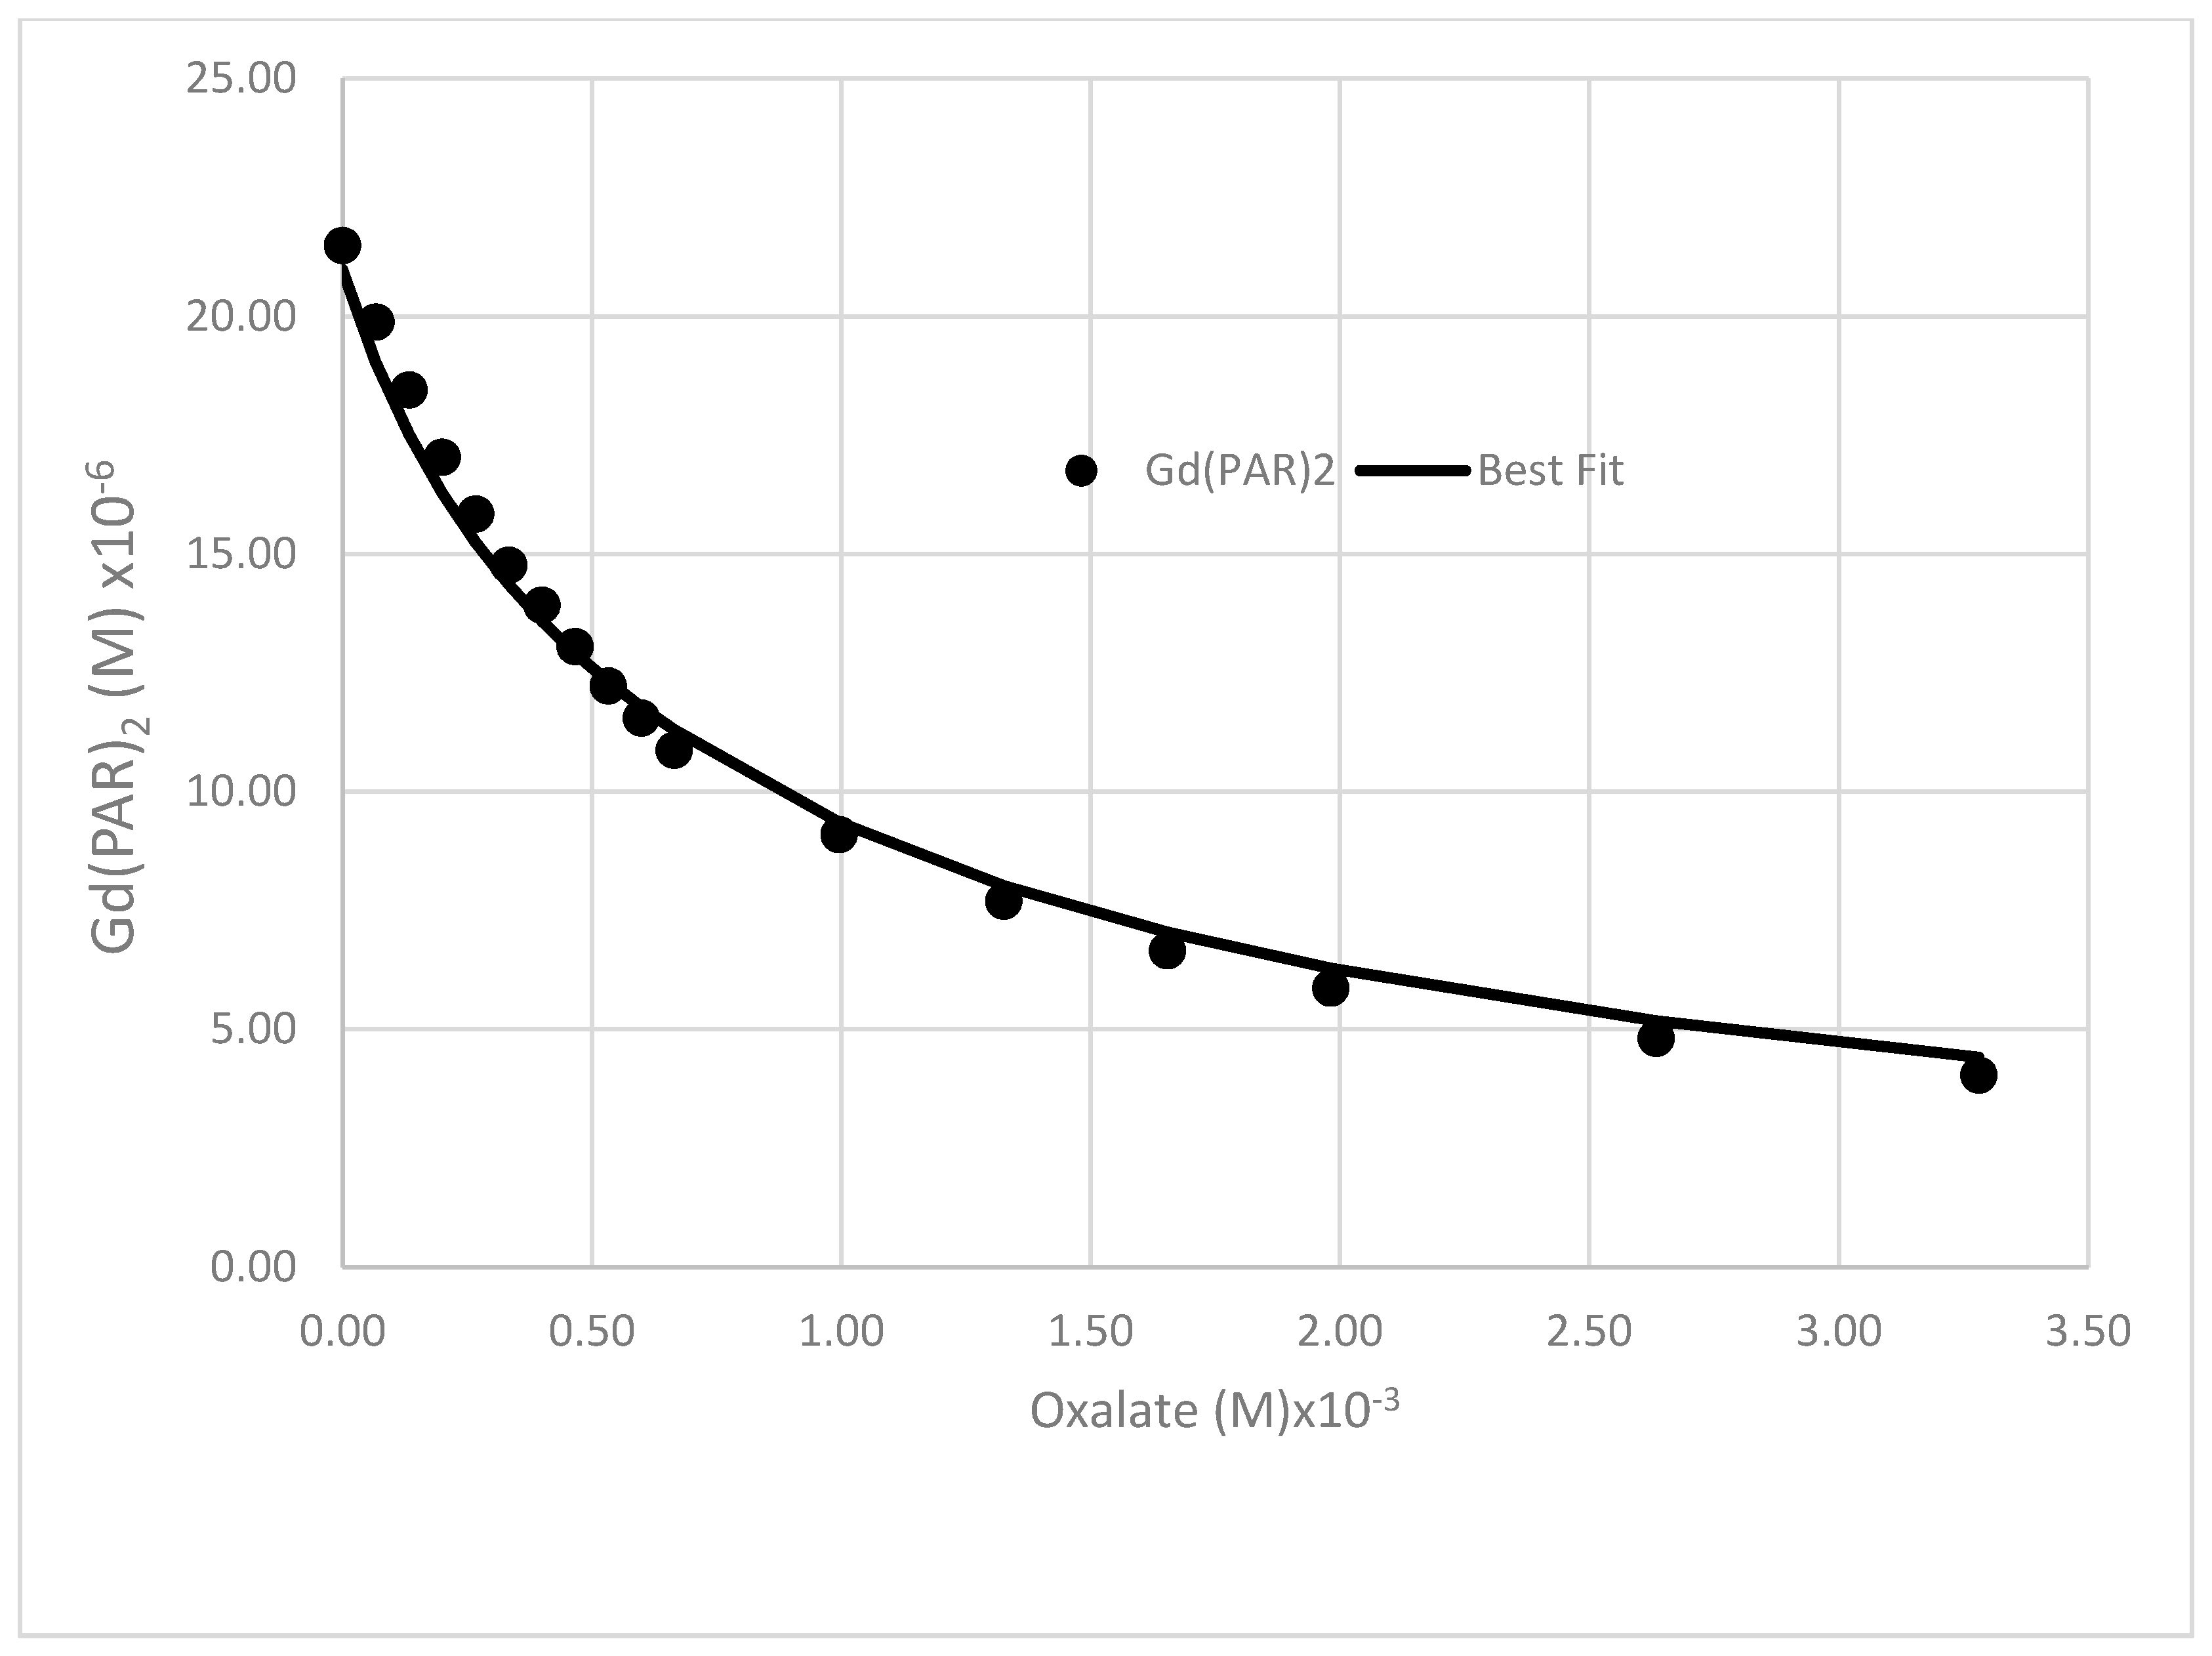
The decrease in the concentration of Gd(PAR)
2 resulting from the addition of oxalate to the solution is illustrated in the
Figure 4. Including a bis–oxalato complex did not improve the fit. If Gd(
Ox)
2− exists, it is clearly a minor species under these conditions. The value for the GdOx
+ stability constant (log β
oxal = 4.96) obtained is of course conditional. This estimate procedure was simplified by the rather low pK
a values for oxalate, enabling us to consider all of the oxalate completely ionized at pH 8. This same approach could be utilized for the other low molecular weight organic acids examined in this study. We cannot rule out the occurrence of mixed complexes between oxalate and PAR. However, it is clear that our data reasonably fits this simplified model.
The results for other organic acids examined by this method are shown in
Table 1. The stability constants from Martel and Smith (1977) and Gustafsson [
28,
29] are shown for comparison. The carbonate stability constant was extrapolated from the stability constant incorporated into the Visual MINTEQ software [
29]. Extrapolation of the zero ionic strength value from Lee and Byrne (1993) [
30] resulted in a log K of 6.63. All of the results from this study were of the same order of magnitude and were well correlated (R = 0.94) with the literature results. Differences are likely a function of the experimental methods utilized.
Wood (1993) [
31] tabulated critical stability constants for rare earth element complexes with simple carboxylic acids at 25 °C and 1 bar. He reported a log β stability constant for oxalate and malonate of 6.68 (estimated by correlation) and 5.87, respectively at infinite dilution. Using the Davies equation to correct these values to 0.1 M ionic strength yielded values for oxalate and malonate of 5.39 and 4.59, respectively. The oxalate number was ~0.1 log units lower than this report, while the malonate value was considerably higher than our measurement based on competition with PAR.
The overall reasonable correlation between our results and previous measurements demonstrates that the competitive ligand approach can offer valuable insight into Gd3+ speciation in an aqueous solution in the presence of low molecular weight ligands. We next report the application of this method quantifying Gd3+ interaction with polyelectrolytes of environmental interest.
3.4. Tannic Acid
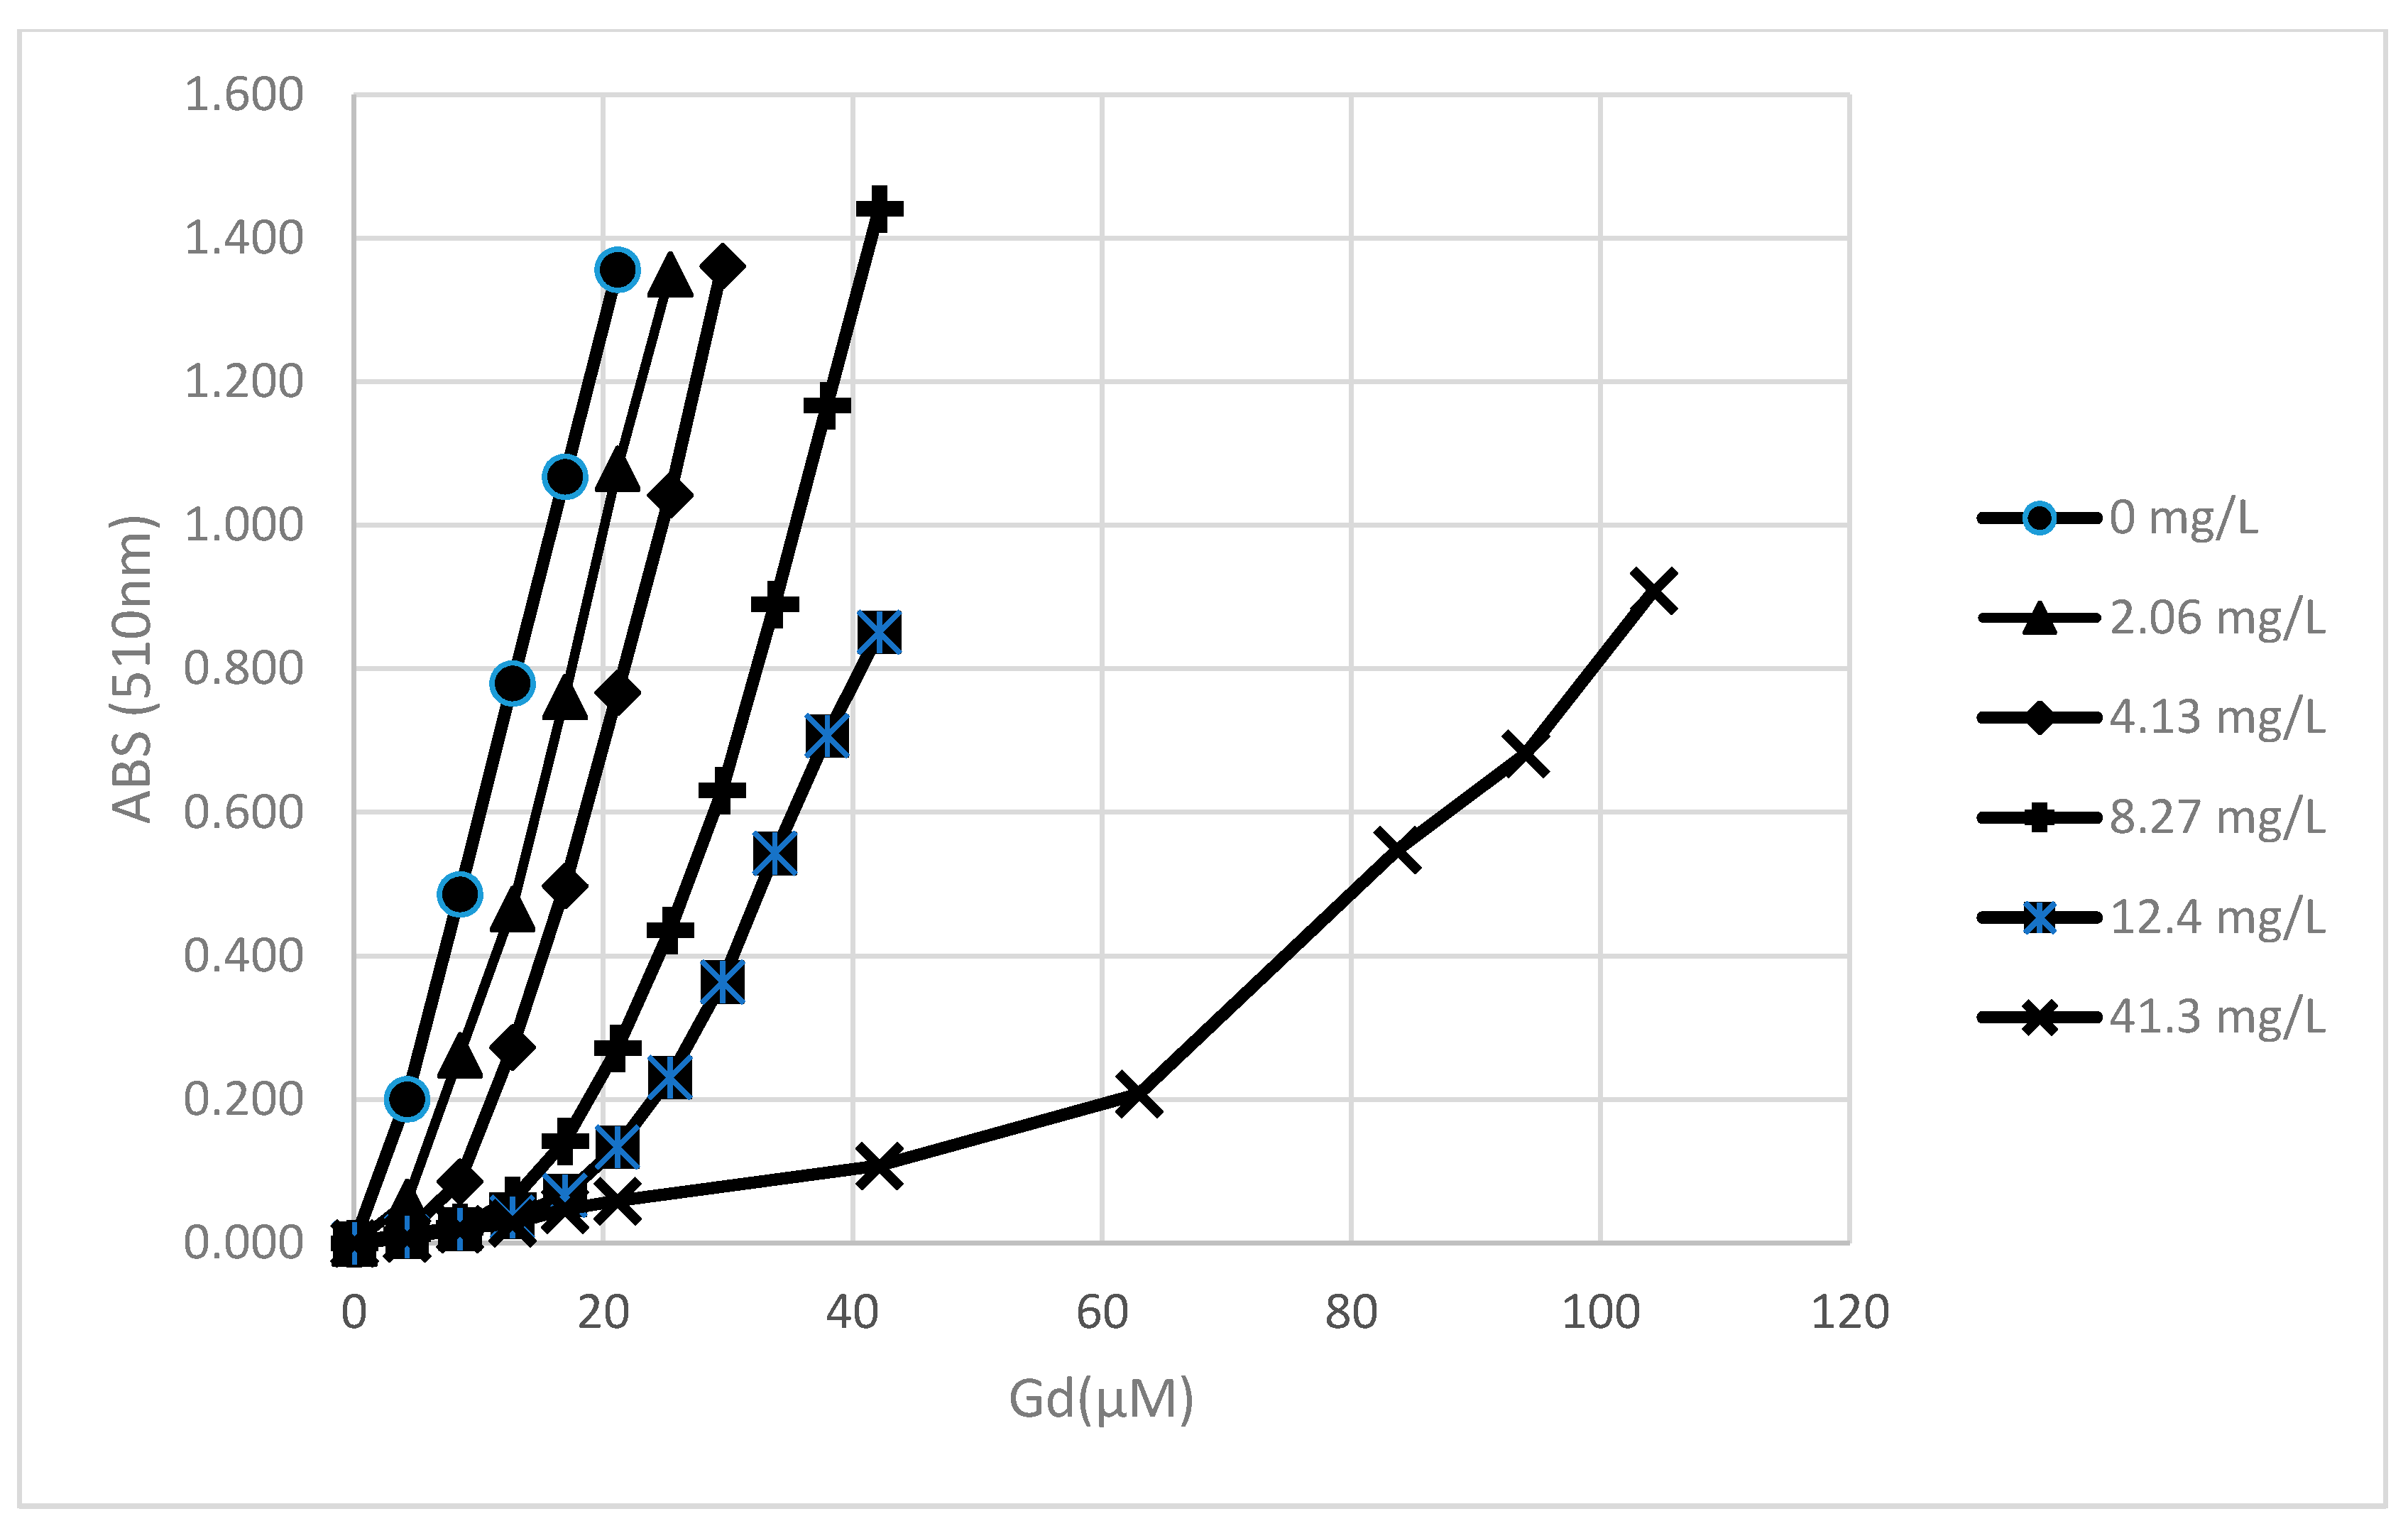
We tested tannic acid as a potential ligand for Gd3+ and as a humic acid analog. Tannic acid is a biopolymer comprised of polygallate esters with a carbohydrate core. It is a natural product that probably exists in soils and is likely incorporated into the humic fraction. The molecular weight of the material we utilized was reported by the manufacturer as 1701.2 g/mol.
Metal interaction with tannic acid should be primarily through the phenolic hydroxyl groups. Phenolic hydroxyl groups have been hypothesized by many workers to be important functionalities for the interaction of humic acids with various metals. We examined the influence of tannic acid at various concentrations on the Gd(PAR)
2 response. The solutions were prepared by mixing different proportions of a tannic acid stock solution (in TEA) with TEA pH 8 buffer. The total volume of these mixtures again amounted to 2400 µL. A 600 µL aliquot of 1.2 mM PAR in 0.1 M TEA pH 8 buffer was added and the mixture, which was placed in the cuvette. Gd
3+ was then titrated into the solution. The results for different concentrations of tannic acid at pH 8 are presented in
Figure 5.
For these experiments, we titrated considerably more Gd3+ into solution than in some of the other experiments reported. The shape of the titration curves were fairly consistent and appear to indicate a finite number of binding sites for Gd3+ on the tannic acid molecules. Note that the slope of the curve (response) increased as additional Gd3+ was added and as the complexing capacity of the dissolved tannic acid was apparently being exceeded. From the molar concentration of tannic acid, it is clear that more than one Gd3+ binds to each tannic acid molecule. This observation is an important consideration for modeling the interaction of Gd3+ with polyelectrolytes.
3.5. Gadolinium Interaction with Humic Acids
3.5.1. International Humic Acid Society (IHSS) Leonardite HA
Leonardites are oxidation products (weathering products) of lignite coals. The humic acids are extracted from the leonardite with alkali. A leonardite humic acid was purchased from the IHSS. A 116 mg/L humic acid stock solution were prepared in 0.1 M TEA pH 8 buffer. Various portions of TEA pH 8 and the humic stock solution were mixed, keeping the total volume 2400 μL. Then, 600 μL of 1.2 mM PAR in TEA pH 8 was added. The solution was titrated with Gd
3+. The results of this titration are presented in
Figure 6.
Clearly, the humic acid is capable of sequestering Gd3+, rendering it unavailable to the PAR. However, it is not a simple task to assign a stability constant to the Gd3+ humic complex. IHSS does provide estimates of carboxylic acid and phenolic group content for samples. However, assuming a molecular weight for the humic acid of ~1000 g/mol, it is apparent that like tannic acid, it is likely that more than one Gd+3 is bound per molecule of humic acid.
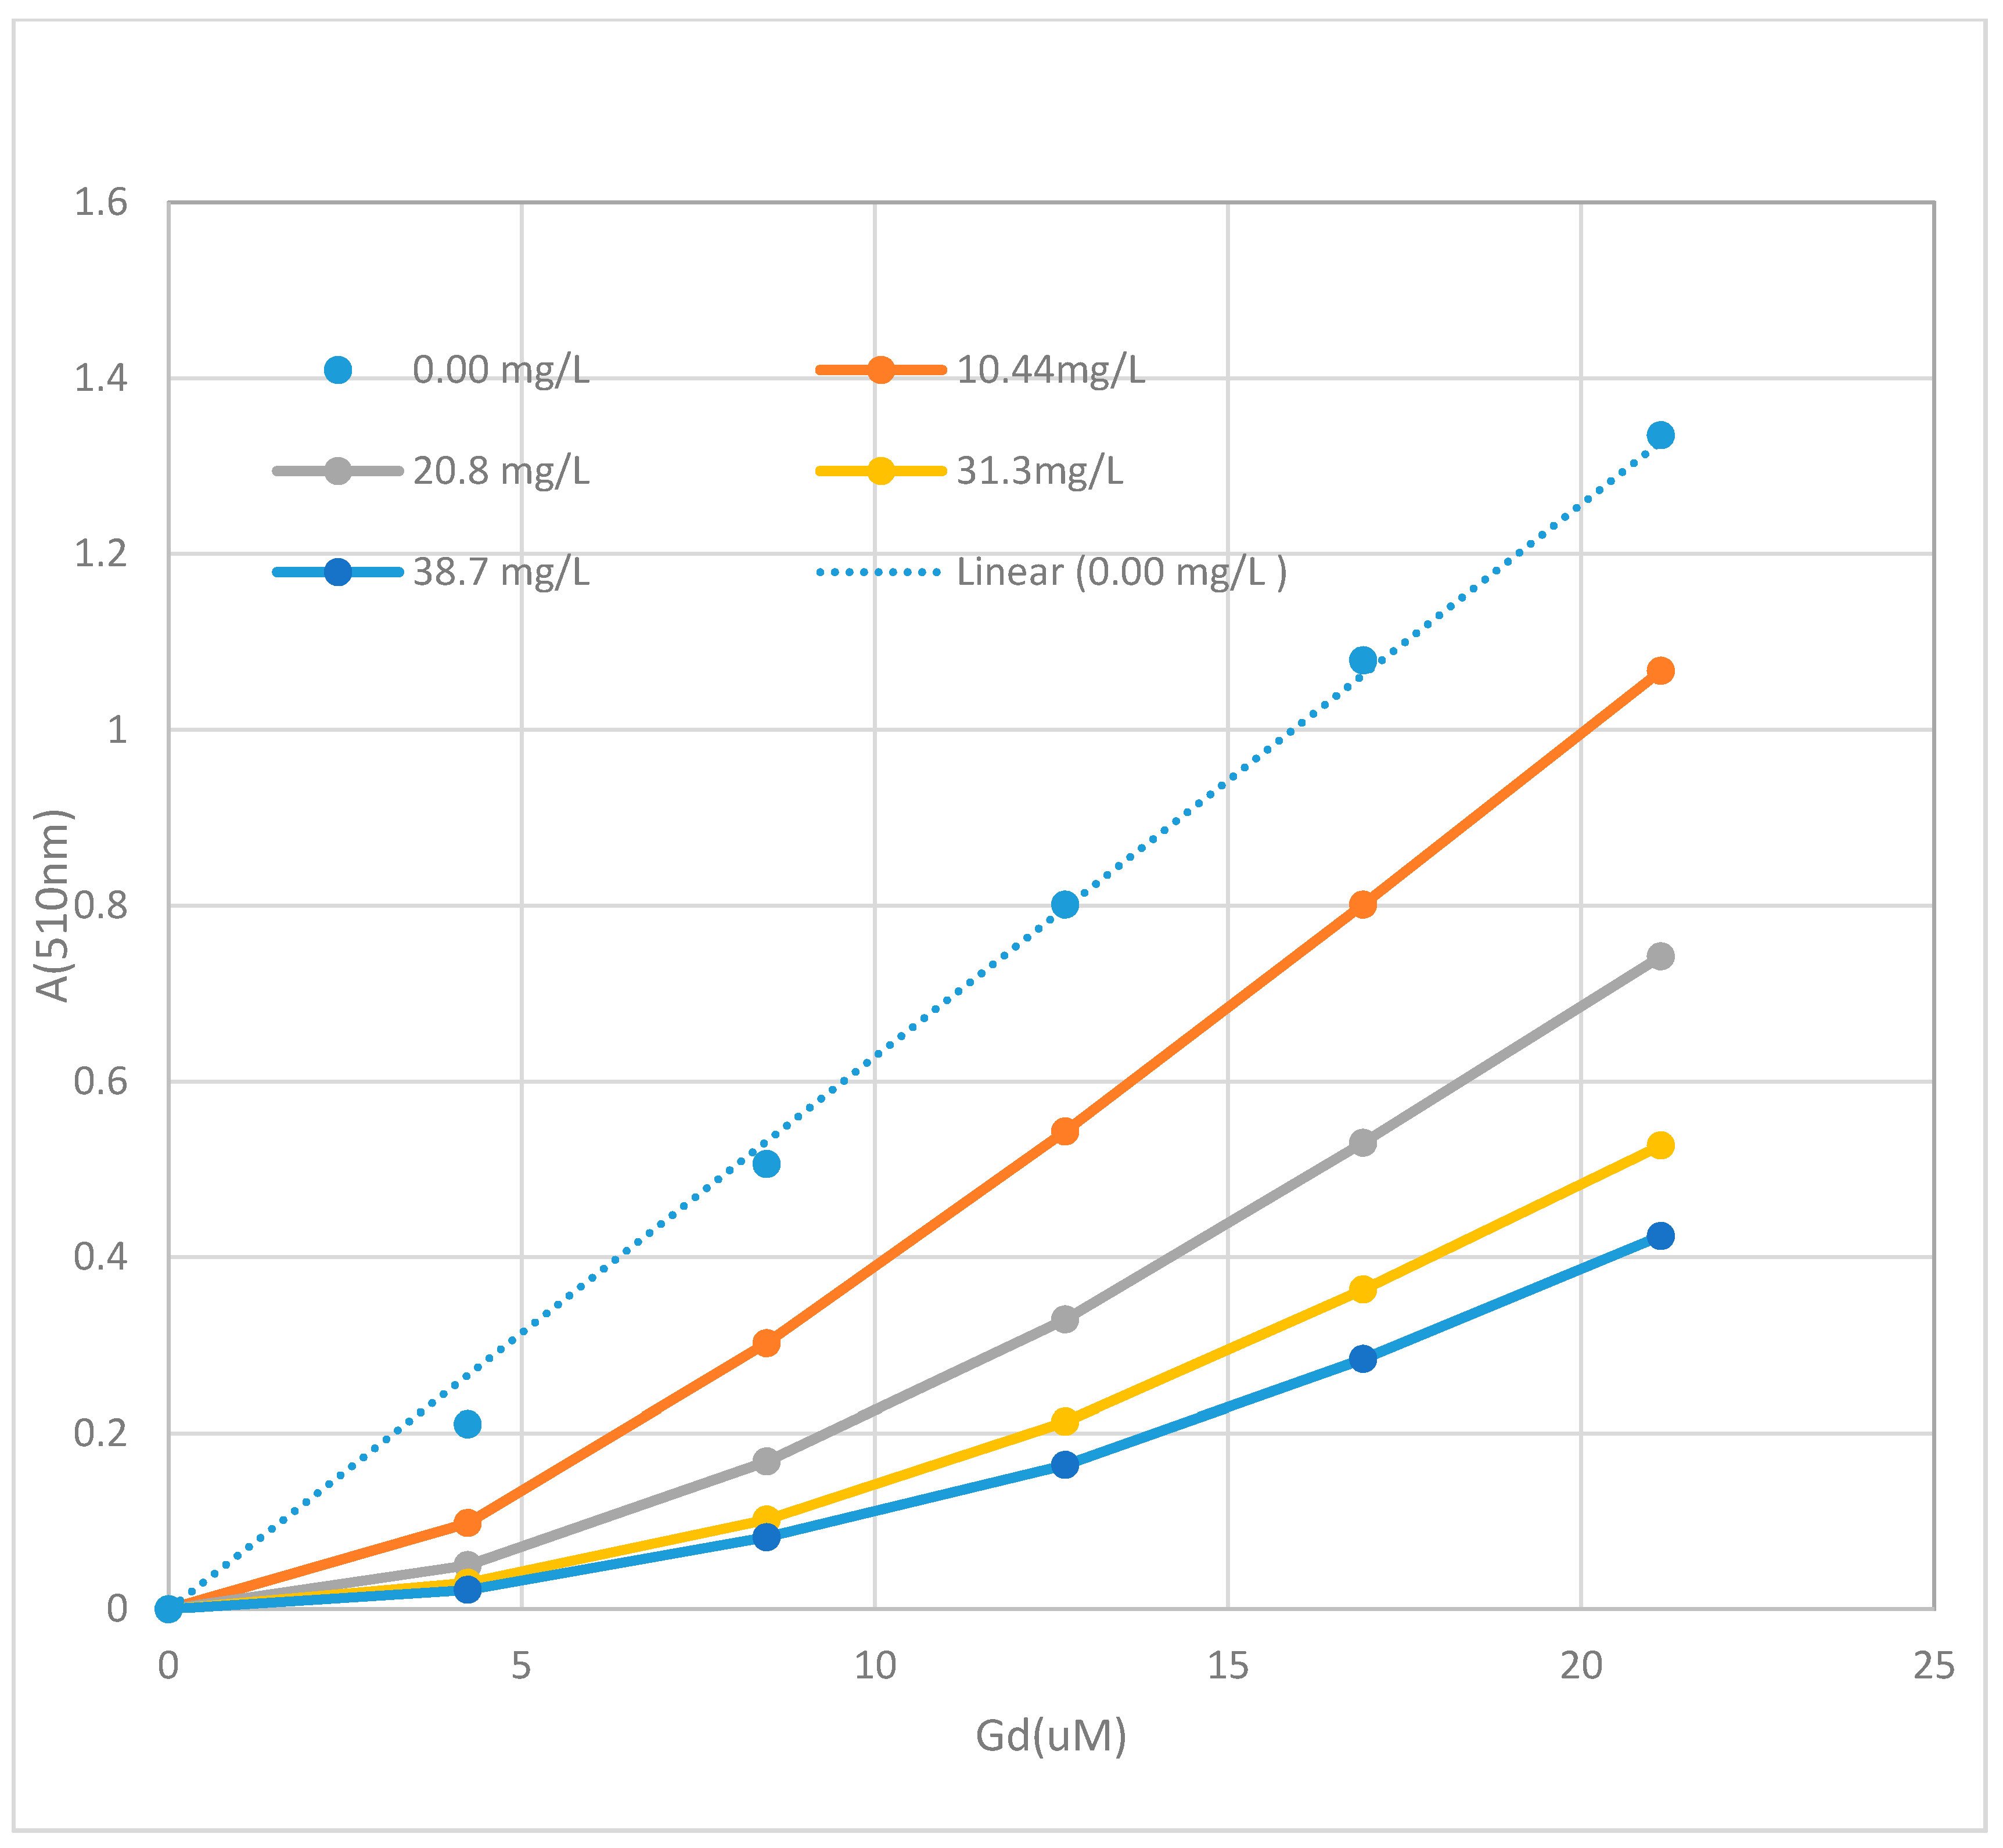
3.5.2. TeraVita LeonarditeIHSS
In our previous study (Steinberg and Hodge, 2018) [
32], we demonstrated the ability of TeraVita humic acid to complex copper as Cu
2+. In this study, experiments with this humic acid were done in TEA pH 8 buffer with a humic acid stock solution of 122 mg/L. Various portions of TEA pH 8 and the humic stock solution were mixed, keeping the total volume 2400 μL. Then, 600 μL of 1.2 mM PAR in TEA pH 8 was added. The solution was titrated with Gd
3+.
The addition of Gd
3+ was done at four different humic acid concentrations and the results are presented in
Figure 7. The suppression of the formation of Gd(PAR)
2 is apparent and increases with increasing humic acid concentration.
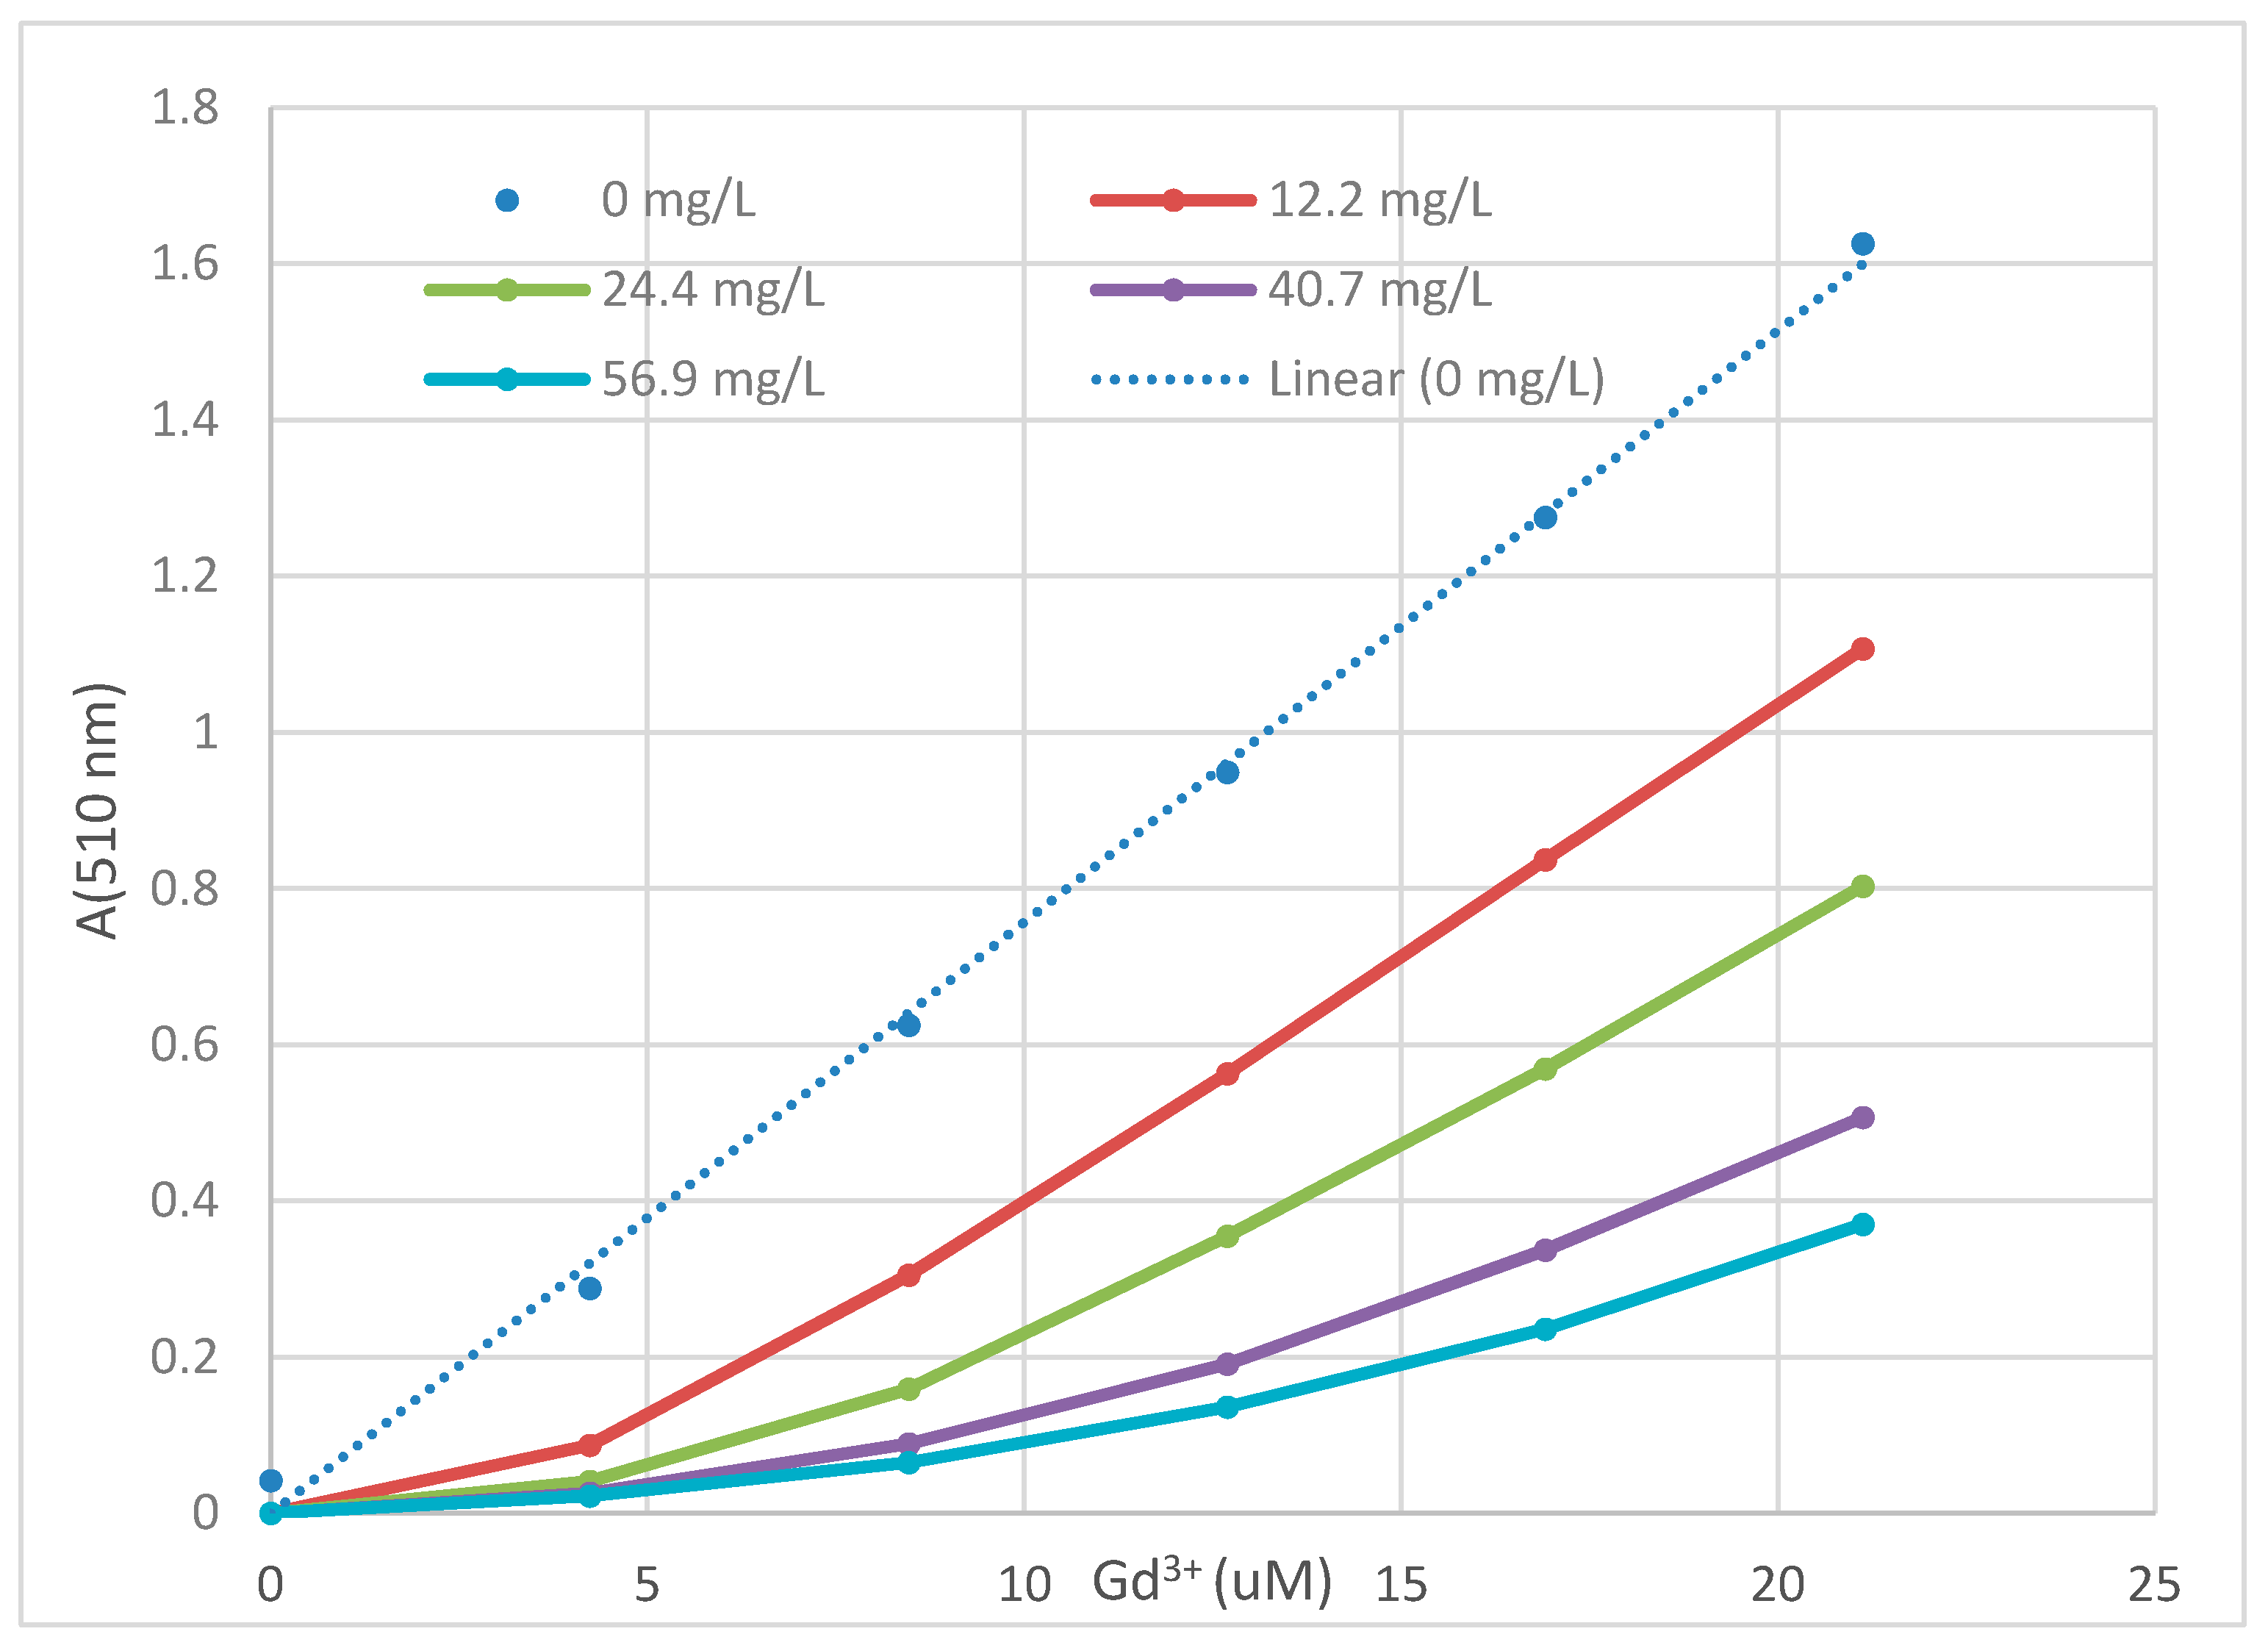
3.6. IHSS Pahokee Peat Humic Acid
The ability of the IHSS Pahokee peat humic acid to sequester gadolinium at pH 8 was tested. These experiments were done in TEA pH 8 buffer using 600 µL of 1.2 mM PAR. The data for the Pahokee peat humic acid is reported in
Figure 8. As the concentration of humic acid increases the Gd
3+ response is increasingly suppressed demonstrating the competitive complexation of Gd
3+ by the Pahokee peat humic acid.
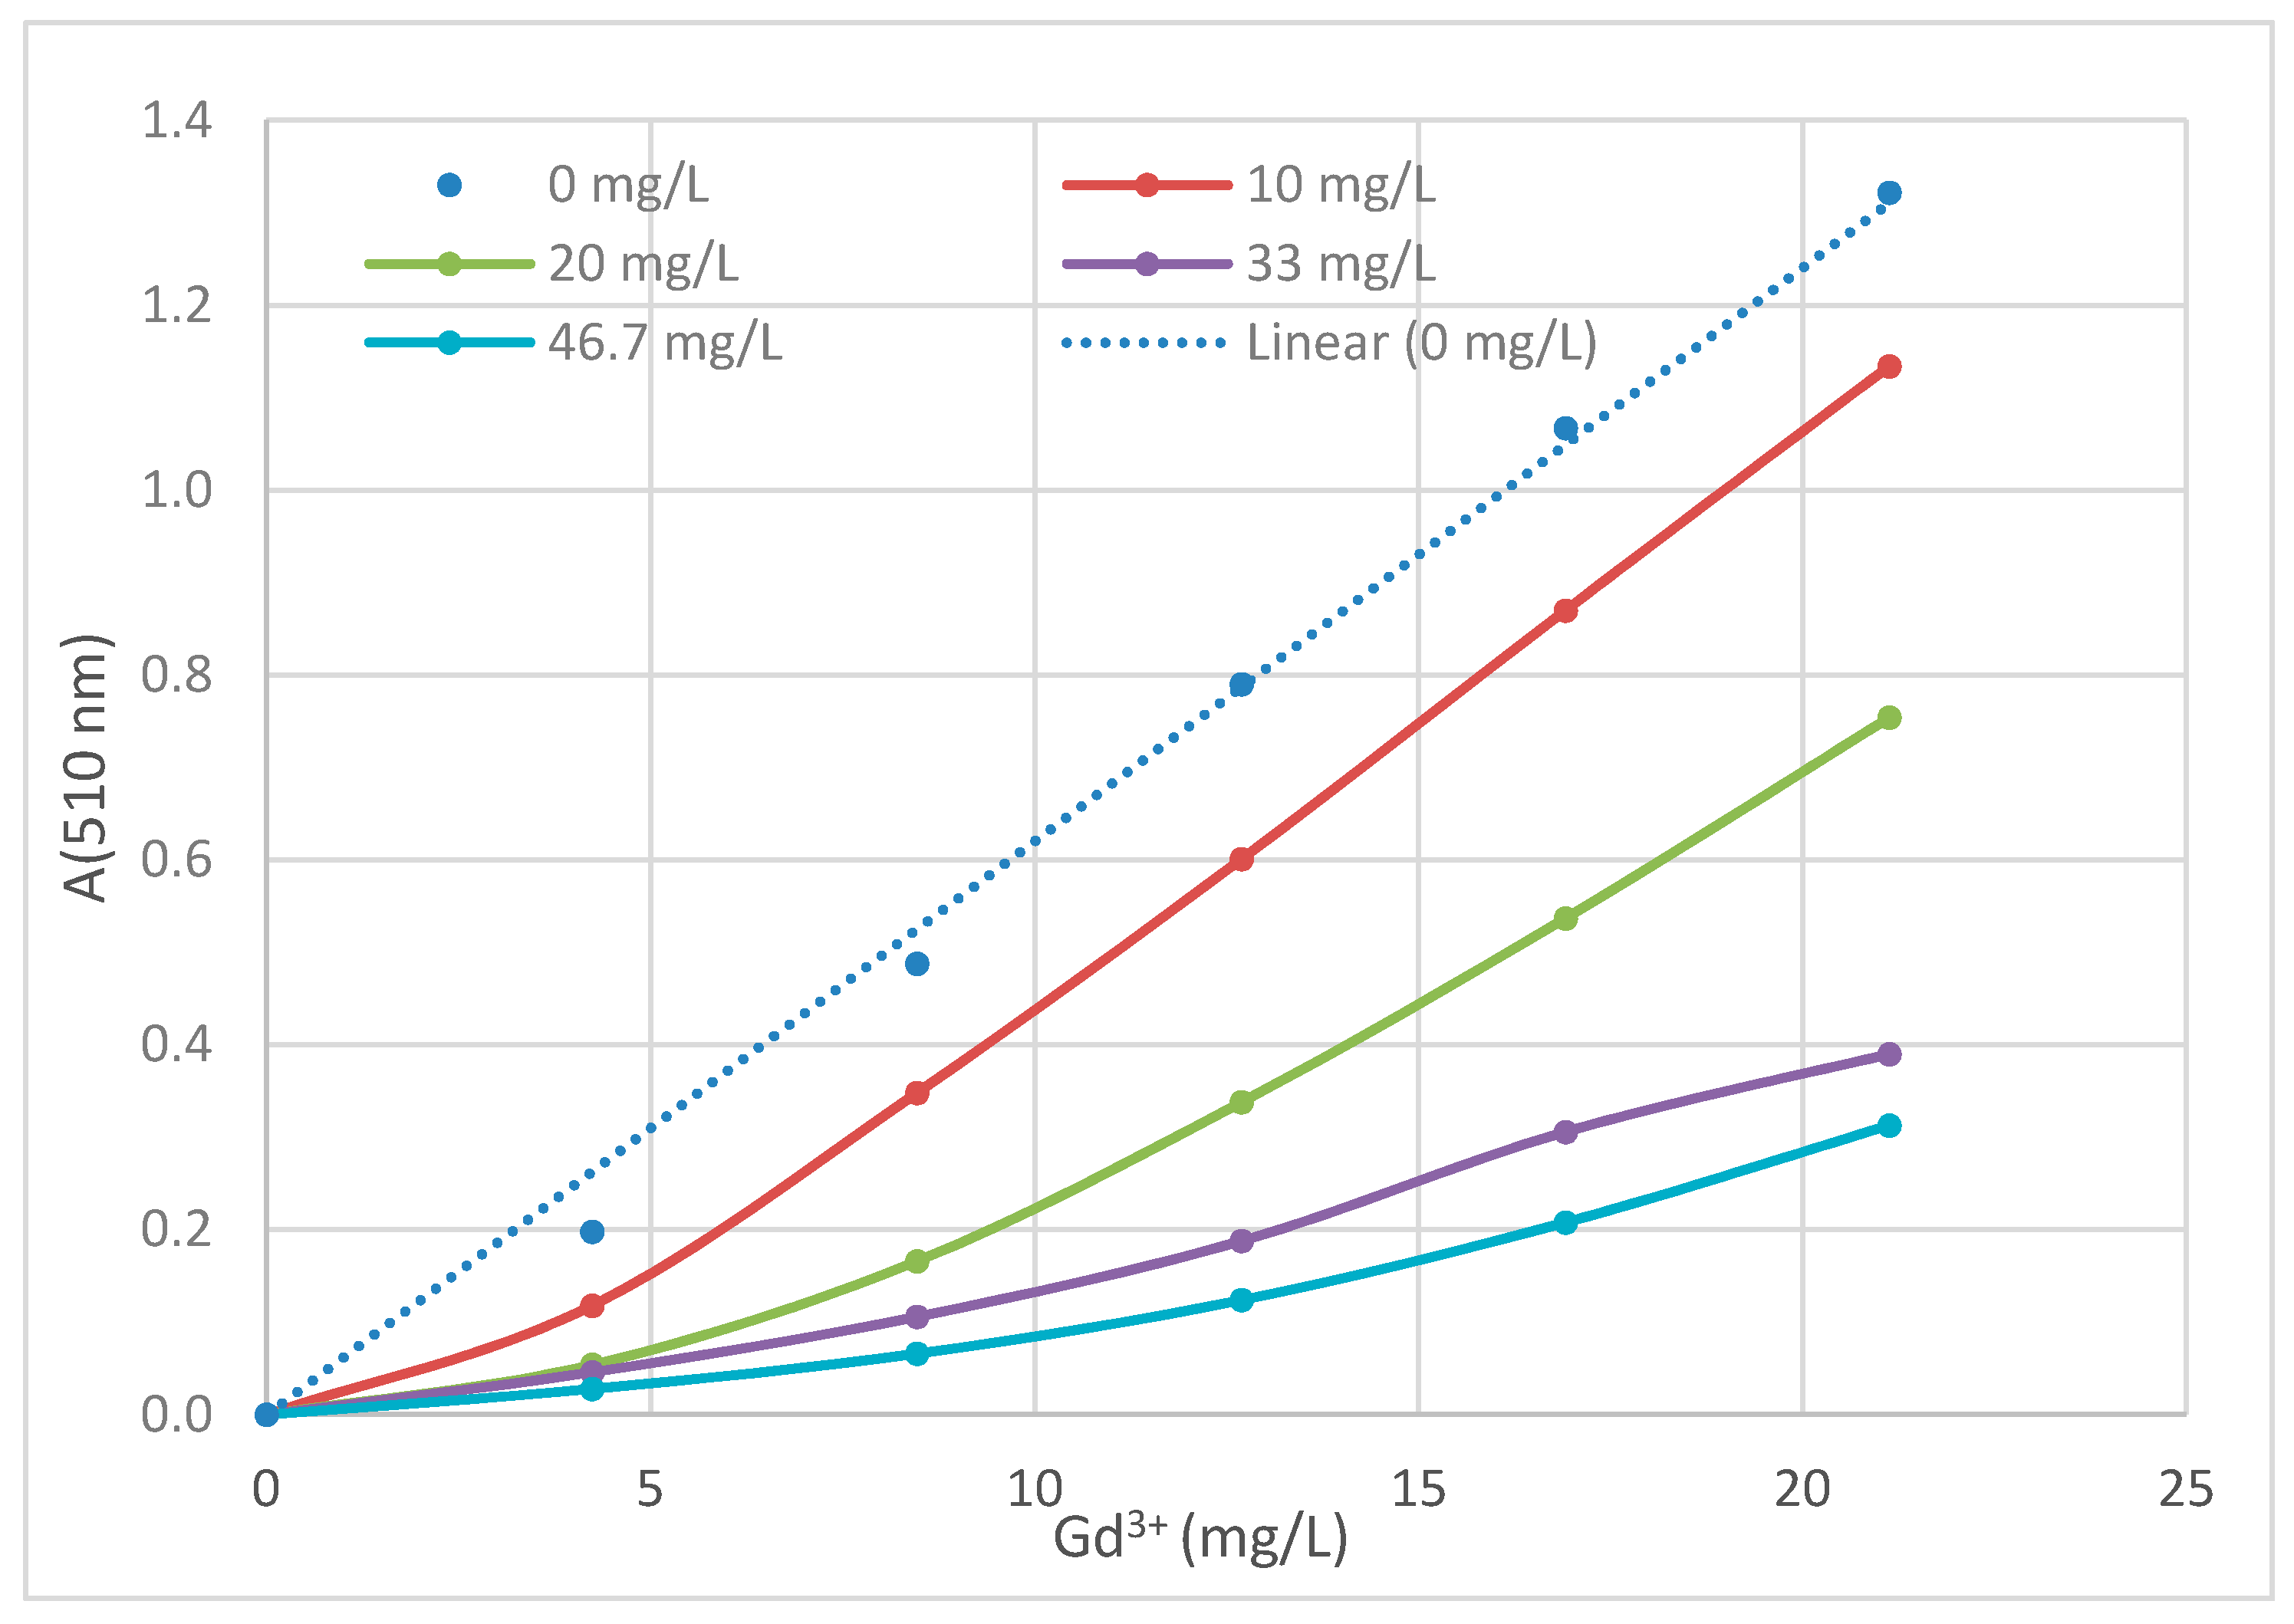
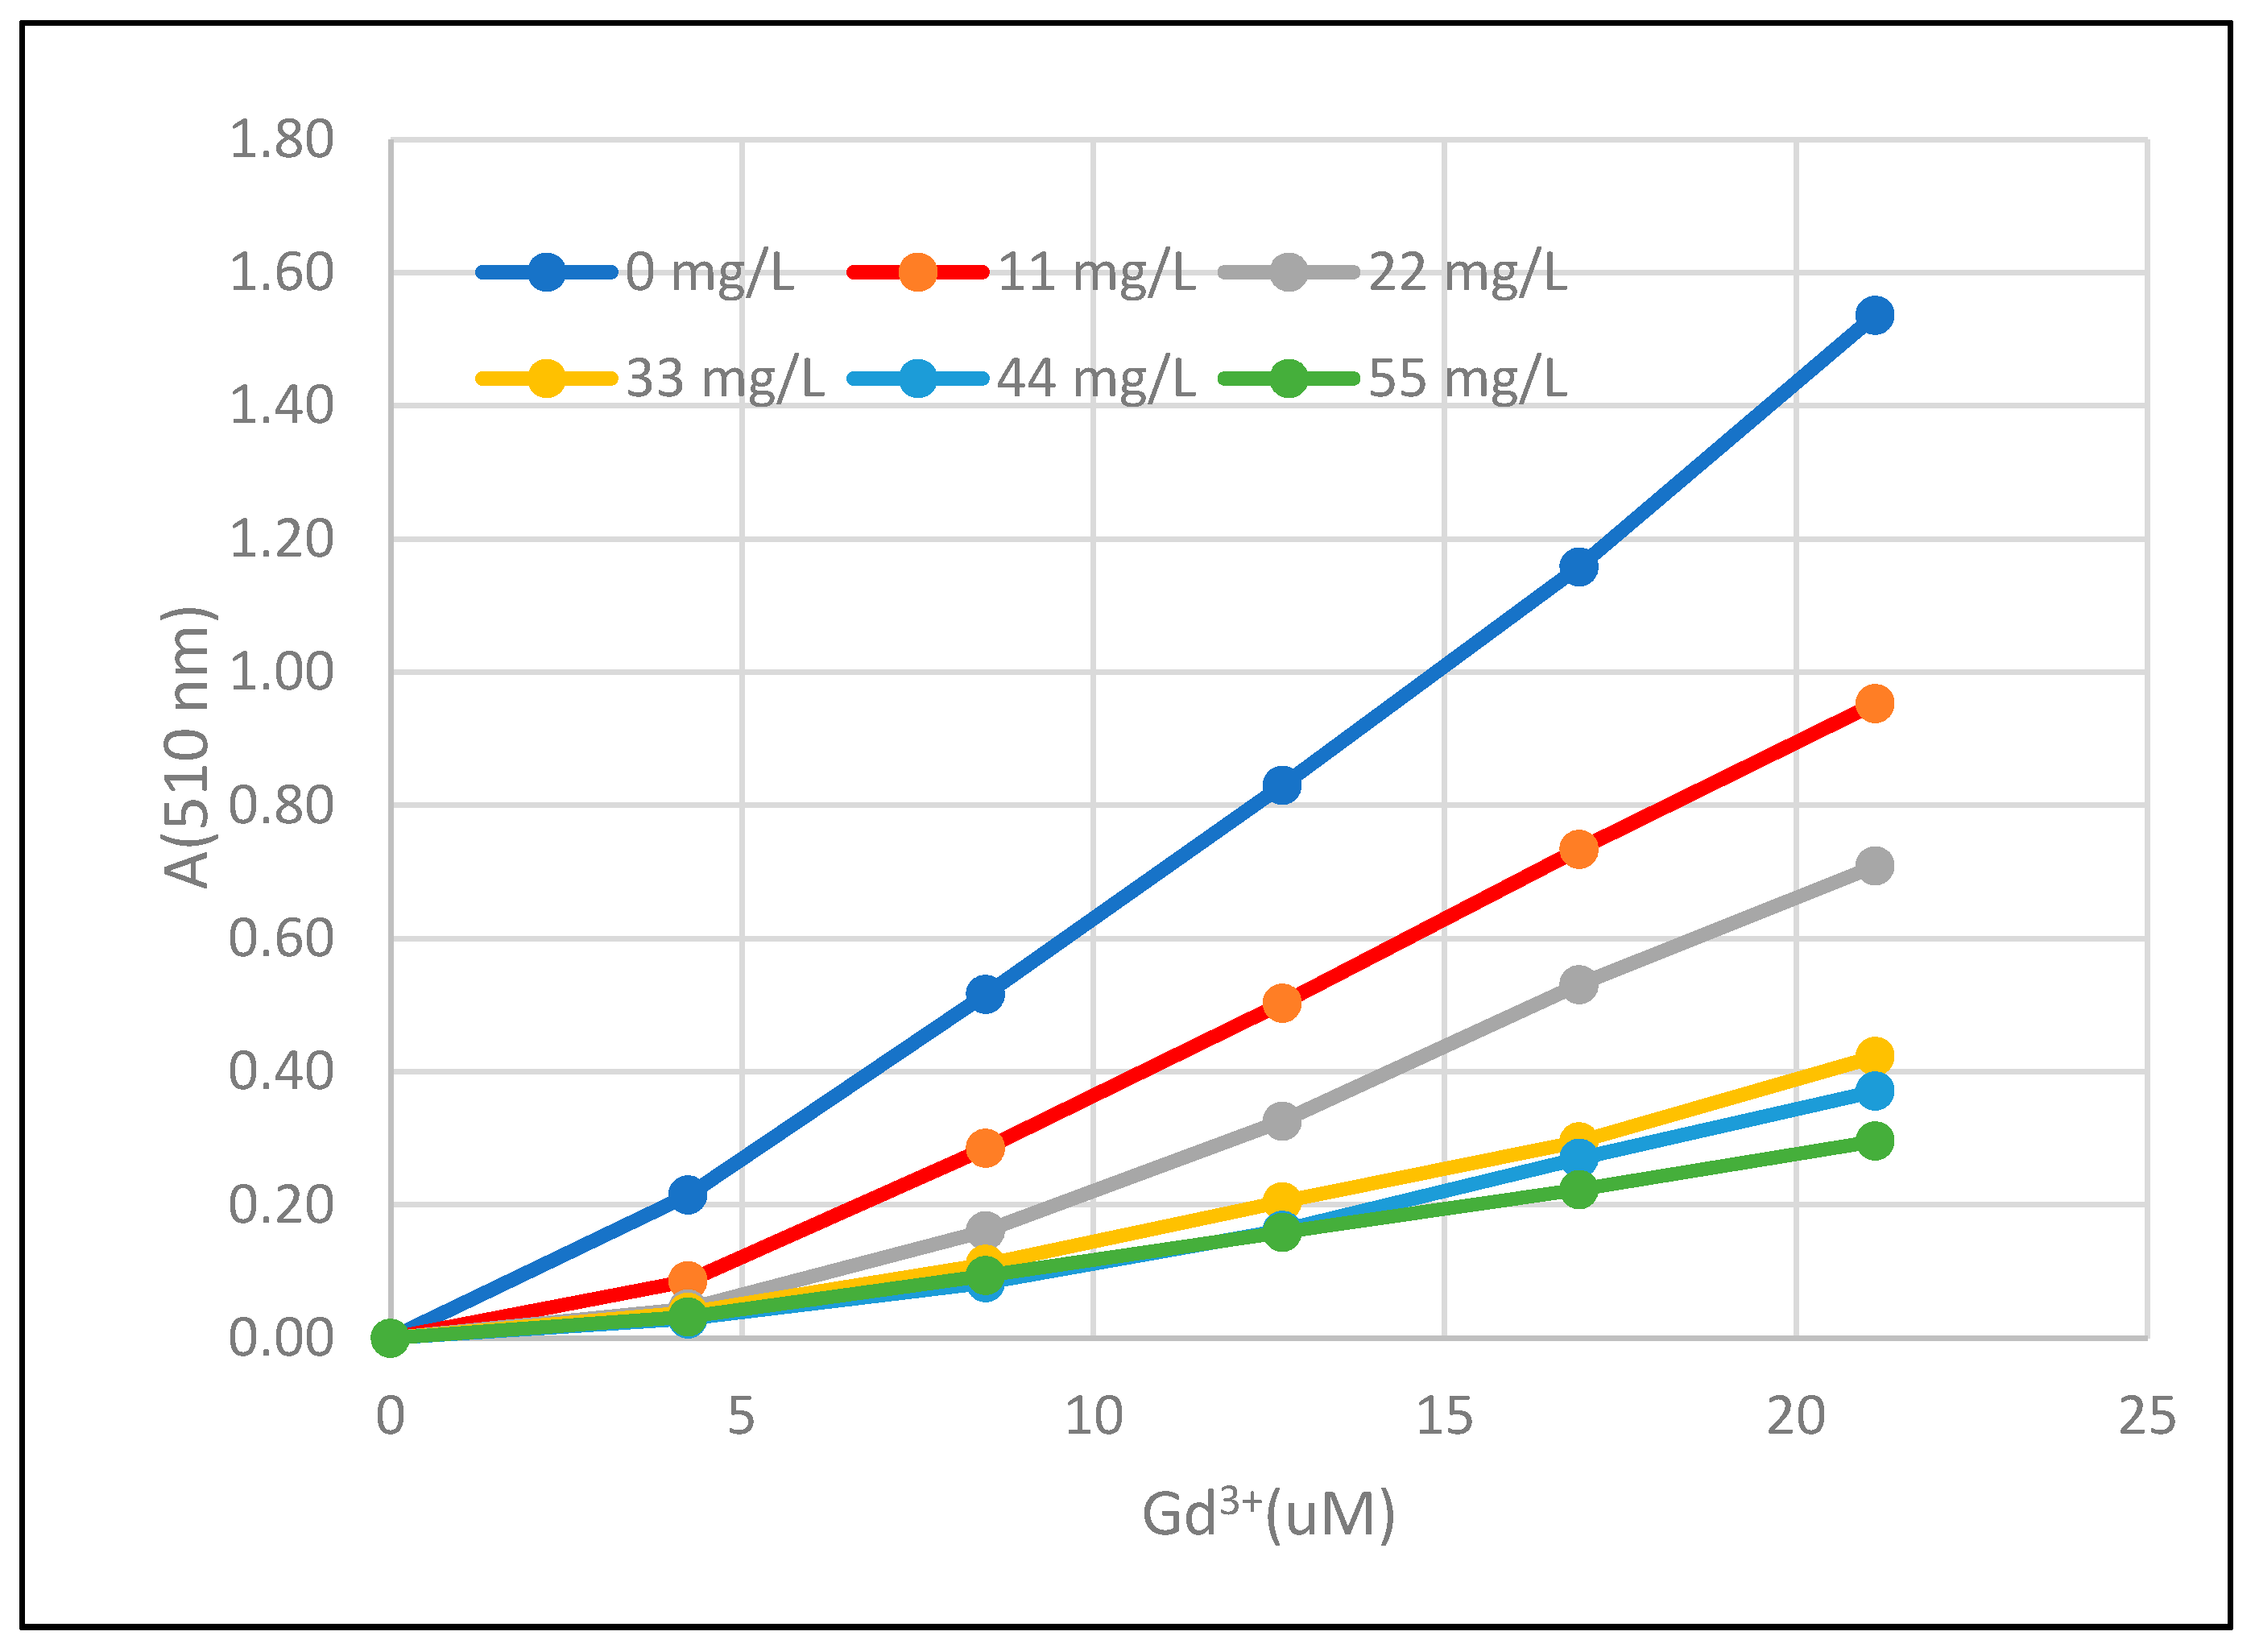
3.7. Fluka Humic Acid
The ability of the Fluka humic acid to sequester gadolinium was tested in TEA pH 8 buffer. The humic acid was prepared in 0.1 M TEA pH 8 buffer at a concentration 110 mg/L. Various portions of TEA pH 8 and the humic stock solution were mixed, keeping the total volume 2400 μL. Then, 600 μL of 1.2 mM PAR in TEA pH 8 was added. The solution was titrated with Gd
3+. The Gd
3+ stock solution was a commercial 1000 mg/L solution. The data for all of the various concentrations tested are summarized in
Figure 9.
3.8. Estimated Stability Constants for Gd3+ and Humic Acids
In the cases of the Pahokee peat humic acid and the IHSS Leonardite humic acid, the IHSS has provided measurements of the carboxylic and phenolic functional group contents. For the Pahokee peat humic acid, the carboxylic acid and phenolic acid groups occurred at 9.01 and 1.91 meq/g, respectively. The Leonardite humic acid is reported to contain 7.46 and 2.31 meq/g for carboxylic acids and phenolic acids, respectively. As these functionalities are generally thought to be involved in humic metal binding, we examined if competition between PAR and these two humic substances could be related to the concentrations of these two functional groups. Using the Gd3+ binding data at 21 uM total Gd3+ and variable concentrations of PAR, we adapted Equation (3) to analyze the data and found that there was a correlation between Gdt/Gd(PAR)2 and the ratio of the square of the sum of the total carboxylic acid and phenolic functional group content to PAR2 ratio. This correlation yielded r2 values of 0.993 and 0.996 for the Pahokee peat and Leonardite humic acids. We assumed for the Pahokee peat and the IHSS Leonardite results that Gd(PAR)2 and a Gd3+ humic acid complex were the predominant solution species. The calculated log β values for the interaction of the Gd3+ and humic acid were 9.5 and 9.4 for the Pahokee peat and the IHSS Leonardite, respectively. These calculated constants were very close to the conditional stability constant for PAR. It is tempting to interpret this simple correlation as an indication of bidentate interaction with the humic acid. However, this correlation does not consider the heterogeneous nature of the humic acid or the potential contribution of electrostatic potentials to metal humic interaction, so this is at best a very preliminary result. We believe that our observations can be incorporated a humic acid-metal binding model that considers heterogeneity and electrostatic effects. If this can be accomplished, it should lead to results that may have a predictive value.
4. Conclusions
We have demonstrated that through a competitive ligand methodology using PAR, it is possible to measure stability constants for various ligands of potential environmental importance. The sensitivity of the method is sufficiently high so that low (uM) concentrations of Gd3+ can be utilized. With excess PAR present in solution, the complications of hydrolysis are largely avoided. What is clear from this data is that various organic acids and humic acids can influence the speciation of Gd3+ under circumneutral pH conditions. On a mass basis, the Gd3+ binding to all of the humic materials was very similar and we anticipate that similar stability constants would be measured.
A large fraction of the anthropogenic Gd
3+ released into the environment is likely from medical applications and is initially bound by a chelating agent. Apparently, these chelating agents, which are meant to make Gd
3+ biologically inert during MRI testing, survive wastewater treatment [
33]. Port et al. (2008) reviewed the thermodynamic and kinetic stability of various gadolinium chelates [
34]. It is not clear how long these complexes will survive long term exposure to environmental chemical, photo-chemical, and biological degradation.
It has been demonstrated that Gd
3+ may be partially displaced from the chelates by competition with other metals such as Ca
2+ and Mg
2+ when waste streams are mixed with seawater [
35]. In addition, there is some evidence that zinc, calcium, and iron may be able to partially displace Gd
3+ from medical chelating agents in vivo [
36] despite the very high stability constants. If this occurs, then the environmental chemistry of Gd
3+ will be determined by the abundance of alternative inorganic and organic ligands. These ligands including humic substances will then determine the bio-availability and toxicity of Gd
3+.
This study demonstrated that various humic materials are capable of disrupting the Gd3+-PAR complex. Our estimates of stability of the stability constants for Gd3+ and humic acids are very preliminary. In our future work, will plan to improve the quantitative interpretation of these results using a humic acid metal binding model. We are presently exploring the incorporation of our results using the software available for one of the currently available humic acid metal binding models.


