Article

Characterization of the Dynamics of Leachate Contamination Plumes in the Surroundings of the Hulene-B Waste Dump in Maputo, Mozambique

by
Bernardino Bernardo
1,2,
Carla Candeias
1 and
Fernando Rocha
1,*
1
GeoBioTec Research Centre, Department of Geosciences, University of Aveiro, 3810-193 Aveiro, Portugal
2
Faculty of Earth Sciences and Environment, Pedagogic University of Maputo, Av. do Trabalho, Maputo 2482, Mozambique
*
Author to whom correspondence should be addressed.
Submission received: 9 December 2021 / Revised: 19 January 2022 / Accepted: 20 January 2022 / Published: 26 January 2022
(This article belongs to the Special Issue Feature Papers in Environments in 2021)

Abstract

:
The contamination of areas around solid urban waste dumps is a global challenge for the maintenance of environmental quality in large urban centres in developing countries. This study applied a geophysical method (electrical resistivity) to identify leachate contamination plumes in the subsoil and groundwater, as well as to describe their temporal dynamics (2020 and 2021) in the surroundings of the Hulene-B waste dump, Maputo, Mozambique. Eight 400 m electrical resistivity profiles were performed, four profiles in January 2020 and four profiles in May 2021 overlapped, and the data were inverted with RES2D software. The electrical resistivity models predominantly indicate an E-W movement of large contamination plumes that are successively diluted with saturated media and groundwater, creating zones of less resistive anomalies (<4.2–8.5 Ω·m) possibly contaminated at the two analysed seasons, between 2020–2021. The thickness of the contamination plumes was higher in summer (2020) for profiles 1 and 2, and we associate it with the production and migration mechanisms of leachate that are intense in the hot and rainy season. Southwest of the dump, profile 4b showed the propagation of anomalous areas on the surface and at depth, which are associated with the production of leachate resulting from the continuous decomposition of waste that is continuously deposited in a new area southwest of the dump, thus generating a slow and continuous migration of leachate at depth, mainly in winter (2021). The spatial distribution of contamination plumes during both seasons was reduced significantly farther away from the waste deposit, revealing the attenuating effect of groundwater and lithological substrate (Profile 3).

1. Introduction

In recent decades, waste generation has increased in quantity and diversity worldwide, resulting from population explosion and economic growth [1,2]. The global annual production of municipal solid waste (MSW) in 2025 is expected to reach about 2.2 billion metric tons [3]. This fact implies many challenges in defining and managing the final disposal sites for municipal solid waste [4,5]. It is estimated that about 33% of municipal solid waste produced worldwide is disposed of improperly [3]. Thus, several studies have reported environmental problems associated with poor solid waste disposal [6]. Morita et al. [7] estimate that open dumpsites will account for 10% of global greenhouse gas emissions by 2025. Municipal solid waste, when disposed of, produces leachate, which is a highly contaminated liquid containing high amounts of inorganic ions, organic compounds, and other toxic elements such as heavy metals and ammonia [8,9]. In unplanned landfills, leachate is commonly mobilised to the surrounding environment (soils, surface, and groundwater), causing contamination [10]. Kumar et al. [11] and Khattak et al. [12] have shown that in waste dump in areas with high temperatures and precipitation, the process of waste decomposition and leachate production is higher. The greatest environmental impacts resulting from environmental contamination by waste are described in developing countries, where the planning of waste disposal sites is deficient [13]. In Mozambique, namely in Maputo city, the production of municipal solid waste has been increasing, and daily waste production is estimated to be around 1250 tonnes [14,15,16]. Of these, about 1000 tons are deposited in the largest open-air dump in Maputo city, the Hulene-B dump [15]. In this dump, all types of waste, food, electronic, construction, health and industrial are deposited without any treatment [14,17]. Studies developed by Nogueira et al. [16] and Vicente et al. [17] denounced a possible contamination of soils and groundwater in the environment around the Hulene-B dump, which suggests the need for its continuous study and monitoring of its geo-environmental context [18].
Many methods are currently used to study contamination problems in solid waste disposal areas, and geophysical methods are pointed out as effective in identifying waste-contaminated areas [19,20]. Among these methods, electrical resistivity is widely applied due to its non-invasive nature in data acquisition and processing [21,22,23]. Arifin et al. [20] and Lau et al. [21] demonstrated that electrical resistivity is effective in locating buried hazardous waste and identifying contamination plumes resulting from leachate flow.
In general, the typical resistivity of a waste mass is between 15 and 30 Ω·m in a saturated medium and between 30–70 Ω·m in an unsaturated medium [22]. However, certain materials present in a waste mass can increase or further decrease the resistivity values [24,25]. Ashes from incinerating plants, tree cuttings and textiles (when they can retain moisture), previously treated waste and chemicals give rise to low resistivities; however, plastics, rubber, certain types of building demolition rubble, rubbish preserved inside plastic bags, heavily compacted newspapers and organic chemicals have high resistivities [23,25]. The reference resistivity for sandy soils is 50–100 Ω·m [26,27].
This study applied the geophysical method (electrical resistivity) to identify the leachate contamination plumes and to describe their temporal dynamics on the surroundings of the Hulene-B Waste dump in Maputo, Mozambique (2020 and 2021).

2. Materials and Methods
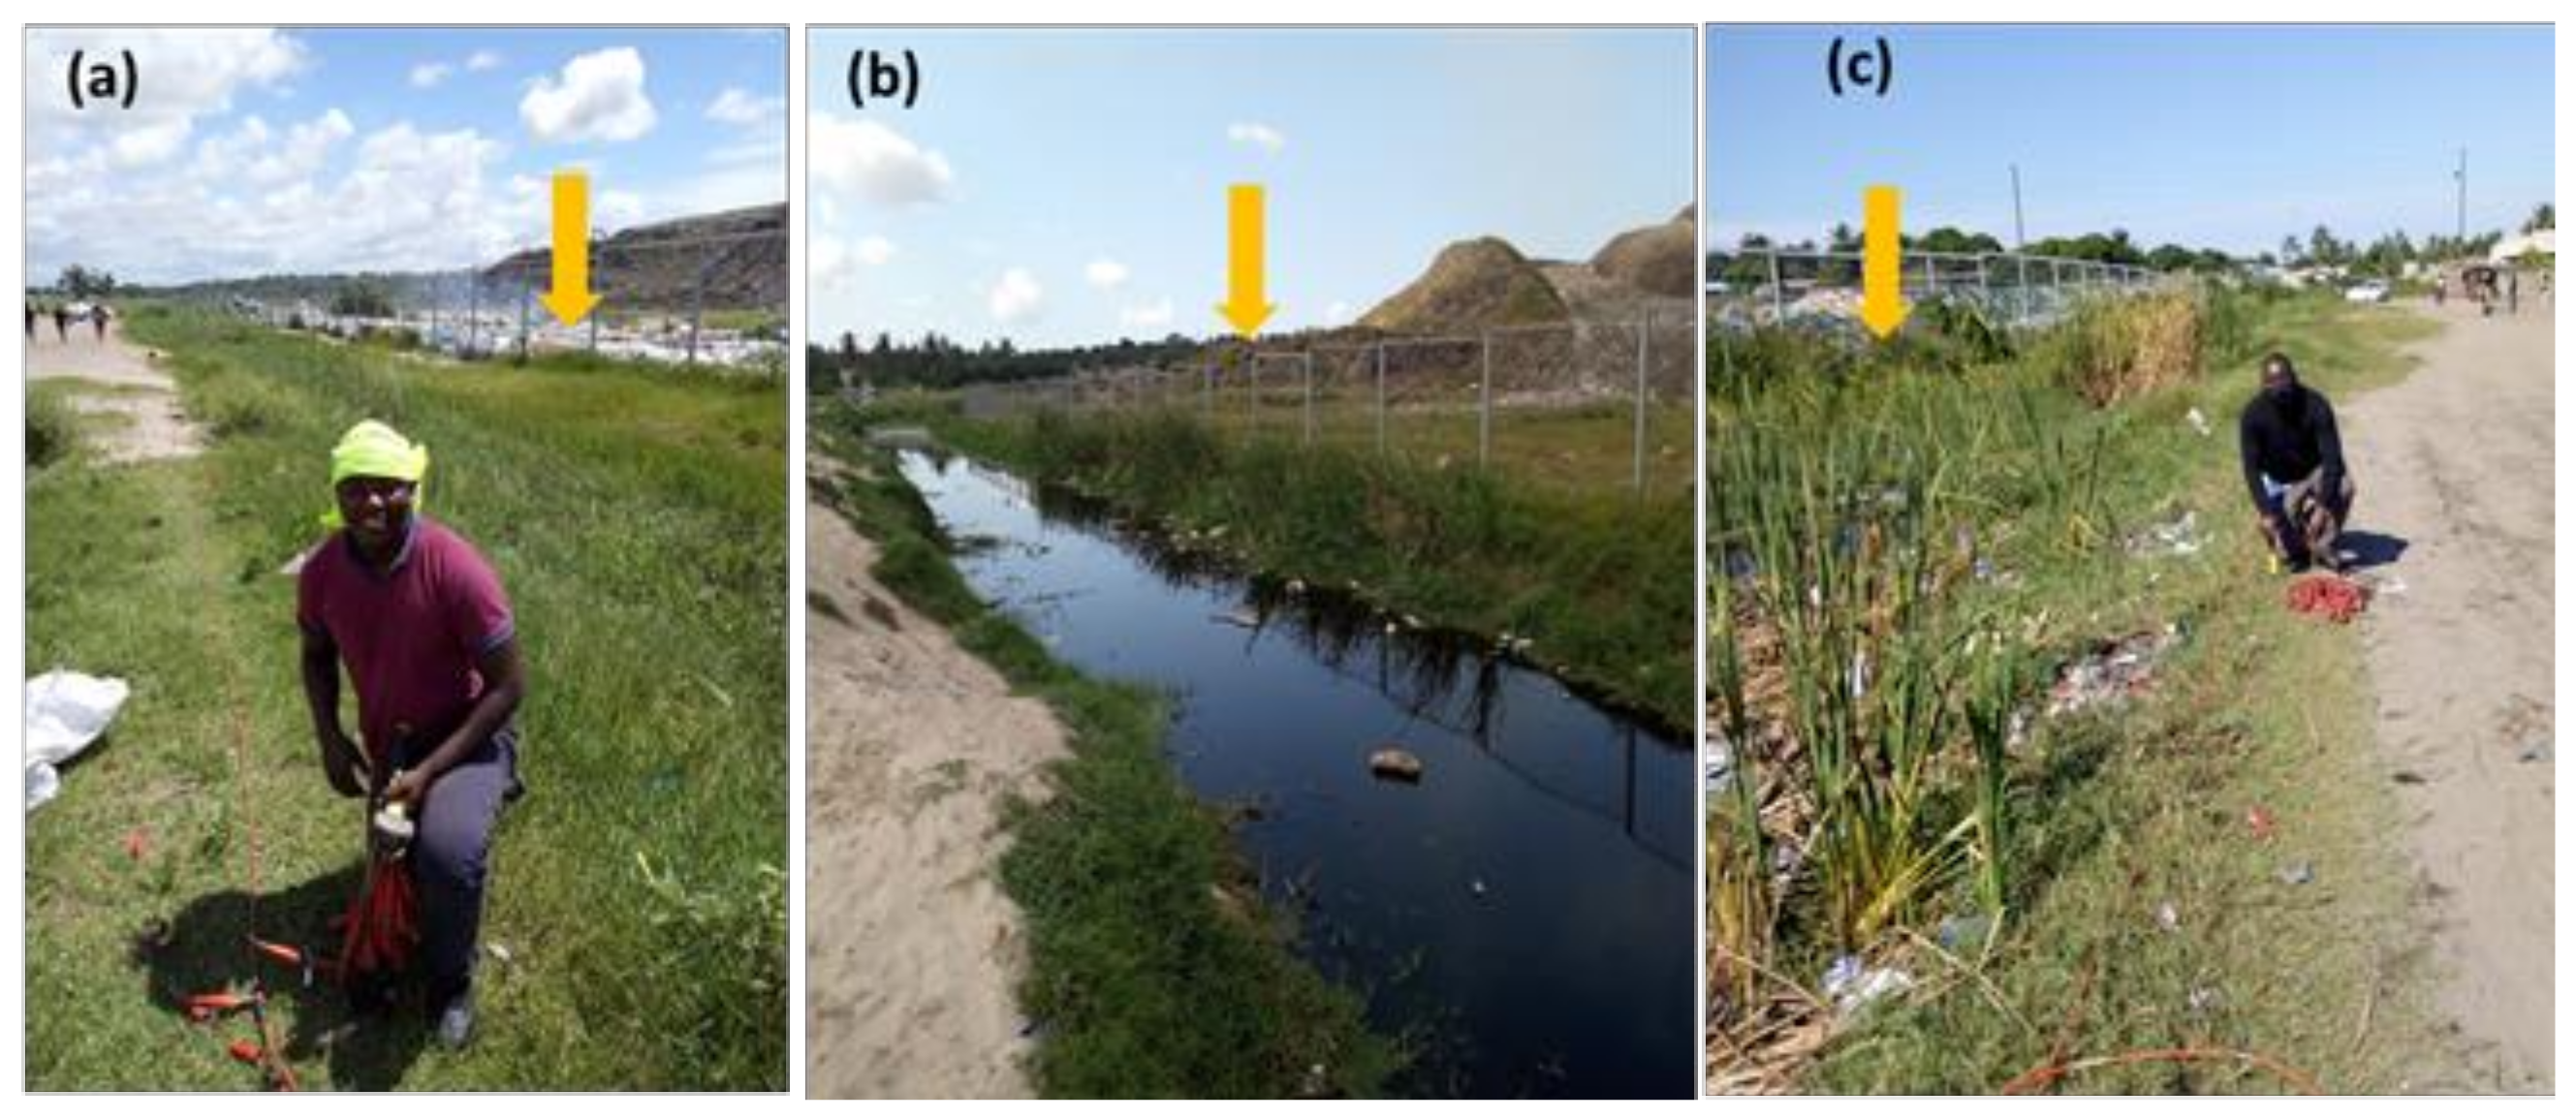
2.1. Study Area

The Hulene-B dump is in the Hulene-B neighbourhood, in the northern direction of Maputo city, Mozambique (Figure 1) [17,28], a residential area with approximately 48, 717 inhabitants. The dump receives all types of waste produced in Maputo City [15,29,30,31]. The height of the waste is estimated to be about 6 to 15 m and occupies an area of 17 hectares [25]. The dump is in a former quarry with no previous preparation for waste reception [26]. These characteristics are described as conducive to contamination of the local hydrogeological system [27]. Sallwey et al. [30], Serra [31] and Vicente et al. [17] have associated the Hulene-B dump with heavy metal (Hg, As, Pb, Cu and Zn) contamination of surrounding groundwater and soils. The Hulene-B hydrogeological system is part of the Tertiary-Quaternary aquifer system [16]. The aquifer substrate is formed by the layer of clayey marl to grey clay [18,32]. In the surroundings of the Hulene-B dump, the localised presence of the semi-impermeable layer (clayey sands) between the fine to coarse sand and the sandstones causes the water circulation of these two sectors to continuously connect [33]. There are places where the coarse sands lie directly on top of the clay layer, developing semi-confined conditions [18,34]. Nogueira et al. [35] showed that the aquifer system in Maputo city is prone to contamination. Concerning regional and local geology, the Hulene-B dump is inserted into the Mesocenozoic sedimentary basin of southern Mozambique [17], and is situated in a contact zone of two lithologies, Ponta Vermelha Formation and Malhazine (Figure 1b) on a gentle dune slope with east–west orientation [36]. The Ponta Vermelha Formation (TPv) dates from the upper Pliocene to the lower Plistocene and is composed, in the upper part, of ferruginous sandstones and red silty sands, which gradually change to yellow and whitish sands [18,37]. At the surface, this unit presents a red colour, and poorly consolidated sands may appear [16]. The Malhazine Formation (QMa) dates to the upper Pleistocene and consists of coarse to fine, poorly consolidated, sands with whitish to reddish colours, fixed by vegetation because of successive consolidation processes [18,37]. The soils in the surrounding of the Hulene-B dump have been classified as sandy dune [36]. The predominant climate is of subtropical type, with two seasons: (a) hot and rainy period from December to March with more than 60% of the annual precipitation, with the highest concentration of precipitation in January (with an average of 125 mm) and (b) dry and cold season from April to September with lower temperatures in June and July, as well as a weak and irregular precipitation, whose minimum values are recorded in August (12 mm). The average annual precipitation is 789.2 mm [38,39]. The prevailing winds are SE [40].

2.2. Geophysical Studies (Electrical Resistivity)

In recent years, the awareness of the increasingly complex environmental issues has boosted the use of geophysical prospection methods, in a quite successful way, for the study of complex environments, such as urban areas [41,42]. Among the geophysical methods most employed in environmental studies, electrical resistivity has been pointed out as relevant [19,20], and it has been prominent in the study of environmental problems in soil and groundwater, mainly in the location of buried hazardous waste, contamination from different sources, and planning of safe sites for deposit of industrial and domestic waste [24,43], being widely used to identify areas of heavy metal contamination, contamination plumes [10], groundwater [20,44], and lithological variations [20]. Leachates cause, when they meet geological materials, natural electrical resistivity of the material to decrease due to the high concentration of dissolved metal ions, creating anomalous resistive zones [45,46].
The resistivity method is based on the electric current injected into the ground through a pair of electrodes (A and B-current electrodes) and the resulting potential difference between another pair of electrodes (M and N potential electrodes) [19,45]. The ground resistivity is calculated from the distances between the electrodes, applied current and measured potential difference, based on the Law of Ohm [47]. The apparent resistivity of the soil can be determined based on the known differences between the electric field potential (∆V) and the current (I), and the distance between the electrodes [21].
The resistivity is given by the equation:
ρ a = k V I
where: ρa—resistivity of a bedrock, I—intensity of current applied to the soil by electrodes AB (mA), ∆V—differential potential between electrodes MN (mV), k—geometrical coefficient of electrode positioning (m).
The geometrical factor k is dependent on the distribution geometry of the electrodes, as follows:
K = 2 π 1 A M 1 B M 1 A N + 1 B N
where AM, BM, AN and BN represent the geometrical distance between the electrodes A and M, B and M, A and N, and B and N, respectively [1,48].
The electrical resistivity of the terrains is a characteristic closely linked to the type, nature, and state of alteration of the geological formations [22,49]. Thus, the method allows for: (1) the identification of the lithology of landfill subsoil; (2) the determination of the groundwater table depth; (3) the determination of the distribution of the contamination zones and the direction of the pollutant migration; (4) the evaluation of waste thickness disposed at a landfill site [21,28,50].
In this research, 8 electrical resistivity profiles were performed in two different seasons (Figure 1a): 4 profiles in January 2020, corresponding to the hot and rainy period, and in May 2021, 4 more profiles were executed overlapping those of the first campaign on the western edge of the dump.
For the data acquisition, a resistor ABEM SAS 4000 was used, including 4 rollers of 100 m cables with 21 outlets that connect to the same number of electrodes. The layout produced by this sequence of cables (100 m and 21 outputs) corresponds to the standard of the reading program hosted by the resistivimeter LUND Imaging System. For data acquisition, it employed a 50 Hz current frequency, using a multigradient protocol (GRAD4LX8 and GRAD4SX8); the GRAD4LX8 was selected because it provides dense coverage on the nearby surface and adopts the Wenner–Schlumberger protocol [51,52]. The electrode spacing for data acquisition was 5 m. All the electrode take-outs were connected in the GRAD4S8 protocol (Figure S1). The resistivimeter automatically switches the electrodes to serve as current or potential pairs. After the readings, the data were transferred to the resistivimeter, after storing a minimum of 3 and a maximum of 6 readings, to obtain the lowest average error between readings. The inversion of the electrical resistivity data obtained in the 8 lines was performed based on the standards defined in the software RES2DINV3.59.106, namely, application of the smoothness constraint method in the resistivity values of the final model, calculation of the Jacobian matrix in each iteration, and Gauss–Newton optimization method [19,42,49]. The interpretation of the profiles was based on the direction of each profile and the length of the profiles (400 m). The analysis zones were delimited as Zone 1 from 0–200 m (Z1) and Zone 2 from 200–400 m (Z2).

3. Results and Discussion

3.1. Geophysical Studies—Electrical Resistivity

The interpretation of the electrical resistivity models allowed for the understanding of the leachate formation areas, dynamics, and dispersion of contamination plumes in the groundwater as well as for comparing the variations of the resistive anomalies (2020–2021). The following anomalous areas were distinguished: (I) areas of possible leachate formation and enrichment; (II) contamination plumes in subsurface and groundwater.

3.1.1. Profile 1: 2020 (a) and 2021 (b)

The two profiles (a) and (b) extend in the S–N direction and are parallel to the western boundary of the dump (Figure 2).
Zone 1—Along the first 200 m of both profiles, no significant changes are noted near the surface, and in general, the resistivity is higher and associated with the rubble and debris of old houses that were built in this space until 2018 [49]. At depth, slight differences in resistive layers are noted, which may be associated with the effect of variation in rainfall and moisture, more abundant in (a) and less in (b). The zone of resistivity <19.2 Ω·m in (a) and <15.4 Ω·m (b), which we consider as the leachate concentration zone, resulting from the vertical migration of leachate from the surface washing of the dump by precipitation being channelled in the unprotected ditch and parallel to these profiles (Figure 3b). Wu et al. [50] and Ololade et al. [51] showed that leachate flow in non-isolated areas can cause migration to great depths and groundwater contamination. The leachate accumulation zones, <19.2 Ω·m (a) and <15.4 Ω·m (b), show variable thicknesses, which may be associated with the effect of the relatively saturated lower layers, <16.1 to 11.7 Ω·m (a), being more extensive in summer, which causes slow vertical migration at depth and the production of thick plumes at great depth, <8.46 Ω·m in profile (a) and <8.56 Ω·m in profile (b). The leachate migration layers can be considered as contaminated, <16.1–11.7 Ω·m (a) and <13.2–10.7 Ω·m (b). At great depth, at the southern end of both profiles, there is a localised anomalous zone that we interpret as being influenced by groundwater contamination by plumes resulting from vertical leachate migration.
Zone 2—In both profiles, anomalous zones are evident near the surface at 280 m onwards, which are more extensive in profile (b), representing residues humidified by surface water (leachate producer) <15.4 Ω·m, which are more visible in the north of both profiles and more extensive in profile (b). The clearly visible plumes in both profiles, in the surface water, correspond to the contamination in the natural receiving basin by surface leachates and plumes mobilizing at depth in the E–W direction, described in profile 2.

3.1.2. Profile 2 2020 (a) and 2021(b)

Profile 2, with a west–east orientation, and northern boundary of the dump (Figure 4).
Zone 1—From 0 to 80 m surface, in profile (a) we can notice a marked variation of resistivities. The zones of low resistivity (<24.5 Ω·m), we interpret as a wet and leached waste production zone, given the new solid waste depositions recorded at this point to the west of the basin. The same profile section (b) show high resistivities, given the scarcity of precipitation and low ambient temperature. The high temperatures, humidity and age of the dump are primary factors in decomposition and leachate production [17,44,53]. From 8.35 m depth downwards, in profile (a), we note an extensive saturated zone that extends in the northern direction and connects to an extensive subsurface flow system. In turn, in profile (b), this saturated zone appears more confined and with an expressive concentration of anomalous values <4.96 Ω·m (b), which we interpret as a plume migrating horizontally in summer in the east–west direction and being confined at this point. Cendón et al. [16] described the aquifer system of this region as semi-confined that seasonally binds continuously, a fact that is visualized in these bands of the two profiles and that are associated with the transfer of possible plumes at depth. From 80 to 200 m, superficial in profile (a), we verify the alternation of high and low resistivities. The high resistivities, we interpret as compact material on the surface, which alternates between debris, rubble, and old house debris. From 160 to 200 m (a), we observe surface waters of the natural leachate reception basin, which are constantly enriched by the surface leachates. In this section at a depth of 8.35 to 47.7 m (a), there is an extensive plume of contamination arising from the large mass of wet waste and producing leachates <24.5 Ω·m (a) that migrate horizontally in an east–west direction. Complex mechanisms of leachate movement from the surface and at depth are also observed. The vertical and horizontal movement of the leachate produces an extensive plume migrating E–W, <6.21 Ω·m (a). In profile (b), from 80 to 140 m, the resistivity is higher along a larger area than in (a), given the significant reduction in the extent of surface water responsible for the decomposition of the waste mass and consequent decrease in resistivity. At the depth of the same section, confined groundwater receives leachate, which moves horizontally from E–W < 16.8 Ω·m (b) and a vertical migration between 142.5 to 147.5 m. The contamination plume <7.9 Ω·m (b) at this point is quite pronounced and may indicate a high level of contamination, given the reduced dilution and migration environment.
Zone 2—In (a) between 200 m to 315 m, it shows alternating resistivities between the less moist waste mass <20.7 Ω·m to saturated zones <10.6 Ω·m (b) which represent pits and small surface depressions enriched by surface water, and the same characteristics are noted in (b), but with lower moisture extent. From 320 m onwards, in profile (a), an increase in resistivity >30.8 Ω·m is noted which corresponds to waste mass mixed with less moist soils and resistivity >52.8 Ω·m which represents compacted dry waste. In profile (b), to the same extent, the increase in resistivity is much more noticeable, which indicates dry waste and soil (<33.4 Ω·m) and compacted waste (>33.4 Ω·m). At depth, in both profiles, the large mass of waste, <30.94 Ω·m (a) and <20.74 Ω·m (b), gains successive moisture in (a), establishing an extensive area of leachate production <24.5 Ω·m (a), whereas in (b), it is confined (<16.8 Ω·m). These differences are the result of the variation in precipitation and temperature in the two seasons studied, which are responsible for the variation in waste mass decomposition, production, and migration of leachate [54,55].

3.1.3. Profile 3 2020 (a) and 2021 (b)

Profile 3, with an S–N orientation northwest of the dump (Figure 5).
The execution area of this profile corresponds to the strip that temporarily floods with run-off water from the dump. It was executed to understand the spatial dynamics of possible contamination plumes in the northern direction of the surroundings of the dump (reception basin). At 40 m, in both profiles, the influence of moisture in a localized band, at depth, is noted, evidenced by resistivity <23.5 Ω·m in profile (a) and 21.6 Ω·m (b). In the first profile, the strip occupies a relatively larger area due to the abundant precipitation in this period that infiltrates to the deeper layers. At 140 m depth, there is an anomalous zone in both profiles, which we interpret as a plume of contamination, <7.18 (a) and <7.34 Ω·m (b). We consider that this anomaly corresponds to the northern limit of the large plume described in profile 2. From 160 m onwards, in both profiles at all depths, the resistivity tends to be equal, and we consider as typical of local strata and anomalous (positively) zones, >38.2 Ω·m (a) and >33.7 (b), corresponding to compacted soils or rubble, given the strong movement of cars at these points. The similarity of the data in both profiles and the absence of low depth anomalous zones show the decreasing effect of the contamination plumes on the subsoil and the subsurface environment, as one move away from the dump to the North, due to the natural process of attenuation by dilution and dispersion of the plumes in the natural receiving basin. Similar situations have been described in areas around several dumpsites in Africa, Morocco by El Mouine et al. [56] and Touzani et al. [39], Nigeria by Fatoba et al. [53] and Burkina Faso by Barry et al. [54].

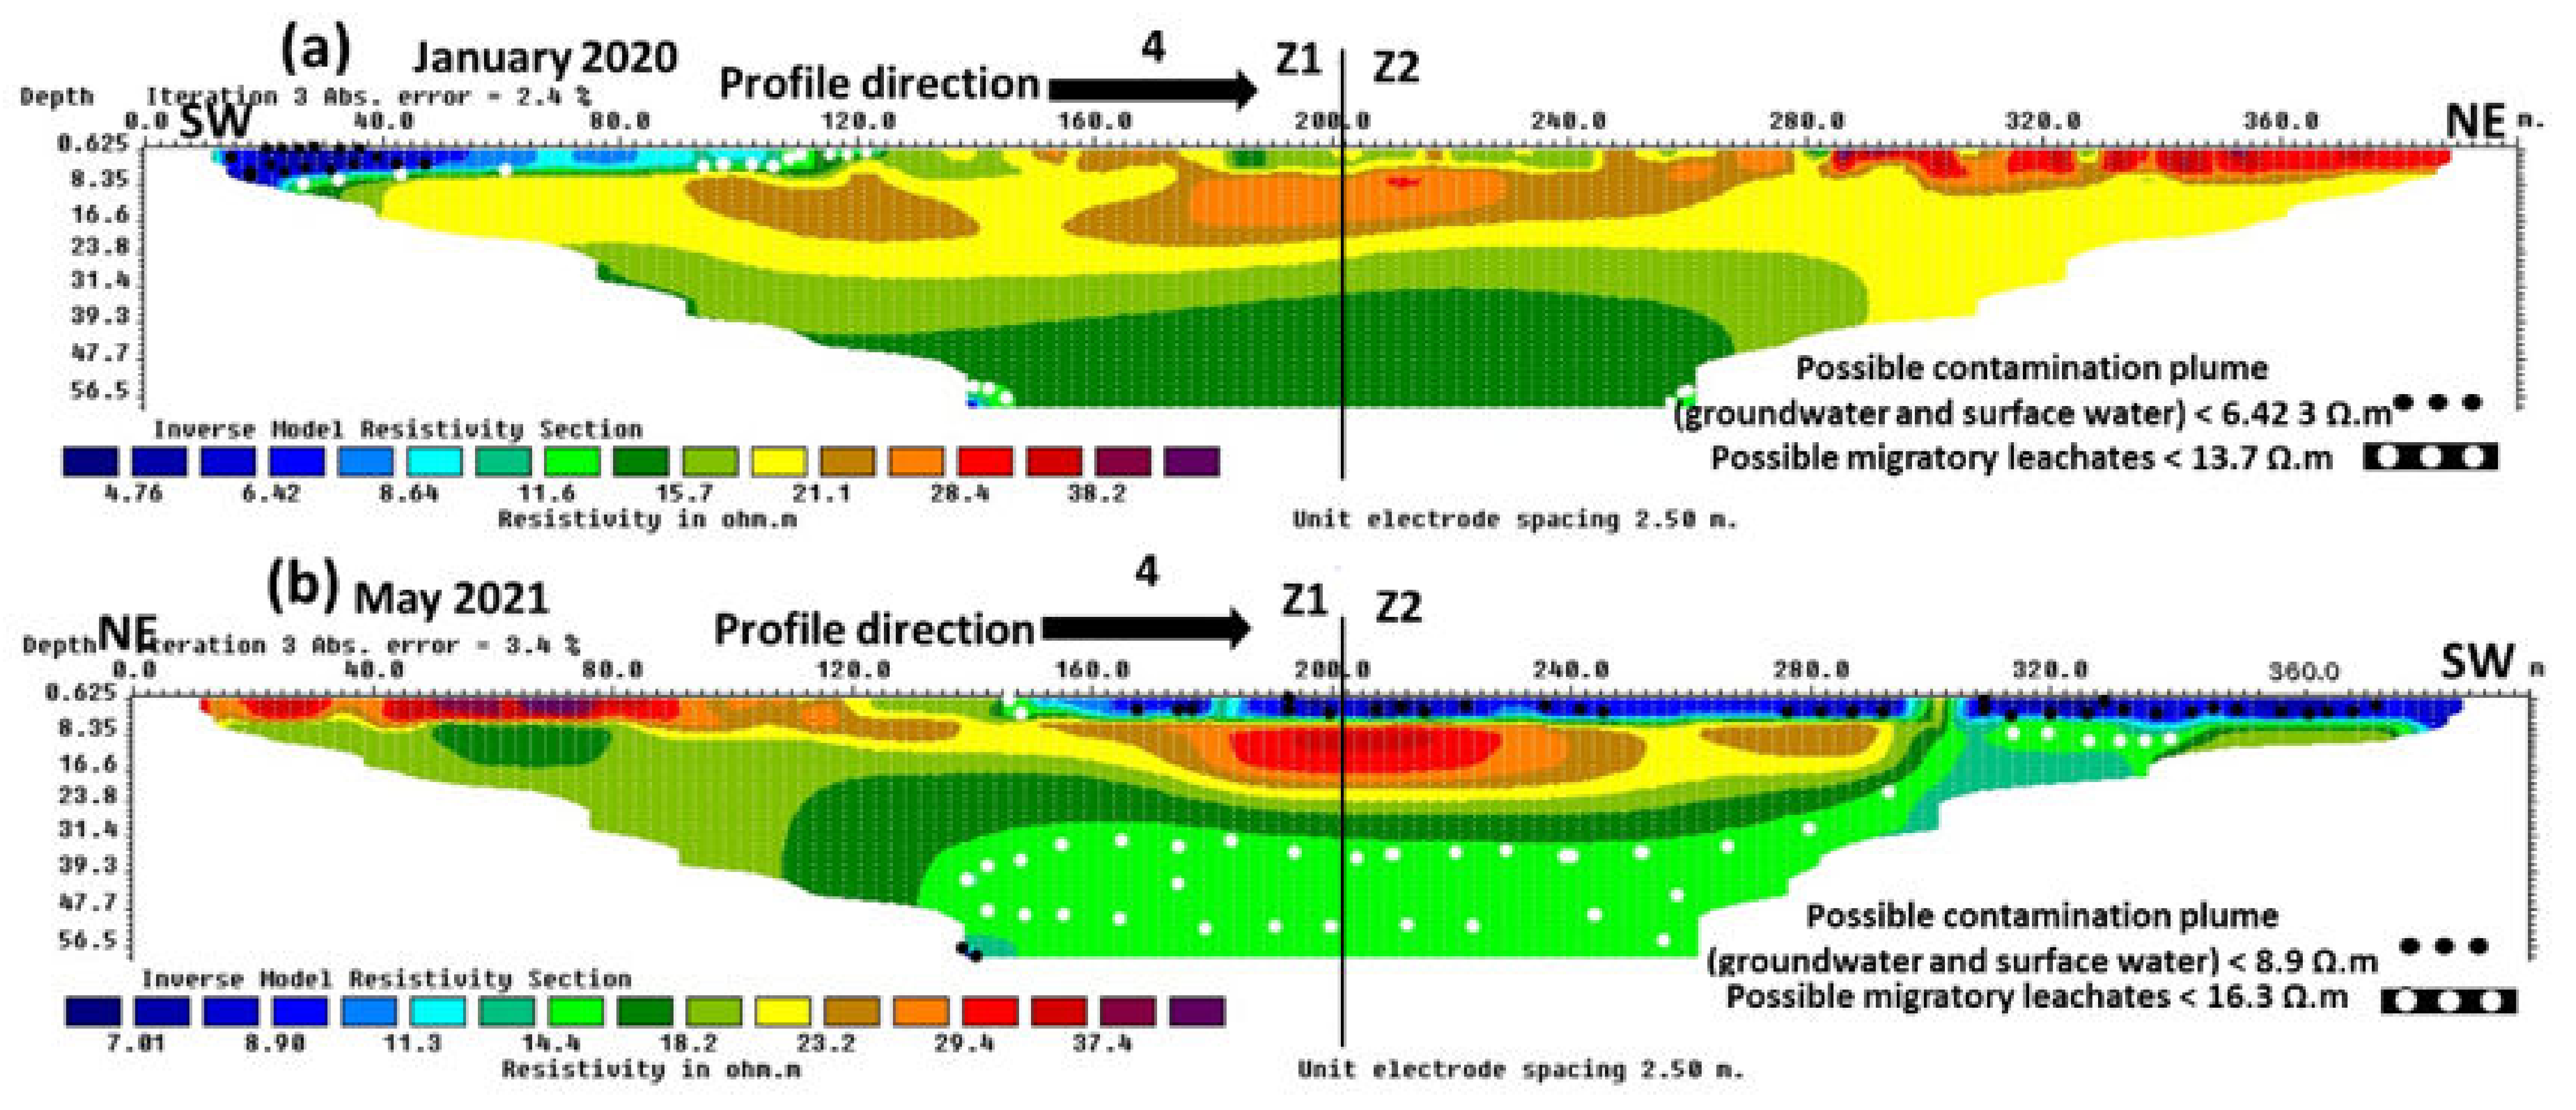
3.1.4. Profile 4 in 2020 (a) and 2021 (b)

Profile 4 has SW–NE orientation (a), and the NE–SW (b) profile both overlap (Figure 6).
Zone 1—Profile 4 (a) from the beginning to 120 m shallow shows zones with anomalous resistivities. The resistivity < 13.7 Ω·m was interpreted as a zone of leachate production and dispersion, resulting from new waste deposits in the southwest of the natural basin. These leachates migrate horizontally in the NE–SW direction and vertically until they mix with groundwater. In profile 4 (b), these anomalies occupy a large area in the dry period and extend over an area of about 240 m surface as well as at depth, <16.3 Ω·m. The extensive anomalous area at depth in profile 4 (b) (< 16.3Ω·m) may be associated with a vertical and continuous migration of leachate accumulated at the end of the rainy season in the southeast of natural reception basin.
Zone 2—In profile 4 (a) from 200 to 400 m, the surface resistivities are generally higher and we interpret them as plastic waste, rubble, and debris from old, buried houses. The same occurs in profile 4b, from 140 m to the end of the profile. The resistivity corresponding to possible contamination plumes were interpreted as <6.42 Ω·m in (a), <8.9 Ω·m in (b), which at great depth, did not show great changes in the two seasons of the years studied. This reality can be associated with the local aquifer system, which is described as semi-confined in clay layers [16].

3.2. Spatial Distribution of Possible Leachate Plumes (2020–2021)

The spatial distribution of the plumes in the study period (2020–2021) (Figure 7), shows predominantly an east–west movement of the deep contamination plumes and surface leachates in profiles 1 and 2, which mix with the surface waters of the natural basin to the west and migrate vertically to the groundwater, causing resistive anomalies at a larger scale in winter (1). The same flow direction was described by Bernardo et al. [18]. The flow is conditioned by the arrangement of the local topography (soft dune E–W), which collects all the leachate from the subsurface compression of the waste, since it is at a higher altitude than the local surface. Another relevant factor in this direction of contaminant flow is the recent construction of leachate drainage channels, which create natural leachate flows in the E–W direction (Figure 4b). However, the dilution process of leachate plumes shows a varied dispersion in the natural reception basin and groundwater (Figure 7. <4.26–<8.5 Ω·m), suggesting that contamination migrates in several directions. Similar anomalous values were interpreted as plumes in groundwater by Harjito et al. [55] 3–9 Ω·m near a Bantul waste dump in Indonesia, Bichet et al. [22] refer between 5–12 Ω·m at a landfill in Belfort (France), and Ugbor et al. [43] registered values of 3.12–8.7 Ω·m in the surroundings of the Onitsha waste dump in southeast Nigeria. To the southwest of the natural basin reception, there is a subplume of contamination resulting from new depositions producing leachate that migrates to the southwest during the wet season and in all directions during the dry season (profile 4). The spatialization of the plumes shows that as one moves away from the dump, the anomalies tend to disappear (profile 3), suggesting the attenuation of the contamination by the local lithology. The role of lithology and groundwater in the attenuation of contamination by leachate plumes in the surrounding of waste dumps has been described in many studies, for example by Fatoba et al. [53] and Biosca et al. [57].

4. Conclusions

The application of the electrical resistivity method to the study of the dynamics of contamination plumes around the Hulene-B waste dump has proven to be efficient in identifying anomalous areas of low resistivity that we consider as leachate production and contamination plume migration zones in lithological substrates and surface and groundwater.
The analysis of the dynamics of the possible contamination plumes showed that summer (2020) occupies an extensive area and with strong horizontal and vertical migration, which may be associated with the greater production of leachates by the greater decomposition of waste in the hot and rainy period (Profiles 1a, 2a). Conversely, in winter (2021), the contamination plumes were thick with a predominantly vertical movement, which allows for a large vertical migration to great depths, causing extensive subsurface anomalies in the lithologies above the groundwater (Profiles 1b and 4b). Unusually, Profile 3 showed that the southern part is partially affected by the large plume described in profile 2, without significant variations in both analysed seasons.
The contamination plumes in the two study seasons (2020–2021) show predominantly an E–W movement (profiles 1 and 2). In profile 3, the movement was in the S–N direction and was influenced by the diffusion of the large plume described in profile 2. In profile 4, the plume assumes a NE–SW movement, and its enrichment is associated with the new deposition at the SW limit of the natural leachate reception basin. The four overlapping profiles show that leachate enrichment zones play a relevant role in the direction of flow and migration of contamination plumes in lithologies, groundwater and surface water.
The spatialized electrical resistivity models at the studied stations show that the anomalies in the subsurface environment decrease as one moves away from the dump to the north (profile 3), which reveals the attenuating effect of groundwater and lithological substrates. Thus, the resistivity models have proven to be efficient in assisting in the adoption of structural measures for monitoring the possible leachate contamination flows in the lithologies, surface and groundwater around the Hulene-B waste dump, Maputo, Mozambique. Studies are ongoing to quantify the chemical contamination of groundwater and surface water.

Supplementary Materials

The following are available online https://0-www-mdpi-com.brum.beds.ac.uk/article/10.3390/environments9020019/s1. Figure S1 (a) Resistivimeter applied in data acquisition, (b) data acquisition in January 2020 (profile 2), (c) data acquisition in profile 2 in May 2021, (d) southern section of profile 1 in 2021, (e) central section of profile 1 in 2020, (f) western section of profile 2 in 2020, (g) northern section of profile 3, (h) electrode connection in the northwest section of profile 4 in 2021.

Author Contributions

Conceptualization, B.B. and F.R.; methodology, B.B.; software, B.B.; validation, B.B., C.C. and F.R.; formal analysis, F.R.; investigation, B.B.; resources, B.B.; data curation, B.B.; writing—original draft preparation, B.B.; writing—review and editing, B.B. and F.R.; visualization, B.B.; supervision, F.R. and C.C.; project administration, F.R.; funding acquisition, B.B. All authors have read and agreed to the published version of the manuscript.

Funding

This work was partially supported by GeoBioTec (UIDB/04035/2020) Research Centre, funded by FEDER funds through the Operational Program Competitiveness Factors COMPETE and by National funds through FCT. The first author acknowledges grants from the Portuguese Institute Camões and FNI (Investigation National Fund—Mozambique).

Institutional Review Board Statement

Not applicable.

Informed Consent Statement

Not applicable.

Data Availability Statement

Not applicable.

Conflicts of Interest

The authors declare no conflict of interest.

References

  1. Brahmi, S.; Baali, F.; Hadji, R.; Brahmi, S.; Hamad, A.; Rahal, O.; Zerrouki, H.; Saadali, B.; Hamed, Y. Assessment of groundwater and soil pollution by leachate using electrical resistivity and induced polarization imaging survey, case of Tebessa municipal landfill, NE Algeria. Arab. J. Geosci. 2021, 14, 1–13. [Google Scholar] [CrossRef]
  2. Ooi, J.; Woon, K.S. Simultaneous Greenhouse Gas Reduction and Cost Optimization of Municipal Solid Waste Management System in Malaysia. Chem. Eng. Trans. 2021, 83, 487–492. [Google Scholar] [CrossRef]
  3. Ferronato, N.; Torretta, V. Waste Mismanagement in Developing Countries: A Review of Global Issues. Int. J. Environ. Res. Public Health 2019, 16, 1060. [Google Scholar] [CrossRef] [PubMed] [Green Version]
  4. Nanda, S.; Berruti, F. Municipal solid waste management and landfilling technologies: A review. Environ. Chem. Lett. 2020, 19, 1433–1456. [Google Scholar] [CrossRef]
  5. Marino, A.; Pariso, P. Comparing European countries’ performances in the transition towards the Circular Economy. Sci. Total Environ. 2020, 729, 138142. [Google Scholar] [CrossRef]
  6. Koliyabandara, S.; Asitha, T.C.; Sudantha, L.; Siriwardana, C. Assessment of the impact of an open dumpsite on the surface water quality deterioration in Karadiyana, Sri Lanka. Environ. Nanotechnol. Monit. Manag. 2020, 14, 100371. [Google Scholar] [CrossRef]
  7. Morita, A.K.; Ibelli-Bianco, C.; Anache, J.A.; Coutinho, J.V.; Pelinson, N.S.; Nobrega, J.; Rosalem, L.M.; Leite, C.M.; Niviadonski, L.M.; Manastella, C.; et al. Pollution threat to water and soil quality by dumpsites and non-sanitary landfills in Brazil: A review. Waste Manag. 2021, 131, 163–176. [Google Scholar] [CrossRef]
  8. Wijekoon, P.; Koliyabandara, P.A.; Cooray, A.T.; Lam, S.S.; Athapattu, B.C.; Vithanage, M. Progress and prospects in mitigation of landfill leachate pollution: Risk, pollution potential, treatment and challenges. J. Hazard. Mater. 2021, 421, 126627. [Google Scholar] [CrossRef]
  9. Jayawardhana, Y.; Kumarathilaka, P.; Herath, I.; Vithanage, M. Municipal Solid Waste Biochar for Prevention of Pollution from Landfill Leachate. In Environmental Materials and Waste; Academic Press: Cambridge, MA, USA, 2016; pp. 117–148. [Google Scholar] [CrossRef]
  10. Wang, F.; Song, K.; He, X.; Peng, Y.; Liu, D.; Liu, J. Identification of Groundwater Pollution Characteristics and Health Risk Assessment of a Landfill in a Low Permeability Area. Int. J. Environ. Res. Public Health 2021, 18, 7690. [Google Scholar] [CrossRef]
  11. Kumar, G.; Reddy, K.R.; McDougall, J. Numerical modeling of coupled biochemical and thermal behavior of municipal solid waste in landfills. Comput. Geotech. 2020, 128, 103836. [Google Scholar] [CrossRef]
  12. Khattak, S.A.; Rashid, A.; Tariq, M.; Ali, L.; Gao, X.; Ayub, M.; Javed, A. Potential risk and source distribution of groundwater contamination by mercury in district Swabi, Pakistan: Application of multivariate study. Environ. Dev. Sustain. 2020, 23, 2279–2297. [Google Scholar] [CrossRef]
  13. Iddrisu, T.I.; Debrah, K.D. Consequences of Poor Landfill Management on the People of Gbalahi in the Sagnarigu Municipality of Northern Ghana. J. Geosci. Environ. Prot. 2021, 9, 211–224. [Google Scholar] [CrossRef]
  14. Tvedten, I.; Candiracci, S. Flooding our eyes with rubbish: Urban waste management in Maputo, Mozambique. Environ. Urban. 2018, 30, 631–646. [Google Scholar] [CrossRef]
  15. Serra, C. Da Problemática Ambiental à Mudança: Rumo à um Mundo Melhor; Editora Escolar: Lisboa, Portugal, 2012. [Google Scholar]
  16. Cendón, D.I.; Haldorsen, S.; Chen, J.; Hankin, S.; Nogueira, G.; Momade, F.; Achimo, M.; Muiuane, E.; Mugabe, J.; Stigter, T.Y. Hydrogeochemical aquifer characterization and its implication for groundwater development in the Maputo district, Mozambique. Quat. Int. 2019, 547, 113–126. [Google Scholar] [CrossRef]
  17. Vicente, E.M.; Jermy, C.A.; Schreiner, H.D. Urban geology of Maputo, Mocambique. Geol. Soc. 2006, 338, 1–13. Available online: https://citeseerx.ist.psu.edu/viewdoc/download?doi=10.1.1.606.7220&rep=rep1&type=pdf (accessed on 28 January 2020).
  18. Bernardo, B.; Candeias, C.; Rocha, F. Application of Geophysics in geo-environmental diagnosis on the surroundings of the Hulene-B waste dump, Maputo, Mozambique. J. Afr. Earth Sci. 2021, 185, 104415. [Google Scholar] [CrossRef]
  19. Helene, L.P.I.; Moreira, C.A. Analysis of Leachate Generation Dynamics in a Closed Municipal Solid Waste Landfill by Means of Geophysical Data (DC Resistivity and Self-Potential Methods). Pure Appl. Geophys. Pageoph 2021, 178, 1355–1367. [Google Scholar] [CrossRef]
  20. Kayode, J.S.; Arifin, M.H.; Nawawi, M.N.M. Characterization of a Proposed Quarry Site using Multi-Electrode Electrical Resistivity Tomography. Sains Malays. 2019, 48, 945–963. [Google Scholar] [CrossRef]
  21. Lau, A.M.P.; Ferreira, F.J.F.; Stevanato, R.; Filho, E.F.D.R. Geophysical and physicochemical investigations of an area contaminated by tannery waste: A case study from southern Brazil. Environ. Earth Sci. 2019, 78, 1–16. [Google Scholar] [CrossRef]
  22. Bichet, V.; Grisey, E.; Aleya, L. Spatial characterization of leachate plume using electrical resistivity tomography in a landfill composed of old and new cells (Belfort, France). Eng. Geol. 2016, 211, 61–73. [Google Scholar] [CrossRef]
  23. Bernstone, C.; Dahlin, T.; Ohlsson, T.; Hogland, H. DC-resistivity mapping of internal landfill structures: Two pre-excavation surveys. Environ. Earth Sci. 2000, 39, 360–371. [Google Scholar] [CrossRef] [Green Version]
  24. Nassereddine, M.; Rizk, J.; Nasserddine, G. Soil Resistivity Structure and Its Implication on the Pole Grid Resistance for Transmission Lines. Int. J. Electr. Comput. Eng. 2013, 7, 19–23. [Google Scholar]
  25. Palalane, j.; Segala, I.; Opressa, I. Urbanização e Desenvolvimento Municipal em Moçambique: Gestão de Resíduos Sólidos. Instituto Brasileiro de Administração Municipal, Área de Desenvolvimento Urbano e Meio Ambiente, RJ, 2008, 12. Available online: https://www.scribd.com/document/419123335/Gestao-de-Residuos-Solidos-Em-Mocambique (accessed on 5 August 2021).
  26. Ferrão., D.A.G. Evaluation of Removal and Disposal of Solid Waste in Maputo City, Mozambique. Master’s Thesis, University of Cape Town, Cape Town, South Africa, 2006. Available online: http://hdl.handle.net/11427/4851 (accessed on 30 August 2021).
  27. Wang, X.-X.; Chang, Y.-B.; Deng, J.-Z.; Chen, J.-S. 3D spatial distribution of old landfills and groundwater pollution from electrical resistivity tomography with fuzzy set theory. Explor. Geophys. 2021, 1–9. [Google Scholar] [CrossRef]
  28. Dhakate, R.; Mogali, N.J.; Modi, D. Characterization of proposed waste disposal site of granite quarry pits near Hyderabad using hydro-geophysical and groundwater modeling studies. Environ. Earth Sci. 2021, 80, 1–20. [Google Scholar] [CrossRef]
  29. Adamo, N.; Al-Ansari, N.; Sissakian, V.; Laue, J.; Knutsson, S. Geophysical Methods and their Applications in Dam Safety Monitoring. J. Earth Sci. Geotech. Eng. 2020, 11, 291–345. [Google Scholar] [CrossRef]
  30. Sallwey, J.; Hettiarachchi, H.; Hülsmann, S. Challenges and opportunities in municipal solid waste management in Mozambique: A review in the light of nexus thinking. AIMS Environ. Sci. 2017, 4, 621–639. [Google Scholar] [CrossRef]
  31. Bandeira, J.; Paula, S. The Maputo Bay Ecosystem; Western Indian Ocean Marine Science Association (WIOMSA): Zanzibar Town, Tanzania, 2014; p. 427. Available online: https://www.biofund.org.mz/wp-content/uploads/2019/02/1550049666-Je02-036.pdf (accessed on 30 July 2021).
  32. INAM [Mozambique National Meteorological Institute]. Available online: https://www.inam.gov.mz/index.php/pt/ (accessed on 28 January 2020).
  33. Muchimbane, A.B.D. Estudo dos Indicadores da Contaminação das Aguas Subterrâneas por Sistemas de Saneamento in Situ–Distrito Urbano 4, Cidade de Maputo, Moçambique. Master’s Thesis, USP Instituto de Geociências, São Paulo, Brasil, 2010. [Google Scholar] [CrossRef]
  34. CIAT; World Bank. Climate-Smart Agriculture in Mozambique; International Center for Tropical Agriculture: Cali, Colombia, 2017; pp. 1–25. [Google Scholar]
  35. Nogueira, G.; Stigter, T.; Zhou, Y.; Mussa, F.; Juizo, D. Understanding groundwater salinization mechanisms to secure freshwater resources in the water-scarce city of Maputo, Mozambique. Sci. Total Environ. 2018, 661, 723–736. [Google Scholar] [CrossRef]
  36. Oliveira, J.T.; Dias, R.P.; Pereira, A. Cooperaça o Entre Portugal e Moçambique na Área das Geociencias 1986–2012; Laboratório Nacional de Energia e Geologia–LNEG: Amadora, Portugal, 2012; pp. 23–26. ISBN 978-989-675-026-8. Available online: https://repositorio.lneg.pt/bitstream/10400.9/3336/1/35652.pdf (accessed on 28 January 2020).
  37. Mama, C.N.; Nnaji, C.C.; Nnam, J.P.; Opata, O.C. Environmental burden of unprocessed solid waste handling in Enugu State, Nigeria. Environ. Sci. Pollut. Res. 2021, 28, 19439–19457. [Google Scholar] [CrossRef]
  38. Udosen, N.I. Geo-electrical modeling of leachate contamination at a major waste disposal site in south-eastern Nigeria. Model. Earth Syst. Environ. 2021, 1–10. [Google Scholar] [CrossRef]
  39. Touzani, M.; Mohsine, I.; Ouardi, J.; Kacimi, I.; Morarech, M.; El Bahajji, M.; Bouramtane, T.; Tiouiouine, A.; Yameogo, S.; El Mahrad, B. Mapping the Pollution Plume Using the Self-Potential Geophysical Method: Case of Oum Azza Landfill, Rabat, Morocco. Water 2021, 13, 961. [Google Scholar] [CrossRef]
  40. Dos Muchangos, A. Paisagens e Regiões Naturais, Maputo; Editora Escolar: Lisboa, Portugal, 1999; pp. 5–163. [Google Scholar]
  41. Arifin, M.H.; Kayode, J.S.; Khairel, M.; Abdul, I.; Abdullah, M.; Shahidah, M.N.; Azmi, A. Environmental hazard assessment of industrial and municipal waste materials with the applications of RES2-D method and 3-D Oasis Montaj modeling: A case study at Kepong, Kuala Lumpur, Peninsula Malaysia. J. Hazard. Mater. 2020, 406, 124282. [Google Scholar] [CrossRef]
  42. Geotomo. RES2DINV ver. 3.59—Rapid 2-D Resistivity & IP Inversion using the Least-Squares Method Wenner (α,β,γ), Dipole-Dipole, Inline Pole-Pole, Pole-Dipole, Equatorial Dipole-Dipole, Offset Pole-Dipole, Wenner-Schlumberger, Gradient and Non-Conventional Arrays, 2010, 1–148. Available online: http://epsc.wustl.edu/~epsc454/instruction-sheets/Res2dinv03.59.pdf (accessed on 28 January 2020).
  43. Ugbor, C.C.; Ikwuagwu, I.E.; Ogboke, O.J. 2D inversion of electrical resistivity investigation of contaminant plume around a dumpsite near Onitsha expressway in southeastern Nigeria. Sci. Rep. 2021, 11, 1–14. [Google Scholar] [CrossRef]
  44. Nta, S.A.; Ayotamuno, M.J.; Igoni, A.H.; Okparanma, R.N. Leachate Characterization from Municipal Solid Waste Dump Site and Its Adverse Impacts on Surface Water Quality Downstream—Uyo Village Road, Akwa Ibom State—Nigeria. J. Eng. Res. Rep. 2020, 13, 11–19. [Google Scholar] [CrossRef]
  45. Qiu, L.; Yang, Y.; Ma, L.; Qiao, J. Research on the Electrical Resistivity Characteristics of Statue Remolded Soil. IOP Conf. Series: Earth Environ. Sci. 2021, 692, 042076. [Google Scholar] [CrossRef]
  46. Ejiogu, B.C.; Opara, A.; Nwosu, E.I.; Nwofor, O.K.; Onyema, J.C.; Chinaka, J.C. Estimates of aquifer geo-hydraulic and vulnerability characteristics of Imo State and environs, Southeastern Nigeria, using electrical conductivity data. Environ. Monit. Assess. 2019, 191, 238. [Google Scholar] [CrossRef]
  47. Koda, E.; Tkaczyk, A.; Lech, M.; Osiński, P. Application of Electrical Resistivity Data Sets for the Evaluation of the Pollution Concentration Level within Landfill Subsoil. Appl. Sci. 2017, 7, 262. [Google Scholar] [CrossRef]
  48. Vasantrao, B.M.; Bhaskarrao, P.J.; Mukund, B.A.; Baburao, G.R.; Narayan, P.S. Comparative study of Wenner and Schlumberger electrical resistivity method for groundwater investigation: A case study from Dhule district (M.S.), India. Appl. Water Sci. 2017, 7, 4321–4340. [Google Scholar] [CrossRef] [Green Version]
  49. VOA. Desabamento de Lixeira Deixa 17 Mortos em Maputo. Voice of America News. 2018. Available online: https://www.voaportugues.com/a/desabamento-lixeira-17-mortos-maputo/4260624.html (accessed on 30 September 2021).
  50. Wu, Q.; Hu, W.; Wang, H.; Liu, P.; Wang, X.; Huang, B. Spatial distribution, ecological risk and sources of heavy metals in soils from a typical economic development area, Southeastern China. Sci. Total Environ. 2021, 780, 146557. [Google Scholar] [CrossRef]
  51. Ololade, O.O.; Mavimbela, S.; Oke, S.A.; Makhadi, R. Impact of Leachate from Northern Landfill Site in Bloemfontein on Water and Soil Quality: Implications for Water and Food Security. Sustainability 2019, 11, 4238. [Google Scholar] [CrossRef] [Green Version]
  52. Chaudhary, R.; Nain, P.; Kumar, A. Temporal variation of leachate pollution index of Indian landfill sites and associated human health risk. Environ. Sci. Pollut. Res. 2021, 28, 28391–28406. [Google Scholar] [CrossRef] [PubMed]
  53. Fatoba, J.O.; Eluwole, A.B.; Sanuade, O.A.; Hammed, O.S.; Igboama, W.N.; Amosun, J.O. Geophysical and geochemical assessments of the environmental impact of Abule-Egba landfill, southwestern Nigeria. Model. Earth Syst. Environ. 2020, 7, 695–701. [Google Scholar] [CrossRef]
  54. Barry, A.; Yameogo, S.; Ayach, M.; Jabrane, M.; Tiouiouine, A.; Nakolendousse, S.; Lazar, H.; Filki, A.; Touzani, M.; Mohsine, I. Mapping Contaminant Plume at a Landfill in a Crystalline Basement Terrain in Ouagadougou, Burkina Faso, Using Self-Potential Geophysical Technique. Water 2021, 13, 1212. [Google Scholar] [CrossRef]
  55. Harjito, S.; Gunawan, T.; Maskuri, M. Underground leachate distribution based on electrical resistivity tomography in Piyungan landfill, Bantul. Indones. J. Geogr. 2018, 50, 34–40. [Google Scholar] [CrossRef]
  56. El Mouine, Y.; El Hamdi, A.; Morarech, M.; Kacimi, I.; Touzani, M.; Mohsine, I.; Tiouiouine, A.; Ouardi, J.; Zouahri, A.; Yachou, H.; et al. Landfill Pollution Plume Survey in the Moroccan Tadla Using Spontaneous Potential. Water 2021, 13, 910. [Google Scholar] [CrossRef]
  57. Biosca, B.; Arévalo-Lomas, L.; Izquierdo-Díaz, M.; Díaz-Curiel, J. Detection of chlorinated contaminants coming from the manufacture of lindane in a surface detritic aquifer by electrical resistivity tomography. J. Appl. Geophys. 2021, 191, 104358. [Google Scholar] [CrossRef]
Figure 1. (a) Location, geophysical survey lines and environment context (b) geology and topography. Adapted by Oliveira et al. [36].
Environments 09 00019 g001
Figure 2. Electrical resistivity model of profile 1, 2020, (a) and 2021 (b).
Environments 09 00019 g002
Figure 3. Geophysical surveys: (a) profile 1 in 2020—the arrow indicates the surface leachate concentration ditch parallel to the profile 1; (b) drainage ditch with uninsulated surface leachate 2021; (c) southern section of profile 1 in 2021.
Environments 09 00019 g003
Figure 4. Electrical resistivity model of profile 2, 2020 (a) and 2021 (b).
Environments 09 00019 g004
Figure 5. Electrical resistivity model of profile 3 in 2020 (a) and 2021 (b).
Environments 09 00019 g005
Figure 6. Electrical resistivity model of profile 4 in 2020 (a) and 2021 (b).
Environments 09 00019 g006
Figure 7. Possible flow directions of contamination plumes 2020–2021, modified from Bernardo et al. [18].
Environments 09 00019 g007
Publisher’s Note: MDPI stays neutral with regard to jurisdictional claims in published maps and institutional affiliations.

