Article

FMECA Application in Tomotherapy: Comparison between Classic and Fuzzy Methodologies

1
Department of Engineering, University of Palermo, Viale delle Scienze-Parco d’Orléans, 90128 Palermo, Italy
2
Department of Physics, University of Milan, Via Celoria 16, 20133 Milan, Italy
3
DSBCO Department, University of Milan, Via Commenda 10, 20122 Milan, Italy
*
Author to whom correspondence should be addressed.
Submission received: 23 February 2022 / Revised: 1 April 2022 / Accepted: 6 April 2022 / Published: 10 April 2022

Abstract

:
Accident analysis in radiotherapy highlighted the need to increase quality assurance (QA) programs by the identification of failures/errors with very low probability (rare event) but very severe consequences. In this field, a Failure Mode, Effects and Criticality Analysis (FMECA) technique, used in various industrial processes to rank critical events, has been met with much interest. The literature describes different FMECA methods; however, it is necessary to understand if these tools are incisive and effective in the healthcare sector. In this work, comparisons of FMECA methodologies in the risk assessment of patients undergoing treatments performed with helical tomotherapy are reported. Failure modes identified for the phases “treatment planning” and “treatment execution” are classified using the Risk Priority Number (RPN) index. Differences and similarities in the classification of failures/errors of the examined FMECA approaches are highlighted.

1. Introduction

Helical tomotherapy (HT) is a radiotherapy (RT) technique that combines intensity-modulated RT (IMRT) and image-guided RT (IGRT), thereby allowing dose escalation to the tumor while reducing doses to adjacent normal tissues.
The continuous technological development of devices used in RT processes has produced an increase in the complexity of operator tasks/procedures, mainly due to a close relationship between man and machine. This growing complexity has delivered new failure/error modes, some of which are not easily detectable and can have very severe consequences, although they are rare events.
Accident analysis has highlighted that it is important to use tools that are useful for performing in-depth risk analysis able to proactively identify critical failure/error modes.
FMEA (Failure Mode and Effects Analysis), initially developed by the US military and extensively used in a wide variety of industries such as nuclear power plants to identify parts of the process that are most in need of safety improvements, has become a tool suggested by the American Association of Physicists in Medicine-Task Group 100 [1,2] to ensure safety and quality in the use of radiation in medical procedures.
Failure Mode, Effects and Criticality Analysis (FMECA) transforms FMEA from a qualitative to a quantitative approach by the attribution, for each failure mode, of numerical values to risk parameters Occurrence, Detection and Severity (O, D, S) on a scale ranging from 1 to 10, and then by the calculation of the Risk Priority Number index (RPN) as a product of the above-quoted three risk parameters [3,4,5,6,7]. The RPN rank is between 1 and 10, and failure modes with a higher RPN should be corrected with a higher priority than those with a lower RPN.
Values of (O, D, S) are estimated by experts based on commonly agreed evaluation criteria, with high values denoting more important and critical conditions.
However, RPN values may not be realistic in some applications because (O, D, S) are often difficult to obtain from experts who prefer to provide linguistic-valued judgments rather than quantitative ones. Moreover, to provide equal importance to (O, D, S) could lead to the inaccurate risk ranking of critical failure modes. Another important aspect is that FMECA has as its natural field of application the industrial field, so it is essential to understand if a healthcare FMECA application is equally effective and incisive.
Various efforts have been made in the literature to enhance FMECA applications in the healthcare field and, in particular, to overcome some of the above-described drawbacks.
In this paper, different FMECA methods are applied in a tomotherapy process, and the results are compared. A risk analysis performed by researchers of the Department of Physics, University of Milan in collaboration with IRCCS Ospedale San Raffaele (Milan, Italy) for “treatment planning” and “treatment execution” is considered [8,9].
The study has made it possible to highlight advantages and weaknesses of the examined approaches, as well as differences in the classification of failure/error modes in their application to a real case.

2. Classical and Fuzzy Approach of FMECA in Healthcare

FMECA is a powerful tool for the early identification of the initiating events and the root causes of unacceptable outcomes in various hazardous industrial applications.
In 2001, this method was proposed by the Joint Commission on Accreditation of Healthcare Organizations (JCAHO) as a tool for risk prevention, and its use has been recommended by the International Commission on Radiological Protection (ICRP) to improve patient safety in modern radiotherapy treatments [10,11,12,13].
The methodology has also been identified by the American Association of Physicists in Medicine (AAPM) Task Group 100 as an effective tool in the risk analysis of modern cancer radiotherapy processes, receiving approval from many international scientific communities [1,14,15,16,17].
As a first step to applying FMECA, tasks and procedures necessary to carry out the process are described in detail and, accordingly, the following aspects are listed:
  • Failure/error modes;
  • Potential causes;
  • Failure consequences.
The next step involves the evaluation of the criticality of the identified failure/error modes.
As above mentioned, FMECA uses three risk parameters to describe each failure/error mode:
  • Occurrence index, O, which represents the probability that a particular accidental event will occur;
  • Severity index, S, which is a measure of the severity of consequences resulting from the undetected failure mode;
  • Detection index, D, related to the probability that an incipient failure will be detected before the failure occurs.
The product of these three indexes yields RPN as follows:
RPN = O × D × S
In some FMECA industrial applications, RPN is evaluated as follows:
RPN = OwO × DwD × SwS
where wO, wD and wS are weights assigned by analyst team to (O, D, S).
RPN evaluated by Equation (2) ranges between 1 and 10.
A ten-point scale is used to score each category O, D, S, with ten being the number indicating the most severe, most frequent and least detectable failure mode, respectively.
For example, D = 1 ÷ 2 is chosen by experts when the failure/error will be detected with very high probability. If experts attribute O = 5 to an adverse event, this indicates that there is medium occurrence for error/failure (error occurs once per month, or failure takes place with low frequency). Finally, S = 9 ÷ 10 specifies that failure/error results in the major injury or death of a patient.
The threshold RPN value at which the risk is considered acceptable can be modified taking into account assigned values by an expert’s estimation of the significance of severity levels.
To perform FMECA, in [8,9] analysis data are collected using the Root Cause Analysis (RCA) method, a retrospective approach aimed at highlighting what happened to identify related causes.
In the RCA first step, a small number of operators collect data about the occurred event and carry out a chronological description of the incident. The working group performs inspections and reviews adopted procedures and guidelines to ascertain the adequacy of the applied controls. In the second step, a review of the literature regarding the adverse event is carried out. Finally, a “fishbone” diagram (Figure 1), also known as an Ishikawa diagram [18], helps to identify in the brainstorming process possible causes of the event that might not otherwise be considered. The diagram is made up of a horizontal line (fish backbone), which represents the event itself and spines of the fish that represent a specific category of potential contributors to the event.
The team then reviews potential causes and identifies the “most likely” root cause.
Failure/error modes are ranked using the RPN evaluated by Equation (1).
The most important limitations of this approach, as reported in the literature, are summarized below:
  • Relative importance among (O, D, S) is not taken into consideration;
  • Different combinations of (O, D, S) produce the same RPN value (i.e., same rank order), even if risk levels are very different;
  • It is difficult for the expert to accurately assess (O, D, S) parameters.
To overcome the above issues in [5], a new approach is proposed based on Fuzzy Logic Theory.
Fuzzy FMECA is characterized by three main steps:
  • Fuzzification process: numerical values of risk parameters (O, D, S) and RPN index are converted into linguistic variables to which fuzzy sets are associated. A degree of truth of each fuzzy set is characterized by a membership function generally defined by triangular or trapezoidal distributions [19,20,21,22]. For example, let us take parameter O relating to the occurrence probability of a failure mode; its value (in the range of 1–10) can be interpreted using fuzzy labels such as “low”, “medium”, “high”, etc. Each linguistic variable can be characterized by triangular distribution that is defined by three parameters: lower limit; peak value; upper limit. Peak value corresponds to the most probable value of the set data, whereas the lower and upper limit are the lower and upper bounds of the data interval;
  • Fuzzy inference process: linguistic variables, classified as fuzzy sets, are processed using rules based on Fuzzy Logic (i.e., Fuzzy Rules of Inference). These rules are, generally, expressed as if-then conditions.
  • An example of the if-then rule is: IF occurrence, O, is “Moderate” AND detectability, D, is “Low” AND severity, S, is “High” THEN risk priority number, RPN, is Moderate.
  • Each rule has a weight w that denotes its degree of importance evaluated using weight wO, wD and wS assigned for O, D, S. More details are reported in [5];
  • Defuzzification process: it maps RPN outputs from the fuzzy domain back into the crisp domain, in the range of 1–1000. In [5], RPN crisp value is evaluated using the analytical calculation of the “center of gravity” of the area produced by the combination of fuzzy RPN outputs.

3. FMECA Application in Tomotherapy

The following phases of the process are examined [8,9]:
  • Treatment planning (volume determination and treatment planning stages);
  • Treatment execution (positioning and immobilization of the patient, execution of megavoltage (MV), computed tomography (CT) and irradiation).
Three medical physicists, two radiation oncologists, and two external physicists with experience and competence in radiation protection and risk management strategies for radiotherapy composed the working team involved in the risk analysis.
Some critical failures in treatment planning appear related to wrong tasks such as missing definition and contouring of the overlapping regions, or wrong (or not performed) choice of fundamental parameters in the planning station.
In treatment execution, some identified critical failures are related to patient identification or daily dose delivery errors. Many mistakes are recognized as the result of a lack of attention or inadequate skill of the medical physicist in charge of planning or lack of communication among medical staff.
RPN criticality threshold value is set to 80 (failure modes with a lower value are considered acceptable).
The following main results are reported in [8,9]:
  • treatment planning: 74 failure/error modes are examined, 21 of them have exceeded the threshold value;
  • treatment execution: 30 failure/error modes are examined, 9 of them have exceeded the threshold value.

3.1. Fuzzy Approach

In the field of a research project, as part of a collaboration between the Engineering Department, University of Palermo, and the Radiotherapy Department of ARNAS Civico Hospital at Palermo, a new software tool, called SAPERO, was designed and developed to support analysts in the risk analyses of radiotherapy applications.
SAPERO has a modular structure that allows the integration of different techniques:
  • Hierarchical Task Analysis (HTA) [23];
  • Cognitive Task Analysis (CTA) [24];
  • Fuzzy FMECA [5].
In this study, to deepen results obtained using the fuzzy approach, the following weight sets for (O, D, S) are used:
wO = 0.33, wD = 0.33, wS = 0.33
wO = 0.40, wD = 0.20, wS = 0.40
Equation (3) attributes the same weights to (O, D, S); Equation (4) assigns high a significance level to parameters O and S in order to emphasize the importance of occurrence and severity in radiotherapy applications.

4. Criteria of Comparison for Various FMECA Approaches

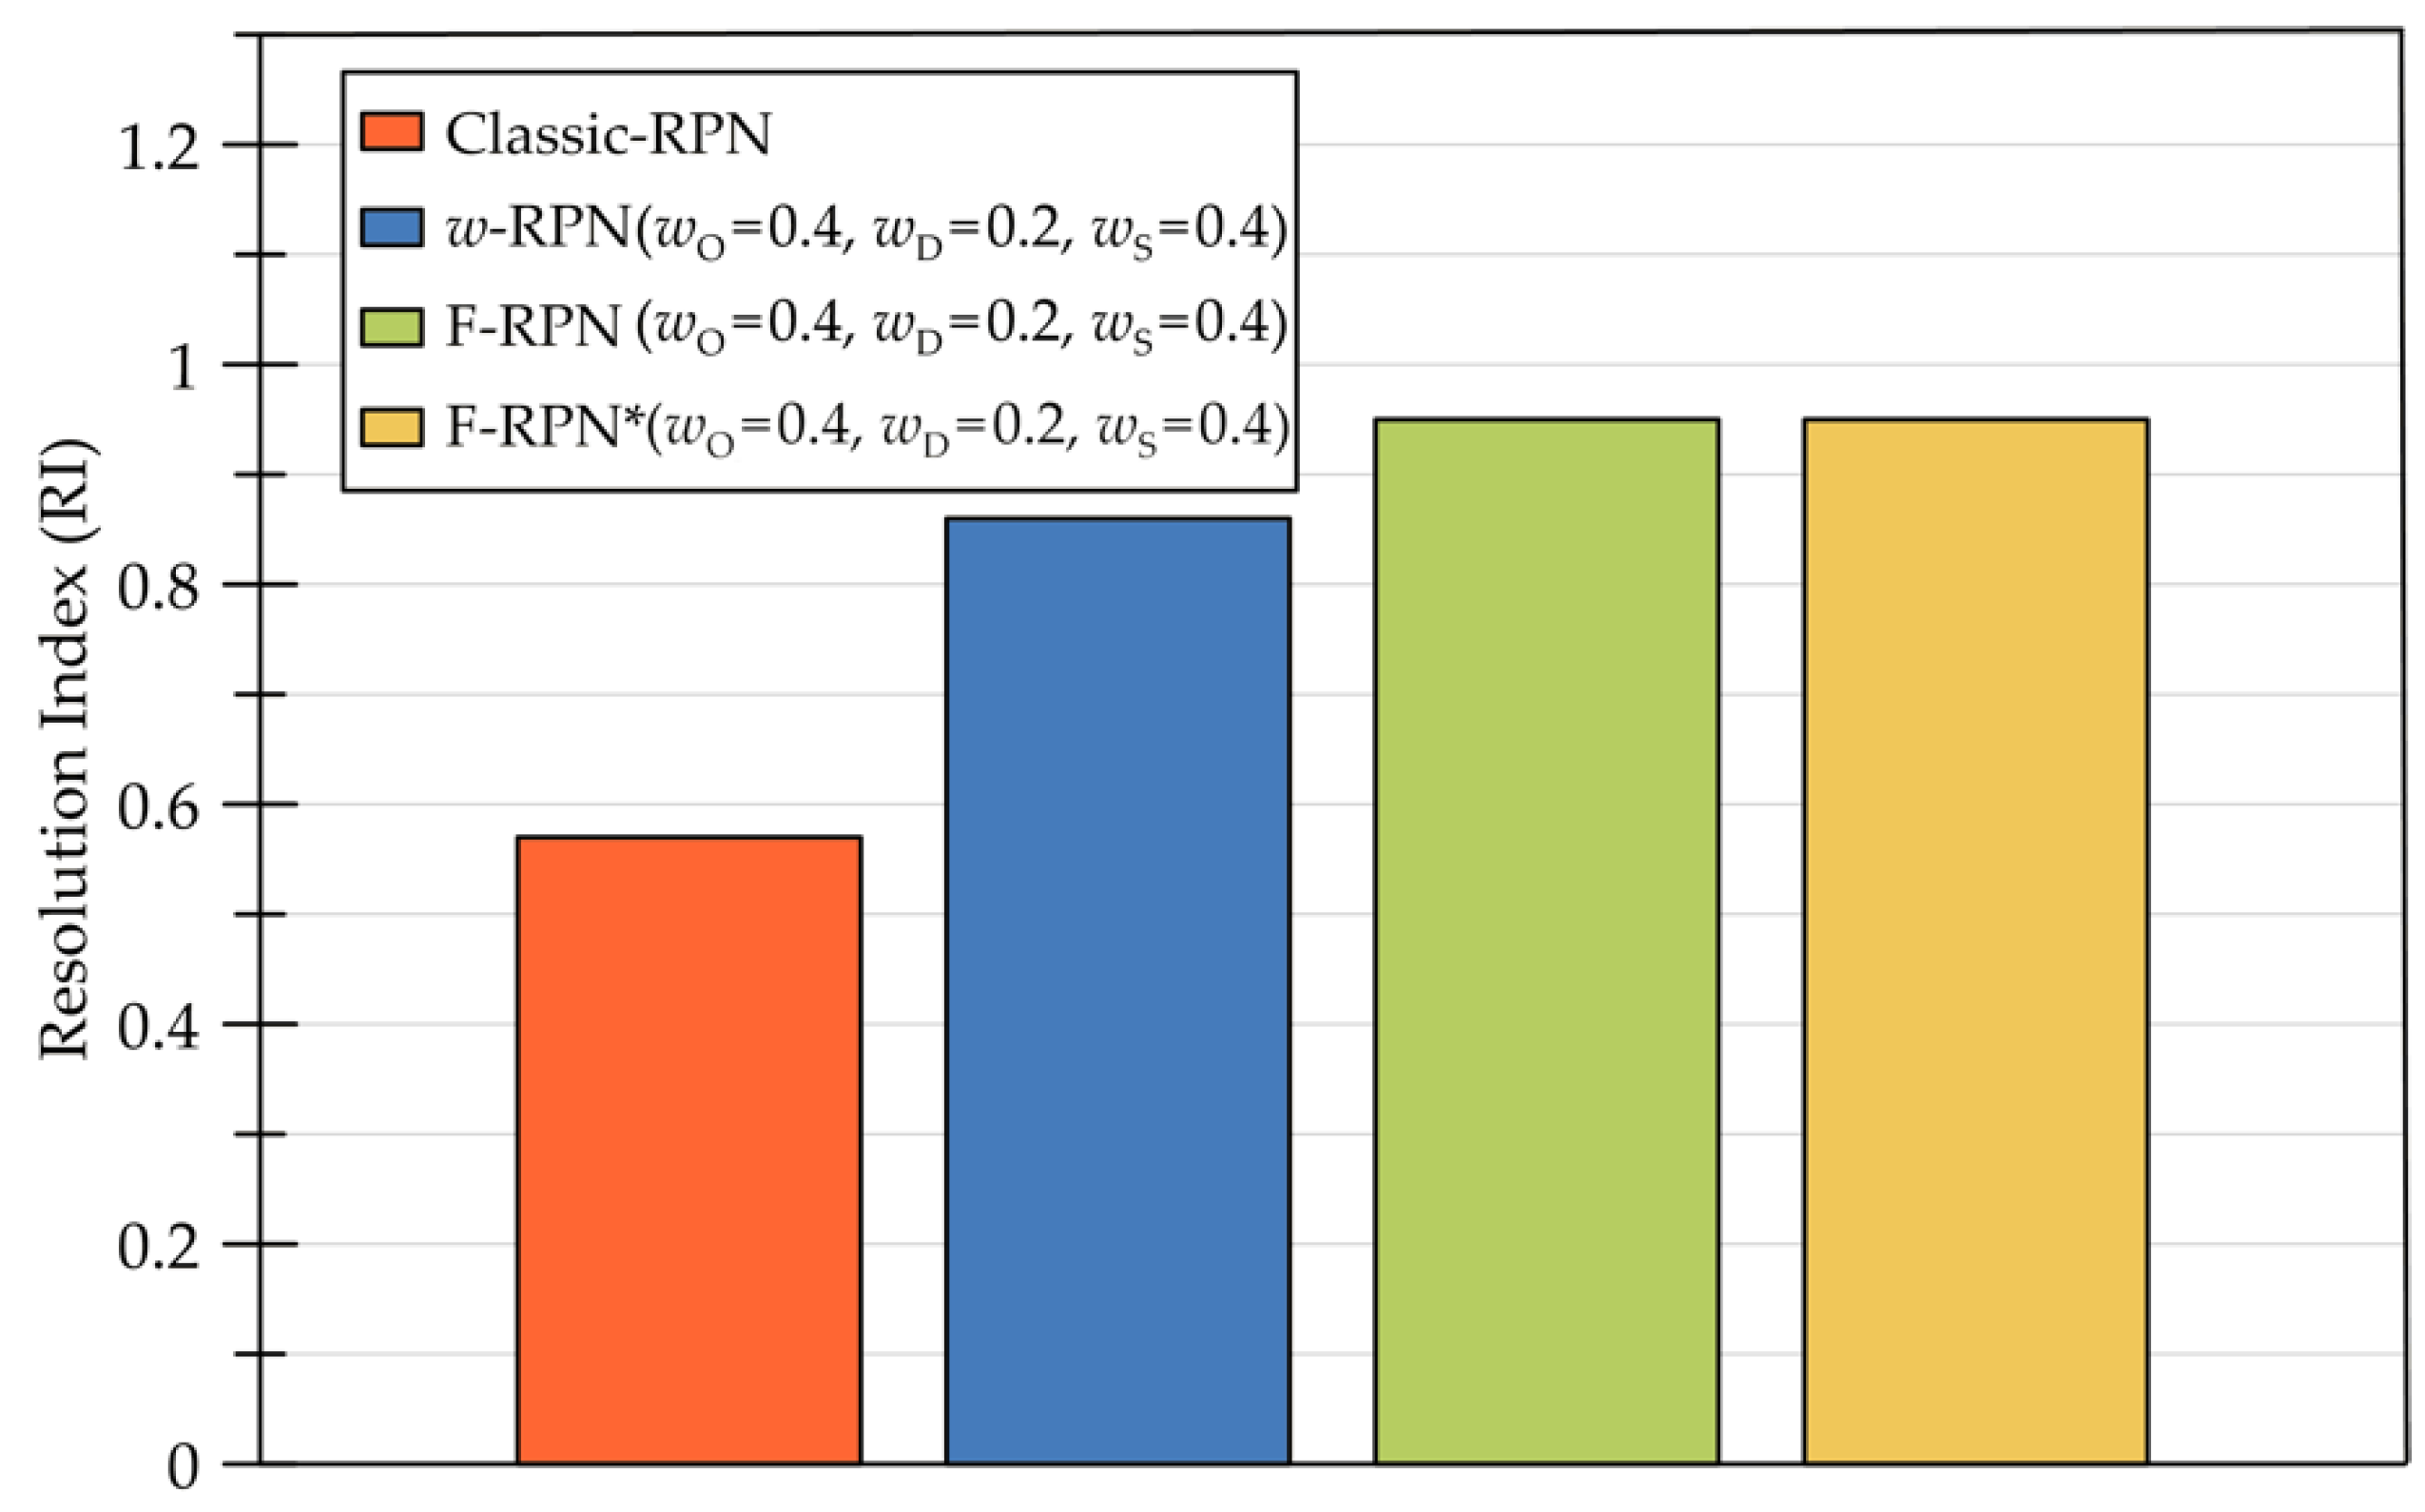
4.1. Resolving Capacity

An expert team can choose a value from 1 to 10 for each of the three risk parameters (O, D, S); this leads to the expression of a risk assessment for each failure mode in 1000 different ways.
However, Equation (1) drastically reduces the variety of judgment (120 different values for RPN).
In order to evaluate the capability of the various RPN calculation methods in keeping the expert opinions distinct, a Resolution Index (RI) is introduced and evaluated as follows:
RI = NRPN/NODS
where NRPN is the number of different RPN values (i.e., excluding O, D, S triplets that provide the same RPN) and NODS is the total number of triplets that each technique gives.
Therefore, RI measures if the method is able to distinguish values of RPN compared to the number of triplets (O, D, S). So, RI has values from 1/NODS (i.e., all O, D, S triplets provide the same RPN value) and 1 (maximum value, i.e., all O, D, S triplets are transformed into different RPN values).

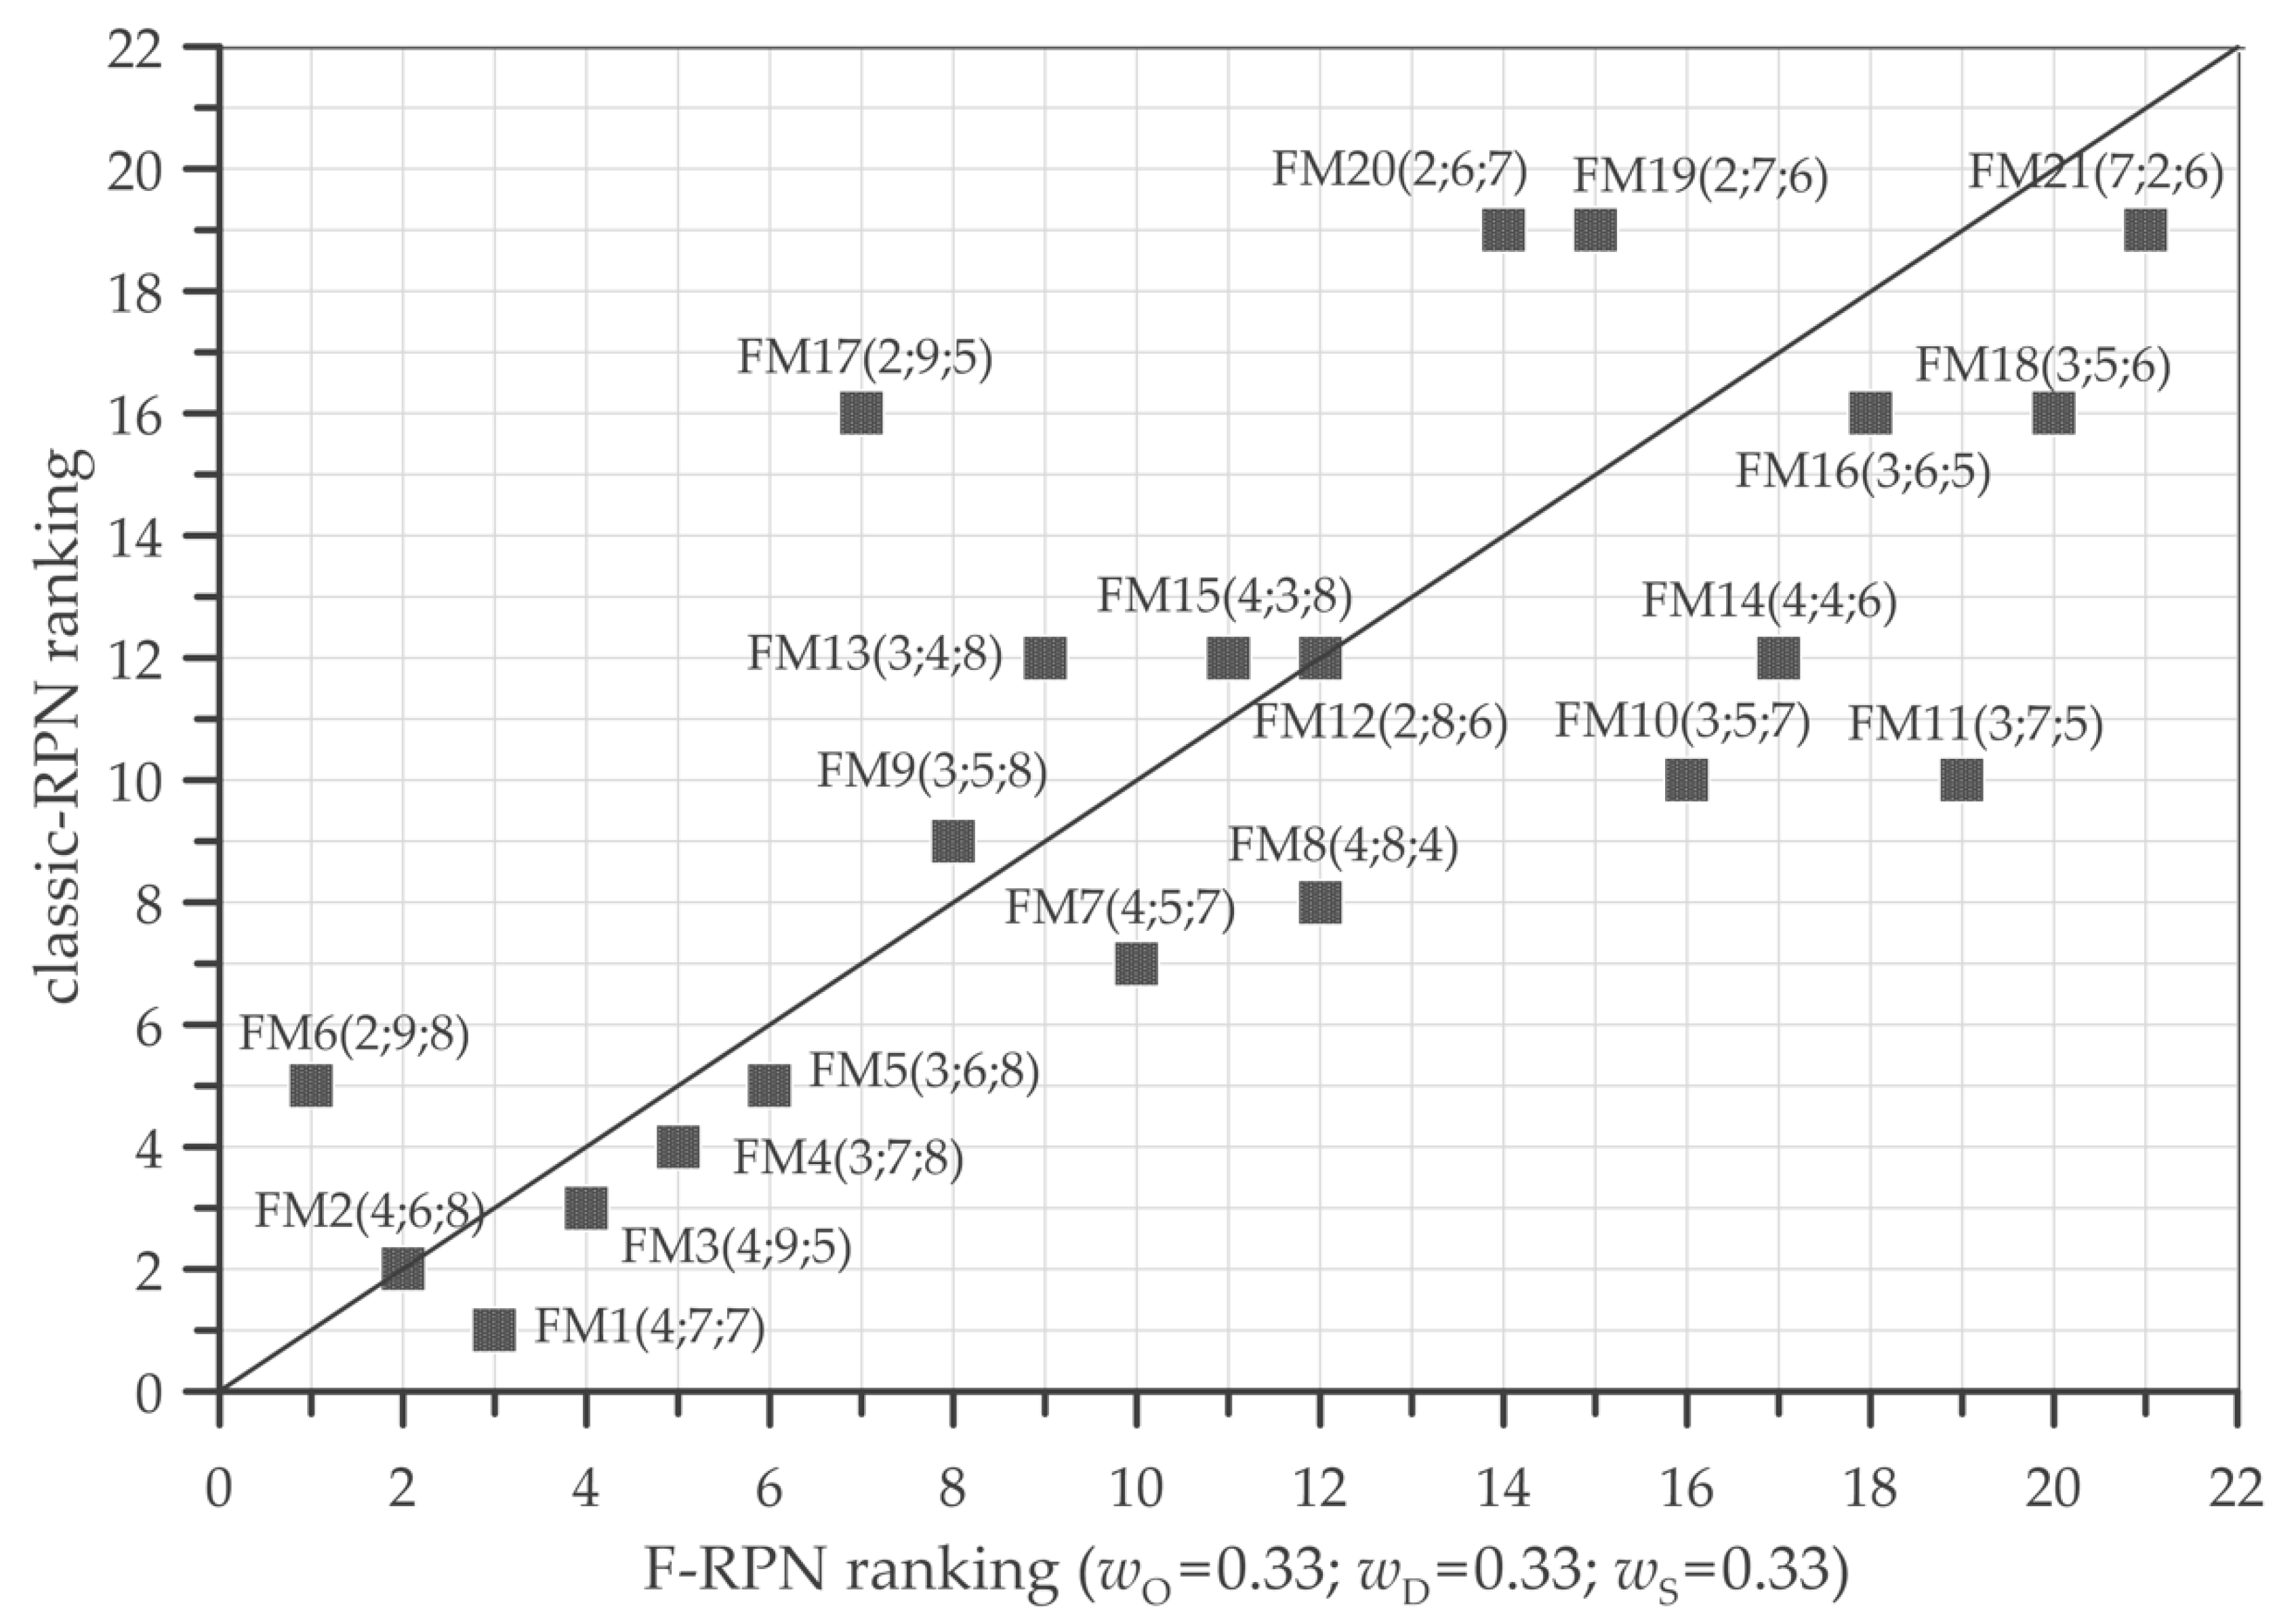
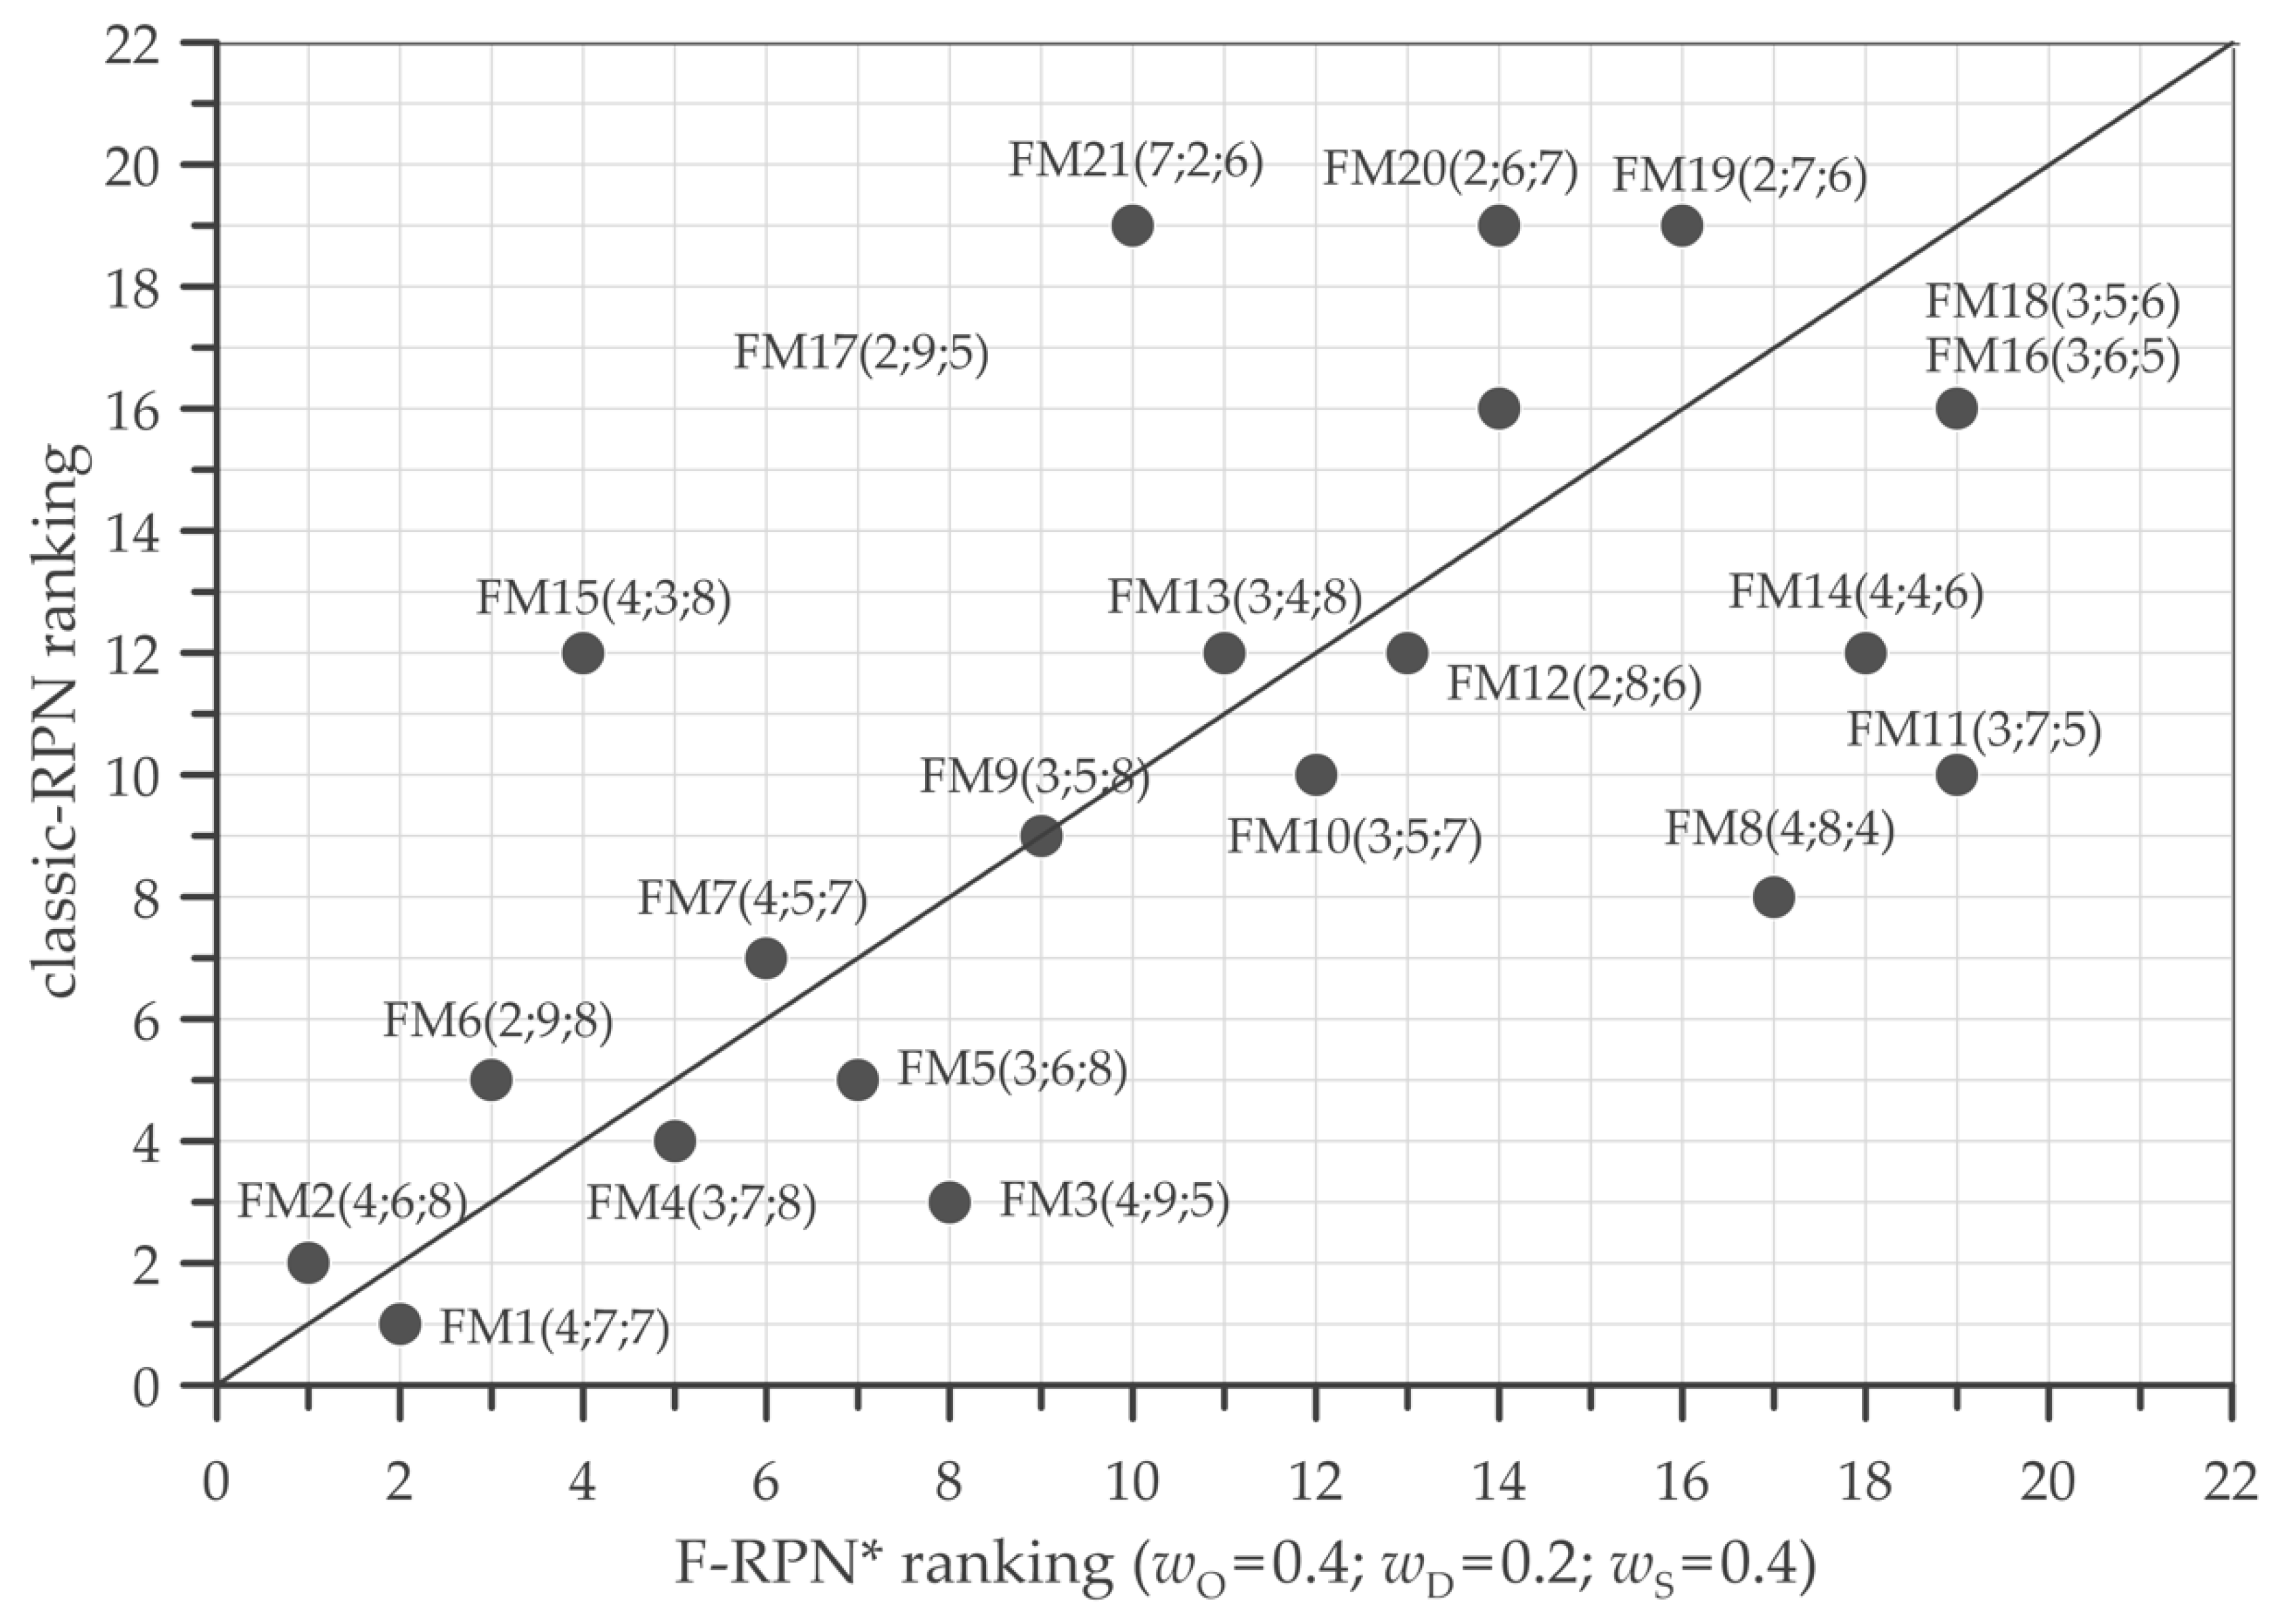
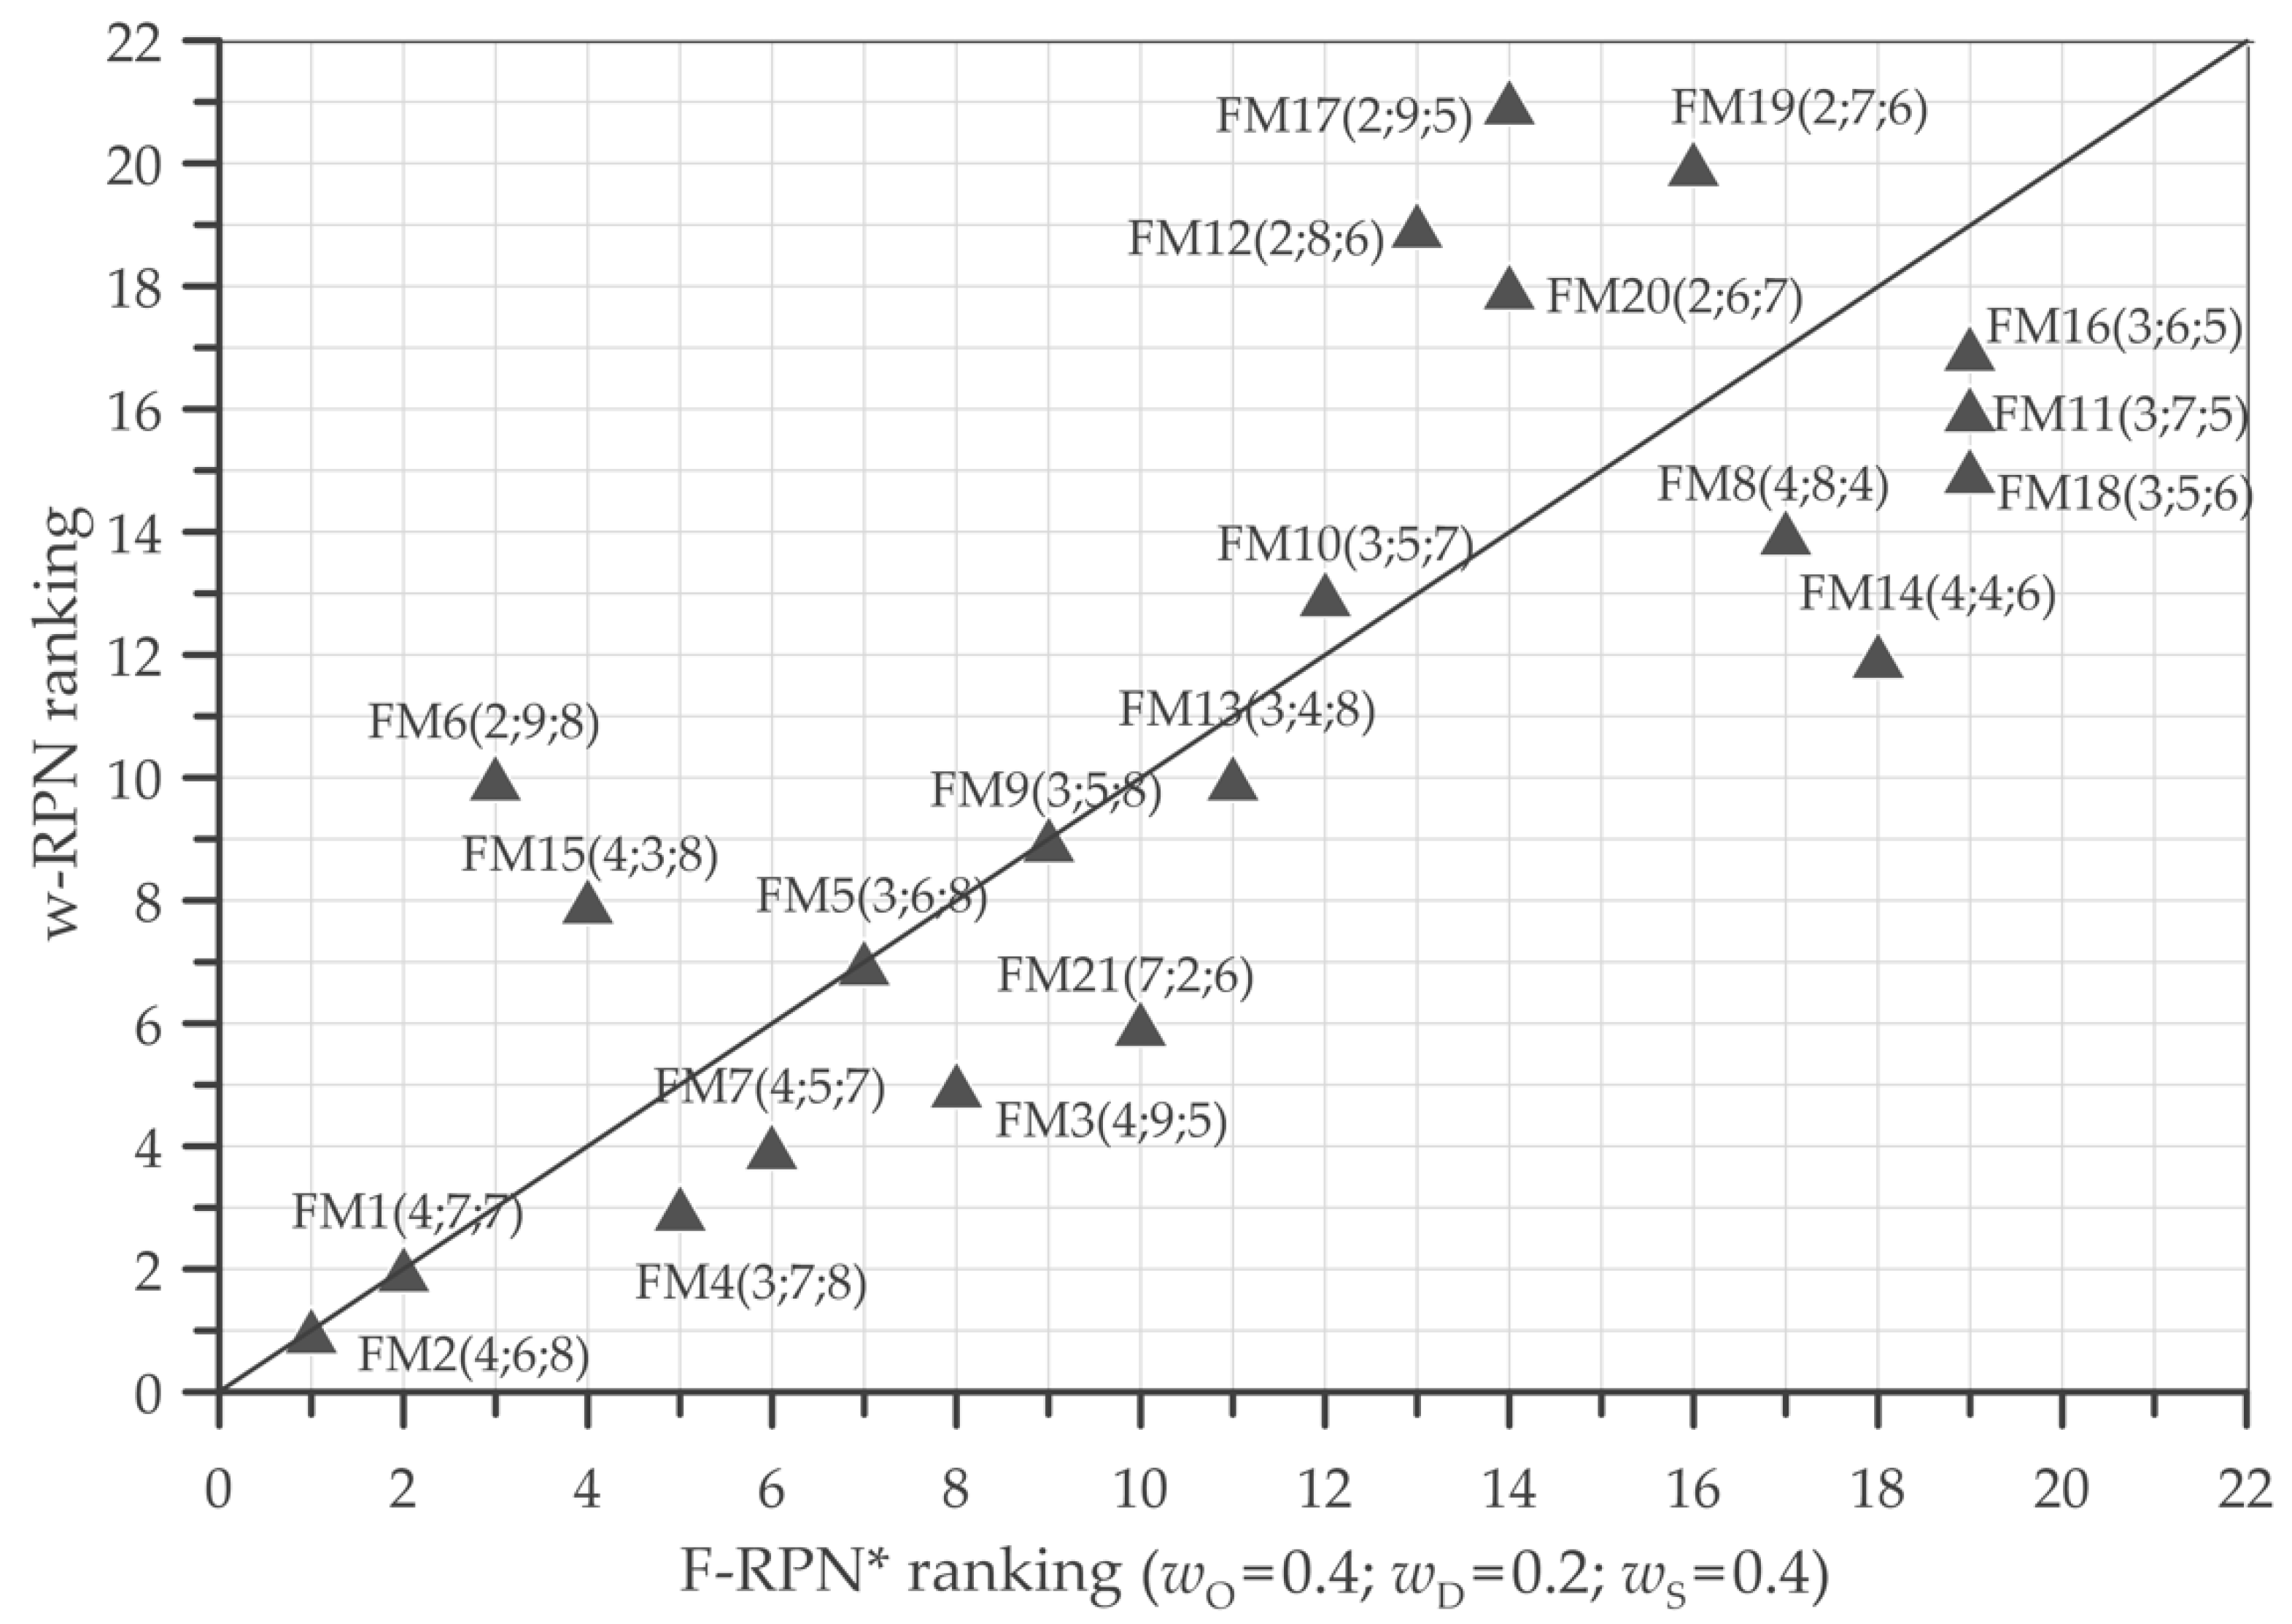
4.2. Ranking Capacity

RPN should satisfy the capability to rank failure/error modes, as well as be as consistent as possible, with opinions expressed by experts and with their “intentions” in the attribution of values for O, D, S.
To highlight this property, comparisons in pairs among the examined RPN methods are performed. This has allowed us to note changes in rank order of failure/error modes and verify if these are consistent with experts’ indications.

5. Comparison Results

5.1. Comparison of Resolving Capacity for RPN Calculation

RI index has been evaluated using four different ways to calculate RPN: product of (O, D, S) evaluated according to Equation (1) (referred to in Figure 2 as classic-RPN); weighed product of (O, D, S) evaluated according to Equation (2) (referred to in Figure 2 as w-RPN); fuzzy approach using the weights of Equation (3) (referred to in Figure 2 as F-RPN); fuzzy method using the weights of Equation (4) (referred to in Figure 2 as F-RPN *).
Comparisons, reported in Figure 2, show that the methods examined in this paper are capable of differentiating 85–95% of experts’ judgments, except for the classical approach that obtains a value of 57%.
Therefore, F-RPN, F-RPN* and w-RPN make it possible to offer a wide range of (O, D, S) combinations that result in an equally wide range of RPN values, providing experts the possibility to better transfer their opinion in different rankings useful for identifying critical events.

5.2. Ranking Capacity for RPN Calculation

RPN rankings, analyzed in this section, are related to 21 critical failure/error modes listed in [8,9] for FMECA application in “treatment planning”. Note that fuzzy RPN evaluations are performed with SAPERO software, provided by a module capable of building the fuzzy inference process described in Section 3.1.
Values attributed by experts to (O, D, S) for each failure mode and rankings obtained by FMECA methods are reported in Table 1.
Figure 3, Figure 4 and Figure 5 show comparisons in a pair of RPN rankings. This allows us to highlight the difference among methods for the failure mode prioritization, taking into account that points on the bisector point out the same rank order.
Figure 3 reports a comparison of rank order between classic-RPN and F-RPN, evaluated using weights of Equation (3).
It is noted that, in F-RPN rank order, failure mode FM6 with (O, D, S = 2, 9, 8) is the first event in the list, i.e., it is the most critical failure in the “treatment planning”. In contrast, in the classic approach, FM6 ranks No. 5 on the classic-RPN list, i.e., it has been de-classified with respect to, for example, failure mode FM1 with (O, D, S = 4, 7, 7). Note that FM1 is the first event on the classic-RPN list for which experts have proposed lower values for D, S compared to FM6. In this case, the classic method subverts the expert’s idea that intended to indicate FM6 as a significant critical event.
Moreover, failure modes FM8 with (O, D, S = 4, 8, 4) and FM9 with (O, D, S = 3, 5, 8) are characterized by very different Severity values (S = 4, no serious injury/fatality risk, S = 8, high serious injury/fatality risks, respectively). Despite this, classic-RPN ranks these failure modes with places in final standings that are very close to each other (Nos. 8 and 9, respectively). Furthermore, FM8 is considered more critical compared to FM9.
F-RPN, which ranks FM8 and FM9 with place Nos. 12 and 8, respectively, allows a better representation of the expert’s opinion to put more attention on FM9.
From all this, we can conclude that F-RPN gives a higher priority to all failure modes that have at least a couple of risk parameters defined as “high” or “very high” by experts.
Figure 4 shows the ranking of classic-RPN as a function of F-RPN*, obtained using the weights of Equation (4).
The comparison highlights that the failure mode FM6 in F-RPN* is the third event in the ranking list. This is due to the fuzzy inference process based on Equation (4) that reduces the importance of Detection (wD = 0.2) with respect to other parameters (wO = wS = 0.4). This result is also noticeable by comparison failure modes FM15 with (O, D, S = 4, 3, 8) and FM9 (O, D, S = 3, 5, 8).
Figure 5 shows a comparison between weight-RPN versus F-RPN*, both evaluated using the weights of Equation (4).
In such cases, it is noted that the rank order obtained by ω-RPN, compared to F-RPN*, de-classifies the relevance of the failure modes FM6 and FM15, although these two events have a high S.
Moreover, F-RPN* tends to increase the importance of failure modes with high D (e.g., FM12, FM17 and FM19).

6. Conclusions

Applications of the Failure Mode Effect and Criticality Analysis (FMECA) technique in radiotherapy to rank critical events have gained much interest. The literature reports various approaches aimed at extending the classic FMECA methodology, used in the industrial field, to the healthcare sector. Accordingly, it has become essential to understand whether the proposed extensions are an effective tool.
The goal of this work is to perform comparisons of results obtained using different FMECA approaches. Data of risk analysis related to “treatment planning” and “treatment execution” phases in tomotherapy available in the literature are used for comparison.
Results in terms of RI index and the comparison of pairs, applied to examined methodologies, are examined.
The study highlights differences and similarities in ranking failure/error modes, which is necessary to focus safety measures that may contribute to improving patient safety in the tomotherapy process and so to improving safety conditions that are already achieved in current clinical practice.

Author Contributions

Methodology, research design, data analyses, M.G., E.T., P.B. and M.P.; writing—review and editing, M.G., E.T., P.B., M.P., I.V. and M.C.C. All authors have read and agreed to the published version of the manuscript.

Funding

This research was funded by A.R.N.A.S-Civico, the “SicurezzA del PazientE nel settore RadioterapicO” (SA.PE.RO) Project.

Institutional Review Board Statement

Not applicable.

Informed Consent Statement

Not applicable.

Data Availability Statement

Not applicable.

Conflicts of Interest

The authors declare no conflict of interest.

References

  1. Huq, M.S.; Fraass, B.A.; Dunscombe, P.B.; Gibbons, J.P., Jr.; Ibbott, G.S.; Mundt, A.J.; Mutic, S.; Palta, J.R.; Rath, F.; Thomadsen, B.R.; et al. The report of Task Group 100 of the AAPM: Application of risk analysis methods to radiation therapy quality management. Med. Phys. 2016, 43, 4209–4262. [Google Scholar] [CrossRef] [PubMed]
  2. Thomadsen, B.R.; Dunscombe, P.; Ford, E.; Huq, S.; Pawlicki, T.; Sutlief, S. Quality and Safety in Radiotherapy: Learning the New Approaches in Task Group 100 and Beyond. In Medical Physics; Thomadsen, B., Ed.; Medical Physics Publishing, Inc.: Madison, WI, USA, 2013; pp. 274–349. ISBN 9781888340495. [Google Scholar]
  3. Bowles, J.B.; Pelaez, C.E. Fuzzy logic prioritization of failures in a system failure mode, effects and criticality analysis. Reliab. Eng. Syst. Saf. 1995, 50, 203–213. [Google Scholar] [CrossRef]
  4. Ford, E.C.; Gaudette, R.; Myers, L.; Vanderver, B.; Engineer, L.; Zellars, R.; Song, D.Y.; Wong, J.; DeWeese, T.L. Evaluation of Safety in a Radiation Oncology Setting Using Failure Mode and Effects Analysis. Int. J. Radiat. Oncol. Biol. Phys. 2009, 74, 852–858. [Google Scholar] [CrossRef] [PubMed] [Green Version]
  5. Giardina, M.; Castiglia, F.; Tomarchio, E. Risk assessment of component failure modes and human errors using a new FMECA approach: Application in the safety analysis of HDR brachytherapy. J. Radiol. Prot. 2014, 34, 891–914. [Google Scholar] [CrossRef] [PubMed]
  6. Giardina, M.; Morale, M. Safety study of an LNG regasification plant using an FMECA and HAZOP integrated methodology. J. Loss Prev. Process Ind. 2015, 35, 35–45. [Google Scholar] [CrossRef]
  7. Buffa, P.; Giardina, M.; Prete, G.; De Ruvo, L. Fuzzy FMECA analysis of radioactive gas recovery system in the SPES experimental facility. Nucl. Eng. Technol. 2021, 53, 1464–1478. [Google Scholar] [CrossRef]
  8. Broggi, S.; Cantone, M.C.; Chiara, A.; Di Muzio, N.; Longobardi, B.; Mangili, P.; Veronese, I. Application of failure mode and effects analysis (FMEA) to pretreatment phases in tomotherapy. J. Appl. Clin. Med. Phys. 2013, 14, 265–277. [Google Scholar] [CrossRef] [PubMed]
  9. Broggi, S.; Cantone, M.C.; Chiara, A.; Di Muzio, N.; Longobardi, B.; Mangili, P.; Veronese, I. Application of failure mode and effect analysis to tomotherapy treatment delivery. Radioprotection 2015, 50, 171–175. [Google Scholar] [CrossRef] [Green Version]
  10. Patient Safety Standards-Hospitals: Standard LD.5.2; Joint Commission on Accreditation of Healthcare Organizations (Ed.) Joint Commission Resources: Oakbrook Terrace, IL, USA, 2001; Available online: https://www.jointcommission.org/accreditation-and-certification/health-care-settings/hospital/learn/our-standards (accessed on 5 April 2022).
  11. López, P.O. Preventing Accidental Exposures from New External Beam Radiation Therapy Technologies; International Commission on Radiological Protection: Ottawa, ON, Canada, 2009; Volume 39, pp. 63–74. [Google Scholar] [CrossRef]
  12. Failure Mode and Effects Analysis in Health Care: Proactive Risk Reduction, 3rd ed.; Joint Commission Resources (Ed.) Joint Commission Resources: Oakbrook Terrace, IL, USA, 2010; ISBN 9781599404066. Available online: https://www.jointcommission.org/accreditation-and-certification/health-care-settings/hospital/learn/our-standards (accessed on 5 April 2022).
  13. Giardina, M.; Cantone, M.; Tomarchio, E.; Veronese, I. A Review of Healthcare Failure Mode and Effects Analysis (HFMEA) in Radiotherapy. Health Phys. 2016, 111, 317–326. [Google Scholar] [CrossRef] [PubMed]
  14. Abujudeh, H.H.; Kaewlai, R. Radiology Failure Mode and Effect Analysis: What Is It? Radiology 2009, 252, 544–550. [Google Scholar] [CrossRef] [PubMed]
  15. Younge, K.C.; Wang, Y.; Thompson, J.; Giovinazzo, J.; Finlay, M.; Sankreacha, R. Practical Implementation of Failure Mode and Effects Analysis for Safety and Efficiency in Stereotactic Radiosurgery. Int. J. Radiat. Oncol. Biol. Phys. 2015, 91, 1003–1008. [Google Scholar] [CrossRef] [PubMed]
  16. Schuller, B.W.; Burns, A.; Ceilley, E.A.; King, A.; Letourneau, J.; Markovic, A.; Sterkel, L.; Taplin, B.; Wanner, J.; Albert, J.M. Failure mode and effects analysis: A community practice perspective. J. Appl. Clin. Med. Phys. 2017, 18, 258–267. [Google Scholar] [CrossRef] [PubMed]
  17. Xu, A.Y.; Bhatnagar, J.; Bednarz, G.; Flickinger, J.; Arai, Y.; Vacsulka, J.; Feng, W.; Monaco, E.; Niranjan, A.; Lunsford, L.D.; et al. Failure modes and effects analysis (FMEA) for Gamma Knife radiosurgery. J. Appl. Clin. Med. Phys. 2017, 18, 152–168. [Google Scholar] [CrossRef] [PubMed]
  18. Nolan, D.P. Specialized Reviews—CHAZOP, EHAZOP, Bow-Tie Analysis, Layers of Protection Analysis, Safety Integrity Level, Fishbone Diagram, and Cyber Security Vulnerability Analysis. In Safety and Security Review for the Process Industries; Elsevier: Amsterdam, The Netherlands, 2015; pp. 17–27. [Google Scholar] [CrossRef]
  19. Zadeh, L.A. Toward a theory of fuzzy information granulation and its centrality in human reasoning and fuzzy logic. Fuzzy Sets Syst. 1997, 90, 111–127. [Google Scholar] [CrossRef]
  20. Zadeh, L.A. The concept of a linguistic variable and its application to approximate reasoning—III. Inf. Sci. 1975, 9, 43–80. [Google Scholar] [CrossRef]
  21. Zadeh, L.A. The concept of a linguistic variable and its application to approximate reasoning—II. Inf. Sci. 1975, 8, 301–357. [Google Scholar] [CrossRef]
  22. Zadeh, L.A. The concept of a linguistic variable and its application to approximate reasoning—I. Inf. Sci. 1975, 8, 199–249. [Google Scholar] [CrossRef]
  23. Shepherd, A. Hierarchical Task Analysis, 1st ed.; CRC Press: Boca Raton, FL, USA, 2000; ISBN 9780748408382. [Google Scholar]
  24. Schraagen, J.M.; Chipman, S.F.; Shalin, V.L. Cognitive Task Analysis, 1st ed.; Schraagen, J.M., Chipman, S.F., Shalin, V.L., Eds.; Psychology Press: Hove, UK, 2000; ISBN 9780805833836. [Google Scholar]
Figure 1. A generic representation of the Ishikawa diagram (or fishbone diagram).
Environments 09 00050 g001
Figure 2. Comparison of results in terms of RI index.
Environments 09 00050 g002
Figure 3. Comparison of rankings classic-RPN vs. Fuzzy-RPN obtained using weights of Equation (3).
Environments 09 00050 g003
Figure 4. Comparison of rankings classic-RPN vs. Fuzzy-RPN*, obtained using weights of Equation (4).
Environments 09 00050 g004
Figure 5. Comparison of rankings weight-RPN vs. Fuzzy-RPN* both obtained using weights of Equation (4).
Environments 09 00050 g005
Table 1. Comparison among failure mode ranking obtained by different FMECA approaches.
ODSClassic RPNClassic-RPN RankingF-RPN (wO = 0.3, wD = 0.3, wS = 0.3)F-RPN RankingF-RPN* (wO = 0.4, wD = 0.2, wS = 0.4)F-RPN* Rankingw-RPN (wO = 0.4, wD = 0.2, wS = 0.4)w-RPN Ranking
FM14771961451348725.602
FM24681922454249115.721
FM34951803450444285.145
FM43781684427545055.263
FM53681445426644475.107
FM62981445534146834.7010
FM745714073511044765.234
FM8484128834812320174.5914
FM93581209420842394.929
FM103571051031616400124.6613
FM113751051030719307194.3616
FM12286961234812326134.1019
FM1334896124009403114.7010
FM14446961231317317184.7012
FM1543896123501145144.988
FM16365901630818307194.2317
FM1729590164247325143.9021
FM18356901630620307194.3815
FM19276841932315323163.9920
FM20267841932514325144.1118
FM21726841930021413105.126
Publisher’s Note: MDPI stays neutral with regard to jurisdictional claims in published maps and institutional affiliations.

