
A Preliminary Study of the Characteristics of Radon Data from Indoor Environments and Building Materials in the Campania Region Using PCA and K-Means Statistical Analyses

 , , , ,
  and
and
Abstract
:1. Introduction
2. Materials and Methods
2.1. Data
2.2. Statistical Analysis Methods
2.2.1. PCA
2.2.2. K-Means
2.2.3. R Software and RStudio
3. Results and Discussion
3.1. Building Materials
3.2. Radon Indoor Data
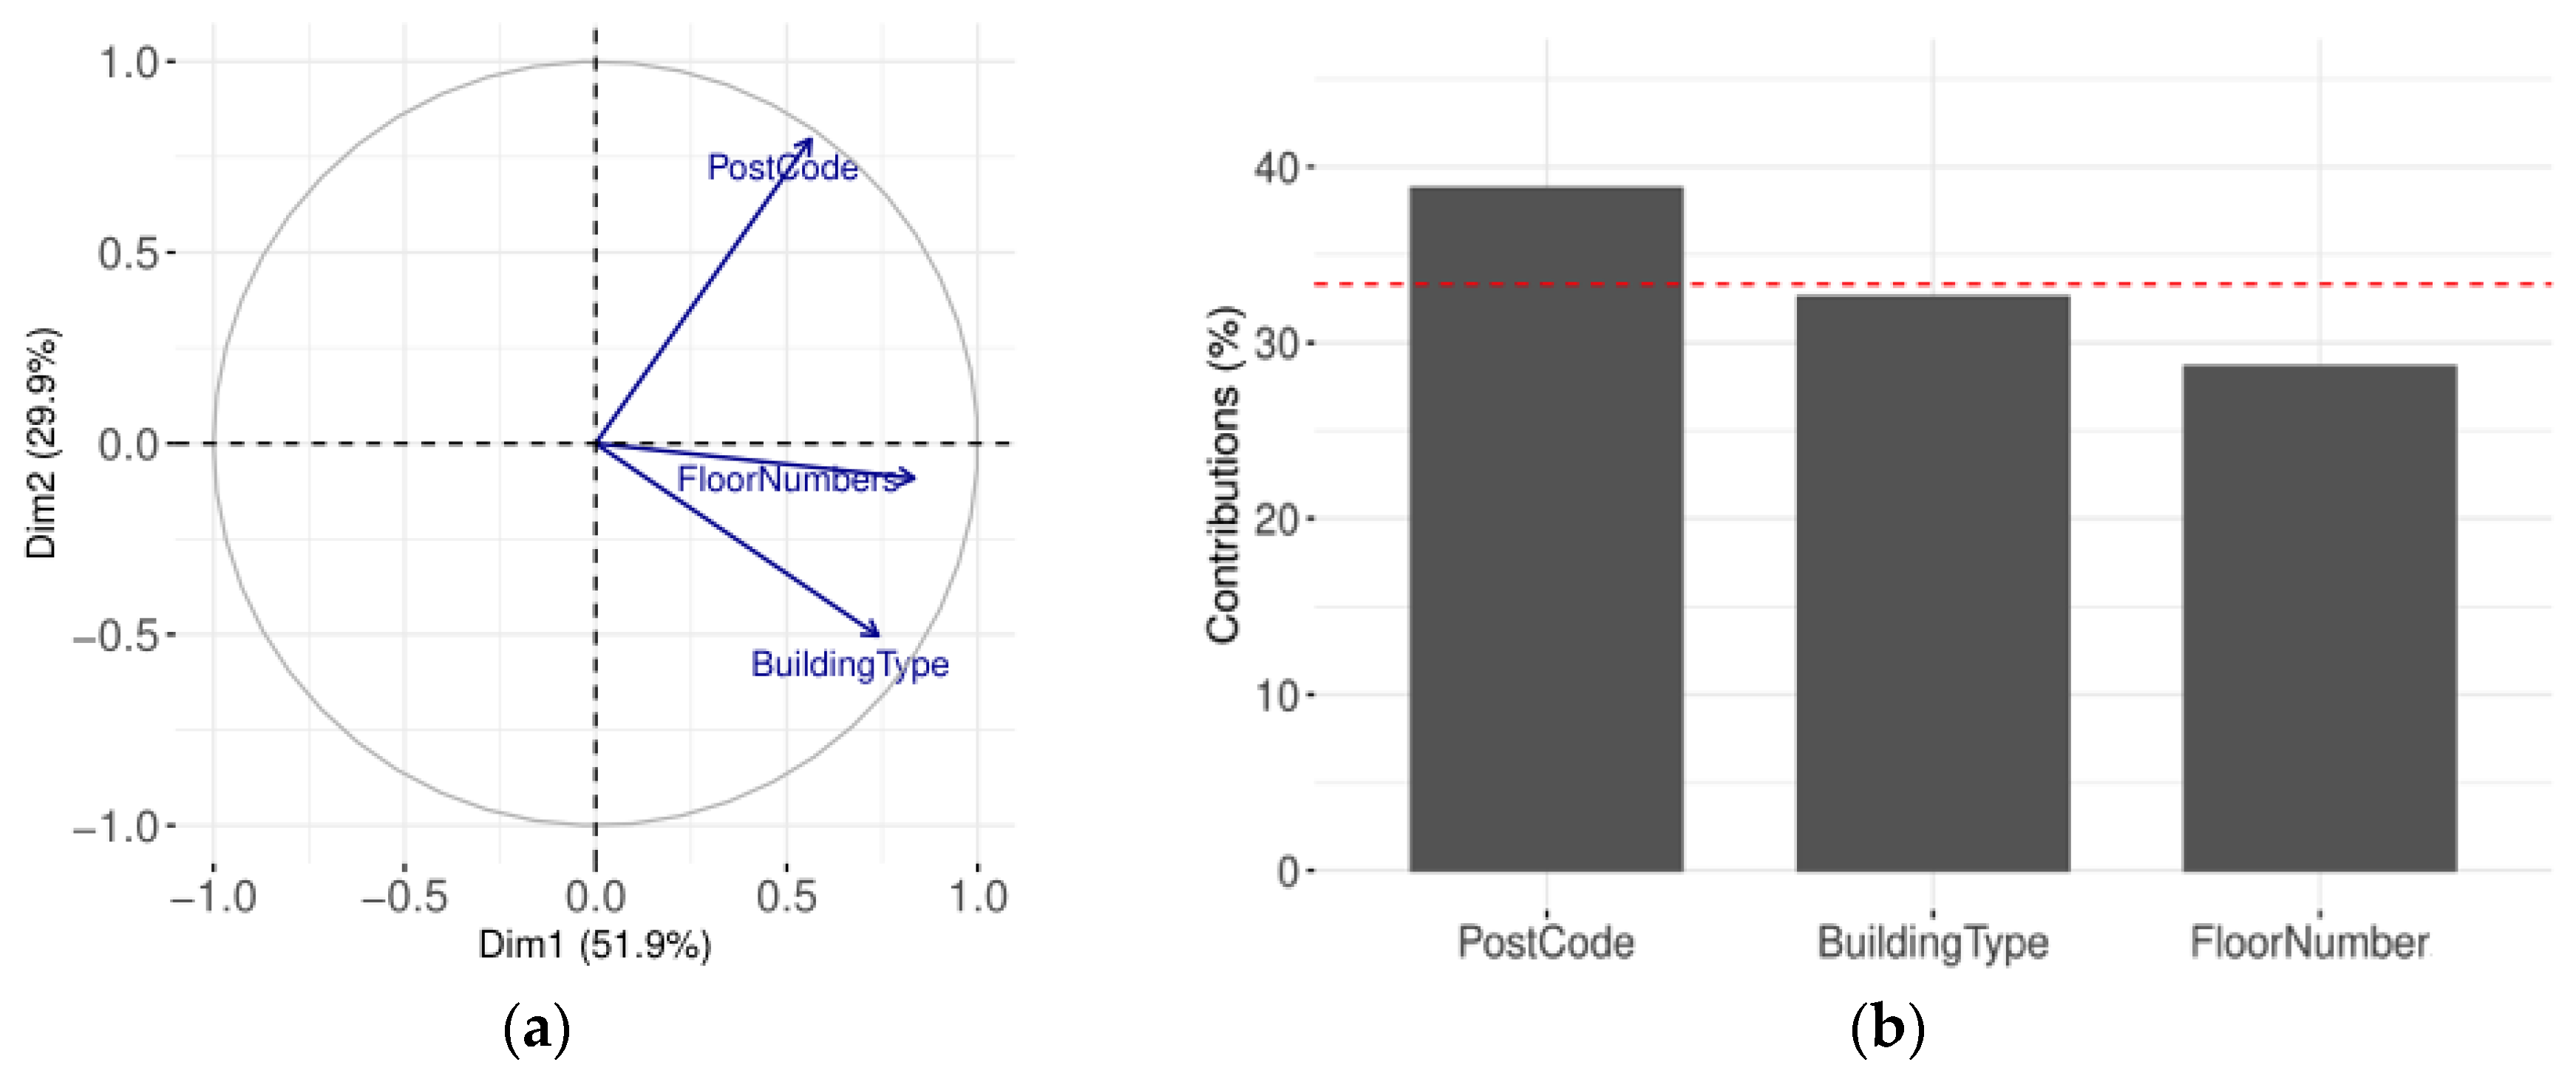
- the type of building (above ground, underground, basement, on pillars).
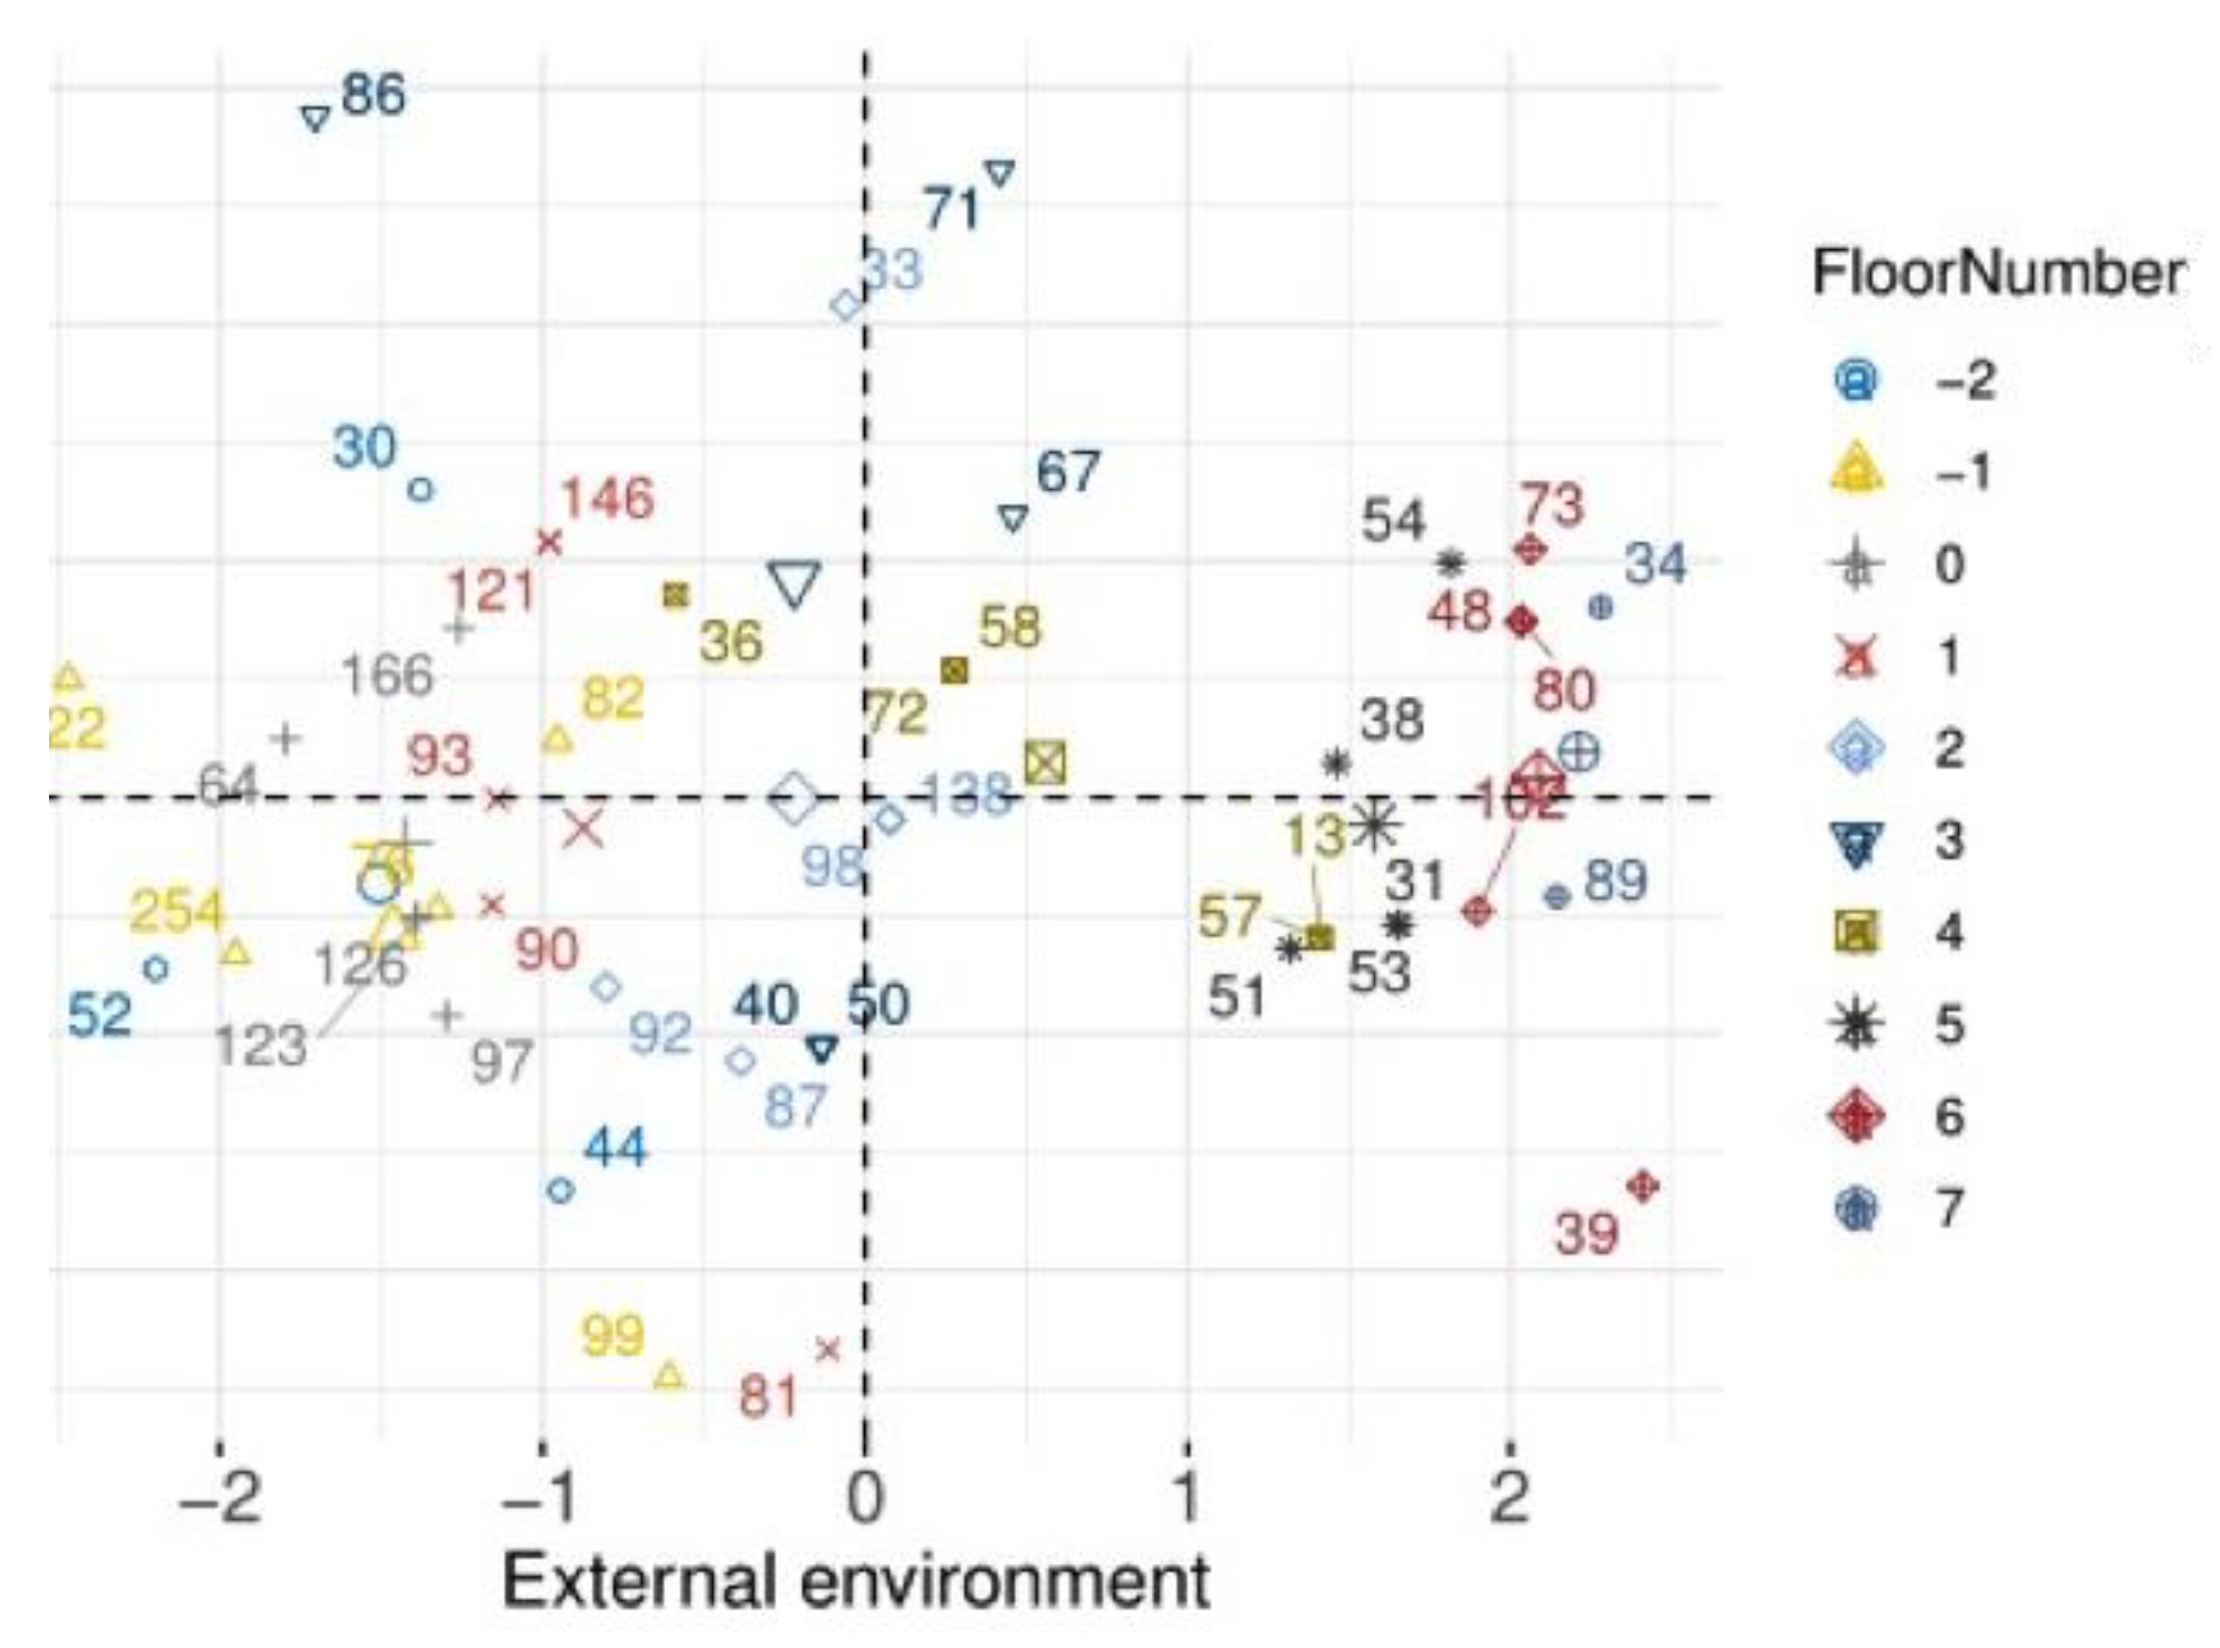
- the floor number.
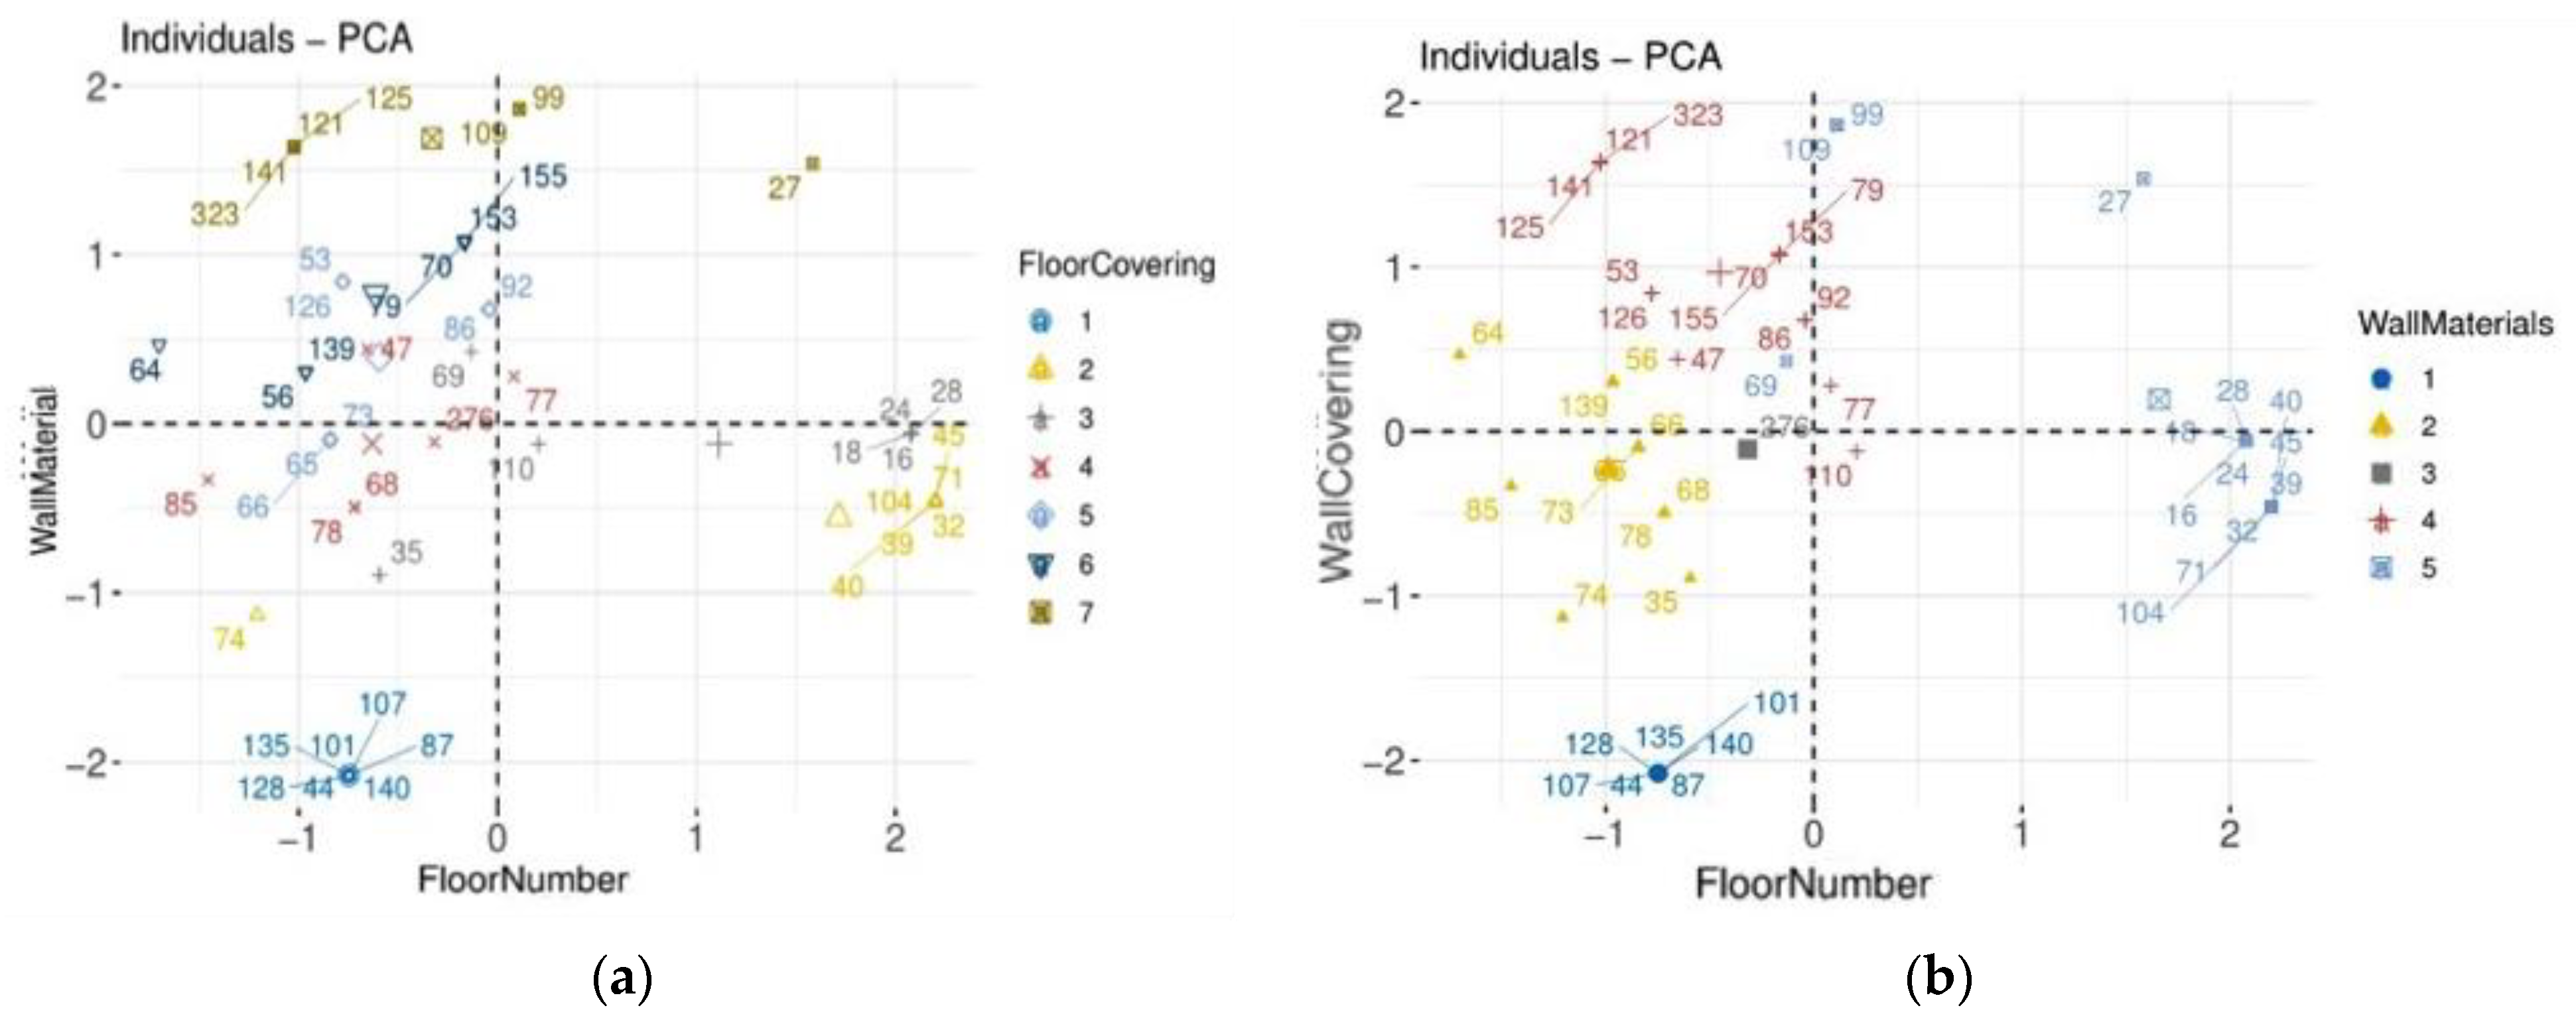
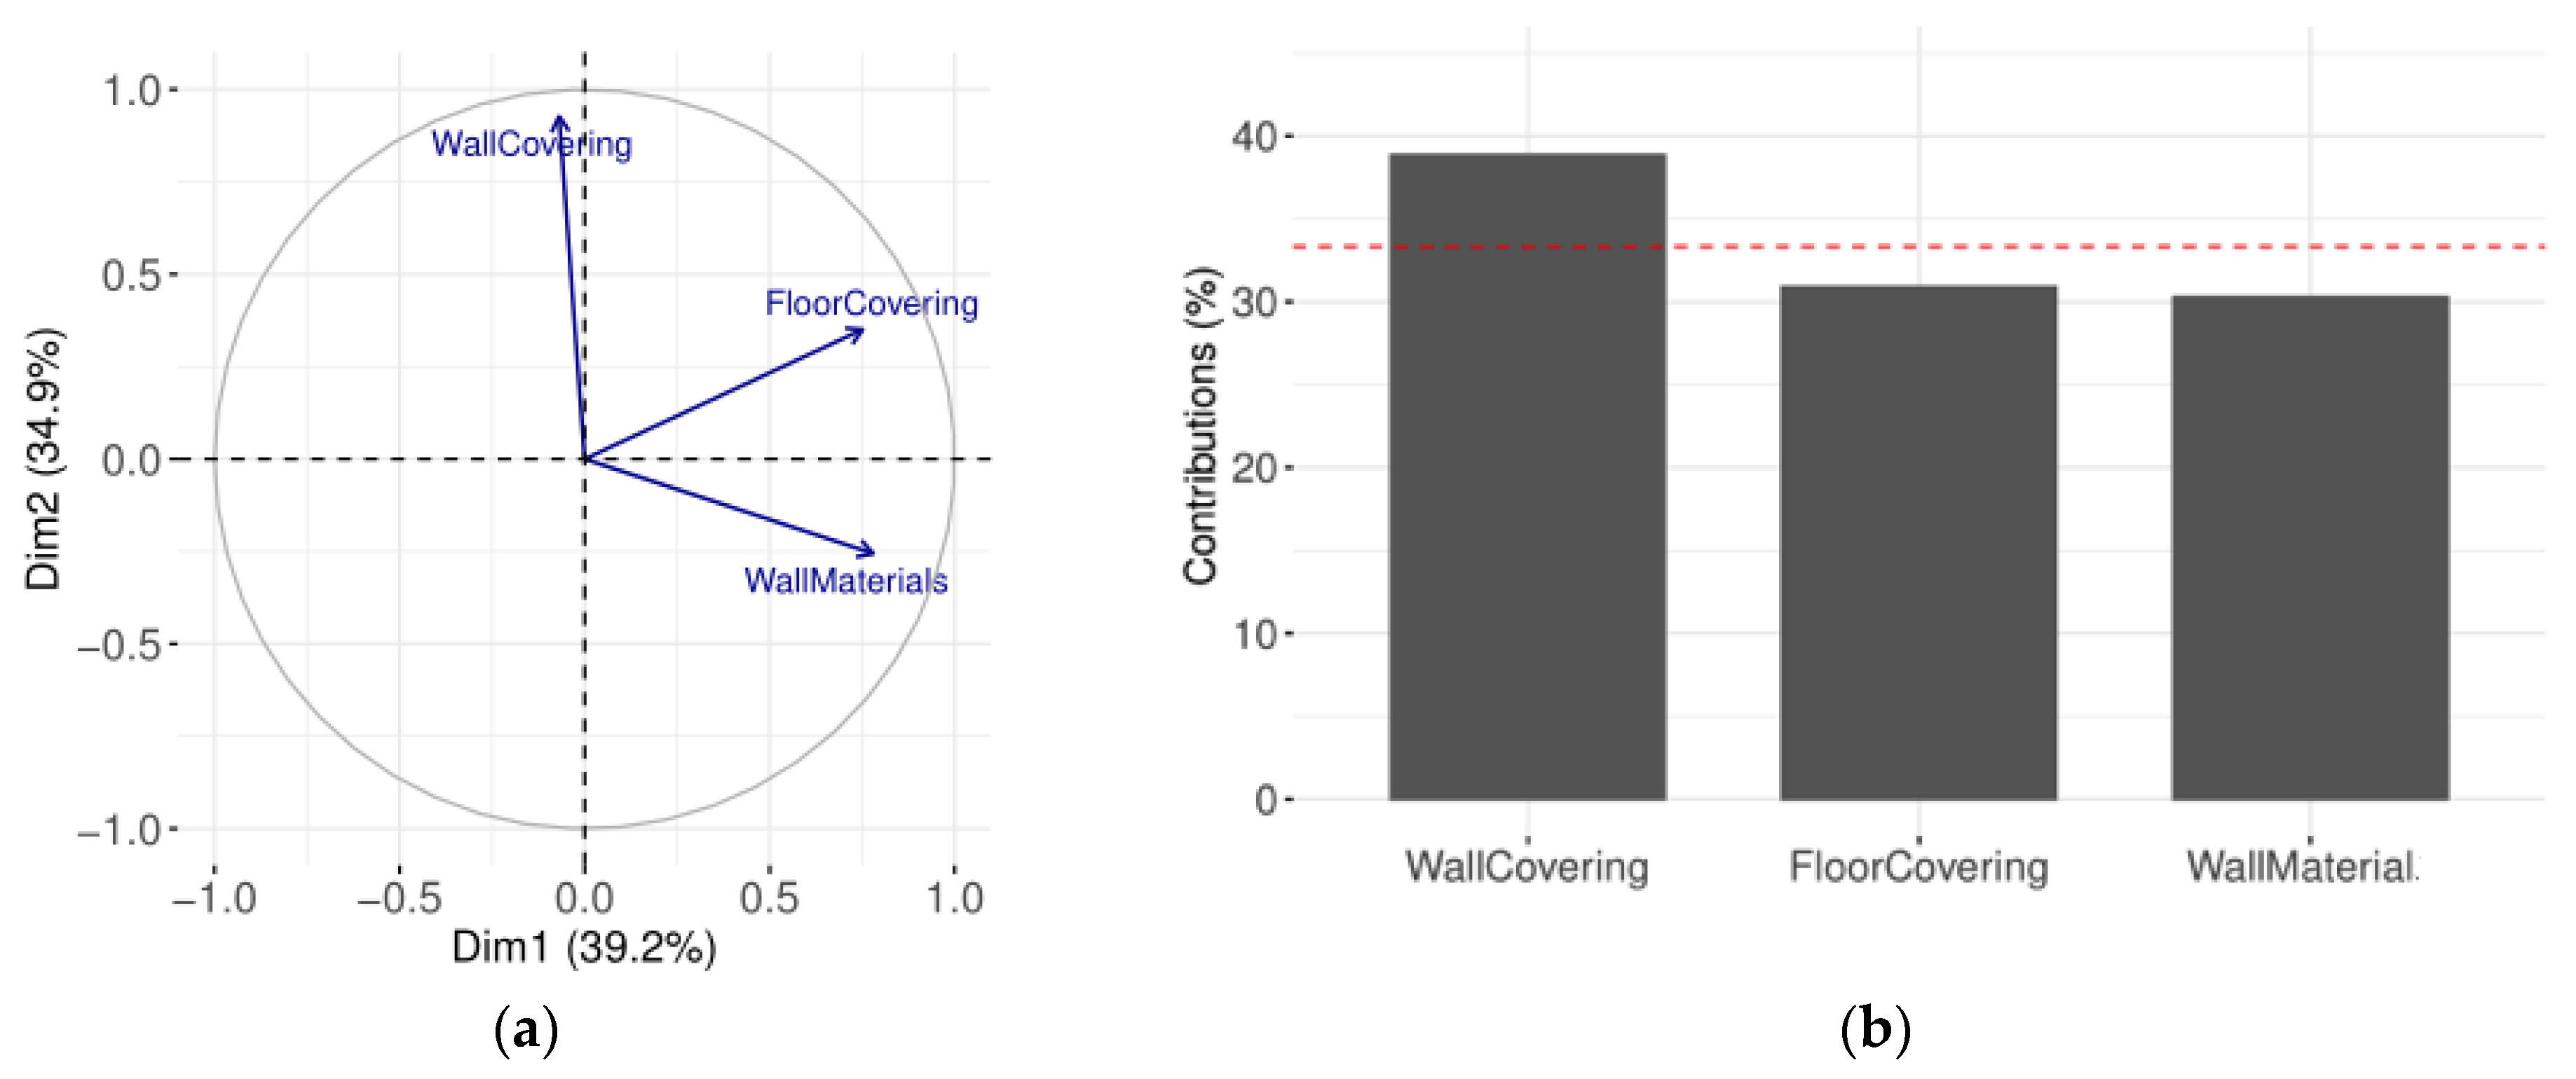
- the wall material (concrete, brick, stone, tuff, other).
- wall covering (paper, plaster, tiles, other).
- the floor covering (tiles, wood, linoleum, carpet, granite,
- marble, other).
- the number of windows.
- the number of doors.
- the postcode of the place where the house is located.
4. Conclusions
Author Contributions
Funding
Institutional Review Board Statement
Informed Consent Statement
Data Availability Statement
Conflicts of Interest
References
- UNSCEAR, United Nations Scientific Committee on the Effects of Atomic Radiation. Sources and Effects of Ionizing Radiation, Report to General Assembly with Scientific Annexes; United Nations: New York, NY, USA, 2008.
- Charles, M. UNSCEAR Report 2000: Sources and Effects of Ionizing Radiation; United Nations Scientific Comittee on the Effects of Atomic Radiation. J. Radiol. Prot. 2001, 21, 83–86. [Google Scholar] [CrossRef] [PubMed]
- Zeeb, H.; Shannoum, F. WHO Handbook on Indoor Radon: A Public Health Perspective; WHO Guidelines Approved by the Guidelines Review Committee; World Health Organization: Geneva, Switzerland, 2009.
- U.S. Environmental Protection Agency. EPA Assessment of Risks from Radon in Homes; EPA 402-R-03-003; Office of Radiation and Indoor Air: Washington, DC, USA, 2003.
- Bochicchio, F.; Ampollini, M.; Antignani, S.; Carpentieri, C.; Caprio, M.; Caccia, B.; Di Carlo, C.; Pozzi, S.; Valentini, S.; Venoso, G. Protection from radon in Italy: Past, present and perspectives. Rom. J. Phys. 2019, 64, 817. [Google Scholar]
- Trevisi, R.; Nuccetelli, C.; Risica, S. Screening tools to limit the use of building materials with enhanced/elevated levels of natural radioactivity: Analysis and application of index criteria. Constr. Build. Mater. 2013, 49, 448–454. [Google Scholar] [CrossRef]
- Stanley, F.K.T.; Irvine, J.L.; Jacques, W.R.; Salgia, S.R.; Innes, D.G.; Winquist, B.D.; Torr, D.; Brenner, D.R.; Goodarzi, A.A. Radon exposure is rising steadily within the modern North American residential environment and is increasingly uniform across seasons. Sci. Rep. 2019, 9, 18472. [Google Scholar] [CrossRef] [PubMed] [Green Version]
- Guida, D.; Guida, M.; Cuomo, A.; Guadagnuolo, D.; Siervo, V. Assessment and Mapping of Radon-prone Areas on a regional scale as application of a Hierarchical Adaptive and Multi-scale Approach for the Environmental Planning. Case Study of Campania Region, Southern Italy. WSEAS Trans. Syst. 2013, 12, 105–120. [Google Scholar]
- Szajerski, P.; Zimny, A. Numerical analysis and modeling of two-loop experimental setup for measurements of radon diffusion rate through building and insulation materials. Environ. Pollut. 2020, 256, 113393. [Google Scholar] [CrossRef]
- Minolfi, G.; Albanese, S.; Lima, A.; Tarvainen, T.; Fortelli, A.; DeVivo, B. A regional approach to the environmental risk assessment—Human health risk assessment case study in the Campania region. J. Geochem. Explor. 2018, 184, 400–416. [Google Scholar] [CrossRef]
- Sabbarese, C.; Ambrosino, F.; D’Onofrio, A. Development of radon transport model in different types of dwellings to assess indoor activity concentration. J. Environ. Radioact. 2021, 227, 106501. [Google Scholar] [CrossRef]
- Lima, A.; Albanese, S.; Cicchella, D. Geochemical baselines for the radioelements K, U, and Th in the Campania region, Italy: A comparison of stream-sediment geochemistry and gamma-ray surveys. Appl. Geochem. 2005, 20, 611–625. [Google Scholar] [CrossRef]
- Sabbarese, C.; Ambrosino, F.; D’Onofrio, A.; Roca, V. Radiological characterization of natural building materials from the Campania region (Southern Italy). Constr. Build. Mater. 2021, 268, 121087. [Google Scholar] [CrossRef]
- De Martino, S.; Sabbarese, C.; Monetti, G. Radon emanation and exhalation rate from soils measured with an electrostatic collector. Appl. Radiat. Isot. 1998, 49, 407–413. [Google Scholar] [CrossRef]
- Quarto, M.; Pugliese, M.; Roca, V. Gamma dose rate measurements in dwellings of Campania region, South Italy. J. Environ. Radioact. 2013, 115, 114–117. [Google Scholar] [CrossRef] [PubMed]
- Sabbarese, C.; De Martino, S.; Signorini, C.; Gialanella, G.; Roca, V.; Baldassini, P.G.; Cotellessa, G.; Sciocchetti, G. A survey of indoor 222Rn in the Campania Region. Radiat. Prot. Dosim. 1993, 48, 257–263. [Google Scholar]
- Pugliese, M.; Quarto, M.; Roca, V. Radon concentrations in air and water in the thermal spas of Ischia Island. Indoor Built Environ. 2014, 23, 823–827. [Google Scholar] [CrossRef] [Green Version]
- Malanca, A.; Pessina, V.; Dallara, G. Influence of tuff on the radon concentration in dwellings. J. Environ. Radioact. 1991, 14, 295–303. [Google Scholar] [CrossRef]
- Quarto, M.; Pugliese, M.; Loffredo, F.; Roca, V. Indoor radon concentration measurements in some dwellings of the Penisola Sorrentina, South Italy. Radiat. Prot. Dosim. 2013, 156, 207–212. [Google Scholar] [CrossRef]
- Venoso, G.; De Cicco, F.; Flores, B.; Gialanella, L.; Pugliese, M.; Roca, V.; Sabbarese, C. Radon concentrations in schools of the Neapolitan area. Radiat. Meas. 2009, 44, 127–130. [Google Scholar] [CrossRef]
- La Verde, G.; Roca, V.; Sabbarese, C.; Ambrosino, F.; Pugliese, M. The equilibrium factor in the radon dose calculation in the archaeological site of Acquedotto Augusteo del Serino in Naples. Nuovo Cim. C 2018, 41, 218. [Google Scholar]
- La Verde, G.; D’Avino, V.; Sabbarese, C.; Ambrosino, F.; Roca, V.; Raulo, A.; Pugliese, M. Radiation protection legislation and sustainable development of a rural green tuff village of ischia island. Sustainability 2020, 12, 8374. [Google Scholar] [CrossRef]
- Sabbarese, C.; Ambrosino, F.; Chiodini, G.; Giudicepietro, F.; Macedonio, G.; Caliro, S.; De Cesare, W.; Bianco, F.; Pugliese, M.; Roca, V. Continuous radon monitoring during seven years of volcanic unrest at Campi Flegrei caldera (Italy). Sci. Rep. 2020, 10, 9551. [Google Scholar] [CrossRef]
- Sabbarese, C.; Ambrosino, F.; D’Onofrio, A.; Pugliese, M.; La Verde, G.; D’Avino, V.; Roca, V. The first radon potential map of the Campania region (southern Italy). Appl. Geochem. 2021, 126, 104890. [Google Scholar] [CrossRef]
- Lloyd, S. Least Squares Quantization in PCM. IEEE Trans. Inf. Theory 1982, 28, 129–137. [Google Scholar] [CrossRef] [Green Version]
- Jackson, J.E. A User’s Guide to Principal Components; Wiley: New York, NY, USA, 1991. [Google Scholar]
- Jolliffe, I.T. Principal Component Analysis, 2nd ed.; Springer: New York, NY, USA, 2002. [Google Scholar]
- Likas, A.; Vlassis, N.; Verbeek, J.J. The global k-means clustering algorithm. Pattern Recognit. 2003, 36, 451–461. [Google Scholar] [CrossRef] [Green Version]
- R Core Team. R: A Language and Environment for Statistical Computing; R Foundation for Statistical Computing: Vienna, Austria, 2017; Available online: https://www.R-project.org/ (accessed on 20 April 2022).
- RStudio Team. RStudio: Integrated Development for R.; RStudio: Boston, MA, USA, 2020; Available online: http://www.rstudio.com/ (accessed on 20 April 2022).


| First Analysis | Second Analysis | Third Analysis | Fourth Analysis | |
|---|---|---|---|---|
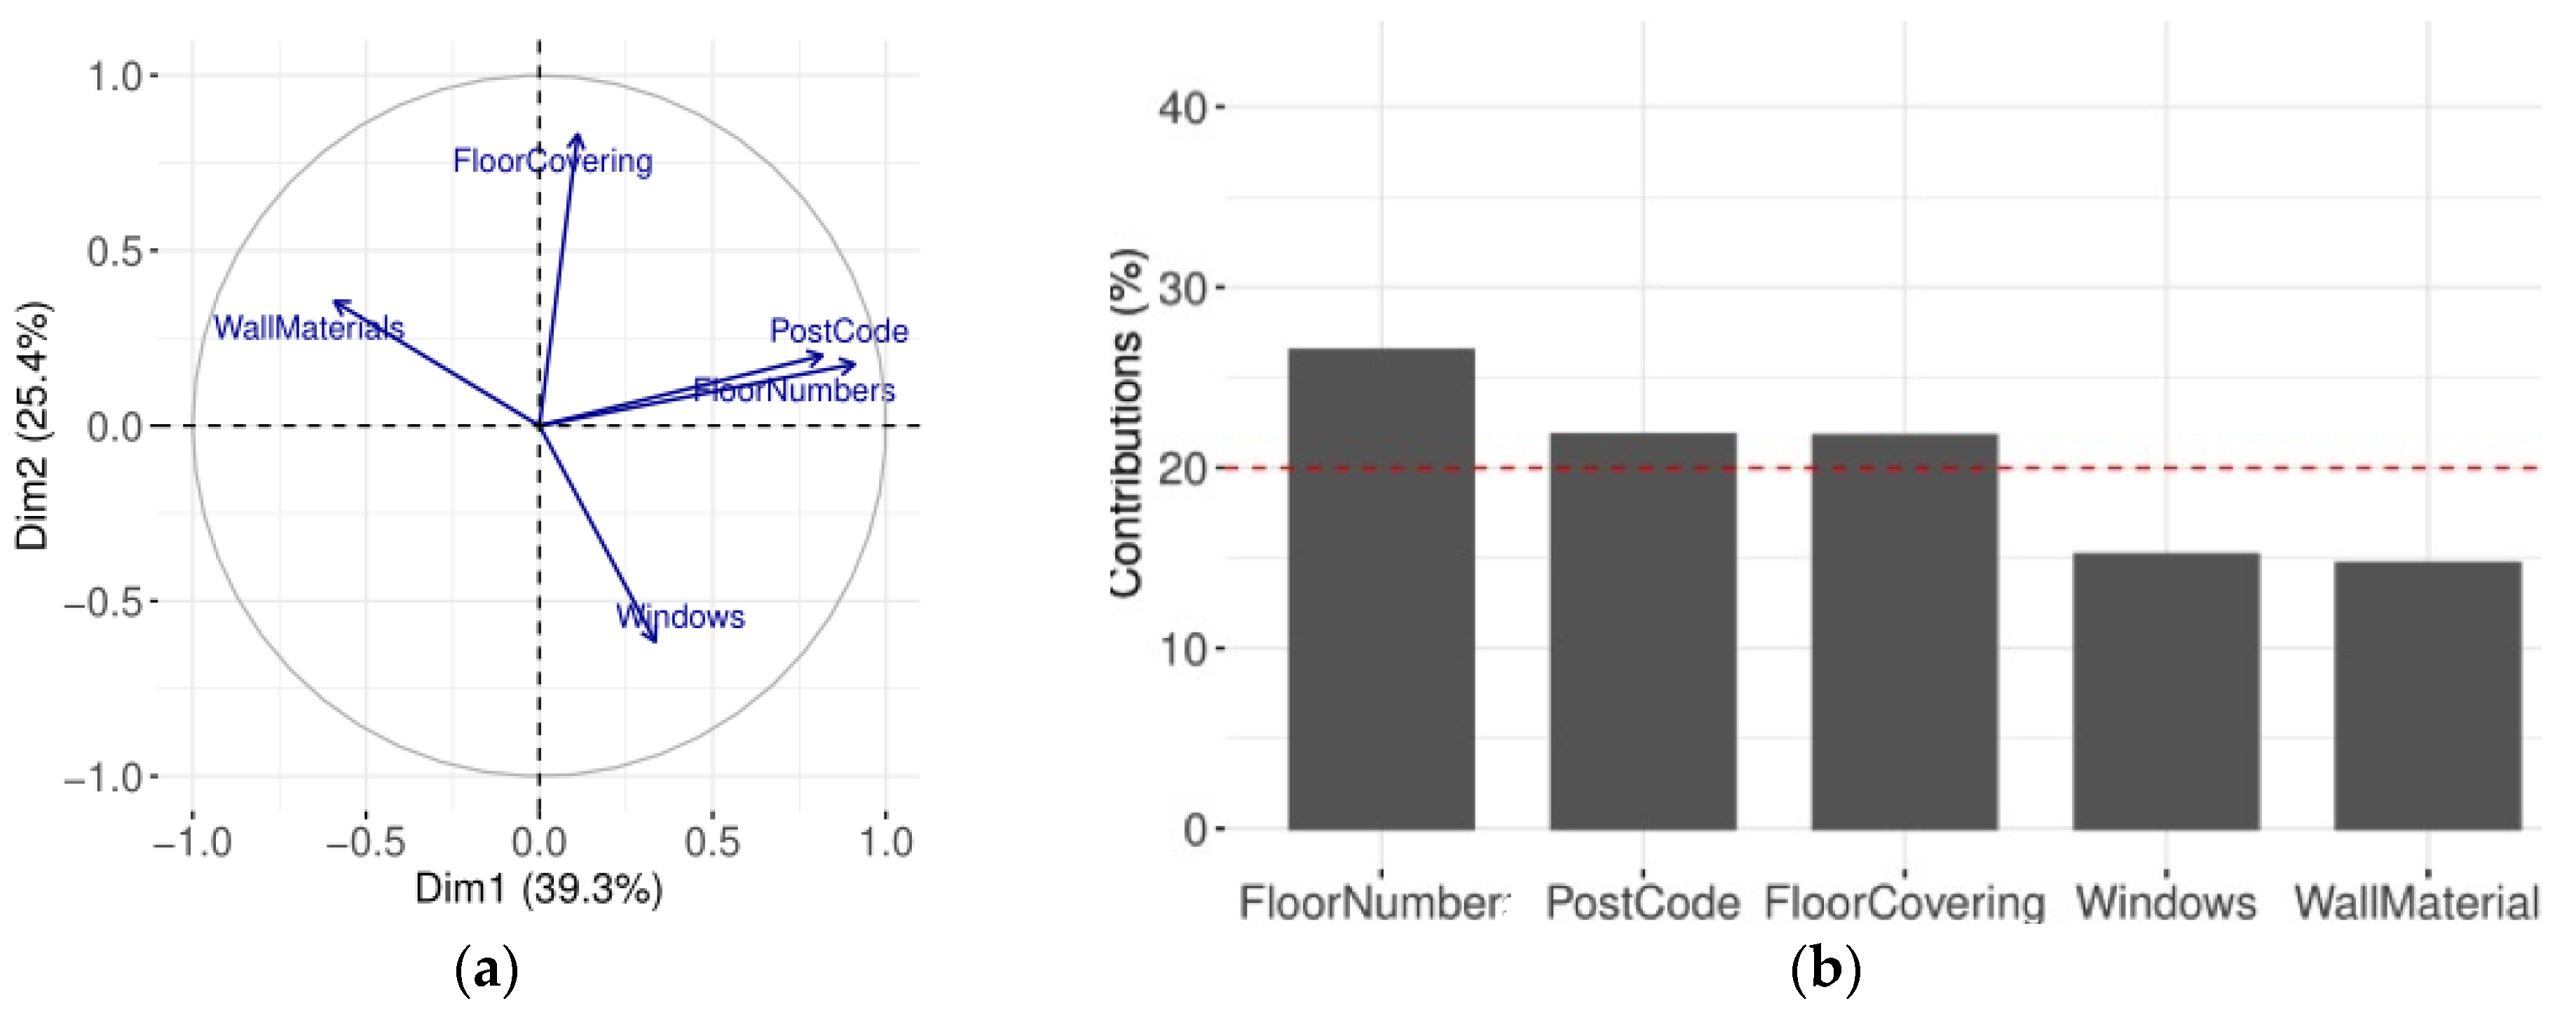
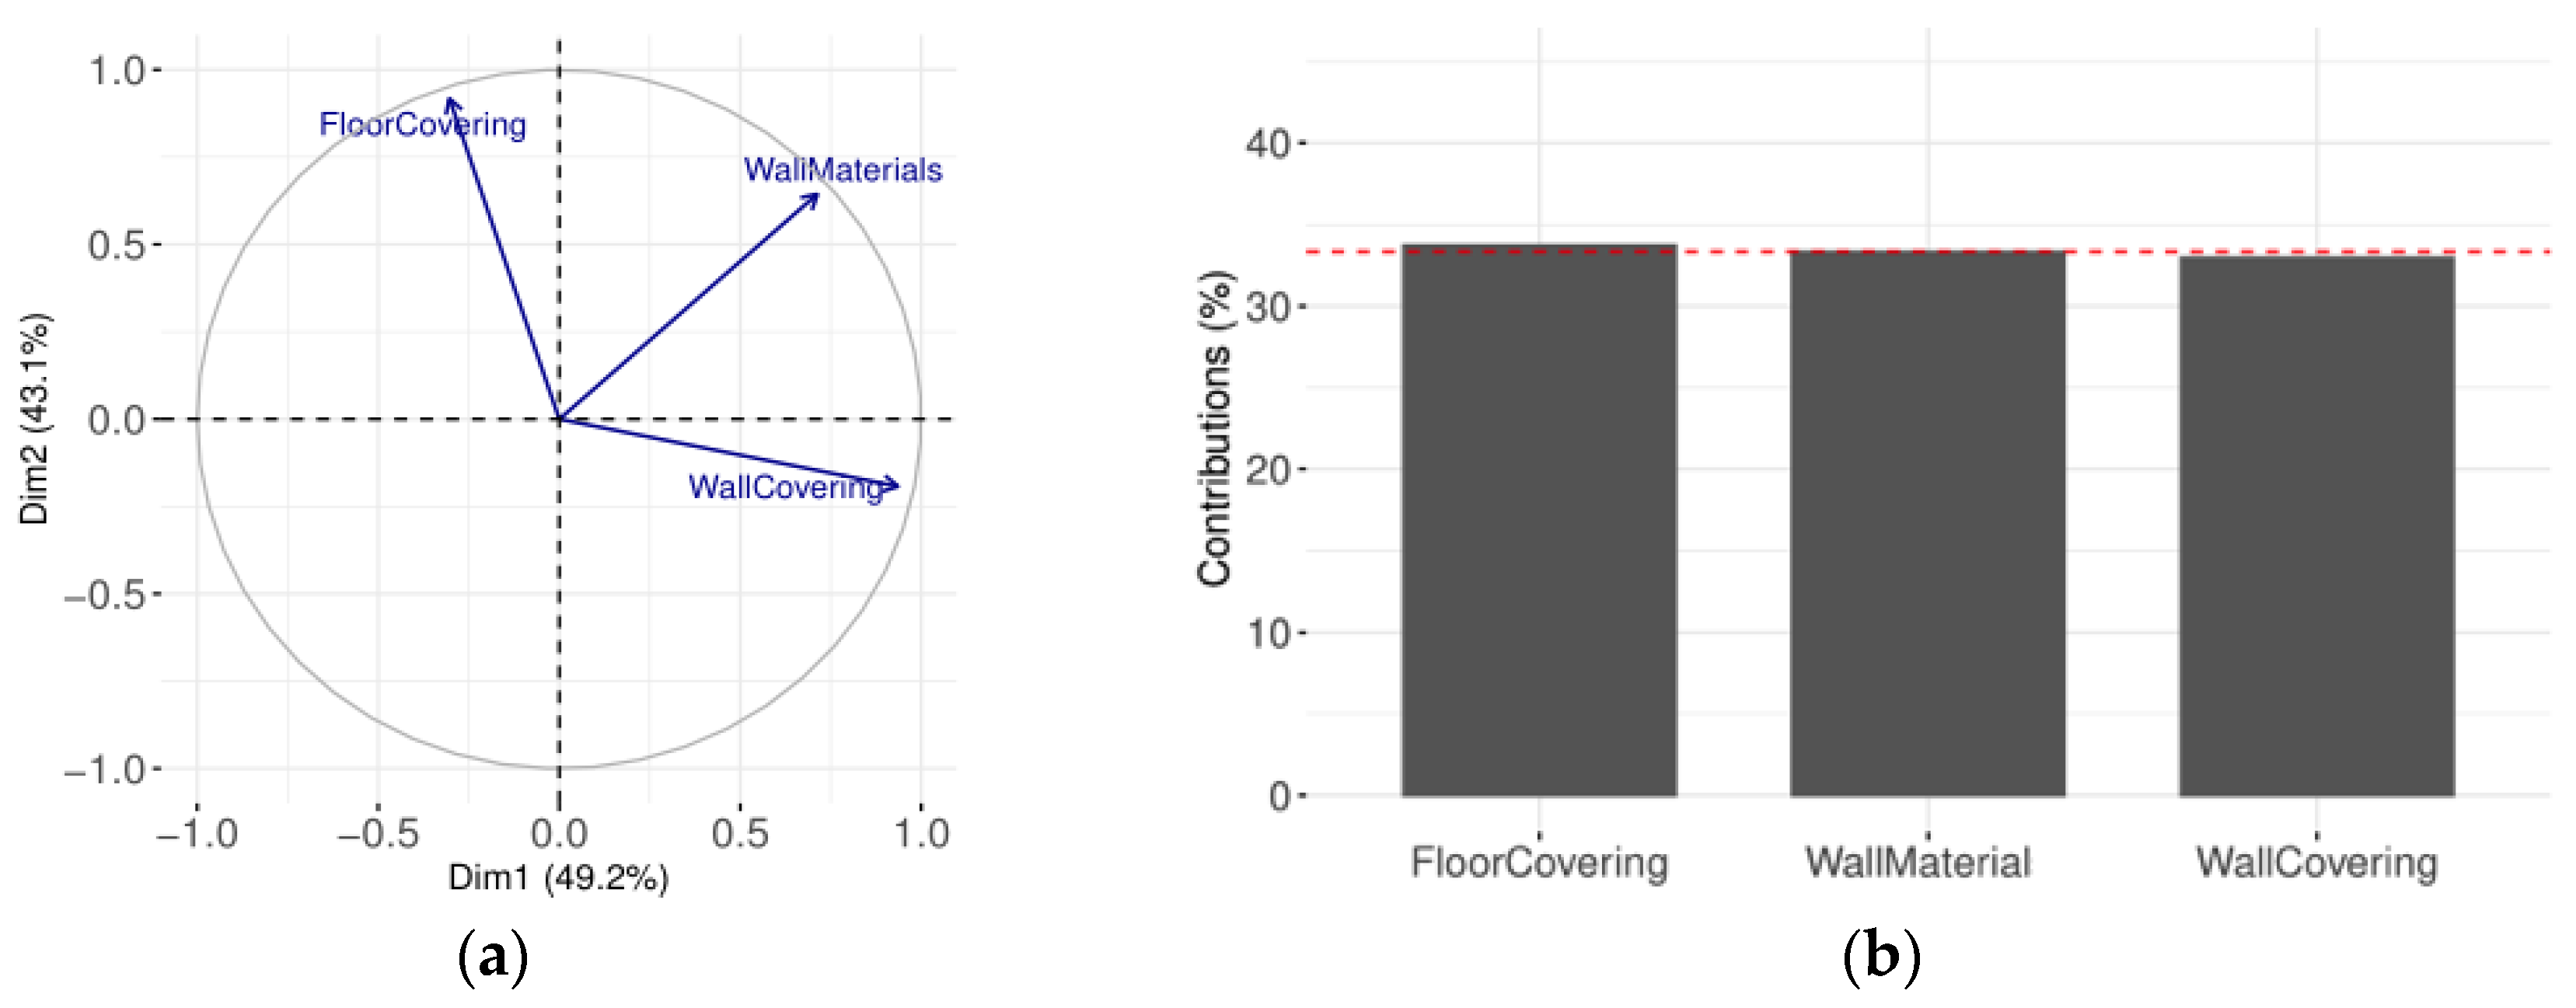
| Actual variables | All | Floor number, Building type, Postcode | Floor number, Windows, Wall material, Floor covering, Postcode | Wall material, Wall covering, Floor covering |
| Additional variables | None | Wall material, Wall covering, Floor covering, Windows number, Doors number | Building type, Wall covering, Doors number | Building type, Floor number, Windows number, Doors number, Postcode |
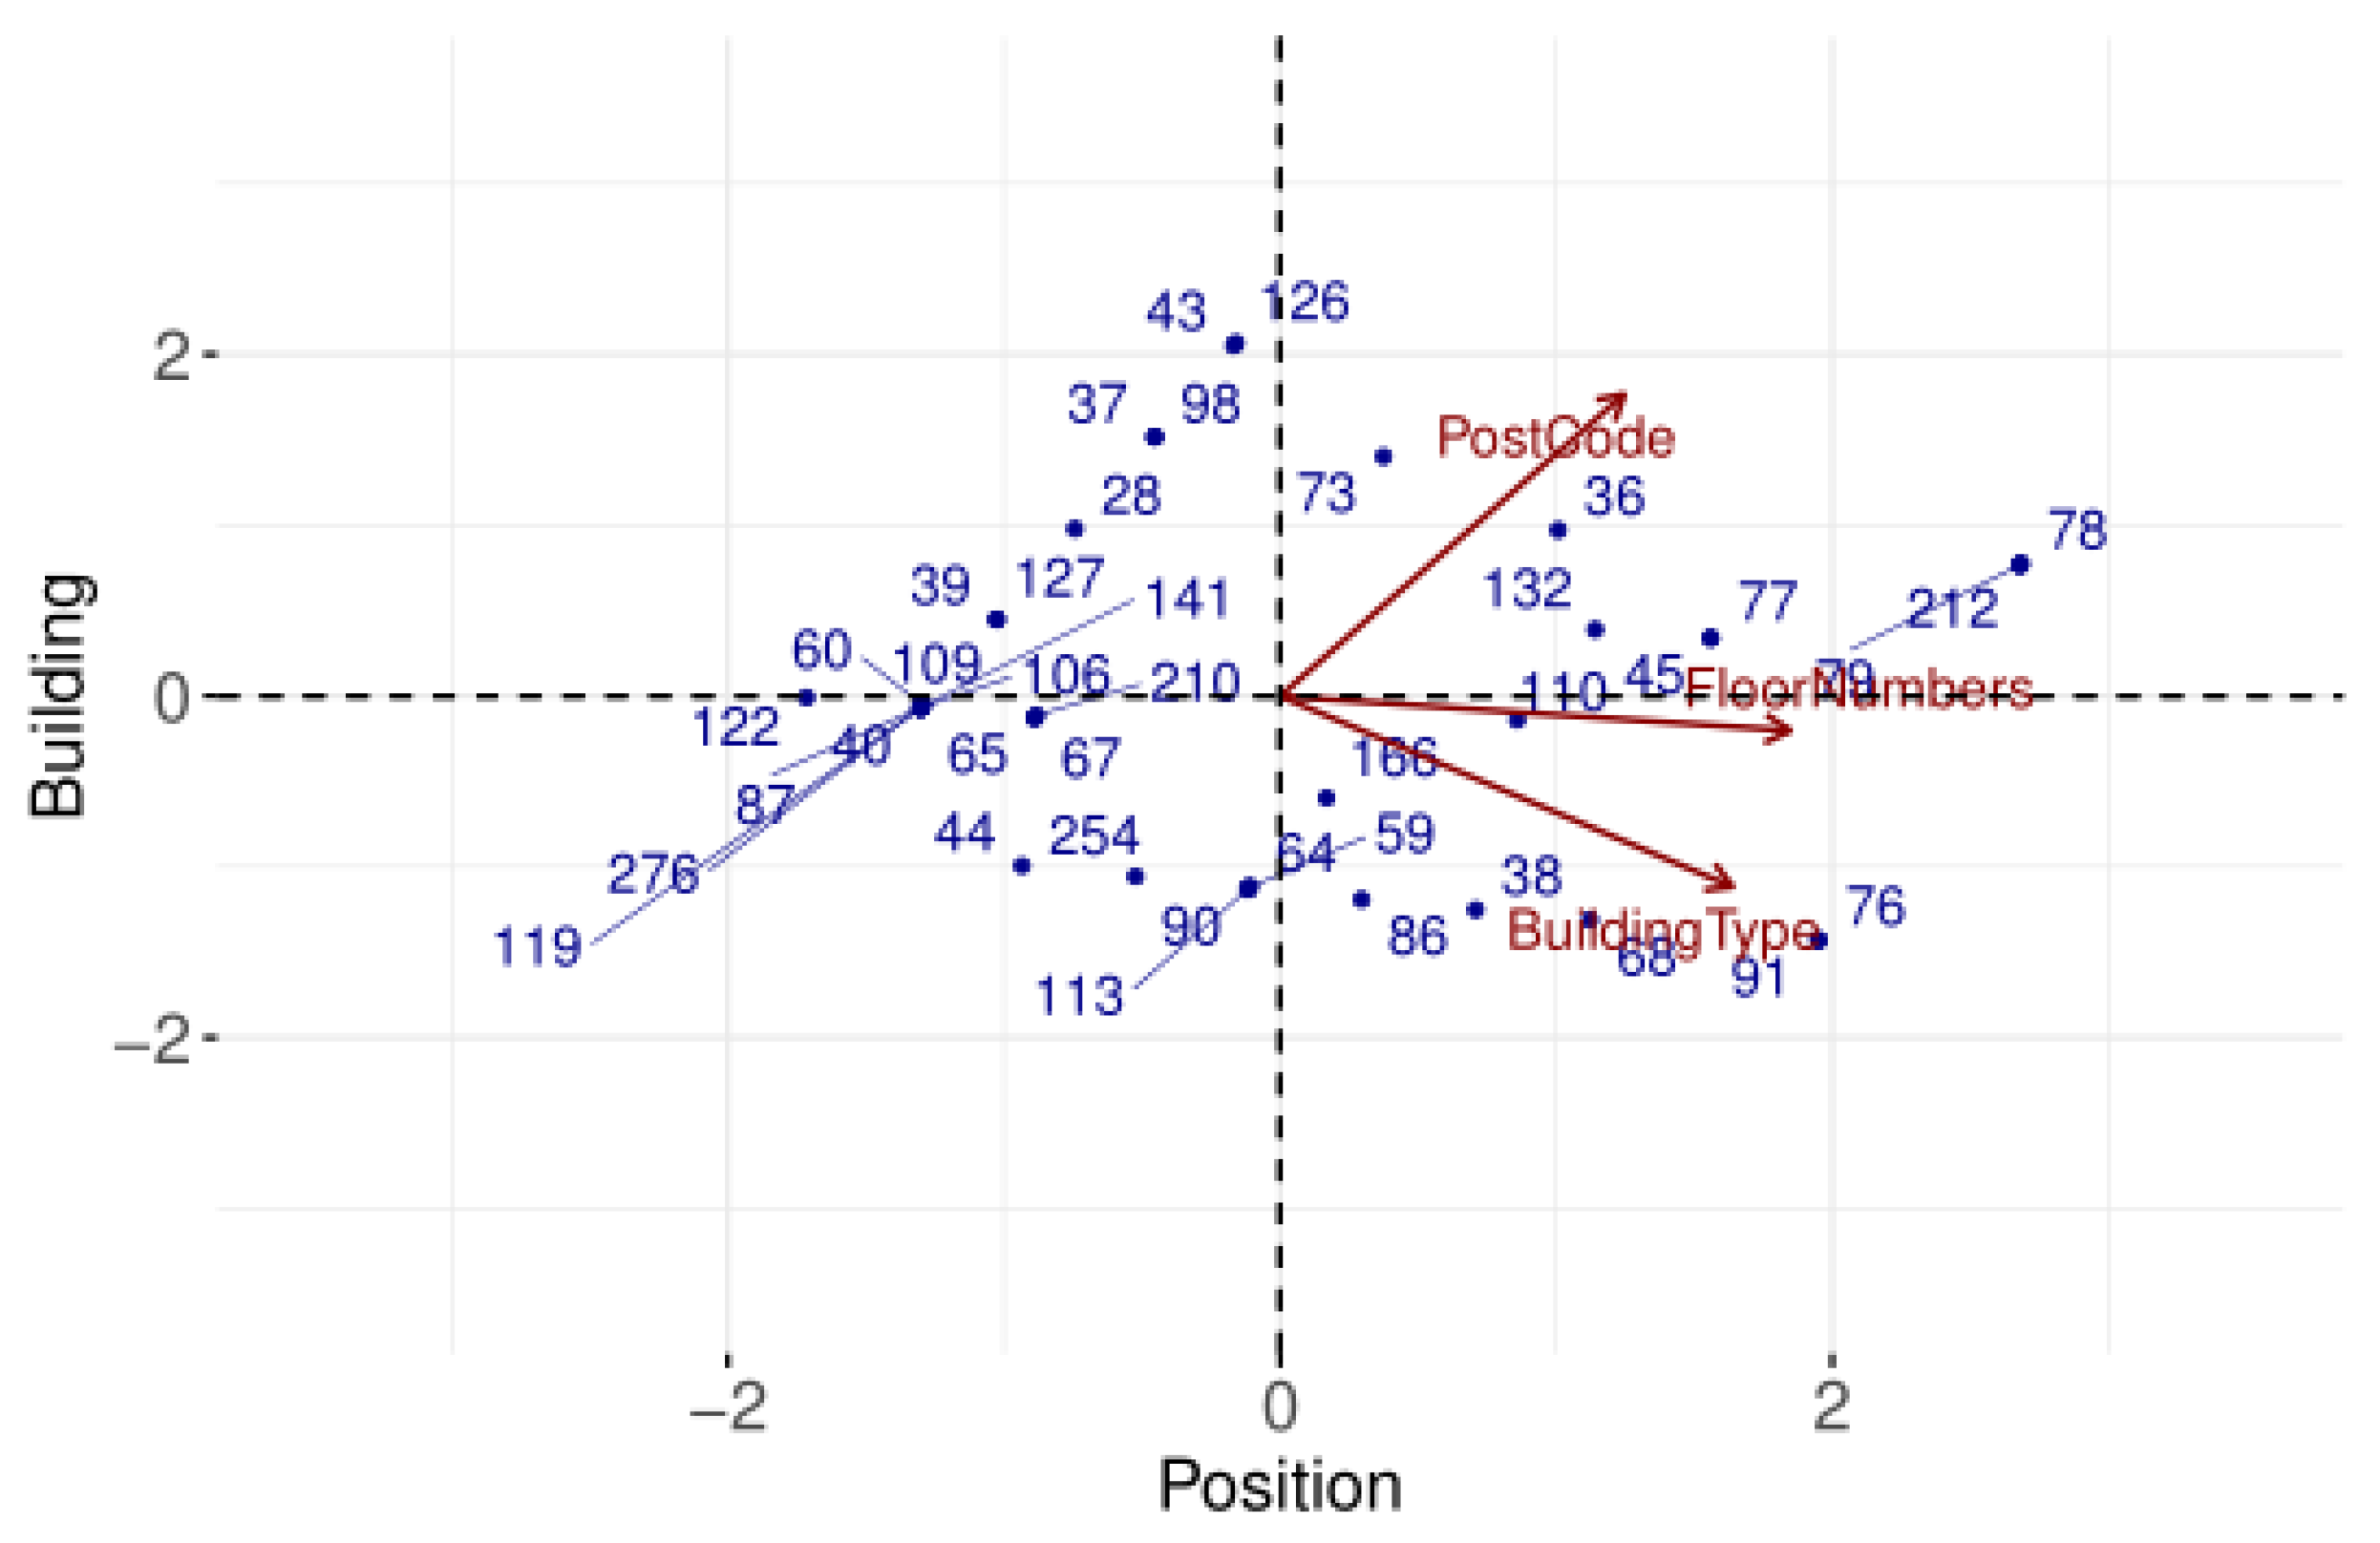
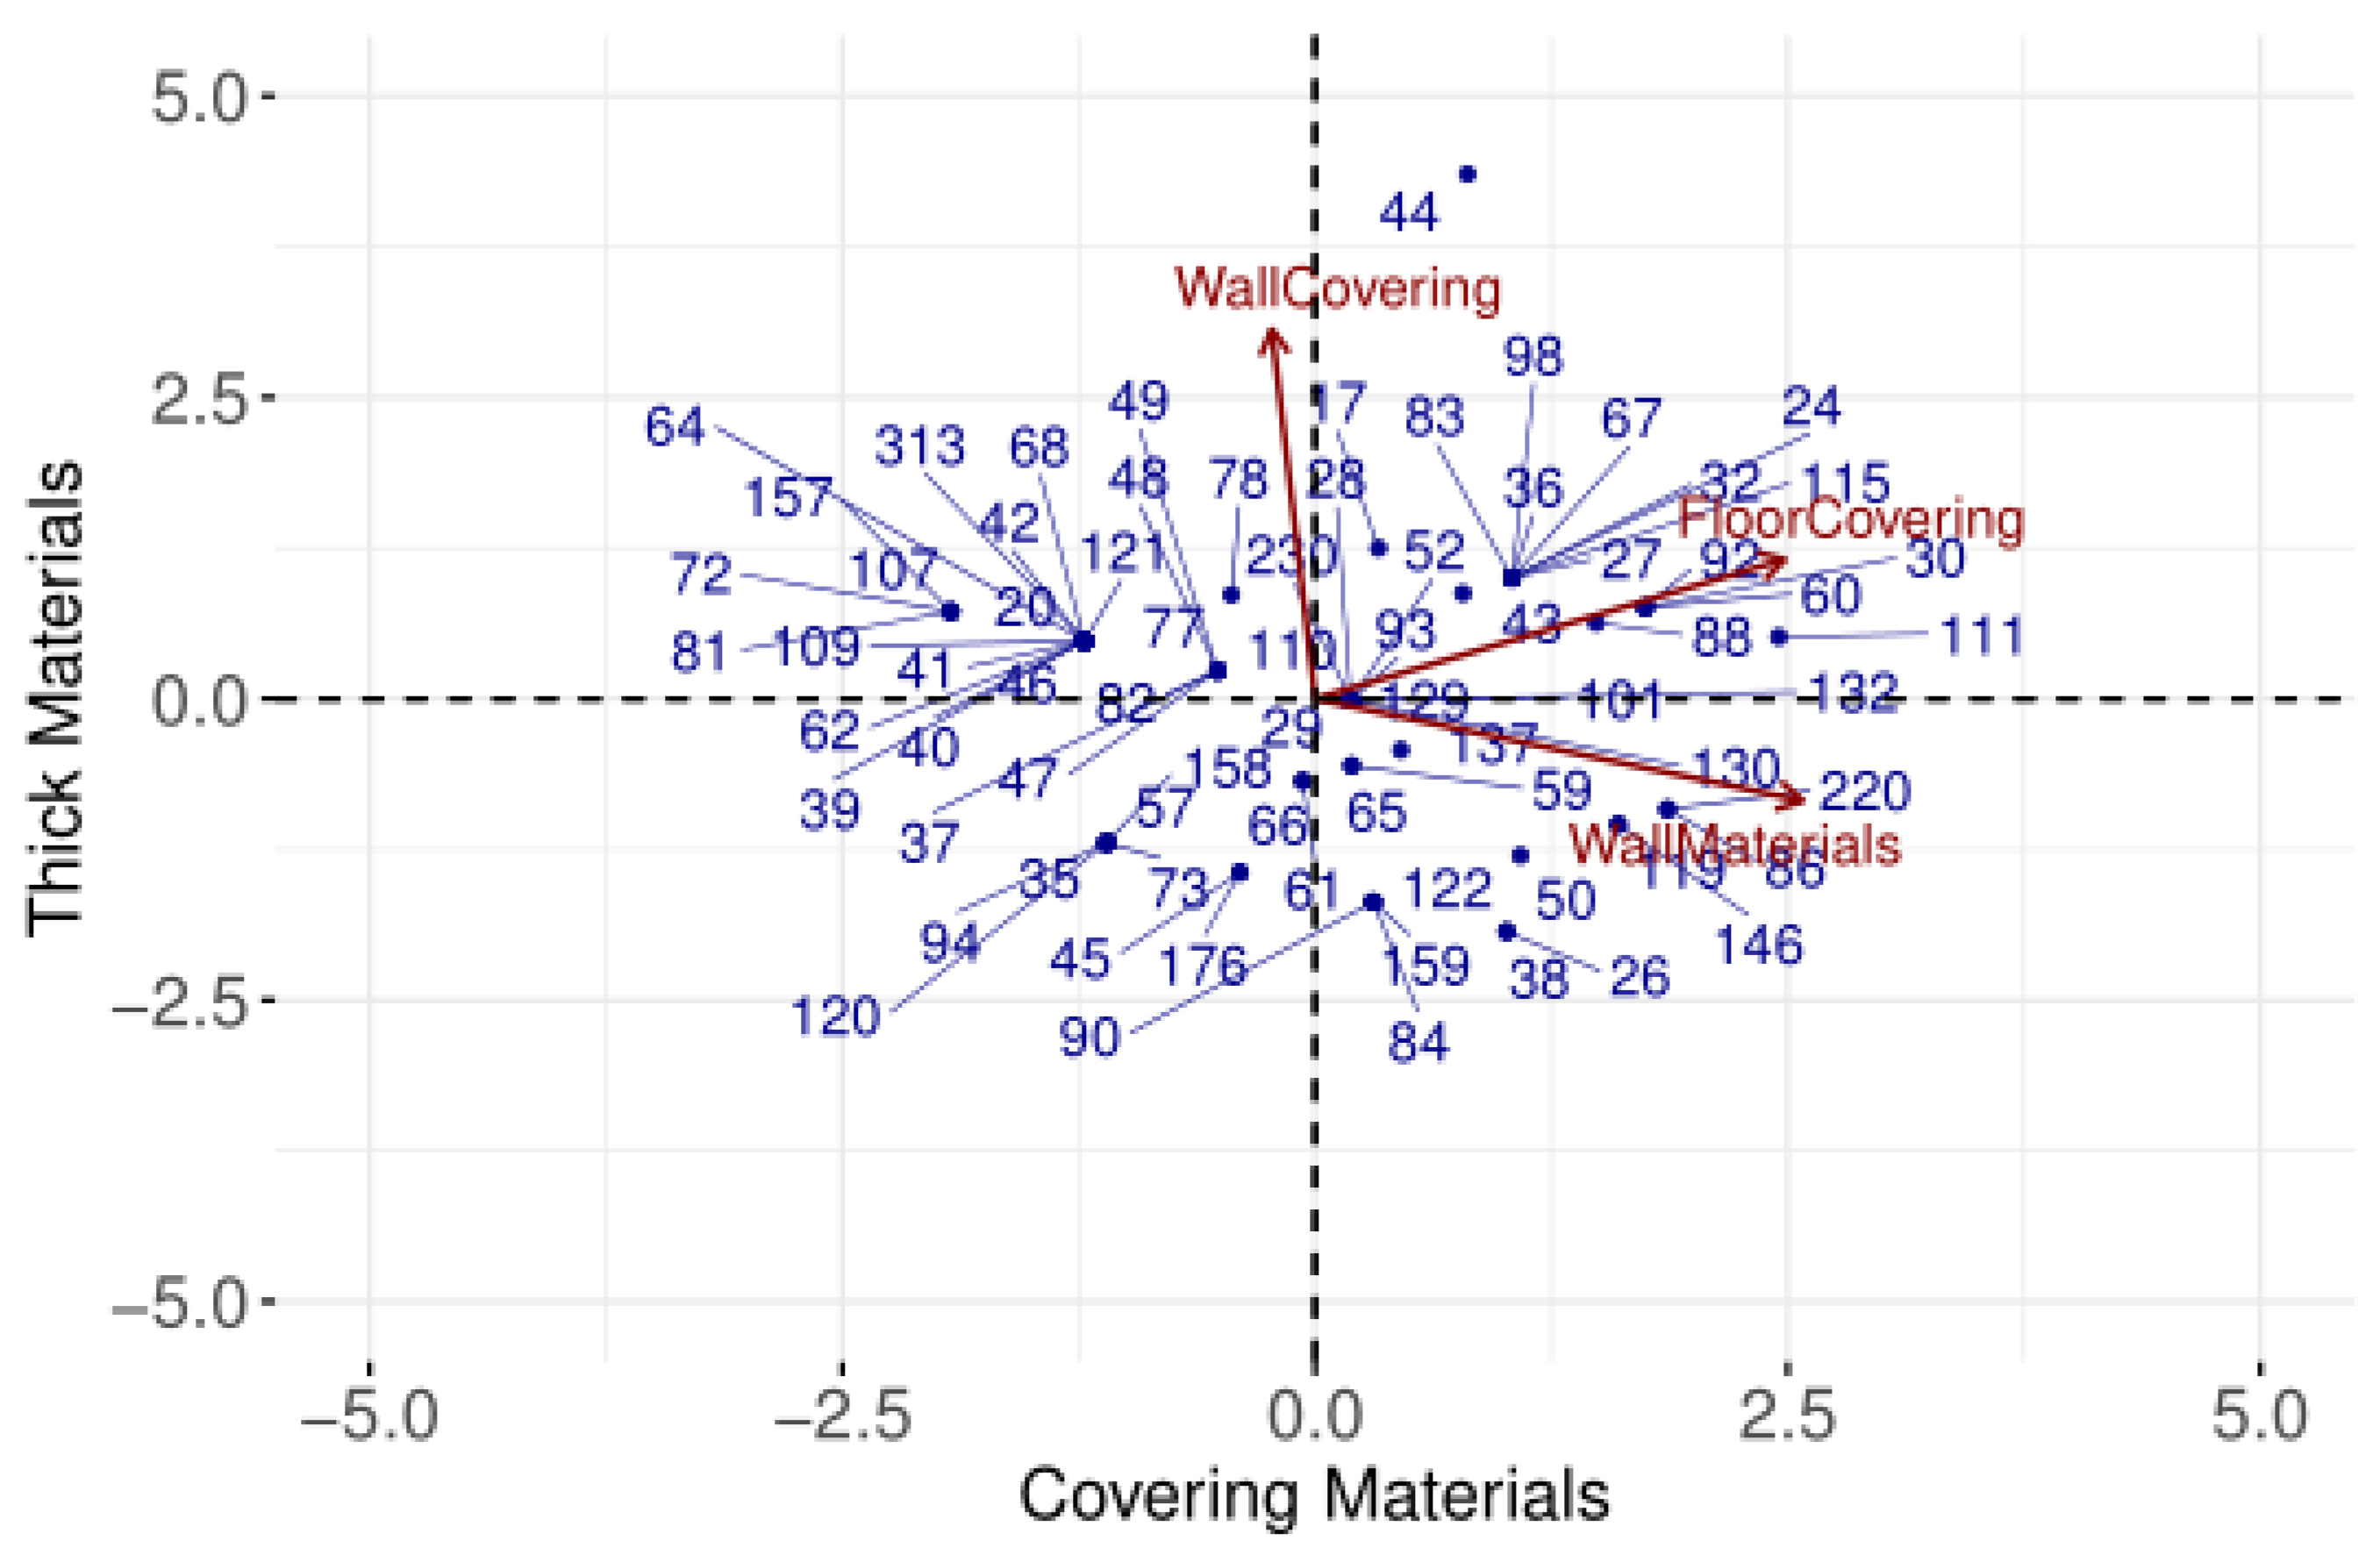
| First component | Building material, Windows, Floor covering | Floor number | Postcode | Wall covering, Floor covering |
| Second component | Postcode, Floor number | Wall material | Building type | Building material, Floor number |
| Cluster 1 | Cluster 2 | |
|---|---|---|
| Radon Activity Concentration (Bq/m3) | ||
| Mean value | 181 | 72 |
| Standard Deviation | 60 | 28 |
| Percentage Distribution of Wall Materials (%) | ||
| Cement | 5.6 | 8.9 |
| Bricks | 20.4 | 42.8 |
| Stones | 15.5 | 15.9 |
| Tuff | 58.5 | 25.9 |
| Other materials | 0 | 6.5 |
| Percentage Distribution of Floor Covering Materials (%) | ||
| Majolica | 64.1 | 60.1 |
| Wood | 0 | 2.5 |
| Linoleum | 0 | 1.3 |
| Granite | 0.7 | 0.9 |
| Moquette | 10.6 | 8.3 |
| Marble | 8.5 | 9.1 |
| Other materials | 16.1 | 17.8 |
Publisher’s Note: MDPI stays neutral with regard to jurisdictional claims in published maps and institutional affiliations. |
© 2022 by the authors. Licensee MDPI, Basel, Switzerland. This article is an open access article distributed under the terms and conditions of the Creative Commons Attribution (CC BY) license (https://creativecommons.org/licenses/by/4.0/).
Share and Cite
Sabbarese, C.; Feola, M.L.; Ambrosino, F.; Roca, V.; D’Onofrio, A.; La Verde, G.; D’Avino, V.; Pugliese, M.; Festa, V. A Preliminary Study of the Characteristics of Radon Data from Indoor Environments and Building Materials in the Campania Region Using PCA and K-Means Statistical Analyses. Environments 2022, 9, 82. https://0-doi-org.brum.beds.ac.uk/10.3390/environments9070082
Sabbarese C, Feola ML, Ambrosino F, Roca V, D’Onofrio A, La Verde G, D’Avino V, Pugliese M, Festa V. A Preliminary Study of the Characteristics of Radon Data from Indoor Environments and Building Materials in the Campania Region Using PCA and K-Means Statistical Analyses. Environments. 2022; 9(7):82. https://0-doi-org.brum.beds.ac.uk/10.3390/environments9070082
Chicago/Turabian StyleSabbarese, Carlo, Maria Luisa Feola, Fabrizio Ambrosino, Vincenzo Roca, Antonio D’Onofrio, Giuseppe La Verde, Vittoria D’Avino, Mariagabriella Pugliese, and Vittorio Festa. 2022. "A Preliminary Study of the Characteristics of Radon Data from Indoor Environments and Building Materials in the Campania Region Using PCA and K-Means Statistical Analyses" Environments 9, no. 7: 82. https://0-doi-org.brum.beds.ac.uk/10.3390/environments9070082