Design of Wide Angle and Large Aperture Optical System with Inner Focus for Compact System Camera Applications


1
Department of Medical IT Convergence Engineering, Kumoh National Institute of Technology, Gumi-daero 39253, Korea
2
Department of Optical Engineering, Kumoh National Institute of Technology, Gumi-daero 39253, Korea
*
Author to whom correspondence should be addressed.
Appl. Sci. 2020, 10(1), 179; https://0-doi-org.brum.beds.ac.uk/10.3390/app10010179
Submission received: 19 September 2019
/
Revised: 2 December 2019
/
Accepted: 20 December 2019
/
Published: 25 December 2019
(This article belongs to the Collection Optical Design and Engineering)
Abstract
:Conventionally, a bright, very wide-angle optical system is designed as a floating type optical system that moves two or more lens groups composed of multiple lens in order to focus accurately. These have been widely used as phase detection auto focus (AF) methods within conventional digital single-lens reflex (DSLR) cameras. However, a phase detection AF optical system cannot be used when recording motion pictures. In contrast, a compact system camera (CSC) performs AF by the contrast method, where a stepper motor is used as the driving source for moving the optical lens. Nonetheless, to ensure that the focusing lens is lighter, these stepper motors should not have high torque and AF must be possible by moving only one lens. Yet, when focusing is performed with only one lens, aberration change due to focusing lens movement is magnified. Therefore, a very wide-angle optical system comprised of a half-angle of view more than 40 degrees and F of 1/4 has not been developed. Here, a very wide-angle optical system was designed with high resolving power that enables high speed AF, even in contrast mode, by moving only one lens while minimizing aberration change.
1. Introduction
“Mirrorless” is a familiar term for general users and consumers of cameras. Its official name is a compact system camera (CSC) and is also known as a mirrorless interchangeable lens camera (MILC) [1]. The CSC is a form of the digital single lens reflex (DSLR) in which the reflective mirror and the optical view finder are removed [2]. As a result, the volume and weight are dramatically reduced when compared to conventional DSLR type cameras. Further, no mirror shock and black out are caused by DSLR because there is no reflection mirror movement inside the camera [3]. As CSCs did not have an auto focus (AF) sensor at their introduction, the camera essentially used contrast detection auto focus (contrast AF) [4]. Hence, AF speed was significantly slower when compared to contrast AF. The phase difference AF system calculates the difference between the reference phase and the current phase and determines the amount of movement required to achieve optimum focus, while the contrast AF moves the lens group by small amounts to achieve the same [5]. As the method determines the contrast by the image sensor and finds the optimum focus, AF was not rapid. However, the latest technological enhancements to improve AF speed, such as hybrid AF using the phase contrast AF method and contrast AF method simultaneously, dual pixel CMOS AF, and depth from defocus (DFD) AF method, have improved to the point that this deficiency is no longer an issue when compared to DSLR [6]. At the same time, developments in the area of image sensors, progressing from the M4/3 (micro four thirds) sensor to the full-frame sensor, have been steadily advancing. In pursuit of the high-quality achieved by the full-frame DSLR in CSC, a CSC that adopted an APS-C (advanced photo system, type-C) sensor was introduced for the first time in Korea in 2010 and a CSC that adopted a full-frame sensor was released in Japan in 2013 [7,8].
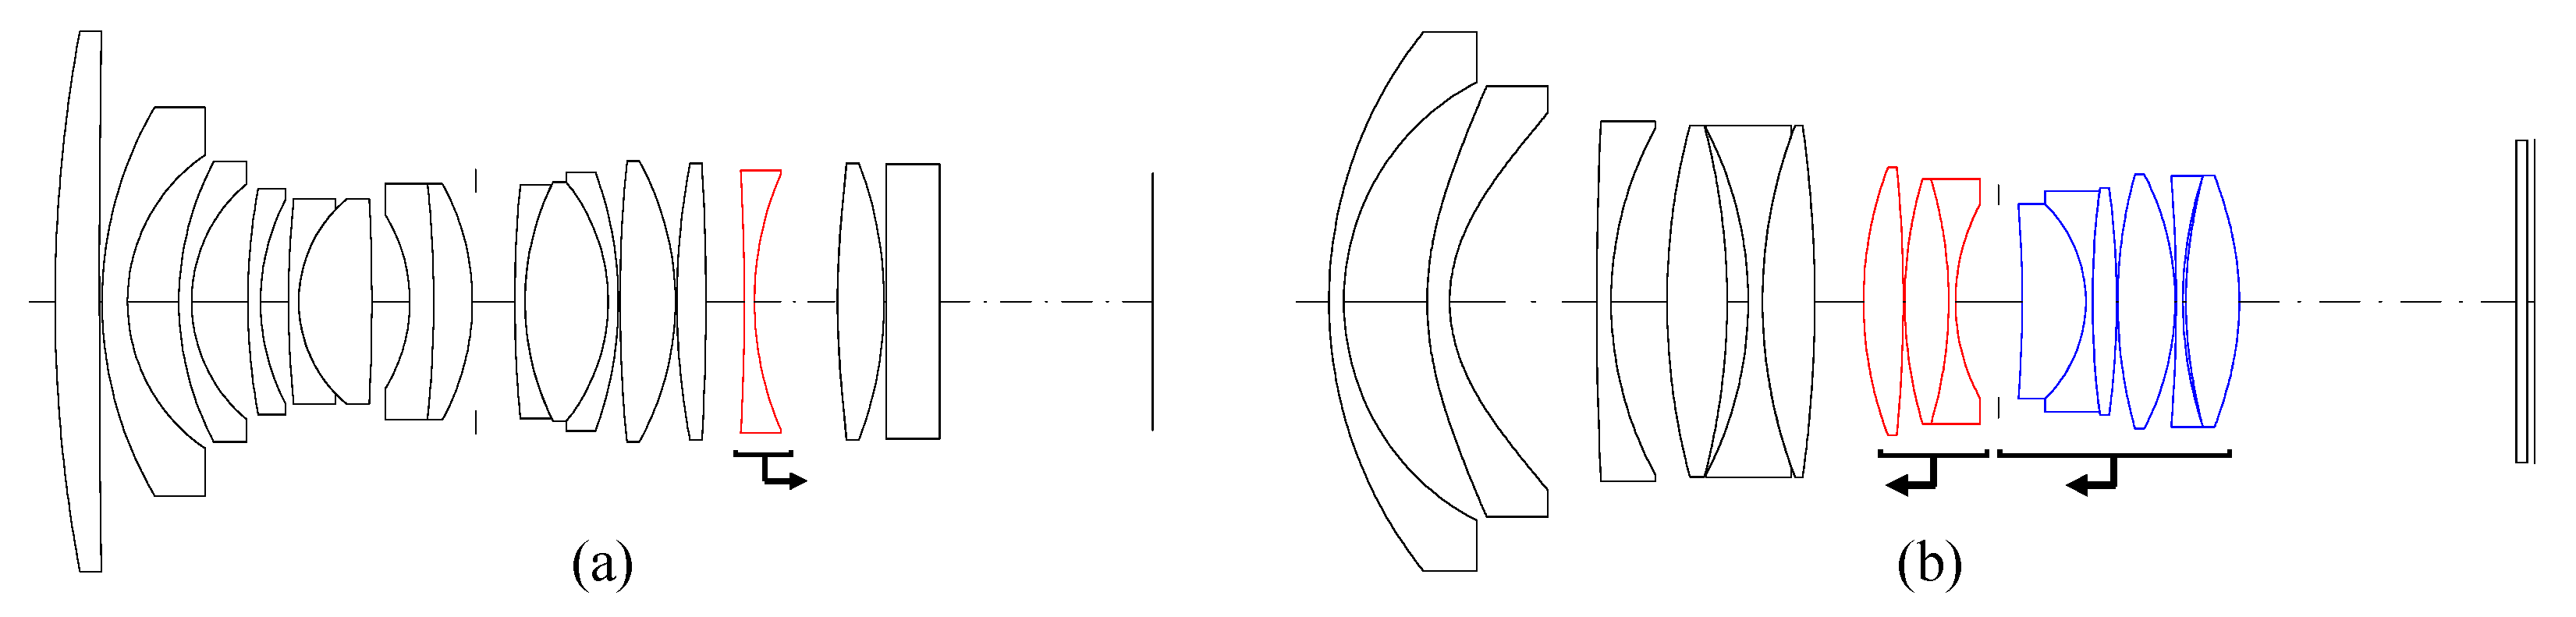
Meanwhile, the digital camera industry in 2017 was equipped with a 4K UHD (ultra-high definition) 60 frame/s video recording function [9]. The movie recording function began to be used when the camera sensor was replaced with a digital sensor. However, problems such as AF speed and AF noise, which were detrimental in video recording, were gradually solved through technological advancements. Specifically, by integrating phase detection AF and contrast AF, as described above, to compensate for the respective AF methods’ shortcomings, the speed and accuracy of AF in CSC were improved. The phase detection AF method’s drawback is that the actual focal position does not match due to AF computation movement [10]. Therefore, if it is supplemented with contrast AF, that focuses accurately, it is possible to focus on fast-moving objects even in dark surroundings. In addition, the compensation method with phase difference AF or DFD AF was used to determine the focusing direction. Contrast AF, that can focus precisely, is essential for any AF method. Additionally, a driving source capable of moving the AF group constantly and quickly is required. For this purpose, a stepper motor (STM), that has a higher precision, is used as a driving source for moving the lens. However, STM is unable to generate fast AF when the focusing group is heavy because the torque is not large [11]. Hence, when the STM is used as a driving source, the focusing group must be lightened for optical system design. In this study, the AF group designed a very wide angle optical system with a lightweight internal focus system. The inner focus system is a method in which the inner lens group moves and focuses while the first and last groups of the optical system are stationary. The floating system is a method in which two or more arbitrary lens groups move and focus. The 24 mm field of view is also included in the product range of major camera manufacturers, with field angles typically used for outdoor scenes or celestial objects. However, for such an angle of view, the optical system with an inner focusing CSC interchangeable lens or a floating interchangeable lens using APS-C sensor or less, and a full-frame CSC interchangeable lens capable of focusing only with one lens has not yet been developed. Therefore, in this study, we discuss the optical design method of the very wide angle optical system of an internal focusing type that can focus with only one lens in the CSC using a full-frame sensor. The objective of designing and building the system is for use in an optical-based camera system. Representative examples of inner focus system and floating system in camera optics are shown in Figure 1.
2. Theory
A First Order Fit Using Gaussian Brackets
As paraxial ray tracing resembles the optical system, the characteristics of the optical system can be calculated easily and quickly [14]. In this case, the effective focal length (EFL), back focal length (BFL), and front focal length (FFL) of the optical system can be expressed by Equations (1)–(3) using a Gaussian bracket [15]. Here, k represents the refracting power of the lens surface, d represents the distance between the front and rear surfaces of the lens, i represents the refractive index, and the subscript is a number corresponding to each side of the optical system. From Equations (1)–(3), it is evident that the three variables must be adjusted to satisfy the desired EFL, BFL, and FFL [16].
For example, the focal length EFL of an optical system consisting of n elements is expressed by the Gaussian bracket method and the third, sixth, and tenth elements, α3, α6, and α10, respectively, are extracted as indicated in Equation (4).
Here, element a represents the selected variable, refractivity or thickness, and the subscripts i, j, k represent the first, second, and third variables in order, and α, including the subscript, is defined to simplify the expansion of the Gaussian parenthesis [15]. By defining β and γ in the same way, BFL and FFL can be expressed simply as Equations (5) and (6). In order to obtain each variable, Equations (4)–(6) are combined and expressed as Equation (7), where S1, S2, ⋯ S5 denote the coefficients of the quadratic equation. Therefore, by obtaining the solution of Equation (7), it is possible to obtain design variables αi, αj, and αk satisfying an arbitrary focal length, back focal distance, and front focal length.
3. Methods
3.1. Primary Design Approximation of Optical Lens
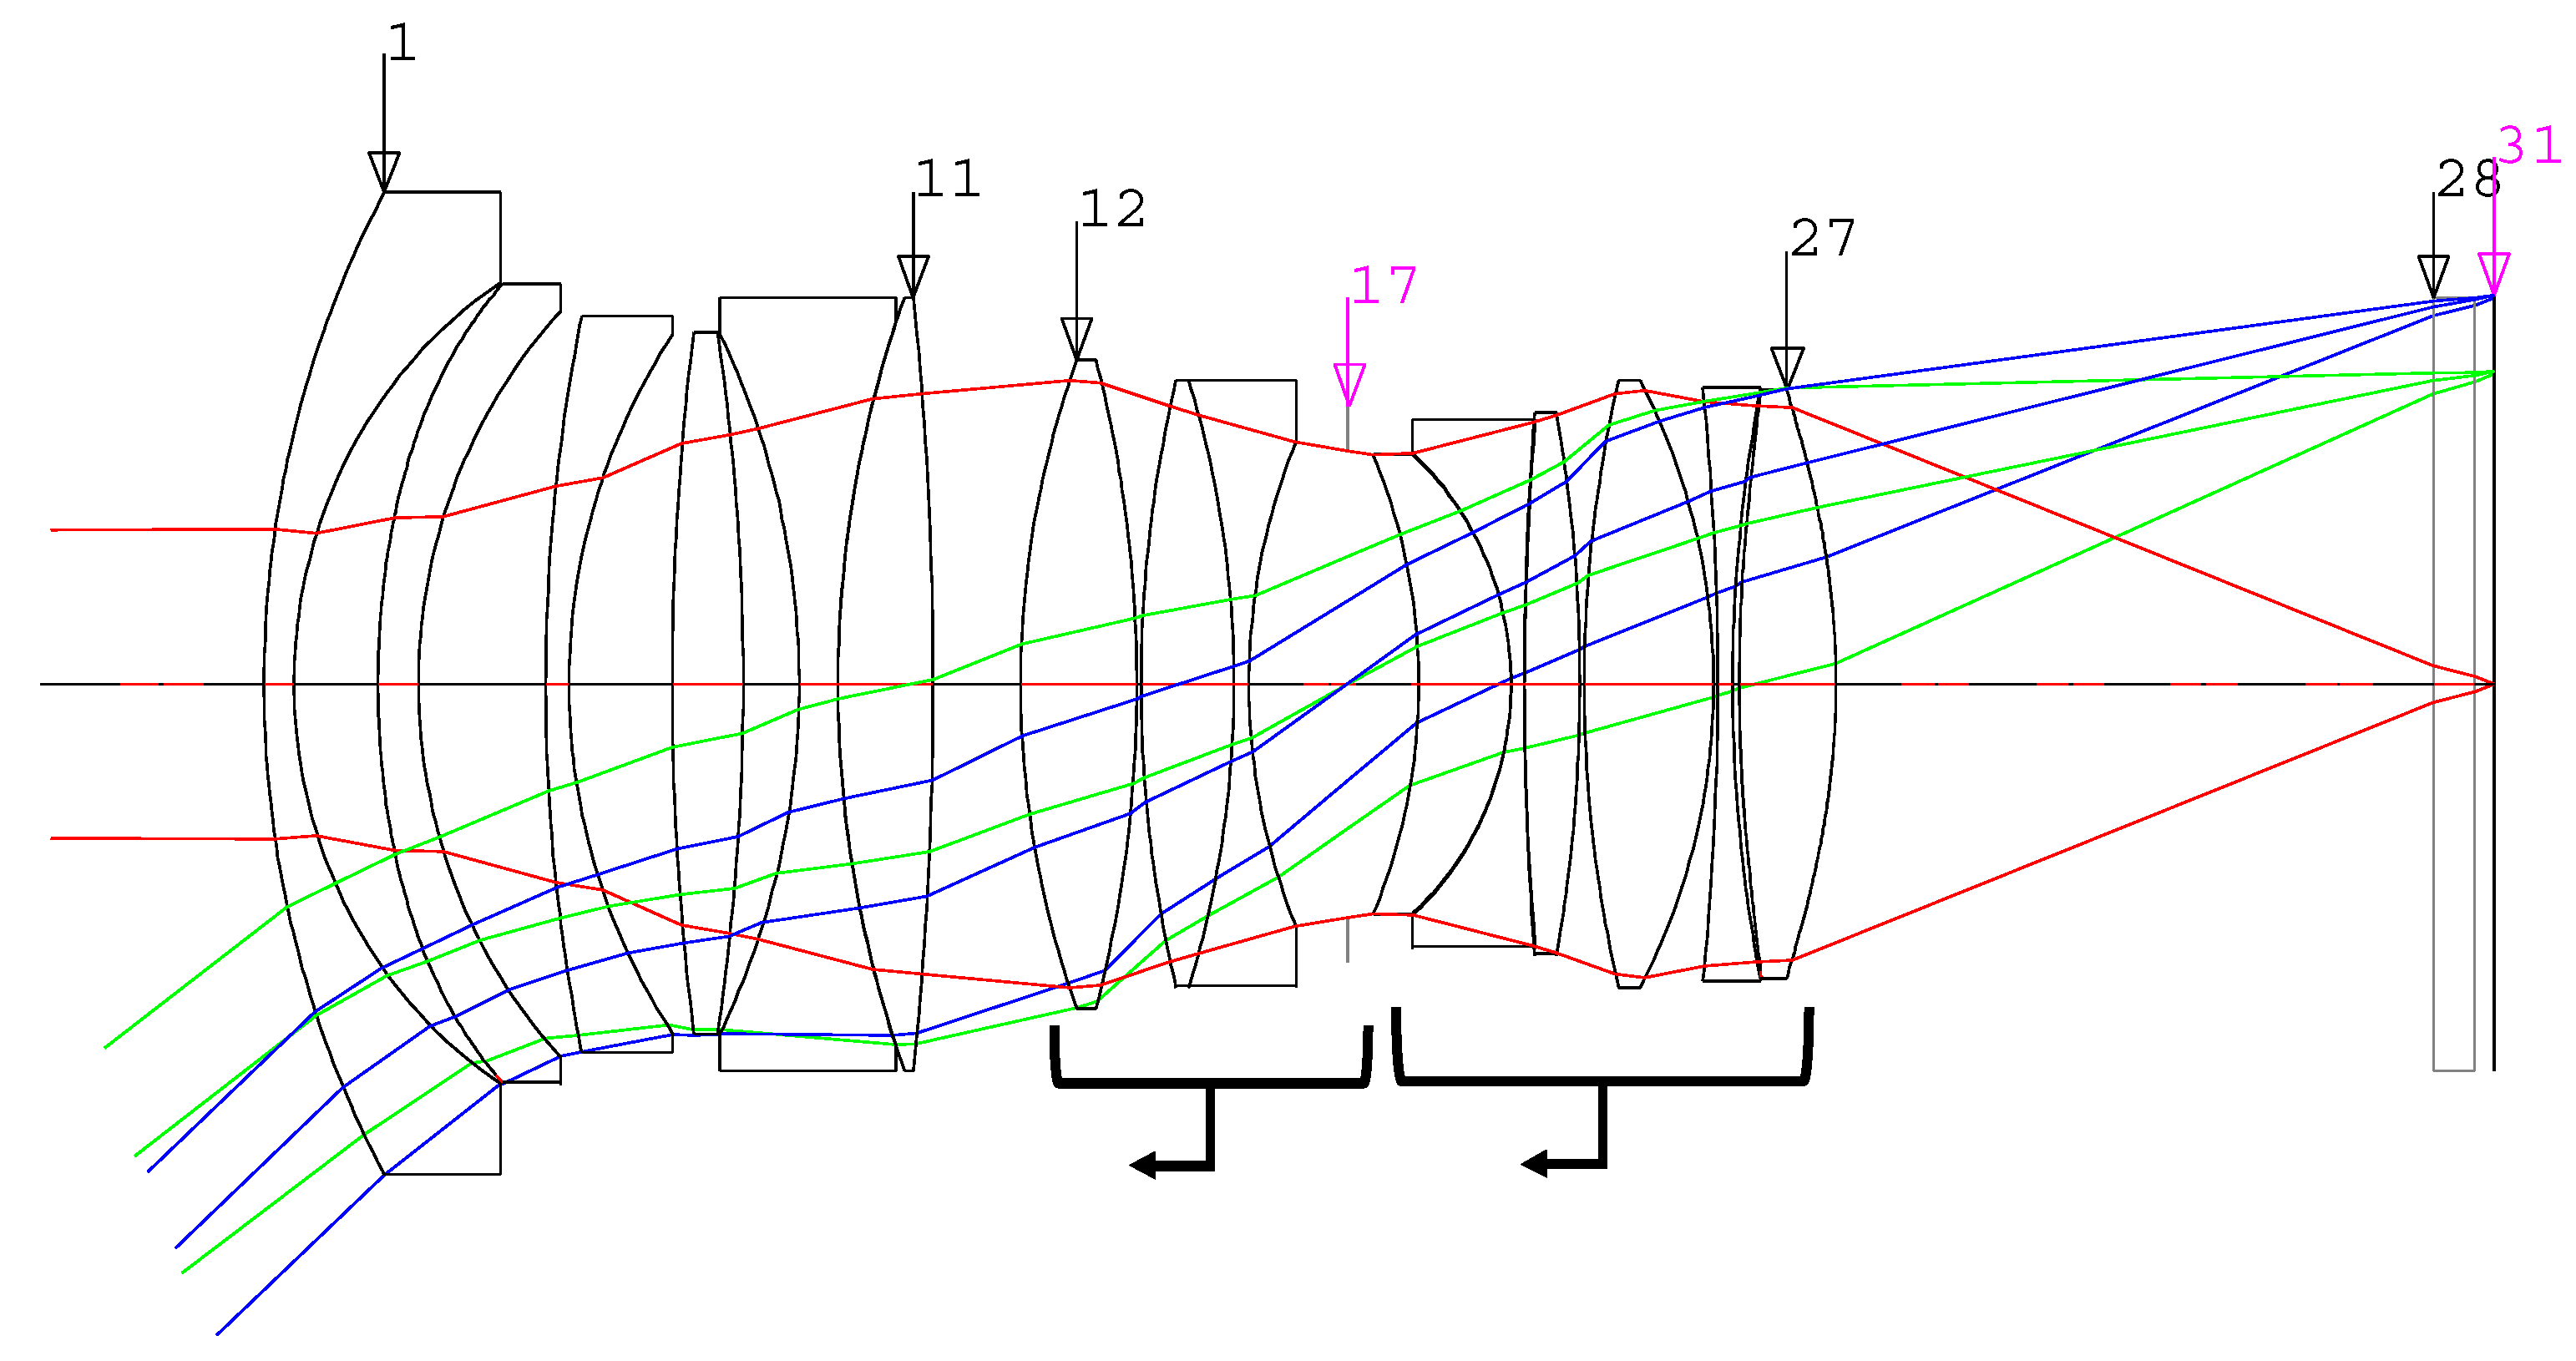
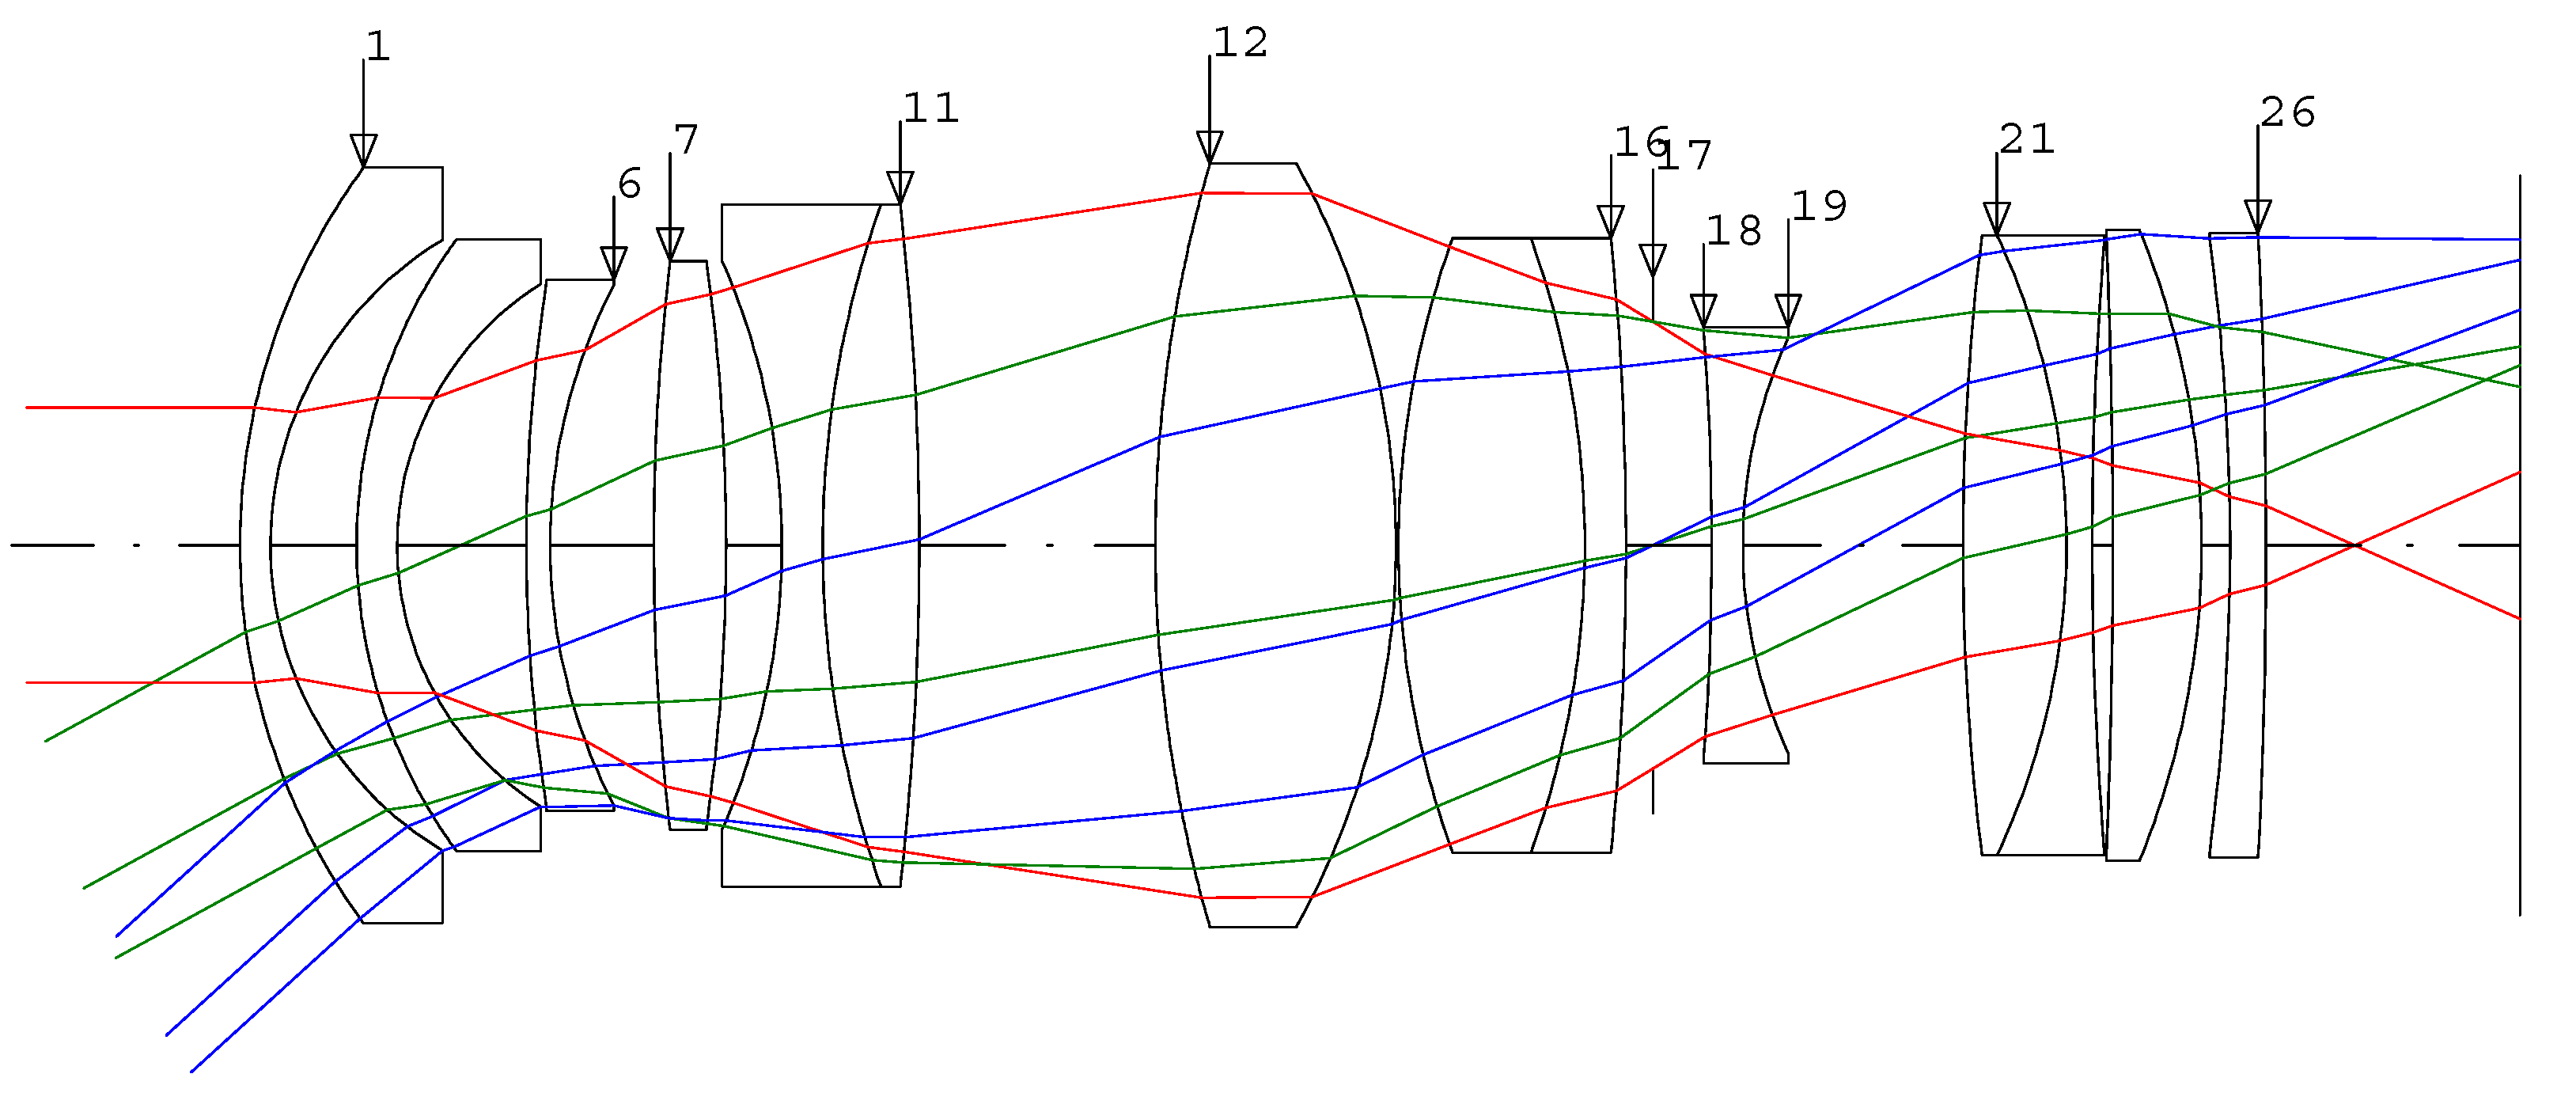
The design software used in this study was CODE V (Synopsis, Optical system design Inc., East Boothbay, ME, USA). Figure 2 illustrates the optical path for the optical system of Example 1 from the patent JP20160012034A2P. In Figure 2, beginning at the object side to the sixth surface, the object serves as a converter to rapidly change the angle of view, and the sixth surface to the twenty-seventh surface forms shape of a double-gauss type for the incoming rays. This optical system has optical specifications of F/# 1.4 and EFL of 24 mm, and the applied imaging sensor size satisfies 21.7 mm of full-frame. However, the AF system is a floating type optical system focusing on the third group from the 12th surface of the optical system to the 16th surface and the fourth and fifth groups from the 18th surface to the 27th surface. As it has a flange back distance for DSLR, it does not match the flange back distance for the CSC design.
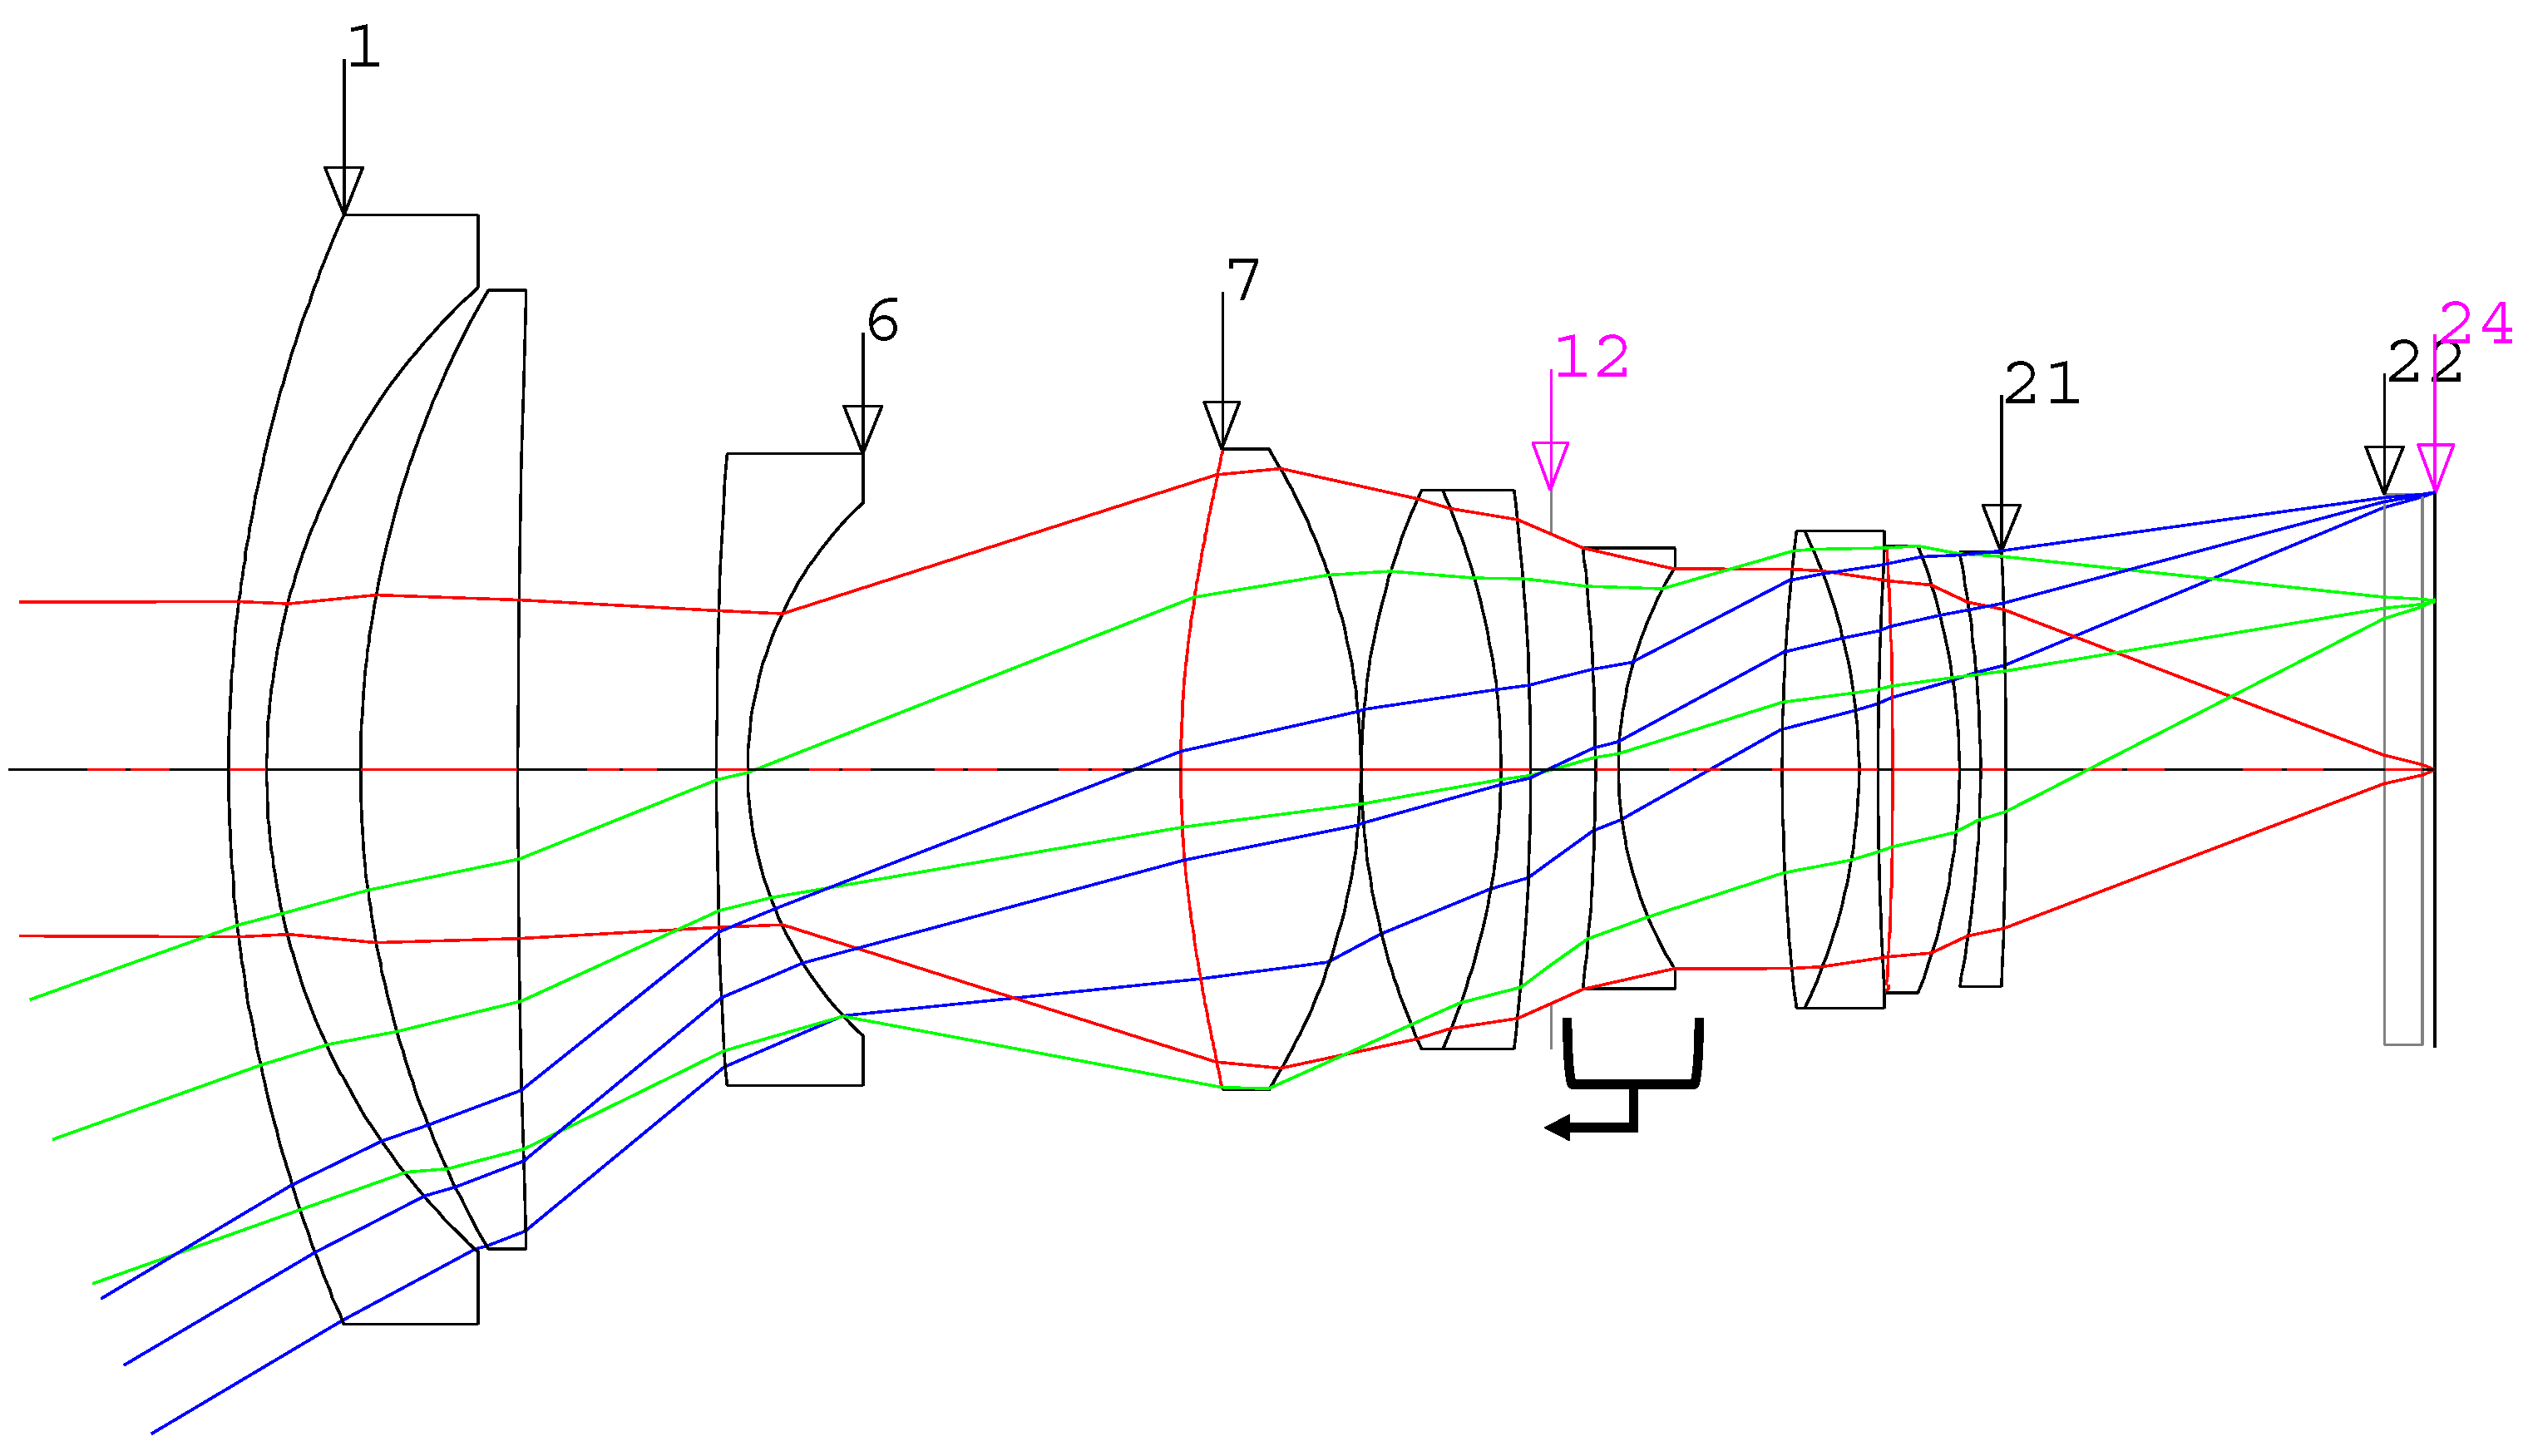
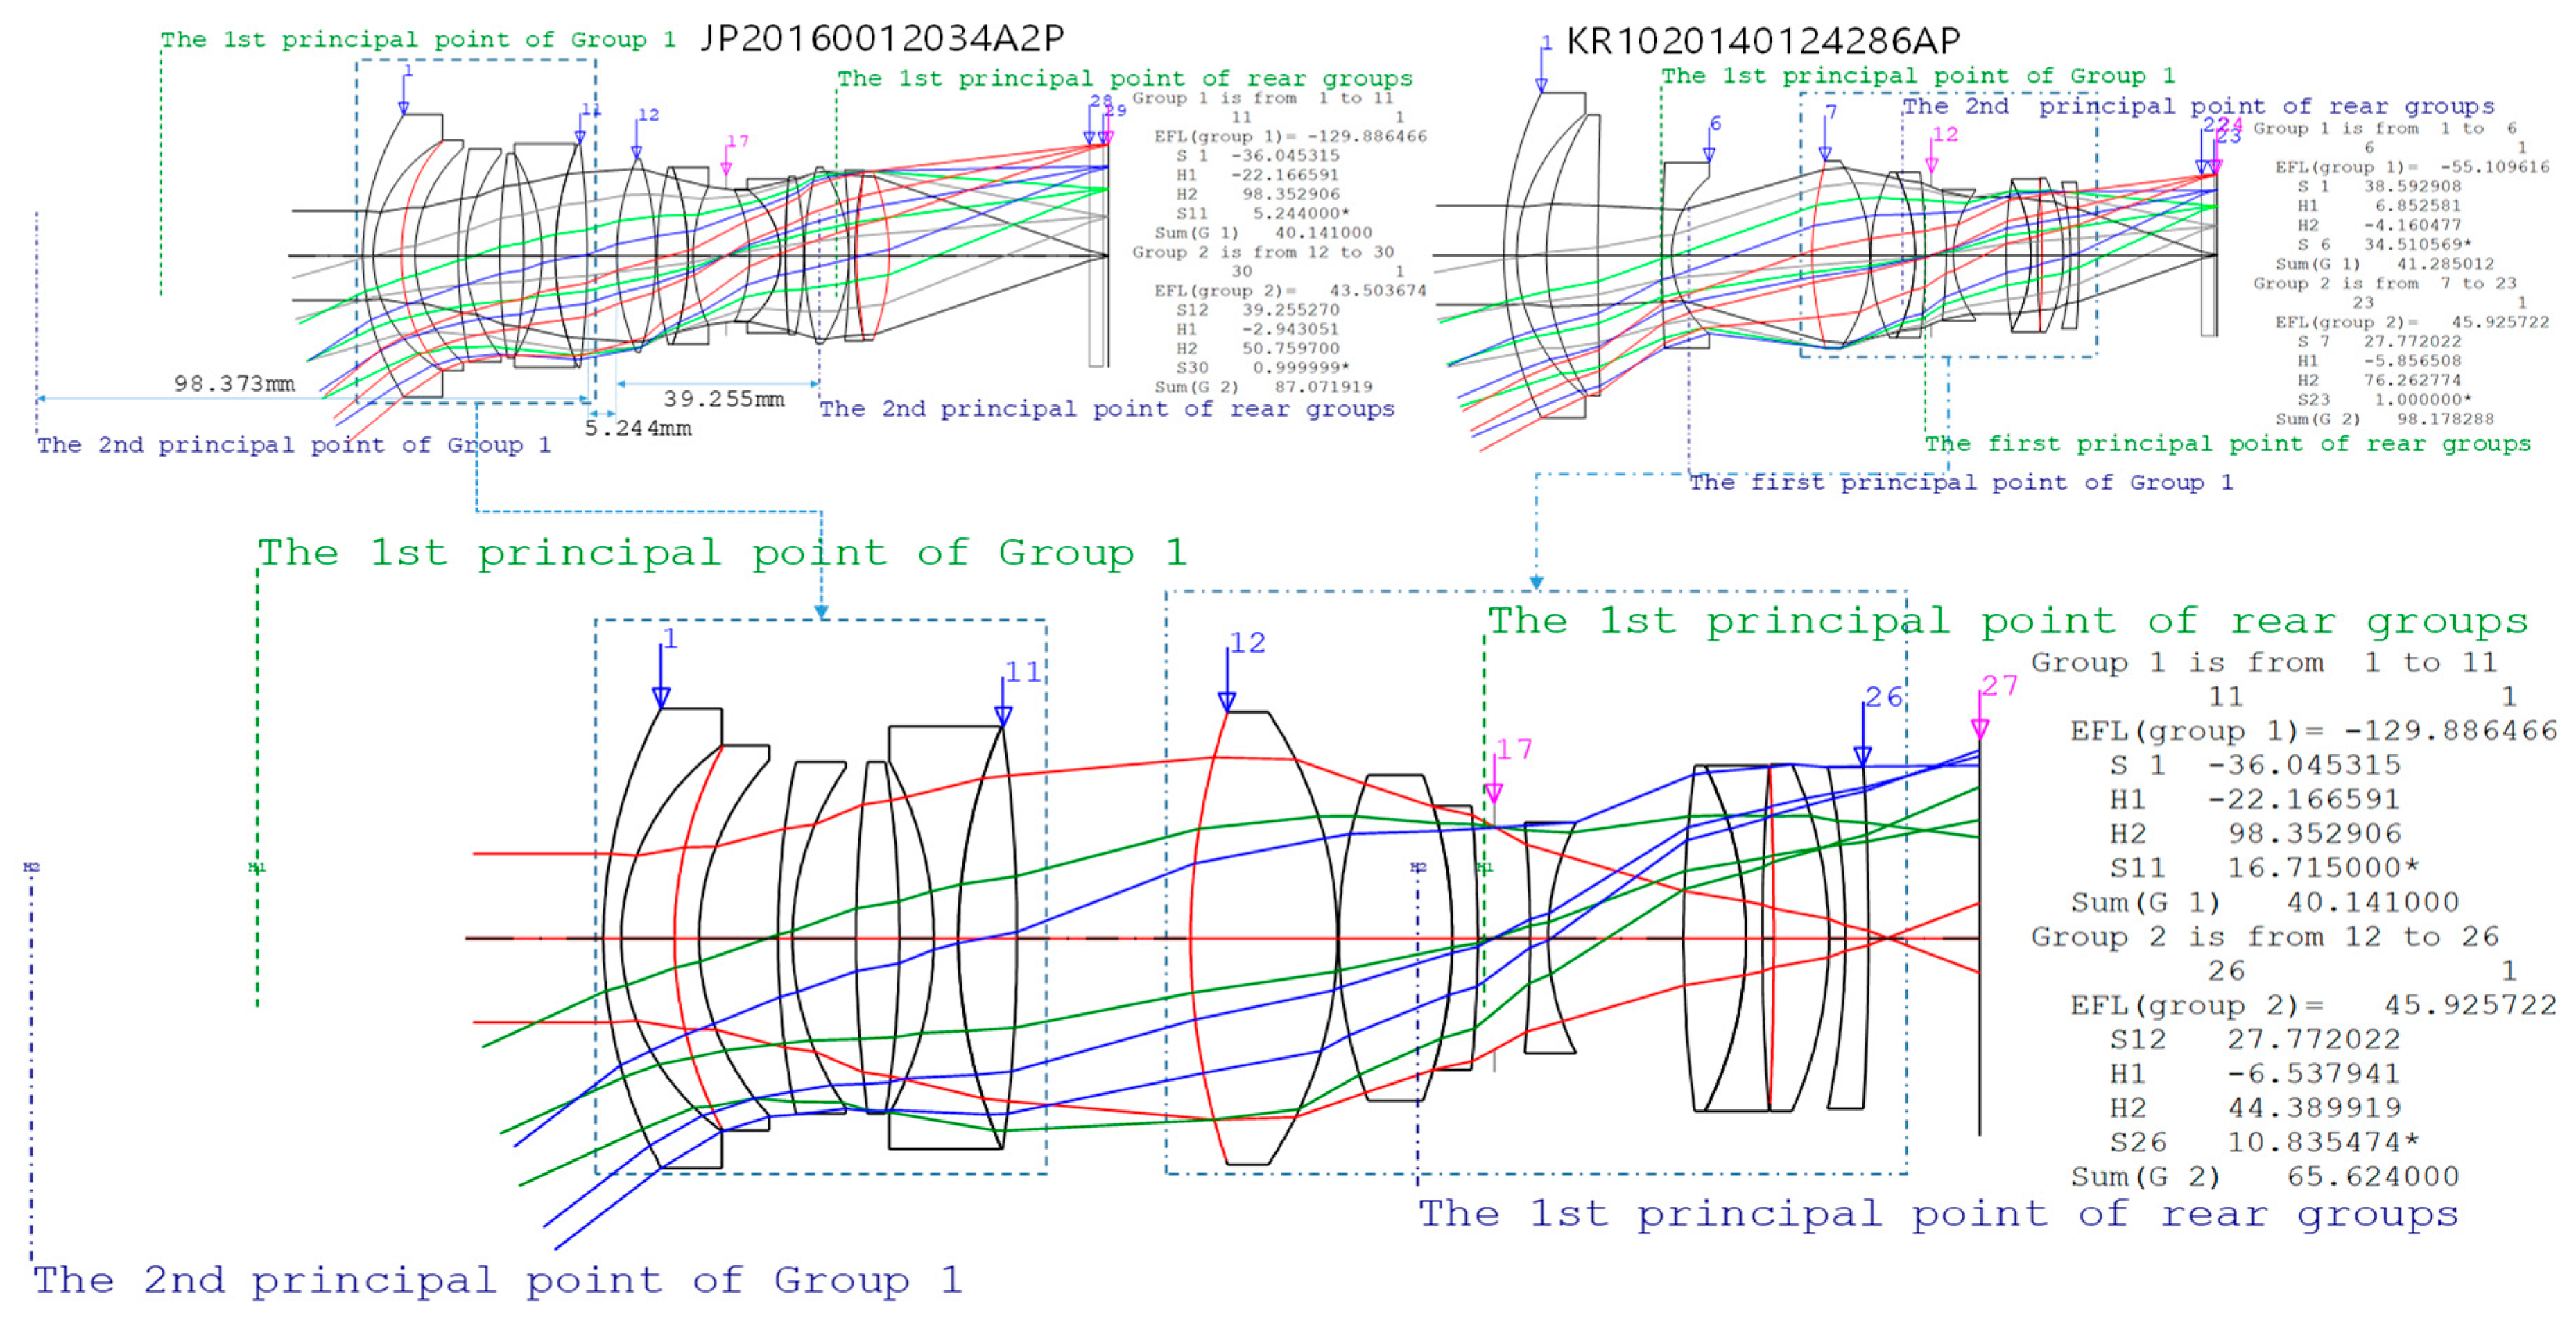
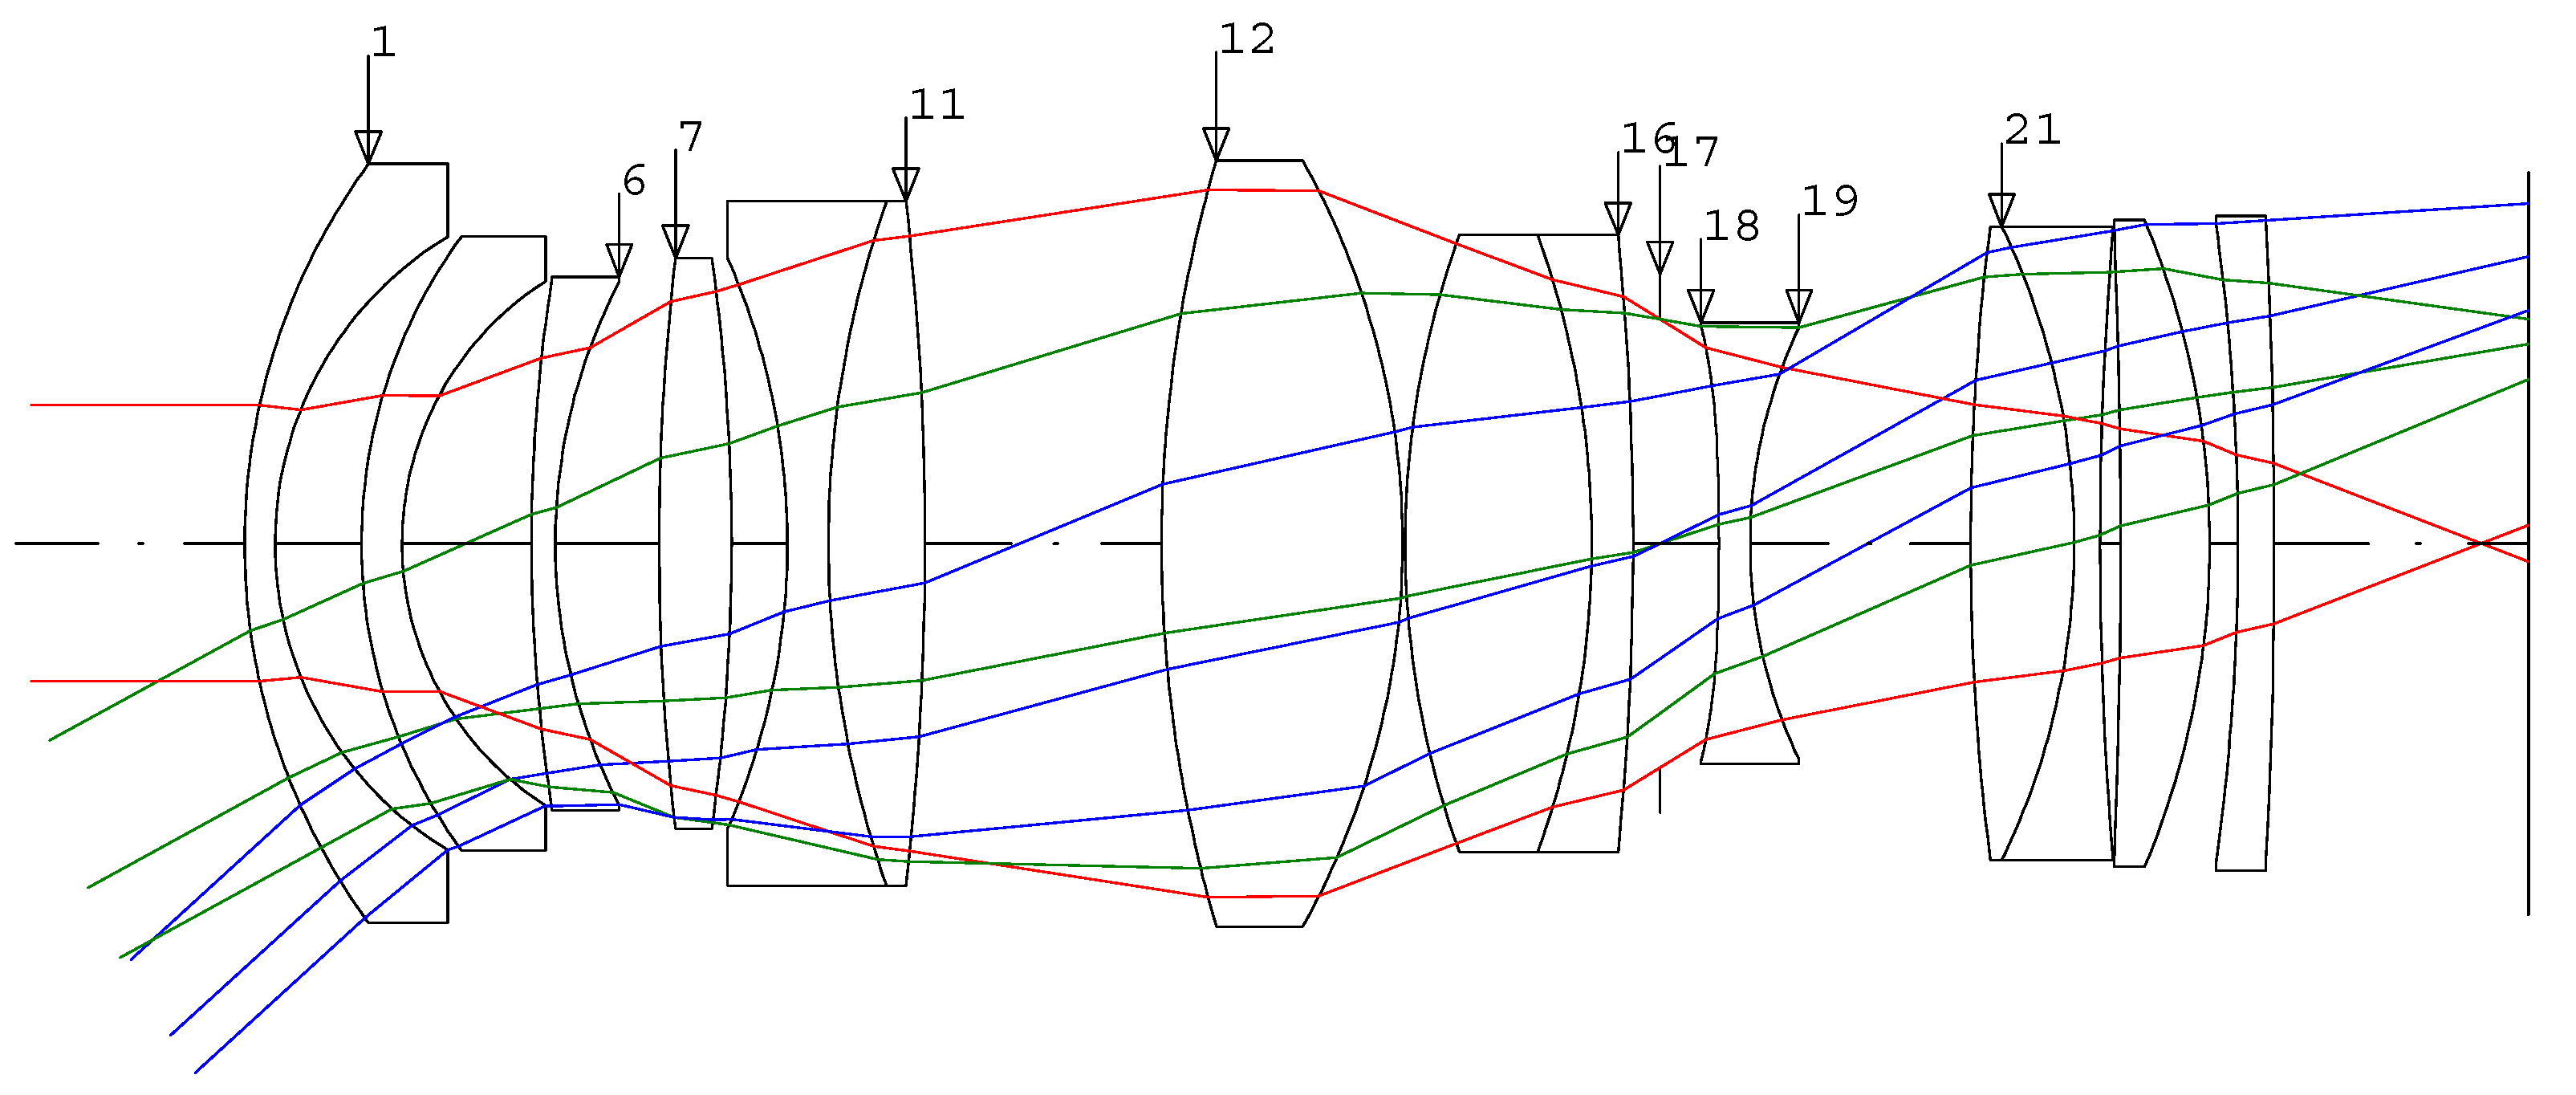
Figure 3 shows the optical path for the optical system of Example 1 from the patent KR1020140124286AP. The first to sixth surfaces on the object side act as converters, and the seventh surface to the 21st surface serve as the imaging unit, and the focusing is performed with the single lens of the 13th surface. This optical system has the flange back distance for the CSC optical system capable of AF with internal focusing using a single F/# of 1.4, and the imaging sensor has a full-frame size of 21.7 mm or APS-C size of 14.25 mm is not satisfied. Therefore, by combining the two optical systems appropriately, basic design data that satisfies both the F/# of 1.4, AF with the internal focusing method using a single lens and a full-frame imaging sensor was obtained. The 1st surface to The 11th surface of the Example No. 1 optical system from the patent JP 20160012034A2P (Figure 2) and the 7th surface to The 21th surface of the Example No. 1 optical system from the patent No. KR1020140124286AP (Figure 3) were synthesized. Prior to combining the two optical systems, the KR1020140124286AP optical system was adapted to meet the specifications of the APS-C sensor such that it was extended to the size of a full-frame sensor. Each focal length of the synthesized lenses was compared with the optical systems of JP20160012034A2P and KR1020140124286AP, and the group with minimum variance was then selected. For example, the focal distance from the 12th surface to the 27th surface of the JP20160012034A2P optical system is 43.508 mm, and the focal length from the 7th surface to the 21st surface of the KR1020140124286AP optical system is 45.926 mm, which is a relatively small focal length difference from other lens groups. The objective of the synthesis of the two optical systems is to replace the imaging group of the JP20160012034A2P optical system with the imaging group of the KR1020140124286AP optical system in such a way that the paraxial optical properties of the optical system after synthesis would not differ greatly from the paraxial optical properties of the JP20160012034A2P optical system before synthesis. Therefore, the optical system of JP20160012034A2P is considered as an optical system having a first group from the 1st surface to the 11th surface and a second group from the 12th surface to the 27th surface. The principal points of each group are determined and the principal point of the optical system is −98.353 mm from the 11th surface. Additionally, the first principal point of the second group is 39.255 mm from the 12th surface of the optical system, the optical distance difference between the two groups is 142.852 mm from the second principal point of the first group to the first principal point of the second group. Likewise, in the KR1020140124286AP optical system, if the 1st to 6th surfaces are referred to as the 1st group and the 7th surface to the 21st surface as the second group. The first principal point of the second group in the KR1020140124286AP optical system is separated by 27.772 mm from the 7th surface. As the second group of the JP20160012034A2P optical system is replaced by the second group of the KR2020140124286AP optical system, the distance from the second principal point of the first group of JP20160012034A2P to the first principal point of the second group of KR1020140124286AP was supposed to be identical at 142.852 mm. Therefore, the distance between the lenses on the 11th surface and the 12th surface after synthesis should be increased by 16.715 mm, which is the distance between the first principal point of the second group of JP20160012034A2P and the first principal point of the 2nd group of KR1020140124286AP. Specifications of the optical system as shown in Figure 4 are shown in Table 1.
The optical path of the synthesized optical system is shown in Figure 4. The EFL of the synthesized optical system is 26.302 mm, which is the difference between the designed target of 24 mm and 2.3 mm at 5 degrees field of view. In addition, the BFL is 10.83 mm, which is shorter than the standard CSC flange back specification. Considering that this optical design is a very wide angle system intended for the CSC format, proper correction of the focal length and back focal length is essential and so this was adjusted by solving the simultaneous equations of Equation (2). Here, the lens surface selected to correct each day’s radiation must be capable of physical fabrication, where the curvature and thickness after correction must not be largely changed from the existing values. Additionally, as there is no real numeric solution in the quadratic equation to find the solution of the focal distance, various combinations of variables were applied, and then, R1, R4, and D11 variables were selected. R1 is the curvature of the first surface, R4 is the curvature of the fourth surface, and D11 is the lens thickness of the 11th surface. When the variables R1, R4, and D11 were selected and the BFL was corrected to 15 mm, the changed values of each variable were as illustrated in Table 2. At this point, if a second correction is performed to adjust the focal length to 24, it was confirmed that the parameters of R2, R3, and R25 variables changed as illustrated in Table 3. In this case, variable selection was chosen by examining the variable combinations as mentioned above.
Figure 5 illustrates the optical path when the BFL of the synthesized optical system is adjusted and the EFL is corrected to 24 mm. It is evident that the light aberration is very large through the optical path of Figure 5. In the optical design software, design optimization is the process to minimize the size of the surface area. Allowing large aberrations in the central part of the basic design process can be detrimental in the early stages of the optimization process, especially as the center size is more sensitive to the surface size. Hence, design optimization should proceed after correcting the aberration to some extent. To that end, the aspherical contribution to the Seidel 3rd order aberration was used [17]. As the aim of the aberration correction in the basic design process is to further smoothen the design optimization at the initial stage, spherical aberration, the factor with a considerable effect on gathering the ray to one point with respect to the central part of the upper surface, was corrected. The equation for the aspherical surface is shown in Equation (8), where c represents the curvature and y represents the vertical distance from the optical axis when the ray falls on the refracting surface. A4 and A6 are the fourth- and sixth-order aspherical coefficients, respectively, and the change of the Seidel aberration coefficient by the fourth-order aspherical coefficient can be expressed as Equations (9)–(12) [17].
where SI represents the coefficient of the spherical aberration of the Seidel aberration coefficient, the subscript total represents the Seidel aberration coefficient including the aspherical surface, n represents the refractive index immediately before the refracting surface, n’ represents the refractive index of the refracting surface, y is the height of the axial ray of the refracting surface, SII, SIII, and SV are the coma aberration, astigmatism, and distortion aberration, and ȳ represents the principal ray height at the corresponding refracting surface.
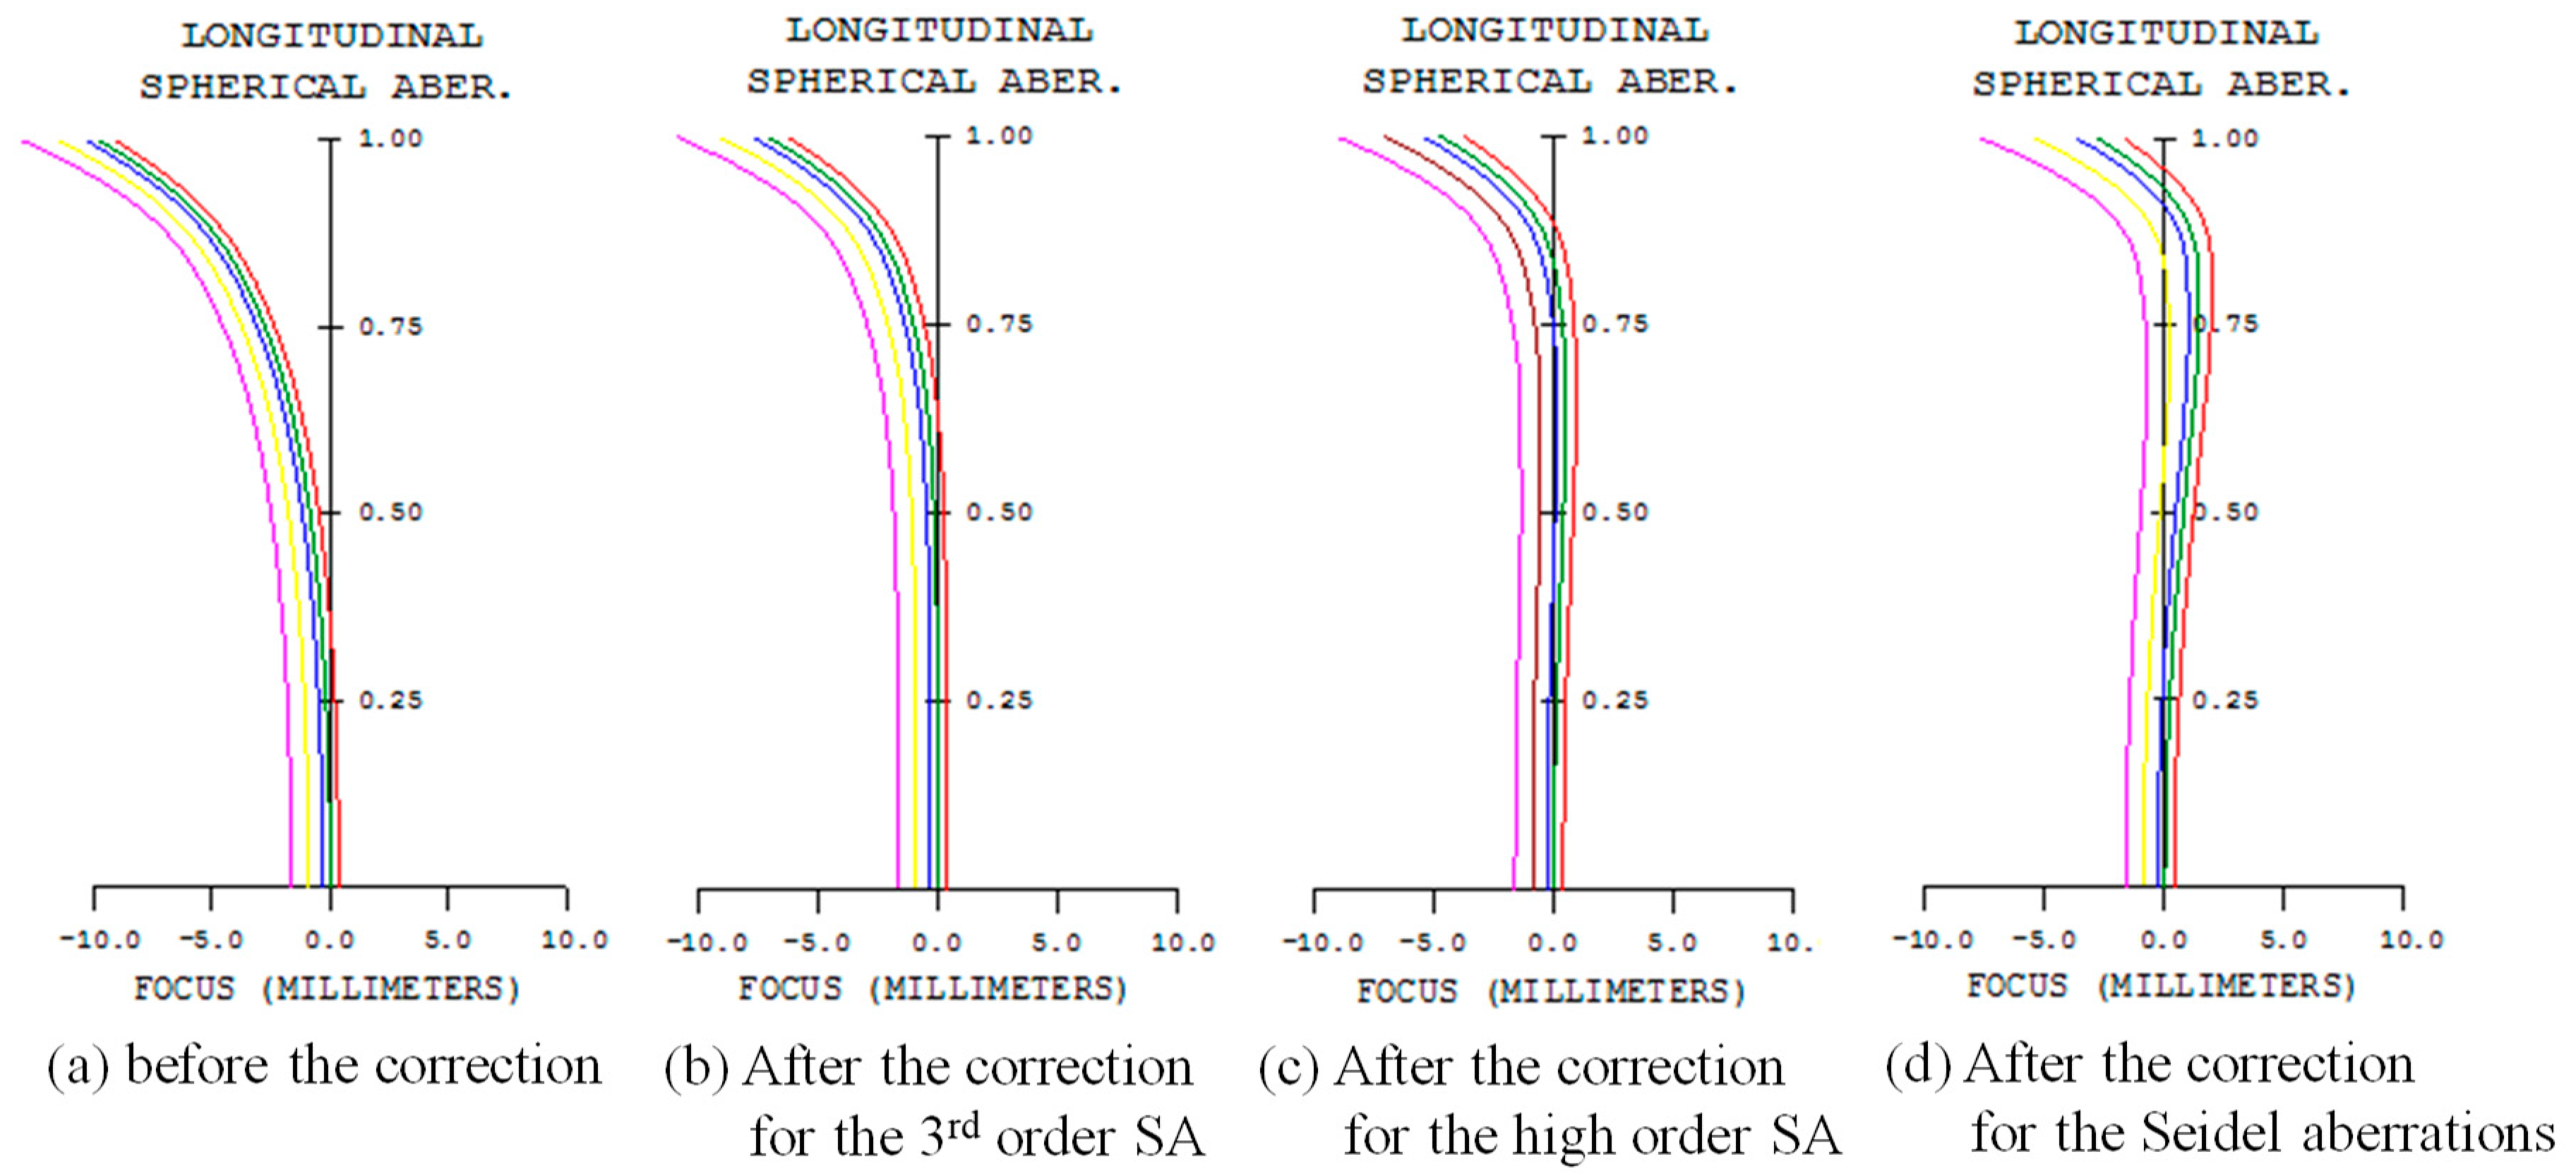
Moreover, as the aspherical surface becomes larger, the material and processing cost increase [18]. Therefore, the 18th surface was selected as the aspherical surface to correct spherical aberration considering both the correction effect and the processing cost. In this study, a method to reduce the total number of aberrations by adjusting the balance with higher order aberrations was used. Using Equation (9), the fourth-order aspheric coefficient A4 when the Seidel spherical aberration is zero was calculated as −1.982156e−5, and Figure 6b shows the order difference when it is applied to the 18th surface. In this case, by comparing with Figure 6a, which is the order difference before the correction, it can be confirmed that the longitudinal spherical aberration shifted in the positive direction. Additionally, as shown in Table 3 line (b), SAT and spot size decreased from 3.571648 to 2.343004 mm. Here, SAT is the sum of the third-order, fifth-order, and seventh-order spherical aberrations.
Based on Equations (9)–(12), when only the spherical aberration is corrected, the aspherical surface is used as the surface closest to the diaphragm, so that the principal ray height is minimized, thereby reducing the variation of the coma aberration, astigmatism, and distortion aberration, and effectively correcting the spherical aberration.
Figure 6c shows the order of magnitude of the spherical aberration of the synthesized optical system after secondary correction. In this case, A4 is calculated as −1.648908e−5, and SAA is increased to 0.64045 mm as shown in Table 3 line (c), but SAT is decreased to −0.00006 mm. In addition, the ordinal number difference in Figure 6d shows the difference in the number after the third correction of the synthesized optical system, where A4 is −2.1495534e−5. As shown in Table 3 line (d), while the SAA is 1.1 mm and SAT is not identical to the secondary correction, the spot size of the on-axis is the smallest. The third order spherical aberration of the synthesized optical system was corrected and the basic design data of the super focus and large diameter optical system to be designed in this study were obtained. Specifications of the optical system as shown in Figure 7 are shown in Table 4. Figure 7 shows the data for radiation and optical path of the basic design.
3.2. Design Optimization and Evaluation
Optimization must be performed to achieve the desirable resolution from the primary design approximation that was previously obtained [19,20]. The optical design software (CodeV, Synopsys, Mountain View, CA, USA), is used for the optimization. During the optimization, infinite object distance, object magnification of 1/40× (approximately 1.1 m from the image sensor) for the principal shooting distance, and the greatest distance to the object are decided, at a level comparable to those of the competitors’ products. Then, the optimization was implemented to realize the performance for the object at a distance of approximately 0.25 m from the image sensor. Moreover, the design goals of F#/1.4 large aperture, the very wide angle of 42° HFOV (Half Field of View), and inner focusing of 1-piece lens were maintained. For mechanical constraints, the distance from the last surface of the system to the image surface was controlled to be 16 mm or longer based on its availability in CSC. In addition, the diameter of the last lens in the system was limited to avoid vignetting of the principal ray due to the camera mount. For the relative illumination, CRA (Chief Ray Angle) was also set to 21° or less to obtain 20% or higher at the corner of the screen.
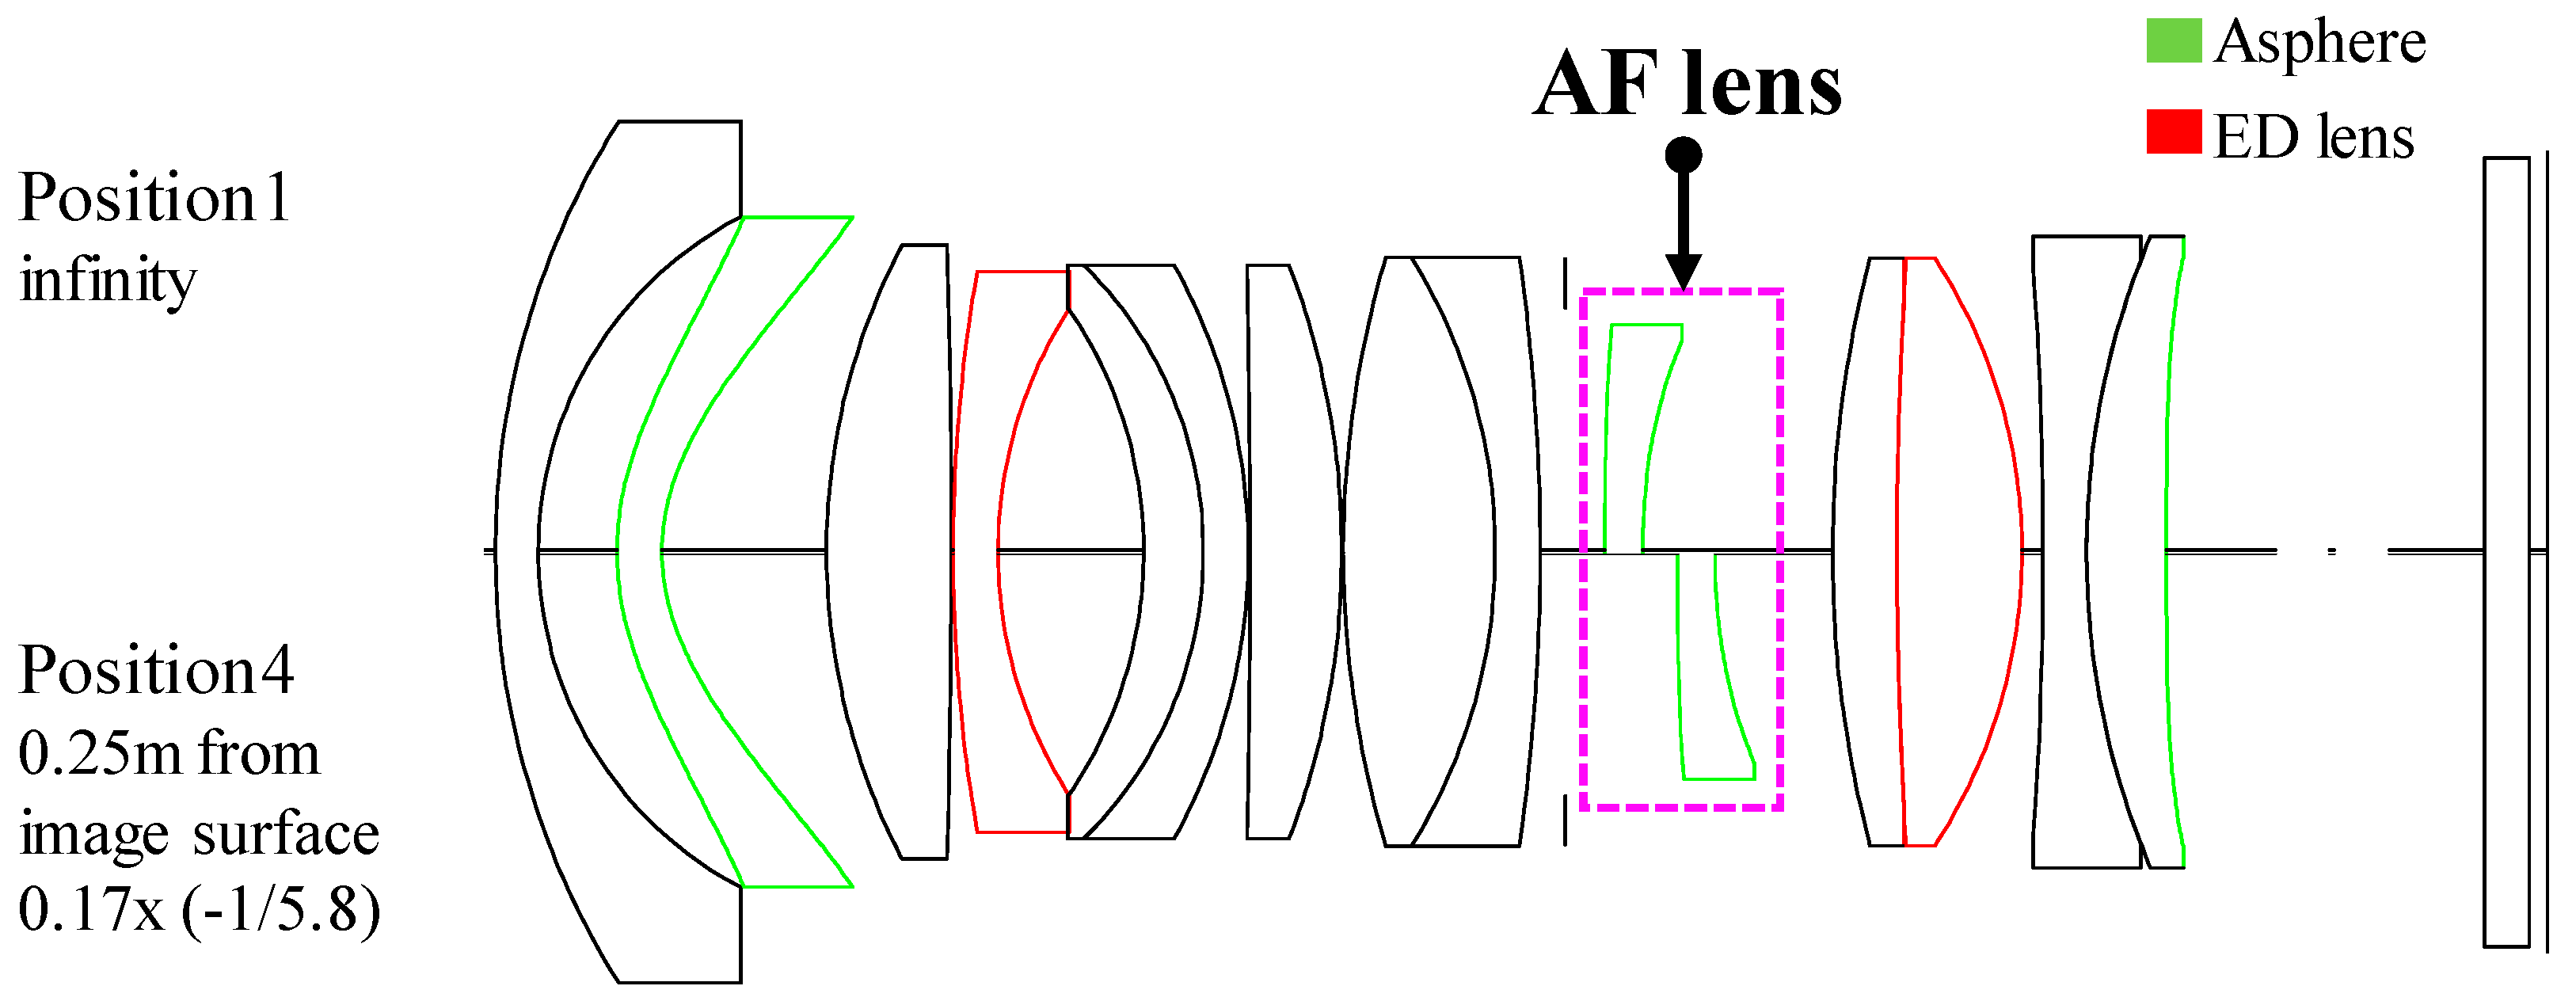
The diagram of the final design after the optimization is shown in Figure 8. The dotted line for the AF lens above indicates the travel range of the AF lens as the object travels from infinity to the nearest focusing distance. Information on curvature, thickness, material, etc. for this optical system is mentioned in Korean Patent 10-2018-0123849.
4. Results and Discussion
4.1. Lens Performance Verification
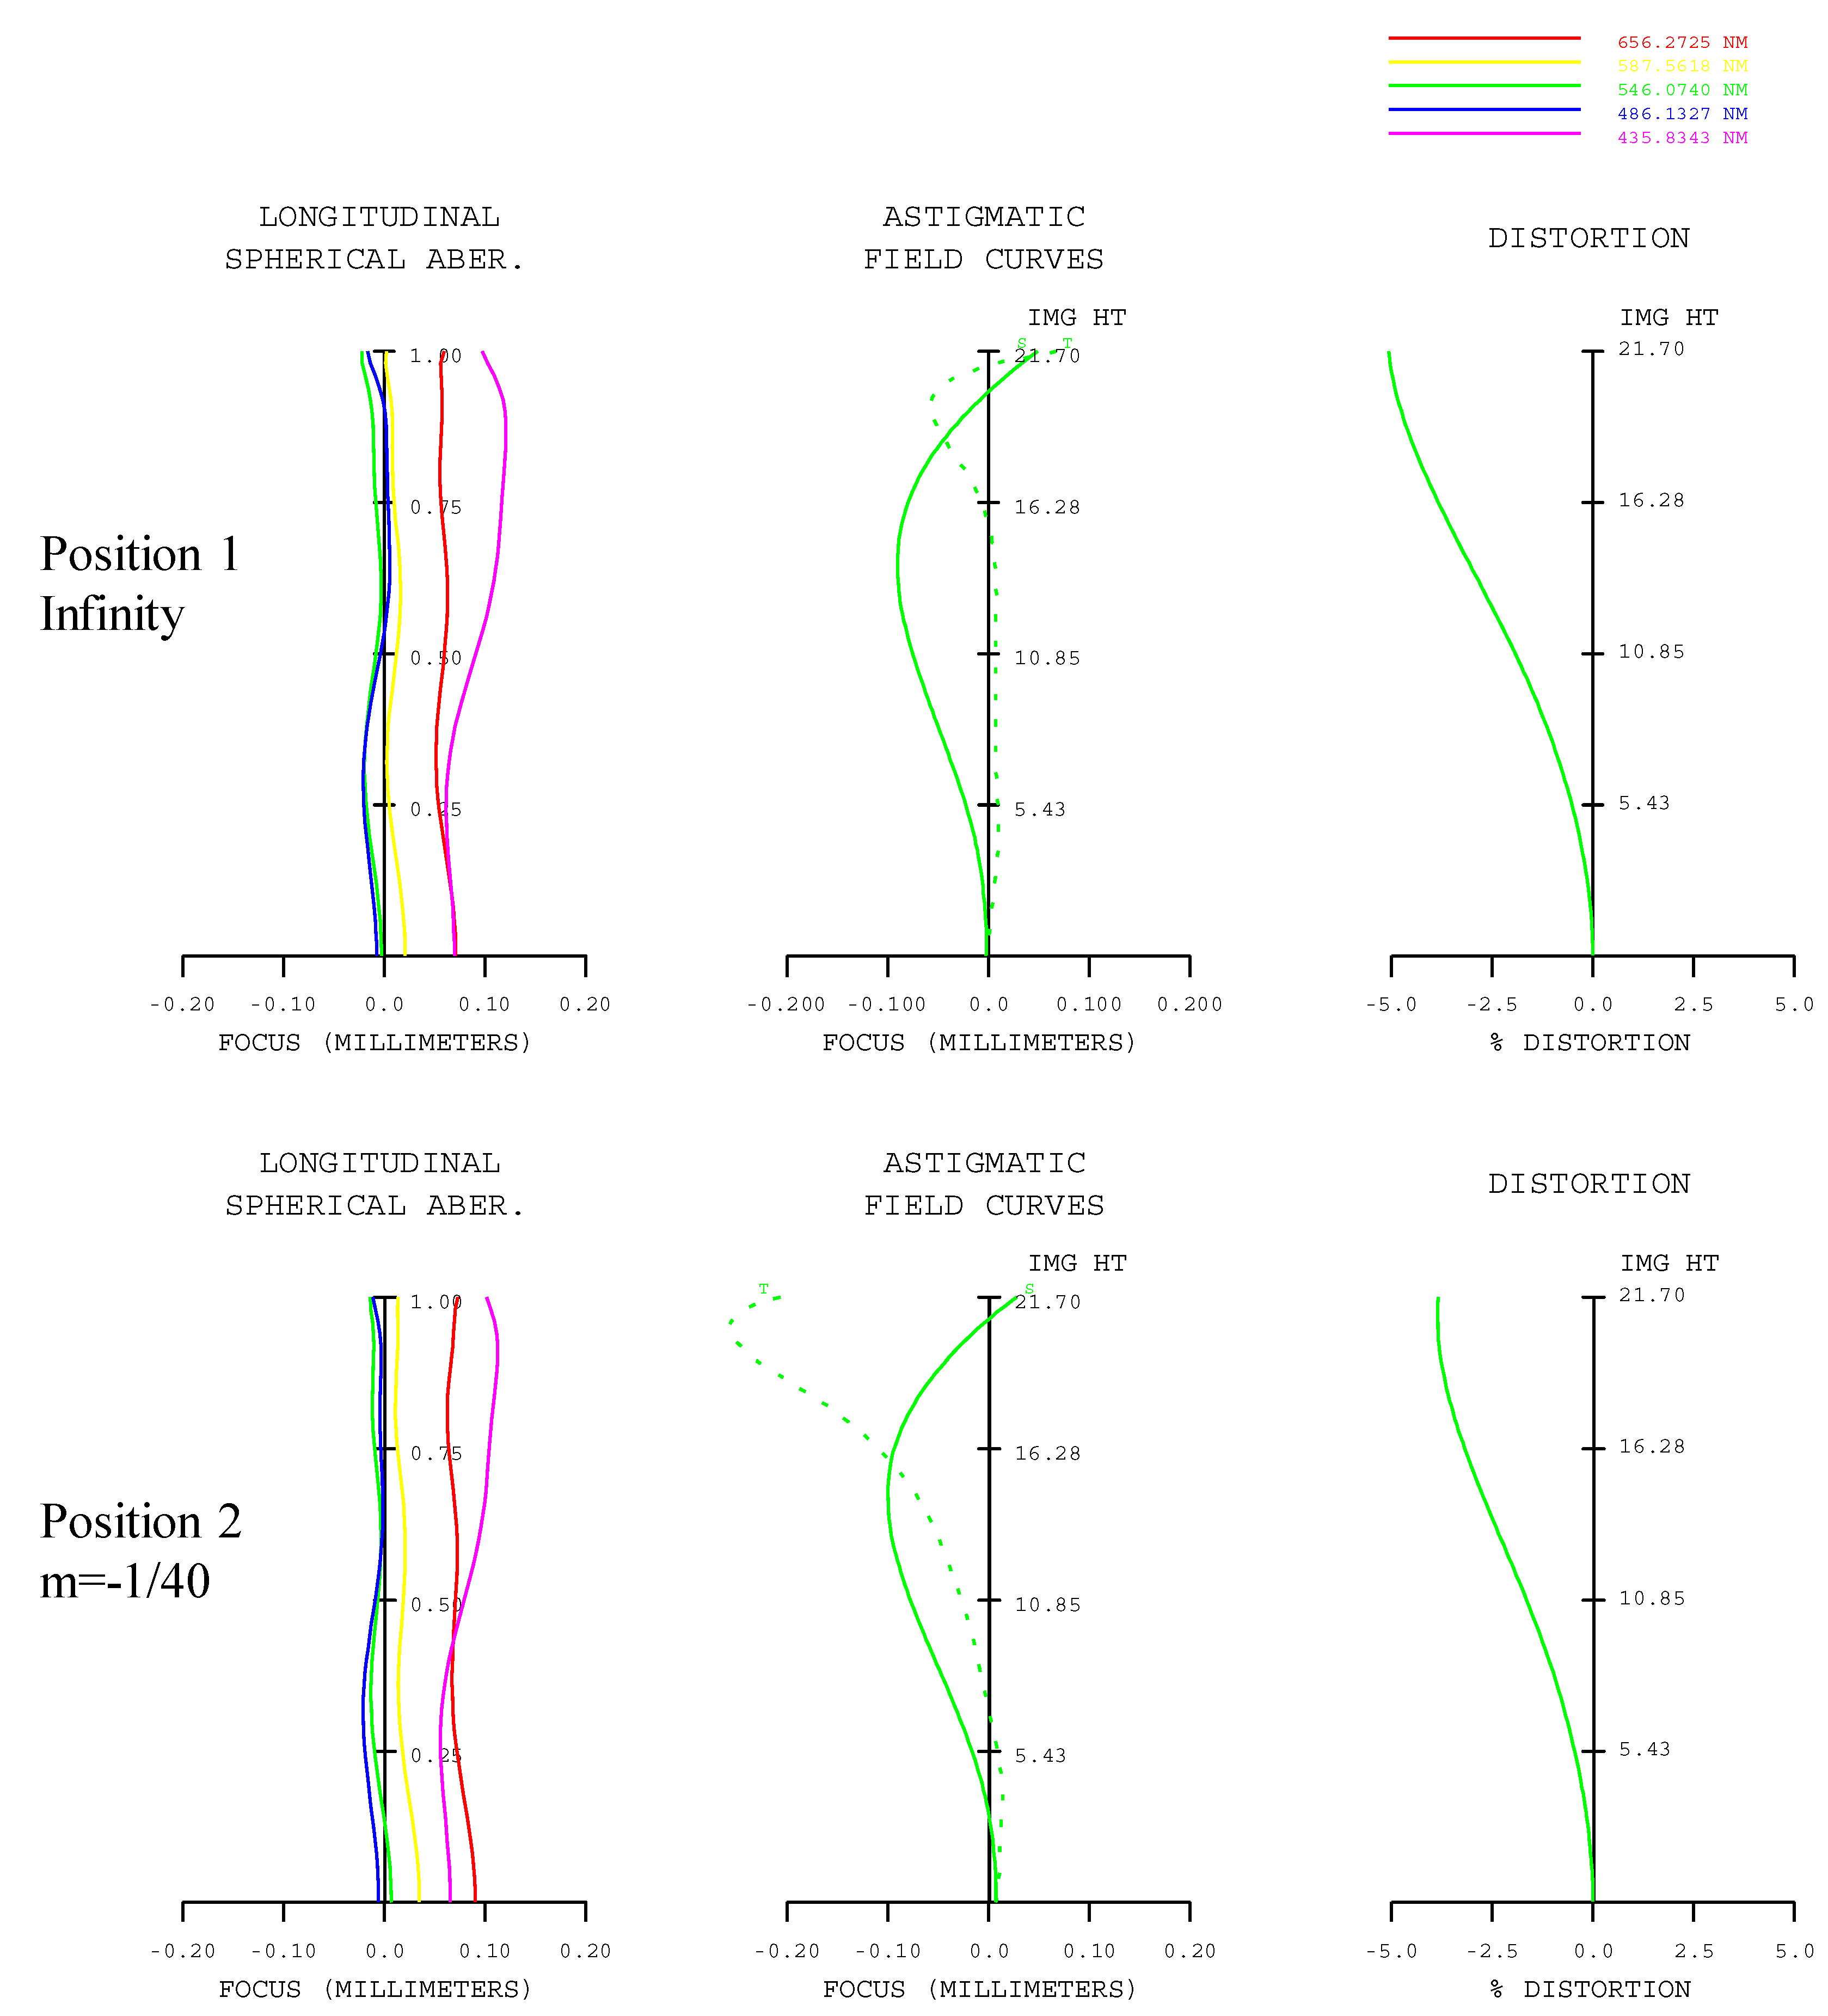
Three lenses, one 10th AF lens, one second lens, and one 14th lens, were used as the aspheric surfaces in the design. The total comprised of 14 lenses, including two extra low dispersion (ED) lenses. The aspherical surface of the AF lens was used for spherical aberration correction in the basic design process. Additionally, to correct residual aberrations such as coma aberration, astigmatism, and distortion aberration, the object side and the upper lens side was used. Figure 9 is a collection of graphs illustrating the species difference between the infinity and the principal shooting distance. The pitch angle difference is generally stable at infinity and the principal shooting distance, and the distortion aberration is −5%, which includes some barrel distortion but still meets the design goal.
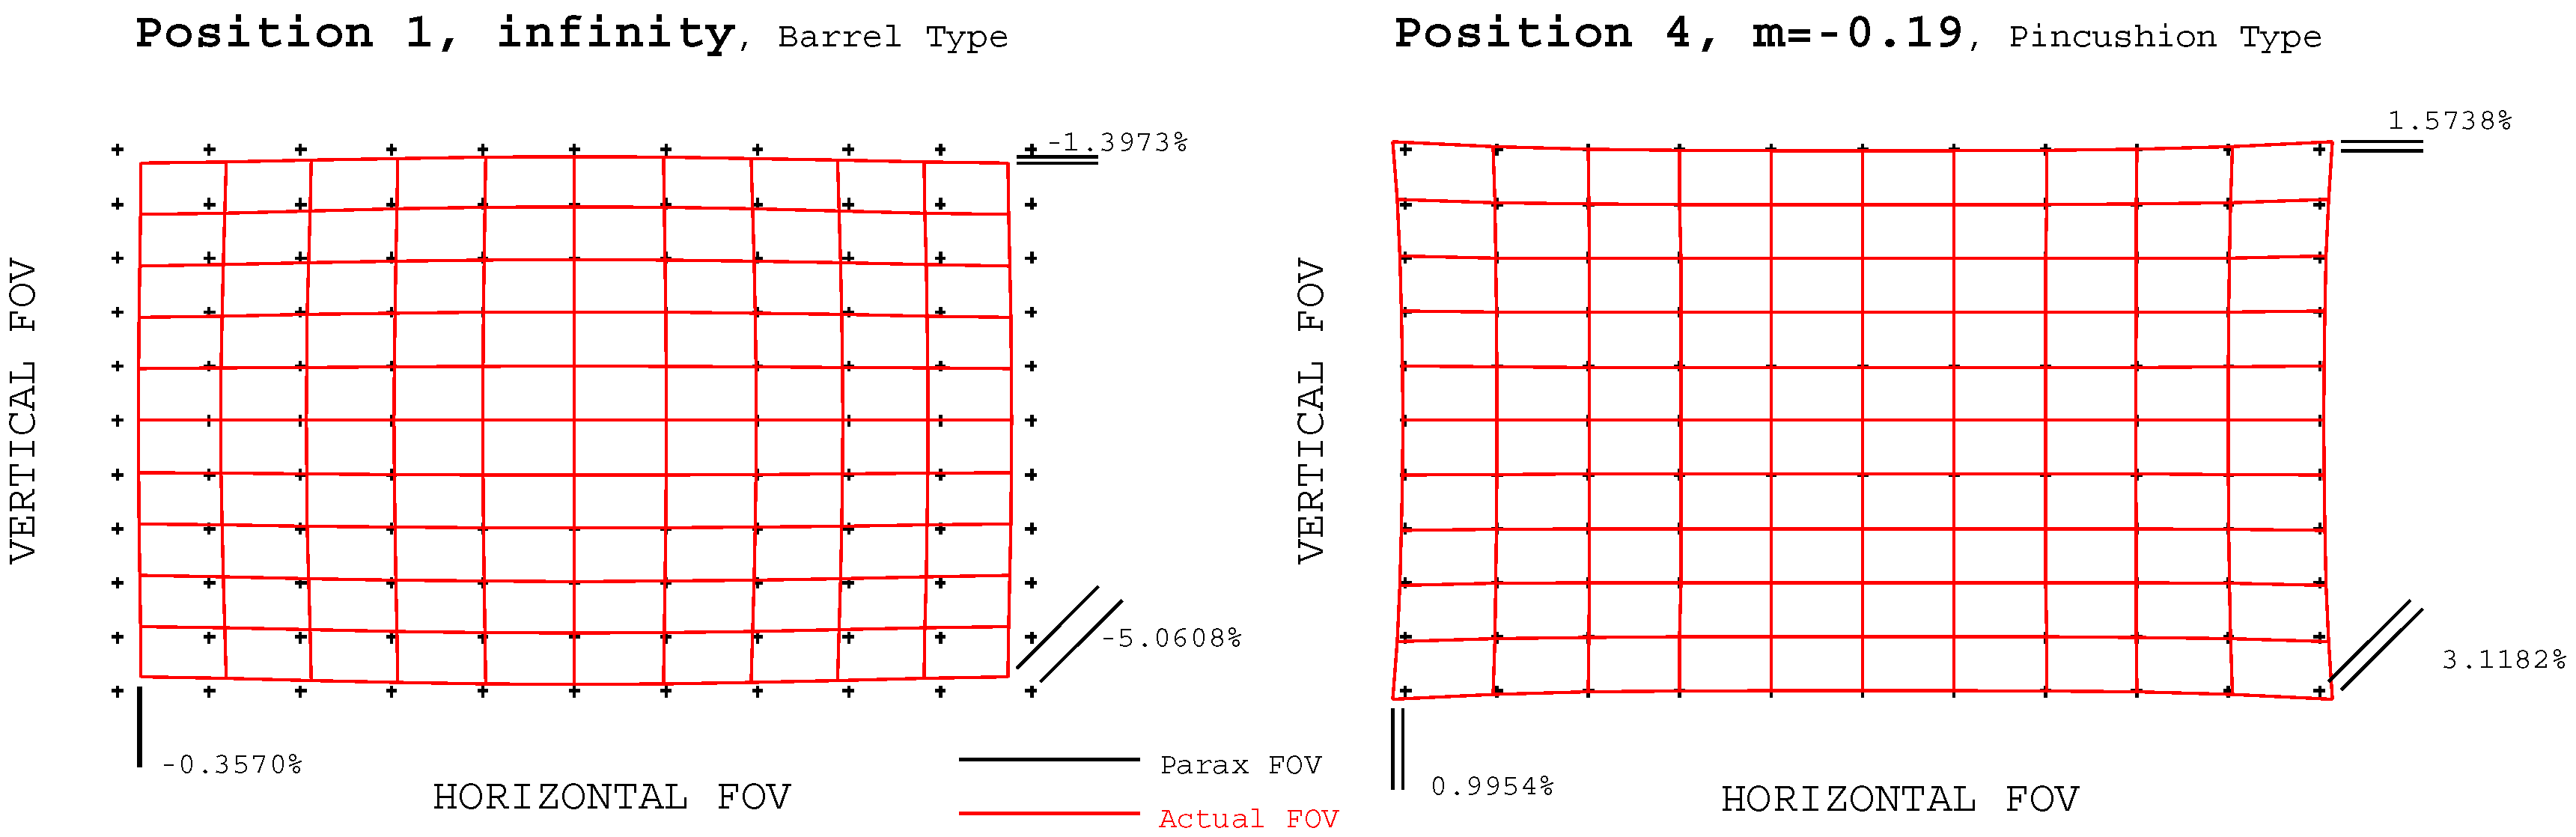
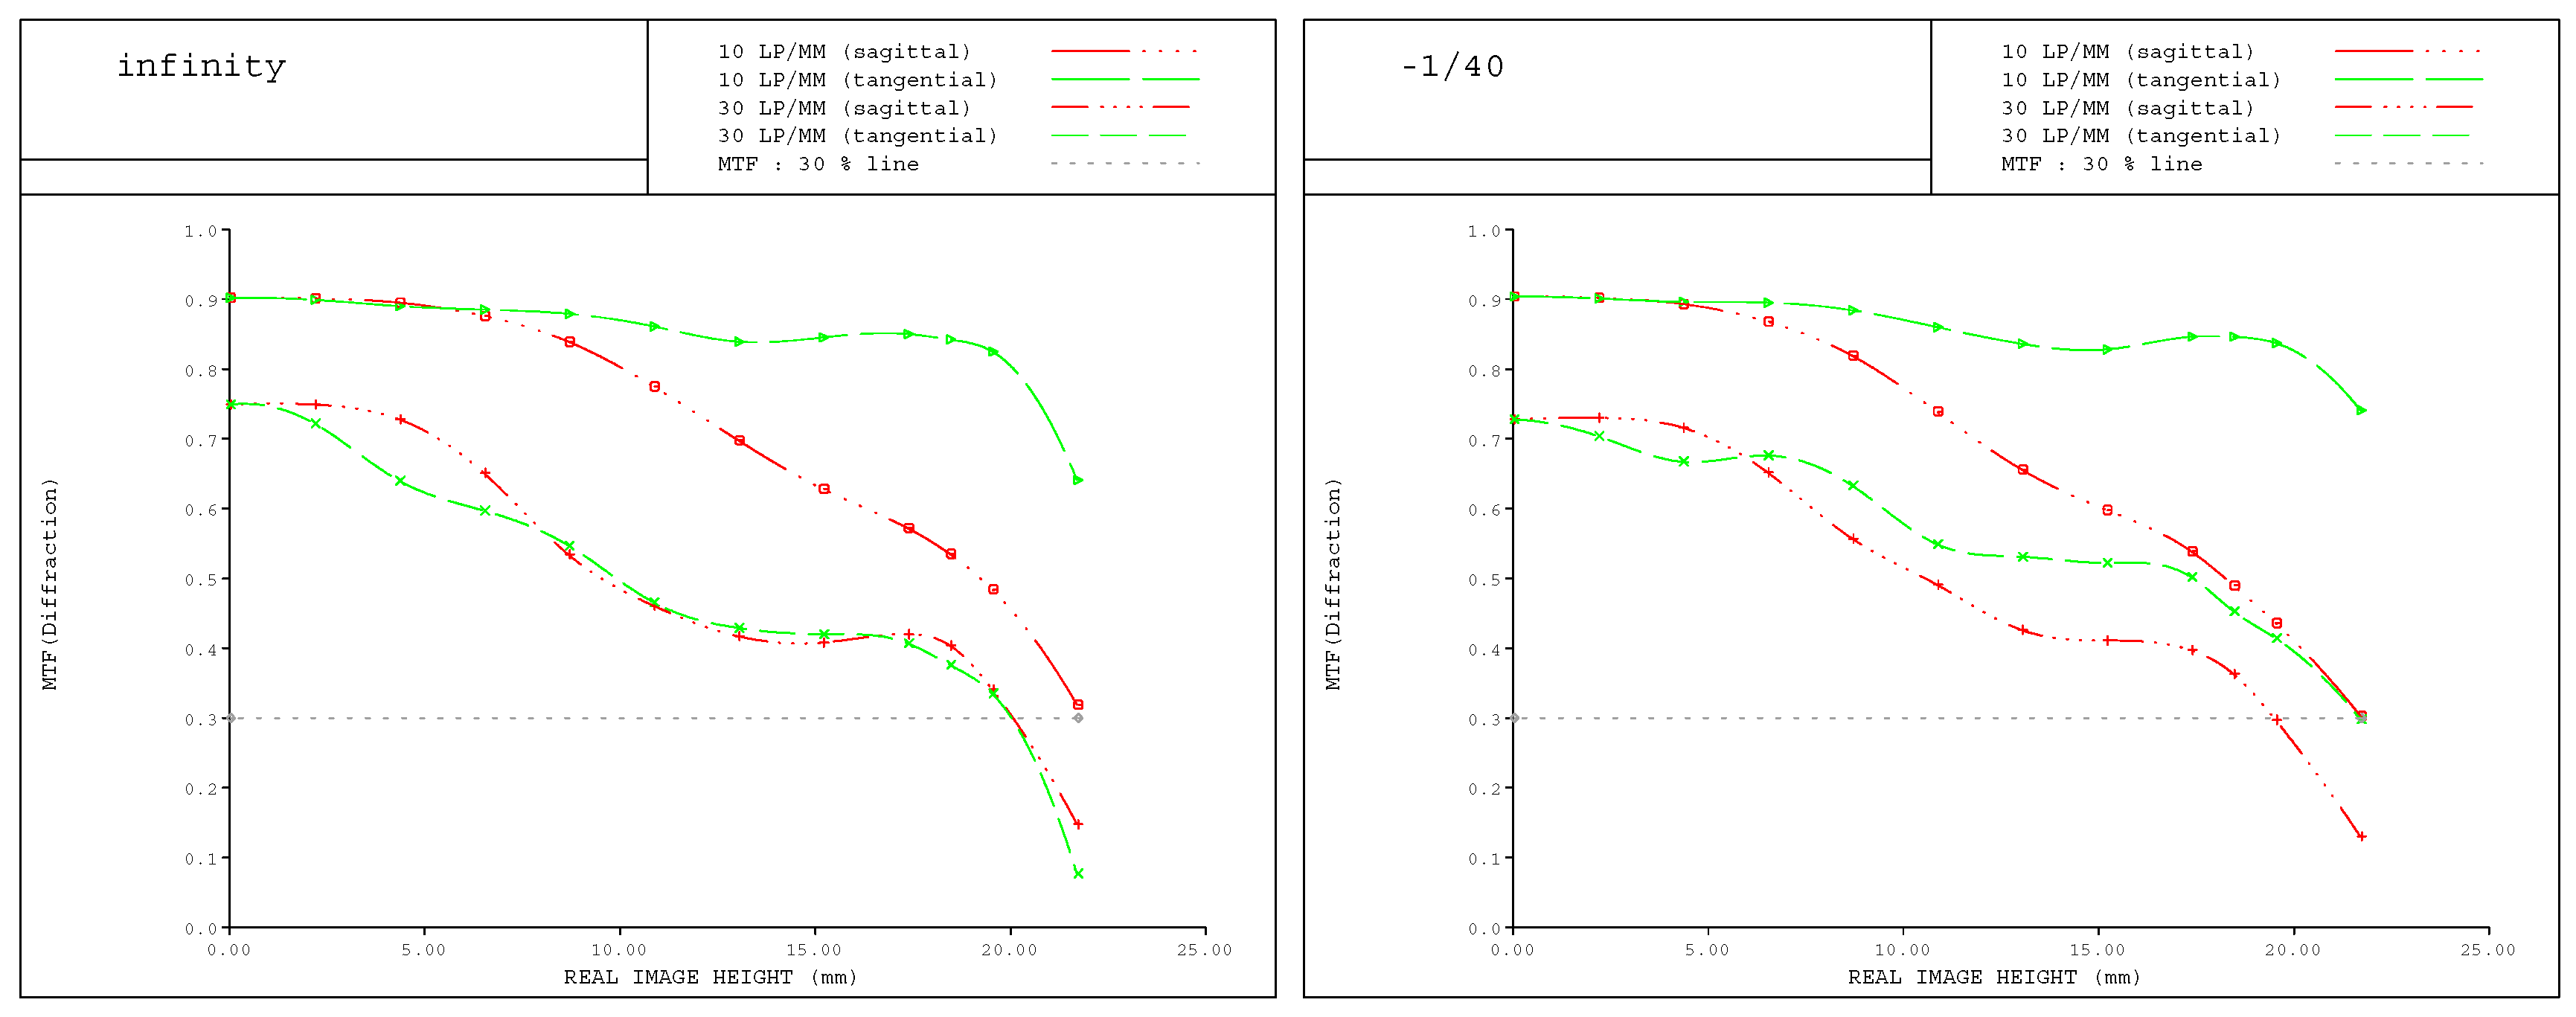
Figure 10 and Figure 11 illustrate the TV distortion and MTF graph of the final design. In infinity, the TV distortion has a Barrel type distortion of −1.40% and +1.57% at the furthest object distance, which has a pincushion type of distortion. The MTF satisfies 70% or more at 30 lp/mm with respect to the center of the screen, and more than 30% at the periphery up to the 0.85-field.
As shown in Figure 11, as the image height increases, the MTF gradually decreases. This is because aberrations such as coma and astigmatism increase as the image height increases, as shown in the astigmatic field curve in Figure 9. Most camera manufacturers disclose MTFs with 10lp/mm and 30 lp/mm spatial frequencies for camera optics [21,22]. Therefore, this paper also identified MTF based on the same criteria.
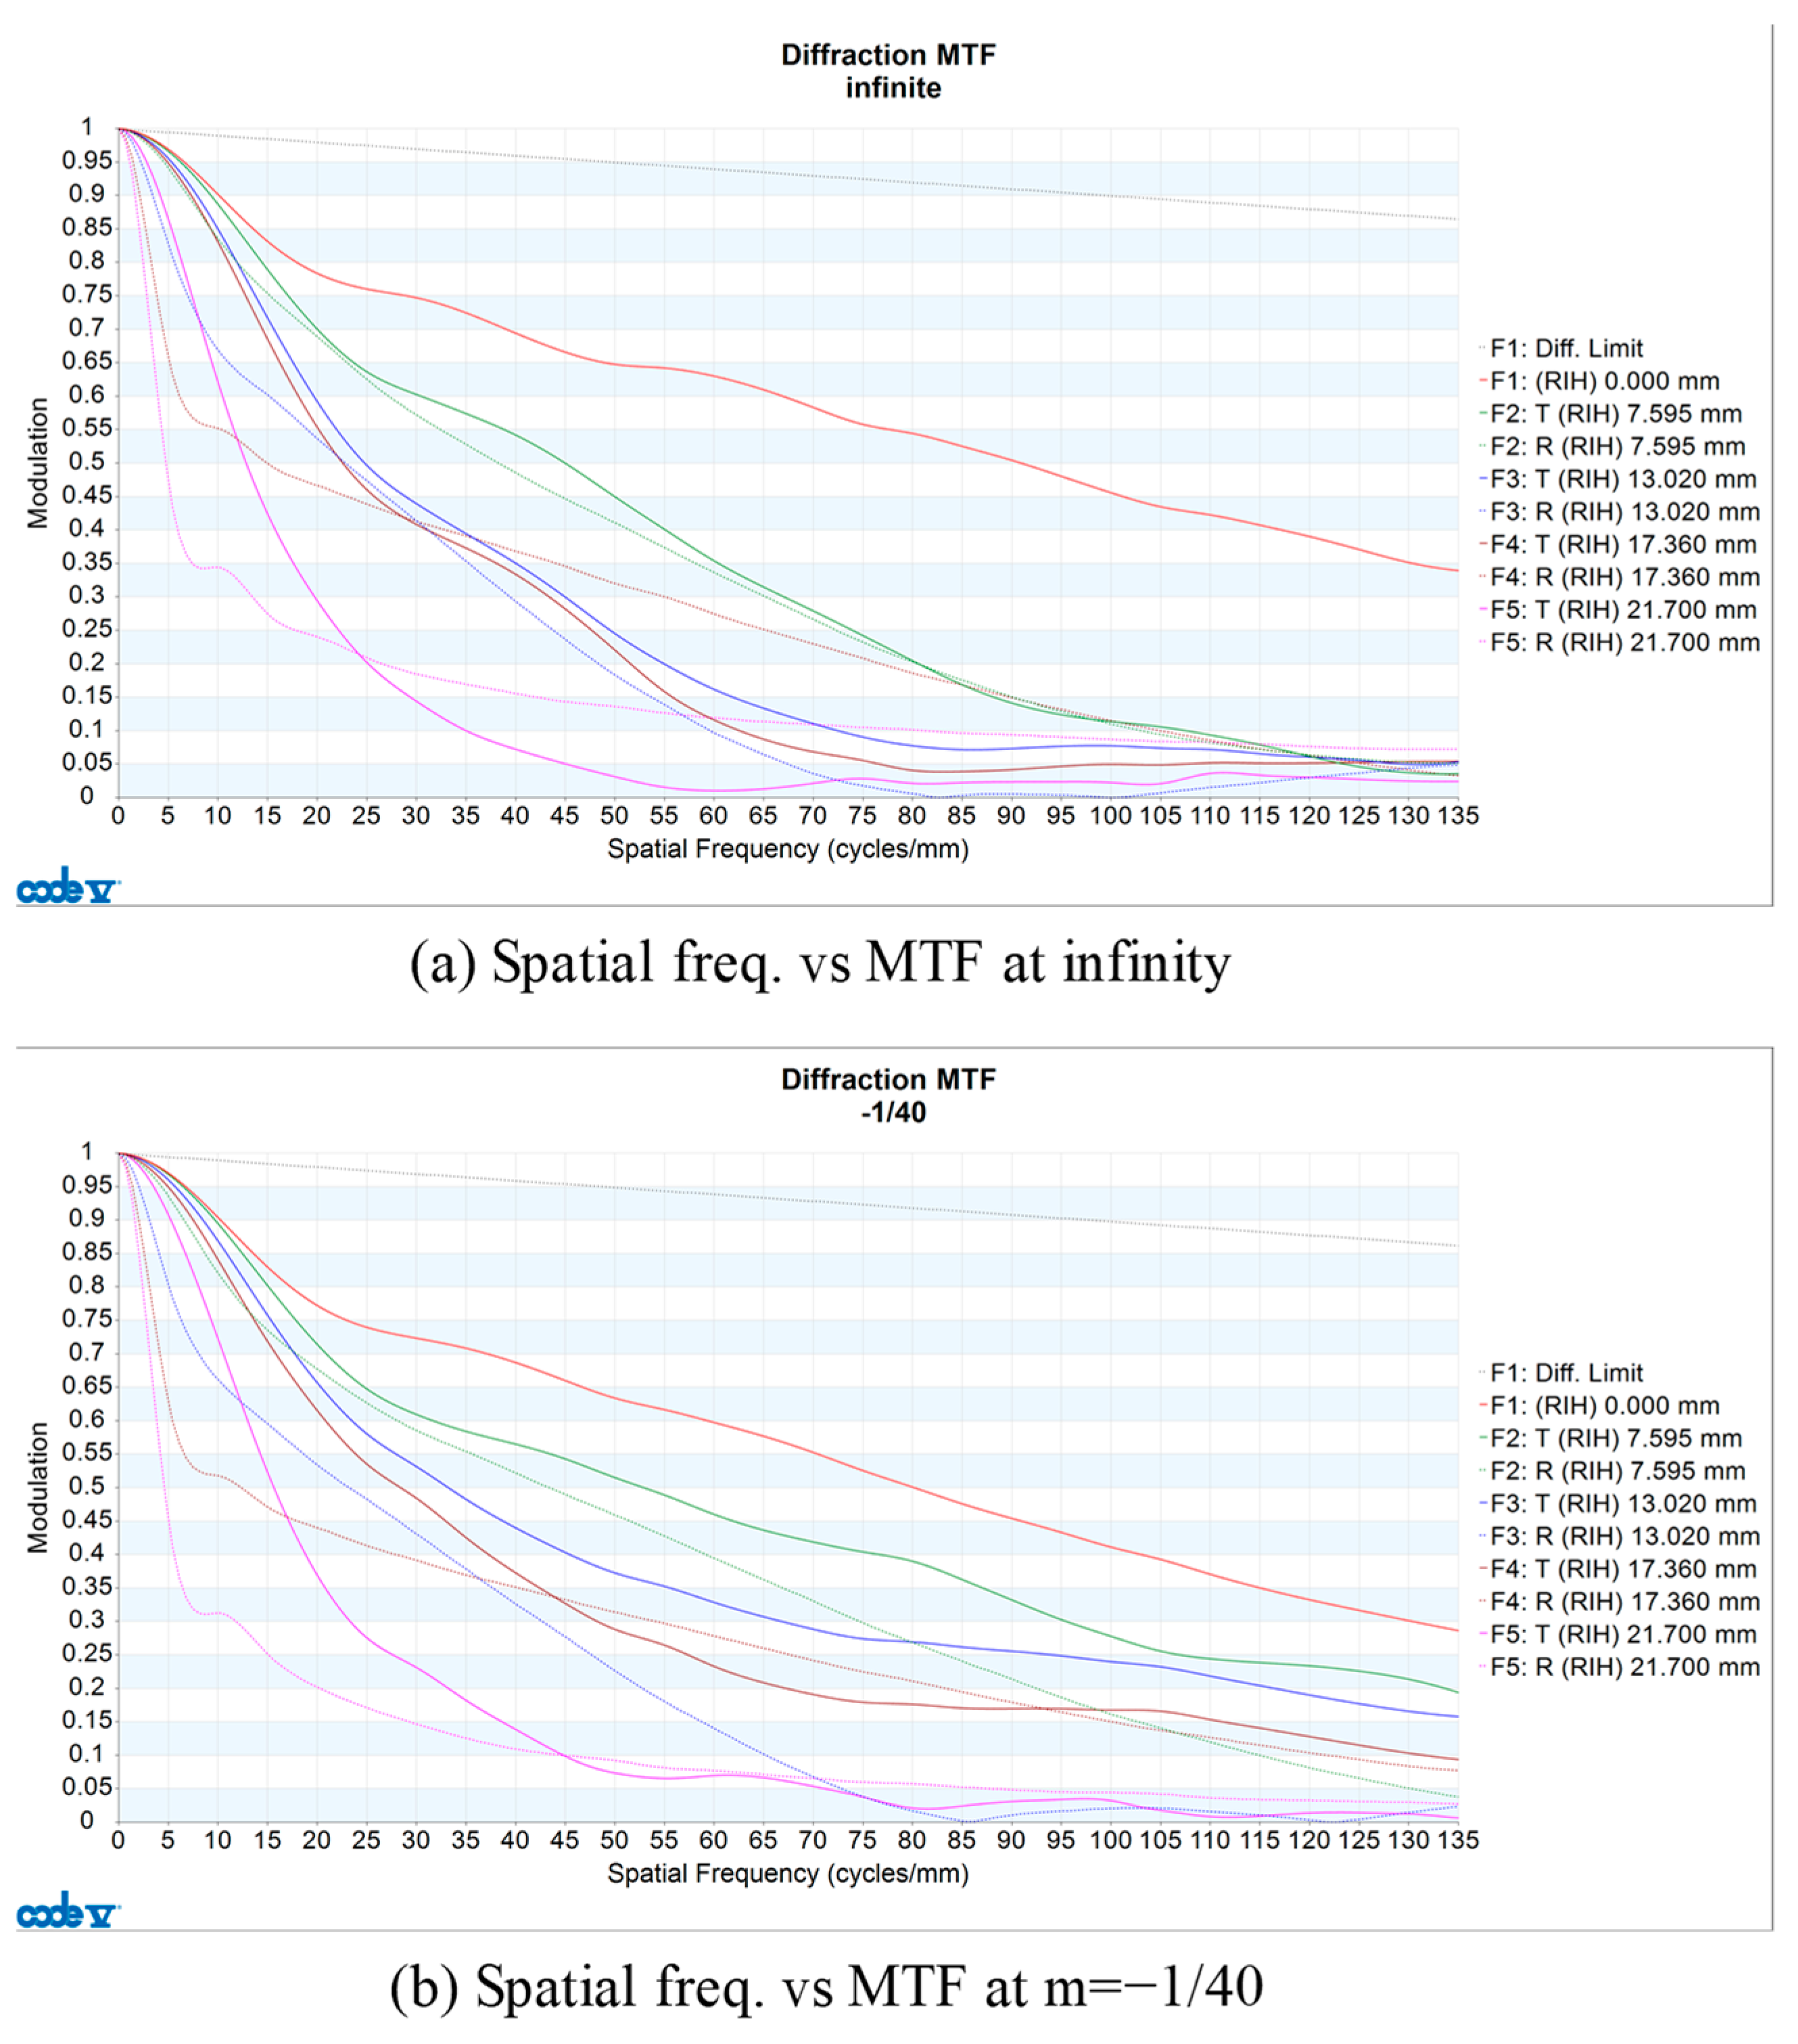
Figure 12 shows the MTF as the spatial frequency changes. Figure 12a shows the object at infinity and Figure 12b shows the magnification of −1/40 times. The maximum spatial frequency in each graph is 135 lp/mm, which is the Nyquist frequency of the digital sensor with the largest pixel of the currently available camera body.
4.2. Tolerance Analysis
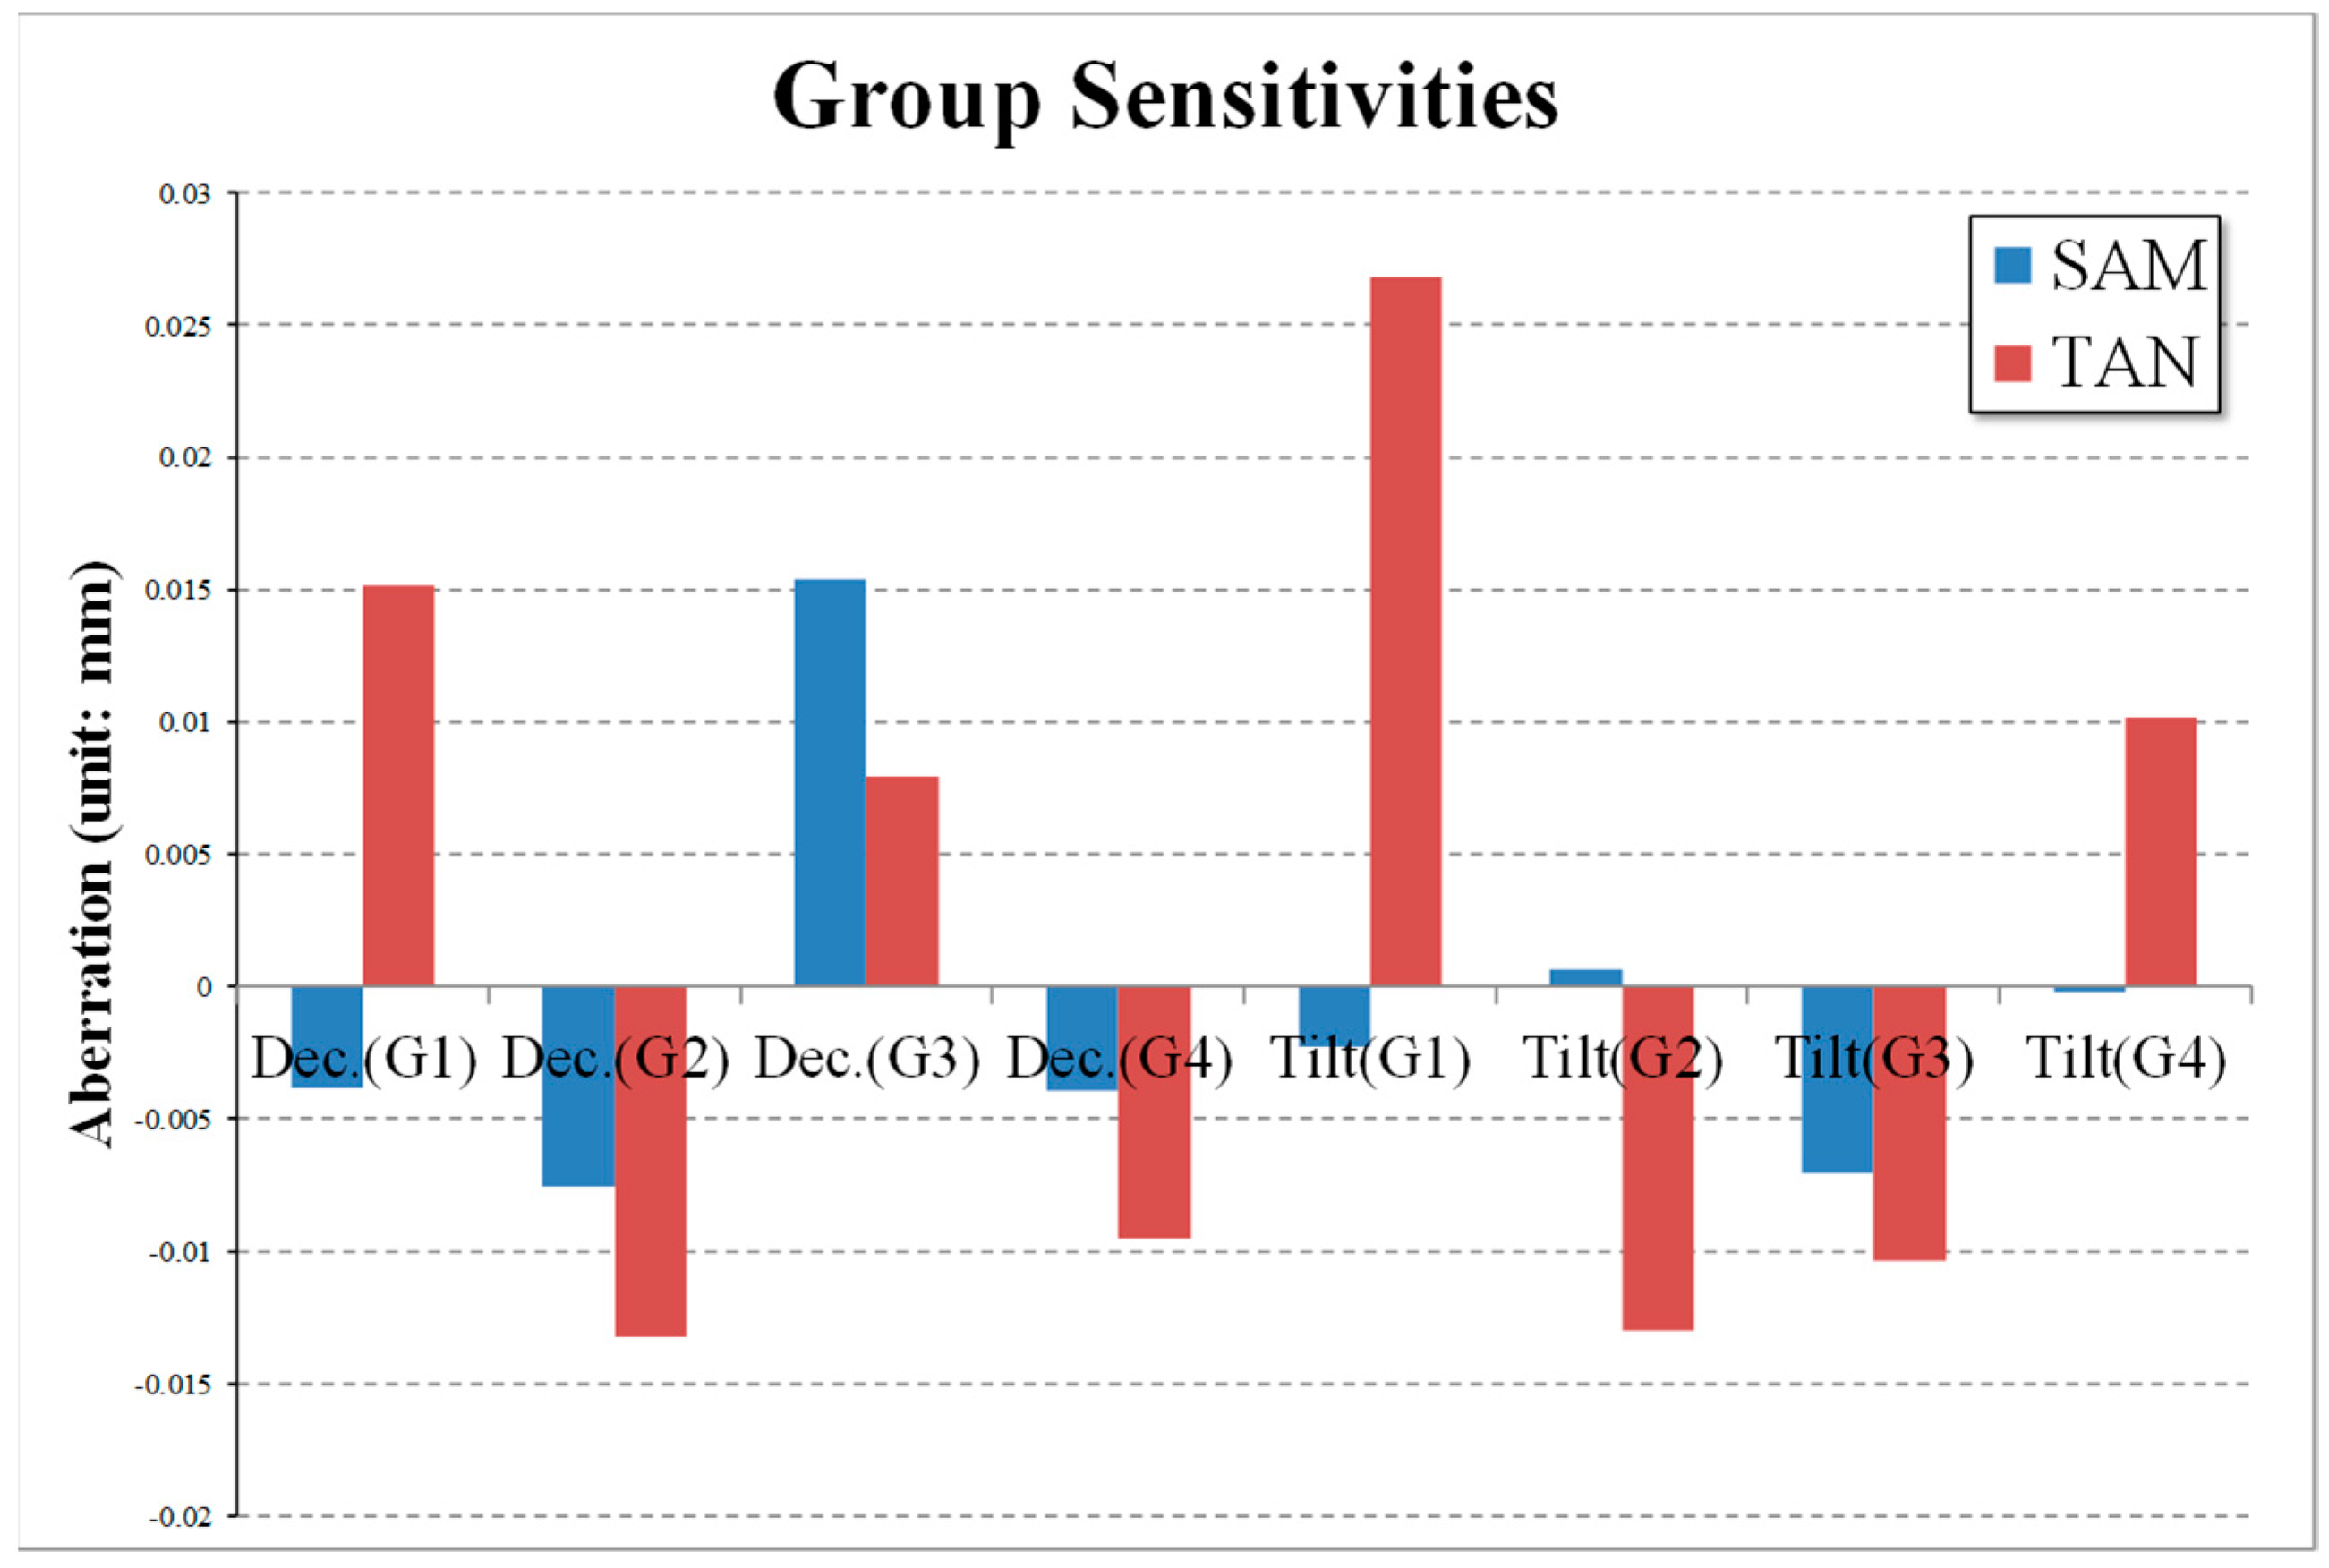
A camera optical system is a relatively large product. In optical systems such as the one devised in this study, many lenses are used, and a driving device for moving the lenses is used too. Therefore, it is expensive to manufacture such an optical system. Consequently, additional costs are incurred from disposal, if a failure occurs. However, defect rates will exist when the lens is assembled at the mass production stage and tested for resolution, such as MTF. The fundamental cause of such defects is that the lenses are decentered or tilted at the assembly stage. Nevertheless, resolution performance can be improved by decentering or tilting a specific lens group. Figure 13 is a histogram showing the sensitivities of spherical aberration and field curvature based on decentering and tilting of each lens group constituting the designed optical system.
In Figure 13, SAM is spherical aberration, SAG is the sagittal component of field curvature, and TAN is the tangential component of field curvature. As illustrated in Figure 13, the tangential component of the field curvature changes considerably with respect to tilt, and the spherical aberration changes with respect to the decentering of the third group. Therefore, it is possible to correct the spherical aberration and field curvature caused by the assembly error of the designed optical system. It is also evident that the sagittal component of the field curvature does not change significantly due to the assembly error of the lens group. This can be explained by the third order aberration theory, because the sagittal component is generally about one third smaller than the tangential component [23].
Manufacturing errors for the optical system can be classified as being rotationally symmetrical and asymmetrical with respect to the optical axis. Here, rotationally symmetrical errors include lens shape, thickness, and material refractive index, and rotational asymmetry errors include centering, seat tilt, clearance, group decenter, and group tilt [24]. These errors allow us to calculate spherical aberrations and field curvatures that affect resolution degradation. In this case, the aberration may be corrected by adjusting the decenter and tilt of the specific lens group in order to counteract the aberrations generated during the assembly of the optical system.
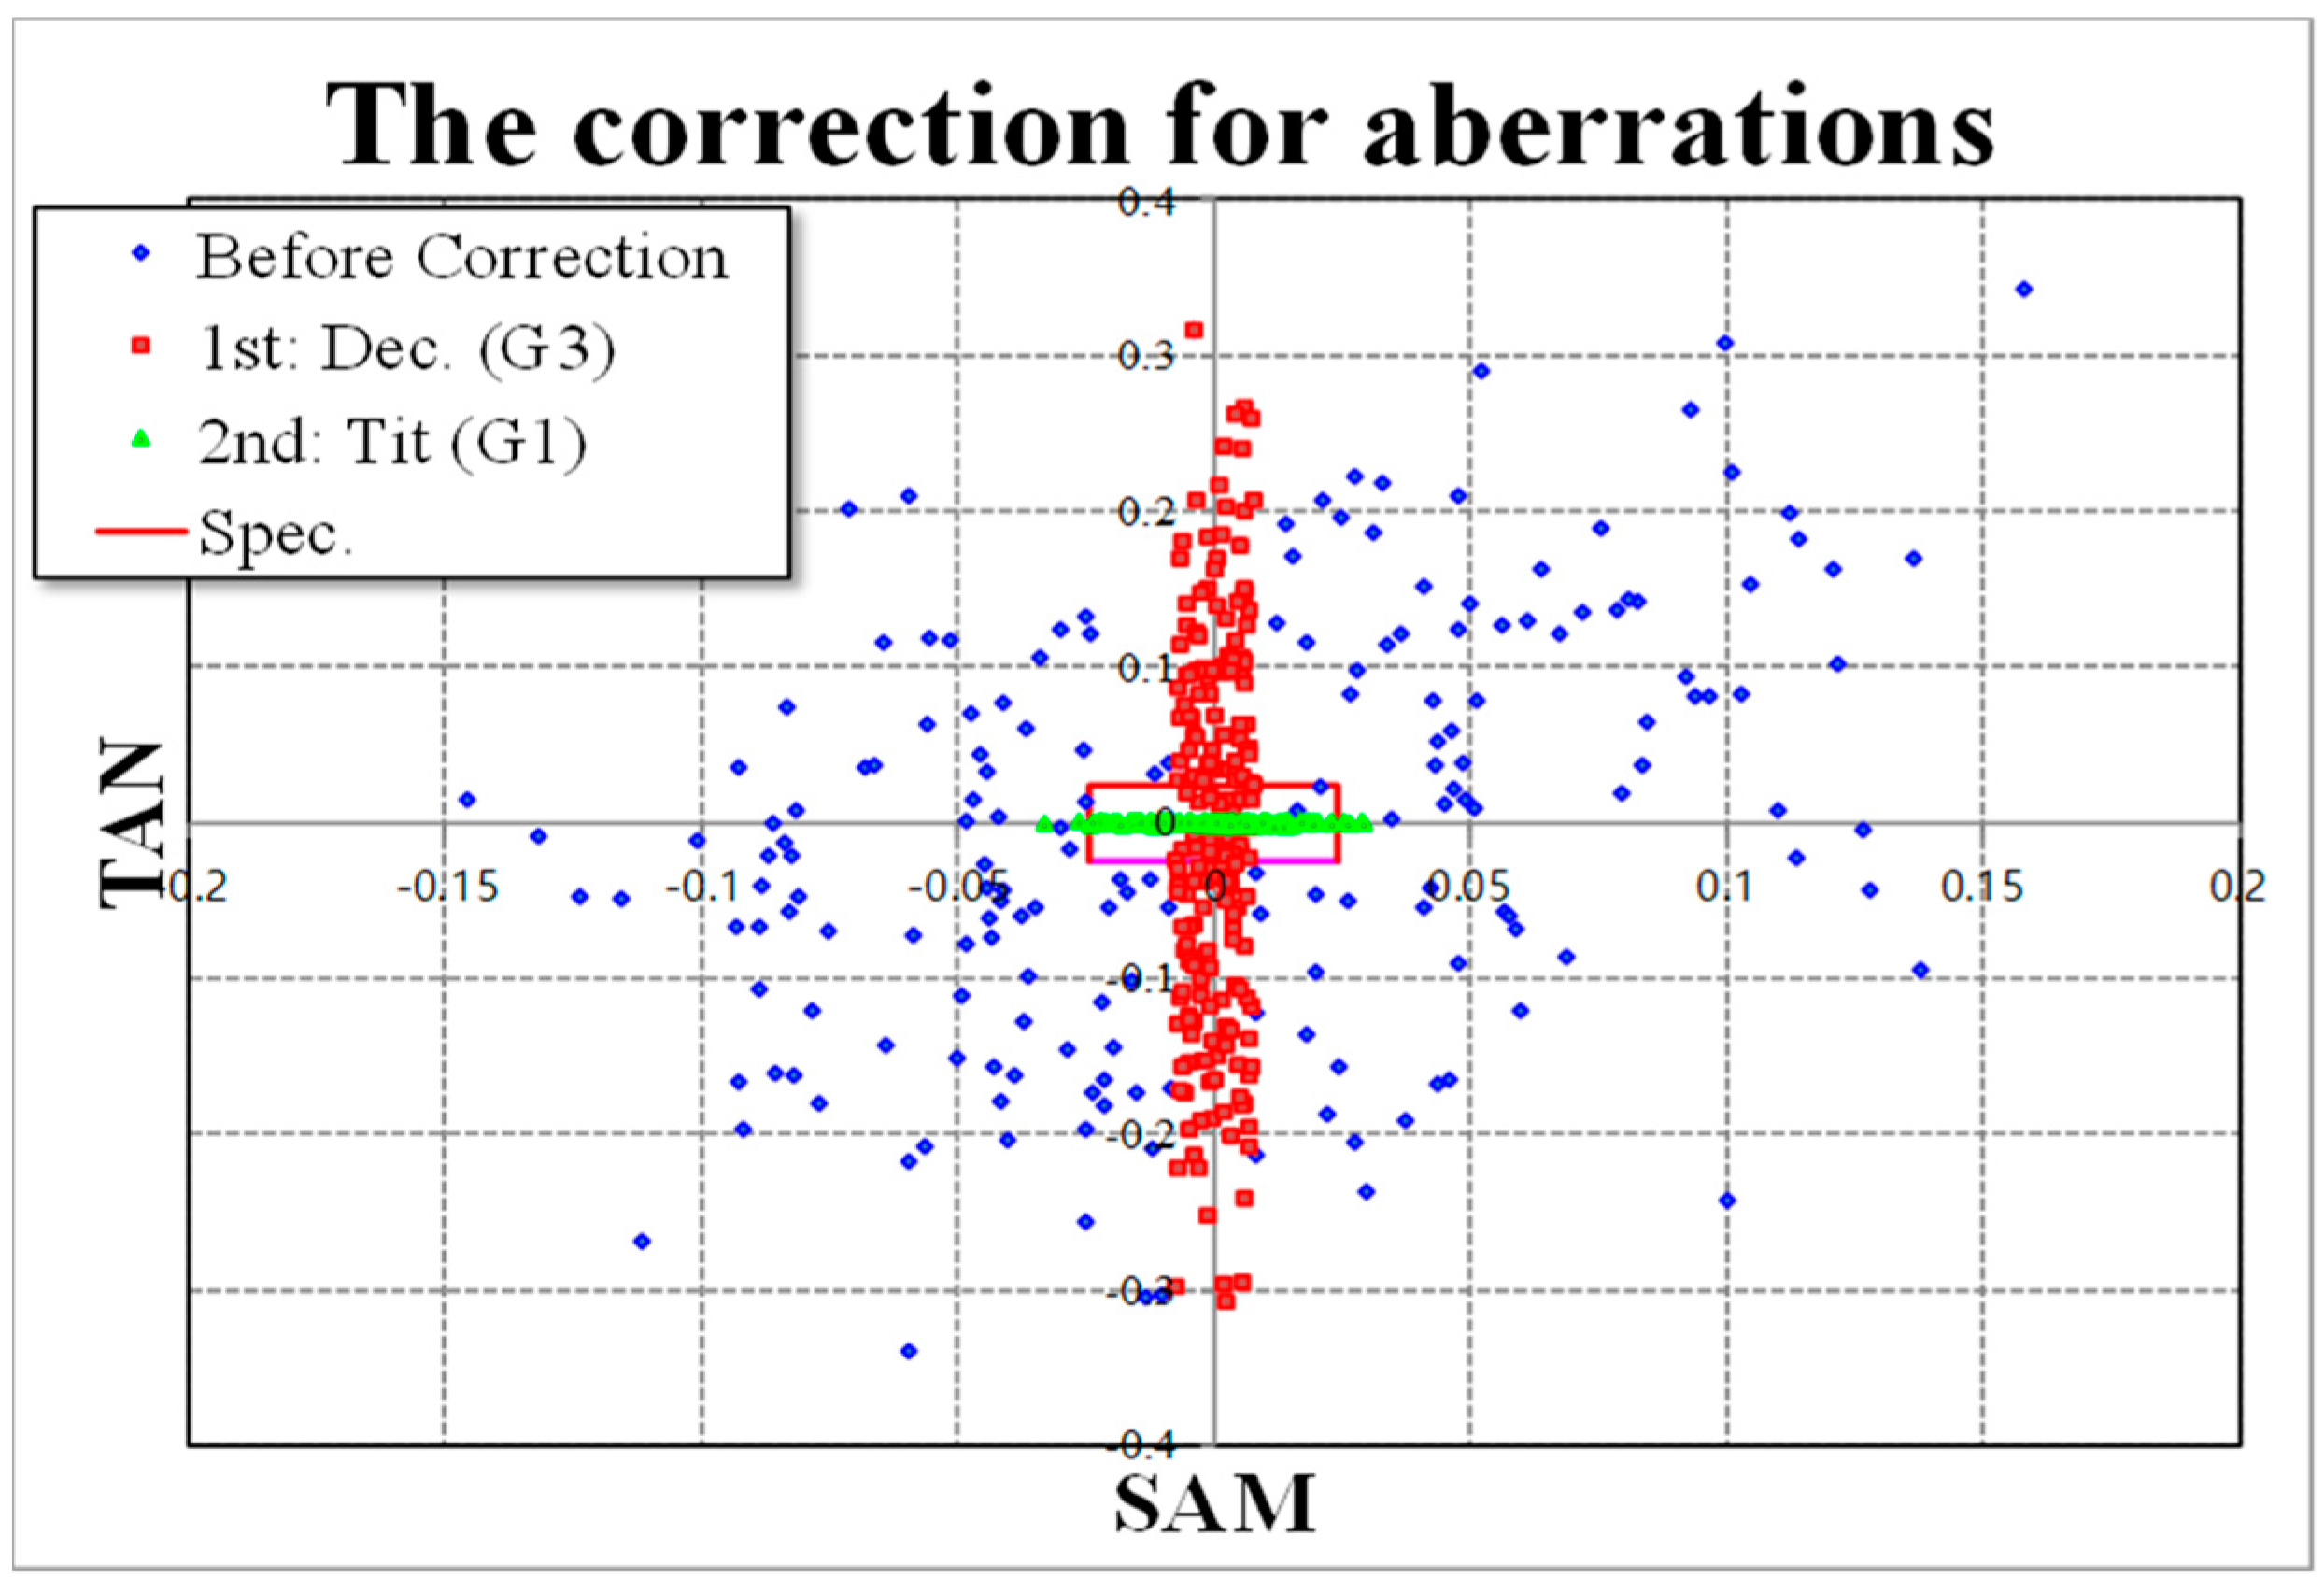
Figure 14 illustrates the results of spherical aberration and field curvature distribution of the whole optical system by randomly generating the above-mentioned errors of assembly and parts, and also illustrates the change of aberration distribution based on the decentering or tilting of a specific lens group. The blue dot represents the aberration calculated by the random number generated error. The red dot denotes that the spherical aberration is corrected by decentering of the third group. The green dot indicates that the field curvature is corrected by tilting the first group. The purple box here denotes a performance limit, and a resolution box within this range indicates good resolution performance. The rest of the spherical aberrations remain after group 1 adjustment, which in turn may lead to defects. Therefore, this should be considered in the optical design stage so that there is no spherical aberration according to the tilt of group 1.
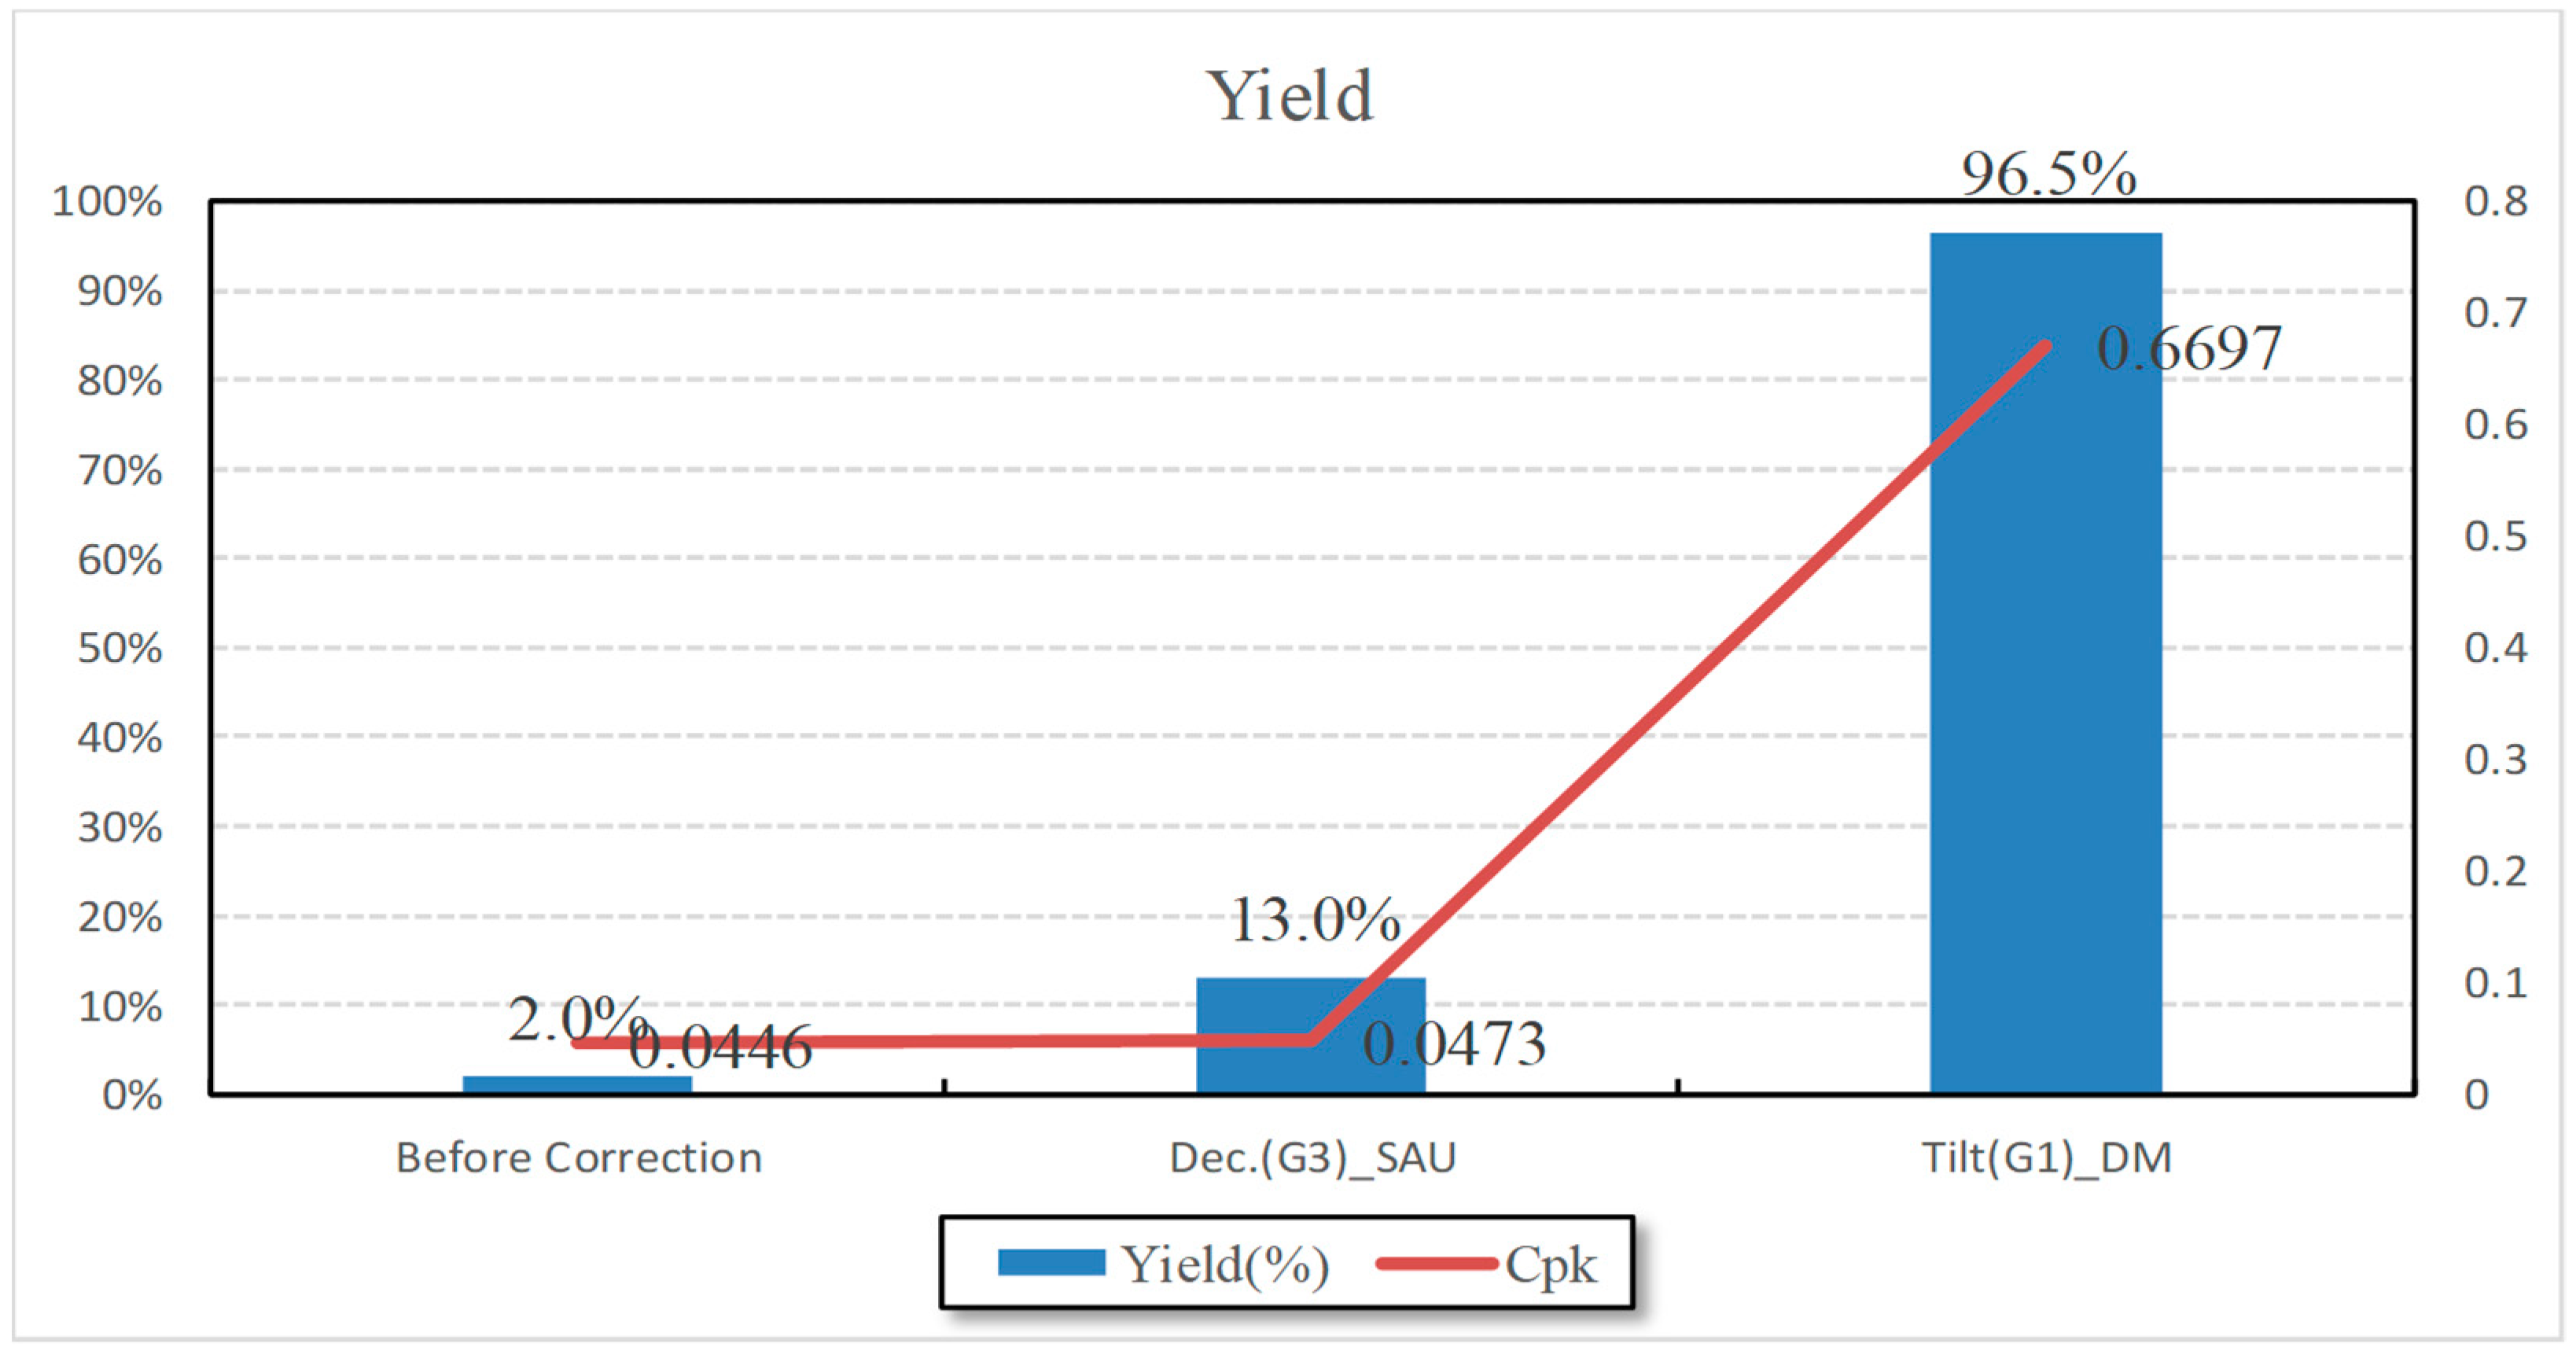
To estimate the actual failure rate from the results shown in Figure 12, we need to analyze the process capability index (Cpk). Cpk can be calculated by Equation (13) [25].
where USL represents the upper specification limit, LSL represents the lower specification limit, σ represents the standard deviation of the distribution, and K represents kurtosis.
Here, USL and LSL are values determined from the inspection standard of the optical system. Most interchangeable lens companies are based on the spatial frequency 30 lp/mm of the optical system, and the corresponding pixel size of the image sensor is about 16.7 μm. If the depth of focus is determined by considering the F/# of the optical system, then this value determines USL and LSL. The Cpk of each distribution for Equation (13) is shown in Figure 15.
5. Conclusions
Contrast detection type AF is required to achieve high accuracy movement when focusing drive source. As the stepping motor used to satisfy this requirement does not have large torque, it is difficult to realize fast AF when the focusing lens is heavy. The contrast AF method is basically used in CSC so that AF group weight would be considered in optical design stage to realize fast AF speed. Hence, basic design was carried out for the optical system that moves only one sheet for focusing. At initial design, two optical systems that partially satisfy the design specifications were synthesized. A typical floating type optical system with a large aperture and a very wide angle and an optical system with a large aperture and focusing with a single lens were appropriately synthesized. After combining the two optical systems, optical system curvature and lens space were adjusted using Gaussian bracket method to match the EFL, BFL, FFL, and so on to design target values. The final design obtained through optimization resulted in the optical system with satisfactory MTF performance of more than 70% at the center of the screen and at least 30% below 0.85-field for a spatial frequency of 30 lp/mm. Through this research, the world’s first CSC adopting a full-frame sensor can reduce the weight of one focusing lens and design a large-aperture ultra-wide-angle optical system that focuses internally. The same can be applied to a wider variety of wide angle and large aperture optical systems with a similar method. Additionally, products with high MTF performance are expected to meet the demand for the interchangeable lens family for a full-frame CSC that can be applied to a high-performance camera.
Author Contributions
Conceptualization, J.R.; Methodology, H.C. and J.R.; Software, J.R.; Data curation, J.R.; Writing—Original Draft Preparation, H.C. and J.R. All authors have read and agreed to the published version of the manuscript.
Funding
This research was supported by Basic Science Research Program through the National Research Foundation of Korea (NRF) funded by the Ministry of Education (No. NRF-2017R1D1A3B03029119). This work (Grants No. S2563336) was supported by Business for Cooperative R&D between Industry, Academy, and Research Institute funded Korea Small and Medium Business Administration in 2019.
Conflicts of Interest
The authors declare no conflict of interest.
References
- Malacara, Z.; Servin, M. Interferogram Analysis for Optical Testing; CRC Press: Boca Raton, FL, USA, 2016; Volume 84. [Google Scholar]
- Glossary of Photography Terms. Available online: https://www.Apotelyt.Com/photo-terms/imaging-glossary (accessed on 21 April 2019).
- Eismann, K.; Duggan, S.; Grey, T. Real World Digital Photography; Pearson Education: London, UK, 2010. [Google Scholar]
- Choi, H.; Ryu, J.-M.; Yeom, J.-Y. Development of a double-gauss lens based setup for optoacoustic applications. Sensors 2017, 17, 496. [Google Scholar] [CrossRef] [PubMed] [Green Version]
- Ray, S. Applied Photographic Optics; Routledge: Oxfordshire, UK, 2002. [Google Scholar]
- Camera Autofocus Systems Explained: Phase, Contrast, Hybrid, Dfd. Available online: https://petapixel.Com/2018/10/16/camera-autofocus-systems-explained-phase-contrast-hybrid-dfd/ (accessed on 21 April 2019).
- Hybrid Future Based on Digital Camera History. Available online: http://www.Econovill.Com/news/articleview.Html?Idxno=304659 (accessed on 21 April 2019).
- Full-Frame Digital Slr. Available online: https://en.Wikipedia.Org/wiki/full-frame_digital_slr (accessed on 21 April 2019).
- Owens, J. Video Production Handbook; Focal Press: Waltham, MA, USA, 2017. [Google Scholar]
- Mir, H.; Xu, P.; Chen, R.; van Beek, P. An autofocus heuristic for digital cameras based on supervised machine learning. J. Heuristics 2015, 21, 599–616. [Google Scholar] [CrossRef]
- Zhang, Y.; Liu, L.; Gong, W.; Yu, H.; Wang, W.; Zhao, C.; Wang, P.; Ueda, T. Autofocus system and evaluation methodologies: A literature review. Sens. Mater. 2018, 30, 1165–1174. [Google Scholar]
- Koyama, T. Inner Focusing Optical System. Japan Patent JP 2017-134121 A, 3 August 2017. [Google Scholar]
- Fujita, K. Large Apeture Wide-Angle Lens. Japan Patent JP 2017-15941 A, 19 January 2017. [Google Scholar]
- Choi, H.; Yeom, J.Y.; Ryu, J.M. Development of a Multiwavelength Visible-Range-Supported Opto–Ultrasound Instrument Using a Light-Emitting Diode and Ultrasound Transducer. Sensors 2018, 18, 3324. [Google Scholar] [CrossRef] [PubMed] [Green Version]
- Choi, H.; Jo, J.-Y.; Ryu, J.-M. A Novel Focal Length Measurement Method for Center-Obstructed Omni-Directional Reflective Optical Systems. Appl. Sci. 2019, 9, 2350. [Google Scholar] [CrossRef] [Green Version]
- Choi, H.; Jo, J.; Ryu, J.-M.; Yeom, J.-Y. Ultrawide-angle optical system design for light-emitting-diode-based ophthalmology and dermatology applications. Technol. Health Care 2019, 27, 133–142. [Google Scholar] [CrossRef] [PubMed] [Green Version]
- Choi, H.; Choe, S.-W.; Ryu, J.-M. A Macro Lens-Based Optical System Design for Phototherapeutic Instrumentation. Sensors 2019, 19, 5427. [Google Scholar] [CrossRef] [PubMed] [Green Version]
- Choi, H.; Ju, Y.J.; Jo, J.H.; Ryu, J.-M. Chromatic aberration free reflective mirror-based optical system design for multispectral photoacoustic instruments. Technol. Health Care 2019, 27, 397–406. [Google Scholar] [CrossRef] [PubMed] [Green Version]
- Shin, S.-H.; Yoo, W.-S.; Choi, H. Development of Public Key Cryptographic Algorithm Using Matrix Pattern for Tele-Ultrasound Applications. Mathematics 2019, 7, 752. [Google Scholar] [CrossRef] [Green Version]
- Jeong, J.J.; Choi, H. An impedance measurement system for piezoelectric array element transducers. Measurement 2017, 97, 138–144. [Google Scholar] [CrossRef]
- AF-S NIKKOR 24 mm f/1.4G ED. Available online: https://imaging.nikon.com/lineup/lens/f-mount/singlefocal/wide/af-s_24mmf_14g/index.htm (accessed on 21 April 2019).
- EF 24 mm F 1.4L II USM, Specification. Available online: https://cweb.canon.jp/ef/lineup/wide/ef24-f14lii/spec.html (accessed on 21 April 2019).
- Choi, H.; Ryu, J.; Kim, J. A Novel Fisheye-Lens-Based Photoacoustic System. Sensors 2016, 16, 2185. [Google Scholar] [CrossRef] [PubMed]
- Magarill, S. Optomechanical Engineering and Vibration Control. In Optomechanical Sensitivity and Tolerancing; International Society for Optics and Photonics: Bellingham, WA, USA, 1999; pp. 220–228. [Google Scholar]
- Vardeman, S.B.; Jobe, J.M. Statistical Methods for Quality Assurance; Springer: New York, NY, USA, 2016. [Google Scholar]

Figure 2.
Optical layout for JP20160012034A2P, Example 1.

Figure 3.
Optical layout for KR20140124286AP, Example 1.

Figure 4.
Optical layout after combining the optical layout of JP20160012034A2P and the optical layout of KR1020140124286AP.
Figure 4.
Optical layout after combining the optical layout of JP20160012034A2P and the optical layout of KR1020140124286AP.

Figure 5.
Optical layout of the optical system with 24 mm EFL increment.

Figure 6.
Degree change variances of the aspheric coefficient of the combined optical system.

Figure 7.
Optical path diagram of basic design data.

Figure 8.
Diagram of the final design.

Figure 9.
Spherical aberration degree of the final design at the infinity and principal shooting distance.
Figure 9.
Spherical aberration degree of the final design at the infinity and principal shooting distance.

Figure 10.
TV distortion of the final designs at the infinite and nearest distance.

Figure 11.
Image heights vs. MTF plots of the final designs at the infinite and main imaging distance.
Figure 11.
Image heights vs. MTF plots of the final designs at the infinite and main imaging distance.

Figure 12.
Frequency vs. MTF plots of the final designs at the infinite and main imaging distance.

Figure 13.
The sensitivities for the decenter and tilt of the lens group.

Figure 14.
The correction for the designed optical system aberrations.

Figure 15.
The process capability index for the designed and assembled optical system.


Table 1.
First orders of optical layout after combining the optical layout of JP20160012034A2P and the optical layout of KR1020140124286AP.
Table 1.
First orders of optical layout after combining the optical layout of JP20160012034A2P and the optical layout of KR1020140124286AP.
| EFL | 26.302 mm |
| BFL | 10.830 mm |
| FFL | 19.457 mm |
| F/# | 1.4 |
| Image distance | 10.830 mm |
| Overall length | 122.481 mm |
| Paraxial image height | 21.7 mm |
| HFOV (Half Field of View) | 39.5° |
Table 2.
Combined optical layout BFL and EFL change value before and after correction.
| BFL | Before | R1 | 53.9982 | R4 | 28.8431 | D11 | 16.7154 |
| After | 37.235853 | 18.078948 | 13.959187 | ||||
| EFL | Before | R2 | 25.7944 | R3 | 45.1546 | R25 | −88.95502 |
| After | 20.841198 | 30.198396 | −134.9441 |
Table 3.
Spot size and the spherical aberration change due to the radiation correction of the synthesized optical system.
Table 3.
Spot size and the spherical aberration change due to the radiation correction of the synthesized optical system.
| RMS (mm) | 100% (mm) | SAA (mm) | SAT (mm) | |
|---|---|---|---|---|
| (a) | 3.571648 | 11.712321 | −0.873108 | −2.69256 |
| (b) | 2.343004 | 9.375108 | 0 | −1.155744 |
| (c) | 1.485043 | 7.553029 | 0.64045 | −0.000062 |
| (d) | 1.029953 | 6.184465 | 1.1 | 0.843992 |
Table 4.
First orders of basic design.
| EFL | 24 mm |
| BFL | 15 mm |
| FFL | 19.457 mm |
| F/# | 1.488 |
| Image distance | 15 mm |
| Overall length | 119.724 mm |
| Paraxial image height | 21.7 mm |
| HFOV | 42.1° |
© 2019 by the authors. Licensee MDPI, Basel, Switzerland. This article is an open access article distributed under the terms and conditions of the Creative Commons Attribution (CC BY) license (http://creativecommons.org/licenses/by/4.0/).
Share and Cite
MDPI and ACS Style
Choi, H.; Ryu, J. Design of Wide Angle and Large Aperture Optical System with Inner Focus for Compact System Camera Applications. Appl. Sci. 2020, 10, 179. https://0-doi-org.brum.beds.ac.uk/10.3390/app10010179
AMA Style
Choi H, Ryu J. Design of Wide Angle and Large Aperture Optical System with Inner Focus for Compact System Camera Applications. Applied Sciences. 2020; 10(1):179. https://0-doi-org.brum.beds.ac.uk/10.3390/app10010179
Chicago/Turabian StyleChoi, Hojong, and Jaemyung Ryu. 2020. "Design of Wide Angle and Large Aperture Optical System with Inner Focus for Compact System Camera Applications" Applied Sciences 10, no. 1: 179. https://0-doi-org.brum.beds.ac.uk/10.3390/app10010179
Note that from the first issue of 2016, this journal uses article numbers instead of page numbers. See further details here.