Article

Qualification of a Ni–Cu Alloy for the Laser Powder Bed Fusion Process (LPBF): Its Microstructure and Mechanical Properties

1
Foundry Institute, RWTH Aachen University, Intzestraße 5, 52072 Aachen, Germany
2
Otto Junker GmbH, Jägerhausstr. 22, 52152 Simmerath, Germany
3
Fraunhofer Institute for Laser Technology (ILT), Steinbachstraße 15, 52074 Aachen and FH Aachen University of Applied Sciences, Goethestr. 1, 52064 Aachen, Germany
4
Oerlikon AM GmbH, Kapellenstraße 12, 85622 Feldkirchen, Germany
*
Author to whom correspondence should be addressed.
Submission received: 31 March 2020 / Revised: 10 May 2020 / Accepted: 11 May 2020 / Published: 14 May 2020
(This article belongs to the Special Issue Materials Development by Additive Manufacturing Techniques)

Abstract

:
As researchers continue to seek the expansion of the material base for additive manufacturing, there is a need to focus attention on the Ni–Cu group of alloys which conventionally has wide industrial applications. In this work, the G-NiCu30Nb casting alloy, a variant of the Monel family of alloys with Nb and high Si content is, for the first time, processed via the laser powder bed fusion process (LPBF). Being novel to the LPBF processes, optimum LPBF parameters were determined, and hardness and tensile tests were performed in as-built conditions and after heat treatment at 1000 °C. Microstructures of the as-cast and the as-built condition were compared. Highly dense samples (99.8% density) were achieved after varying hatch distance (80 µm and 140 µm) with scanning speed (550 mm/s–1500 mm/s). There was no significant difference in microhardness between varied hatch distance print sets. Microhardness of the as-built condition (247 HV0.2) exceeded the as-cast microhardness (179 HV0.2.). Tensile specimens built in vertical (V) and horizontal (H) orientations revealed degrees of anisotropy and were superior to conventionally reported figures. Post heat treatment increased ductility from 20% to 31% (V), as well as from 16% to 25% (H), while ultimate tensile strength (UTS) and yield strength (YS) were considerably reduced.

1. Introduction

With the isomorphic nature of nickel (Ni) and copper, the Ni–Cu system results in a complete solid solution which paves way for the development of single-phase alloys over a wide range of compositions [1]. The Monel family of Ni alloys which is based on the Ni–Cu alloy system is characterized by their relatively good strength, good weldability, excellent corrosion resistance, high toughness, and fracture toughness over a wide range of temperature. As a result, they are found in many fields of application [2,3,4,5]. The single-phase Monel series is a solid solution alloy primarily hardened conventionally by cold working and typically finds its application in the chemical and petroleum industry and in food processing, as well as in the marine industry for the production of valves, pumps, heat exchangers, boiler feed heaters, pressure vessels, shafts, and fasteners, among others [2,6,7]. Comparatively, Monel is known to have better corrosion resistance than stainless steels and copper with regard to marine applications [8,9]. It does not exhibit a ductile to brittle transition (DTB) and, therefore, performs very well, even at subzero temperatures [10]. Several variations of the Monel family of alloys, such as Monel 400, Monel 401, Monel 404, Monel R-405, and Monel K-500, are commercially available [2,11,12]. G-NiCu30Nb (DIN 2.4365/9.4365) is a typical casting alloy which is modified after the Monel 400 NiCu30Fe alloy but with significant niobium (Nb) and Si content which promotes better weldability and castability, respectively [13,14,15]. They are typically manufactured in the as-cast state but may be soft annealed at about 900 °C depending on the wall thickness [16].
As additive manufacturing (AM) technologies continue to receive attention, various ranges of metal alloys of steel, titanium, aluminum, cobalt–chromium, gold, silver, and nickel-based superalloys continue to have their application via this generative technology [17]. AM of nickel-based alloys predominantly involved IN625, IN718, IN738LC, and Hastelloy X, whereas others like the Nimonic 263, Chromel, and MAR-M 247 were also severally investigated for the LPBF process [18]. Not much is known in published literature concerning the application of Ni–Cu-based alloy series for the AM process, especially with LPBF. Wire arc additive manufacturing (WAAM) of Monel K500 Ni–Cu alloy was investigated by Reference [19], who concluded that WAAM manufactured components had higher strength, hardness, and ductility than those hot rolled under various heat treatment conditions. Finite element modeling (FEM) of heat transfer, as well as residual stress build-up in laser metal deposition (LMD) of Monel 400, was investigated by Reference [20], while laser and plasma arc direct energy deposition (DED) fabrication of Monel 400 bimetallic structures was also carried out by Reference [21]. This present work, however, focuses on the processability, microstructure, and mechanical properties of the Ni–Cu-based G-NiCu30Nb alloy for LPBF.

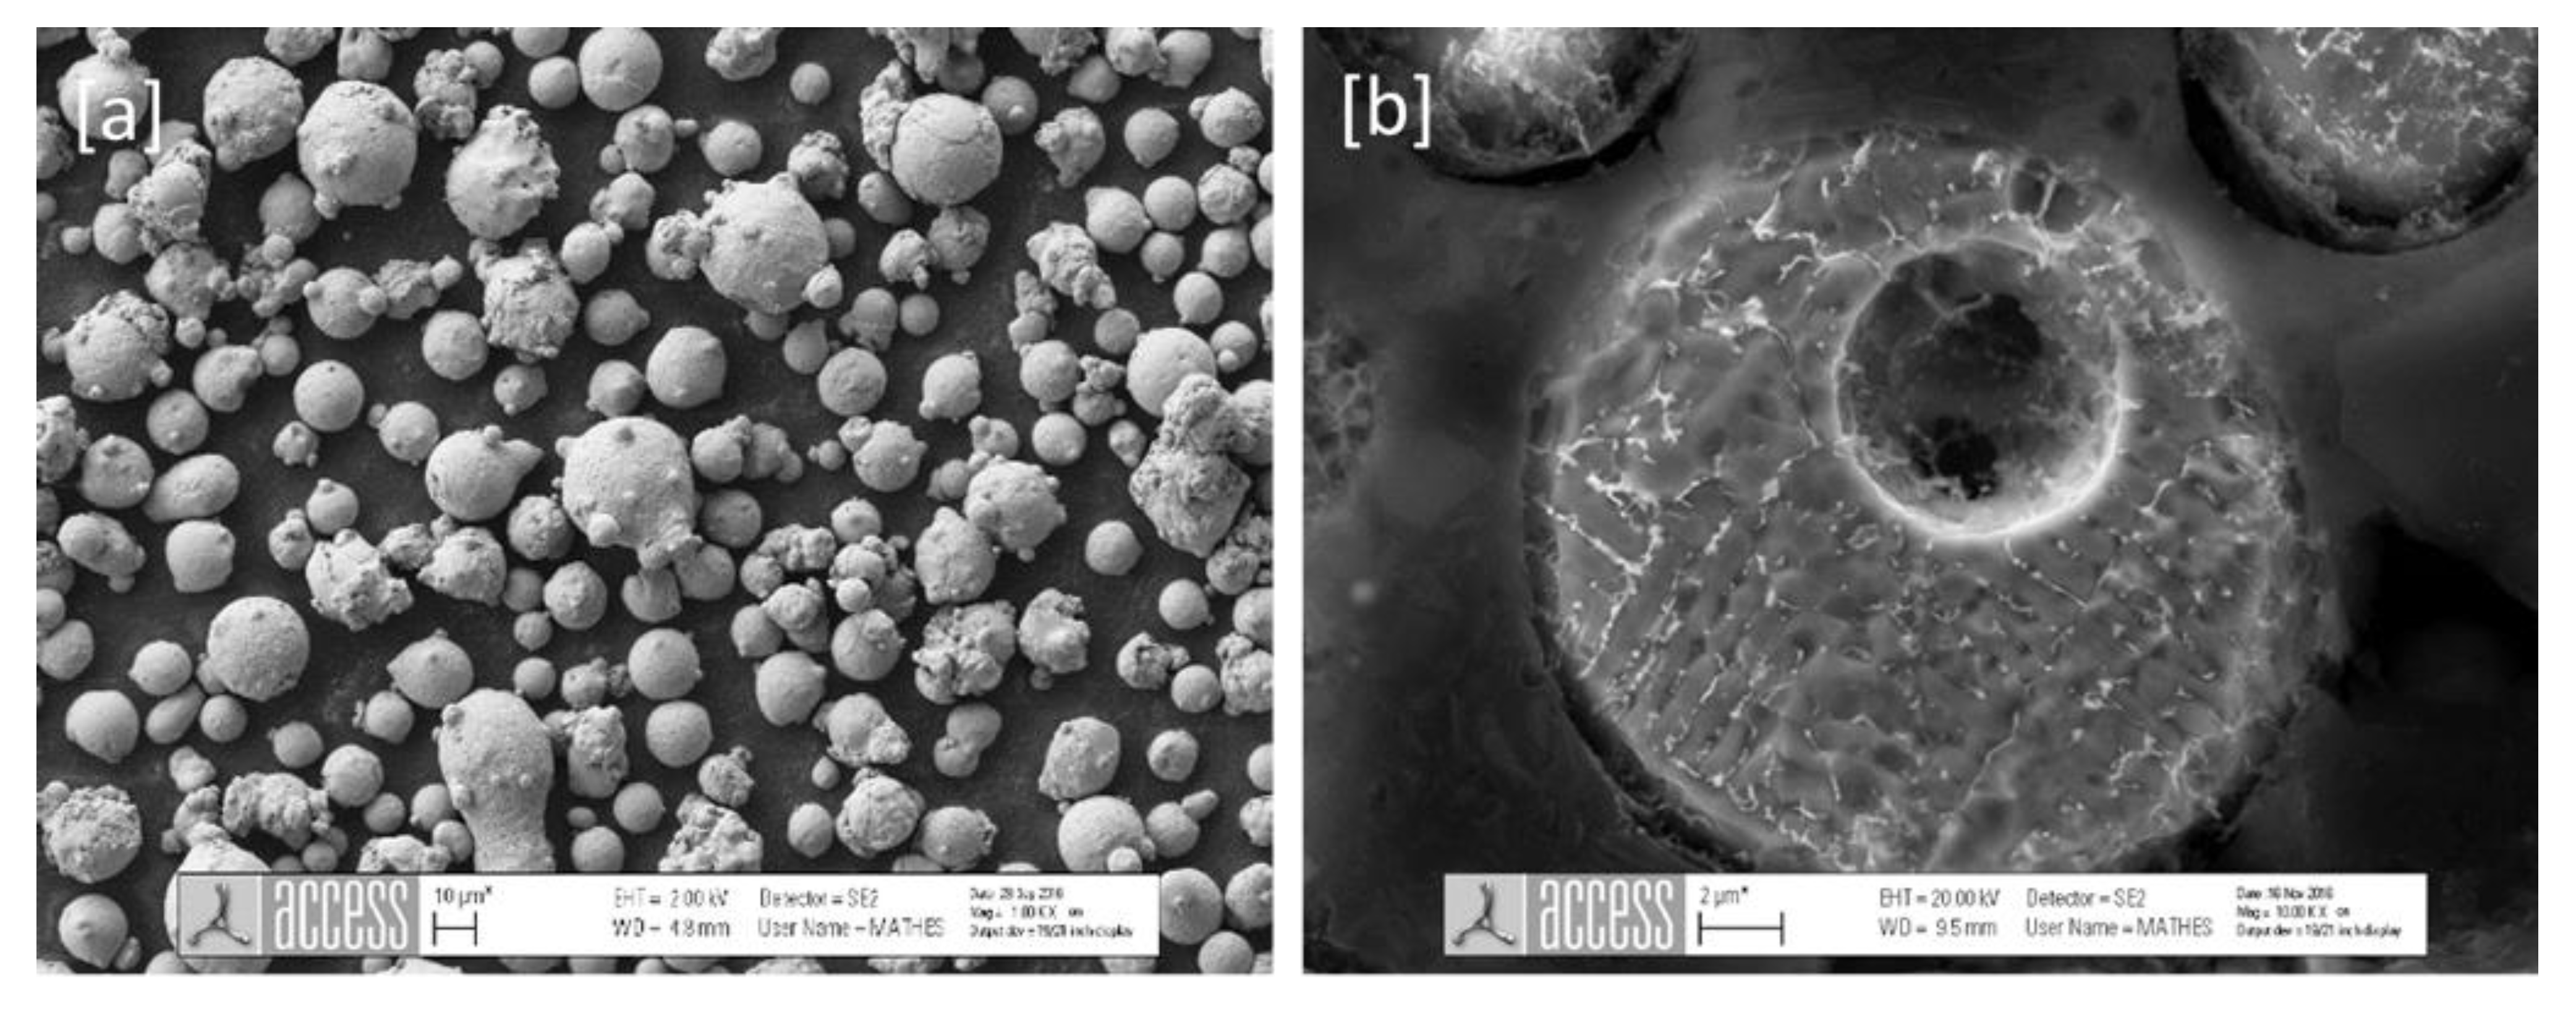
2. Materials and Methods

The G-NiCu30Nb (Deutsches Institut für Normung (DIN) 2.4365) material used for this work was supplied by Otto Junker GmbH. The ingot was gas atomized by Nanoval GmbH under argon atmosphere. The powder was generally spherical, as shown in Figure 1a, but with a few satellites, whereas Figure 1b shows an etched powder particle. Particle size analysis by Nanoval GmbH had a d50 of 27.2 µm. The nominal compositions (wt.%) of the cast (spectral analysis) and the subsequent gas atomized powder (representative energy-dispersive spectroscopy (EDS) measurements, INCA Oxford INCA X-Sight 7426 system) are tabulated in Table 1 below, showing no significant elemental losses during the atomization. The overall carbon content in the powder was not measured; however, local enrichments were measured by EDS. The Zeiss light optical microscope (LOM) and the Zeiss Gemini Field-Emission Gun (FEG) scanning electron microscope (SEM) were used for all microscopic material characterization. Oxford Instruments Inca X-sight 7426 energy-dispersive spectroscopy (EDS) and electron backscatter diffraction (EBSD) detectors were used for all EDS and EBSD measurements, respectively, while etching was performed for 60 s (80 mL of ethanol + 40 mL of HCL+ 2 g of CuCl2). Fraunhofer Institute for Laser Technology’s (ILT) laser powder bed fusion (LPBF) Aconity machine (IPG Photonics Ytterbium YLR-200-SM, 200 W laser power, wavelength of 1080 nm, 90 µm beam diameter) was used for all additive printing.
Eight cubes of 10 × 10 × 10 mm3 dimensions were LPBF-printed using a bidirectional XY scanning strategy which turned about at 90° between each successive layer with a Z building direction perpendicular to the building platform. A constant laser power of 200 W and layer thickness of 30 µm were used. Two hatch distances, 80 µm and 140 µm, were chosen along with a varying scanning speed (Vs) between 550 and 1500 mm/s. Using ANSYS Pro image analysis software, the relative densities of the cubes were determined. The relative density of each cube was determined by averaging five optical measurements taken at five different positions. Microhardness was determined using the Buehler MicroMet 5104 equipment both in as-built and in post heat-treated conditions. The measurements were determined from averaging nine different measurements on the plane parallel to the building direction away from the bottom layer near the support structure using a load of 200 g (HV0.2). The averaged microhardness of each hatch distance (80 µm and 140 µm) print set, along with their respective scanning speeds (1000–1500 mm/s and 550–850 mm/s), was compared to as-cast material. Based on the building parameters of the as-built cubes, the tensile specimens were printed using the following process parameters: laser power (Lp) = 200 W, layer thickness (Ds) = 30 µm, hatch distance (ys) = 140 µm, and scanning speed (Vs) = 850 mm/s. Tensile tests were performed at room temperature with the INSTRON 8033 tensile test machine using a crosshead speed of 0.3 mm/min. Six tensile test specimens according to DIN 50125 standard were as-printed and tensile tested (three vertical and three horizontal orientations), while six other as-built tensile specimens also printed according to DIN 50125 standard were post heat treated (PHT) at 1000 °C for 1 h (three vertical and three horizontal orientations) before the tensile test was performed. The tensile test results obtained from each building orientation were averaged and compared.
A full factorial experimental design approach was adopted in this study to investigate the effect of varying hatch distances with varying scanning speeds on the printing of as-built samples, on the relative density, and on the subsequent effect of PHT on mechanical properties. The scope of the experiment also covered an investigation into the anisotropic microstructure of different building directions and the impact on mechanical properties.

3. Results

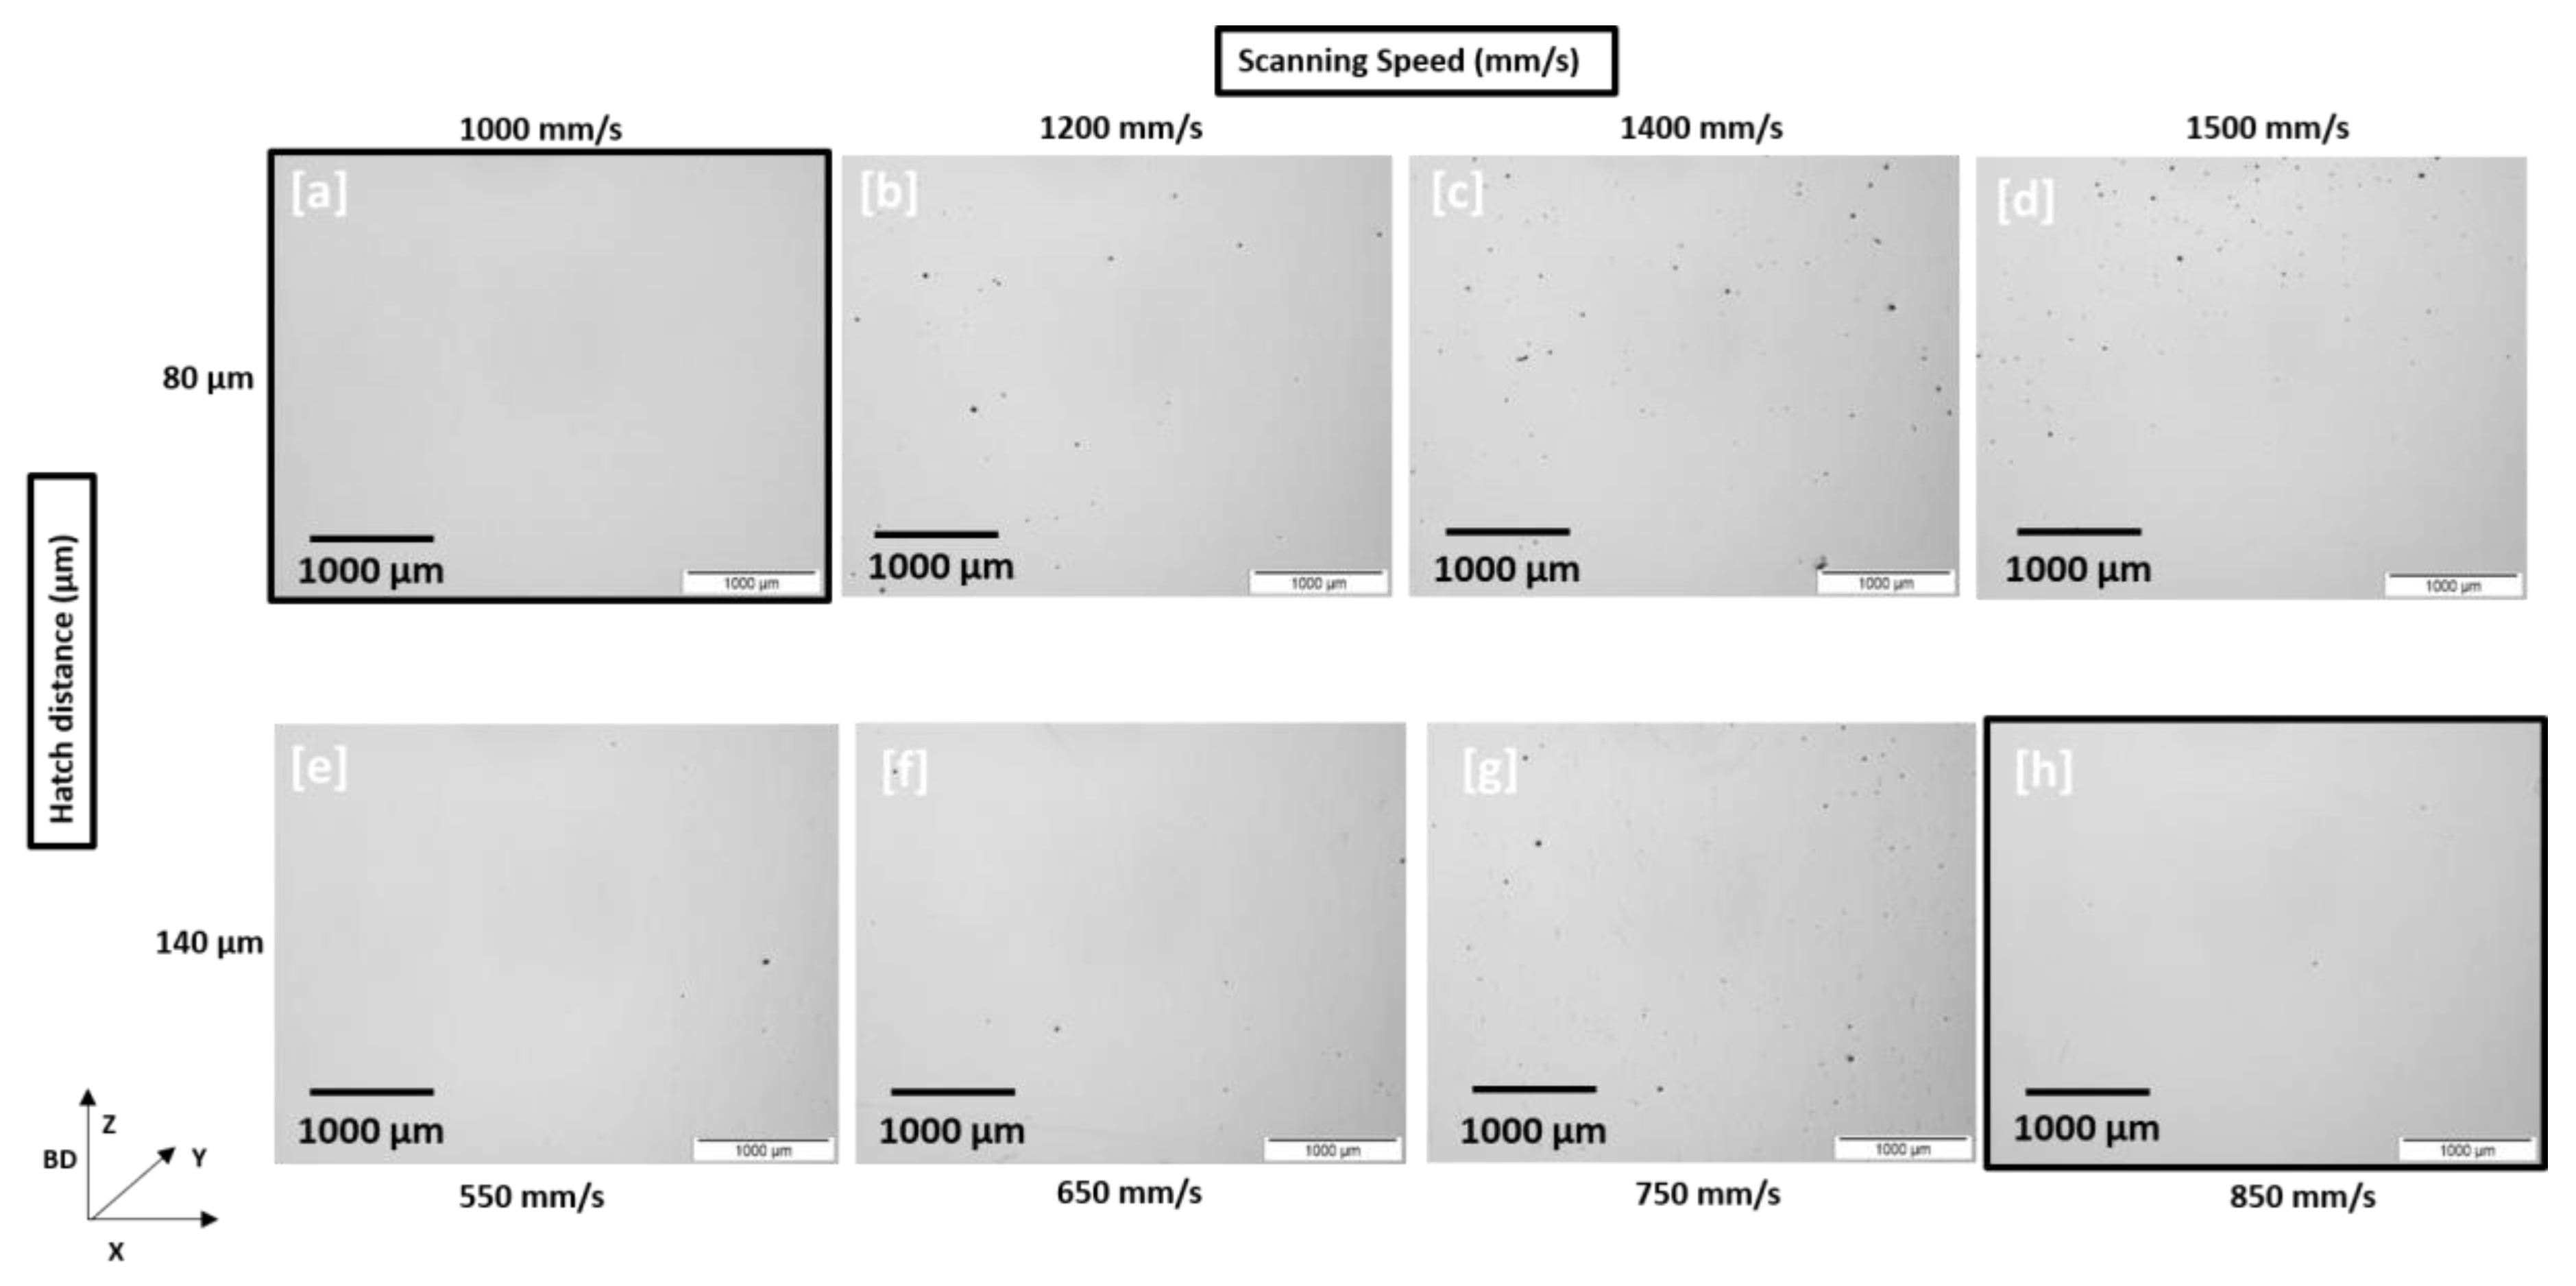
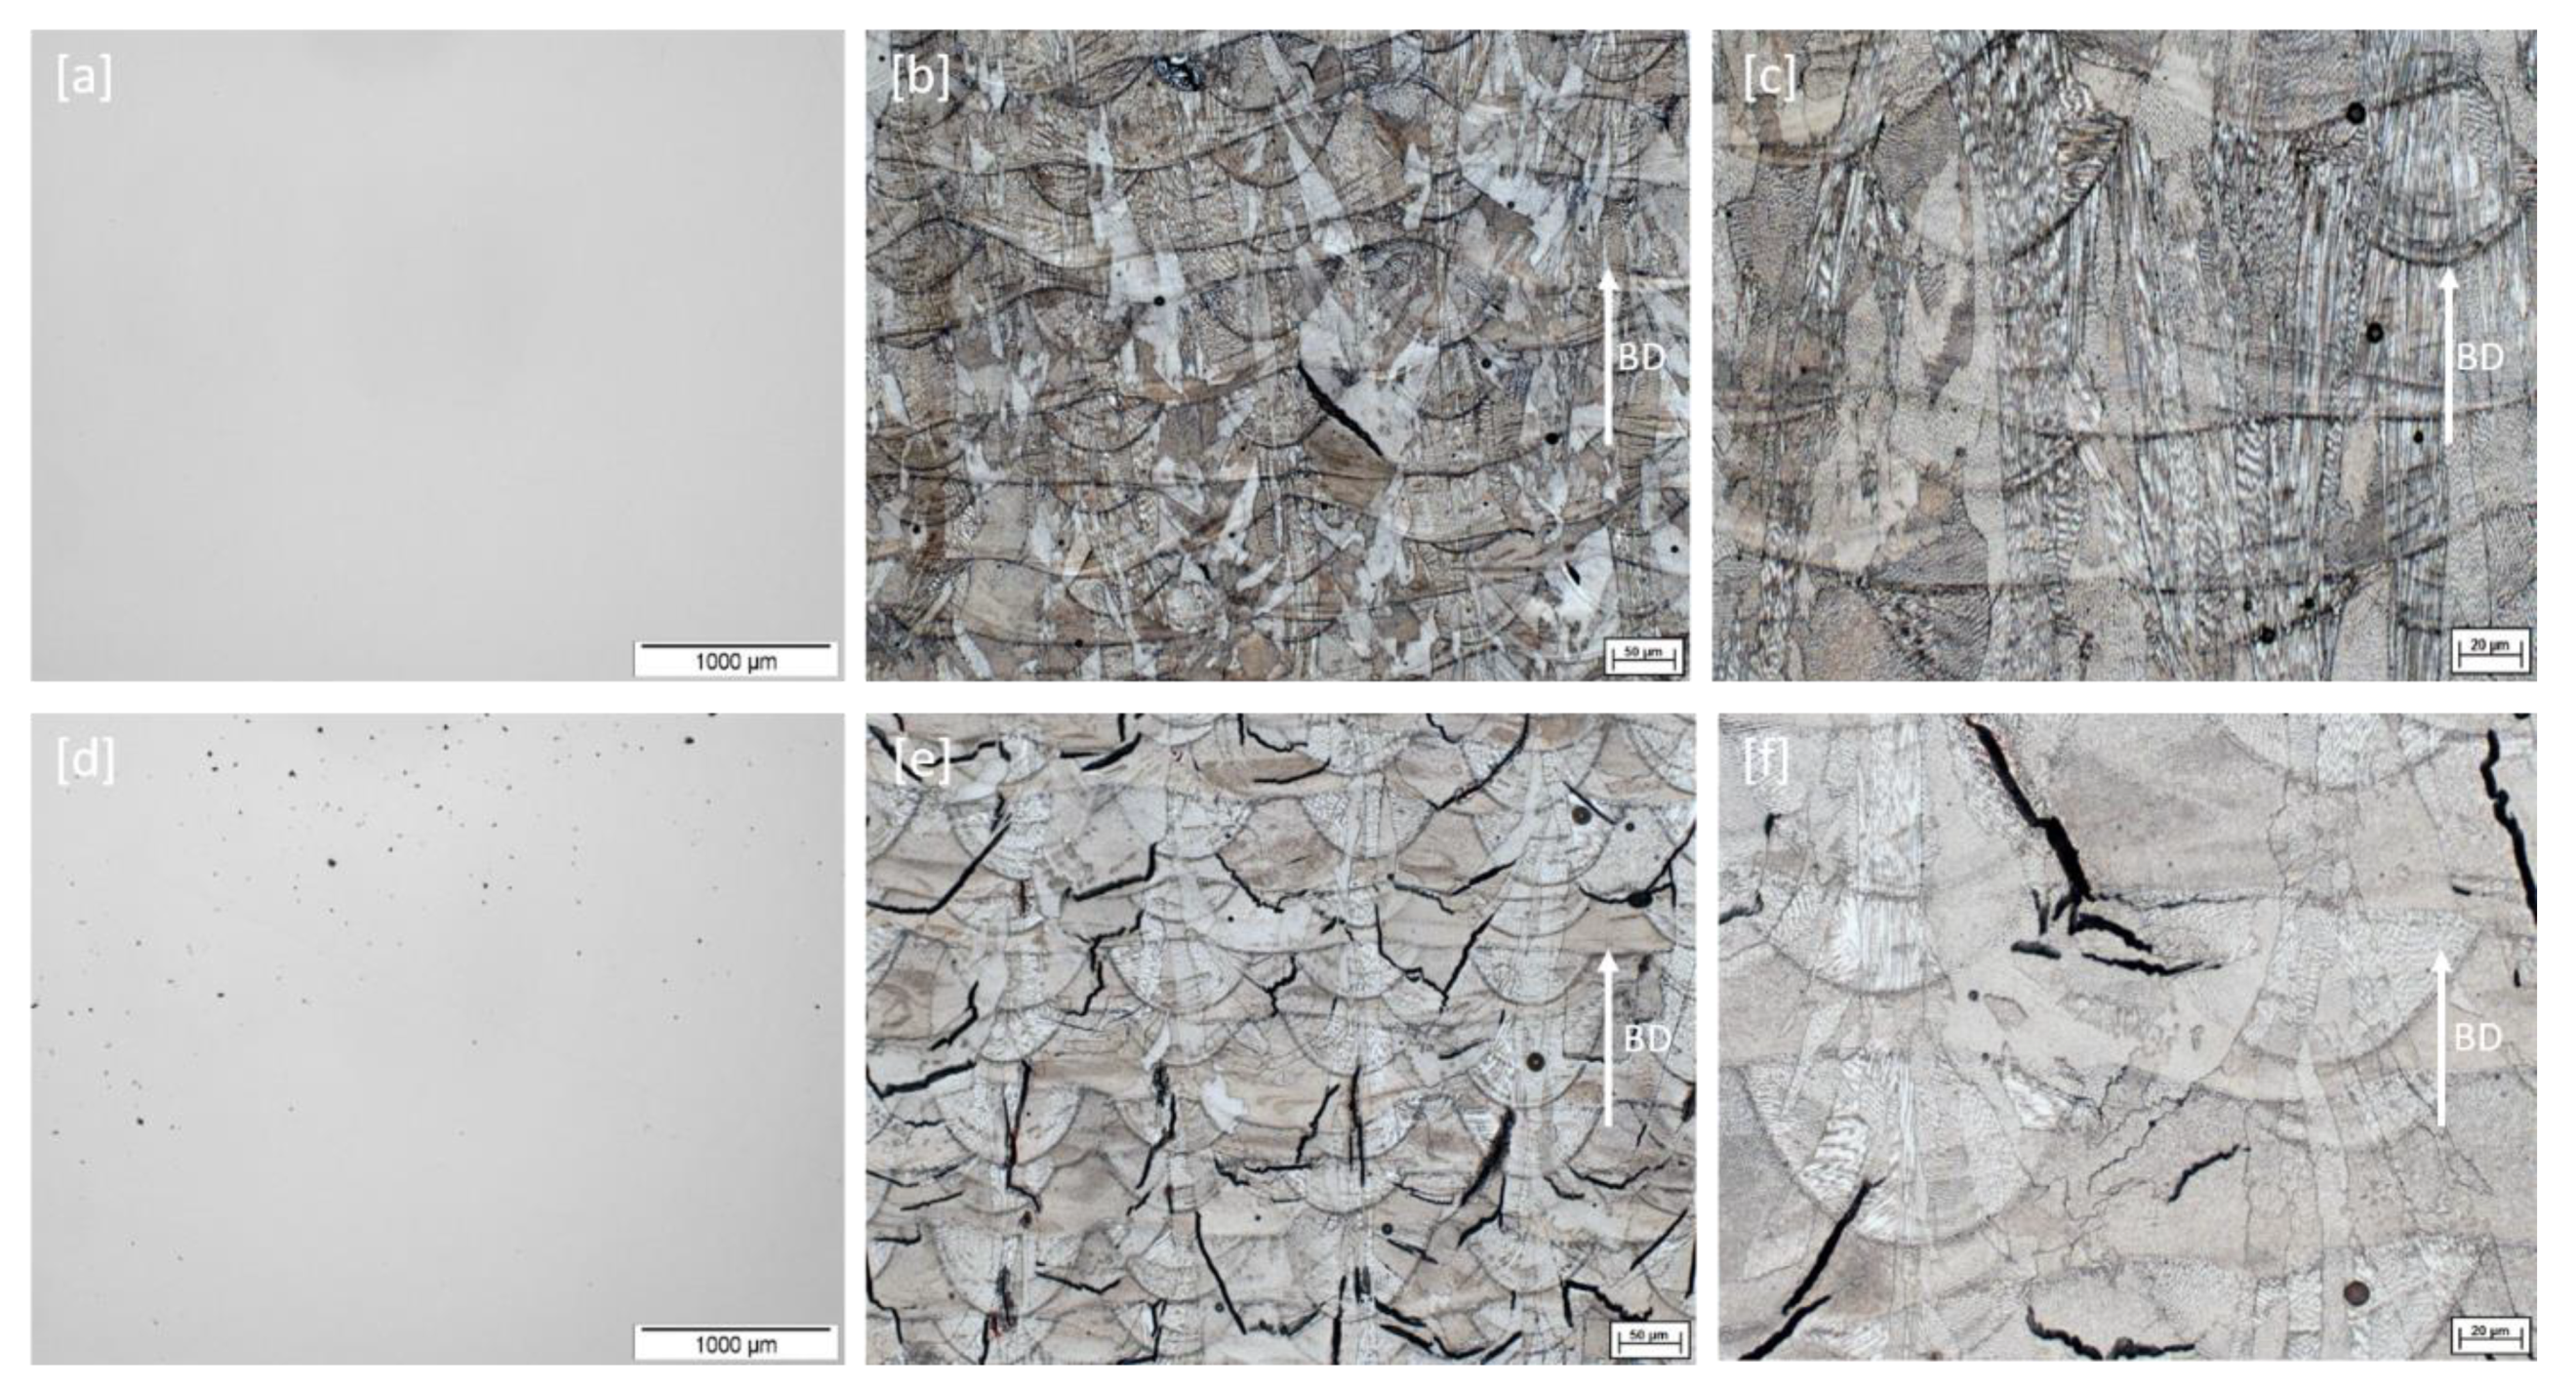
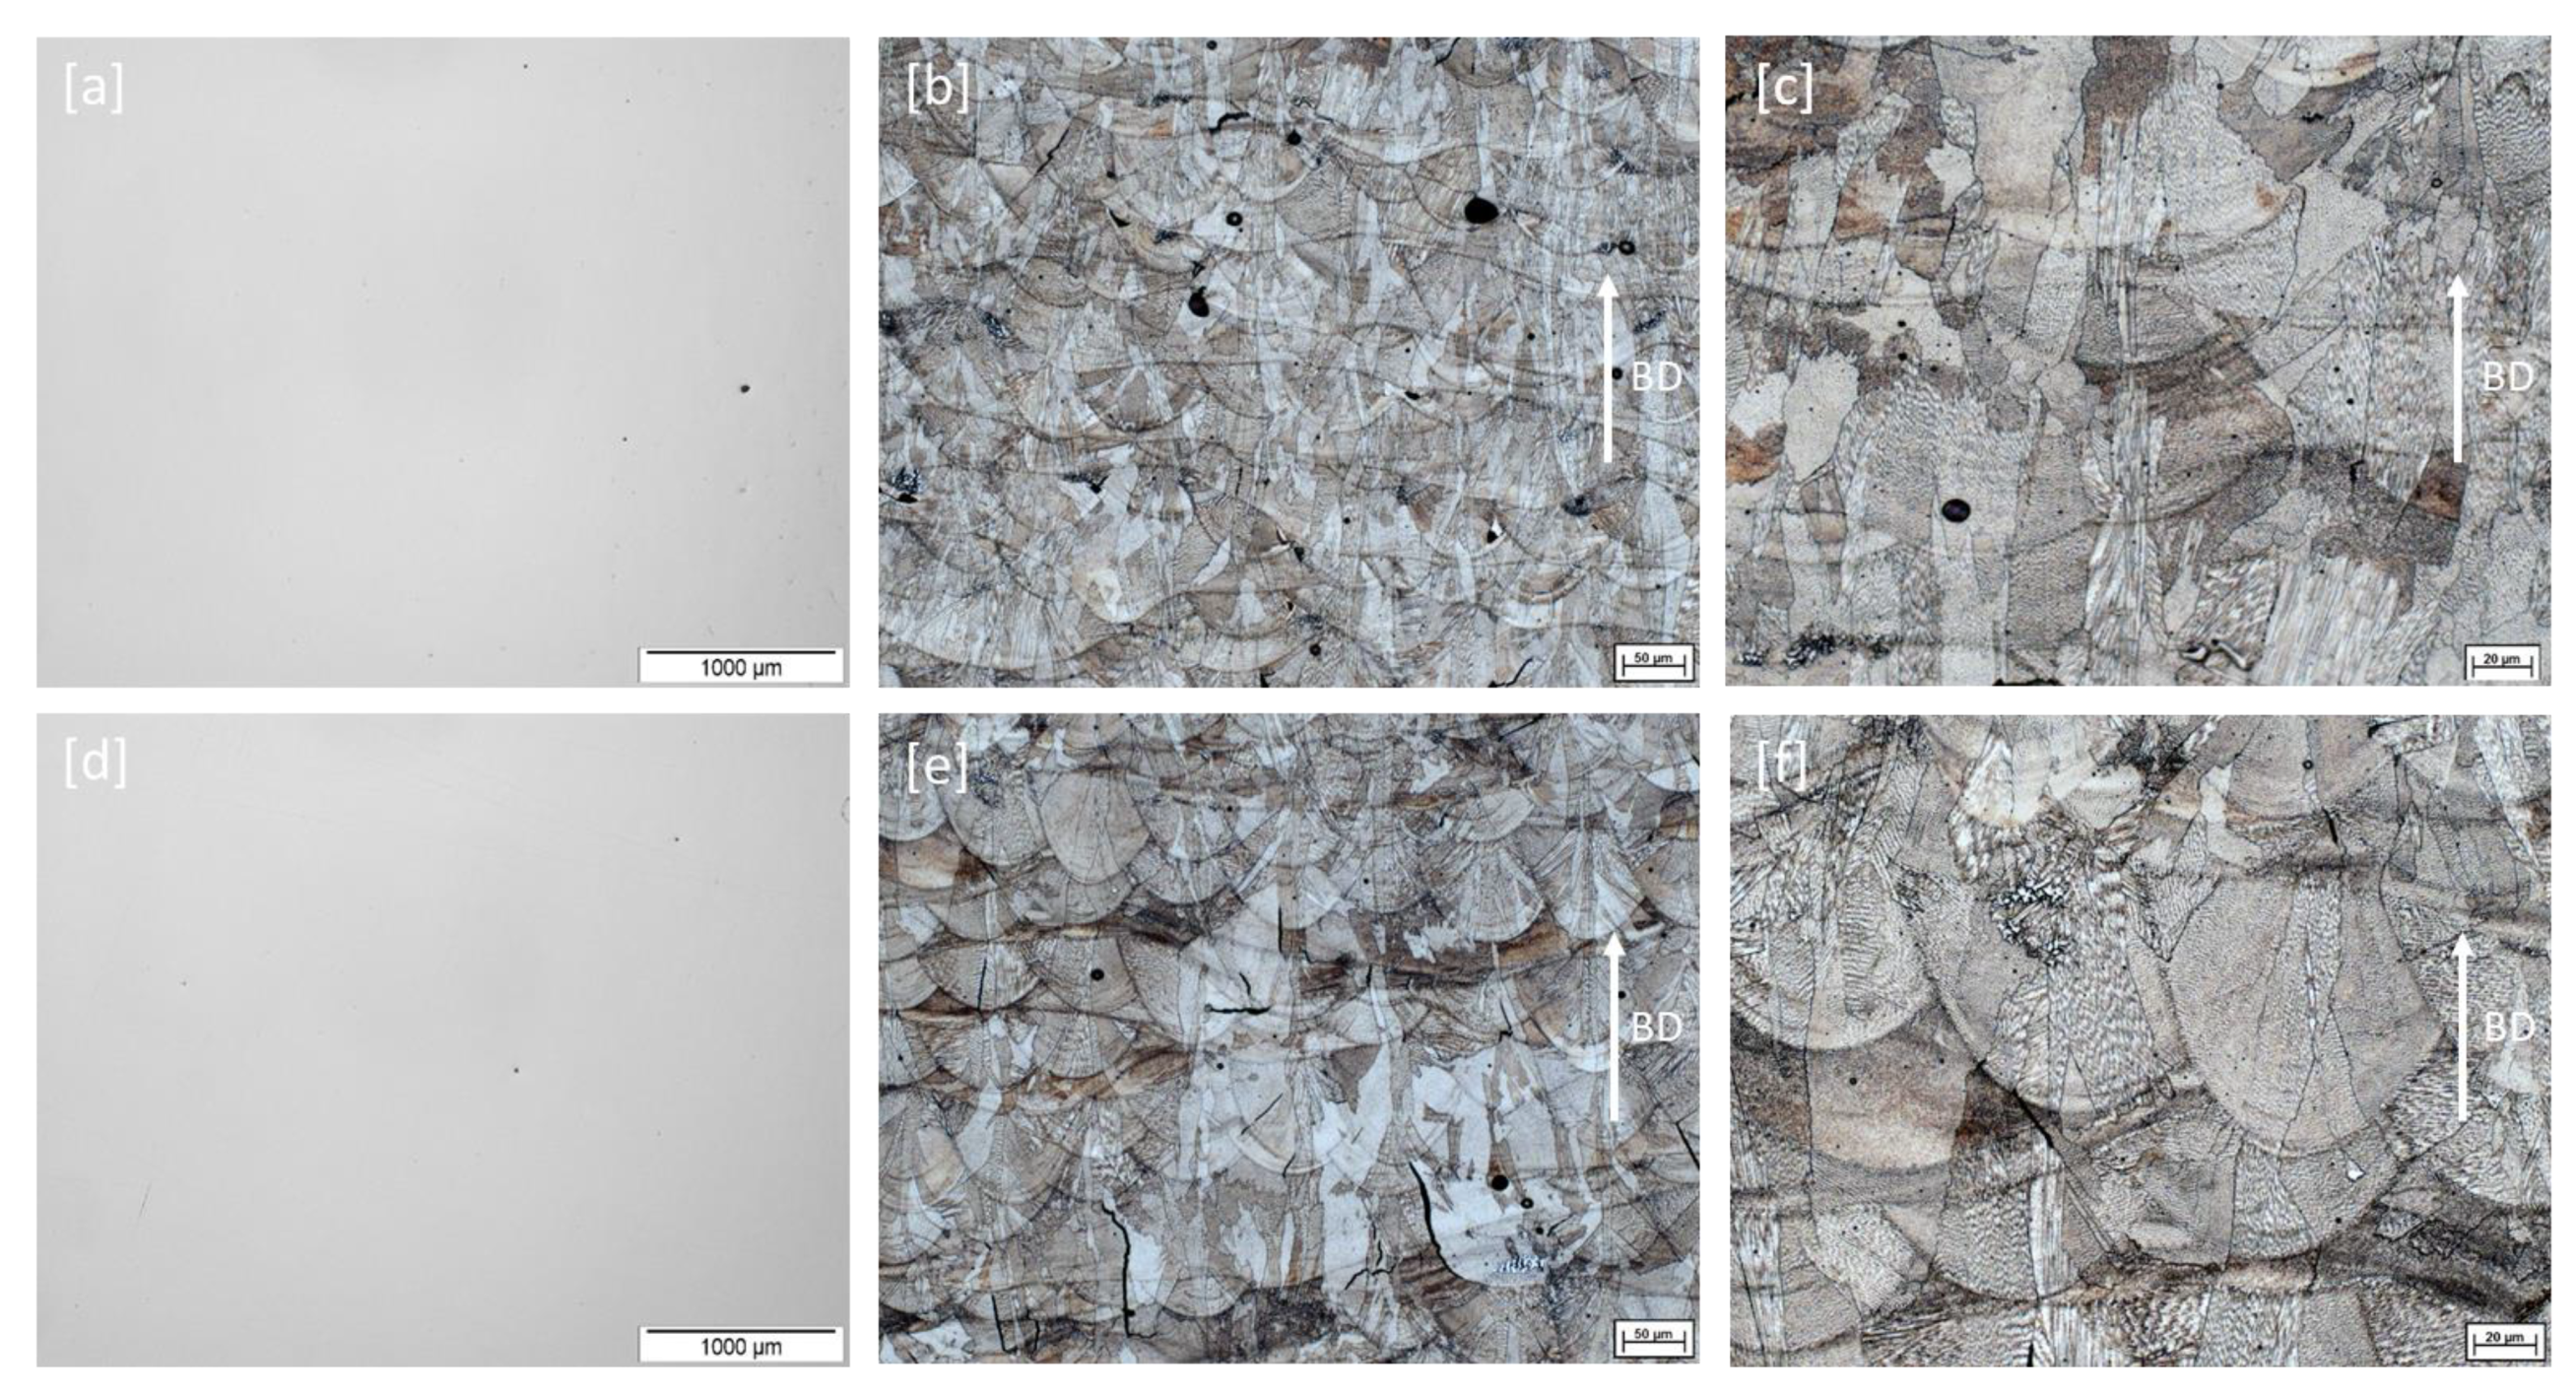
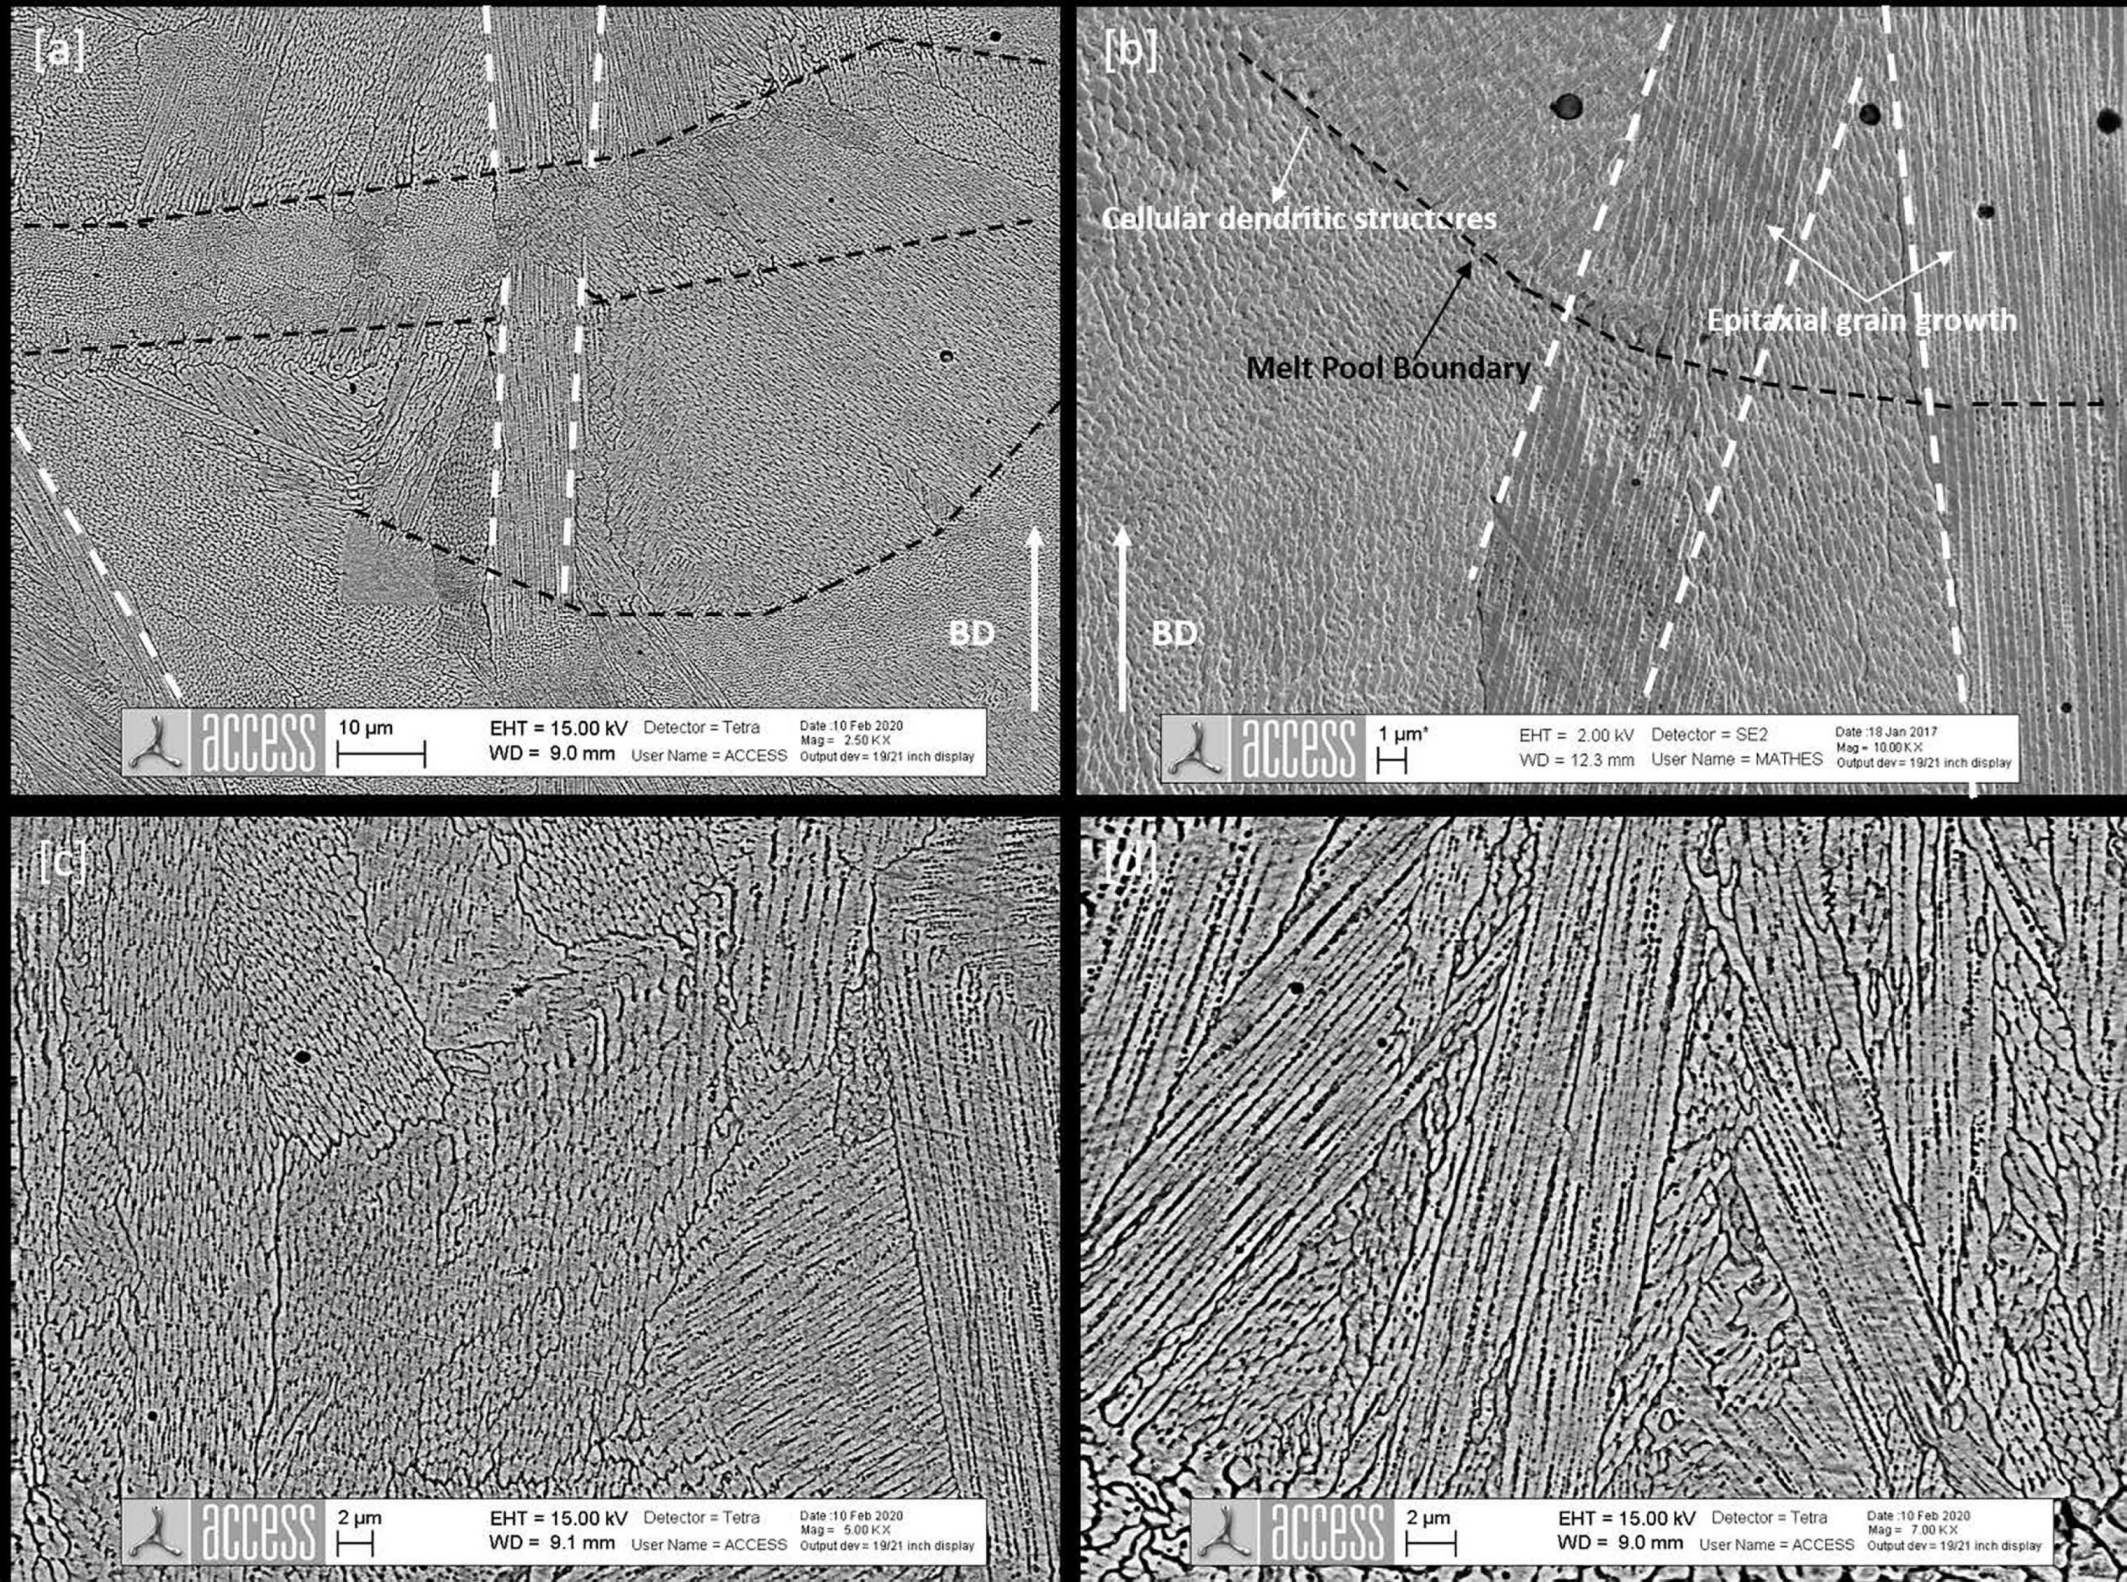
3.1. As-Built LPBF Micrographs

E v = L P D s   ·   v s   ·   y s   [ J / m m 3 ] .
The volumetric energy density (Ev) equation as expressed in Equation (1) above highlights the inter-relation between the key process parameters such as the laser power (Lp), layer thickness (Ds), scanning speed (Vs), and hatch distance (ys). This served as the basis for the parametric design employed in this study. The as-printed cubes were generally dense (≥99.6%) with the most dense cubes recording a relative density of 99.8%, as shown in Figure 2. Table 2 below highlights the process parameters and the achieved relative densities in each print set.
For the 80 µm hatch distance print set, the least and most dense cubes recorded relative densities of 99.63% and 99. 80%, respectively. These represented percentage porosities of 0.37% and 0.20%, respectively. Similarly, in the 140 µm hatch distance print set, 99.71% and 99.80% were recorded as the lowest and highest relative densities, respectively. This also accounted for percentage porosities of 0.29% and 0.20%, respectively. From Figure 2, for both hatch distance print sets (80 µm and 140 µm), small spherical pores can be observed, which are characteristically gas-induced pores which may have been trapped during melting and solidification [22]. The average pore size measured with the ANSYS Pro image analysis software among all the samples was less than 1 µm. In Figure 3, micrographs of 80 µm hatch distance samples at different scanning speeds are compared. The as-built cube printed at 1000 mm/s scanning speed shown in Figure 3a is observed to be denser and crack-free compared to Figure 3d, printed at 1500 mm/s scanning speed, which shows more cracks. Calculated energy density values ranged from 55–88 J/mm3.
Since the volumetric energy density (Ev) is the same for the samples shown in Figure 2d,h (about 56 J/ mm3), and the cracks do not resemble Lack of Fusion (LOF) defects, they are believed to be residual stress propagating cracks arising from the build-up of large amounts of local residual stress in the as-built condition due to the generally high temperature gradient associated with the LPBF process. High scanning speeds tend to generate higher cooling rates [23], which, in combination with smaller hatching distance, can lead to local stresses and fracture when the material ultimate tensile strength is exceeded [24]. The increase in scanning speed to 1500 mm/s is, therefore, believed to have induced higher cooling rates which influenced residual stress build-up and led to fracture or cracks as seen in Figure 3e,f and not in Figure 3a–c at 1000 mm/s scanning speed.
The micrographs in Figure 4 show etched and unetched cubes at different magnifications built using a 140 µm hatch distance. Although there are few gas pores in these cubes, no cracks are observed with scanning speed between 550 mm/s and 850 mm/s. Lower hatch distances tend to reduce the building rate, and they are typically characterized by increased melt pool overlap, as well as an increase in local melt pool temperature (vice versa for increased hatch distance) [25]. However, for complete fusion and good metallurgical bonding, the amount of laser and material interaction time should be enough to generate the right volumetric energy density available for complete melting [26]. As previously explained, in spite of the higher hatch distance of 140 µm, as seen in Figure 4, cracks which were not observed in this print set can be attributed to the lower scanning speed between 550 and 850 mm/s. This may have led to a reduction in the build-up of high residual stresses leading to fracture or cracks as seen in Figure 3e,f.
In both hatch distance print sets (80 µm and 140 µm), however, well-defined melt pool boundaries with orientation along the building direction and a lot of epitaxial growth were observed.
Scanning electron micrographs of the as-built cubes shown in Figure 5 highlight discontinuous cellular dendritic sub-structures with high levels of epitaxial growth at different portions of the microstructure. Epitaxial growth is seen to be interrupted at some point at the top of the melt pool as shown in Figure 5a and grows again only to be terminated at the melt pool boundary. In Figure 5b, epitaxial growth is seen stretching across the melt pool boundary. In Figure 5d, it is interlaced between dendritic cellular substructures. The microstructural features, such as the growth of epitaxy and the formation of fine dendritic structures, as seen in Figure 5, are consistent with typical as-built LPBF microstructures reported in several nickel-based alloys such as IN718, IN625, and Haynes® 230® [27,28]. The unique microstructure observed in the LPBF built nickel-based alloys, which is also seen in Figure 5, is influenced not only by the process parameters, but also by the extremely fast cooling rate associated with the LPBF process, which makes it different from the cast [29].

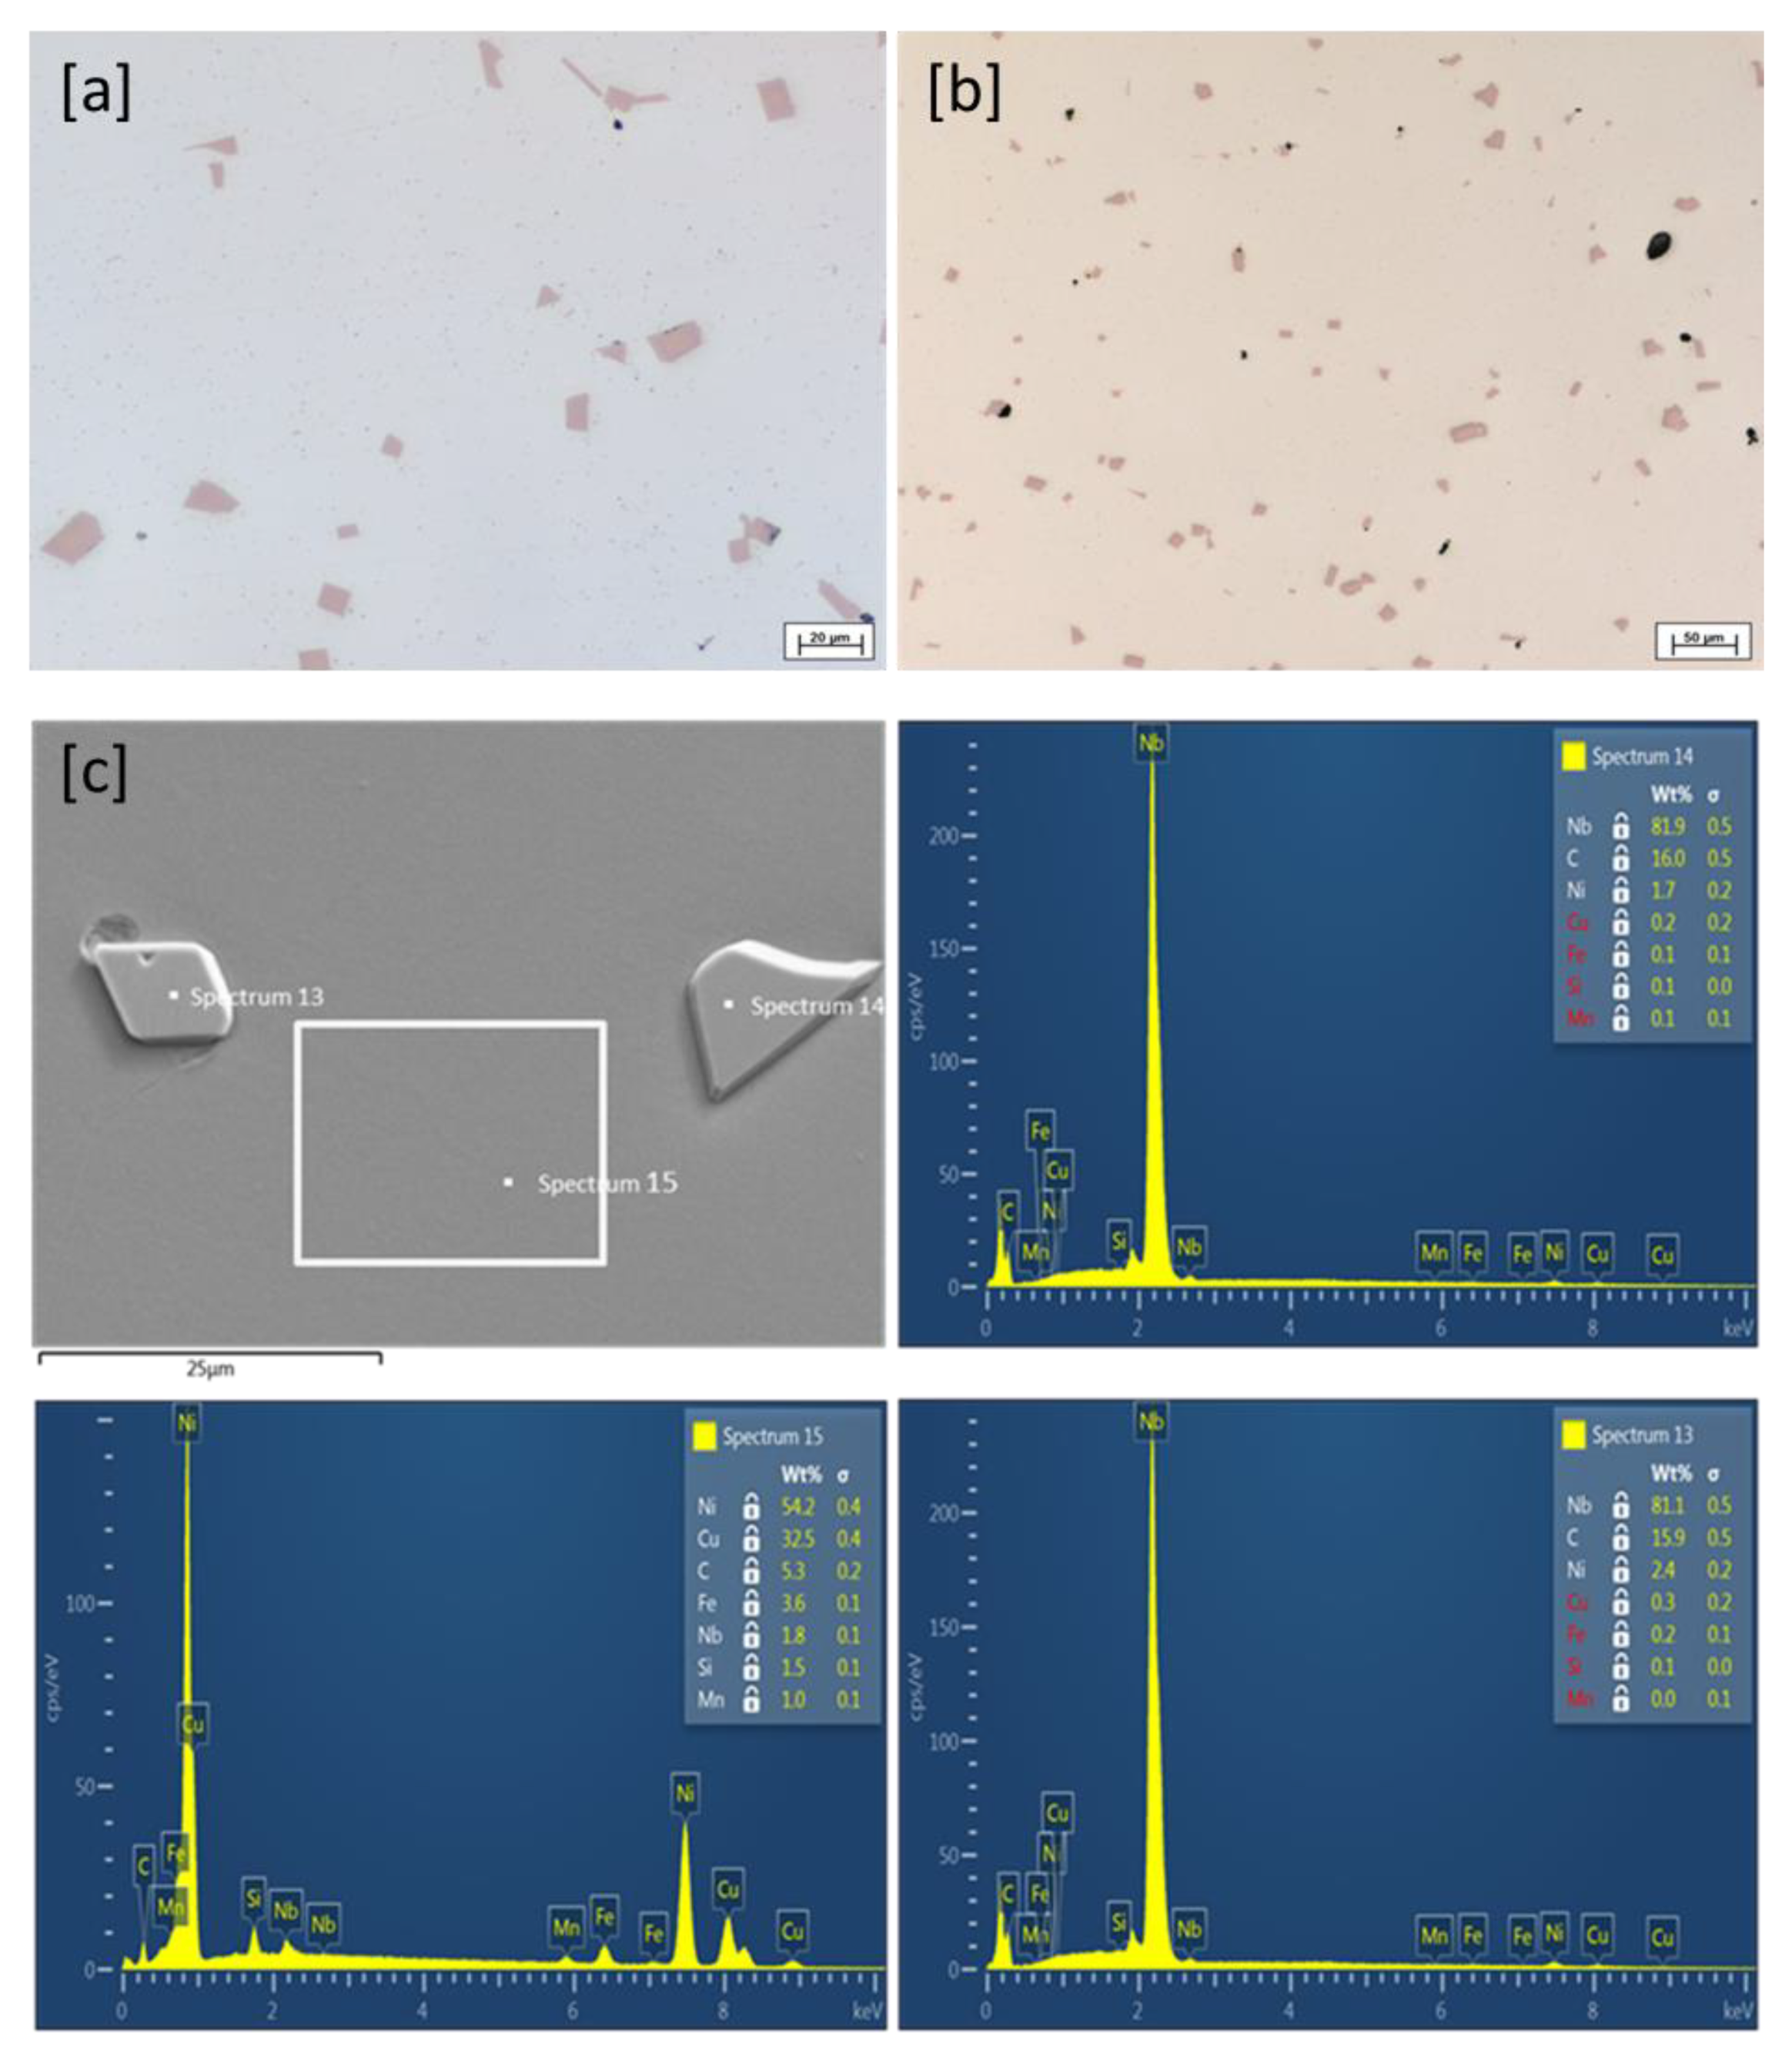
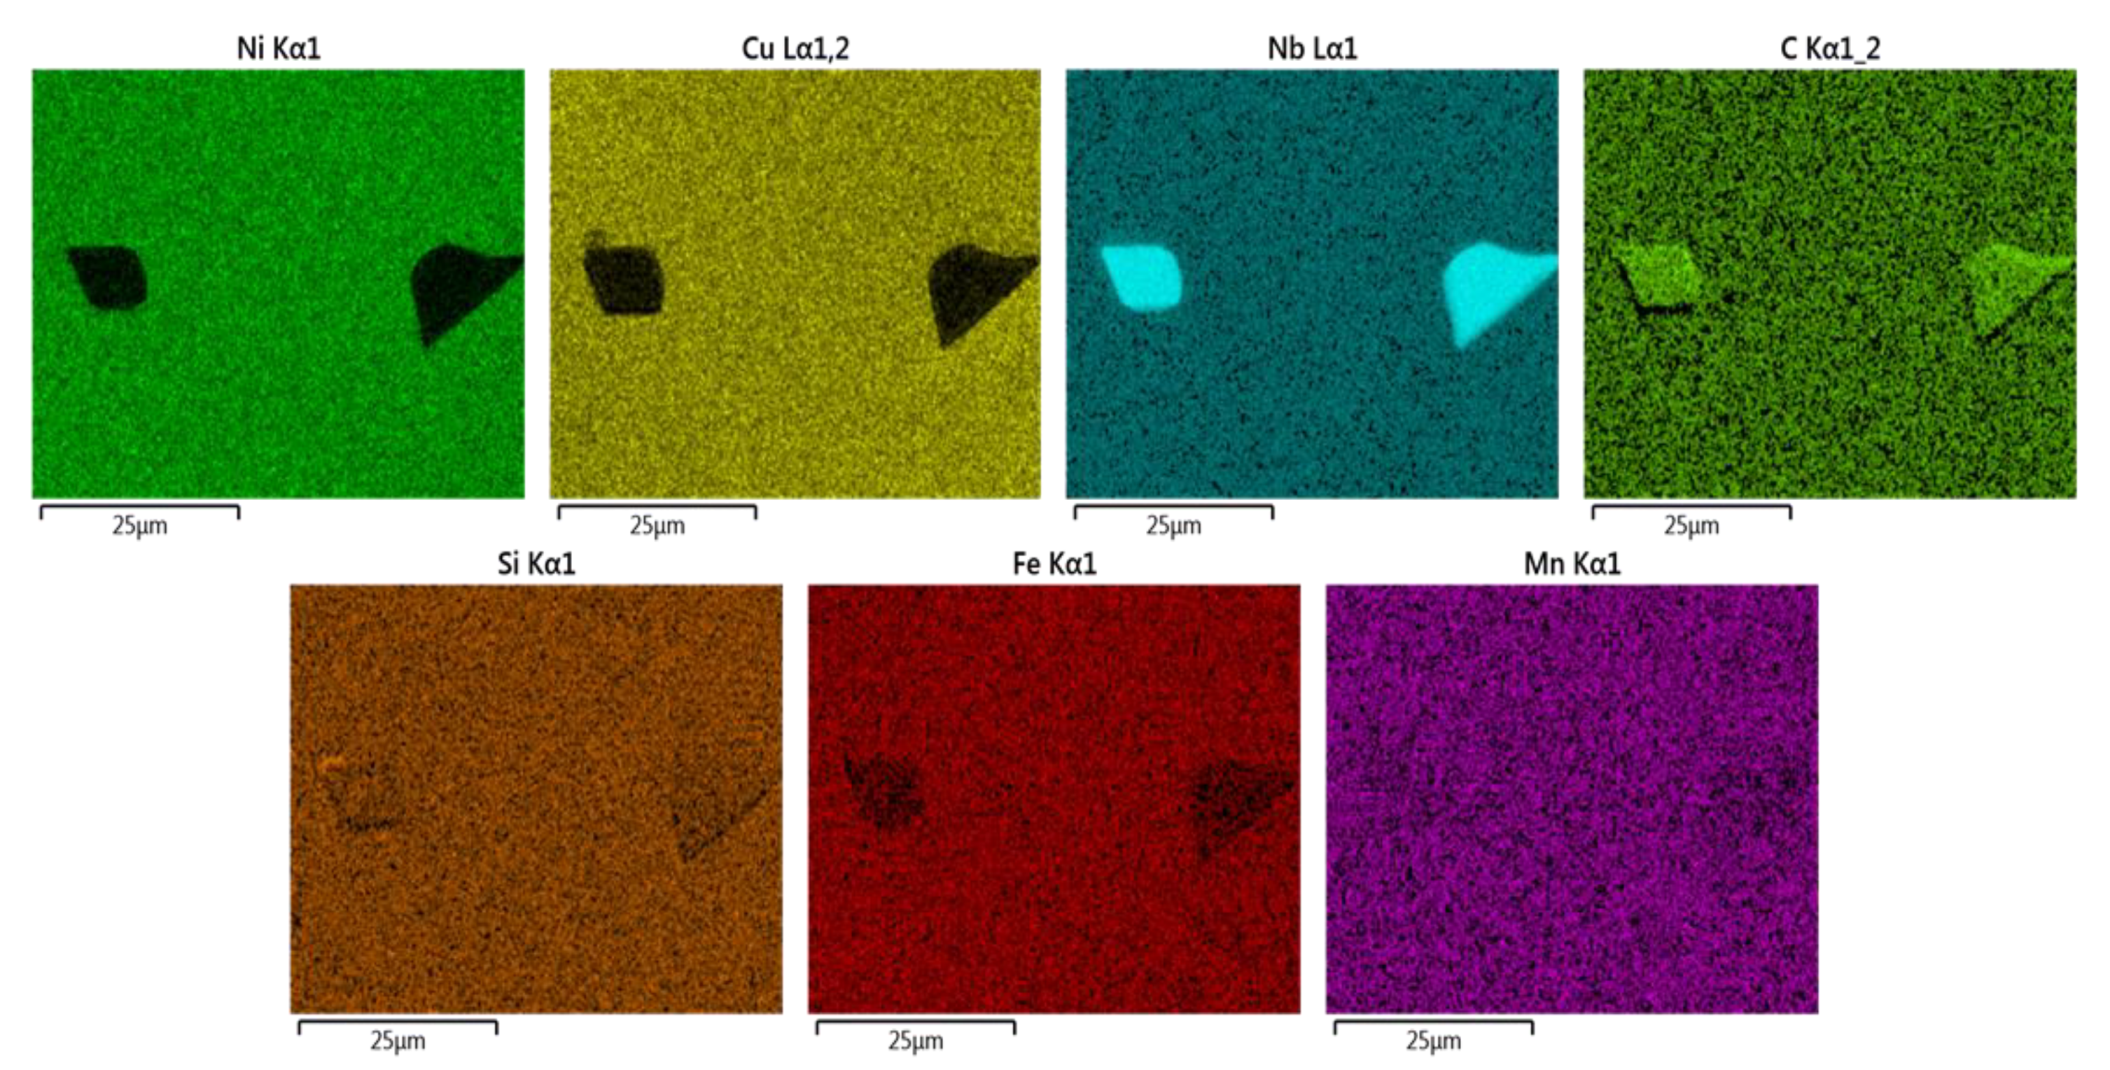
3.2. As-Cast Micrographs

As expected, both LOM and SEM micrographs of the as-cast structure show a completely different microstructure compared to the as-built microstructure. Micrographs of an unetched as-cast sample in Figure 6a,b show a random distribution of coarse particles of varying sizes and shapes in the matrix. The size of these particles ranges from as small as 5 µm to as huge as 20 µm. SEM/EDS mapping and quantitative analyses are reported in both Figure 6c and Figure 7. EBSD phase analyses confirm these particles as niobium carbide particles (NbC).
While some authors [30,31] reported the formation of NbC particles in conventionally fabricated Monel 400 Ni–Cu alloys, others [32,33,34] found these particles in Selective Laser Melting (SLM) or Laser Metal Deposition (LMD) built IN718 and IN625. To the best of our knowledge, no work is currently reported concerning their formation in the G-NiCu30Nb Ni–Cu alloy processed via LPBF additive manufacturing technique. Since the various magnifications employed in the characterization of the as-built microstructures could not confirm NbC in the as-built condition, further work will be carried out in the next phase of this study not only to ascertain expected NbC particles formation but also the nature of their distribution in the as-built condition.

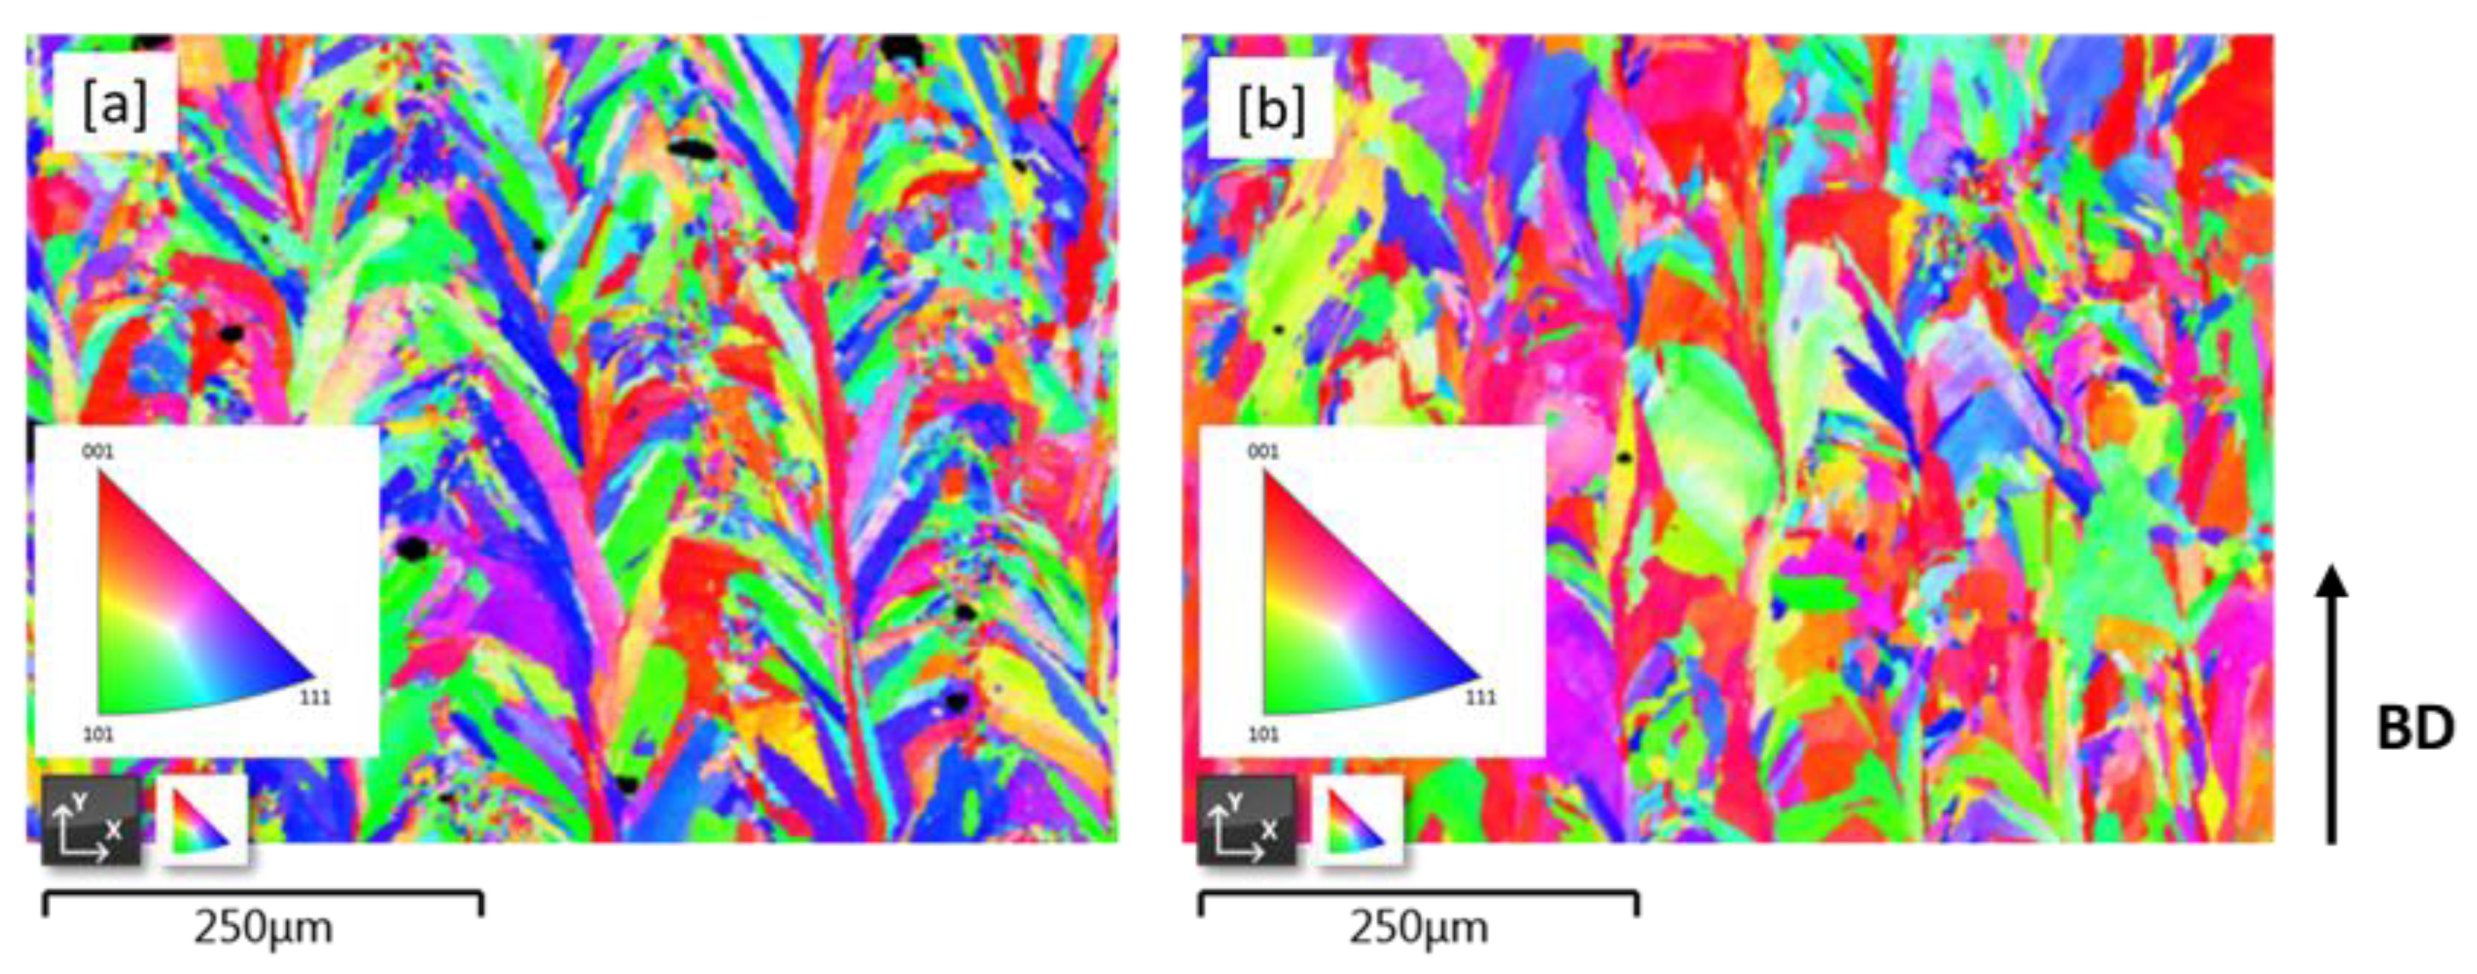
3.3. EBSD Measurement of As-Built Samples

Inverse pole figure (IPF) EBSD maps obtained from the as-built samples are shown in Figure 8 (ys = 80 µm, Vs = 1000 mm/s and ys = 140 µm, Vs = 850 mm/s). From Figure 8, both as-built samples show columnar orientation along the building direction. The effect of constitutional supercooling is dependent on the quotient (G/R), where (G) is the temperature gradient and (R) is the rate of solidification. (G/R) determines the solidification morphology. For rapid solidification processes, like LPBF (104–108 K/s), heat is conducted away from the building plate in a directional manner. This results in the formation of typically columnar oriented structures due to the direction of flow of heat flux as shown by the EBSD measurements [26,35,36,37]. A melt pool exposed to the atmosphere transfers heat flux by radiation while the underlying solidified substrate does so by conduction; grain growth is, therefore, favored in the direction perpendicular to the solid–liquid front [38].
The 80 µm hatch distance sample recorded an average equivalent grain diameter (ECD) of 8.45 µm with a mean aspect ratio of 2.13 compared to an average ECD of 11.93 µm with a mean aspect ratio of 2.52 for the 140 µm hatch distance as-built sample. The smaller ECD of the 80 µm hatch distance as-built samples compared to the 140 µm hatch distance samples is a result of the different local thermal and solidification behavior of the different hatch distances. The hatch distance affects the nature of local heat transfer such that wider hatch distances not only reduce the rate of local heat accumulation but also the local cooling rates and lead to coarsened microstructures [38].

3.4. Mechanical Properties

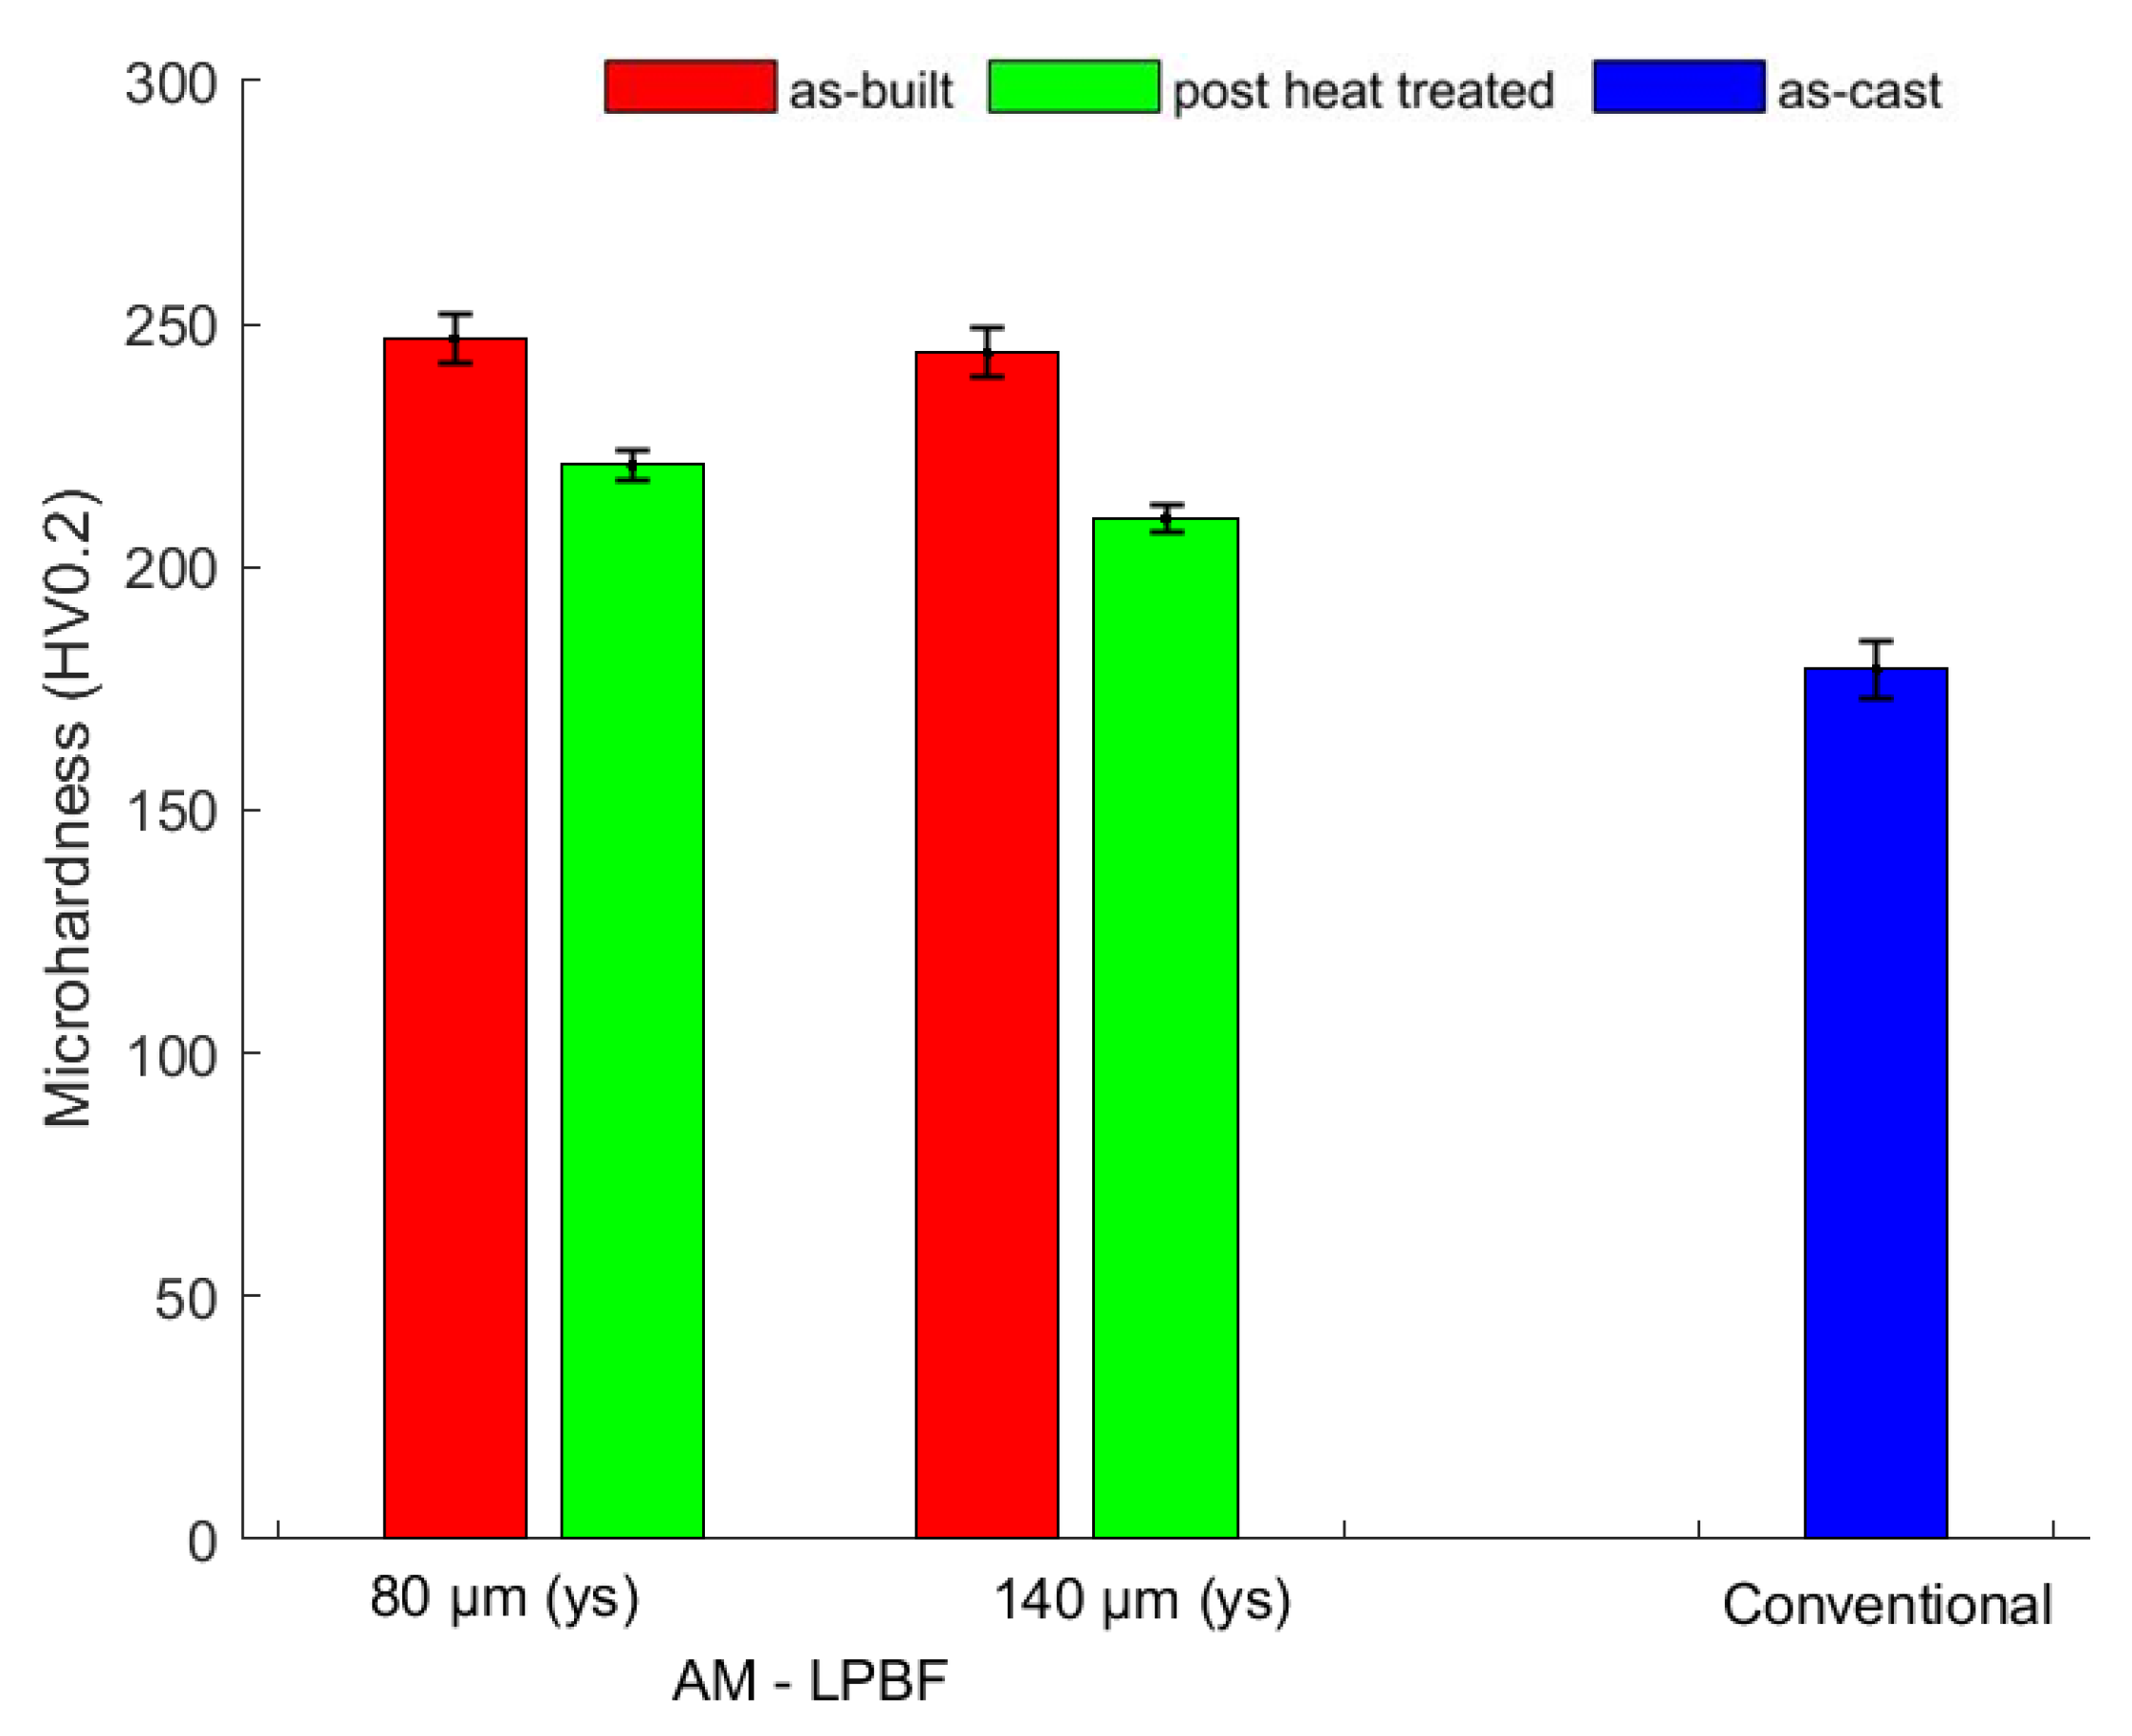
3.4.1. Microhardness
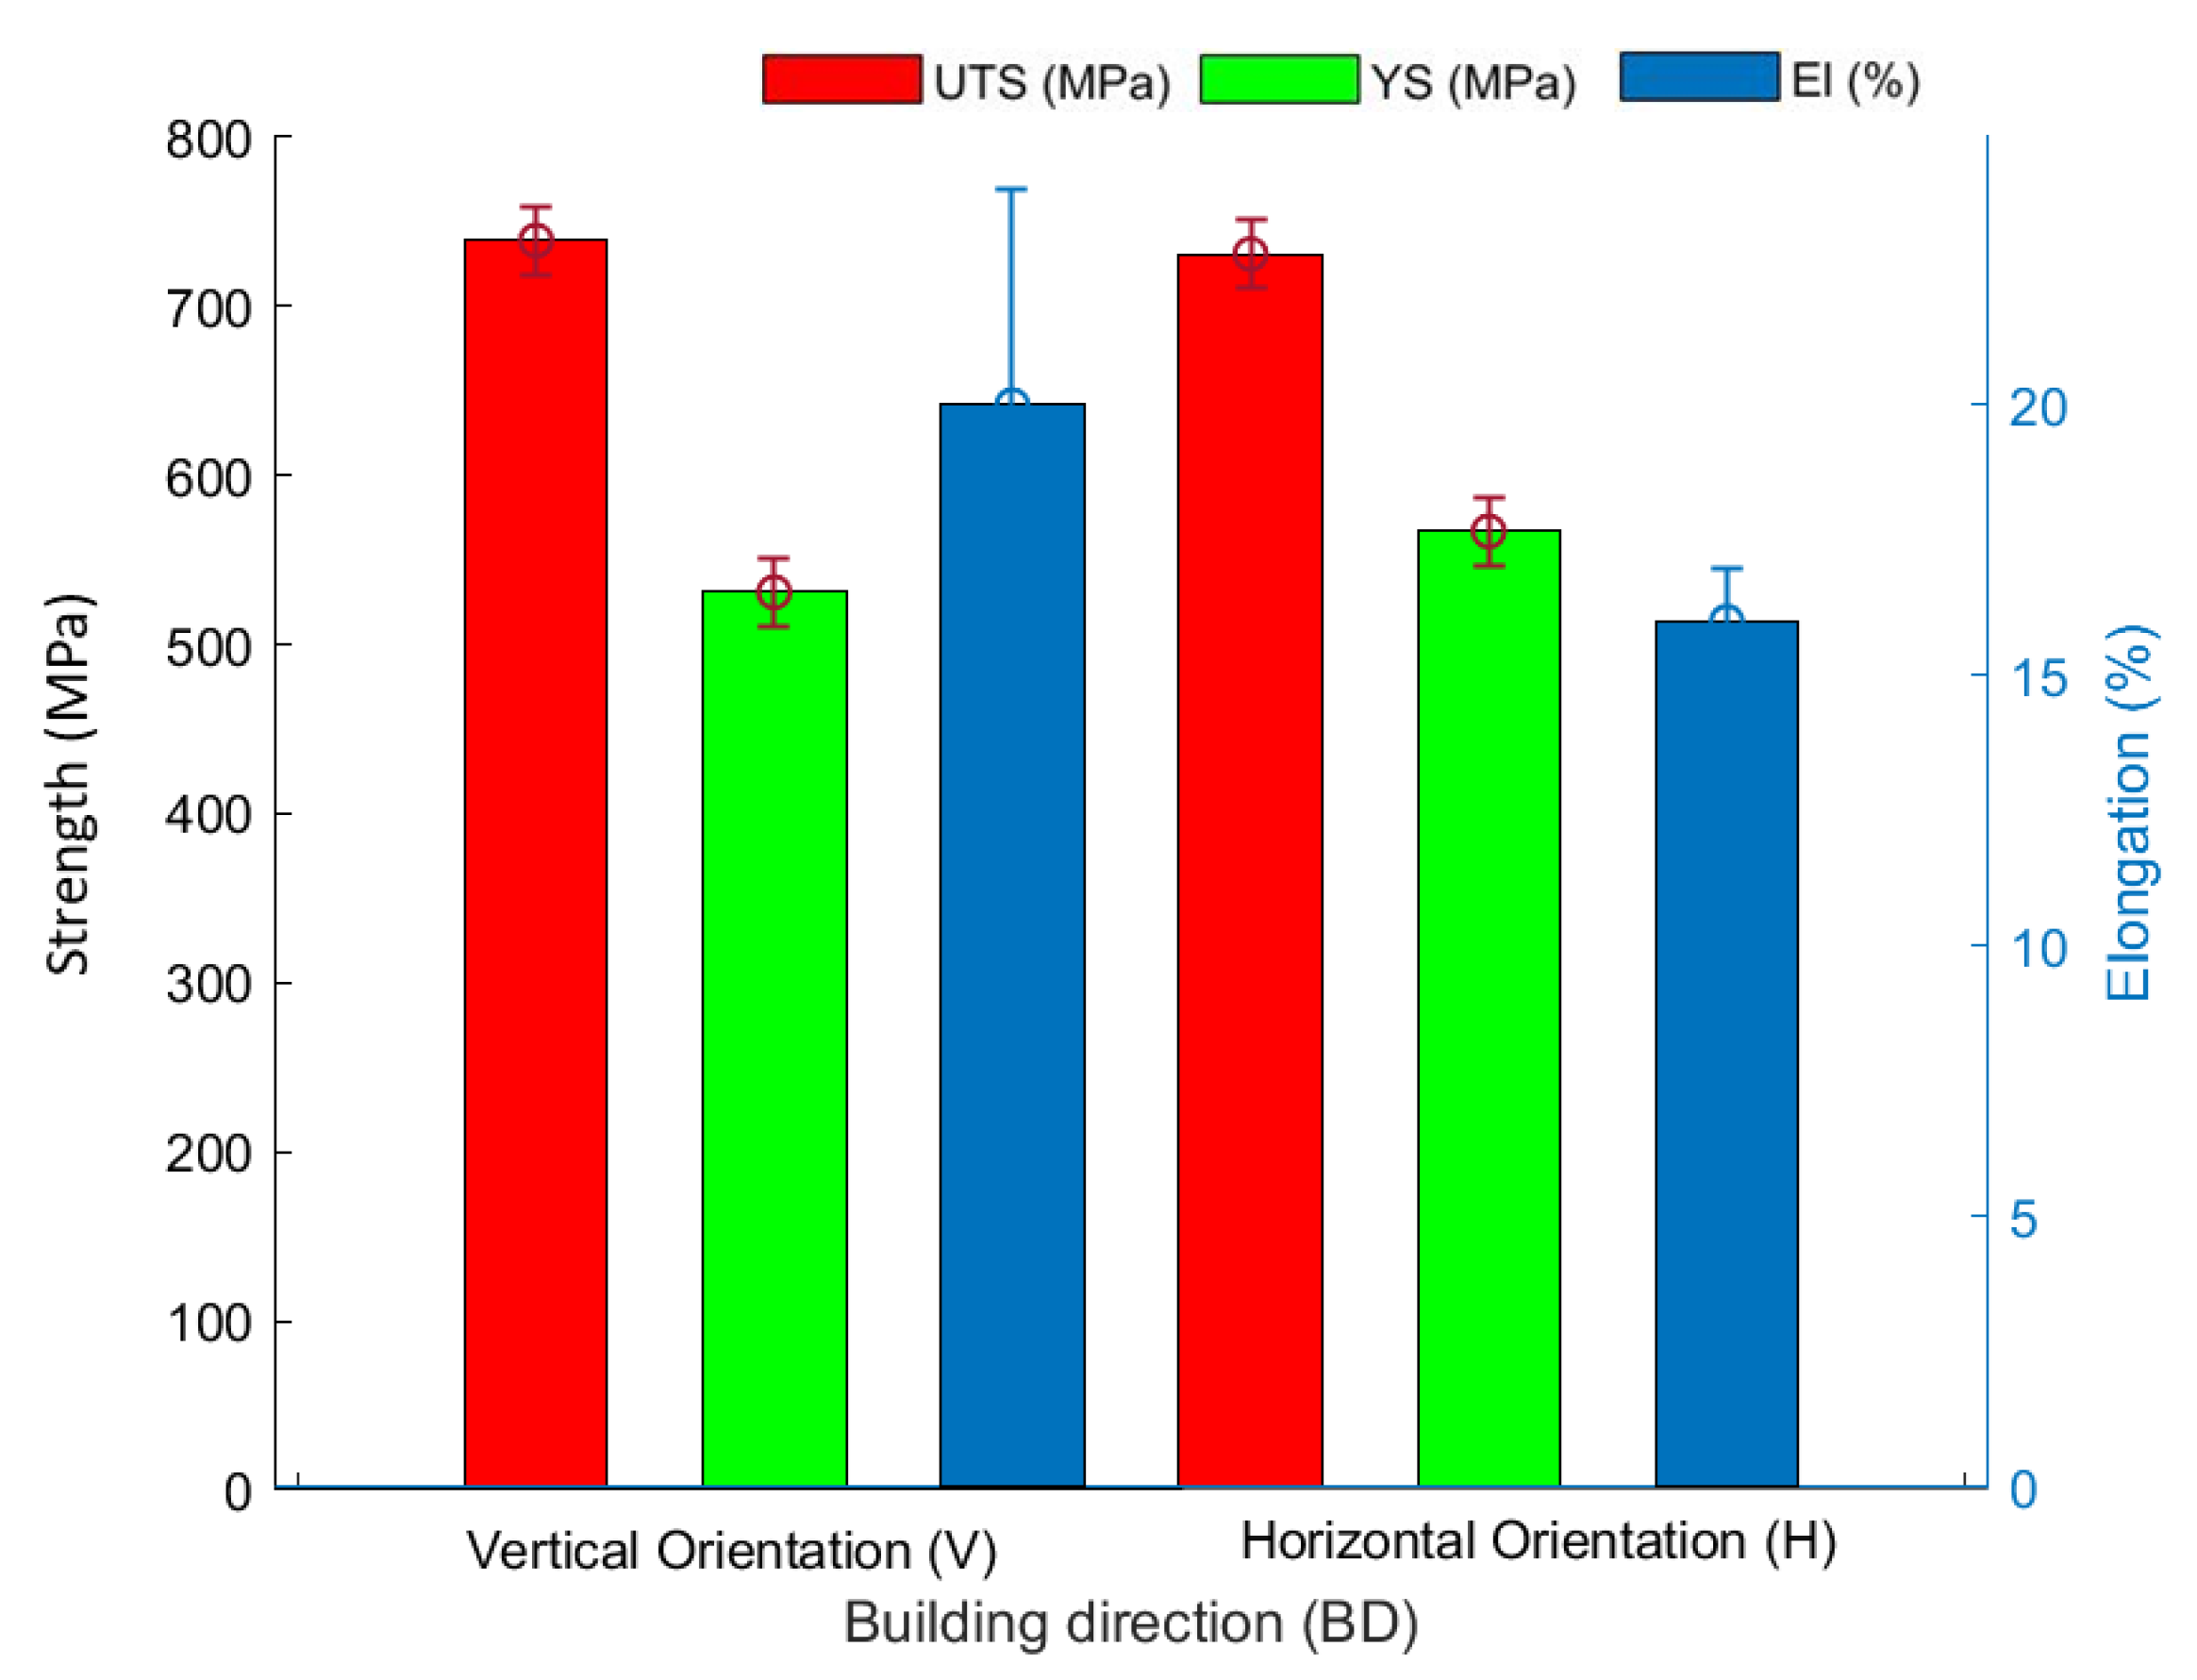
The microhardness of both as-built print sets (80 µm and 140 µm hatch distance) and that of as-cast sets were determined and compared. As illustrated by the bar chart in Figure 9, hatch distance variation did not significantly influence the microhardness of the as-built print sets as there was only a marginal difference in microhardness between the 80 µm (247 HV0.2) and 140 µm (244 HV0.2) hatch distance. However, the microhardness of both as-built print sets was far higher than the measured microhardness of as-cast (179 HV0.2). The higher microhardness recorded in the as-built print sets can be attributed to a combination of both the residual stresses build-up in the as-built condition and the finer microstructures of LPBF printed samples which enhance mechanical properties compared to conventional manufactured methods like casting [26,39]. Post heat treatment (PHT) performed on the as-built samples at 1000 °C for one hour saw the microhardness significantly reduced to 221 HV0.2 and 210 HV0.2 for both as-built print sets with 80 µm and 140 µm hatch distance. The loss in microhardness may be associated with the relief of stresses and the coarsening of the microstructure through PHT. Even after PHT, the LPBF print set recorded higher microhardness than the as-cast material. Figure 9 and Table 3 show a comparison of the microhardness at different printing conditions.

3.4.2. Tensile Test

Tensile tests, conducted at room temperature using a crosshead speed of 0.3 mm/min on six as-built tensile specimens (three built in the vertical and three built in the horizontal orientation) showed the existence of anisotropy in the different building orientations. From Figure 10, it was observed that there was only a marginal difference in the ultimate tensile strength (UTS) and the yield strength (YS) between specimens built in the vertical orientation and specimens built in the horizontal orientation. UTS and YS of the vertical orientation-built specimen were 739 MPa and 531 MPa, respectively, compared to 731 MPa and 567 MPa of horizontal orientation specimen. However, a significant difference in the percent elongation between specimens built in both orientations was observed in Figure 9. The vertical orientation-built specimen had a significantly higher elongation of 20% compared to 16% in the horizontal orientation-built specimen. The LPBF as-built specimens were far superior in UTS and YS compared to UTS (450 MPa) and YS (170 MPa) of as-cast material [40]. The elongation of both as-built specimens (vertical and horizontal orientation) fell short of elongation of the as-cast material (25%) [40]. From Table 4, post heat treatment of tensile specimens at 1000 °C for 1 h showed a deterioration of strength properties of the alloy. PHT specimens built in the vertical orientation recorded a UTS of 674 MPa, a 9% reduction compared to the as-built state. The YS also deteriorated by 23% (408 MPa) compared to the as-built state. Similarly, for horizontally built specimens, post heat treatment at 1000 °C for 1 h recorded a UTS of 665 MPa and YS of 417 MPa, representing a reduction of 9% and 26%, respectively, as compared to the as-built state.

4. Discussion

The attainment of a high relative density in LPBF depends on the ability to obtain the right process parameter combinations. The 80 µm hatch distance varied with scanning speed yielded a high relative density of 99.8% at 1000 mm/s scanning speed. However, when scanning speed increased to 1500 mm/s, cracks became pronounced. The cracks which are believed to be residual stress-induced cracks were, however, not seen when the hatch distance was increased to 140 µm and the scanning speed was comparatively reduced (550–850 mm/s). The role of scanning speed, as studied by various authors [23,26,41], is critical not only in determining the amount of volumetric energy density available for complete melting but also the magnitude of local residual stress build-up. Overly increased scanning speed results in insufficient interaction between laser beam and material because high scanning speed leads to reduced energy density available for complete melting, which would lead to lack of fusion defects. High scanning speeds also lead to a faster cooling rate which may generate cracks due to the high residual stress build-up as already explained. This is believed to have resulted in the cracks seen in Figure 3e,f.
No such defect was seen with an increase in hatch distance to 140 µm. This may be due to the comparatively lower scanning speed (550–850 mm/s) regime which gave sufficient beam–material interaction time to enhance good metallurgical bonding, not only between tracks but also with underlying layers. The lower scanning speed regime (550–850 mm/s) at the higher hatch distance (140 µm) may have generated considerable local residual stress which was low enough to avoid crack formation. The building of a highly dense sample of 99.8% relative density with a scanning speed of 850 mm/s was, therefore, possible at 140 µm hatch distance. Small spherical gas-induced porosity, as observed in both 80 µm and 140 µm hatch distances and described by various authors [22,42], takes its origin from the powder feedstock and from the in-process escape of elements and materials, which results in entrapped gases in the molten pool carried through to the as-built part. The elimination of this porosity can be achieved through the combination of the use of metallic powders of good packing density, good pre-process powder preparation, and highly optimized process parameters [43,44].
Samples of both as-built 80 µm and 140 µm hatch distance showed typical LPBF microstructures with defined melt pools oriented along the building direction. High epitaxial grain growth was observed in both microstructures. Epitaxial grain growth is formed from remelted areas as a result of multiple laser scans or the remelting of previous layers [44,45]. The LPBF technique generates fine microstructures owing to the high cooling rates. ECD grain size measurements by EBSD confirmed fine microstructures of ECD of 8.45 µm and 11.93 µm for the 80 µm and 140 µm hatch distance print sets, respectively. Higher hatch distances tend to generate slower cooling rates compared to smaller hatch distances which influences the grain morphology [46]. The grain size of the 140 µm hatch distance was, therefore, slightly bigger than the 80 µm hatch distance print set. As a result of the slow cooling rates of a typical conventional manufacturing process like casting, in the as-cast microstructure, undissolved and coarse NbC particles were detected with EDS/EBSD analysis, which were not detected in the as-built LPBF microstructure.
As expected, mechanical properties of as-built (HV0.2, UTS, YS) and PHT (HV0.2, UTS, YS, El) samples were generally superior to properties of the as-cast condition. The high microhardness observed in the as-built cubes, which is attributed to both the fine microstructure and residual stress build-up, was slightly reduced after a PHT at 1000 °C for 1 h mainly because of stress relief. The comparatively higher cooling rate of the 80 µm print set which accounted for its finer microstructure resulted in the slightly higher microhardness than in the 140 µm hatch distance print set. Anisotropy in LPBF built samples was severely investigated [39,47]; this was reflected in the tensile properties which were built in different orientations. The vertical orientation-built tensile specimen showed a higher UTS (739 MPa) and ductility (20 %), but lower YS (531 MPa). The horizontal orientation-built tensile specimen had a higher YS (567 MPa), but lower UTS (731 MPa) and El (16 %). The PHT tensile specimen instead had higher ductility in both orientations (V: El (31%) and H: El (25%)) than the as-built specimen but lower UTS (V—674 MPa, H—665 MPa) and YS (V—674 MPa, H—665 MPa). Due to the steep temperature gradient associated with the LPBF process, grain growth typically takes place in a directional manner usually along the building direction. The resulting microstructure and texture influence the mechanical anisotropy [48]. The disparity in the tensile properties may, therefore, have originated on the angle between the columnar oriented grains which were along the building direction and the tensile axis [49]. Stress relief through post heat treatment at 1000 °C for 60 min also significantly contributed to the increase in ductility at the expense of both yield and ultimate tensile stress when the as-built samples were heat-treated.

5. Conclusions

In this work, the LPBF processability of the nickel–copper-based alloy (G-NiCu30Nb/DIN 2.4365) was successfully demonstrated. After varying process parameters between scanning speed and hatch distance, highly dense cubes of relative density of 99.8% were built at both 80 µm and 140 µm hatch distances with scanning speeds of 1000 mm/s and 850 mm/s, respectively. No significant difference in microhardness was recorded for both as-built hatch distance print sets (247 HV0.2 for ys = 80 µm and 244 HV0.2 for ys = 140 µm). This was significantly higher than the as-cast microhardness of 179 HV0.2 of the same material. PHT resulted in a further drop in microhardness of the as-built cubes to 221 HV0.2 (80 µm ys) and 210 HV0.2 (140 µm ys) after 1000 °C for 1 h. Tensile properties of both vertical and horizontal orientation-built tensile specimens showed superior properties to as-cast specimens (UTS 450 MPa, YS 170 MPa, El 25%). The UTS of vertical orientation-built specimen was higher (739 MPa) than that of the horizontal orientation-built specimen (731 MPa) but recorded a lower YS (531 MPa) compared to the horizontal orientation-built specimen (567 MPa). Similarly, anisotropy was observed with regard to the elongation and the building orientation. Elongation was observed to be higher (20%) in the vertical orientation-built specimen than in the horizontal orientation-built specimen (16%). PHT deteriorated both the UTS (674 MPa—V orientation, 665 MPa—H orientation) and YS (408 MPa—V orientation, 417 MPa—H orientation) compared to the as-built condition but also recorded a higher elongation (31%—V orientation, 25% MPa—H orientation).
Epitaxial growth does not require sufficient nucleation energy for nucleus formation. In additive manufacturing, the growth of epitaxy is associated with remelted areas which typically arise from overlapping melt pools. This phenomenon which also occurs in single-phase alloys leads to the formation of columnar structures which introduces anisotropic properties. Columnar-oriented structures are by their nature coarser than equiaxed structures and may not be fit for use in multipronged stress applications compared to a preferred equiaxed or combination of columnar-equiaxed structures [50]. Further work, therefore, needs to be done to minimize the level of epitaxy to achieve equiaxed or columnar-equiaxed structure necessary for the production of reproducible AM parts with isotropic properties. This could be attained through the introduction of heterogeneous nucleation sites which act as grain refiners and the slowing of solidification speed through in situ heat treatment techniques for nuclei formation.
After successful LPBF processability, the G-NiCu30Nb alloy proved to be a good material candidate for AM fabricated components but, however, requires further research to understand and optimize the microstructure for enhanced mechanical properties. This study significantly opens the door for industrial applications of additively manufactured parts from the G-NiCu30Nb alloy after demonstrating successful LPBF processability. This means that not only does the G-NiCu30Nb alloy add up to the scope of AM applicable materials, but also that this Monel 400 variant, which according to this study shows very good mechanical properties via LPBF processing, presents itself as an alternative to the cast in the building of convoluted or complex geometrical parts and in the elimination of tooling cost.

Author Contributions

Conceptualization, I.R.; data curation, F.A.-K. and A.H.; investigation, F.A.-K. and A.H.; methodology, I.R.; project administration, I.R.; resources, E.W. and S.B.; supervision, I.R.; validation, U.V.; writing—original draft, I.R. and F.A.-K.; writing—review and editing, I.R., U.V., A.H., and A.B.-P. All authors have read and agreed to the published version of the manuscript.

Funding

This research received no external funding.

Conflicts of Interest

The authors declare no conflicts of interest.

References

  1. Lippold, J.C.; Kisser, S.D.; Dupont, J.N. Welding Metallurgy and Weldability of Nickel-Base Alloys; John Wiley & Sons: Hoboken, NJ, USA, 2011; p. 456. [Google Scholar]
  2. Esgin, U.; Özyürek, D.; Kaya, H. An investigation of wear behaviors of different Monel alloys produced by powder metallurgy. AIP Conf. Proc. 2016, 1727. [Google Scholar] [CrossRef] [Green Version]
  3. Xiaoping, Z.; Wenzhang, C. Experimental Research on Heating Performance of Monel K-500 Alloy. Adv. Mater. Res. 2012, 572, 273–277. [Google Scholar] [CrossRef]
  4. Kutz, M. Handbook of Materials Selection; John Wiley & Sons, Inc.: New York, NY, USA, 2002; pp. 237–241. [Google Scholar]
  5. Barsanescu, P.-D.; Leitoiu, B.; Goanta, V.; Cantemir, D.; Gherasim, S. Reduction of Residual Stresses Induced by Welding in Monel Alloy, Using Parallel Heat Welding. Int. J. Acad. 2011, 3, 335–339. [Google Scholar]
  6. Neenu, J.; Jobil, V. Study on Behavior of Steel, Monel and Inconel at Elevated Temperature. IJEDR 2015, 3, 327–331. [Google Scholar]
  7. Devendranath, R.K.; Arivazhagan, N.; Narayanan, S. Effect of filler materials on the performance of gas tungsten arc welded AISI 304 and Monel 400. Mater. Des. 2012, 40, 70–79. [Google Scholar] [CrossRef]
  8. Devendranath, R.K.; Arivazhagan, V.; Narayanan, S.; Mukund, N.; Arjun, M.; Raunak, K. Development of defect free Monel 400 welds for marine application. Adv. Mater. Res. 2012, 383–390, 4695. [Google Scholar] [CrossRef]
  9. Ventrella, V.A.; Berretta, J.R.; De-Rossi, W. Micro Welding of Ni-based Alloy Monel 400 Thin Foil by Pulsed Nd:YAG laser. Phys. Procedia 2011, 12, 347–354. [Google Scholar] [CrossRef] [Green Version]
  10. Kukliński, M.; Bartkowska, A.; Przestacki, D. Microstructure and selected properties of Monel 400 alloy after laser heat treatment and laser boriding using diode laser. Int. J. Adv. Manuf. Tech. 2018, 98, 3005–3017. [Google Scholar] [CrossRef] [Green Version]
  11. Bopp, C.; Santhanam, K. Corrosion Protection of Monel Alloy Coated with Graphene Quantum Dots Starts with a Surge. ChemEngineering 2019, 3, 80. [Google Scholar] [CrossRef] [Green Version]
  12. Himanshu, B.S. Surface roughness modeling of Ni -Co based alloy using RSM. Int. J. Emerg. Trends Res. 2016, 1, 29–39. [Google Scholar]
  13. Davis, J.R. Nickel, Cobalt, and Their Alloys, 1st ed.; ASM International: Novelty, OH, USA, 2000; pp. 294–295. [Google Scholar]
  14. Zils, R. Werkstoffe im Pumpenbau. Chem. Ing. Tech. 2008, 80. [Google Scholar] [CrossRef]
  15. Lee, F.T.; Major, J.F.; Samuel, F.H. Fracture Behaviour Of A112wt.%Si0.35wt.%Mg(O-O.O2)wt.%Sr Casting Alloys Under Fatigue Testing. Fatigue Fract. Eng. Mater. Struct. 1995, 18, 385–396. [Google Scholar] [CrossRef]
  16. Röhrig, K.E. Guss aus Hochkorrosionsbeständigen Nickel-Basislegirerungen. Available online: https://www.kug.bdguss.de/fileadmin/content/Publikationen-NormenRichtlinien/Guss_aus_hoch_korr.best._Nickelleg.pdf (accessed on 10 March 2020).
  17. Seifi, M.; Salem, A.; Beuth, J.; Harrysson, O.; Lewandowski, J.J. Overview of Materials Qualification Needs for Metal Additive Manufacturing. JOM 2016, 68. [Google Scholar] [CrossRef] [Green Version]
  18. Yap, C.Y.; Chua, C.K.; Dong, Z.L.; Liu, Z.H.; Zhang, D.Q.; Loh, L.E.; Sing, S.L. Review of selective laser melting: Materials and applications. Appl. Phys. Rev. 2015, 2, 041101. [Google Scholar] [CrossRef]
  19. Marenych, O.; Kostryzhev, A.; Shen, C.; Pan, Z.; Li, H.; Van Duin, S. Precipitation Strengthening in Ni–Cu Alloys Fabricated Using Wire Arc Additive Manufacturing Technology. Metals 2019, 9, 105. [Google Scholar] [CrossRef] [Green Version]
  20. Labudovic, M.; Hu, D.; Kovacevic, R. A three dimensional model for direct laser metal powder deposition and rapid prototyping. J. Mater. Sci. 2003, 38, 35–49. [Google Scholar] [CrossRef]
  21. Anderson, R.; Terrell, J.; Schneider, J.; Thompson, S.; Gradl, P. Characteristics of Bi-metallic Interfaces Formed during Direct Energy Deposition Additive Manufacturing Processing. Metall. Mater. Trans. B 2019, 50, 1921–1930. [Google Scholar] [CrossRef]
  22. Raffeis, I.; Adjei-Kyeremeh, F.; Vroomen, U.; Suwampinij, P.; Ewald, S.; Bührig-Polaczek, A. Investigation of the Lithium-Containing Aluminum Copper Alloy (AA2099) for the Laser Powder Bed Fusion Process [L-PBF]: Effects of Process Parameters on Cracks, Porosity, and Microhardness. JOM 2019, 71, 1543–1553. [Google Scholar] [CrossRef]
  23. Mugwagwa, L.; Yadroitsev, I.; Matope, S. Effect of Process Parameters on Residual Stresses, Distortions, and Porosity in Selective Laser Melting of Maraging Steel 300. Metals 2019, 9, 1042. [Google Scholar] [CrossRef] [Green Version]
  24. Mercelis, P.; Kruth, J.P. Residual stresses in selective laser sintering and selective laser melting. Rapid Prototyp. 2006, 12, 265. [Google Scholar] [CrossRef]
  25. Nguejioa, J.; Szmytkaa, F.; Hallaisb, S.; Tanguyb, A.; Nardonec, S.; Godino Martinezc, M. Comparison of microstructure features and mechanical properties for additive manufactured and wrought nickel alloys 625. Mater. Sci. Eng. A 2019, 764, 138214. [Google Scholar] [CrossRef]
  26. Pourbabak, S.; Montero-Sistiaga, M.L.; Schryvers, V.; Van Humbeeck, J.; Vanmeensel, K. Microscopic investigation of as built and hot isostatic pressed Hastelloy X processed by Selective Laser Melting. Mater. Charact. 2019, 153. [Google Scholar] [CrossRef]
  27. Raghavana, S.; Baicheng, Z.; Pei, W.; Chen-Nan, S.; Mui, L.S.N.; Tao, L.; Jun, W. Effect of different heat treatments on the microstructure and mechanical properties in selective laser melted INCONEL 718 alloy. Mater. Manuf. Process. 2016. [Google Scholar] [CrossRef]
  28. Li, C.; White, R.; Fang, X.Y.; Weaver, M.Y.; Guo, B. Microstructure Evolution Characteristics of Inconel 625 Alloy from Selective Laser Melting to Heat Treatment. Mater. Sci. Eng. A 2017. [Google Scholar] [CrossRef]
  29. Kulkarni, A. Additive Manufacturing of Nickel Based Superalloys. arXiv 2018, arXiv:1805.11664. [Google Scholar]
  30. Aminipour, N.; Derakhshandeh-Haghighi, R. The Effect of Weld Metal Composition on Microstructural and Mechanical Properties of Dissimilar Welds between Monel 400 and Inconel 600. J. Mater. Eng. Perform. 2019, 28, 6111. [Google Scholar] [CrossRef]
  31. Debidutta, M.; Vignesh, M.K.; Ganesh, R.B.; Pruthvi, S.; Devendranath, K.R.; Arivazhagan, N.; Narayanan, S. Mechanical Characterization of Monel 400 and 316 Stainless Steel Weldments. Procedia Eng. 2014, 75, 24–28. [Google Scholar]
  32. Chlebus, E.; Grubern, K.; Kuźnicka, B.; Kurzac, J.; Kurzynowski, T. Effect of heat treatment on the microstructure and mechanical properties of Inconel 718 processed by selective laser melting. Mater. Sci. Eng. A 2015, 639, 647–655. [Google Scholar] [CrossRef]
  33. McLouth, T.D.; Witkin, D.B.; Bean, G.E.; Sitzman, S.D.; Adams, P.M.; Lohser, J.R.; Yang, J.-M.; Zaldivar, R.J. Variations in ambient and elevated temperature mechanical behavior of IN718 manufactured by selective laser melting via process parameter control. Mater. Sci. Eng. A 2020, 780, 139–184. [Google Scholar] [CrossRef]
  34. Marchese, G.; Garmendia, X.C.; Calignano, F.; Lorusso, M.; Biamino, S.; Minetola, P.; Manfredi, D. Characterization and Comparison of Inconel 625 Processed by Selective Laser Melting and Laser Metal Deposition. Adv. Eng. Mater. 2017, 19. [Google Scholar] [CrossRef]
  35. Yan, F.; Xiong, W.; Faierson, E.J. Grain Structure Control of Additively Manufactured Metallic Materials. Materials 2017, 10, 1260. [Google Scholar] [CrossRef] [Green Version]
  36. Seede, R.; Mostafa, A.; Brailovski, V.; Jahazi, M.; Medraj, M. Microstructural and Microhardness Evolution from Homogenization and Hot Isostatic Pressing on Selective Laser Melted Inconel 718: Structure, Texture, and Phases. J. Manuf. Mater. Process. 2018, 2, 30. [Google Scholar] [CrossRef] [Green Version]
  37. Brandt, M.; Sun, S.; Leary, M.; Feih, S.; Elambasseril, J.; Liu, Q. High-Value SLM Aerospace Components: From Design to Manufacture. Adv. Mater. Res. 2013, 147, 633. [Google Scholar] [CrossRef]
  38. Shifeng, W.; Shuai, L.; Qingsong, W.; Yan, C.; Sheng, Z.; Yusheng, S. Effect of molten pool boundaries on the mechanical properties of selective laser melting parts. J. Mater. Process. Technol. 2014, 214, 2660–2667. [Google Scholar] [CrossRef]
  39. Dong, Z.; Liu, Y.; Wen, W.; Ge, J.; Liang, J. Effect of Hatch Spacing on Melt Pool and As-built Quality During Selective Laser Melting of Stainless Steel: Modeling and Experimental Approaches. Materials 2019, 12, 50. [Google Scholar] [CrossRef] [PubMed] [Green Version]
  40. Sun, S.; Brandt, M.; Easton, M. Powder Bed Fusion Processes: An Overview, Laser Additive Manufacturing-Materials, Design, Technologies, and Applications; Centre for Additive Manufacturing: Melbourne, Australia, 2017; pp. 55–77. [Google Scholar]
  41. Hanzl, P.; Zetek, M.; Bakša, T.; Kroupa, T. The Influence of Processing Parameters on the Mechanical Properties of SLM. Parts Procedia Eng. 2015, 100, 1405–1413. [Google Scholar] [CrossRef] [Green Version]
  42. Zhang, B.; Li, Y.; Bai, Q. Defect Formation Mechanisms in Selective Laser Melting: A Review. Chin. J. Mech. Eng. 2017, 30, 515–527. [Google Scholar] [CrossRef] [Green Version]
  43. Kasperovich, G.; Haubrich, J.; Gussone, J.; Requena, G. Correlation between porosity and processing parameters in TiAl6V4 produced by selective laser melting. Mater. Des. 2016, 105, 160–170. [Google Scholar] [CrossRef] [Green Version]
  44. Strondl, A.; Lyckfeldt, O.; Brodin, H.; Ackelid, U. Characterization and Control of Powder Properties for Additive Manufacturing. JOM 2015, 67. [Google Scholar] [CrossRef]
  45. Casati, R.; Lemke, J.; Vedani, M. Microstructure and fracture behavior of 316L austenitic stainless steel produced by selective laser melting. J. Mater. Sci. Technol. 2016, 32, 738–744. [Google Scholar] [CrossRef]
  46. Carter, L.N.; Martin, C.; Withers, P.J.; Attallah, M.M. The influence of the laser scan strategy on grain structure and cracking behaviour in SLM powder-bed fabricated nickel superalloy. J. Alloys Compd. 2014, 615, 338–347. [Google Scholar] [CrossRef]
  47. Kunze, K.; Etter, T.; Grässlinc, J.; Shklover, V. Texture, anisotropy in microstructure and mechanical propertiesof IN738LC alloy processed by selective laser melting (SLM). Mater. Sci. Eng. A 2014, 620, 213–222. [Google Scholar] [CrossRef]
  48. Deev, A.A.; Kuznetcov, P.A.; Petrov, S.N. Anisotropy of Mechanical properties and its correlation with the structure of the stainless steel 316L produced by SLM Method. Phys. Procedia 2016, 83, 789–796. [Google Scholar] [CrossRef] [Green Version]
  49. Etter, T.; Kunze, K.; Geiger, F.; Meidani, H. Reduction in mechanical anisotropy through high temperature heat treatment of Hastelloy Xprocessed by Selective Laser Melting (SLM). IOP Conf. Ser. Mater. Sci. Eng. 2015, 82, 012097. [Google Scholar] [CrossRef]
  50. DebRoy, T.; Wei, H.L.; Zuback, J.S.; Mukherjee, T. Additive manufacturing of metallic components–process, structure and properties. Prog. Mater. 2018, 92, 112–224. [Google Scholar] [CrossRef]
Figure 1. SEM micrographs: (a) morphology of the gas atomized G-NiCu30Nb (DIN 2.4365) powder; (b) etched powder particle revealing dendrite structures.
Applsci 10 03401 g001
Figure 2. Light optical microscope (LOM) micrographs showing two different hatch distances with scanning speed variation at constant laser power (200 W) and layer thickness (30 µm) for unetched as-built cubes; the highest relative density of 99.8% was recorded at 1000 mm/s and 850 mm/s.
Applsci 10 03401 g002
Figure 3. (ac) Dense 80 µm hatch distance cube (etched and unetched) built at 1000 mm/s; (df) 80 µm hatch distance cube (etched and unetched) built at 1500 mm/s showing a high number of cracks.
Applsci 10 03401 g003
Figure 4. LOM micrographs of 140 µm hatch distance print set: (a) unetched, dense as-built cube (scanning speed 550 mm/s); (b,c) etched with CuCl2 showing epitaxial growth and columnar grain formation; (d) unetched, dense as-built cube (scanning speed 850 mm/s); (e,f) etched with CuCl2 also showing epitaxial growth and columnar grain formation.
Applsci 10 03401 g004
Figure 5. SEM micrographs of as-built laser powder bed fusion (LPBF) samples at 140 µm (Ys): at 550 mm/s (a) showing discontinuity in epitaxial growth; (b) combination of both epitaxial and cellular dendritic structures; at 850 mm/s (c), (d) different subgrain orientations at higher magnification.
Applsci 10 03401 g005
Figure 6. LOM: (a,b) LOM of unetched as-cast samples showing randomly dispersed NbC particles; SEM/energy-dispersive spectroscopy (EDS): (c) EDS quantitative measurements of NbC particles in as-cast sample.
Applsci 10 03401 g006
Figure 7. EDS mapping showing coarse NbC particles in an as-cast sample.
Applsci 10 03401 g007
Figure 8. Inverse pole figures of as-built samples: (a) 80 µm hatch distance; (b) 140 µm hatch distance showing columnar orientation along the building direction.
Applsci 10 03401 g008
Figure 9. Microhardness of as-built, post heat treated (PHT), and as-cast material compared.
Applsci 10 03401 g009
Figure 10. Tensile properties of as-built specimens (ys: 140 µm, Vs: 850 mm/s) shown in both horizontal and vertical orientations by stress–strain diagram and bar chart highlighting anisotropy in different building orientations.
Applsci 10 03401 g010
Table 1. Nominal composition (wt.%) of the cast and gas atomized powder.
Material: G-NiCu30NbNominal Composition (wt.%)
NiCuNbFeMn SiAl
Cast60.2531.282.873.281.001.380.10
Gas atomized powder59.3929.893.873.680.991.650.53
Table 2. Process parameters and the respective relative densities of the as-built cubes shown in Figure 2.
SampleLaser Power
(W)
Layer Thickness
(µm)
Scanning Speed
(mm/s)
Hatch Distance
(µm)
Relative Density (%)
2a20030100080 99.80
2b20030120080 99.72
2c20030140080 99.63
2d20030150080 99.70
2e2003055014099.78
2f2003065014099.77
2g2003075014099.71
2h2003085014099.80
Table 3. Comparison of microhardness of as-cast, as-built, and as-built + PHT cubes.
Material: G-NiCu30NbHV0.2
As-Cast179
LPBF as-built cube (ys =80 µm)247
LPBF as-built + PHT (ys = 80 µm)221
LPBF as-built cube (ys = 140 µm)244
LPBF as-built + PHT (ys = 140 µm)210
Table 4. Summary of compared tensile properties.
Material: G-NiCu30Nb
UTS (MPa)YS (MPa)El (%)
As-Cast [16]45017025
LPBF as-built (V) at r.t.p73953120
LPBF as-built (H) at r.t.p73156716
LPBF as-built + PHT (V)67440831
LPBF as-built + PHT (H)66541725
As-built process parameters (tensile specimens): laser power (Lp)—200 W, layer thickness (Ds)—30 µm, hatch distance (ys)—140 µm, scanning speed (Vs)—850 mm/s; r.t.p—room temperature; PHT—post heat treatment at 1000 °C, 1 h; V—vertical orientation-built specimen; H—horizontal orientation-built specimen.

