An ANN-Based Approach for Prediction of Sufficient Seismic Gap between Adjacent Buildings Prone to Earthquake-Induced Pounding

 , ,
, ,
Abstract
:1. Introduction
- -
- Canada: sum of individual peak lateral displacements of structures calculated by elastic analyses;
- -
- Turkey: 3 cm for 6 m of height of the building, and 1 cm should be added for every 3 m of height;
- -
- Australia: more than 1% of the height of the structure;
- -
- Serbia: min. 3 cm and should be increased by 1 cm for every 3 m of the height of the building;
- -
- Peru: 3 + 0.004·(h − 500) cm;
- -
- India: R times the sum of the calculated peak lateral displacements of the structures;
- -
- Egypt: 2 times the sum of the peak displacements of the structures or 0.004 times the height of the building.
2. Materials and Methods
3. Results
4. Verification
5. Validation
6. Parametric Analysis
7. Concluding Remarks
Author Contributions
Funding
Conflicts of Interest
References
- Anagnostopoulos, S.A. Pounding of building in series during earthquakes. Earthq. Eng. Struct. Dyn. 1988, 16, 443–456. [Google Scholar] [CrossRef]
- Miari, M.; Choong, K.K.; Jankowski, R. Seismic pounding between adjacent buildings: Identification of parameters, soil interaction issues and mitigation measures. Soil Dyn. Earthq. Eng. 2019, 121, 135–150. [Google Scholar] [CrossRef]
- Jankowski, R. Pounding between superstructure segments in multi-supported elevated bridge with three-span continuous deck under 3D non-uniform earthquake excitation. J. Earthq. Tsunami 2015, 9, 1550012. [Google Scholar] [CrossRef]
- Rahman, A.M.; Carr, A.J.; Moss, P.J. Structural pounding of adjacent multi-storey structures considering soil flexibility effects. In Proceedings of the 12th World Conference on Earthquake Engineering, Auckland, New Zealand, 30 January–4 February 2000. [Google Scholar]
- Favvata, M.J. Minimum required separation gap for adjacent RC frames with potential inter-story seismic pounding. Eng. Struct. 2017, 152, 643–659. [Google Scholar] [CrossRef]
- Khatami, S.M.; Naderpour, H.; Barros, R.C.; Jakubczyk-Gałczyńska, A.; Jankowski, R. Effective formula for impact damping ratio for simulation of earthquake-induced structural pounding. Geosciences 2019, 9, 347. [Google Scholar] [CrossRef] [Green Version]
- Favvata, M.J.; Karayannis, C.G.; Liolios, A.A. Influence of exterior joint effect on the inter-story pounding interaction of structures. J. Struct. Eng. Mech. 2009, 33, 113–136. [Google Scholar] [CrossRef]
- Sołtysik, B.; Jankowski, R. Non-linear strain rate analysis of earthquake-induced pounding between steel buildings. Int. J. Earth Sci. Eng. 2013, 6, 429–433. [Google Scholar]
- Elwardany, H.; Seleemah, A.; Jankowski, R. Seismic pounding behavior of multi-story buildings in series considering the effect of infill panels. Eng. Struct. 2017, 144, 139–150. [Google Scholar] [CrossRef]
- Abdel Raheem, S.E.; Fooly, M.Y.M.; Abdel Shafy, A.G.A.; Abbas, Y.A.; Omar, M.; Abdel Latif, M.M.S.; Mahmoud, S. Seismic pounding effects on adjacent buildings in series with different alignment configurations. Steel Compos. Struct. 2018, 28, 289–308. [Google Scholar]
- Elwardany, H.; Seleemah, A.; Jankowski, R.; El-Khoriby, S. Influence of soil-structure interaction on seismic pounding between steel frame buildings considering the effect of infill panels. Bull. Earthq. Eng. 2019, 17, 6165–6202. [Google Scholar] [CrossRef] [Green Version]
- Khatami, S.M.; Naderpour, H.; Barros, R.C.; Jakubczyk-Gałczyńska, A.; Jankowski, R. Determination of peak impact force for buildings exposed to structural pounding during earthquakes. Geosciences 2020, 10, 18. [Google Scholar] [CrossRef] [Green Version]
- Rosenblueth, E.; Meli, R. The 1985 earthquake: Causes and effects in Mexico City. Concr. Int. 1986, 8, 23–34. [Google Scholar]
- Anagnostopoulos, S.A. Earthquake induced pounding: State of the art. In Proceedings of the 10th European Conference on Earthquake Engineering, Vienna, Austria, 28 August–2 September 1994; pp. 897–905. [Google Scholar]
- Kasai, K.; Maison, B.F. Building pounding damage during the 1989 Loma Prieta earthquake. Eng. Struct. 1997, 19, 195–207. [Google Scholar] [CrossRef]
- International Code Council Inc. IBC: International Building Code; International Code Council Inc.: Country Club Hills, IL, USA, 2009. [Google Scholar]
- European Committee for Standardization. Eurocode 8: Design of Structures for Earthquake Resistance; European Committee for Standardization: Brussels, Belgium, 2003. [Google Scholar]
- Building & Housing Research Center. Iranian Code of Practice for Seismic Resistant Design of Buildings (Standard 2800—4th Edition); Permanent Committee of Revising the Code of Practice for Seismic Resistant Design of Buildings, BHR: Tehran, Iran, 2017; p. 94. [Google Scholar]
- Jeng, V.; Kasai, K.; Maison, B.F. A spectral difference method to estimate building separations to avoid pounding. Earthq. Spectra 1992, 8, 201–223. [Google Scholar] [CrossRef]
- Filiatrault, A.; Wagner, P.; Cherry, S. Analytical prediction of experimental building pounding. Earthq. Eng. Struct. Dyn. 1995, 24, 1131–1154. [Google Scholar] [CrossRef]
- Naderpour, H.; Barros, R.C.; Khatami, S.M. Prediction of critical distance between two MDOF systems subjected to seismic excitation in terms of artificial neural networks. Period. Polytech. Civ. Eng. 2017, 61, 516–529. [Google Scholar] [CrossRef] [Green Version]
- Der Kiureghian, A. A response spectrum method for random vibration analysis of MDF systems. Earthq. Eng. Struct. Dyn. 1981, 9, 419–435. [Google Scholar] [CrossRef]
- Penzien, J. Evaluation of building separation gap required to prevent pounding during strong earthquakes. Earthq. Eng. Struct. Dyn. 1997, 26, 849–858. [Google Scholar] [CrossRef]
- Garcia, D.L. Separation between adjacent non-linear structures for prevention of seismic pounding. In Proceedings of the 13th World Conference on Earthquake Engineering, Vancouver, BC, Canada, 1–6 August 2004. [Google Scholar]
- Kasai, K.; Jagiasi, A.R.; Jeng, V. Inelastic vibration phase theory for seismic pounding mitigation. J. Struct. Eng. 1996, 122, 1136–1146. [Google Scholar] [CrossRef]
- Lopez-Garcia, D.; Soong, T.T. Evaluation of current criteria in predicting the separation necessary to prevent seismic pounding between nonlinear hysteretic structural systems. Eng. Struct. 2009, 31, 1217–1229. [Google Scholar] [CrossRef]
- Zhang, W.S.; Xu, Y.L. Dynamic characteristics and seismic response of adjacent buildings linked by discrete dampers. Earthq. Eng. Struct. Dyn. 1999, 28, 1163–1185. [Google Scholar] [CrossRef]
- Matsagar, V.A.; Jangid, R.S. Viscoelastic damper connected to adjacent structures involving seismic isolation. J. Civ. Eng. Manag. 2005, 11, 309–322. [Google Scholar] [CrossRef]
- Polycarpou, P.C.; Komodromos, P. Numerical investigation of potential mitigation measures for pounding of seismically isolated building. Earthq. Struct. 2011, 2, 1–24. [Google Scholar] [CrossRef]
- Raheem, S.E.A. Mitigation measures for earthquake induced pounding effects on seismic performance of adjacent buildings. Bull. Earthq. Eng. 2014, 12, 1705–1724. [Google Scholar] [CrossRef]
- Khatami, S.M.; Naderpour, H.; Razavi, S.M.N.; Barros, R.C.; Jakubczyk-Gałczyńska, A.; Jankowski, R. Study on methods to control interstory deflections. Geosciences 2020, 10, 75. [Google Scholar] [CrossRef] [Green Version]
- Anajafi, H.; Ghomi-Gharaei, A.; Ghorbani-Tanha, A.K. The effect of soil-structure-foundation interaction on lateral structural displacement and comparison with design code requirements. In Proceedings of the SE-50EEE International Conference on Earthquake Engineering, Skopje, Macedonia, 29–31 May 2013. [Google Scholar]
- Jeng, V.; Tzeng, W.L. Assessment of seismic pounding hazard for Taipei City. Eng. Struct. 2000, 22, 459–471. [Google Scholar] [CrossRef]
- Bazan, E.; Bielak, J. Earthquake response of nonlinear building-foundation systems. Dev. Geotech. Eng. 1987, 43, 13–24. [Google Scholar]
- Ghomi-Gharaei, A.; Anajafi, H.; Ghorbani-Tanha, A.K. Comparison of footing design codes criteria and foundation effects on structural seismic behavior. In Proceedings of the 4th International Conference on Concrete and Development, Tehran, Iran, 29 April–1 May 2013. [Google Scholar]
- Anajafi, H.; Medina, R.A. Lessons learned from evaluating the responses of instrumented buildings in the United States: The effects of supporting building characteristics on floor response spectra. Earthq. Spectra 2019, 35, 159–191. [Google Scholar] [CrossRef]
- Goetz, T. The Decision Tree: How to Make Better Choices and Take Control of Your Health; Rodale Books: Emmaus, PA, USA, 2010. [Google Scholar]
- Schmidt, V. Stochastic Geometry, Spatial Statistics and Random Fields: Models and Algorithms; Springer: Berlin/Heidelberg, Germany, 2015. [Google Scholar]
- Jankowski, R.; Walukiewicz, H. Modeling of two-dimensional random fields. Probabilistic Eng. Mech. 1997, 12, 115–121. [Google Scholar] [CrossRef]
- Siemaszko, A.; Jakubczyk-Gałczyńska, A.; Jankowski, R. The idea of using Bayesian networks in forecasting impact of traffic-induced vibrations transmitted through the ground on residential buildings. Geosciences 2019, 9, 339. [Google Scholar] [CrossRef] [Green Version]
- Rojas, R. Neural Networks: A Systematic Introduction; Springer Science & Business Media: Berlin/Heidelberg, Germany, 2013. [Google Scholar]
- Hüsken, M.; Jin, Y.; Sendhoff, B. Structure optimization of neural networks for evolutionary design optimization. Soft Comput. 2005, 9, 21–28. [Google Scholar] [CrossRef] [Green Version]
- Naderpour, H.; Kheyroddin, A.; Amiri, G.G. Prediction of FRP-confined compressive strength of concrete using artificial neural networks. Compos. Struct. 2010, 92, 2817–2829. [Google Scholar] [CrossRef]
- Naderpour, H.; Rafiean, A.H.; Fakharian, P. Compressive strength prediction of environmentally friendly concrete using artificial neural networks. J. Build. Eng. 2018, 16, 213–219. [Google Scholar] [CrossRef]
- Ahmadi, M.; Naderpour, H.; Kheyroddin, A. Utilization of artificial neural networks to prediction of the capacity of CCFT short columns subject to short term axial load. Arch. Civ. Mech. Eng. 2014, 14, 510–517. [Google Scholar] [CrossRef]
- Naderpour, H.; Nagai, K.; Fakharian, P.; Haji, M. Innovative models for prediction of compressive strength of FRP-confined circular reinforced concrete columns using soft computing methods. Compos. Struct. 2019, 215, 69–84. [Google Scholar] [CrossRef]
- Kamgar, R.; Naderpour, H.; Komeleh, H.E.; Jakubczyk-Gałczyńska, A.; Jankowski, R. A proposed soft computing model for ultimate strength estimation of FRP-confined concrete cylinders. Appl. Sci. 2020, 10, 1769. [Google Scholar] [CrossRef] [Green Version]
- Chenouda, M.; Ayoub, A. Inelastic displacement ratios of degrading systems. J. Struct. Eng. 2008, 134, 1030–1045. [Google Scholar] [CrossRef]
- Chopra, A.K.; Chintanapakdee, C. Inelastic deformation ratios for design and evaluation of structures: Single-degree-of-freedom bilinear systems. J. Struct. Eng. 2004, 130, 1309–1319. [Google Scholar] [CrossRef]
- Iervolino, I.; Chioccarelli, E.; Baltzopoulos, G. Inelastic displacement ratio of near-source pulse-like ground motions. Earthq. Eng. Struct. Dyn. 2012, 41, 2351–2357. [Google Scholar] [CrossRef]
- Anajafi, H.; Poursadr, K.; Roohi, M.; Santini-Bell, E. Effectiveness of seismic isolation for long-period structures subject to far-field and near-field excitations. Front. Built Env. 2020, 6, 24. [Google Scholar] [CrossRef]
- Léger, P.; Dussault, S. Seismic-energy dissipation in MDOF structures. J. Struct. Eng. 1992, 118, 1251–1269. [Google Scholar] [CrossRef]
- Anajafi, H.; Medina, R.A.; Santini-Bell, E. Effects of the improper modeling of viscous damping on the first-mode and higher-mode dominated responses of base-isolated buildings. Earthq. Eng. Struct. Dyn. 2020, 49, 51–73. [Google Scholar] [CrossRef]
- Charney, F.A. Unintended consequences of modeling damping in structures. J. Struct. Eng. 2008, 134, 581–592. [Google Scholar] [CrossRef]
- Chopra, A.K.; McKenna, F. Modeling viscous damping in nonlinear response history analysis of buildings for earthquake excitation. Earthq. Eng. Struct. Dyn. 2016, 45, 193–211. [Google Scholar] [CrossRef]
- Jankowski, R. Non-linear FEM analysis of pounding-involved response of buildings under non-uniform earthquake excitation. Eng. Struct. 2012, 37, 99–105. [Google Scholar] [CrossRef]
- Burkacki, D.; Wójcik, M.; Jankowski, R. Numerical investigation on behaviour of cylindrical steel tanks during mining tremors and moderate earthquakes. Earthq. Struct. 2020, 18, 97–111. [Google Scholar]
- Der Kiureghian, A. A coherency model for spatially varying ground motions. Earthq. Eng. Struct. Dyn. 1996, 25, 99–111. [Google Scholar] [CrossRef]


| Earthquake | Date | Magnitude | Station | PGA (cm/s2) |
|---|---|---|---|---|
| Tabas | 1978 | 7.4 | Tabas | 821 |
| Imperial Valley | 1979 | 6.5 | Calexico | 284 |
| Loma Prieta | 1989 | 6.9 | Presidio | 360 |
| Landers | 1992 | 7.3 | Baker | 765 |
| Kobe | 1995 | 7.2 | JMA | 338 |
| Kocaeli | 1999 | 7.6 | Sakarya | 369 |
| Building | Imperial Valley | Kobe | Loma Prieta | Kocaeli | Landers | Tabas |
|---|---|---|---|---|---|---|
| Single-story | 10.25 | 5.66 | 15.1 | 18.63 | 20.86 | 20.67 |
| Two-story | 14.15 | 14.11 | 31.9 | 39.58 | 44.83 | 38.72 |
| Three-story | 26.62 | 10.32 | 32.1 | 55.1 | 60.65 | 38.95 |
| Four-story | 38.06 | 15 | 40.24 | 56.4 | 50.94 | 77.81 |
| Five-story | 43.57 | 8.8 | 40 | 23.73 | 22.87 | 57.52 |
| Six-story | 33.52 | 16.85 | 50.5 | 27.67 | 30.74 | 43.51 |
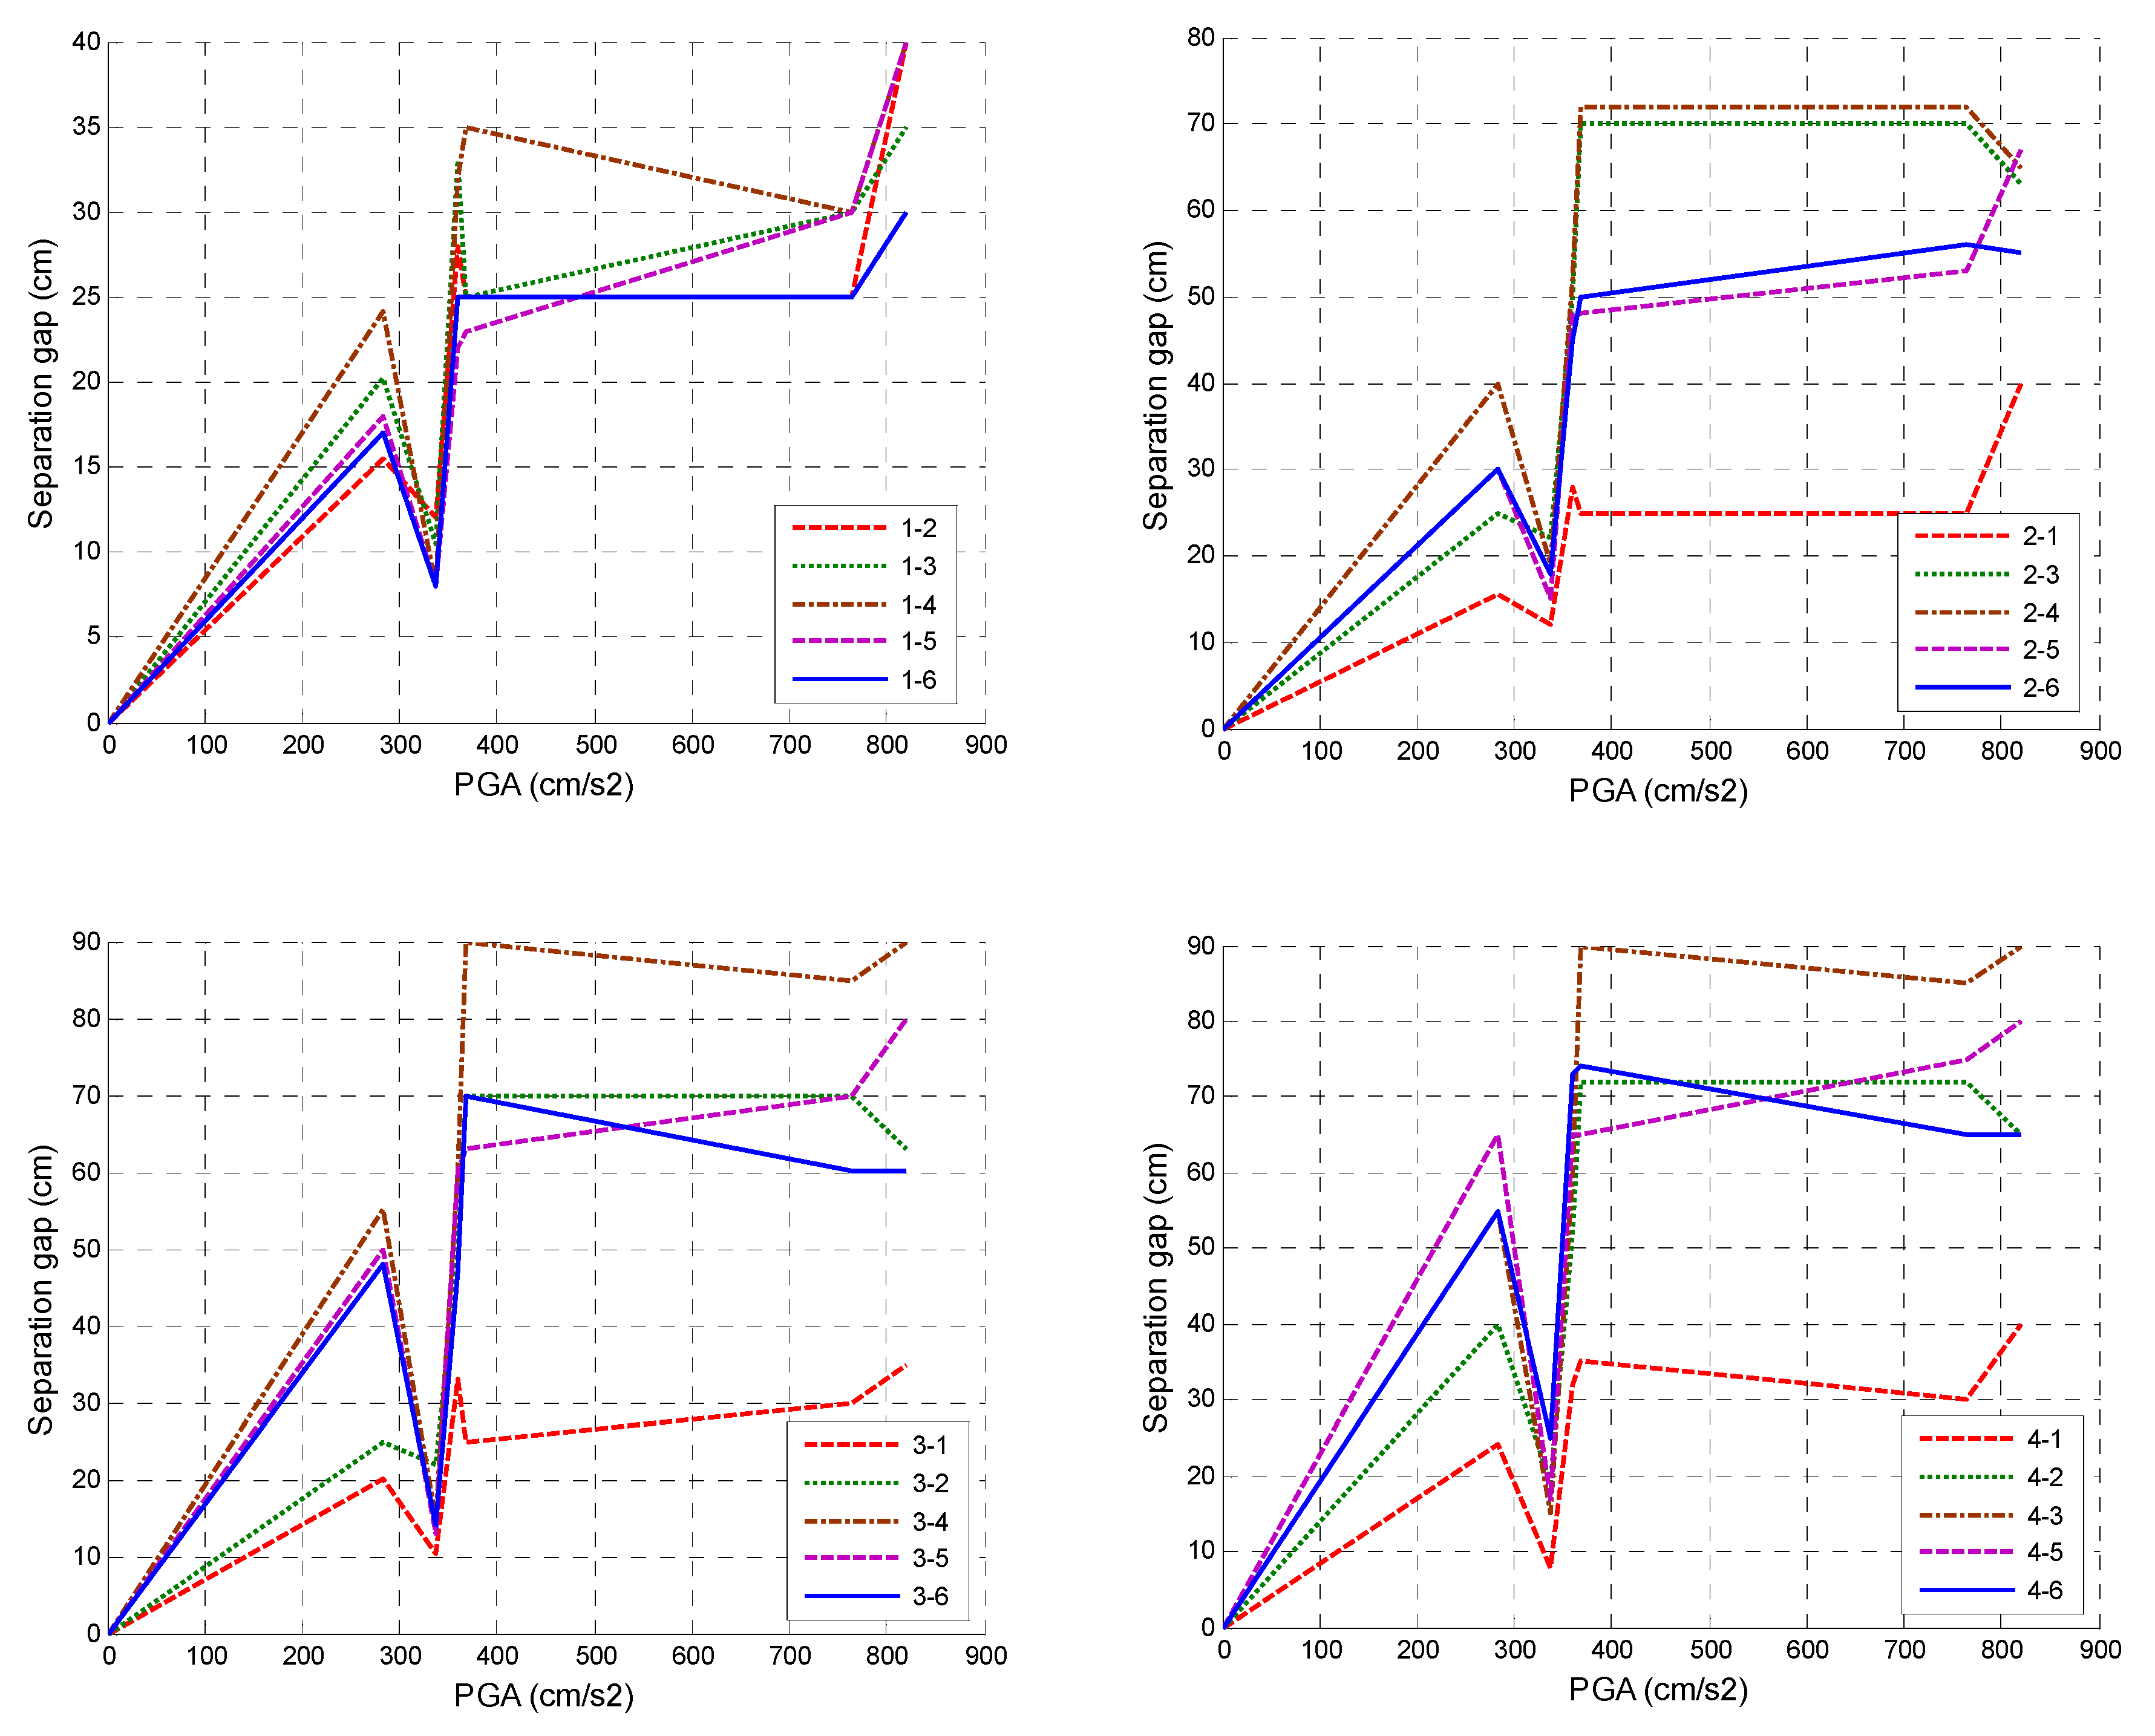
| Arrangement | Imperial Valley | Kobe | Loma Prieta | Kocaeli | Landers | Tabas |
|---|---|---|---|---|---|---|
| 1-1 | 0 | 0 | 0 | 0 | 0 | 0 |
| 1-2 | 15.5 | 12 | 28 | 25 | 25 | 40 |
| 1-3 | 20.2 | 10.5 | 33 | 25 | 30 | 35 |
| 1-4 | 24.1 | 8 | 32 | 35 | 30 | 40 |
| 1-5 | 18 | 8 | 22 | 23 | 30 | 40 |
| 1-6 | 17 | 8 | 25 | 25 | 25 | 30 |
| 2-1 | 15.5 | 12 | 28 | 25 | 25 | 40 |
| 2-2 | 0 | 0 | 0 | 0 | 0 | 0 |
| 2-3 | 25 | 22 | 50 | 70 | 70 | 63 |
| 2-4 | 40 | 19 | 52 | 72 | 72 | 65 |
| 2-5 | 29 | 15 | 48 | 58 | 53 | 67 |
| 2-6 | 30 | 18 | 45 | 50 | 56 | 55 |
| 3-1 | 20.2 | 10.5 | 33 | 25 | 30 | 35 |
| 3-2 | 25 | 22 | 50 | 70 | 70 | 63 |
| 3-3 | 0 | 0 | 0 | 0 | 0 | 0 |
| 3-4 | 55 | 15 | 60 | 90 | 85 | 90 |
| 3-5 | 50 | 13 | 60 | 63 | 70 | 80 |
| 3-6 | 48 | 14 | 47 | 70 | 60 | 60 |
| 4-1 | 24.1 | 8 | 32 | 35 | 30 | 40 |
| 4-2 | 40 | 19 | 52 | 72 | 72 | 65 |
| 4-3 | 55 | 15 | 60 | 90 | 85 | 90 |
| 4-4 | 0 | 0 | 0 | 0 | 0 | 0 |
| 4-5 | 65 | 17 | 65 | 65 | 75 | 80 |
| 4-6 | 55 | 25 | 73 | 74 | 65 | 65 |
| 5-1 | 18 | 8 | 22 | 23 | 30 | 40 |
| 5-2 | 29 | 15 | 48 | 58 | 53 | 67 |
| 5-3 | 50 | 13 | 60 | 63 | 70 | 80 |
| 5-4 | 65 | 17 | 65 | 65 | 75 | 80 |
| 5-5 | 0 | 0 | 0 | 0 | 0 | 0 |
| 5-6 | 56 | 26 | 74 | 74 | 67 | 69 |
| 6-1 | 17 | 8 | 25 | 25 | 25 | 30 |
| 6-2 | 30 | 18 | 45 | 50 | 56 | 55 |
| 6-3 | 48 | 14 | 47 | 70 | 60 | 60 |
| 6-4 | 55 | 25 | 73 | 74 | 65 | 65 |
| 6-5 | 56 | 26 | 74 | 74 | 67 | 69 |
| 6-6 | 0 | 0 | 0 | 0 | 0 | 0 |
© 2020 by the authors. Licensee MDPI, Basel, Switzerland. This article is an open access article distributed under the terms and conditions of the Creative Commons Attribution (CC BY) license (http://creativecommons.org/licenses/by/4.0/).
Share and Cite
Khatami, S.M.; Naderpour, H.; Razavi, S.M.N.; Barros, R.C.; Sołtysik, B.; Jankowski, R. An ANN-Based Approach for Prediction of Sufficient Seismic Gap between Adjacent Buildings Prone to Earthquake-Induced Pounding. Appl. Sci. 2020, 10, 3591. https://0-doi-org.brum.beds.ac.uk/10.3390/app10103591
Khatami SM, Naderpour H, Razavi SMN, Barros RC, Sołtysik B, Jankowski R. An ANN-Based Approach for Prediction of Sufficient Seismic Gap between Adjacent Buildings Prone to Earthquake-Induced Pounding. Applied Sciences. 2020; 10(10):3591. https://0-doi-org.brum.beds.ac.uk/10.3390/app10103591
Chicago/Turabian StyleKhatami, Seyed Mohammad, Hosein Naderpour, Seyed Mohammad Nazem Razavi, Rui Carneiro Barros, Barbara Sołtysik, and Robert Jankowski. 2020. "An ANN-Based Approach for Prediction of Sufficient Seismic Gap between Adjacent Buildings Prone to Earthquake-Induced Pounding" Applied Sciences 10, no. 10: 3591. https://0-doi-org.brum.beds.ac.uk/10.3390/app10103591