Vibration Diagnosis of Sand Units in a Stone Crusher Plant: An On-Site Field Test
by
 ,
,
Seong-Hwan Kim
1, 
Bo-Gyu Kim
1,
Dong-Soo Jung
1,*,
Seung-Bok Choi
1,*,
Jong-Mu Lee
2 and
Kyu-Bong Lee
2 1
Smart Structure Systems Laboratory, Department of Mechanical Engineering, Inha University, Incheon 22212, Korea
2
Maleun Environment Industrial Co. Ltd., Incheon 21687, Korea
*
Authors to whom correspondence should be addressed.
Appl. Sci. 2020, 10(12), 4327; https://0-doi-org.brum.beds.ac.uk/10.3390/app10124327
Submission received: 1 June 2020
/
Revised: 17 June 2020
/
Accepted: 18 June 2020
/
Published: 24 June 2020
(This article belongs to the Special Issue Structural Vibration: Analysis, Control, Experiment, and Applications)
Abstract
:Due to the shortage of natural sand from rivers and seas, artificial sand production from large stones or rocks is being increased. However, this sand manufacturing process is dangerous and causes several social problems such as a high level of unwanted vibrations or noises. This study investigates the vibration characteristics of sand and screen units in an artificial sand production plant whose operation is multiple with several actuators different exciting frequencies. As a first step, vibration levels are measured at the sand and screen unit positions using accelerometers in time and frequency domains. The measurement is carried out at two different conditions: activating only the sand unit and operating entire facilities such as a stone crusher. Vibration signals acquired from several locations of the sand and screen units of the plant are collected and analyzed from waveforms and spectrums of the signals. We identified that the vibration acceleration level of the screen unit is higher than that of the sand unit. In addition, it is found from the acceleration signals measured at the plant office and shipping control center (which are far away from the plant location) that the beating phenomenon arose due to close driving frequencies for several sand units. In this work, the vibration caused from the beating is significantly reduced by adjusting the driving frequencies for the sand units so that they are sufficiently scattered to avoid the beating.
1. Introduction
Natural sand has been formed through the normal erosion process of exposed rocks. Sands of various configurations, different sizes, and different non-rock inclusions of organic material are lined on the beach or with rivers or lake shores. Therefore, sand can be easily found in our surrounding natural environment, such as rivers and seas. Over the past decades, humans have been required large amounts of sand for social overhead capital (SOC) facilities and infrastructure, including large-scale construction of buildings, roads, bridges, airports, and harbors. However, as most natural sand is obtained from rivers and seas, its availability in the natural environment is limited. Moreover, indiscriminate collection of sand from rivers causes flooding and destruction of the natural environment such as river ecosystems, leading to various social issues. In the case of sand collected from the sea, it must proceed by removing the salt and undergoing a drying process. Therefore, a method for manufacturing artificial sand using a stone or rock grinding mechanism is used as a solution to prevent environmental destruction and sand depletion problems caused by massive natural sand production. In contrast, artificial sand is essentially manufactured or processed to have appropriate particle sizes required for the intended utilization. Most studies related to artificial sand in civil engineering have focused on the comparison of strength property between natural sand-based concrete and artificial sand-based concrete [1,2,3,4,5,6,7]. In addition, several works on the equipment design and analysis have been reported to enhance the production efficiency of an artificial sand manufacturing facility [8,9,10,11]. A few works on the vibration problem of artificial sand manufacturing facilities have been introduced by carrying out transverse and longitudinal oscillation analysis of screen units [12,13]. Recently, in order to improve the screening efficiency of the vibration screen and make the vibration process smoother, a new type MR damper was proposed and evaluated at a laboratory level [14]. Furthermore, shape memory alloy (SMA) is applied to the screen unit to properly achieve a sufficient spring constant by controlling the operating temperature [15].
The rock (or stone) breaking and crushing process plays an important role in minimizing the particle size of stone or rock for various construction activities, such as building bridges or infrastructure. They can be obtained in large quantities from artificial sand production plant facilities such as jaw crushers, vibration screen units and sand units. In the manufacturing process of an artificial sand, relatively large stones or rocks are first crushed, then screened, washed, and fine-sized [16,17,18,19,20,21]. An artificial sand production system consists of large motors with high power output and jaw crusher or impact crusher to break rocks or large stones. In addition, a hopper and cone crusher are required to break large stones into small sized stones or gravels. Then, the gravel and sand which are respectively transferred to the vibrating screen unit and sand unit are sorted by particle size by a washing and screening process. Subsequently, the fine sand is moved to a designated storage place Thus, the artificial sand production from crushed stones or rocks requires various types of equipment related to the full manufacturing processes. These facilities are large and hence inevitably have a significant impact, generating a high level of vibration and noise. Therefore, an artificial sand manufacturing plant should be built on large plains or mountain entrances which are far from densely populated residential areas and industrial complexes. Otherwise, if an artificial sand plant is located close to a densely populated area such as a residential complex or an industrial complex, then there will exist significant noise and vibration issues when the artificial sand manufacturing facilities are operating in such sites. Many complaints are also related to the transmission of such vibrations, shock, and noise by the residents in the adjacent areas.
Most of the artificial sand manufacturing facilities include vibration isolating devices that are operated by simply installing several coil spring parallelly around the device, and most structures comprise simple steel structures connected by welding H-beams (Maleun Environmental Co. Ltd. made by artificial sand facilities Manufacturer). Therefore, the vibration generated in the facility is transmitted to the ground through the vibration isolating device and supporting structures. The noise generated during the operation of the manufacturing facility is at a loud level, exceeding 90 dB. Thus, it is impossible to communicate with another operator. It is well known that vibration is measured as three physical parameters: displacement, velocity, and acceleration. Among these three parameters, the acceleration is frequently adopted to analyze vibration intensity. Since the main issue of this work is to investigate the vibration intensity that occurs in an artificial sand production plant, we used several accelerometers. However, it is noted that displacement sensors such as linear variable differential transducer (LVDT) are also used for vibration control focusing on the displacement of flexible structures. The vibration level of an artificial sand facility plant is severe, and this vibration is propagated to the surrounding through floors and structures. This vibration can be also detected in nearby offices and residential areas located several hundreds of meters away. In addition, many social issues of environments are caused by complaints regarding discomfort caused by the propagation of the vibration-induced high noise level to the surroundings. Despite the discomfort to the residents, research reports into the reduction of the unwanted vibration from artificial sand plants are considerably rare. In particular, vibration measurement and reduction of an artificial sand manufacturing plant has not been reported so far.
Consequently, the main technical contribution of this work is to experimentally investigate the vibration characteristics of the artificial sand production plant through on-site measurement. More specifically, from the analysis of the measured signals in time and frequency domains, vibration isolations of the sand and screen units are evaluated, and vibration sources are identified. To achieve this contribution, accelerometers are located on the sand and screen units by operating only the sand unit actuators and the entire facilities of the plant. Subsequently, collected acceleration signals from various locations are analyzed in the time and frequency domains. In particular, vibration acceleration level (VAL), the vibration isolation level difference (ΔVAL), percent isolation rate, and vibration transmissibility of the sand and screen units are calculated to evaluate the vibration isolation system. In addition, to find out the vibration source at the shipping control center and plant office located far away from the plant site, acceleration signals are measured and analyzed. From the analysis, it is identified that the main vibration source is the beating phenomenon caused by multiple operations of the motors to activate sand units which have close driving frequencies. In other words, close driving frequencies for the simultaneous operation of three motors for the sand units cause the beating and hence large vibration occurs [22,23,24,25,26,27,28,29,30,31]. In this work, the driving frequencies are adjusted to be sufficiently separated so that the beating is avoided in the multiple operations of several actuating motors. Then, it is shown that unwanted vibrations are significantly reduced by the adjustment of driving frequencies of the sand units [23].
2. Artificial Sand Production Plant
2.1. Overall Structure
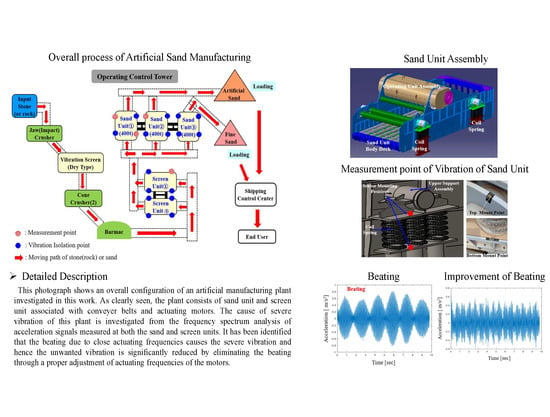
To understand the artificial sand manufacturing production facilities, we overview the stone crusher plant shown in Figure 1 which includes various manufactural equipment. Stone crushing plays a key role in the reduction of particle size of rocks or stones [8,9,10,11,12,13,14,15,16,17,18,19,20,21]. The jaw crusher is defined as a device for crushing large rocks or stones. The crushed rocks and stones from the jaw crusher are screened on a dry type vibration screen and transported through a conveyor belt to a cone crusher. The barmac is defined as a device for crushing stones conveyed from a cone crusher into smaller pieces. The operation of the artificial sand manufacturing production process using these facilities generates a significant level of impulse or shock and vibration. The wet type vibration screen unit and sand unit are defined as a device for screening (or sorting) and washing the stones using the water, and it is transported from the barmac into fine sized sand. In case of the vibration screen unit, two wet type vibration screen units are operated by connecting them to an H-beam welded in parallel, and three wet type vibration sand units are also operated by connecting them to H-beam welded in parallel, respectively. The moving paths of the raw materials (i.e., rocks, stones, or sands) are denoted by a red arrow in Figure 1b. In the figure, the blue points denote vibration isolation representing the coil spring for screen units and sand units.
2.2. Vibration Isolation
Vibration isolation is a procedure by which undesirable vibrations are eliminated or reduced. Basically, it involves the insertion of a resilient member (or isolator) between the vibrating mass (or equipment or payload) and the source of vibration so that the reduction in the dynamic response of the system can be achieved under specified vibration excitation conditions. Therefore, this can be achieved using not only passive but also controllable vibration isolators. It is well known that the isolation system can be classified into passive, active and semi-active. The passive isolator consists of a resilient material (stiffness), an energy dissipator (damper) and mass as a single degree of freedom of the mechanical system. The example of passive isolators in a mechanical system includes metal coil spring, cork, felt, pneumatic springs and viscoelastic material, such as elastomer or rubber springs. Among the passive isolators, the rubber springs have been popularly used in terms of the shear mode, or combinations of the shear and compression modes along with sophisticated viscoelastic elements. The active vibration isolator features actuators with a closed-loop feedback control system. Thus, the isolation performance of the active isolation is high, but it requires high cost and sophisticated sensors and control algorithms. The semi-active vibration isolation is featured by addition of damping property in real time manner. This method is known to be simple, but very effective. Among three vibration isolation approaches, the passive method is mostly used in the production of the artificial sand or in the building of the civil engineering structures. The vibration isolation for the artificial sand production plant is mainly achieved by utilizing rubber mounts and/or coil springs. More specifically, many rubber mounts and coil springs are installed under the structures of screen and sand units to reduce the vibration caused from driving (or exciting) actuators such as large-sized motors. Therefore, this isolation system is weak to external disturbances and time-varying uncertainty of the driving frequencies. This isolation system is normally designed to protect against the lowest frequency of the system since it causes the highest vibration amplitude. To achieve the vibration transmissibility of the artificial sand production plant, a single degree of freedom (DOF) model shown in Figure 2 can be considered.
The resilient material is assumed to have both elasticity and damping and modeled as a spring k and a dashpot c, respectively. It is assumed that the operation of the sand manufacturing plant is undertaken by applying a harmonically varying force . Then, the governing equation of the machine sand unit (or screen unit) body is given by
Using the steady state solution of the above equation, the magnitude of the total transmitted force is determined by [32,33,34,35,36,37]
Thus, the transmissibility of the vibration isolation model is defined as the ratio of the magnitude of the force transmitted to the exciting force [32,33,34,35,36,37]:
In the above, FT is the amplitude of the force transmitted to the sand unit, F0 is amplitude of the excitation force from the sand unit body and r is the frequency ratio. It is defined by f/fn. Here, f is the exciting (or driving) frequency of the vibration source and fn is the natural frequency of the sand unit which is mainly influenced by the stiffness of the sand unit structure. In Equation (3), ζ is the damping ratio, which depends on the damping property of the system structures of the sand unit [32,33,34,35,36,37,38]. The vibration isolation design has three criteria or requirements as follows [32,33,34,35,36,37,38]: (i) the frequency ratio should be more than three (f/fn = r ≥ 3), (ii) the vibration transmissibility (or percentage isolation) should be below 0.1 (%I ≥ 90%, where, %I represents the vibration isolation rate percentage) (iii) the minimum value of the vibration isolation efficiency should be under 12.5%. In order to meet the above requirements, most artificial sand production devices including screen and sand units are built by coil springs to achieve vibration isolation as well as avoid the resonance phenomenon. In this plant, the coil springs are installed on each sand unit and screen unit, as shown in Figure 3. The detained specifications of the coil springs used in this plant are given as follows. The outer diameter is 212 mm, the diameter of the coil spring itself is 32 mm, the number of coil turn is 7.5, the static deflection is 25.3 mm, the maximum load is 2950 kgs and the material is stainless steel.
2.3. Vibration Sources
Vibration sources of the artificial sand production plant are very difficult to find. Thus, the operating principles of the plant needs to be figured out as a first step. As a power source, a large-capacity four-phase induction motor with 60–200 horsepower is used and its operating speed ranges from 800 to 1800 rpm. The power is transmitted to the drive shaft via a belt pulley. The drive shaft and gear driving system are shown in Figure 4. The vibration that occurred during the operation of the screen unit and sand units is transmitted the power to the shaft through the belt pulley directly related to the excitation force generated by actuating motors. At this time, the transmitted power is converted into rotational motion by the gear driving system. This rotational motion drives the screen and sand units to vibrate as well as screening the crushed particle size associated with the sorting and washing jobs. The construction and installation of the vibration isolation system in the screen and sand units is described in the next section. To identify the vibration problem that occurred in the artificial sand manufacturing plant, we visited the field site several times to feel the vibration levels. In addition, many interviews with related peoples who reside near the plant were undertaken, in which we discussed the vibration characteristics felt by the residents. Then, the information obtained from the visiting and interviews, and measured vibration signals, which will be presented in a subsequent section of this paper, were used to find the main vibration source.
3. On-Site Vibration Measurement
3.1. Vibration Level
To investigate the vibration level of the screen unit (600 ton) and sand unit (600 ton) during normal operation, two measurement positions of the screen unit and sand unit are fixed as shown in Figure 5. Two uniaxial accelerometers (PCB, model 352CC/NC) are attached on both the top point and bottom point (red color dots). In this work, the vibration level is measured by adopting the difference of the vibration acceleration level (VAL) between the top and bottom of the coil springs. The VAL is numerically represented as the magnitude of vibration in decibel (dB) units [32,33,34,35,36,37]. Thus, it is defined as the value obtained after dividing the vibration acceleration root mean square (RMS) value measured at the measurement point by the reference value of the acceleration which takes a logarithmic value expressed by
In the above, represents the vibration acceleration RMS value at the measurement point and () and . The reference value of the vibration acceleration is based on the international standard ISO R1683 [32,33,34,35,36,37]. If the vibration isolation performance of system is good, the following formula is also used.
In the above, %I represent the vibration isolation rate percentage, T represents the vibration transmissibility, VAL1 represents the vibration acceleration level of the coil spring at the top point and VAL2 represents vibration acceleration level of the coil spring at the bottom point, respectively [32,33,34,35,36,37]. It is noted here that in this work, the four channels of data acquisition system and data processing are carried out utilizing NI 9234 hardware and Matlab software, respectively. In addition, it should be remarked here that the measurement of the vibration level is conducted at the shipment control center located 50 m away from the manufacturing plant, and the company office located 250 m away from the plant site. These vibration signals are to be used as comparative values after resolving the vibration source problem of the screen and sand units during the normal operation of the plant.
3.2. Vibration Analysis
Figure 6 presents measured vibration signals of the sand unit. More specifically, Figure 6a,b shows the vibration responses in time and frequency domains measured at the top and bottom point of the coil spring, respectively, by operating the sand unit only (the other facilities are rest), while Figure 6c,d presents vibration responses measured at the top and bottom point of the coil spring, respectively, by operating entire artificial sand manufacturing facilities including jaw crushers, cone crushers, barmacs, screen and sand units. It is clearly observed from the frequency spectrums of Figure 6a,b that the operating speed of sand unit motor is about 1080 rpm, and thus its harmonic excitation is calculated 1080 rpm divided into 60. Thus, it is 18 Hz and hence, the harmonic motion has system has 18× (times) the fundamental frequency. Thus, the artificial sand manufacturing plant can be defined as an excited rotationally imbalanced system due to large amount of the water and sand entering the sand unit (unbalanced mass) [36,37,38,39,40]. Based on Equation (4), the calculated VAL at the top point of the coil spring is 147 dB, and the calculated VAL at the bottom point of the coil spring is 116 dB, respectively. In addition, using Equation (5), the ΔVAL (or isolation level) is determined by 31 dB. Thus, the transmissibility value is evaluated by 0.028, and the percent isolation rate is calculated as 97.2% using Equation (6). This value indicates that the vibration isolation of the sand unit is good. When the entire artificial sand manufacturing facilities are operated, these values can be evaluated form the frequency spectrums shown in Figure 6c,d. The calculated VAL is 146 dB at the top point of the coil spring, and the calculated vibration level is 116 dB at the bottom point of the coil spring. The ΔVAL is 30 dB, and the transmissibility is calculated by 0.0316. Thus, the percent isolation rate is calculated as 96.4%, which indicates high performance of the vibration isolation even if entire facilities of artificial sand production plant are activated with multiple operating modes. From these results, it can be asserted that the sand unit has good vibration isolation performance itself and it is a valid design of vibration isolation. It is noted here that the waveforms shown in time domains of Figure 6 are the result of defects because of mass imbalance motion and misalignment in the rotating machinery systems [35,36,37,38,39,40]. Figure 7 presents vibration results of the coil spring installed at the top and bottom positions of the screen unit when the entire manufacturing components including jaw crushers, cone crushers, barmacs, and screen unit and sand units are operated. It is identified from the results that the operating speed of the screen unit motor is about 960 rpm, and harmonic excitation is calculated 960 rpm divided into 60. Thus, it is 16 Hz and, hence, the harmonic motion system is 16× (times) the fundamental frequency. Table 1 provides exciting (operating) frequencies before adjusting speed and after adjusting speed for the sand unit and screen unit. It is observed from the time domain signal shown in Figure 7b that the signal waveform is very different from the sand unit signal data. This is caused by complex motion associated with rotor dynamics and bearing properties of the screen unit. The vibration acceleration level (VAL) at the upper point of the coil spring is calculated by 150 dB, and the VAL at the bottom point of the coil spring is by 140 dB, respectively. The ΔVAL (isolation level rate) is 10 dB and the vibration transmissibility is evaluated as 0.316. Hence, the percent isolation rate is determined by 68.4%. Therefore, the vibration isolation of the coil spring for the screen unit is worse than that of the coil spring for the sand unit. This reason is that it is identified from the time wave form of the acceleration signal, which exhibits an outer bearing defect in the screen unit. The result of defects is occurred from mass imbalance motion and misalignment in the screen and sand unit system. Thus, it needs to be investigated by more precise analysis using more accurate diagnosis of the rotary machine. It is concluded from the results shown in Figure 7 that the screen unit isolation system needs to improve as much to that of the sand unit. As for the next measurement, the two most serious places are chosen to resolve many complaints raised from the transmission of such vibrations, shock, and noise by the residents in the adjacent areas. It is remarked that the shipping control center is located 50 m and the plant office is located 250 m from the main production facilities. Figure 8a,b shows vibration responses measured at the shipping control center and plant office by operating entire production facilities. It is clearly observed from this figure that the fundamental frequencies are 18 Hz, 20 Hz and 22 Hz. These fundamental frequencies correspond to the driving (or exciting) frequencies of the large-power motors for the sand and screen units. The VAL at the shipping control center and plant office are calculated by 104 dB and 97 dB, respectively. These results confirm that the attenuation effect of vibration amplitude level is acquired with the increase of the distance from the plant location. Unlike the vibration signals at the screen and sand units, it is very interesting to observe the beating phenomenon from the signals at the shipping center and office floor. The beating is observed with a short period from the time domain waveform and is a word used for the sound waves. So, the beat frequency is the difference in frequency between the two waves. Thus, when two waves, sound, or frequency, of nearly equal frequencies travel in a medium along the same direction meet at a point, beats are produced. The beating frequency is equal to the complete value of the alternation in the frequency of the two waves or frequencies. The count of beats per second, which is equivalent to the difference in frequency of two waves, is called beat frequency. Therefore, the beating frequency formula is expressed in Equations (11) and (12). In this work, the beating phenomenon can occur by resonance when the fundamental frequencies corresponding to the driving frequencies of sand and screen unit actuators are close. The screen and sand units are independently connected by spot welding paralleled with H-beam. Therefore, the occurrence of the beating behavior is seriously considered as one of the main reasons which can cause high vibration levels. This issue is to be discussed in more details in the section on vibration reduction below.
4. Vibration Reduction
As observed from the measured vibration signals shown in Figure 8a, the beating occurred due to close driving (or exciting) frequencies of actuating motors during multiple operation of the artificial sand manufacturing plant. The beating phenomenon at this plant occurred within a short period of time with the pattern of the periodic propagation. It is well known that the beating phenomenon is frequently observed when two harmonic motions with frequencies close to each other are combined. To briefly review the beating, consider a displacement x(t) that is produced by two harmonic forces f1 and f2 [22,23,24,25,26,27,28,29,30,31,36,37,38,39,40]:
Assume that the steady state responses to f1 and f2 are given by
Then, because of the linear properties of the system, the following equation is obtained:
where,
Thus, the beat frequency and beat mean value frequency (fbm) are given by
Therefore, the beating magnitude and cycle can be determined by the difference of two frequencies and phase angles. On the other hand, the vibration level due to the beating can be effectively reduced by adjusting the two frequencies. In this work, to avoid the beating behavior, the operating speed (or driving frequency) of the sand unit is adjusted. The original operating speeds of three motors for three sand units are fixed at 1320 rpm, but this changed a little as time went on. Therefore, three operating speeds for three sand units become close, resulting in the beating behavior. In this work, after measuring the operating speed of each sand unit, it is adjusted to 1050 rpm, 1320 rpm and 1180 rpm for the sand unit #1, sand unit #2 and sand unit #3, as shown in Table 1. Figure 9 presents vibration signals measured at the bottom point of the sand unit during full operation of entire experimental facilities for artificial sand production. It is clearly observed that the vibration level is significantly reduced after adjusting the operating speed (or driving frequency for motors to activate the sand units). More specifically, the power spectrum is remarkably reduced; ΔVAL is 28 dB, and the transmissibility is 0.04. Thus, the percent isolation is calculated by 96%, which is very high.
However, the vibration signals measured at the sand unit do not clearly show the beating phenomenon. Therefore, vibration signals are measured at the shipping control center and plant office under same operating conditions of three sand units. Figure 10 and Figure 11 present vibration signals measured at the shipping control center and plant office, respectively. It is noted that the shipping control center is located at 50 m and the plant office at 250 m from the main manufacturing facilities of artificial sand. It is clearly seen from the vibration signals in the time domain that the beating occurred at two locations due to the close driving frequencies of three sand units, as mentioned in Figure 9. The beating at the shipping control center is more rigorous than that occurred at the plant office. However, the beating is remarkably reduced by adjusting the operating speeds of three sand unit actuators with sufficiently different speeds. The close frequencies of the original operation are seen in the spectrum plot before adjustment and the scattered frequencies are also seen in the spectrum plot after adjusting the operating speeds of the sand units. The vibration measurement and analysis presented in this work are quite self-explanatory, verifying that a high level of unwanted vibrations can occur due to the beating phenomenon caused by the close driving frequencies of several actuators in multiple operation of entire facilities of the artificial sand manufacturing plant or any other civil engineering plant. Therefore, both construction of a vibration isolation system having high performance and appropriate choice of the driving (or exciting) frequencies of actuators are required simultaneously in the case of multiple operation of several actuators.
5. Conclusions
In this work, vibration levels of an artificial sand manufacturing plant are measured and evaluated in time and frequency domains. After briefly explaining the overall structure of the plant, vibration signals are acquired at the sand and screen units using several accelerometers. Then, using the measured data, vibration acceleration level (VAL), the vibration isolation level difference (ΔVAL), percent isolation rate, and vibration transmissibility are calculated. It is identified from the vibration analysis that the isolation system of the sand unit is much better than that of the screen unit. More specifically, for the sand unit, VAL, ΔVAL, transmissibility and percent isolation are calculated by 116 dB, 31 dB, 0.028, and 97.2%, respectively. However, for the screen unit, those are calculated by 140 dB, 10 dB, 0.316 and 68.4%, respectively. In addition, it is shown that the beating phenomenon occurred at the shipping control center and plant office located away from the plant site by 50 m and 250 m, respectively. The beating is caused by the close driving frequencies of several sand units during simultaneous multiple operation of several motors. Thus, in this work unwanted vibrations caused from the beating are significantly reduced by adjusting the driving frequencies of the motors to activate the sand units so that these are sufficiently scattered to avoid the beating. The results and analysis presented in this work have considered the real site of the plant and hence can be effectively used for several plants where multiple operations of several actuators such as motors are to be simultaneously carried out. It is finally remarked that the existing vibration isolation needs to be improved to acquire high reliability, and an automatic adjustment system of the driving or exciting frequencies needs to be explored in a feedback control manner.
Author Contributions
Conceptualization, S.-B.C.; vibration measurement and analysis, B.-G.K., and S.-H.K.; investigation, S.-H.K., and J.-M.L.; writing—original draft preparation, S.-H.K.; review and editing, S.-B.C., and D.-S.J.; project administration, S.-B.C. and K.-B.L.; funding support, J.-M.L. and K.-B.L. All authors have read and agreed to the published version of the manuscript.
Funding
This research was supported by Maleun Environment Industrial Company.
Acknowledgments
This research was supported by Maleun Environment Industrial Company, the authors gratefully appreciate this.
Conflicts of Interest
The authors declare that they have no conflict of interest regarding the publication of this article.
References
- Dalyander, P.S.; Plant, N.G.; Long, J.W.; McLaughlin, M. Nearshore dynamics of artificial sand and oil agglomerates. J. Mar. Pollut. Bull. 2015, 96, 344–355. [Google Scholar] [CrossRef] [PubMed]
- Band, S.R.; Malkhede, S.D. Effect of replacement of natural sand by artificial sand on strength of concrete. Int. J. Adv. Eng. Res. Dev. 2017, 4, 415–419. [Google Scholar]
- Purohit, N.; Chawda, A. Experimental study of effect of artificial sand and aggregates on compressive strength and workability of concrete. Int. J. Eng. Res. Technol. 2016, 5, 730–735. [Google Scholar]
- Bajad, M.N.; Sakhare, S. Influence of artificial sand on the properties of concrete and mortar. Int. J. Civ. Eng. Technol. 2018, 9, 447–454. [Google Scholar]
- Mogre, R.P.; Parbat, D.K. Optimum replacement of natural sand with artificial sand in concrete. Int. J. Civ. Struct. Environ. Infrastruct. Eng. Res. Dev. 2013, 3, 93–100. [Google Scholar]
- Ingale, P.S.; Kawade, N.S.; Jadhav, A.V.; Pawal, B.B.; Pradhan, G.G.; Gawatre, D.w. Optimization of artificial sand in concrete. Int. J. Adv. Mech. Civ. Eng. 2016, 3, 68–70. [Google Scholar]
- Chitlange, M.R.; Pajgade, P.S.; Nagarnaik, P.B. Experimental study of artificial sand concrete. In Proceedings of the International conference on Emerging Trends in Engineering and Technology (ICETET), Maharashtra, India, 16–18 July 2008; pp. 1050–1054. [Google Scholar]
- Zhao, Y.M.; Liu, C.S.; He, X.M.; Zhang, C.Y.; Wang, Y.B.; Ren, Z.T. Dynamic design theory and application of large vibrating screen. Procedia Earth Planet. Sci. 2009, 1, 776–784. [Google Scholar]
- Mali, A.V.; Morey, N.N.; Khtri, A.P. Improvement in the efficiency of the Stone crusher, Generic vibration criteria for vibration-sensitive equipment. Int. J. Sci. Eng. Technol. Res. 2016, 5, 2265–2271. [Google Scholar]
- Leiva, C.A.; Arcos, K.V.; Poblete, D.A.; Serey, E.A.; Toress, C.M.; Ghorabani, Y. Design and evaluation of an expert system in crushing plant. J. Miner. 2018, 8, 469. [Google Scholar] [CrossRef] [Green Version]
- Asbjoernsson, G.; Hulthen, E.; Eversson, M. Modeling and simulation of dynamic crushing plant behavior with MATLAB/Simulink. J. Miner. Eng. 2013, 43–44, 112–120. [Google Scholar] [CrossRef]
- Slepyan, L.I.; Slepyan, V.I. Coupled mode parametric resonance in a vibration screen model. J. Mech. Syst. Signal Process. 2014, 43, 295–304. [Google Scholar] [CrossRef] [Green Version]
- Bessason, B.; Madshus, C.; Frøysteinand, H.A.; Kolbjørnsen, H. Vibration criteria for metrology laboratories. Meas. Sci. Technol. 1999, 10, 1009–1014. [Google Scholar] [CrossRef] [Green Version]
- Wu, F.; Huang, Y.J.; Xu, S. Trispectrum and correlation dimension analysis of magnetorheological damper in vibration screen. J. Cent. South Univ. 2012, 19, 1832–1838. [Google Scholar] [CrossRef]
- Raczka, W.; Sibielak, M.; Kowal, J.; Konieczny, J. Application and SMA spring for vibration screen control. J. Mech. Low Freq. Noise Vib. Act. Control 2013, 32, 117–132. [Google Scholar] [CrossRef] [Green Version]
- Maleun Environment Co. Ltd. Available online: http://www.maleun.co.kr (accessed on 16 June 2020).
- Yongwon Crusher Co. Ltd. Available online: http://ywcrusher.com/home/?lang=en (accessed on 16 June 2020).
- Samyoung Plant Co. Ltd. Available online: http://www.syplant.co.kr/index.html (accessed on 16 June 2020).
- Kwang San Mining Machinery Co. Ltd. Available online: http://www.mmco.kr/html/sub02.html (accessed on 16 June 2020).
- Metso Mining Machinery com. Available online: https://www.metso.com/products/screens/horizontal-screens/metso-es-series-horizontal-screens (accessed on 17 June 2020).
- Sandvik Machinery. Available online: https://www.rocktechnology.sandvik/en/products/stationary-crushers-and-screens (accessed on 16 June 2020).
- Carting, B. Beating frequency and amplitude modulation of the piano tone due to coupling of tones. J. Acoust. Soc. Am. 2005, 117, 2259–2267. [Google Scholar] [CrossRef] [PubMed]
- Chae, S.I.; Kim, B.S.; Lim, W.S.; Yang, B.S. Vibration reduction of reciprocating compressor. In Proceedings of the Korean Society for Noise and Vibration Engineering 2012 Autumn Annual Conference, Won-Joo, Korea, 25–27 October 2012; pp. 779–783. [Google Scholar]
- Choi, Y.C.; Park, J.H.; Yoon, D.B. Structure excitation by using beating. Trans. Korean Soc. Noise Vib. Eng. 2009, 19, 1028–1033. [Google Scholar]
- Lee, H.C. Robust damage diagnostic method using short time Fourier transform and beating. Trans. Korean Soc. Noise Vib. Eng. 2005, 15, 1108–1117. [Google Scholar]
- Kim, S.H.; Park, S.G.; Park, G.Y.; Suh, B.S. Beat maps of a slightly asymmetric ring. Trans. Korean Soc. Noise Vib. Eng. 2002, 12, 685–693. [Google Scholar]
- Kim, S.H.; Cui, C.X. A study on the control of the beat clarity and the beat period in a ring structure. Trans. Korean Soc. Noise Vib. Eng. 2008, 18, 1170–1176. [Google Scholar]
- Park, J.H.; Ahn, S.J.; Jeong, W.B. Study on ride comfort of idle vibration declined by beating phenomenon on passenger vehicle. In Proceedings of the Korean Society for Noise and Vibration Engineering 2015 Spring Annual Conference, Jeju, Korea, 22–25 April 2015; pp. 871–874. [Google Scholar]
- Physics and Radio Electronics/Physics. Available online: https://www.physics-and-radio-electronics.com/physics/beats-waves-physics.html (accessed on 16 June 2020).
- Topper/guides/physics/beat. Available online: https://www.toppr.com/guides/physics-formulas/beat-frequency-formula (accessed on 16 June 2020).
- RP Photonics Encyclopedia/Beats Note. Available online: https://www.rp-photonics.com/beat_note.html (accessed on 16 June 2020).
- Lee, C.J.; Asia Noise and Vibration Institute. Noise and Vibration Control for Workplace; Ybook: Seoul, Korea, 2013; ISBN 978-89-967735-7-3. [Google Scholar]
- The Committee of Korean Society for Noise and Vibration Engineering. A Handbook of Noise and Vibration; the KSNVE Compilation Committee: Seoul, Korea, 1995. [Google Scholar]
- Irwin, J.D.; Graf, E.R. Industrial Noise and Vibration Control; Prentice Hall INC.: Englewood Cliff, NJ, USA, 1996; pp. 154–196. [Google Scholar]
- Jung, I.R.; Kim, J.Y.; Yoon, S.C.; Lee, T.H. Theory and Practice of Noise and Vibration; Shinkwang Munhwa Sa: Seoul, Korea, 2006; pp. 137–187. ISBN 978-89-7432-131-4. [Google Scholar]
- Rao, S.S. Mechanical Vibrations, 4th ed.; Pearson Prentice Hall: Upper Saddle River, NJ, USA, 2004. [Google Scholar]
- Thomson, W. Theory of Vibration with Applications; CRC Press: Boca Raton, FL, USA, 1996. [Google Scholar]
- Dimarogonas, A.D. Vibration for Engineers, 2nd ed.; Prentice Hall: Upper Saddle River, NJ, USA, 2001; ISBN 0-13-456229-1. [Google Scholar]
- Shin, K.H.; Hammond, J. Fundamental of Signal Processing for Sound and Vibration Engineers; John Wiely & Sons. Ltd: Hoboken, NJ, USA, 2008; ISBN 978-0-47051188-6. [Google Scholar]
- Yang, B.S. Condition Monitoring and Diagnostics of Rotational Machinery; Inter Vison: Seoul, Korea, 2006; ISBN 89-5667-320-9. [Google Scholar]
Figure 1.
Artificial sand manufacturing plant and process: (a) Photograph of the artificial sand manufacturing plant; (b) Overall process of manufacturing in artificial sand production.
Figure 1.
Artificial sand manufacturing plant and process: (a) Photograph of the artificial sand manufacturing plant; (b) Overall process of manufacturing in artificial sand production.


Figure 2.
Single degree of freedom (DOF) vibration isolation model on rigid foundation.

Figure 3.
Sand unit assembly and coils spring installed in vibration isolation system: (a) Sand unit body and operating part assembly; (b) Side view of coil spring installed for screen and sand units.
Figure 3.
Sand unit assembly and coils spring installed in vibration isolation system: (a) Sand unit body and operating part assembly; (b) Side view of coil spring installed for screen and sand units.

Figure 4.
Vibration source of screen and sand unit and total assembly system: (a) Power source and power transmitted to the screen unit and sand unit: (b) Photograph of the screen unit and sand unit.
Figure 4.
Vibration source of screen and sand unit and total assembly system: (a) Power source and power transmitted to the screen unit and sand unit: (b) Photograph of the screen unit and sand unit.

Figure 5.
Vibration measurement points of the screen and sand units.

Figure 6.
Vibration responses of the sand unit in time and frequency domains; (a) Vibration response at the top point of the coil spring: sand unit operating only; (b) Vibration response at the bottom point of the coil spring: sand unit operating only; (c) Vibration response at the top point of the coil spring: entire facilities operating condition; (d) Vibration response at the bottom point of the coil spring: entire facilities operating condition.

Figure 7.
Vibration responses during multiple operations of entire facilities; (a) Vibration response at the top point of the coil spring in the screen unit; (b) Vibration response at the bottom point of the coil spring in the screen unit.
Figure 7.
Vibration responses during multiple operations of entire facilities; (a) Vibration response at the top point of the coil spring in the screen unit; (b) Vibration response at the bottom point of the coil spring in the screen unit.

Figure 8.
Vibration responses under multiple operations of entire facilities; (a) Vibration response after adjusting operating speed at the shipping control center; (b) Vibration response after adjusting operating speed at the plant office floor.
Figure 8.
Vibration responses under multiple operations of entire facilities; (a) Vibration response after adjusting operating speed at the shipping control center; (b) Vibration response after adjusting operating speed at the plant office floor.

Figure 9.
Vibration responses before and after adjusting driving frequency of the sand units: (a) Vibration response of the time domain at the bottom point of sand unit; (b) Vibration response of the frequency domain at the bottom point of the sand unit.
Figure 9.
Vibration responses before and after adjusting driving frequency of the sand units: (a) Vibration response of the time domain at the bottom point of sand unit; (b) Vibration response of the frequency domain at the bottom point of the sand unit.

Figure 10.
Vibration characteristics before and after adjusting driving frequencies of the sand units under full facilities operating condition at shipping control center: (a) Vibration responses at the shipping control center before adjusting driving frequency; (b) Vibration responses at the shipping control center after adjusting driving frequency.

Figure 11.
Vibration characteristics before and after adjusting driving frequencies under full facilities operating condition at the plant office: (a) Vibration responses at the plant office before adjusting driving frequency; (b)Vibration responses at the plant office after adjusting driving frequency.


Table 1.
Comparison of driving (excitation) frequencies of the sand unit and screen unit.
| Devices No. | Before Adjusting Frequency | After Adjusting Frequency | ||||
|---|---|---|---|---|---|---|
| Power Efficiency | Operating Speed (rpm) | Fundamental Frequency | Power Efficiency | Operating Speed (rpm) | Fundamental Frequency | |
| Sand Unit #1 | 100% | 1320 rpm | 22.0 Hz | 80% | 1050 rpm | 17.5 Hz |
| Sand Unit #2 | 100% | 1320 rpm | 22.0 Hz | 100% | 1320 rpm | 22.0 Hz |
| Sand Unit #3 | 100% | 1320 rpm | 22.0 Hz | 90% | 1180 rpm | 19.6 Hz |
| Screen Unit #1 | 100% | 1320 rpm | 22.0 Hz | 73% | 960 rpm | 16 Hz |
© 2020 by the authors. Licensee MDPI, Basel, Switzerland. This article is an open access article distributed under the terms and conditions of the Creative Commons Attribution (CC BY) license (http://creativecommons.org/licenses/by/4.0/).
Share and Cite
MDPI and ACS Style
Kim, S.-H.; Kim, B.-G.; Jung, D.-S.; Choi, S.-B.; Lee, J.-M.; Lee, K.-B. Vibration Diagnosis of Sand Units in a Stone Crusher Plant: An On-Site Field Test. Appl. Sci. 2020, 10, 4327. https://0-doi-org.brum.beds.ac.uk/10.3390/app10124327
AMA Style
Kim S-H, Kim B-G, Jung D-S, Choi S-B, Lee J-M, Lee K-B. Vibration Diagnosis of Sand Units in a Stone Crusher Plant: An On-Site Field Test. Applied Sciences. 2020; 10(12):4327. https://0-doi-org.brum.beds.ac.uk/10.3390/app10124327
Chicago/Turabian StyleKim, Seong-Hwan, Bo-Gyu Kim, Dong-Soo Jung, Seung-Bok Choi, Jong-Mu Lee, and Kyu-Bong Lee. 2020. "Vibration Diagnosis of Sand Units in a Stone Crusher Plant: An On-Site Field Test" Applied Sciences 10, no. 12: 4327. https://0-doi-org.brum.beds.ac.uk/10.3390/app10124327
Note that from the first issue of 2016, this journal uses article numbers instead of page numbers. See further details here.